Abstract
Aluminum-based amorphous alloys exhibited an abnormally high vapor pressure at their approximate glass transition temperatures. The vapor pressure was confirmed by the formation of Al nanocrystallites from condensation, which was attributed to weight loss of the amorphous alloys. The amount of weight loss varied with the amorphous alloy compositions and was inversely proportional to their glass-forming ability. The vapor pressure of the amorphous alloys around 573 K was close to the vapor pressure of crystalline Al near its melting temperature, 873 K. Our results strongly suggest the possibility of fabricating nanocrystallites or thin films by evaporation at low temperatures.
1. Introduction
Sublimation is the phase transition from solid to gas, without passing through an intermediate liquid phase. The equilibrium vapor pressure for sublimation is reached when the vaporization rate is consistent with its condensation rate. Vapor pressure due to sublimation is a function of temperature, and it can be easily estimated using the Clausius-Clapeyron equation [1]. The vapor pressure of metal alloys resulting from sublimation at one-third or one-half of the melting temperature are typically negligible compared with the vapor pressure of their liquid phase above the melting temperature [2]. Hence, we expect that metal alloys, which exhibit liquid behavior well below their melting temperatures, may show a vapor pressure as high as the vapor pressure of evaporation, near or above their melting temperature.
Many amorphous alloys exhibit liquid-like behavior at temperatures substantially below their melting temperatures. This temperature range is called the supercooled liquid region (SCLR), which ranges from the glass transition temperature (Tg) to the crystallization temperature (Tx). The liquid-like behavior (reduction in viscosity) of the amorphous alloys in SCLR leads to thermoplastic deformation. For example, some amorphous alloys can be blow-molded into various shapes due to their thermoplastic formability in SCLR [3,4]. In addition, we previously exploited the liquid-like behavior of Al-based amorphous alloys in SCLR to develop Ag paste for solar cells [5,6,7]. The Ag paste with Al85Y8Ni5Co2 (AYNC) exhibited better electrical properties than those with Al85.4Y10Ni5.5 (AYN) and Al86Y6Ni4.5Co2La1.5 (AYNCL). This is likely because AYNC has higher thermoplastic formability [8], so AYNC is more deformed in SCLR by capillary forces in the paste, which enhanced the electrical properties of the Ag electrodes. There could be other reasons for the better electrical properties of the Ag paste with AYNC, and further investigation is needed.
The vaporization of Al-based amorphous alloys over a temperature range that includes SCLR was confirmed by observing both the weight loss of the amorphous alloys and the formation of Al nanocrystallites from condensation during heating. The Al nanocrystallites formed on a substrate near the amorphous alloys after heating at 573 K. The vapor pressure of the Al-based amorphous alloys over the temperature range from 433 to 593 K measured in this report was approximately (0.6–1.4) × 10−8 Pa, which is similar to the vapor pressure of pure crystalline Al at 853–873 K.
Vapor pressure measurements of a supercooled liquid have been previously reported [9]. For materials in solid phase, the vapor pressure was estimated by measuring and extrapolating the vapor pressure from a supercooled liquid phase immediately below the melting temperature. However, measurements of the vapor pressures of amorphous alloys in SCLR well below the melting temperatures have not been reported.
2. Experimental Section
Al-based amorphous alloy ribbons of three different compositions, AYN, AYNC, and AYNCL, were fabricated. The master alloys of the three compositions were prepared by arc-melting the high purity elements (>99.9% from RND Korea, Gwangmyeong, Korea). Using the master alloys, amorphous ribbons of the three compositions were produced by melt-spinning under Ar gas in a vacuum chamber (base pressure of 10−5 torr). The thermal property and crystallinity of the amorphous ribbons were confirmed using differential scanning calorimetry (DSC, Perkin-Elmer DSC8000, PerkinElmer, Akron, OH, USA) and X-ray diffraction (XRD, Bruker D8 ADVANCE, Bruker, Billerica, MA, USA). Energy dispersive X-ray spectroscopy (EDX) connected to a scanning electron microscope (SEM, FEI Helios 600i, FEI company, Hillsboro, OR, USA) was used to analyze the Al nanocrystallites formed by condensation, following vaporization of the ribbon. To capture the vapor from the amorphous ribbons, a carbon-coated grid, generally used to prepare samples for transmission electron microscopy (TEM), was used. The grid was placed on top of an amorphous Al ribbon, which was then transferred into a furnace and heated at 573 K for 15 min in air. The weight loss of the samples per unit area was obtained using thermogravimetric analysis (TGA, TA instrument Q500, TA instruments, New Castle, DE, USA) at a constant heating rate (20 K/min) in air. Additionally, TGA was used to measure the weight loss of the three samples, and Al foil (99.45%, 25 μm thick, from Alfa Aesar, Ward Hill, MA, USA) was used to calculate the enthalpy of vaporization, using an isothermal method at various temperatures under an N2 atmosphere. Pieces of amorphous ribbon and Al foil that were a few millimeters long were stacked on the TGA cells; their weights before heating were approximately 4 mg. Images of the ribbons (or Al foils) on the TGA cell were obtained, and the area of the top surface of the ribbons exposed to air was measured using Photoshop (Adobe CS6, Adobe system, San Jose, CA, USA). The weight change of the ribbons measured by TGA was divided by the area measured using Photoshop because we assumed that the weight loss of the ribbons was due to the vaporization of Al from the top surface exposed to air. The aluminum that vaporized from one ribbon piece underneath another ribbon immediately condensed on the surface of the ribbons above it.
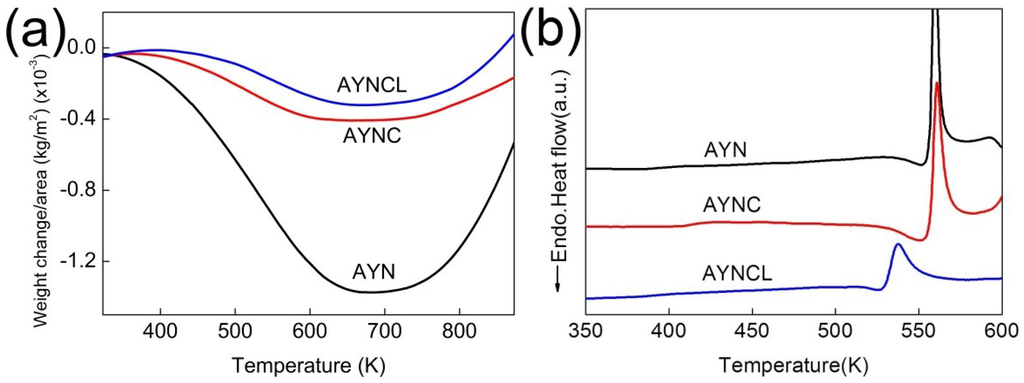
Figure 1.
Weight change per unit area of the three ribbons (Al85.4Y10Ni5.5 (AYN), Al85Y8Ni5Co2 (AYNC), and Al86Y6Ni4.5Co2La1.5 (AYNCL)) measured by (a) TGA and (b) DSC analysis of the three ribbons.
3. Results and Discussion
Vaporization of the Al-based amorphous alloys was confirmed based on the weight loss measured by TGA. The maximum weight loss was (0.3–1.3) × 10−3 kg/m2, as shown in Figure 1a, and it was dependent on the amorphous alloy composition. The weight loss started at approximately 373 K and continued up to 673 K, regardless of the composition of the amorphous alloy. This temperature range overlaps with the SCLR of the Al-based amorphous alloys measured in DSC (Figure 1b and Table 1). The AYN ribbon lost more weight than the other ribbons (i.e., Al was more likely to escape from the AYN ribbon than from the other ribbons), possibly because amorphous AYN has a larger free volume than the other ribbons. The compositions with more elements were expected to have less free volume in a solute-solvent system, such as AYN, AYNC, and AYNCL [10,11]. In this system, each solute (e.g., Ni, Y, Co, La) is surrounded by solvent atoms of Al, forming a cluster [12]. The size of the cluster is determined by the bond distances between Al and the solute, as well as by the coordination numbers (CNs) of the solutes; thus, the sizes of the clusters for Ni, Y, Co, and La are different. The mixture of clusters of various sizes leads to a higher packing density, or less free volume. In a cluster, the bond distances between Al and the solute atoms and the CN of the solutes were extensively investigated [12,13]. Amorphous alloys with less free volume generally exhibited higher glass-forming ability (GFA) [14], and the GFAs of AYN, AYNC, and AYNCL are 0.12, 0.90, and 1.0 mm, respectively [15,16]. Thus, the amount of weight loss varied with the composition of the amorphous alloys, and was inversely proportional to their GFAs.

Table 1.
Tg and Tx of the ribbons with three compositions, Al85.4Y10Ni5.5 (AYN), Al85Y8Ni5Co2 (AYNC), and Al86Y6Ni4.5Co2La1.5 (AYNCL), measured using DSC profiles provided in Figure 1b.
| Composition | Tg (K) | Tx (K) |
|---|---|---|
| AYN | 531 | 555 |
| AYNC | 530 | 556 |
| AYNCL | 516 | 530 |
The weight gain following the weight loss as the temperature increased above 673 K was due to oxidation after the crystallization of the amorphous alloys [17,18]. The weight change of amorphous alloys while heating is commonly measured to analyze physical properties such as oxidation resistance or magnetic properties. Weight gain of amorphous alloys is generally analyzed when the mechanism of oxidation is investigated. Additionally, the weight loss of amorphous alloys while annealing has been reported, but it was only observed in magnetic alloys [19]. The weight loss of magnetic alloys was due to the magnetic transition as the temperature increased.
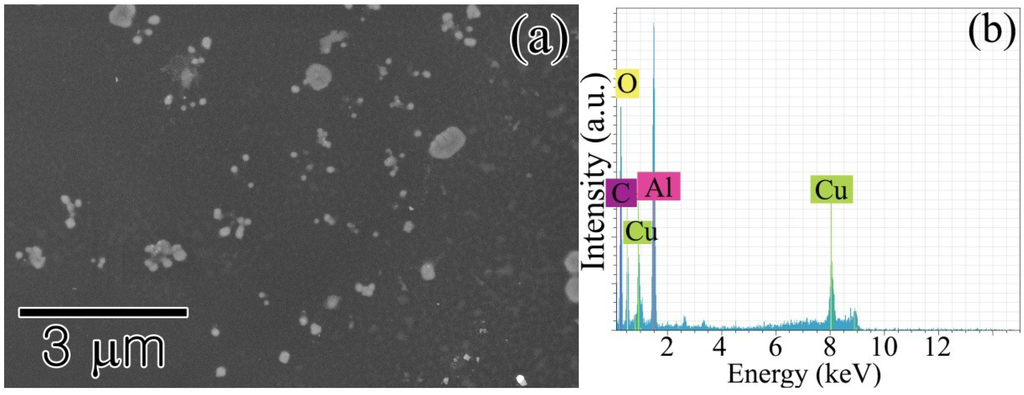
Figure 2.
(a) Al oxide nanocrystallites formed on a TEM grid placed on top of an amorphous alloy ribbon during annealing at 573 K for 15 min; (b) EDX analysis results confirming the nanocrystallites are oxidized Al. The signals of Cu and C originated from the carbon-coated Cu grid used as a substrate.
The excessive vaporization of the Al amorphous alloys at low temperatures was substantiated by the formation of Al nanocrystallites from condensation. As shown in Figure 2, many Al particles in the nanometer range formed on the TEM carbon-coated grid placed on top of the AYN ribbon during annealing at 573 K for 15 min in air. The nanocrystallites were composed of Al oxide, according to the results of EDX analysis. It was expected that vaporized pure Al was oxidized during annealing in air. The vaporization of the solute elements was expected, yet they were not detected by EDX. The formation of nanocrystallites from thermal vaporization was one of the fundamental processes for the fabrication of nanocrystallites or thin films [20,21,22]. However, the previous reports focused on evaporation above the melting temperature. Inorganic elements, such as Se and As, were used to synthesize their nanocrystallites from sublimation, but their vapor pressures of sublimation are intrinsically high [23]. The vapor pressures of the individual elements consisting of Al-based amorphous alloys Al, Ni, Y, Co, and La are too low to fabricate their nanocrystallites by sublimation [2].
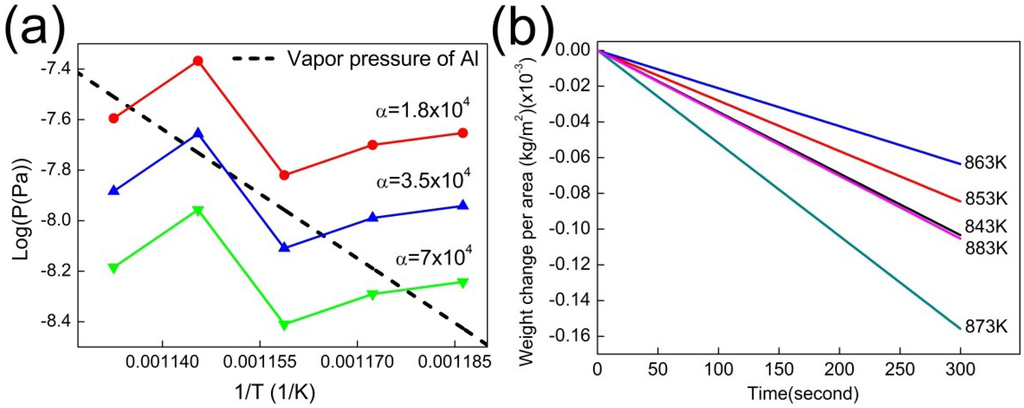
Figure 3.
(a) The value of α was obtained by comparing the previously reported vapor pressure of Al (dotted line) to the vapor pressures of the Al foils calculated using Equation (1). For the calculation, the weight loss rates of the Al foils were measured at various temperatures as shown in (b) and the vapor pressures at these temperatures were calculated using Equation (1) with the three possible values of alpha, 1.8 × 10⁴ (red line), 3.5 × 10⁴ (blue line), and 7.0 × 10⁴ (green line). The optimum value of α is approximately 3.5 × 10⁴.
The vapor pressure of the amorphous alloys was in the range (0.6–1.4) × 10−8 Pa, which is exceptionally higher than that of crystalline Al in the same temperature range. The vapor pressure was comparable to that of crystalline Al over the temperature range from 853 to 873 K. It was reasonable to compare the vapor pressure of the amorphous alloys to that of pure Al because more than 84% of the amorphous alloys were Al. Moreover, the vapor pressures of individual elements consisting of the amorphous alloys are lower than that of Al over the same temperature range. The vapor pressure of the amorphous alloys was calculated using the weight loss rate measured by TGA. Conventional TGA equipment was previously used to estimate the vapor pressure of materials at atmospheric pressure [24,25]. According to previous reports, Equation (1) was proposed to estimate the vapor pressure from the evaporation rate, adapting the Knudsen-Langmuir equation that describes free evaporation in a vacuum, as follows: [26]
where dm/dt is the evaporation rate, S is the evaporating surface area, Pv is the vapor pressure, R is the gas constant, T is the temperature, MA is the molecular weight of the evaporating substance, and α is a vaporization constant. The value of α is strongly dependent on the experimental conditions, especially the purge gas. The value of α for our experimental condition was obtained by measuring dm/dt of pure crystalline Al foil under isothermal conditions at various temperatures in TGA (Figure 3). Because the vapor pressure of crystalline Al is known, the value of α was calculated using Equation (1) and found to be approximately 3.5 × 10⁴. With the same experimental condition, dm/dt of the amorphous ribbons was measured, and the results are summarized in Figure 4.
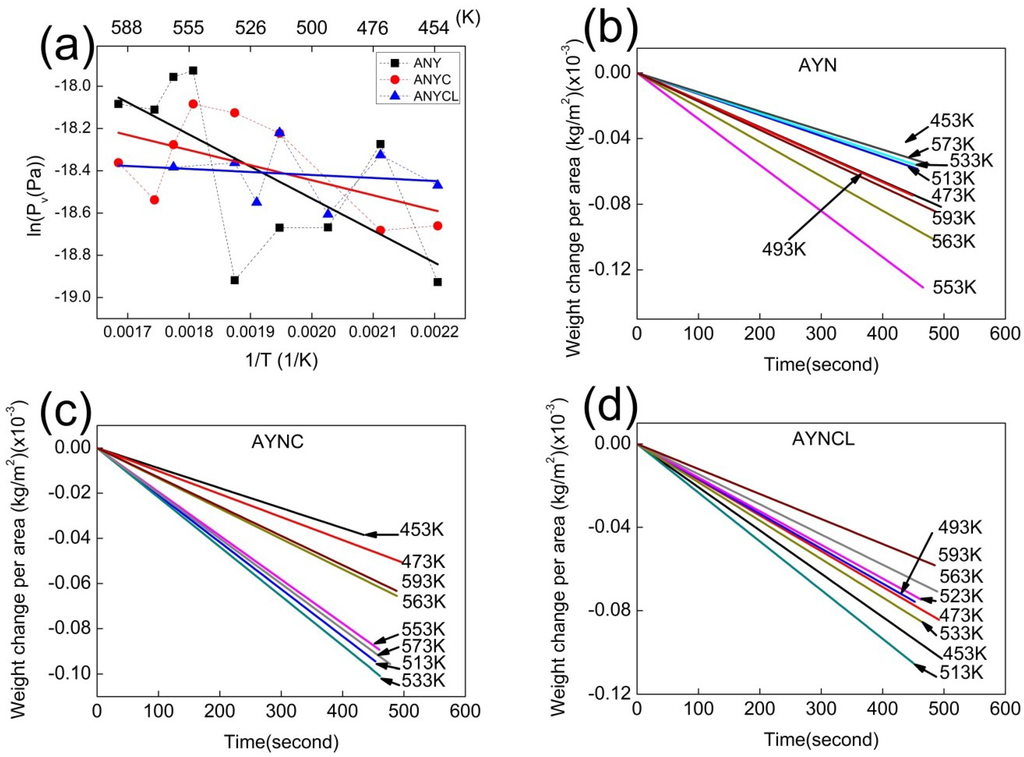
Figure 4.
(a) Vapor pressures of AYN, AYNC, and AYNCL as a function of temperature: The data points fit a straight line for each composite and were used to calculate the enthalpy of vaporization; and (b–d) the individual data points of the three composites in (a) were obtained by measuring weight losses per unit area as a function of time at various temperatures in TGA.
The ΔH for vaporization of the Al-based amorphous alloys close to the value of Tg was estimated using the Clausius-Clapeyron equation (Equation (2)). The data points in Figure 4 fit a straight line for each composition, and the enthalpy of vaporization was estimated from the slope of the straight line. The enthalpy of vaporization for the amorphous alloys was over the range 1.2–12.6 kJ/mol (see Table 2), and the error ranges caused by linear fitting were in the range 3.3–5.4 kJ/mol. Although errors exist, the calculated enthalpies were substantially lower than the ΔH for the vaporization of pure Al at melting temperature (approximately 284 kJ/mol). The temperature range for the vaporization was approximately from 373 to 673 K, and it overlapped with SCLR, regardless of the amorphous alloy compositions. In SCLR, the enthalpy of the glass transition of amorphous alloys is attributed to the change in heat capacity. In addition to heat capacity, other endothermic or exothermic reactions in SCLR have also been previously reported [27,28,29,30,31]. The origins of additional reactions in SCLR are the occurrence of phase separation, short-range or medium-range ordering, and an increase in local immiscibility of liquids in SCLR. To the best of our knowledge, the enthalpy of vaporization of amorphous alloys in SCLR is a novel finding.
Table 2.
Enthalpy changes of vaporization for ribbons of three compositions.
| Composition | ΔH (kJ/mol) |
|---|---|
| AYN | 12.6 ± 5.4 |
| AYNC | 5.9 ± 3.6 |
| AYNCL | 1.2 ± 3.3 |
4. Conclusions
In conclusion, we revealed that the vapor pressure of Al-based amorphous alloys well below their melting temperatures was comparable to that of crystalline Al near its melting temperature, 873 K. In the temperature range 453–593 K, the vapor pressure of the AYN, AYNC, and AYNCL alloys measured in this study was (0.6–1.4) × 10−8 Pa. The vapor pressure was comparable to that of pure Al over the temperature range 853–873 K. An unexpectedly high amount of vaporization at this low temperature was substantiated by the weight loss determined by TGA and the formation of Al nanocrystallites from condensation after heating. The amount of weight loss varied with the composition of the Al-based amorphous alloys, and it was inversely proportional to GFA.
Acknowledgments
This research was supported by Basic Science Research Program through the National Research Foundation of Korea (NRF) funded by the Ministry of Education (NRF-2014R1A1A2055961).
Author Contributions
S.J.K. wrote and edited the paper, and contributed in all activities. J.I.J. performed DSC and TGA experiment and analyzed the results. S.H.L. synthesized amorphous ribbons using arc-melting and melt-spinning. J.J. performed XRD and SEM experiment and analyzed the results.
Conflicts of Interest
The authors declare no conflict of interest.
References
- Gaskell, D.R. Introduction to the Thermodynamics of Materials, 3rd ed.; Taylor & Francis: Washington, DC, USA, 1995; p. 165. [Google Scholar]
- Lide, D.R. Crc Handbook of Chemistry and Physics, 84th ed.; CRC Press: Boca Raton, FL, USA, 2003. [Google Scholar]
- Schroers, J.; Hodges, T.M.; Kumar, G.; Raman, H.; Barnes, A.J.; Pham, Q.; Waniuk, T.A. Thermoplastic blow molding of metals. Mater. Today 2011, 14, 14–19. [Google Scholar] [CrossRef]
- Schroers, J.; Pham, Q.; Peker, A.; Paton, N.; Curtis, R.V. Blow molding of bulk metallic glass. Scr. Mater. 2007, 57, 341–344. [Google Scholar] [CrossRef]
- Kim, S.J.; Kim, S.Y.; Park, J.M.; Heo, J.N.; Lee, J.H.; Lee, S.M.; Kim, D.H.; Kim, W.T.; Lim, K.R.; Kim, D.; et al. Exploiting metallic glasses for 19.6% efficient back contact solar cell. Appl. Phys. Lett. 2012. [Google Scholar] [CrossRef]
- Kim, S.J.; Kim, S.Y.; Park, J.M.; Park, K.H.; Lee, J.H.; Lee, S.M.; Han, I.T.; Kim, D.H.; Lim, K.R.; Kim, W.T.; et al. Thermal decomposition of silver acetate in silver paste for solar cell metallization: An effective route to reduce contact resistance. Appl. Phys. Lett. 2013. [Google Scholar] [CrossRef]
- Kim, S.Y.; Kim, S.J.; Jee, S.S.; Park, J.M.; Park, K.H.; Park, S.C.; Cho, E.A.; Lee, J.H.; Song, I.Y.; Lee, S.M.; et al. Capillary flow of amorphous metal for high performance electrode. Sci. Rep. 2013. [Google Scholar] [CrossRef] [PubMed]
- Pitt, E.B.; Kumar, G.; Schroers, J. Temperature dependence of the thermoplastic formability in bulk metallic glasses. J. Appl. Phys. 2011. [Google Scholar] [CrossRef]
- Moller, B.; Rarey, J.; Ramjugernath, D. Estimation of the vapour pressure of non-electrolyte organic compounds via group contributions and group interactions. J. Mol. Liq. 2008, 143, 52–63. [Google Scholar] [CrossRef]
- Yang, B.J.; Yao, J.H.; Chao, Y.S.; Wang, J.Q.; Ma, E. Developing aluminum-based bulk metallic glasses. Philos. Mag. 2010, 90, 3215–3231. [Google Scholar] [CrossRef]
- Inoue, A. Amorphous, nanoquasicrystalline and nanocrystalline alloys in Al-based systems. Prog. Mater. Sci. 1998, 43, 365–520. [Google Scholar] [CrossRef]
- Sheng, H.W.; Cheng, Y.Q.; Lee, P.L.; Shastri, S.D.; Ma, E. Atomic packing in multicomponent aluminum-based metallic glasses. Acta Mater. 2008, 56, 6264–6272. [Google Scholar] [CrossRef]
- Liu, Y.; Schumacher, G.; Zizak, I.; Erko, A.; Banhart, J. Local structure and site substitution in Al86Ni6Co2Y4.5La1.5 bulk amorphous alloy. Mater. Lett. 2012, 70, 171–173. [Google Scholar] [CrossRef]
- Mukherjee, S.; Schroers, J.; Zhou, Z.; Johnson, W.L.; Rhim, W.K. Viscosity and specific volume of bulk metallic glass-forming alloys and their correlation with glass forming ability. Acta Mater. 2004, 52, 3689–3695. [Google Scholar] [CrossRef]
- Inoue, A.; Matsumoto, N.; Masumoto, T. Al-Ni-Y-Co amorphous alloys with high mechanical strengths, wide supercooled liquid region and large glass-forming capacity. Mater. Trans. JIM 1990, 31, 493–500. [Google Scholar] [CrossRef]
- Yang, B.J.; Yao, J.H.; Zhang, J.; Yang, H.W.; Wang, J.Q.; Ma, E. Al-rich bulk metallic glasses with plasticity and ultrahigh specific strength. Scr. Mater. 2009, 61, 423–426. [Google Scholar] [CrossRef]
- Lim, K.R.; Park, J.M.; Jee, S.S.; Kim, S.Y.; Kim, S.J.; Lee, E.S.; Kim, W.T.; Gebert, A.; Eckert, J.; Kim, D.H. Effect of thermal stability of the amorphous substrate on the amorphous oxide growth on Zr-Al-(Cu, Ni) metallic glass surfaces. Corros. Sci. 2013, 73, 1–6. [Google Scholar] [CrossRef]
- Lim, K.R.; Park, J.M.; Kim, S.J.; Lee, E.S.; Kim, W.T.; Gebert, A.; Eckert, J.; Kim, D.H. Enhancement of oxidation resistance of the supercooled liquid in Cu-Zr-based metallic glass by forming an amorphous oxide layer with high thermal stability. Corros. Sci. 2013, 66, 1–4. [Google Scholar] [CrossRef]
- Liu, T.; Chen, N.; Xu, Z.X.; Ma, R.Z. The amorphous-to-nanocrystalline transformation in Fe73.5Cu1Nb3Si13.5B9 studied by thermogravimetry analysis. J. Magn. Magn. Mater. 1996, 152, 359–364. [Google Scholar] [CrossRef]
- Spiridis, N.; Haber, J.; Korecki, J. STM studies of Au nano-clusters on TiO2 (110). Vacuum 2001, 63, 99–105. [Google Scholar] [CrossRef]
- Kim, S.J.; Stach, E.A.; Handwerker, C.A. Silver layer instability in a SnO2/Ag/SnO2 trilayer on silicon. Thin Solid Films 2012, 520, 6189–6195. [Google Scholar] [CrossRef]
- Gleiter, H. Nanocrystalline materials. Prog. Mater. Sci. 1989, 33, 223–315. [Google Scholar] [CrossRef]
- Umehara, A.; Nitta, S.; Furukawa, H.; Nonomura, S. Preparation and properties of nanocrystalline semiconductor selenium films. Appl. Surf. Sci. 1997, 119, 176–180. [Google Scholar] [CrossRef]
- Phang, P.; Dollimore, D.; Evans, S.J. A comparative method for developing vapor pressure curves based on evaporation data obtained from a simultaneous TG-DTA unit. Thermochim. Acta 2002, 392, 119–125. [Google Scholar] [CrossRef]
- Price, D.M. Vapor pressure determination by thermogravimetry. Thermochim. Acta 2001, 367, 253–262. [Google Scholar] [CrossRef]
- Langmuir, I. The vapor pressure of metallic tungsten. Phys. Rev. 1913, 2, 329–342. [Google Scholar]
- Chen, H.S.; Turnbull, D. Formation, stability and structure of palladium-silicon based alloy glasses. Acta Metall. 1969, 17, 1021–1031. [Google Scholar] [CrossRef]
- Yavari, A.R.; Osamura, K.; Okuda, H.; Amemia, Y. Small-angle x-ray scattering study of phase separation in amorphous alloys during heating with use of synchrotron radiation. Phys. Rev. B 1988, 37, 7759–7765. [Google Scholar]
- Kumar, G.; Nagahama, D.; Ohnuma, M.; Ohkubo, T.; Hono, K. Structural evolution in the supercooled liquid of Zr36Ti24Be40 metallic glass. Scr. Mater. 2006, 54, 801–805. [Google Scholar] [CrossRef]
- Madge, S.V.; Rösner, H.; Wilde, G. Transformations in supercooled Pd40.5Ni40.5P19. Scr. Mater. 2005, 53, 1147–1151. [Google Scholar] [CrossRef]
- Park, E.S.; Na, J.H.; Kim, D.H. Abnormal behavior of supercooled liquid region in bulk-forming metallic glasses. J. Appl. Phys. 2010. [Google Scholar] [CrossRef]
© 2015 by the authors; licensee MDPI, Basel, Switzerland. This article is an open access article distributed under the terms and conditions of the Creative Commons Attribution license (http://creativecommons.org/licenses/by/4.0/).