Article

On the Effect of Pouring Temperature on Spheroidal Graphite Cast Iron Solidification

1
Departamento de Ingeniería Metalúrgica, Universidad de Santiago de Chile (USACH), Av. Bernardo O'Higgins 3363, Santiago, Chile
2
Departamento de Ingeniería Mecánica y Metalúrgica, Centro de Investigación en Nanotecnología y Materiales Avanzados (CIEN-UC), Pontificia Universidad Católica de Chile (PUC), Av. Vicuña Mackenna 4860, Santiago, Chile
3
Departamento de Ingeniería Mecánica, Universidad de Santiago de Chile (USACH), Av. Bernardo O'Higgins 3363, Santiago, Chile
*
Author to whom correspondence should be addressed.
These authors contributed equally to this work.
Metals 2015, 5(2), 628-647; https://doi.org/10.3390/met5020628
Submission received: 31 December 2014 / Revised: 26 March 2015 / Accepted: 27 March 2015 / Published: 20 April 2015
(This article belongs to the Special Issue Advances in Solidification Processing)

Abstract

:
This work is focused on the effect of pouring temperature on the thermal-microstructural response of an eutectic spheroidal graphite cast iron (SGCI). To this end, experiments as well as numerical simulations were carried out. Solidification tests in a wedge-like part were cast at two different pouring temperatures. Five specific locations exhibiting distinct cooling rates along the sample were chosen for temperature measurements and metallographic analysis to obtain the number and size of graphite nodules at the end of the process. The numerical simulations were performed using a multinodular-based model. Reasonably good numerical-experimental agreements were obtained for both the cooling curves and the graphite nodule counts.

1. Introduction

Nodular cast iron, also known as spheroidal graphite cast iron (SGCI) or ductile iron, was firstly developed in 1949 using a Mg-Cu alloy as a spherodizing agent [1]. As a structural material, SGCI has the following properties: versatility, good performance/cost ratio, high corrosion and wear resistance, ductility and high tensile resistance. Studies focusing on this material have been carried out during the last few years due to its extensive use and the growing trend of replacing forged steel because of its manufacturing cost which, in general, is higher than that of SGCI. In particular, the automotive industry has shown great interest and trust in this material by using it in safety components such as steering knuckles and calipers [2]. Another critical application that reflects the good performance and properties of this material is in the storage and transport of nuclear waste [1].
The microstructure of nodular cast iron is responsible for the useful properties of this material and the main reason for the many studies devoted to it since its appearance [3]. By understanding the microstructure, greater control over the physical properties of the final product can be established [4]. One of the most important parameters for microstructure control of SGCI is the cooling rate, i.e., a high cooling rate produces large amounts of carbides in the matrix, causing a significant decrease in ductility and toughness of the material and thus requiring expensive heat treatments for the dissolution of such carbides.
Several models have been proposed to describe the kinetic mechanisms that occur during the liquid-solid transformation of a SGCI with eutectic composition, some of them being based on the uninodular theory [5,6,7,8,9,10,11,12,13,14] and others based on the multinodular theory [15,16,17,18,19]. Nevertheless, the so-called multinodular models are nowadays gaining acceptance due to their good prediction capabilities. According to the multinodular theory of nucleation and growth, during the cooling process of a nodular cast iron with eutectic composition, once the eutectic temperature is reached, austenite and graphite nucleate independently in the liquid (austenite growing in a dendritic shape and graphite in a spherical shape) such that at a certain instant (experimentally determined in reference [16]), graphite is enveloped by the thinnest arms of dendritic austenite and subsequent growth proceeds by carbon diffusion through this phase. It should be mentioned that the multinodular-based model developed by Boeri [16] was widely used and validated with the experiments in reference [20].
In the present work, the effect of pouring temperature on the thermal-microstructural response of the solidification of a nodular cast iron with eutectic composition is analyzed both experimentally and numerically. This specific analysis constitutes an extension of another study [20] which emphasized the influence of the cooling rate on the microstructural evolution of the analyzed part. In order to analyze the evolution of the microstructure during the cooling process, two solidification experiences, i.e., two experiences with filling temperatures of 1200 °C and 1250 °C, were carried out in a wedge-like mold. Details of the experimental procedure are presented in Section 2. Section 3 briefly describes the multinodular-based model used in this study. The discussions, comparison and experimental validation of the numerical results provided by this model, which encompass cooling curves and graphite nodule distributions at different positions of the samples, are given in Section 4. Finally, the main concluding remarks are found in Section 5.

2. Experimental Procedure

Two castings, W1 and W2, were carried out in a wedge-like mold in order to analyze the effect of the pouring temperature on the thermal-microstructural response of the solidification of a nodular cast iron with eutectic composition. A schematic view of the analyzed part is shown in Figure 1. The temperature measurements were made using five 0.51 mm type K thermocouples located at the center of the casting and 50 mm from each other along its length. Due to the high temperatures at these points, the wire of the thermocouple was covered with ceramic tiles and fiber glass cases. The temperature-time curves were obtained with a MICRO MAC thermal interface Model Personal Daq55 (pdaqview55) connected to a laptop.
Figure 1. Mold used in the solidification experiences W1 and W2.
Metals 05 00628 g001

2.1. Solidification Experiences

The pouring temperature for the two solidification experiences W1 and W2 was among the standard ones used at the foundry where these experiences were carried out. They led to a maximum recorded liquid temperature at the mold cavity of 1200 ± 5 °C for W1 and 1250 ± 5 °C for W2. The error in this temperature refers to the measurements registered by the five thermocouples at early stages. Thus, these maximum temperatures, which strictly corresponded to the filling temperatures, are considered the initial temperatures owing to the short filling times of the whole part in both tests. The solidification experiences were carried out in an induction furnace operating under standard conditions. Although the total weight of the casting was that of the total furnace capacity, i.e., 560 kg, the total weight of the metal used for the experiences was only 25 kg. The charge for the solidification experiences was as follows: 53.4% scrap, 41.3% returns, 2.0% low sulfur graphite and 3.3% Fe75Si.
The melting process had an extension of 1.5 h, approximately. The carbon equivalent (CE) adjustment was carried out by the addition of FeSi to the molten metal. The composition of the liquid metal was measured with a standard carbon equivalent meter system. Temperature control was carried out by lance immersion in the liquid. The CE, %C and %Si values were obtained approximately at 1450 °C with cup thermal analysis. The desired chemical composition of the liquid was %C: 3.7–3.9 and %Si: 1.8–2.0. The nodularizing treatment was carried out with a FeMg alloy using the sandwich method [21]. In this procedure, the treatment ladle was previously heated with a burner or by pouring molten metal from the furnace into the ladle. The nodularizing and inoculant agents were placed into the ladle cavity, 1% and 0.2%, respectively. Then, steel scrap (2%–3% of metal weight) or plates of steel or nodular cast iron were placed over these agents. After that, the metal was poured into the treatment ladle to carry out the nodularizing and inoculant processes.
The chemical composition of experiences W1 and W2 is shown in Table 1. The equivalent carbon is given by CE = %C + 0.28%Si + 0.30%P + 0.007%Mn + 0.033%Cr.
Table 1. Chemical composition of experiences W1 and W2.
CSiMnSPNiCuCrMgCE
3.392.670.520.0470.0530.020.010.080.0424.16

2.2. Metallographic Analysis

In order to measure the size, morphology and nodule distribution as a function of the pouring temperature, a metallographic analysis was carried out. The samples were taken out from the center of the wedge cavity and close to the thermocouple location. The cooling curves were obtained in five points at the center line of the wedge, as already shown in Figure 1. Those points were labeled W11 to W15 and W21 to W25 for solidification experiences W1 and W2, respectively.
The surface nodule count was carried out using the software Image-Pro Plus (Measurement Computing Corporation, Norton, MA, USA). With this software, it was possible to measure the size and shape factor of the graphite nodules. Once these data were obtained, the nodule sizes were grouped into families. The volumetric nodule count was then obtained using the following expression that comes from equating the surface and volume graphite fractions:
N V = 3 4 R N A
where NV is the volumetric nodule count (nodules per mm3), NA is the surface nodule count (nodules per mm2) and R is the nodule radius (mm).
The maximum and minimum nodule sizes in the two experiences were 10 μm and 75 μm, respectively. From these lower and upper bounds, five experimental families were considered, each one 13 μm long. The total nodule count was obtained by summing the respective values per family at each point. The family details used to carry out the experimental nodule count are shown in Table 2.
Table 2. Radius range of each family.
FamilyRadius range (μm)
110–23
223–36
336–49
449–62
562–75

2.3. Cooling Curves Characterization

This stage consists in determining the relevant temperatures and times for the many reactions that occur during the solidification process of the nodular cast iron in experiences W1 and W2. The cooling process is carried out in the mold up to 300 °C. In order to carry out the cooling curve characterization, the standard method is applied [22], which consists in determining the first derivative of the cooling curve and then projecting both curves in the same chart. By doing this, it is possible to identify the times at which the slope of the cooling rate curve changes (blue curve) and, then, to obtain the temperatures at such times in the cooling curve (black curve). Figure 2 shows the applied method in a graphical form where the temperature and time of the different reactions that take place during the cooling process can clearly be seen. The temperature TEG corresponds to the bulk eutectic reaction start, TEU is the maximum undercooling temperature, TER is the maximum temperature reached after the recalescence and TES is the final solidification temperature.
Figure 2. Schematic representation of the procedure applied for the cooling curve characterization.
Metals 05 00628 g002

3. Numerical Modeling

3.1. Thermal Model

In order to take into account the phase changes that occur during the cooling process, the well-known energy equation is considered [17,18,19,20]:
ρ c T ˙ + ρ L f ˙ p c = ( k T )
where ρ is the density, c is the specific heat, k is the thermal conductivity, T is the temperature, L is the phase change latent heat and fpc is the phase change function (0 ≤ fpc ≤ 1) that is considered in this context to be the liquid fraction fl = 1 − fs, where fs is the liquid fraction provided by the microstructural model described below. A dot over the variable indicates time derivative and is the gradient operator. The solution of this equation is obtained with initial and boundary conditions and it is carried out through a spatial discretisation using the Finite Element Method (FEM) and a time discretisation using the Finite Differences Method (FDM) [23,24].

3.2. Microstructural Model

The numerical model implemented to simulate the solidification process of an eutectic nodular cast iron poured at two different temperatures in a wedge-like mold is based on the multinodular theory of nucleation and growth [16]. This model assumes that graphite spheres and dendrites of austenite nucleate in the liquid and, after a period of time when the nodule reaches 6 μm in size, the graphite nodules are assumed to be enveloped by the thinner arms of the austenite dendrites. The subsequent growth takes place via carbon diffusion through the austenite envelope. The main aspects of the nucleation and growth laws considered in this approach laws are described below (details of this model can be found in reference [20]).

3.2.1. Graphite Nucleation

The rate of the graphite nucleation density Ngr is assumed to follow an exponential law in the form:
N ˙ g r = f l b Δ T exp ( c Δ T )
where ∆T = TET is the undercooling, with TE being the equilibrium eutectic temperature, and b and c are the nucleation parameters that are assumed to remain constant for a given composition and liquid treatment. The factor fl is included to take into account the continuous disappearance of the nucleation sites with liquid consumption. In this stage, it must be clarified that the model assumes that the nucleation stops when the recalescence is achieved and starts again when the temperature falls below the last maximum undercooling until the end of the solidification process.

3.2.2. Graphite Growth

As already mentioned, two different growing stages are considered: at the beginning, the graphite nodules are only in contact with liquid and, afterwards, the graphite particles are enveloped by the thinner dendrites arms of austenite. The respective growth laws are given by:
r ˙ g r = 1 2 r g r C l / γ C l / g r C g r C l / g r ρ l ρ g r D C l
r ˙ g r = 1.91 r g r C γ / l C γ / g r C g r C γ / g r ρ γ ρ g r D C γ f l 2 / 3
where rgr is the graphite radius and ρl, ρgr and ργ are the liquid, graphite and austenite densities, respectively. Furthermore, D C l and D C γ are the respective diffusion coefficients of carbon in liquid and austenite while C l / γ , C γ / l , C l / g r and C γ / g r correspond to the equilibrium concentrations at the temperature T of liquid with austenite, austenite with liquid, liquid with graphite and austenite with graphite, respectively (Cgr = 100% is the carbon concentration in graphite). These parameters are schematically presented in Figure 3. In this figure, TAS correspond to the austenite solidus temperature, TAL is the austenite liquidus temperature, TGL is the graphite liquidus temperature and TAG determines the carbon solubility variation in austenite.
Figure 3. Equilibrium compositions considered in the microstructural model.
Metals 05 00628 g003

3.2.3. Graphite and Austenite Fractions

The graphite fraction is calculated according to:
f g r = 1 j 4 3 π N g r j r g r j 3
where j relates to the number of different nodule radii that are present in a volume element due to the non-simultaneity of nucleation.
The austenite fraction is obtained by:
f γ = 100 % C E C E C T E f g r
where CTE and CE are the carbon solubility in austenite at the eutectic temperature and the eutectic carbon content (in %), respectively.
Finally, the solid fraction is equal to:
f s = f g r + f γ

4. Results and Discussion

This section firstly presents the experimental results obtained in experiences W1 and W2 described in Section 2. Then, the numerical results obtained with the model summarized in Section 3 are discussed and compared with the corresponding measurements in order to establish its limitations and predictive capabilities.

4.1. Experimental

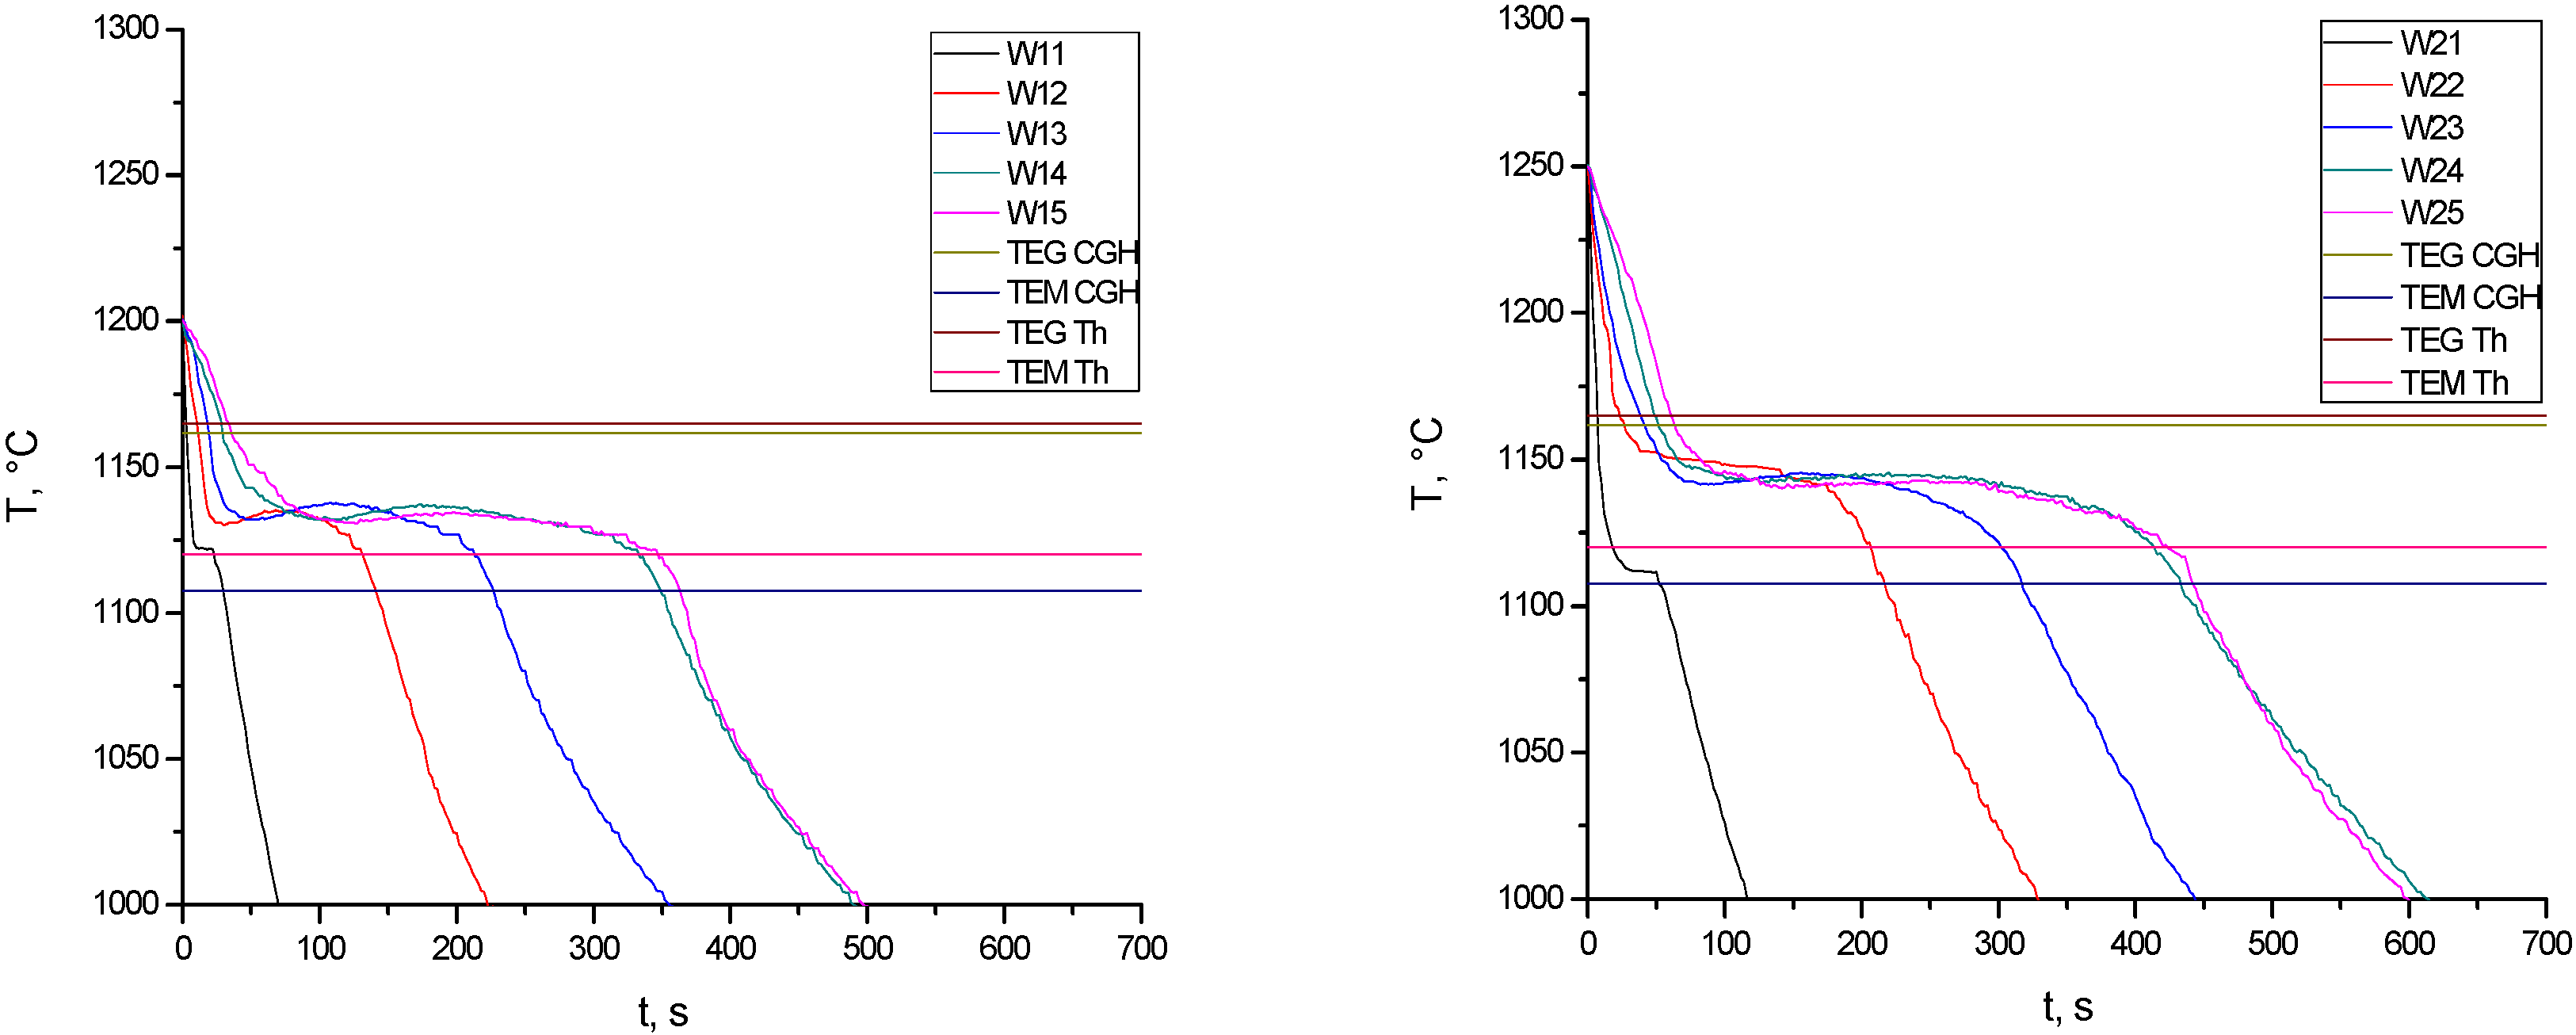
Figure 4 shows the experimental cooling curves of the five analyzed points in experiences W1 and W2 together with the stable (TEG) and metastable (TEM) eutectic temperatures. These temperatures were obtained using an experimental correlation derived from the works of Chipman [25], Gustafson [26] and Henschel [27], among others; this correlation is identified as CGH. The same temperatures were obtained with the software Thermocalc [28], labeled Th, which does not consider the phosphorus content in its database. When comparing the cooling process of each point in both experiences, it is observed that the higher pouring temperature of W2 produces longer solidification times than those of W1 and, in addition, the temperatures of the different reactions in experience W2 are slightly higher than those of W1. In both experiences, it is also seen that, particularly in the first cooling stage, as the thickness of the part increases, the cooling rate decreases. As a consequence of this, a continuous increase in the solidification time of the five points along the part is observed. As expected, the points located at the thicker part has a longer solidification time than the ones located at the thinner parts, which evidences the effect of wedge thickness on the cooling process. This effect is also influenced by the pouring temperature, i.e., as the pouring temperature increases, the solidification times increases as well.
As mentioned above, the stable and metastable eutectic temperatures are included in Figure 4 with the aim of analyzing and evaluating the cementite nucleation in each point along the part. The different temperatures obtained with both methods (i.e., correlations CGH and Th) can clearly be appreciated. It is observed that, according to the values obtained with the correlation Th in the thinner parts of the wedge (locations W11 and W21), the metastable reaction would take place since the cooling curves of these points intersect the metastable eutectic temperature. On the other hand, it should be noted that this effect is not predicted in the same way with the CGH correlation. Considering this last correlation, it is seen that all the temperature-time curves fall within the range TEG-TEM, which means that, regardless of what is predicted by the Th correlation, all points of the wedge would solidify according to the stable Fe-graphite diagram. However, from the metallographic analysis carried out at the different points, the validity of the prediction given by the Th correlation is confirmed since, as mentioned below, a high fraction of white eutectic was found in locations W11 and W21.
Figure 4. Experimental cooling curves of experiences W1 and W2.
Metals 05 00628 g004
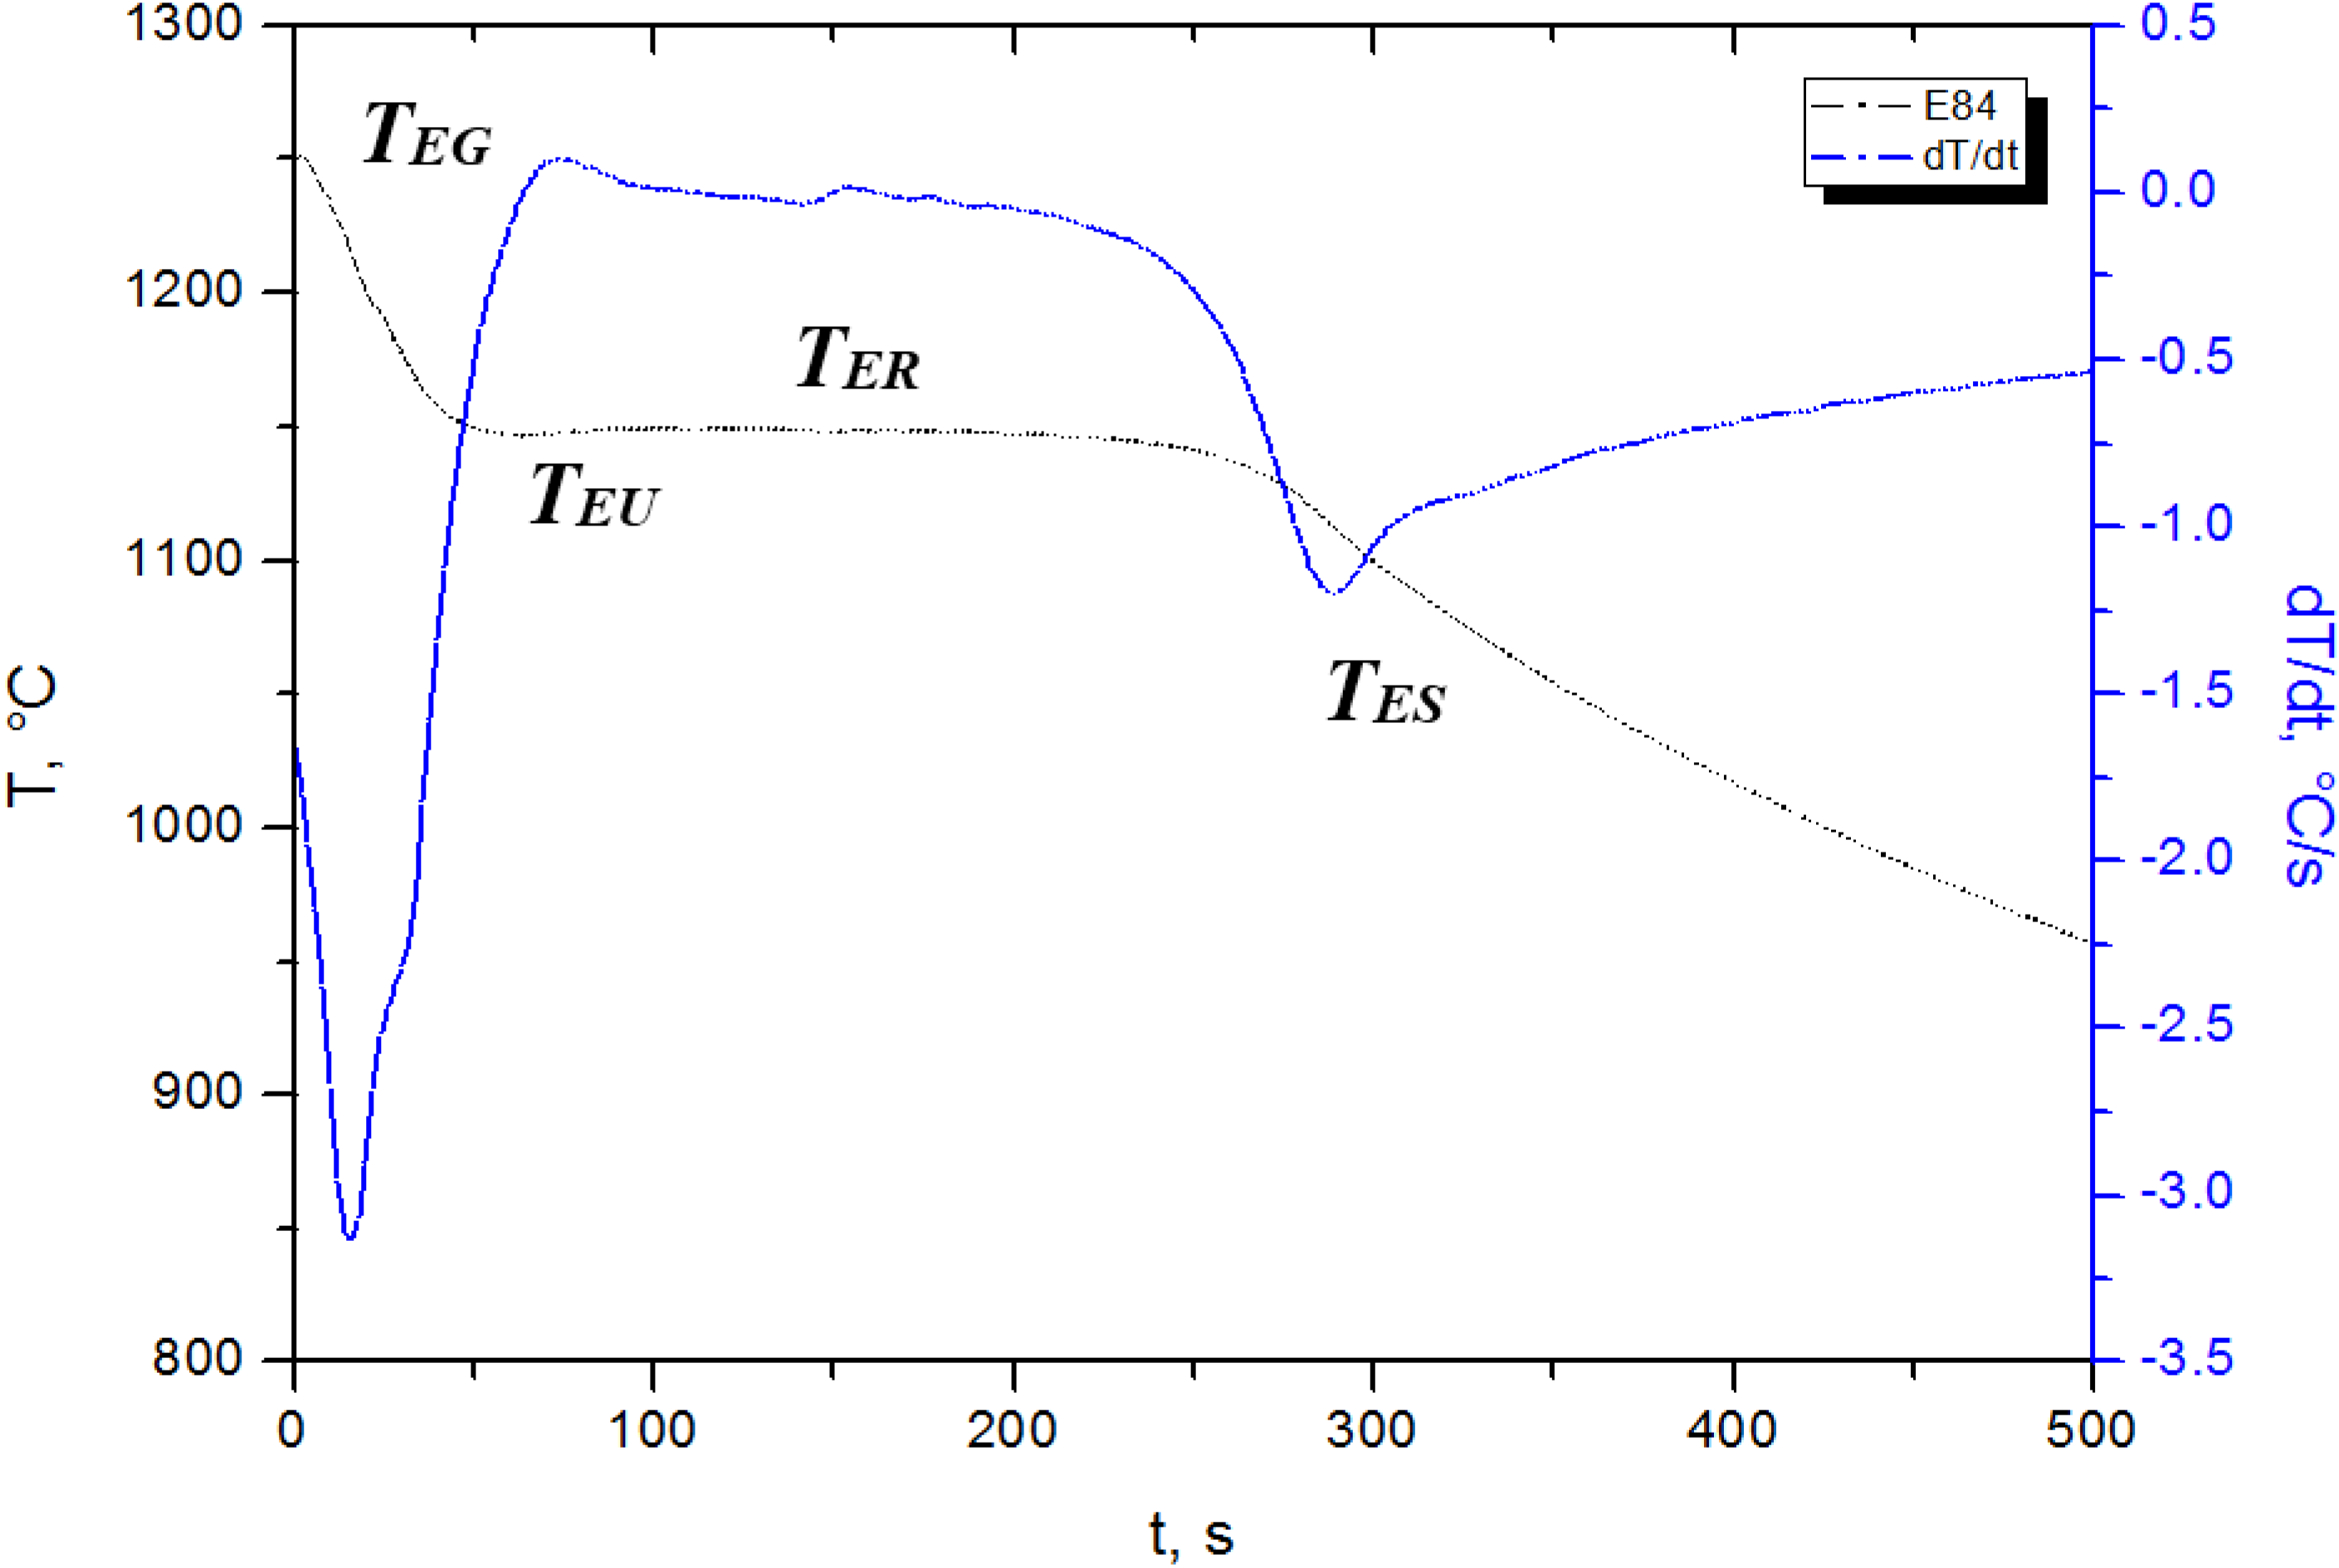
Table 3 summarizes the results obtained from the standard procedure carried out to determine the characteristic times and temperatures of the solidification experiences. The eutectic undercooling ∆TEG = TEGTEU, the recalescence amplitude ∆Tr = TERTEU and the elapsed time from the eutectic reaction until the solidification ending ∆tES = t(TES) –t(TEG) are also included. It can be seen that, as the pouring temperature increases, ∆Tr decreases and ∆tES increases.
Table 3. Experimental cooling curves characterization for experiences W1 and W2.
PointtTEG, sTEG, °CtTEU, sTEU, °CtTER, sTER, °CtTES, sTES, °CTrTEGtESdT/dt, °C/s
W112.11172.811.81121.915.61122.537.11091.30.550.954.113.9
W123.81188.931.51130.177.81135.0150.11096.45.058.8174.53.7
W1310.81181.651.41131.9113.91137.6238.01094.85.749.7241.52.1
W1415.71181.9101.91132.1175.91137.2356.01100.85.249.9338.51.3
W1520.01183.2127.41130.9198.41134.3372.91095.33.552.3355.91.2
W215.91180.435.01111.549.81111.965.81087.00.468.959.912.1
W2217.41180.6----------------224.61098.7--------207.23.3
W2320.21190.188.41141.6157.01145.3316.31108.83.748.6296.11.7
W2434.31191.4129.81142.5219.91145.5433.01107.93.048.9398.61.5
W2550.41182.4141.11140.4244.71142.9438.31113.92.542.0387.91.3
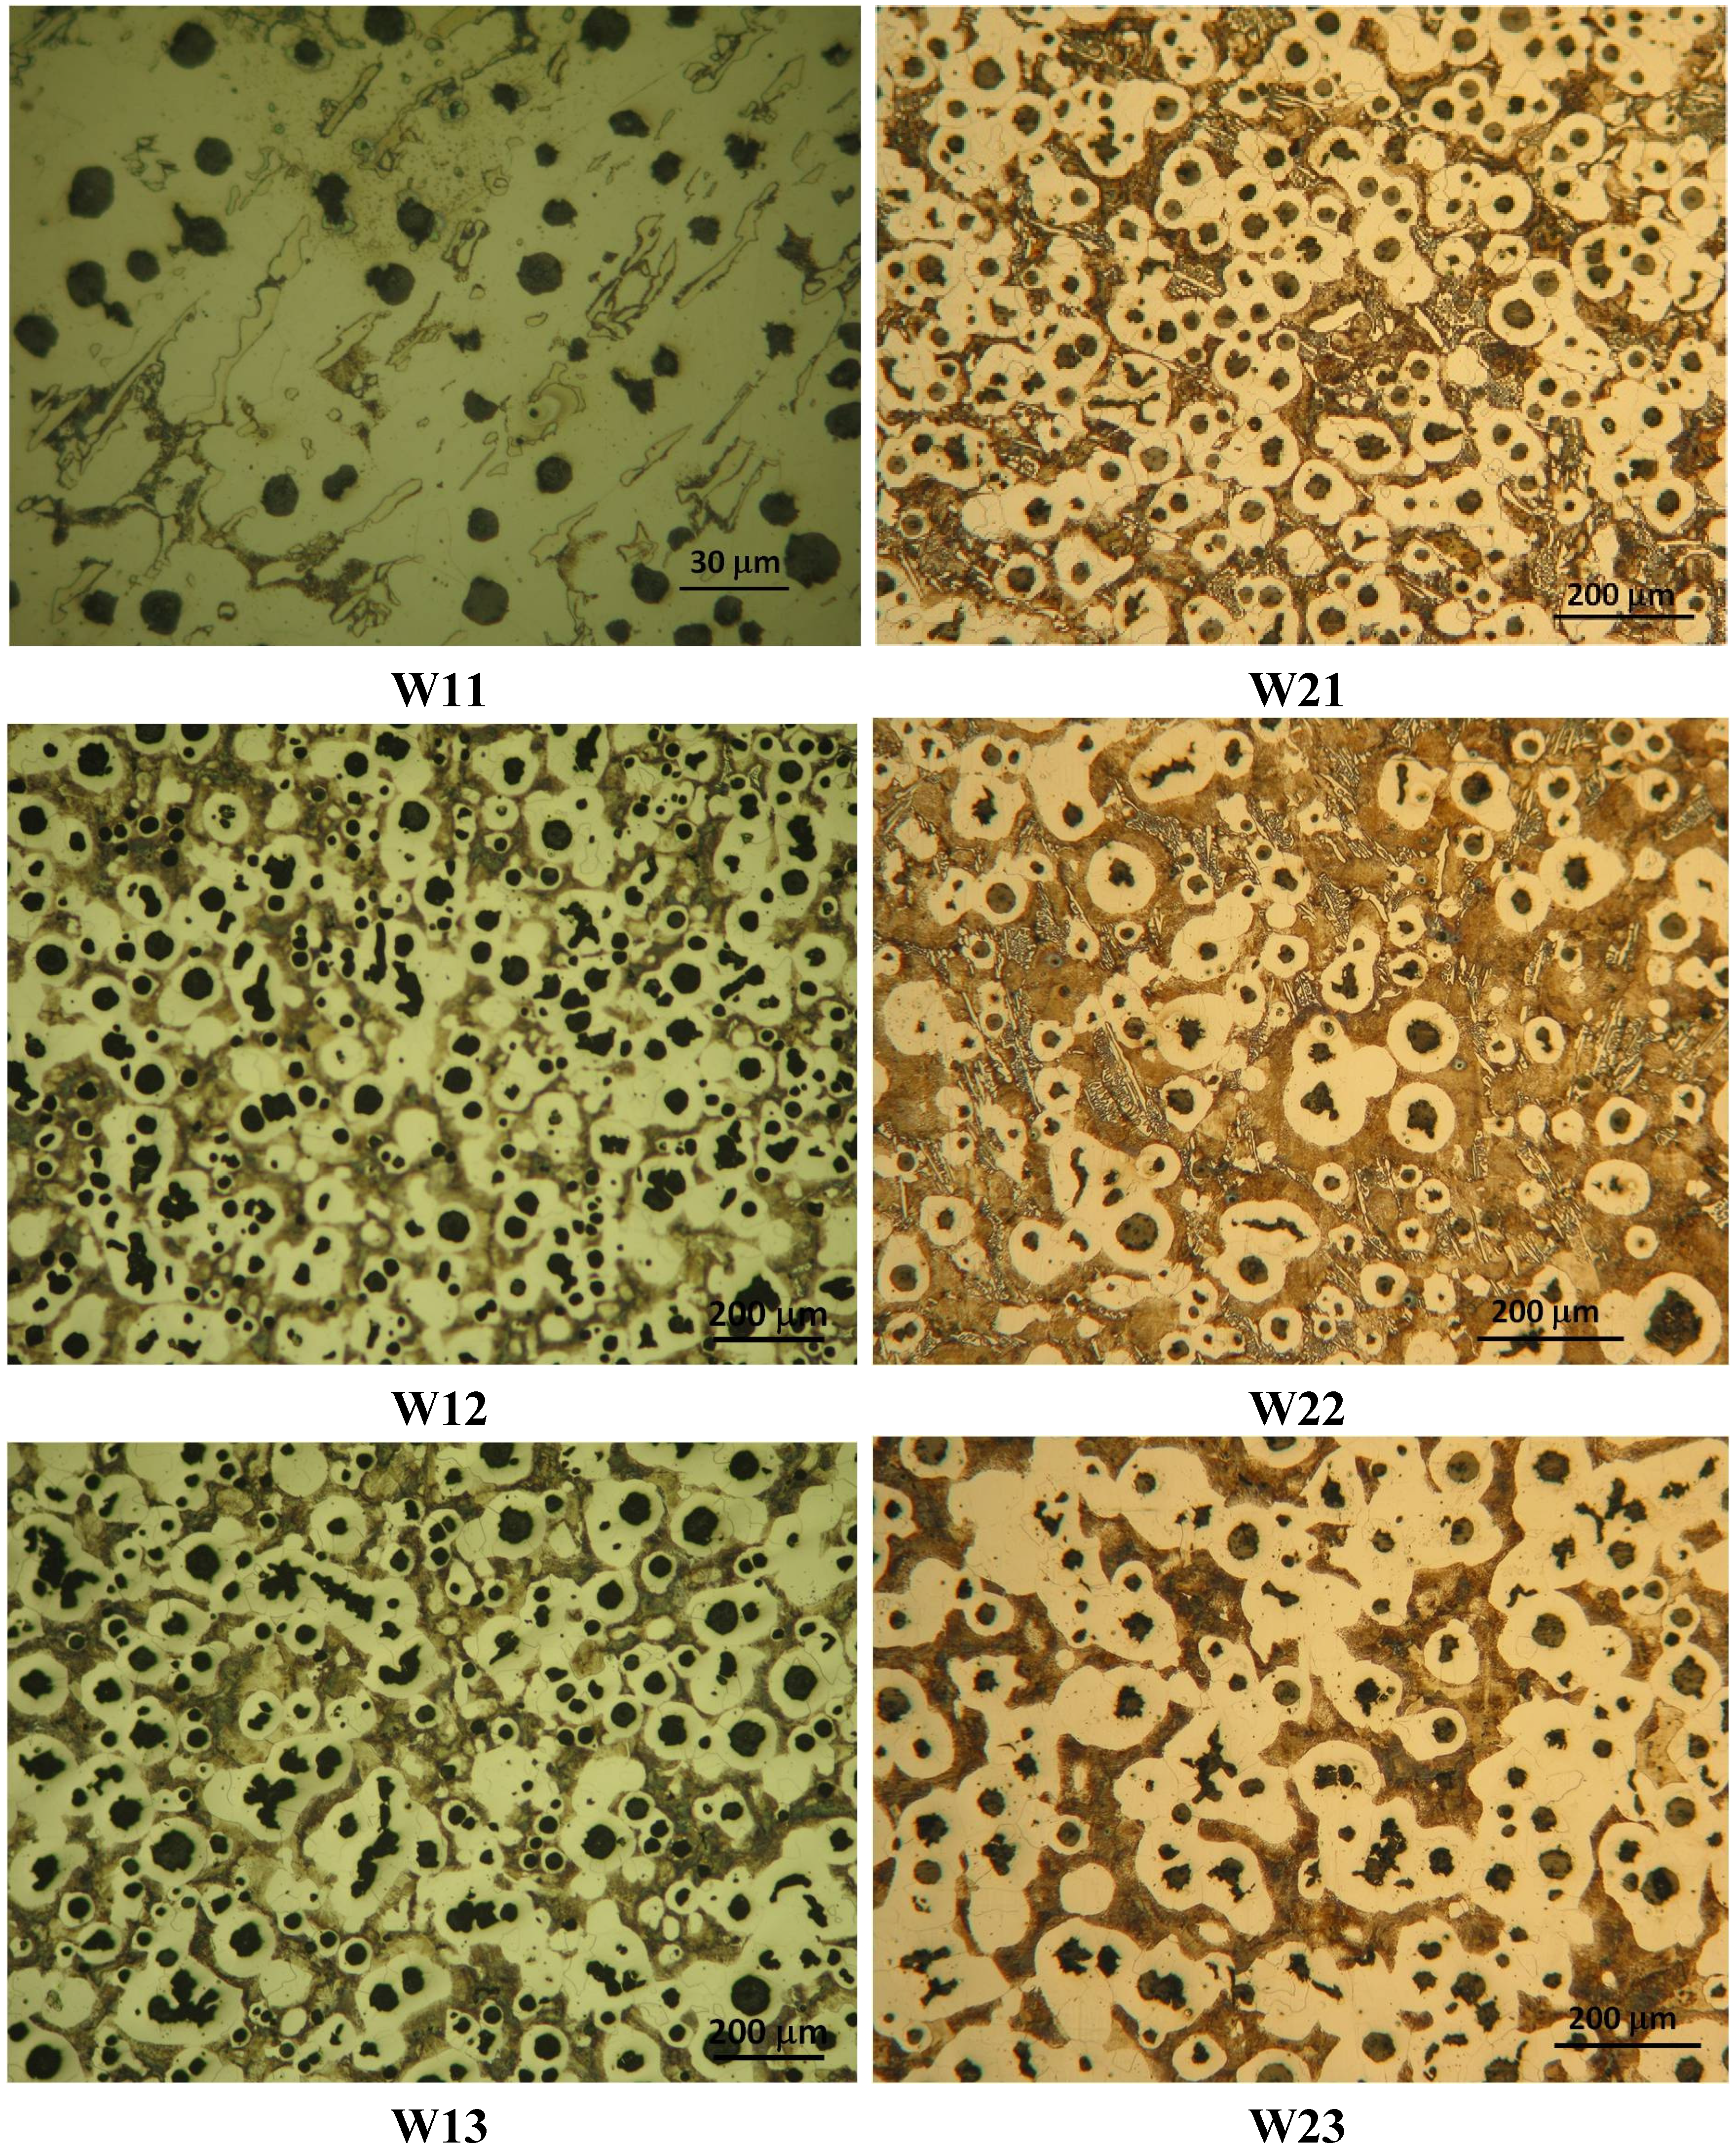
The as-cast microstructures at the different locations in experiences W1 and W2 are shown in Figure 5. The experimental phase fractions for each of those points are summarized in Table 4. In both cases it is observed that, as the pouring temperature increases, the nodule density decreases. This would be due to the effect of the high pouring temperature and the longer time that the molten metal is submitted to this high temperature, producing the growth of the graphite nodules which relates to a lower nodule density. As can be seen in Figure 5, a continuous growth of the graphite nodules is produced from the thinner to the thicker parts of the wedges because of the effect of both cooling rate and pouring temperature on the nucleation and growth time of a graphite particle during the solidification process. As also can be seen in this figure, in the thinner parts of both wedges, random carbides distributed in the structure are observed which, unlike the experimental correlation CGH, is also predicted by Thermocalc. This can be seen in Figure 4, where the cooling curve of points W11 and W21 do not intersect the metastable eutectic temperature curves calculated with this correlation (CGH), thus the white eutectic nucleation is not allowed to succeed. It is important to point out that the presence of carbides is also observed in point W22, a fact that according to Figure 4 would not be plausible. Despite this, it is necessary to take into account the presence of alloying elements in the alloy, mainly manganese and chromium. These elements are strong carbide promoters [29] which, together with the high cooling rate in the thinner sections of the part, could be the reason for the presence of this hard and brittle phase in those zones, even in the 20 mm thick part of wedge W2 (point W21). Towards the thicker parts of the wedges the cementite phase is no longer observed. In these positions, the microstructure is mainly composed by variable quantities of pearlite, ferrite and graphite nodules that depend on the pouring temperature, the cooling rate and the chemical composition of the alloy. As a consequence, when comparing the microstructure of the thinner parts of the wedges to the other locations, there is a change in the graphite fraction, since part of the available carbon forms carbides, producing the stable phase fraction to be lowered; see Table 4. Regarding the phases present in each point, it can be seen that in both cases the carbides fraction is around 5% and part of a ferritic-pearlitic matrix with variables quantities according to the cooling conditions in each point. Towards the thicker parts of the wedges (from W12 upwards for W1 and from W23 upwards for W2), no carbides are observed in the final solidification microstructure of the parts.
Figure 5. Solidification microstructure at the five points in experiences W1 and W2.
Metals 05 00628 g005aMetals 05 00628 g005b
Table 4. Experimental phase fraction at different locations in experiences W1 and W2.
PointPouring T, °C% F% G% P% Fe3C
W11120076.96.911.64.6
W12120059.912.028.10
W13120059.213.227.60
W14120061.612.426.00
W15120068.612.818.60
W21125042.39.442.55.8
W22125036.95.651.26.3
W23125062.77.729.60
W24125062.86.830.40
W25125053.09.437.60

4.2. Numerical Simulation and Experimental Validation

The nucleation parameters b and c were chosen to be the ones with which the better numerical-experimental adjustment was achieved, i.e., those exhibiting the lower experimental-numerical discrepancy for both the cooling curves and the graphite nodule counts. The parameters that simultaneously minimize this error for experiences W1 and W2 were b = 4.0 × 10¹² nuclei/(m °C s) and c = 340 °C. The numerical results obtained with these parameters are compared to the experimental measurements presented in the previous section. They are summarized in Table 5, considering the total nodule count at each point together with the numerical-experimental error, computed as:
ε = ( experimental _ value numerical _ value ) 2 ( experimental _ value ) 2
It can be seen that, as the pouring temperature increases, the nodule density decreases. This means that bigger nodules are produced because of the effect of a prolonged growth time of these particles in contact with the liquid phase giving rise to a lower quantity of large graphite particles.
Table 5. Error between the average experimental and numerical nodule counts obtained with b = 4.0 × 10¹² nuclei/(m °C s) and c = 340 °C.
PointExperimental nodule count NV (nuclei/m3)Numerical nodule count NV (nuclei/m3)Error
W112.47 × 10131.12 × 10130.30
W125.45 × 10121.01 × 10130.73
W136.53 × 10128.23 × 10120.07
W146.75 × 10126.82 × 10120.00
W157.62 × 10128.22 × 10120.01
W216.28 × 10121.14 × 10130.66
W223.47 × 10129.38 × 10122.90
W231.46 × 10127.96 × 101219.82
W242.00 × 10126.48 × 10125.02
W251.23 × 10127.82 × 101228.71
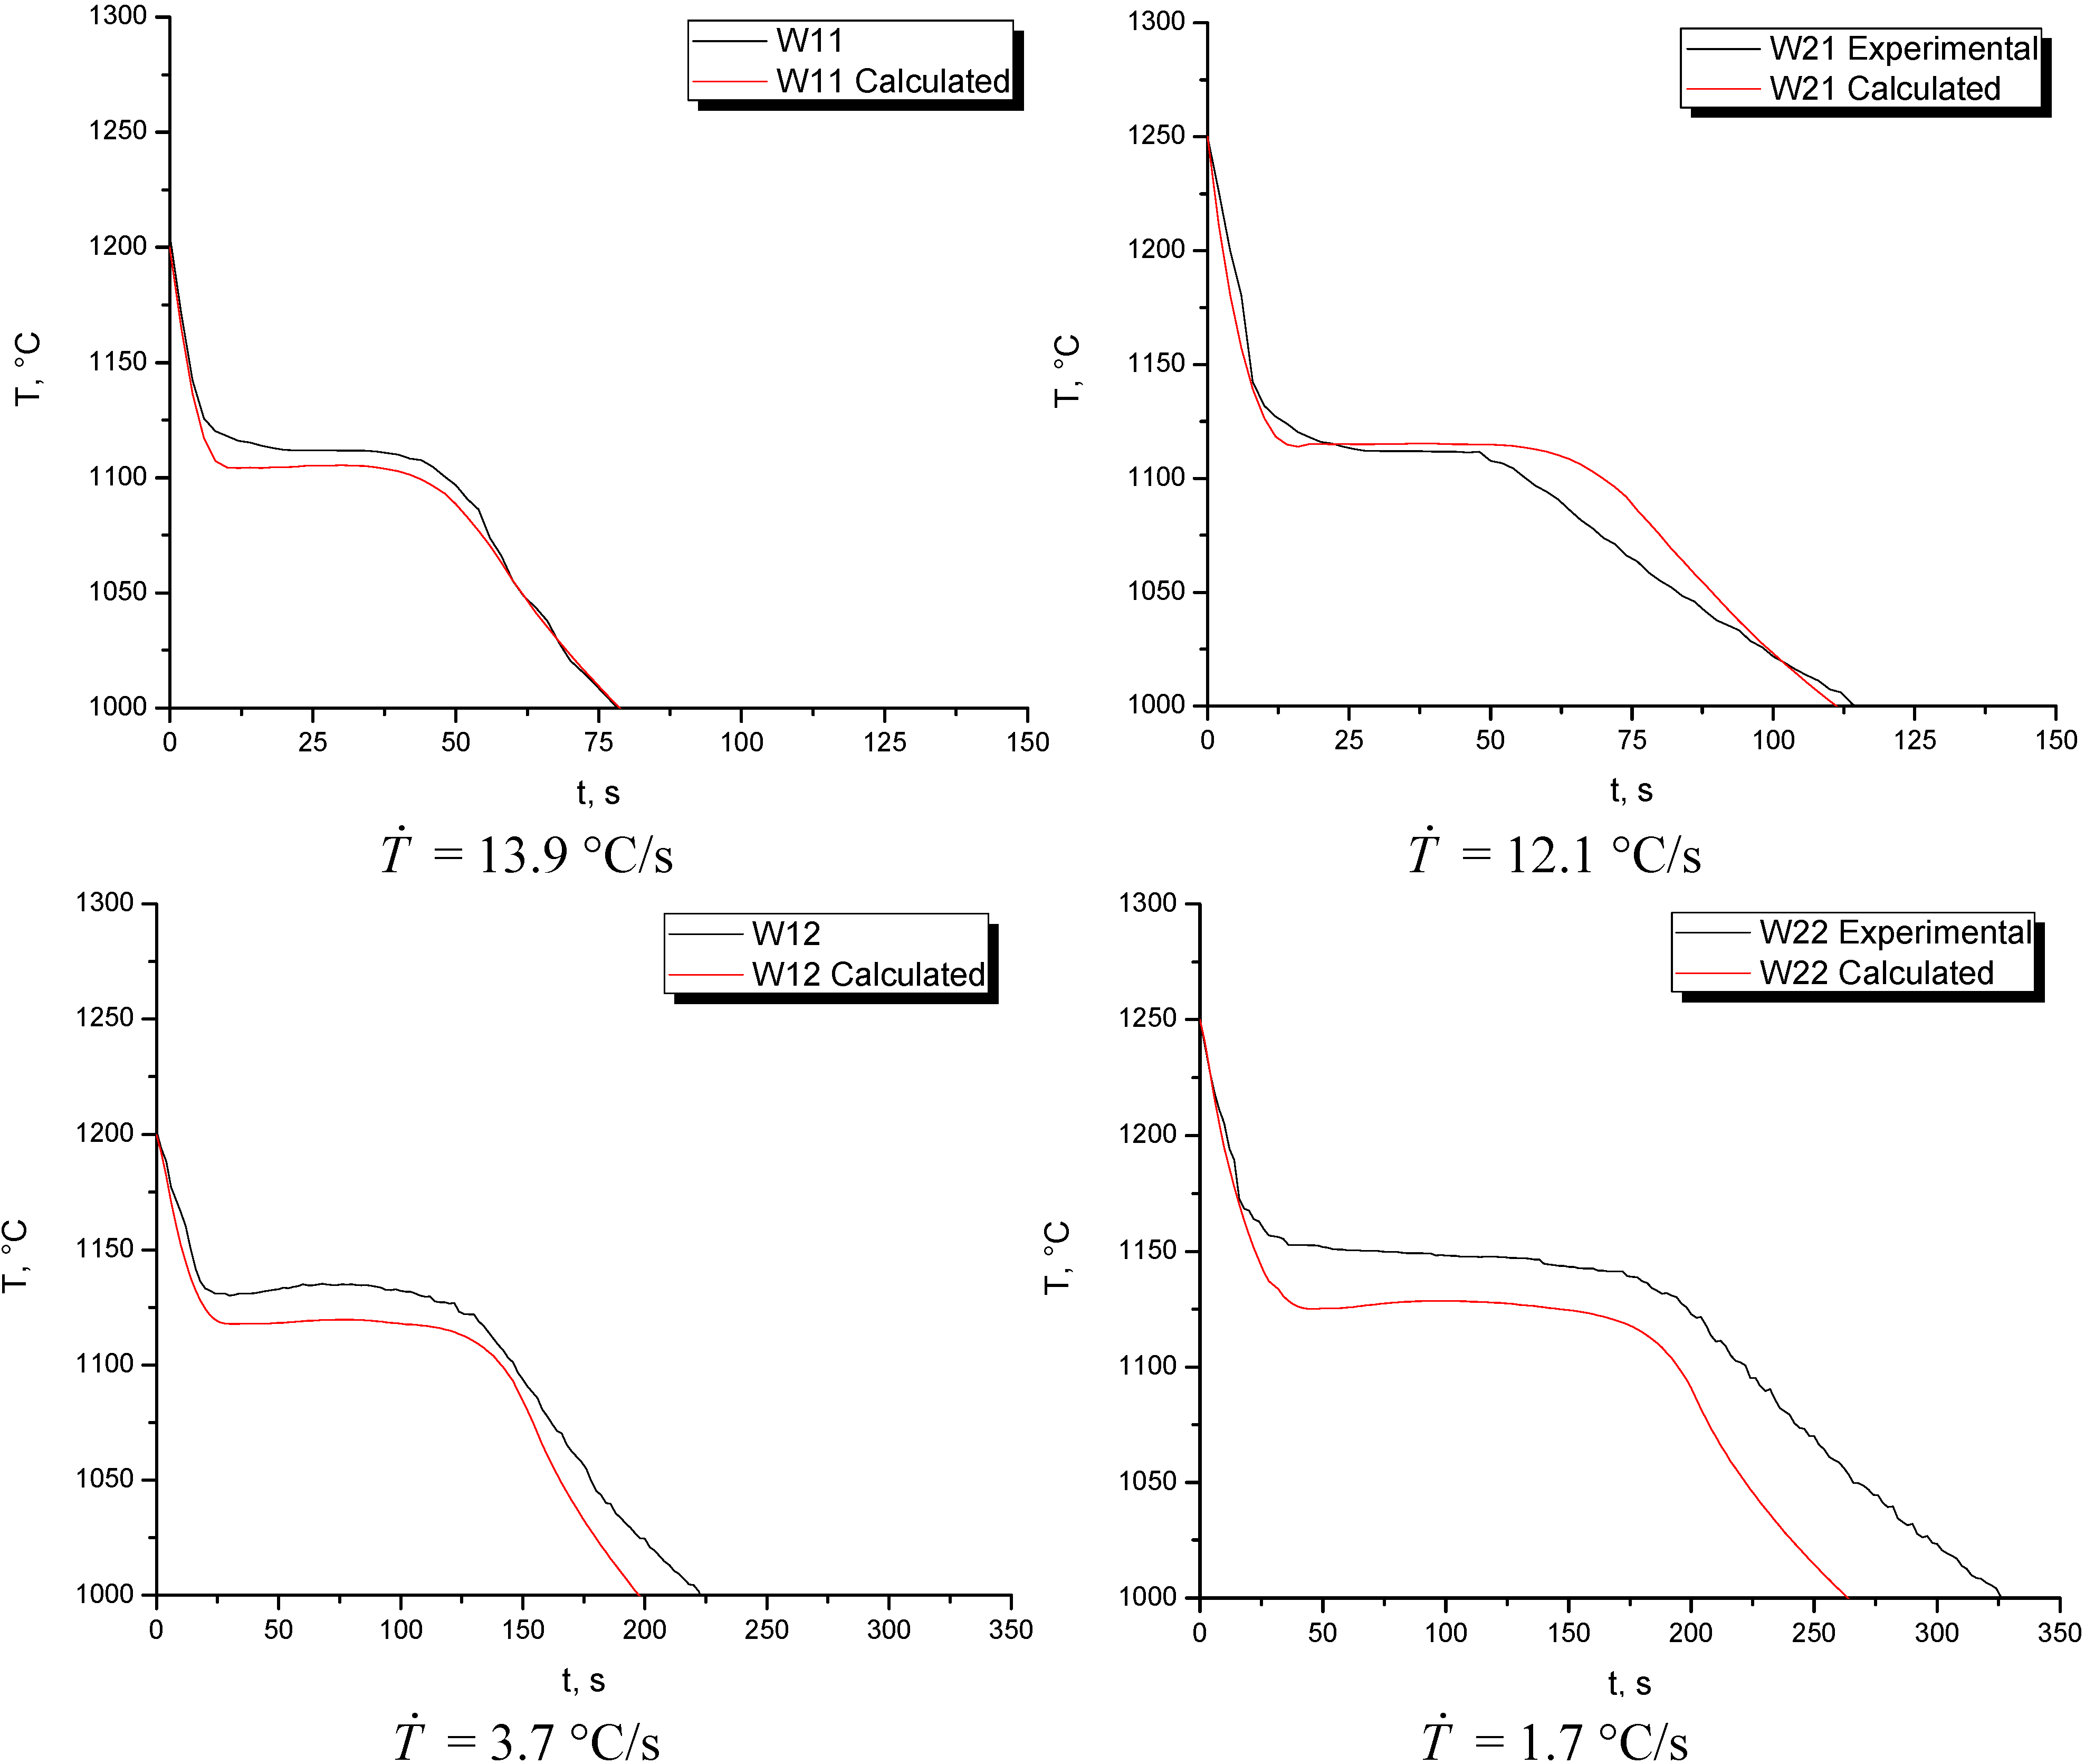
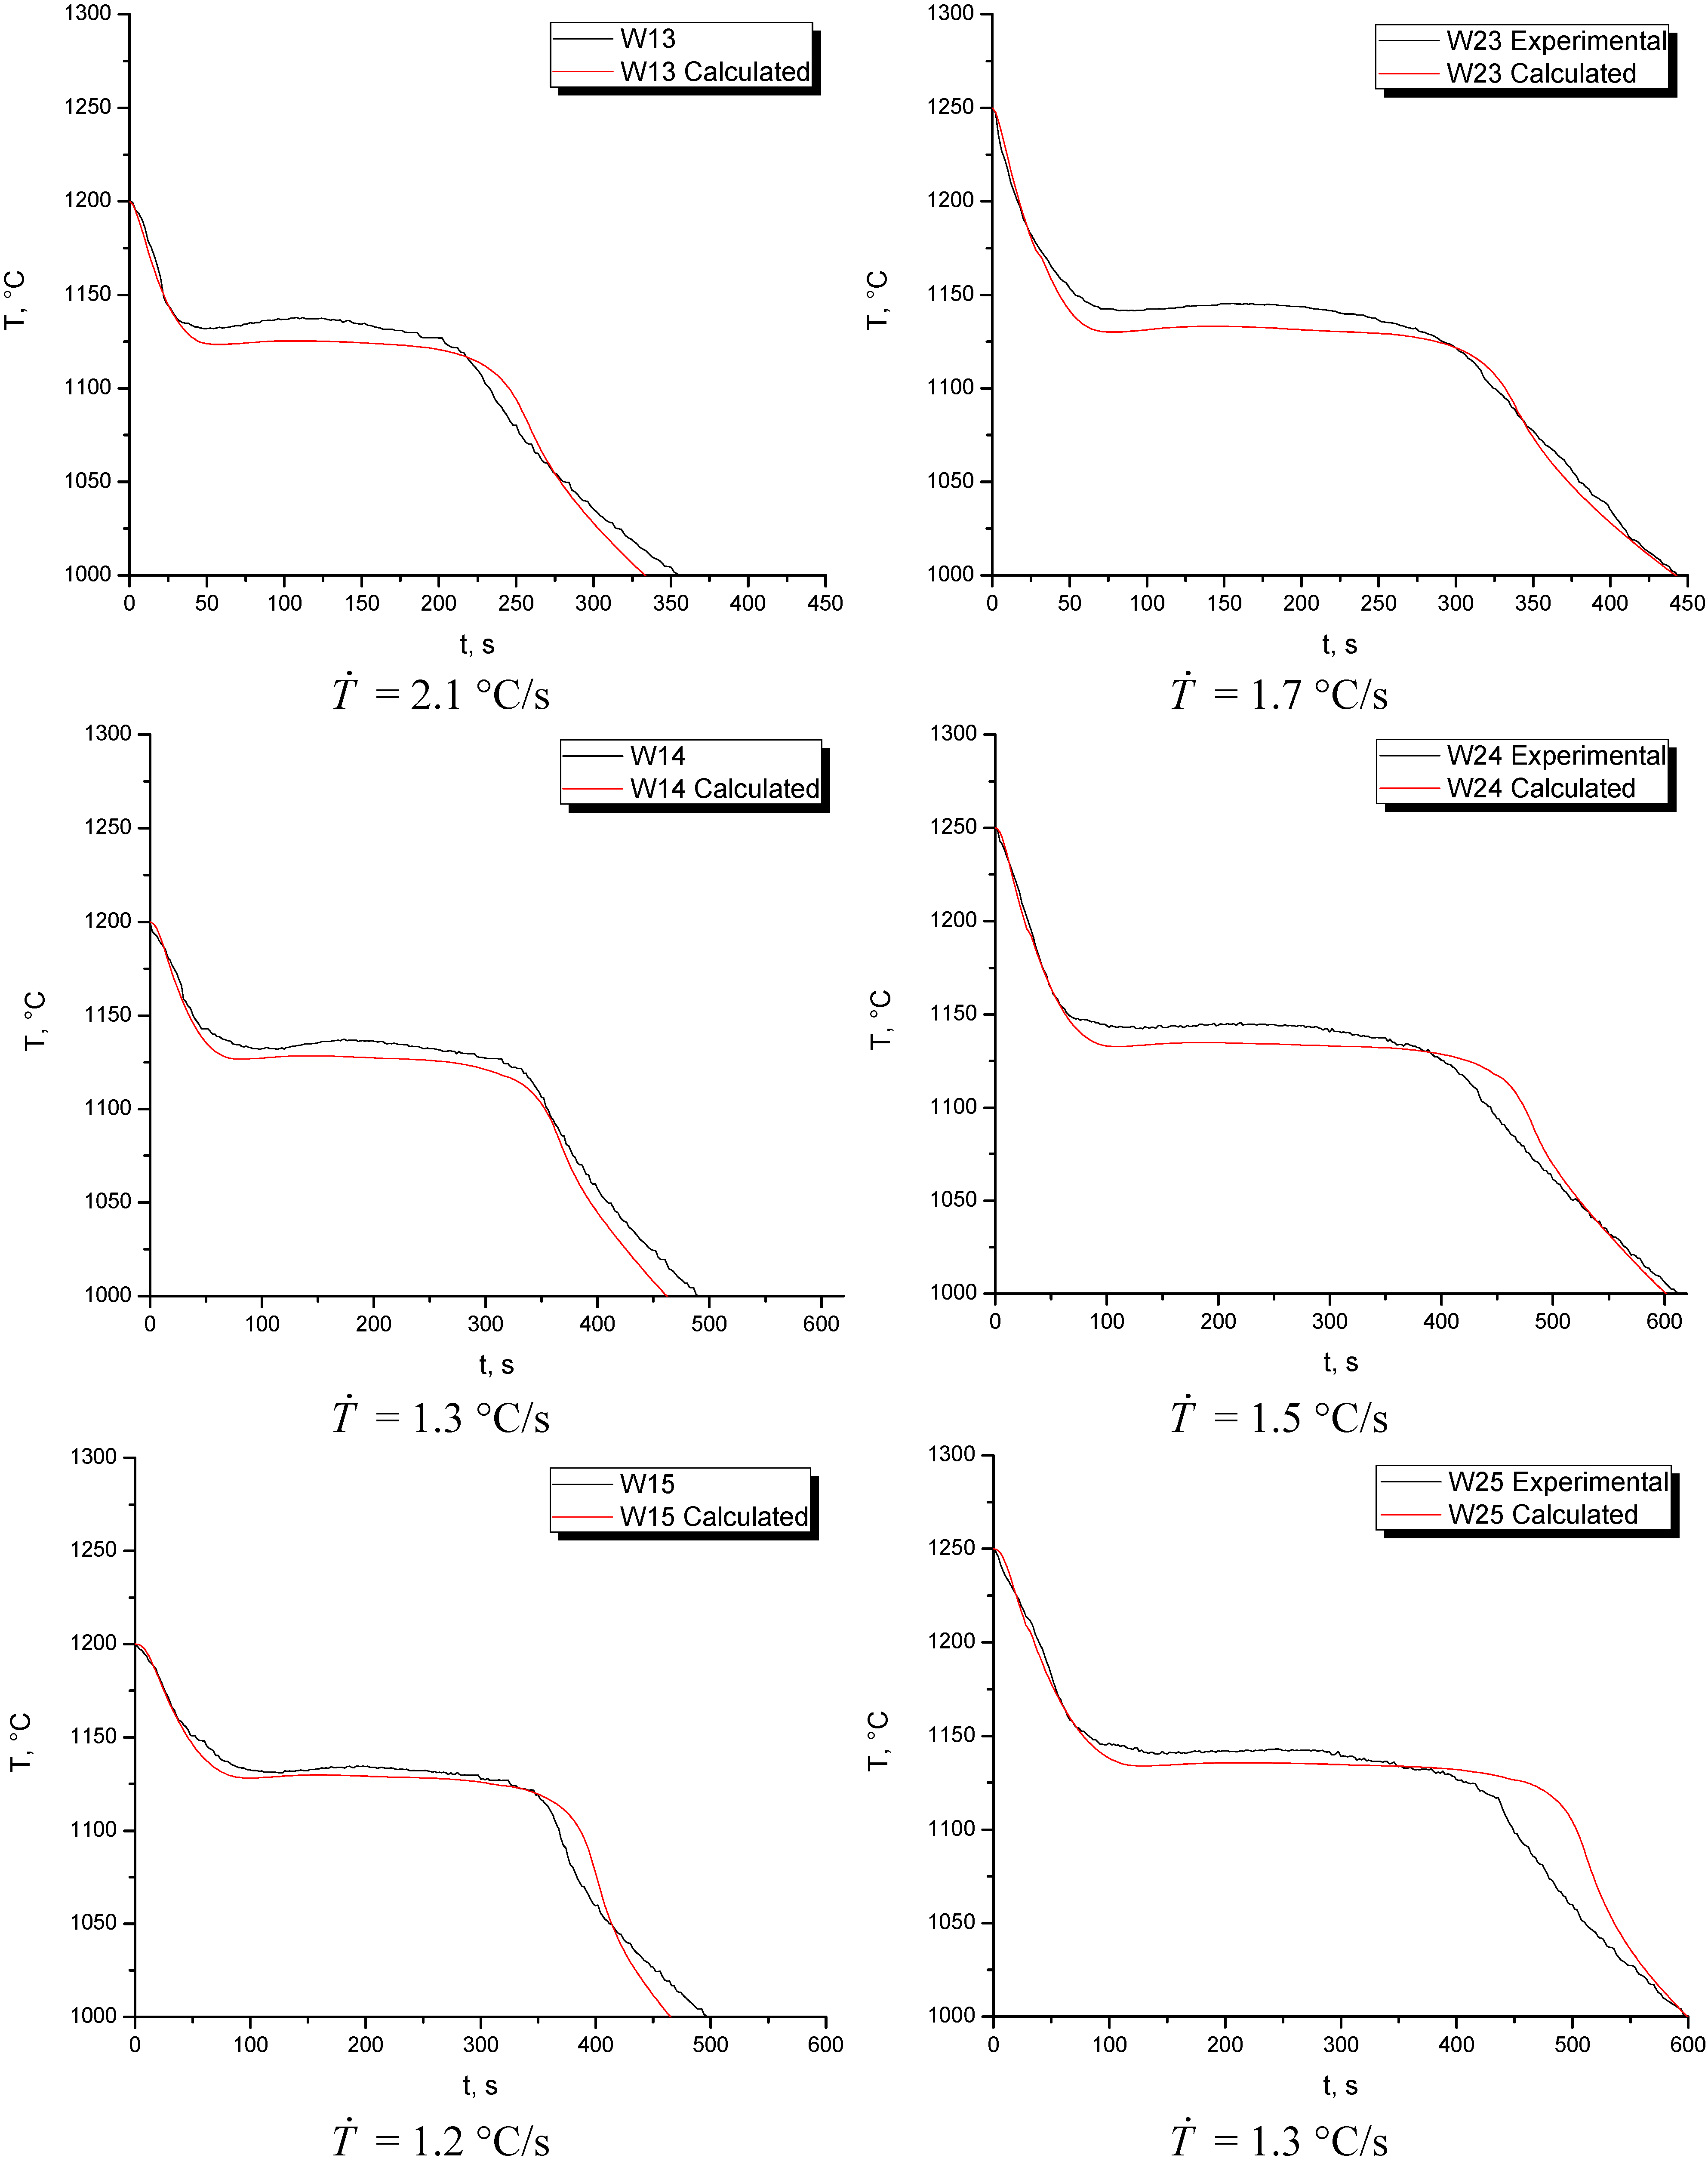
Once the nucleation parameters were determined, Figure 6 plots the experimental and numerical cooling curves for the five points in experiences W1 and W2 together with the experimental cooling rate at the initial stage of cooling. It can be seen that in all the locations, because of the lower pouring temperature, the initial cooling rates are higher in W1 than in W2, which produces the mentioned difference in the graphite nodules size. In both cases, it is observed that in the thinner points of the wedge, the numerical-experimental fit is not as desired. However, the fit improves towards the thicker parts. It is also observed that, as the pouring temperature increases, the solidification time increases as well. In all the locations for experience W1, the computed cooling curves predict a solidification time very similar to the experimental one. It is also notable that in all the locations for experience W1, the calculated cooling curves are located below the experimental ones. The temperature for the eutectic reaction is not well-simulated from point W11 to W13 as in points W14 and W15 where the fit improves slightly. Besides this, although in all the locations the experimental and numerical plateaus differ slightly in temperature, the time extension of such plateaus is very similar, especially in the thick part of the wedge, i.e., points W14 and W15. At the end of the solidification process, the slopes of the experimental and numerical cooling curves are very similar which means that, in general, the numerical-experimental fit is very acceptable. At this point, it can be established that the computed results improve in the thicker parts of the wedge. For experience W2, it can be seen that in all points the calculated cooling curves fall below the experimental ones, with the exception of point W21, where the opposite is seen. In this experience, the best and worse fits were found in points W23 and W22, respectively. For point W23, the numerical and experimental cooling curves are practically superimposed. Regarding characteristic times, the numerical-experimental fit for the eutectic reaction is very acceptable, especially in the thicker parts of the wedge. Besides this, the extensions of the thermal plateaus and the slopes of the calculated and experimental cooling curves at the initial and final stages of the cooling process are very similar, which further improve at the points where the cooling rate is lower. In both experiences, the numerical simulation also predicts longer solidification times for the points located in the thicker part of the sample compared to those located in the thinner part of it.
Figure 6. Numerical and experimental cooling curves in experiences W1 and W2.
Metals 05 00628 g006aMetals 05 00628 g006b
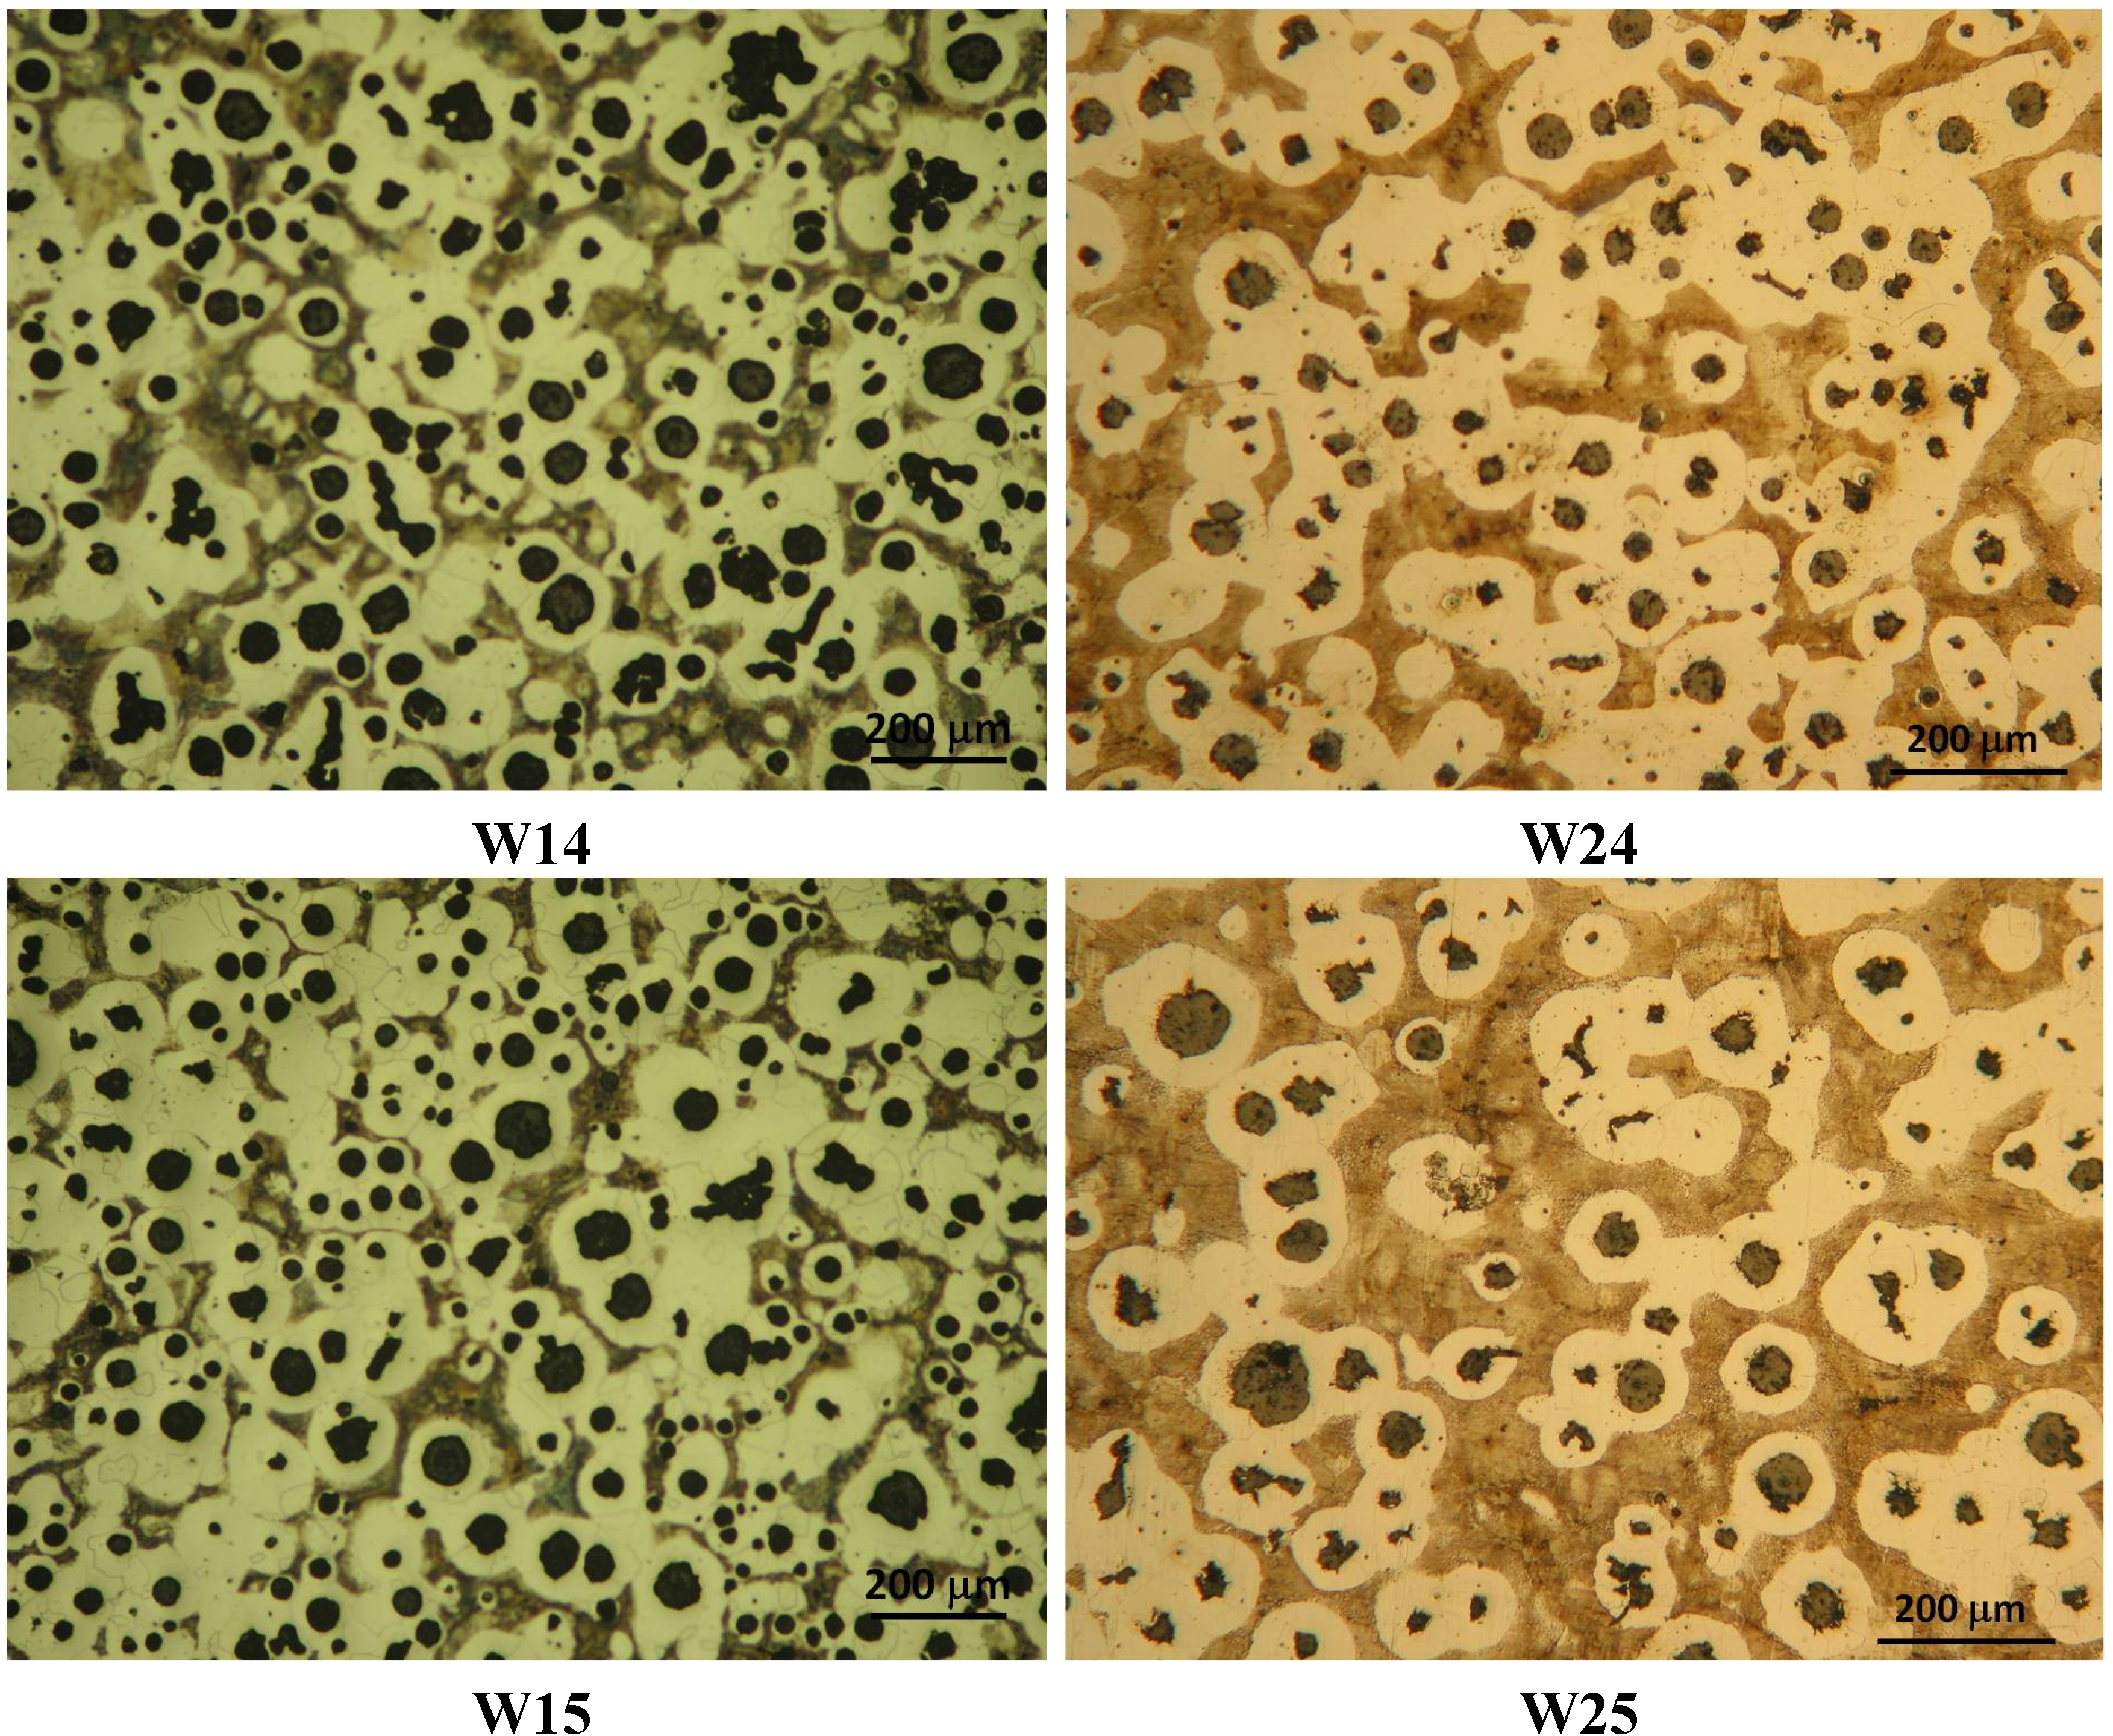
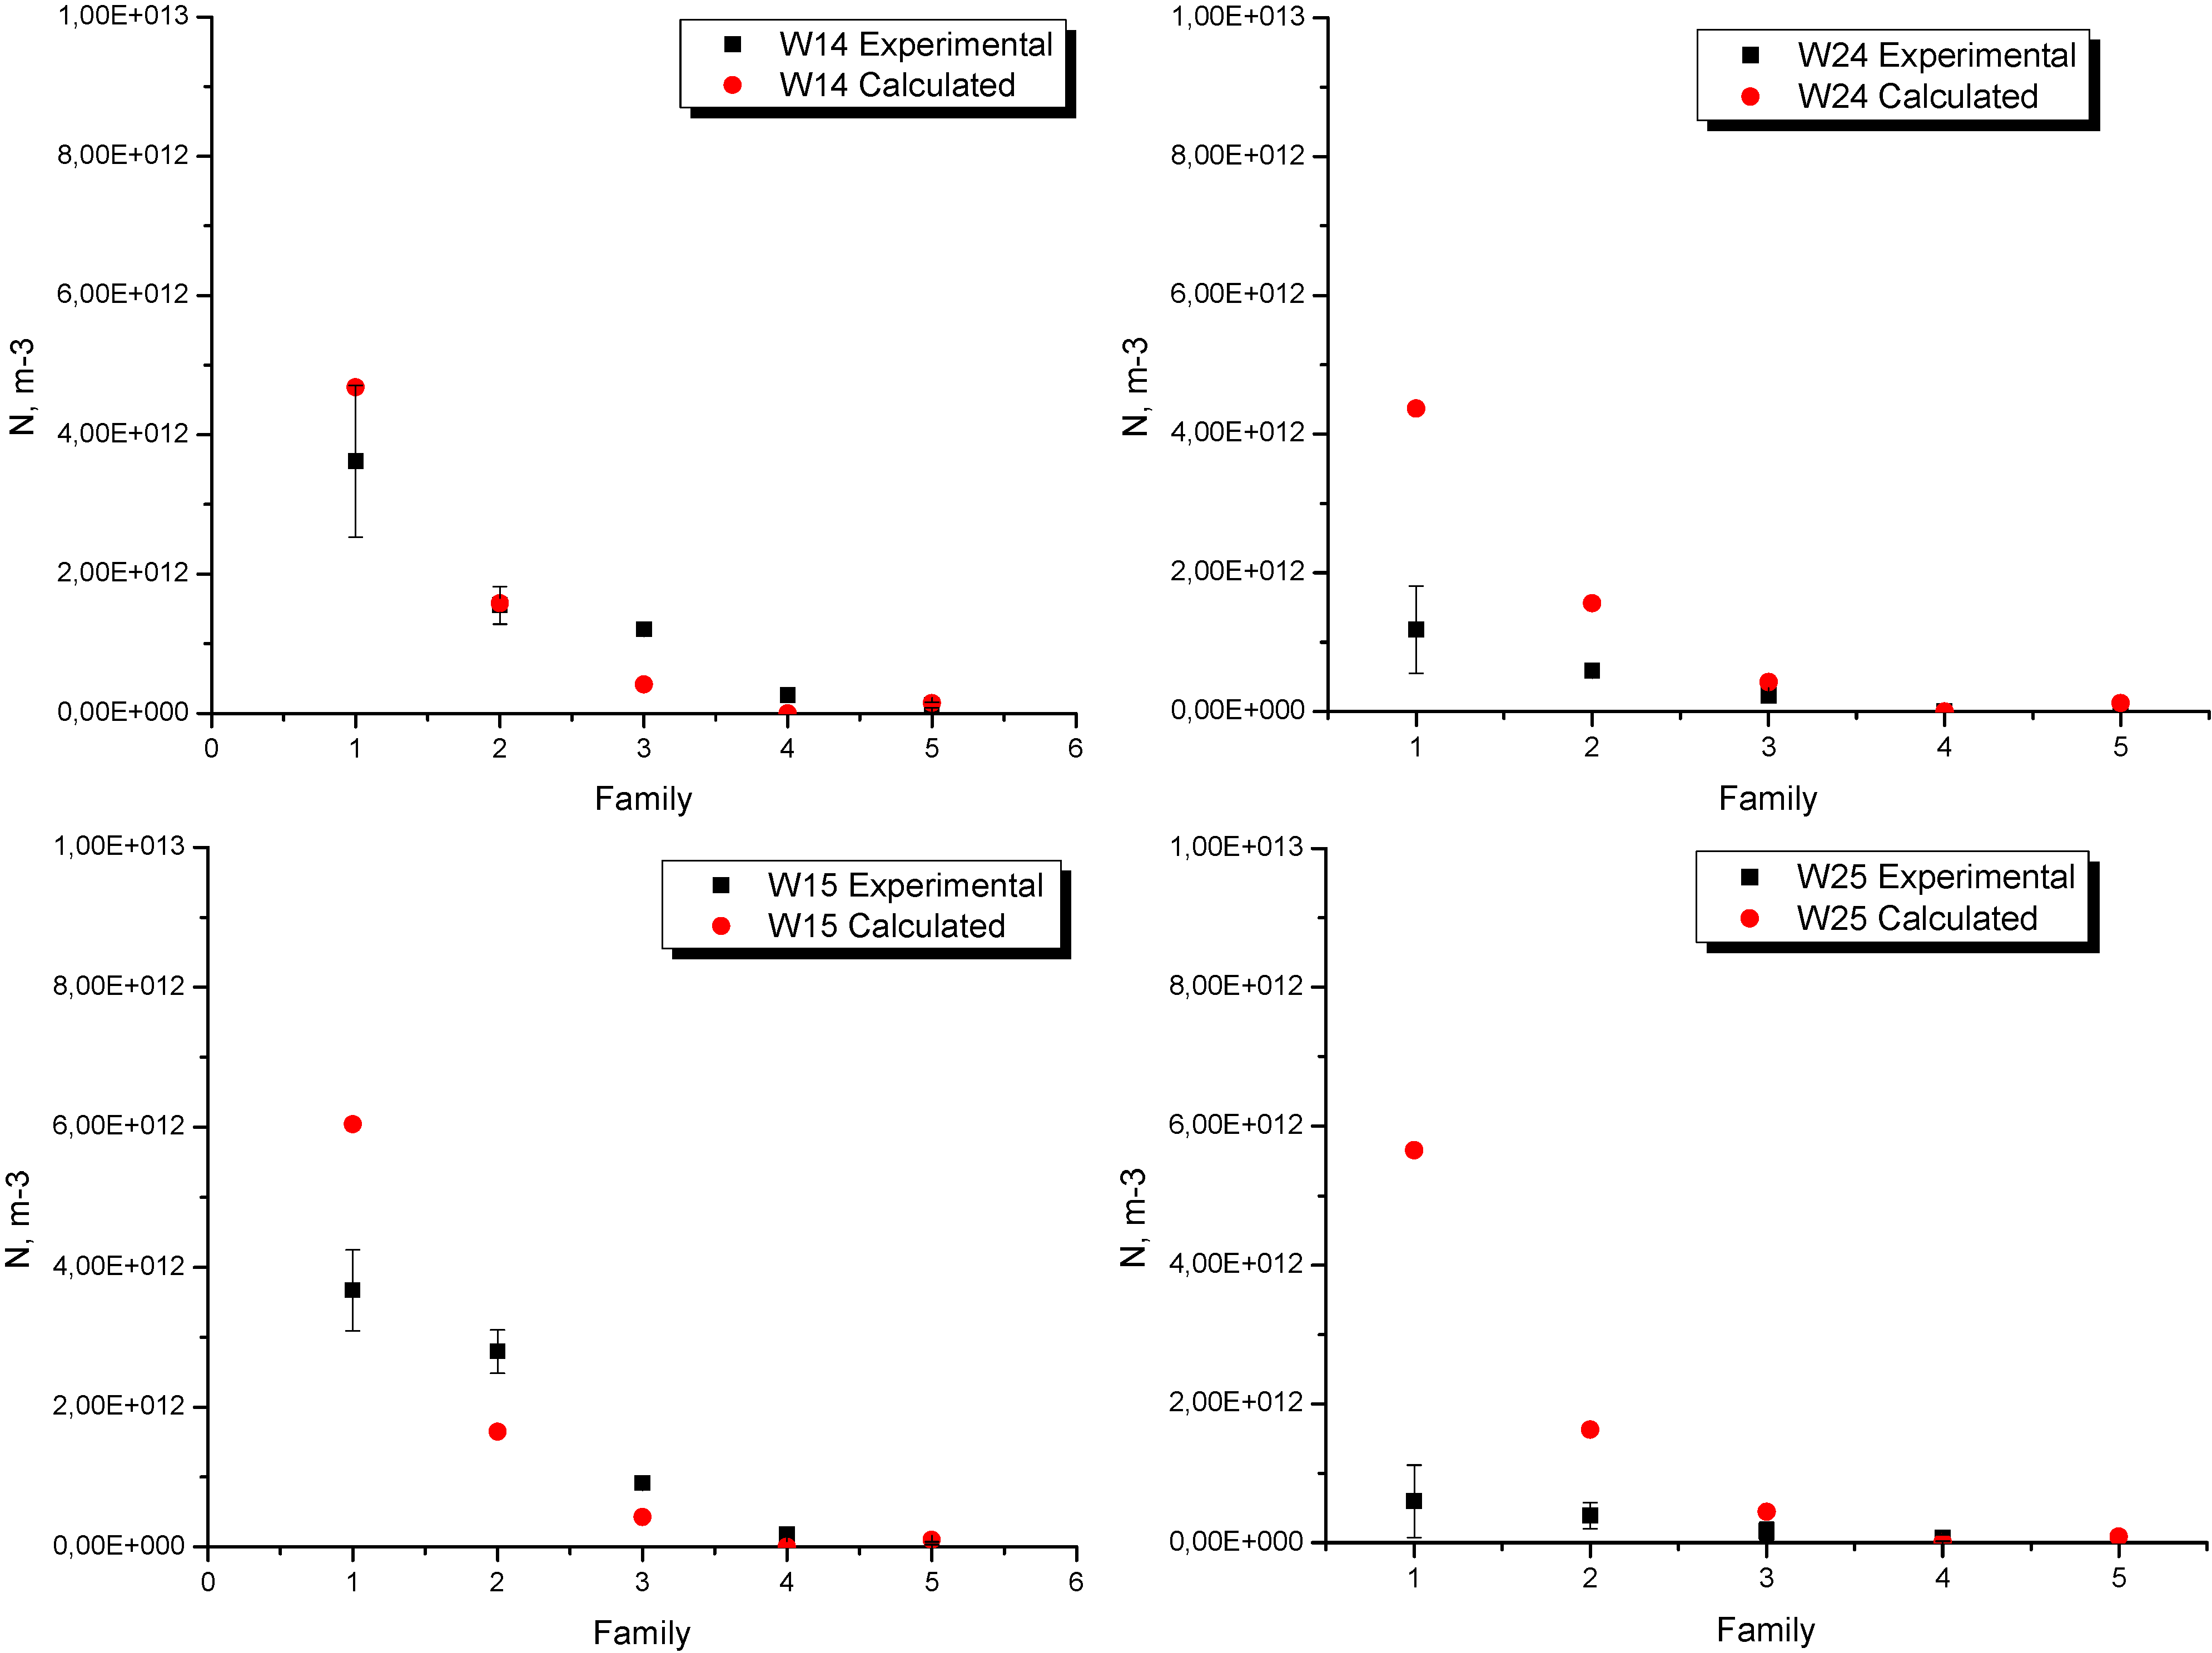
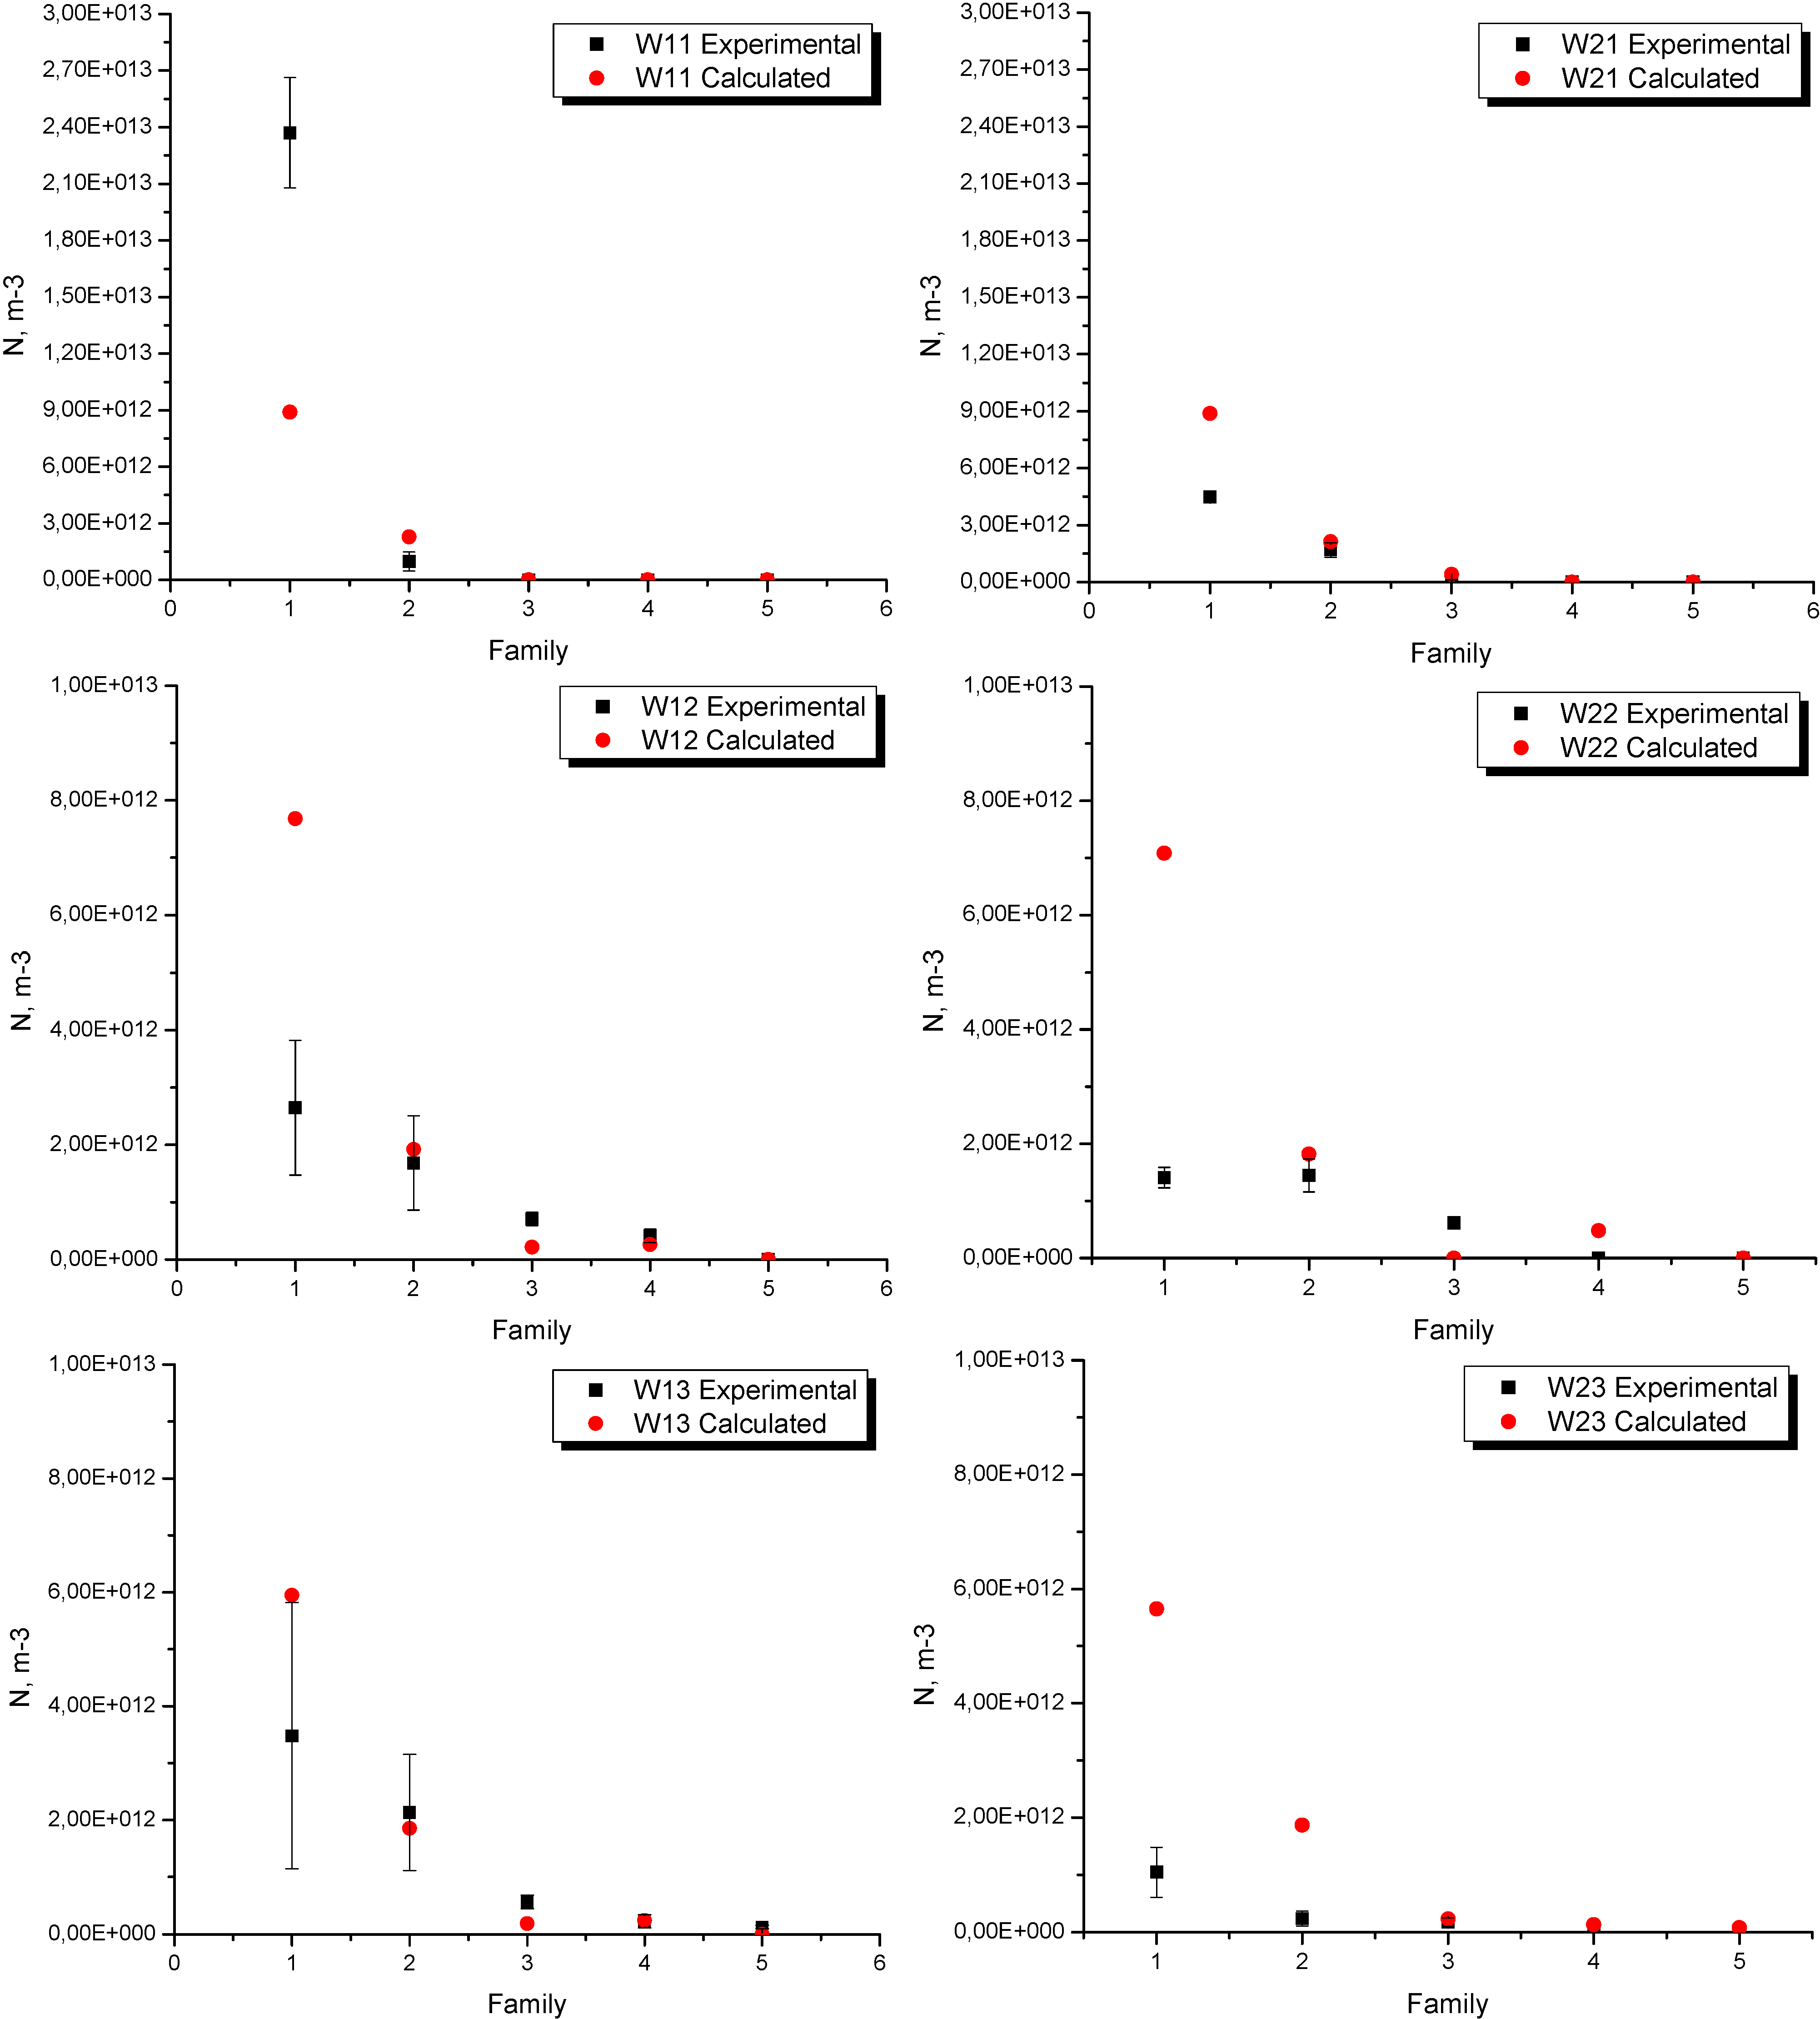
The experimental and calculated nodule counts for each location in experiences W1 and W2 are shown in Figure 7. Three measurements close to the thermocouples location were made (center of each sample). As can be seen, in both experiences the higher numerical-experimental discrepancies were found in the smaller family, i.e., in the small size nodules. This difference is more significant in W2, not only for family 1 but for the five families considered in the analysis. Despite these differences, in both cases the trend is the same, i.e., the nodule density decreases towards the larger families. As mentioned above, it is also notable in this figure that an increase in the pouring temperature produces a decrease in the nodule density in all the families considered in the analysis. This fact is well-reproduced by the numerical model.
Figure 7. Experimental and numerical nodule count in experiences W1 and W2.
Metals 05 00628 g007aMetals 05 00628 g007b
Table 6 and Table 7 summarize the experimental and numerical total nodule count and solidification times for experiences W1 and W2. The effect of the pouring temperature on both the microstructure and the solidification times at each location along the part are apparent where, in addition, it is notable that both effects are well-predicted by the numerical model. In particular, it is seen in experience W1 that, considering the extreme values, the nodule count increases with the cooling rate, from the thicker to the thinner part of the wedge. The nodule count and the cooling rate of the points W12 to W14 are similar. Thus, it is possible to affirm that a high cooling rate will produce a high quantity of graphite nodules, which is also well-predicted by the numerical simulation which, in turn, also overestimates the nodule count in W15. In general, the computed solidification time is close to the experimental values, which agree with the graphical presentation in Figure 6. For experience W2, like in W1, as the cooling rate increases, the nodule count increases as well. However, the effect of this parameter is less marked than in W1, where the difference between the tip and the back of the wedge is more significant. Furthermore, in all points for experience W2, the calculated nodule density is higher than the experimental one, even though the calculated solidification times are very similar to the experimental ones.
Table 6. Experimental and numerical total nodule count and solidification times in experience W1.
PointNV (nuclei/m3) ExperimentalNV (nuclei/m3) Calculatedt(TES)(s) Experimentalt(TES)(s) Calculated
W112.47 × 1013 ± 3.43 × 10121.12 × 101356.257.6
W125.45 × 1012 ± 2.23 × 10121.01 × 1013178.3156.3
W136.53 × 1012 ± 3.62 × 10128.23 × 1012252.3258.6
W146.75 × 1012 ± 1.50 × 10126.82 × 1012354.2366.7
W157.62 × 1012 ± 1.01 × 10128.22 × 1012375.9402.1
Table 7. Experimental and numerical total nodule count and solidification times in experience W2.
PointNV (nuclei/m3) ExperimentalNV (nuclei/m3) Calculatedt(TES)(s) Experimentalt(TES)(s) Calculated
W216.28 × 1012 ± 3.94 × 10111.14 × 101365.868.9
W223.47 × 1012 ± 1.56 × 10119.38 × 1012224.6202.8
W231.46 × 1012 ± 6.03 × 10117.96 × 1012316.3341.4
W242.00 × 1012 ± 7.13 × 10116.48 × 1012433.0480.7
W251.23 × 1012 ±7.26 × 10117.82 × 1012438.3513.8
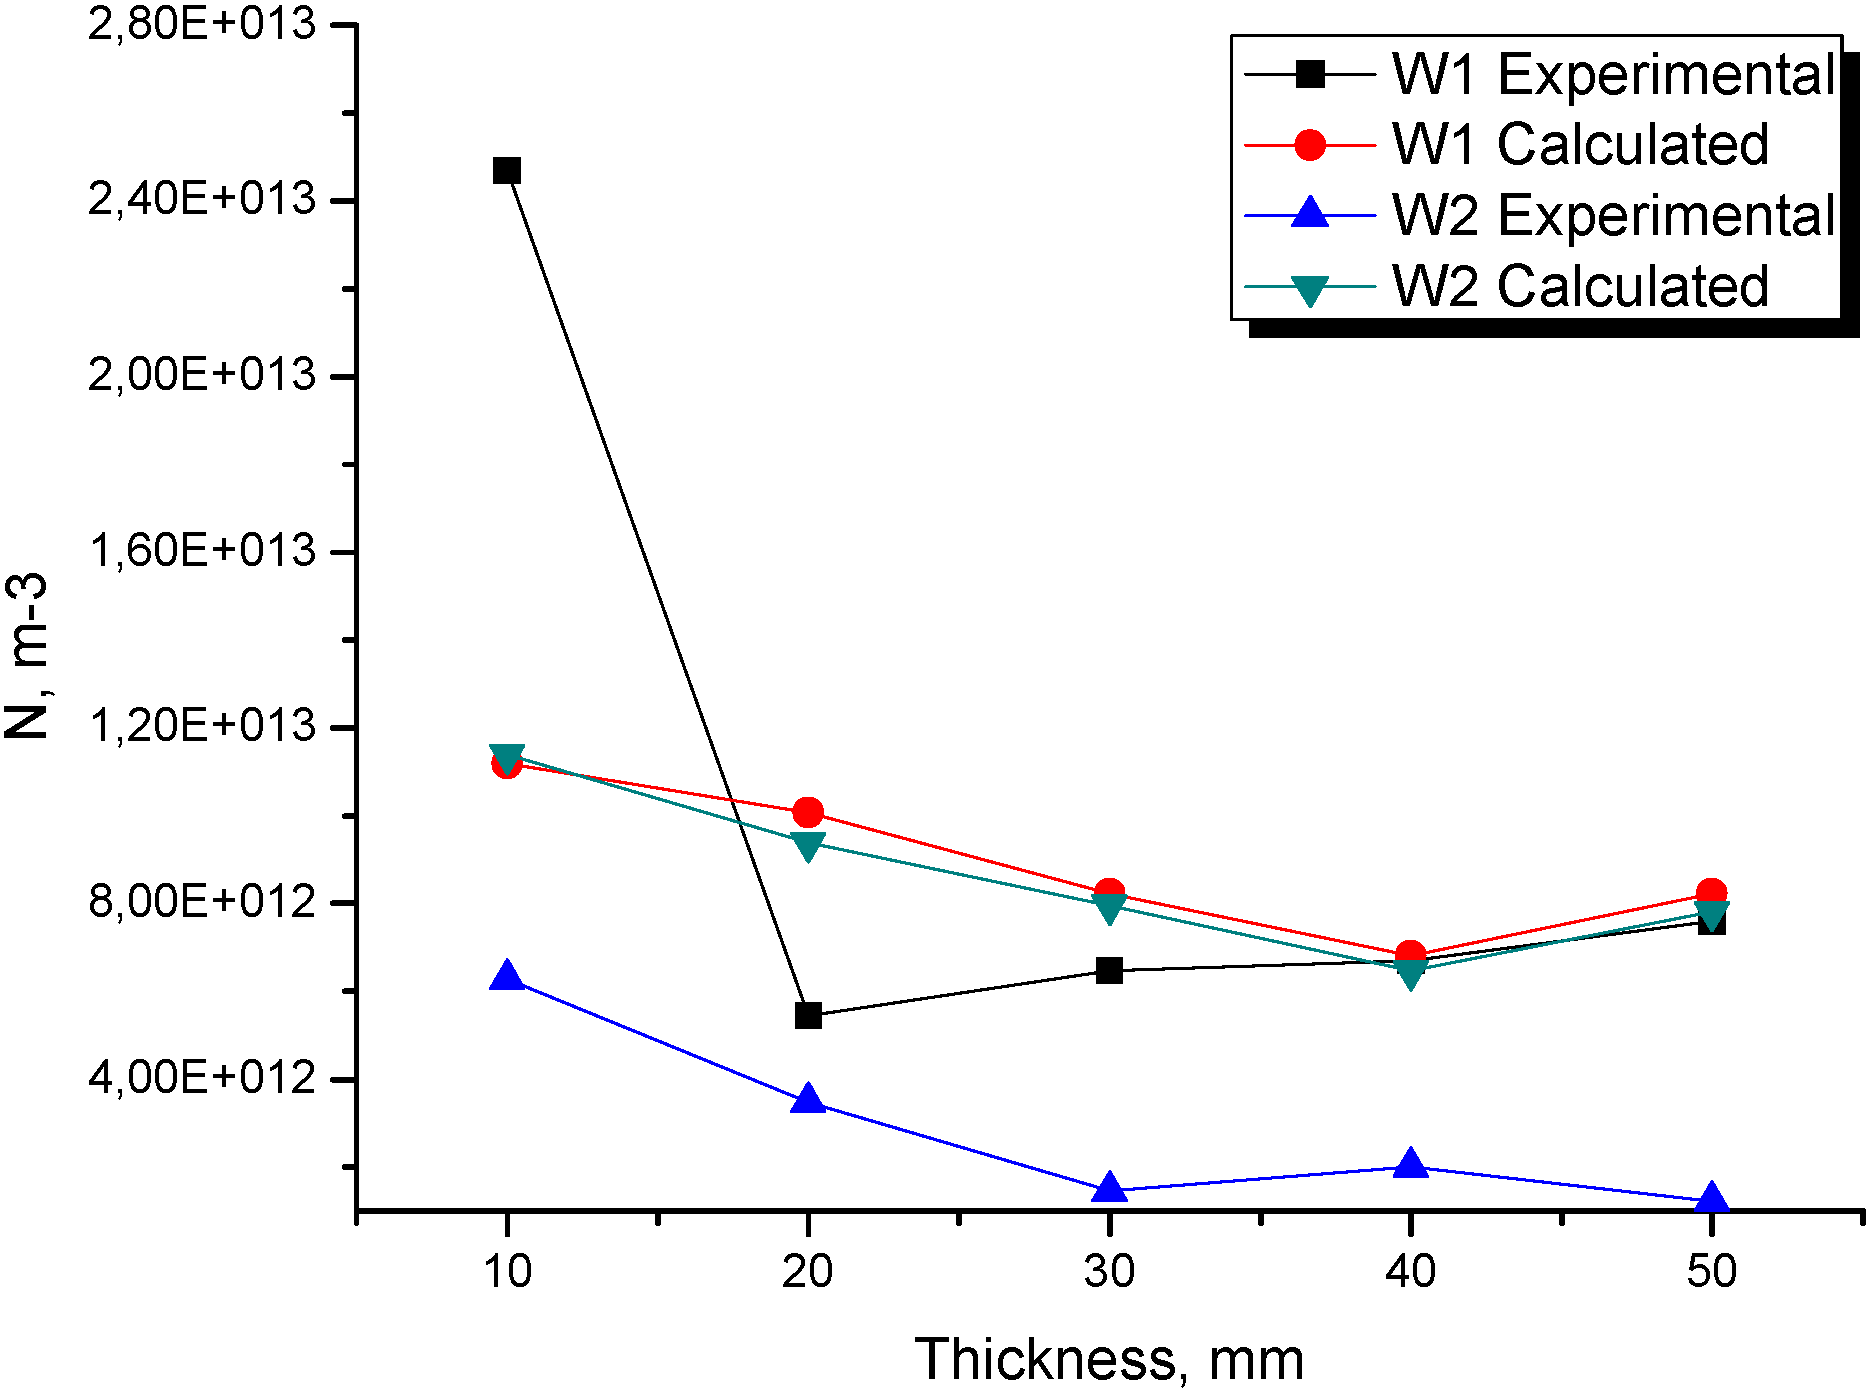
Figure 8 shows the numerical and experimental relationship between the total nodule count and the wall thickness for experiences W1 and W2. It is observed that, as the wall thickness increases, the nodule density decreases, which is also well-predicted by the simulation, especially in experience W1. It is both numerically and experimentally seen that the nodule density does not greatly vary along the wedge, which is directly related to the similar cooling conditions of the points located from 20 mm upwards (from W12 and W22). With these results, it is possible to infer that the thermal contribution of the thicker parts plays an important role on these solidification experiences' morphologies.
Figure 8. Relationship between numerical and experimental total nodule count and wall thickness for experiences W1 and W2.
Metals 05 00628 g008

5. Conclusions

From the realization of this study the following conclusions can be drawn:
-
For each solidification experience, an overall reasonably good numerical-experimental fit was achieved.
-
In the thinner parts of experience W1 (points W11 and W12), the model predicts a lower temperature for the eutectic reaction to start and a longer solidification time than the experimental ones.
-
For experience W2, the fact mentioned above is clearly notable at point W22, where an undesirable numerical-experimental fit is obtained.
-
An increase in the pouring temperature produces larger graphite nodules, which produces a lower nodule density towards the larger families.
-
The effect mentioned above, which is mainly caused by the longer time that graphite particles are submitted to this high temperature, is well-predicted by the numerical model.
-
Another effect of the high pouring temperature is decreased recalescence and increased solidification time. These facts are well-predicted by the numerical model in all the wedge locations.
-
Related to the previous point, as the pouring temperature increases, the cooling curves move to higher temperatures, i.e., the temperature for the eutectic reaction and the maximum temperature reached after recalescence increase.
-
From the experimental validation carried out, a good fit is obtained between the experimental and the calculated cooling curves, especially in the thicker sections of the wedges.
-
The mentioned above applies for the two solidification experiences where the larger discrepancies were observed at the thinner parts of the wedge. This could be related to the low capability of the model to reproduce extremely high cooling rates.
-
It was numerically and experimentally verified that, as the pouring temperature increases, the cooling rate decreases.
-
Regarding the nodule count, it can be seen that in both cases, the numerical-experimental fit greatly improves towards the larger families.
-
From wedge thicknesses larger than 20 mm, the nodule count is very similar along the wedges. These results are related to the similar cooling rates that occur in these locations.
-
Finally, the analysis carried out in this work establishes that is possible to understand and achieve greater control over the pouring temperature of the final microstructure of a nodular cast iron.

Acknowledgments

The authors thank CONICYT (Chilean Council of Research and Technology) for the support provided by Project Fondecyt 1130404.

Author Contributions

Alex Escobar: experimental work, analysis and discussion of results, writing and revision of the manuscript.
Diego Celentano: computational implementation of the model, discussion of results, revision of the manuscript.
Marcela Cruchaga: discussion of results, revision of the manuscript.
Bernd Schulz: discussion of results.

Conflicts of Interest

The authors declare no conflict of interest.

References

  1. Sorelmetal. Ductile Iron Data for Design Engineers; Rio Tinto Iron & Titanium Inc.: Quebec, QC, Canada, 1990. [Google Scholar]
  2. Ashraf Sheikh, M. Production of carbide-free thin ductile iron castings. J. Univ. Sci. Technol. Beijing 2008, 15, 552–555. [Google Scholar] [CrossRef]
  3. Stefanescu, D.M. Science and Engineering of Casting Solidification, 1st ed.; Kluwer Academic/Plenum Publishers: New York, NY, USA, 2002. [Google Scholar]
  4. Pedersen, K.M.; Tiedje, N.S. Graphite nodule count and size distribution in thin-walled ductile cast iron. Mater. Charact. 2008, 59, 1111–1121. [Google Scholar] [CrossRef]
  5. Su, K.C.; Ohnaka, I.; Yamauchi, I.; Fukusako, T. Computer simulation of solidification of nodular cast iron. MRS Proc. 1985, 34, 181–189. [Google Scholar] [CrossRef]
  6. Lesoult, G.; Castro, M.; Lacaze, J. Solidification of spheroidal cast iron-I. Physical modelling. Acta Mater. 1998, 46, 983–995. [Google Scholar] [CrossRef]
  7. Lacaze, J.; Castro, M.; Lesoult, G. Solidification of spheroidal cast iron-II. Numerical simulation. Acta Mater. 1998, 46, 997–1010. [Google Scholar] [CrossRef]
  8. Rappaz, M.; Richoz, J.D.; Thévoz, P. Modelling of solidification of nodular cast iron. In Proceedings of the Euromat 89, Aachen, Germany, 22–24 November 1989; pp. 1–6.
  9. Castro, M.; Alexandre, P.; Lacaze, J.; Lesoult, G. Microstructures and solidification kinetics of cast irons: Experimental study and theoretical modeling of equiaxed solidification of S.G and grey cast iron. In Proceedings of the Cast Iron IV Conference, Tokyo, Japan, 4–6 September 1989; p. 433.
  10. Fras, E.; Kapturkiewicz, W.; Burbielko, A. Micro-macro modeling of casting solidification controlled by transient diffusion and undercooling. In Modelling of Casting, Welding and Advanced Solidification Processes VII; Cross, M., Campbell, J., Eds.; The Minerals, Metals and Material Society: Warrendale, PA, USA, 1995; pp. 679–686. [Google Scholar]
  11. Liu, J.; Elliot, R. Numerical modelling of the solidification of ductile iron. J. Crystal Growth 1998, 191, 261–267. [Google Scholar] [CrossRef]
  12. Fras, E. Computer-aided simulation of the kinetics of solidification of the eutectic ductile cast iron. MRS Proc. 1984, 34, 191–199. [Google Scholar] [CrossRef]
  13. Fredriksson, H.; Svensson, I. Computer simulation of the structure formed during solidification of cast iron. MRS Proc. 1985, 34, 273–284. [Google Scholar] [CrossRef]
  14. Stefanescu, D.M.; Kanetcar, C.S. Computer modeling of the Solidification of Eutectic Alloys: The case of Cast Iron. Comput. Simul. Microstruct. Evolut. 1985, 171–188. [Google Scholar]
  15. Rivera, G.; Boeri, R.; Sikora, J. Influence of the solidification microstructure on the mechanical properties of ductile iron. Int. J. Cast Met. Res. 1999, 11, 533–538. [Google Scholar]
  16. Boeri, R. The Solidification of Ductile Cast Iron. Ph.D. Thesis, the University of British Columbia, Vancouver, BC, Canada, 1989. [Google Scholar]
  17. Celentano, D.J.; Dardati, P.M.; Godoy, L.A.; Boeri, R. Computational simulation of microstructure evolution during solidification of ductile cast iron. Int. J. Cast Met. Res. 2008, 21, 416–426. [Google Scholar] [CrossRef]
  18. Dardati, P.M.; Celentano, D.J.; Godoy, L.A.; Chiarella, A.A.; Schulz, B.J. Analysis of ductile cast iron solidification: Numerical simulation and experimental validation. Int. J. Cast Metals Res. 2009, 22, 390–400. [Google Scholar] [CrossRef]
  19. Dardati, P.M.; Godoy, L.A.; Celentano, D.J. Microstructural simulation of solidification process of spheroidal-graphite cast iron. ASME J. Appl. Mech. 2006, 73, 977–983. [Google Scholar] [CrossRef]
  20. Escobar, A.; Celentano, D.; Cruchaga, M.; Lacaze, J.; Schulz, B.; Dardati, P.; Parada, A. Experimental and numerical analysis of effect of cooling rate on thermal–microstructural response of spheroidal graphite cast iron solidification. Int. J. Cast Met. Res. 2014, 27, 176–186. [Google Scholar] [CrossRef]
  21. Abdul Halil, F.B. Investigation of Ductile Iron Sandwich Treatment Process Parameter. Bachelor of Mechanical Engineering Thesis, University of Malaysia Pahang, Kuantan, Malaysia, 2009. [Google Scholar]
  22. Elliott, R. Cast Iron Technology; Jaico Publishing House: London, UK, 2005. [Google Scholar]
  23. Celentano, D.J. Un Modelo Termomecánico para Problemas de Solidificación de Metales. Ph.D. Thesis, Polytechnical University of Catalunya, Barcelona, Spain, 1994. [Google Scholar]
  24. Celentano, D.J.; Oller, S.; Oñate, E. A coupled thermomechanical model for the solidification of cast metals. Int. J. Solids Struct. 1996, 33, 647–673. [Google Scholar] [CrossRef]
  25. Chipman, J.; Alfred, R.M.; Gottet, L.W.; Small, R.B.; Wilson, D.M.; Thomson, C.N.; Guernsey, D.L.; Fultons, J.C. The solubility in molten iron and in iron-silicon and iron-manganese alloys. Trans. ASM 1952, 44, 1215–1232. [Google Scholar]
  26. Gustafson, P. A thermodynamic evaluation of the Fe-C system. Scand. J. Metall. 1985, 14, 259–267. [Google Scholar]
  27. Henschel, C.; Heine, R.W. Some effects of oxygen on the solidification of cast irons. AFS Cast Metals Res. J. 1971, 7, 93–104. [Google Scholar]
  28. Andersson, J.O.; Helander, T.; Höglund, L.; Shi, P.F.; Sundman, B. Thermocalc and DICTRA, Computational tools for materials science. Calphad 2002, 26, 273–312. [Google Scholar] [CrossRef]
  29. Torres Camacho, G.; Lacaze, J.; Bak, C. Redistribution of alloying elements during graphitisation of mottled spheroidal graphite cast iron. Int. J. Cast Met. Res. 2003, 16, 173–178. [Google Scholar]

