1. Introduction
Metallic glasses,
i.e., amorphous alloys, have attracted considerable interest since their first discovery in 1960s by Duwez
et al. [
1] in the Au-Si system using liquid melt quenching technique. The inviting properties of metallic glasses, such as high yield strength, hardness and elastic strain limit as well as relatively high fracture toughness, fatigue resistance and corrosion resistance, have made them promising for applications in many fields [
2,
3,
4,
5]. In the early stages, the high cooling rate during the preparation of metallic glasses has limited the specimen geometry to thin ribbons, foils, and powders and restricted their practical applications. Later in the 1980s, since the first finding of the bulk glassy millimeter-diameter rods in the Pd-Cu-Si system using simple suction casting methods [
6], bulk metallic glasses (BMGs), with excellent glass forming ability (GFA), have been developed in many multicomponent systems and remarkably broadened the applications of this class of metallic materials [
7,
8].
In the field of BMGs, one of the most important issues is to clarify the formation mechanism, because a clear understanding of metallic glass formation would serve as guidance for choosing the relevant components and designing an appropriate chemical stoichiometry for obtaining the desired metallic glasses [
9,
10,
11]. Concerning this issue, researchers have been working hard in the past decades and have proposed some empirical criteria or rules to predict in which system and at what chemical stoichiometry, metallic glass is most likely to be obtained [
12,
13,
14,
15]. For example, Turnbull
et al. [
12] have predicted that the ratio of the glass transition temperature
Tg to the melting point
Tm, which is referred to as the reduced glass transition temperature
Trg =
Tg/
Tm, can be used as a criterion for determining the GFA of the alloys. Egami and Waseda [
13] have proposed a simple empirical formula to predict the glass formation based on the consideration of the atomic size effect. The empirical rules for the guidance of element selection and for the prediction of compositional range favored for glass formation have been further framed by Johnson [
14] and Inoue
et al. [
15]. Although these empirical criteria or rules have served as guidelines for the synthesis of metallic glasses for decades, they still belong to the empirical models and cannot predict the exact composition range for glass formation. Meanwhile, some essential experimental parameters, such as glass transition temperature of an alloy, can only be obtained after the glass has been prepared and thus are not predictable quantities. Naturally, it requires heavy work of repeatedly melting-quenching and thermal analyses of numerous alloys to pinpoint the glass formation compositions. Therefore, it is of significance to establish a relevant method to efficiently predict the alloy compositions with high GFA
a priori and provide estimates for such compositions to guide the experiments.
To this end, thermodynamic calculation is revealed to be an appropriate scheme for quantitatively and efficiently predicting the compositions with high GFA. Several methods have been proposed, from a macroscopic atom model or from the theory of electronic band structure [
16,
17,
18], and among the various methods, the Mediema’s model and Alonso’s method based on the macroscopic atom model are widely acknowledged [
16,
18]. According to the Mediema’s model and Alonso’s method, the composition range that favors the glass formation, or frequently named as glass formation range (GFR) of a system can be determined by comparing the Gibbs free energies of all possible competing phases, usually the solid solution phase and the glassy phase. Specifically, in determining the Gibbs free energies, many factors that have been recognized as closely correlated with glass formation are considered, such as valence, electronegativity, crystalline structure and atomic size mismatch [
16,
18]. Moreover, in order to further evaluate the GFA, the parameter γ* that is proposed by Xia
et al. [
19] and modified by Wang
et al. [
11] is revealed to work quite well. It is assumed that metallic glasses would be more readily obtained in the compositions with high GFA, while the relatively low GFA indicates the declination of driving force for glass formation and the reduction of resistance against crystallization, and thus it requires more severe kinetic conditions to obtain the metallic glasses.
Since the discovery of the Al-based glassy ribbons in the 1980s, the Al-based BMGs have attracted much research attention. In recent years, dramatic progress has been made in the Al-TM-RE (TM: transition metal elements, RE: rare earth elements) systems [
20,
21,
22,
23]. However, it has been realized that the GFA of the Al-based BMGs are different from most of the known bulk glass formers and fail the generality of many criteria such as deep eutectic rule and size different rule [
24,
25]. Considering that the empirical criteria do not work well for the Al-based systems, in this work, we resort to the semi-quantitative thermodynamic calculations to interpret the composition dependence of GFA in these systems. In the present study, the Al-Cu-Y system, which is a significant representative of the Al-TM-RE alloy systems, is selected here for investigation.
2. Thermodynamic Calculations
Thermodynamics calculations based on Miedema’s model and Alonso’s method have been widely applied to predict the glass formation of a binary or ternary system [
16,
18]. The basic idea is to compare the Gibbs free energy of all the competing alloy phases, such as the amorphous phase, solid solution phase as well as the intermetallic compound. Generally, the Gibbs free energy of an alloy phase could be calculated by ∆
G = ∆
H −
T∙∆
S, where ∆
H and ∆
S are the enthalpy and entropy terms, respectively. As a first approximation, the entropy term ∆
S for a concentrated solid solution or an amorphous phase is simply taken as that of an ideal solution. For a ternary alloy system with constituents of A, B and C, the ∆
S could be calculated as
where
R is the gas constant and
cA,
cB and
cC are the atomic concentrations of metals A, B and C, respectively.
According to Miedema’s model and Alonso’s method [
16,
18], the formation enthalpy
of a ternary solid solution is the sum of three terms,
where
,
and
are the chemical, elastic and structural contributions, respectively.
The chemical term
is closely related to the electron redistribution generated at the boundary of the Wigner-Seitz unit cell when the alloy is formed [
18] and could be divided into contributions of three binary subsystems as
Take the A-B binary subsystem as an example, the chemical term
is given by:
where
cA and
cB are the atomic concentrations of metals A and B,
and
are the electron redistribution contribution to the enthalpies of A solved in B and that of B solved in A [
16]. Further considering the possible chemical short-range ordering of the alloy phases, the right-hand side of Equation (4) should be multiplied by a factor [
16]
In Equation (5), and are the cell surface concentrations, which could be calculated by:
The parameter γ in Equation (5) is an empirical constant which is used to describe the degree of short-range ordering in different alloys. For the solid solution, amorphous phase and ordered compound, it is usually taken as 0, 5 and 8, respectively. Similarly, the chemical terms of another two subsystems, i.e., and could be calculated by Equation (4) and the chemical term could be easily obtained by Equation (3).
The elastic term is an atomic size mismatch contribution and could also be divided into three terms of binary subsystems,
For the A-B binary subsystem, the chemical term
is given by:
where
cA and
cB are the atomic concentrations of metals A and B,
and
are the elastic contribution to the enthalpies of A solved in B and that of B solved in A [
16]. After the elastic terms of each binary subsystem are obtained, the elastic term
of the ternary system could be calculated by Equation (7).
The structural contribution
reflects the correlation between the number of valence electrons and the crystal structure of transition metals. It could be deduced from the lattice stability
Eσ(
Z) of each crystal structure σ (σ = bcc, fcc or hcp) as a function of the number of valence electrons Z of the metal
where
cA,
cB and
cC are the atomic concentrations of metals A, B and C,
,
ZA,
ZB and
ZC are numbers of mean valence electrons of the alloy phase and valence electrons of the pure metals A, B and C,
,
,
and
are the lattice stability parameters of the alloy phase and the pure metals A, B and C, respectively.
For the amorphous phase, both the elastic term
and the structural term
are absent, but the enthalpy difference between the amorphous and crystalline states of pure metals
should be considered. The formation enthalpy
of the amorphous phase could thus be written as
where
cA,
cB and
cC are the atomic concentrations of metals A, B and C,
,
and
are the enthalpy difference between the amorphous and crystalline states of pure metals A, B and C. According to Van der Kolk
et al. [
26], the
(
i = A, B, C) could be given by
where α = 3.5 J mol
−1 K
−1 and
Tm,i is the melting temperature of component
i. By comparing the Gibbs free energies of the amorphous and the solid solution phases, an estimate of the glass formation region (GFR) of a ternary transition alloys system could be obtained.
According to Xia’s proposal [
19] and Wang’s modification [
11], the GFA is affected by two factors: (1) the driving force for glass formation (
), and (2) the resistance against crystallization,
i.e., the difference between the driving force for the amorphous phase and for the intermetallic compound (
). Accordingly, the GFA of a ternary alloy consisting of metal A, B, and C can be evaluated as:
The enthalpy of amorphous phase can be calculated by Equation (10). For the enthalpy of the intermetallic compound, the elastic term and the structural term in Equation (2) are absent for the intermetallic compound, thus
By calculating the value of the parameter γ*, the composition dependence of GFA can be predicted.
3. Results and Discussion
The thermodynamic calculation results for the Al-Cu-Y system are presented here. As the process of producing metallic glasses is always a non-equilibrium or even a far-from-equilibrium process [
27,
28], the complicated phase could not nucleate and grow due to the extremely restricted kinetic condition. It follows that the major competing phase of the amorphous phase is the terminal solid solution phase, whose structure is relatively simple. This viewpoint has been supported by a large number of experimental and theoretical studies [
27,
29,
30]. Accordingly, the issue of predicting the favored glass formation compositions could be converted into an issue of comparing the stability of the amorphous phase
versus the solid solution phase. From a thermodynamic point, the Gibbs free energy of an alloy phase can be taken as an indication of its stability, and therefore by comparing the relative energy status of the amorphous phase
versus the solid solution phase, the compositions that are energetically favoring the metallic glass formation can thus be located.
Table 1 lists the major parameters that are applied or derived in the thermodynamic calculations for the Al-Cu-Y system. For the Al-Cu-Y system, as shown in
Figure 1, by evaluating the energies of the amorphous phase and the solid solution phase, three critical solubility lines,
i.e., AB, CD, and EF, are determined, and a hexagonal region enclosed by ABCDEF is located in the composition triangle. If an alloy composition is located inside the defined hexagonal region, the amorphous phase is energetically favored, and if it is located outside, the crystalline solid solution is favored. The hexagonal region is therefore named as the glass formation region (GFR). It is seen that in the Al-Cu-Y system, the amorphous phase is favored over a large composition region, indicating the system is a readily glass forming one.
Table 1.
The parameters used in the thermodynamic calculations for the Al-Cu-Y system. , , , and are expressed in kJ mol−1, is expressed in K.
| | Al | Cu | Y | Al-Cu | Al-Y | Cu-Y |
|---|
| 0 | 1.5 | −2.5 | | | |
| 933.2 | 1357.6 | 1799.0 | | | |
| | | | −47.17 | −149.60 | −64.37 |
| | | | −37.61 | −236.68 | −127.72 |
| | | | 16.19 | 71.66 | 135.72 |
| | | | 12.34 | 56.84 | 117.24 |
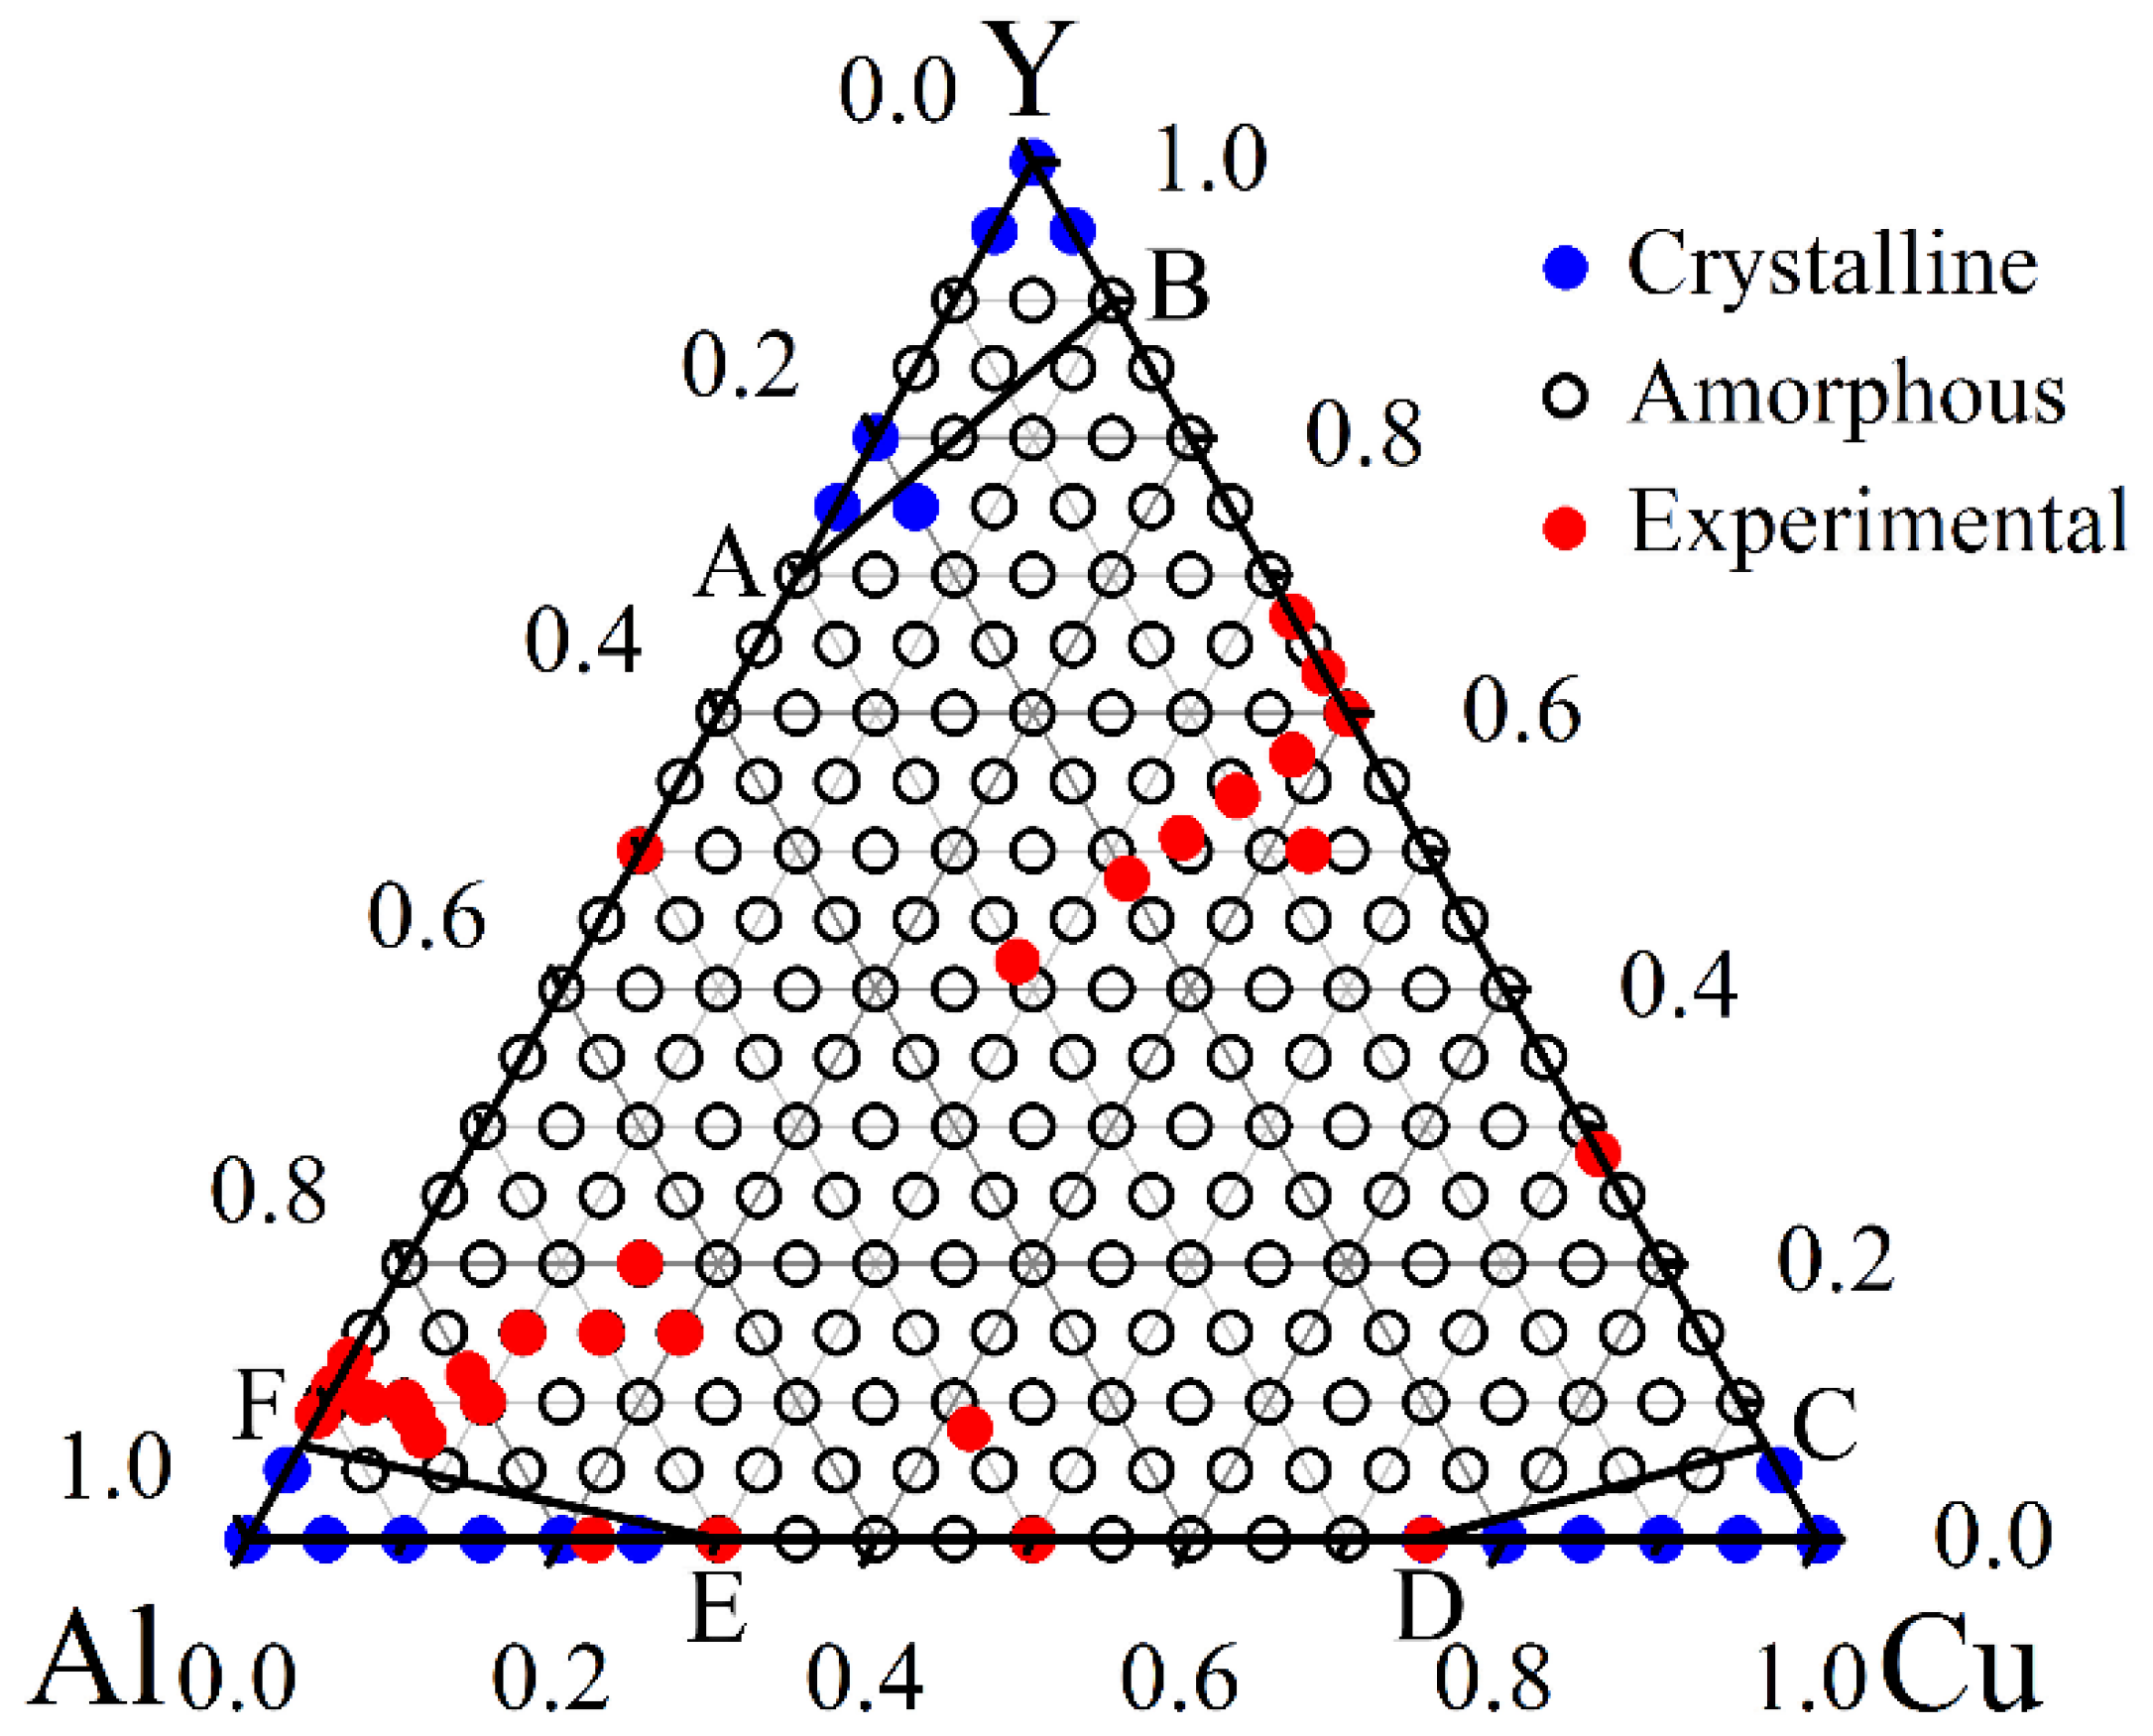
Figure 1.
The hexagonal glass formation region, enclosed by ABCDEF, that are located by the thermodynamic calculations for the ternary Al-Cu-Y system.
Figure 1 also indicates that for the Al-Cu, Al-Y and Cu-Y binary subsystems, the addition of a third element helps broaden the GFR. Take the Cu-Al subsystem as an example, the amorphous phase could be obtained over the composition range of 30–75 at% Cu in this system, and with a minor addition of a few percent of Y, the GFR extends from one end of the composition triangle to the other end, suggesting that the amorphous phase could form at any combinations of Cu and Al. This sensitive alloying effect on the GFA, by a minor addition of a third element, is very useful in producing the metallic glasses in practice.
To further validate the predicted GFR of the Al-Cu-Y system, the experimental identified glass formation compositions reported so far in the literature are extensively collected [
20,
21,
30,
31,
32,
33] and marked by the red dots in
Figure 1. For example, Inoue
et al. have prepared a series of Al-Cu-Y metallic glasses within the composition range of 3–22 at% Y by melt spinning and found that when the Al content is more than 80 at%, the metallic glasses have good bend ductility [
20,
21]. Fukunaga
et al., have obtained Al
x(Cu
0.4Y
0.6)
100−x (
x = 0, 5, 10, 15, 20, 30, 80, and 85) metallic glasses by arc melting and further studied their atomic and electronic structures [
31]. In addition, Idzikowski
et al. have obtained fully amorphous Al
8Cu
42Y
50 ribbon by melt-spinning and further tracked its structural evolution with varying annealing time [
32]. For the Al-Cu sub-binary system, Han
et al. have reported that amorphous phase can form in the composition range of 25–78 at% of Al [
33]. The glass formation in the Al-Y system has not been experimentally studied in the entire composition range, but it is reported that amorphous alloys in Al-rich regions can be formed in the range of 9–13 at% Y [
21]. Meanwhile, several amorphous alloys have been obtained in the Cu-Y system through arc melting [
30,
33]. Summarizing the experimental observations for the Al-Cu-Y system reported so far in the literature, it is revealed that these experimental glass formation compositions mostly fall within the predicted GFR, suggesting that the results predicted by the thermodynamic calculations are reasonable in determining the GFR of the Al-Cu-Y system.
From
Figure 1, one can grasp the possibility of glass formation at a given stoichiometry, but it is not adequate for guiding the composition design, as it does not describe the ease or difficulty in obtaining the metallic glasses at a certain composition. Thus we proceed to determine the compositions with large GFA inside the located glass formation region. To evaluate the composition dependence of GFA and determine the compositions with relatively large GFA, the parameter γ* is further calculated over the entire predicted GFR. Inspecting the expression of parameter γ* in Equation (13), it is seen that γ* considers both the driving force of glass formation and the resistance to crystallization. As the final phase arises from the competition and compromises among possible phases, dominated by the tendency to reduce the total free energy, a high γ* indicates that the amorphous phase is more thermally stable or more easily obtainable against the competing crystalline phases. Comparatively, for the compositions with a relatively lower γ*, the driving force of the amorphous phase and its resistance to crystallization is accordingly reduced, therefore the amorphous phase would be harder to be obtained or be less stabilized.
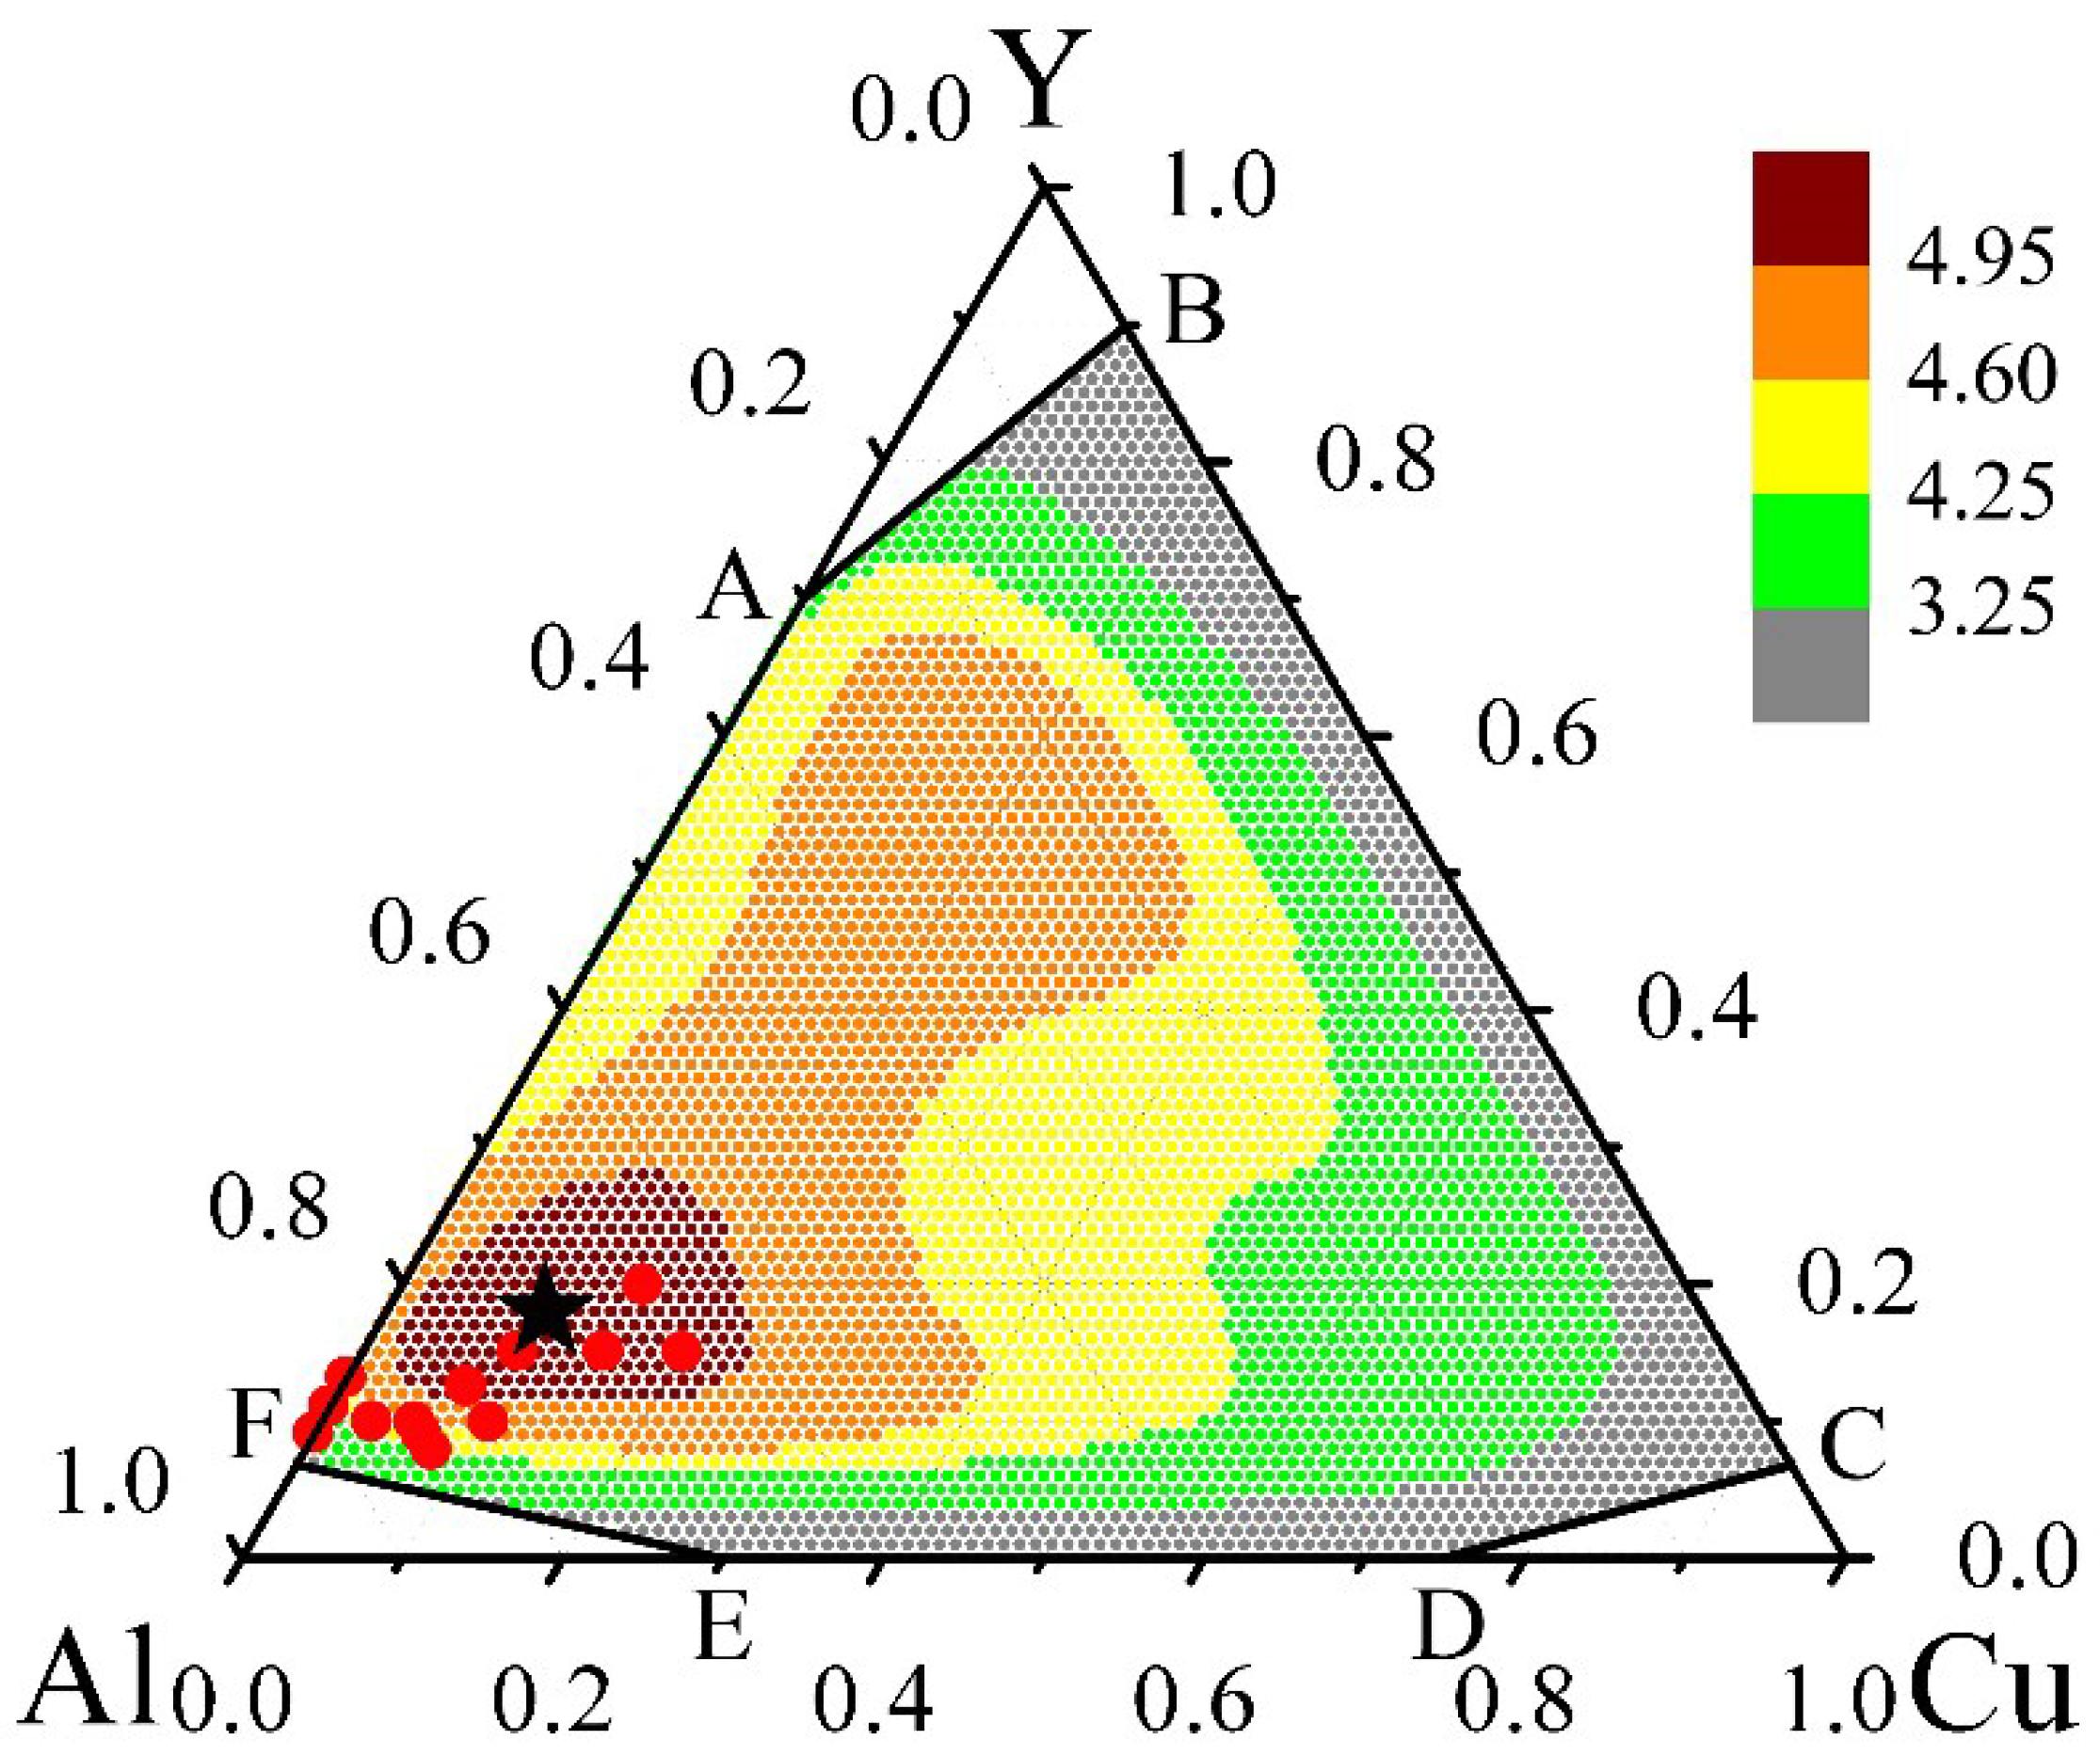
The contour map of γ* inside the GFR for the Al-Cu-Y system is plotted in
Figure 2. Inspecting
Figure 2, the compositions marked by the red dots have a much larger γ* than the other regions, suggesting that these compositions have a relatively larger GFA. Moreover, within this red dot region, the stoichiometry of Al
72Cu
10Y
18 marked by a black asterisk is characterized with the maximum γ*, suggesting that glassy alloys around Al
72Cu
10Y
18 could be most thermally stable or easily attainable. Thus the composition with the largest GFA for metallic glass formation in the Al-Cu-Y system can be pinpointed around Al
72Cu
10Y
18.
In order to facilitate assessing the relevance of the thermodynamic analysis, it is of importance to compare the prediction results with the experimental observations reported in the literature. As the compositions predicted with high GFA are mainly located in the Al-rich corner,
i.e., Al
xCu
yY
100−x−y (
x = 60–100,
y = 0–40), the experimental identified glass formation compositions in the Al-rich corner [
20,
21,
32,
33,
34,
35] are then marked by the red dots in
Figure 2, as they are presented in
Figure 1. One can see from
Figure 2 that experimental identified glass formation compositions in the Al-rich corner are densely clustered around the pinpointed stoichiometry of Al
72Cu
10Y
18, suggesting that the stability of metallic glasses with ternary compositions around Al
72Cu
10Y
18 are indeed enhanced. Therefore, it turns out that prediction of GFA by the thermodynamic calculations for the Al-Cu-Y system is also well supported by the experimental observations.
Figure 2.
Contour map of the parameter γ*, an indicator of GFA that evaluates both the driving force of the amorphous phase and its resistance to crystallization, derived from the thermodynamic calculations for the ternary Al-Cu-Y system. The black asterisk pinpoints the stoichiometry of Al72Cu10Y18 with the largest γ*. The red dots denote the experimentally observed compositions of glass formation in the Al-rich corner that are reported in the literature.
It is also of interest to compare the present results with the results obtained by other thermodynamic calculation methods. In the former studies, several other GFA indicators have been employed to evaluate the glass formation in the Al-Cu-Y system [
35]. For example, by calculating the formation enthalpy difference between the amorphous and the solid solution phases ∆
Ham−ss, the compositions close to Al-Y and Cu-Y sub-binaries are found to exhibit the largest GFA [
35]. From the normalized entropy change
Sσ/
kB, the largest GFA has been predicted in sub-binaries close to Cu-Y [
35]. It is seen that the largest GFA compositions predicted by these indicators are degenerated to the compositions that are close to the sub-binaries, thus unable to reflect the alloying effect by adding a third element. Moreover, by evaluating the ∆P
HS, another GFA indicator that combines enthalpy and entropy analysis, it is indicated that the highest GFA is in the vicinity of the composition of Y
40Cu
31Al
29 [
35]. Although this also gives a reasonable prediction, there is still discrepancy from the experimental glass formation compositions, which are mostly clustered in the Al-rich corner, as exhibited in
Figure 1 and
Figure 2. The derivation in the Al-rich corner can be also seen in the thermodynamic calculations for other Al-based systems, such as the Al-Ni-(Y, La, Ce) systems [
24]. In the present study, we have demonstrated that the parameter γ* can provide a better treatment for the glass formation in the Al-rich corner and the prediction results are more compatible with the experimental observations. As stated above, the glass formation in the Al-based systems have failed the generality of many rules and criteria [
24,
25]; thus, the prediction of glass formation for these systems have significance in both theoretical and technological aspects. The present findings demonstrate that the parameter γ* offers an effective candidate to work as GFA indicator for the Al-Cu-Y system and therefore have implications for the whole family of the Al-based systems.


