Article

Applicability of Solid Solution Heat Treatments to Aluminum Foams

CellMat Laboratory, Faculty of Science, University of Valladolid, Paseo de Belén 7, Valladolid 47011, Spain
*
Author to whom correspondence should be addressed.
Metals 2012, 2(4), 508-528; https://doi.org/10.3390/met2040508
Submission received: 27 November 2012 / Revised: 8 December 2012 / Accepted: 11 December 2012 / Published: 14 December 2012

Abstract

:
Present research work evaluates the influence of both density and size on the treatability of Aluminum-based (6000 series) foam-parts subjected to a typical solid solution heat treatment (water quenching). The results are compared with those obtained for the bulk alloy, evaluating the fulfilment of cooling requirements. Density of the foams was modeled by tomography analysis and the thermal properties calculated, based on validated density-scaled models. With this basis, cooling velocity maps during water quenching were predicted by finite element modeling (FEM) in which boundary conditions were obtained by solving the inverse heat conduction problem. Simulations under such conditions have been validated experimentally. Obtained results address incomplete matrix hardening for foam-parts bigger than 70 mm in diameter with a density below 650 kg/m3. An excellent agreement has been found in between the predicted cooling maps and final measured microhardness profiles.

Graphical Abstract

1. Introduction

Aluminum foams are materials with potential technological relevance since they offer a unique combination of properties. They are lightweight materials with excellent dampening and crash-absorption response, good fire and chemical resistance, high electromagnetic shielding and interesting density-tailored thermal, electrical and mechanical properties [1]. Nevertheless, they also present several drawbacks such as the high processing costs and the poor control of the final structure derived from a foaming process not completely reproducible [2].
Among the existing production methods, the powder metallurgical (PM) route has focused significant attention from scientists and engineers. The remarkable difference compared to the other routes is the possibility of obtaining a foam-part with the required final shape, suppressing secondary steps. Moreover, the external dense skin gives this material a solid appearance and acceptable outward quality [3,4]. On the other hand, similar to other routes, the cellular structure of these foams is not as perfect and reproducible as desired. Defects such as cracks in cell walls, missing cell edges, coarsened pores, irregular cell morphology and a non-homogeneous density distribution are frequently found in most foams produced [5,6]. As a consequence, the derived mechanical properties are not as high as those predicted by the theoretical models established in previous investigations [7,8].
Different strategies to remedy the current situation have been suggested. The use of foams as cores in metallic sandwiches [9,10] and the use of net-shape stainless steel reinforcements can increase the mechanical response in bending/tension [11], as well as in compression [12]. However, the inconveniences of these approaches are the weight payload and the extra manufacturing costs. Alternatively, the modification of the aluminum microstructure by means of “smart” alloying may produce benefits both in the cellular structure and microstructure [13].
Lastly, the modification of the foam matrix microstructure by means of a heat treatment has also been considered in different studies with good results [14,15,16]. Most of these studies focused their attention on AlMgSi type alloys (6000 series), since these are widely used in automobile, aircraft and food industries due to their medium strength, good corrosion resistance, reasonable weldability and moderate cost [17]. Other authors have evaluated heat treatment in 7000 and 2000 series, containing respectively Zn and Cu as the main allowing elements [14,15]. Solid Solution Heat Treatment (SSHT) was selected in most of these cases. SSHT consists of three different steps: solid solution at high temperature, quenching and ageing. Among these steps, the cooling rate reached during quenching is the most important parameter since there is a minimum value needed to obtain a successful treatment.
The optimum parameters for thermal treatments are well established in solid alloys but, according to previous results [16], the heterogeneity of foams, together with their reduced thermal conductivity, may cause undesired cooling rate gradients within the cross section of the sample (from the rather dense skin to the low density center). Therefore, it is not obvious that, for a similar sample size, the cooling requirements that are satisfactory for the dense solid are also successful for the foamed material. The mentioned previous studies [14,15,16] on this subject were not focused on the discussion of the applicability—in terms of size or density limitations—of the known treatments on foams but on their effectiveness on the basis of compression, tension or fatigue tests. Thereby only global effect, measured as a change of the macroscopic properties, could be estimated, while the real changes produced in the local microstructure and the effect of the heterogeneous structure of foams have not been analyzed in detail yet.
Bearing the previous ideas in mind, this paper aims to investigate the influence of bulk density, density distribution and sample size of a 6000-series collection of foams on the applicability of a solid solution heat treatment, and particularly the water quenching step. Among the novelties presented in this work we can mention the use of X-ray tomography to study the density distribution, the high-speed registration of the temperature during the water quenching process in different points, the inclusion of experimentally validated finite elements modeling (FEM)—to predict the cooling behavior in the whole foam and to extend the results to other densities, sample size, etc., and the utilization of Vickers microhardness testing to check the local effectiveness of the treatment comparing the results with those obtained from simulation.
The methodology and results presented in the paper are useful resources for the design of a successful SSHT on real Al-foamed parts in which size and density distribution are the key variables.

2. Experimental Section

2.1. Preparation of Aluminum Foams

A hardenable alloy of 6000 series, with a composition similar to AA6061 was selected for this study. Specific composition of the AA6061 includes small amounts of secondary alloying elements such as Cr and Cu. Cr is believed to influence ductility but usually not strength, most significantly in alloys containing excess silicon [18], so limited effects may be expected from its absence. On the other hand, the presence of Cu normally takes a prominent role, leading to an increase in the strength for the T6 or T7 states, but at the cost of higher quench sensitivity requirements around 100 K/s for AA6061 [17]. These effects together with the consideration of low corrosion resistance have led to the selection of an alloy without any Cr or Cu content. According to this, extruded precursor material, prepared by the Conform method (Alulight Company, Ranshofen, Austria) and with the composition Al-1Mg-0.6Si (+0.4% wt of TiH2), has been used to produce the aluminum foams. The required cooling rate for this alloy is lower than 100 K/s as will be discussed in the next section.
The PM route allows producing foams with rather complex geometry, large size and in a wide range of densities. Nevertheless, in our study a simple cylindrical geometry, with diameter/height ratio of 1, was selected as the most suitable. With this geometry, and assuming axial symmetry, the density can be described by only two coordinates -ρ(r,z)-, z representing the height and r the radius. The selection of a cylinder of aspect ratio 1 promotes a more homogeneous temperature distribution in the heating and cooling stages, both during foaming as well as during the thermal treatment process. The methodology presented in this paper could be easily extended to other alloys and/or geometries.
Foam specimens were produced from pieces of extruded profiles. The foaming process was carried out in cylindrical stainless steels molds in a pre-heated furnace at 750 °C for roughly 8–13 min. The precursor mass was selected according to the volume and the desired final density of the corresponding foam. The expansion behavior of this particular precursor material had been studied previously [19]. Table 1 summarizes the list of foams produced. An average density of approximately 650 kg/m3 was chosen for studying the size effect. The influence of density was evaluated on the smallest samples (40 mm) over a wide density range (from 420 kg/m3 to 1200 kg/m3). In addition, a group of solid cylinders, of the same alloy and sizes as the foams, were also included in this study. The advantage of working with solid samples is that the thermal properties (density, conductivity, specific heat) are constant inside the sample. Therefore they were used to optimize/verify the FEM model.
Table 1. Densities and sizes of the samples used in this investigation.
Diameter/Height (mm/mm)Foams Density (kg·m−3)Solid Cylinders
40/40420660 9001200Yes
50/50 670 Yes
60/60 650 Yes
70/70 690 Yes

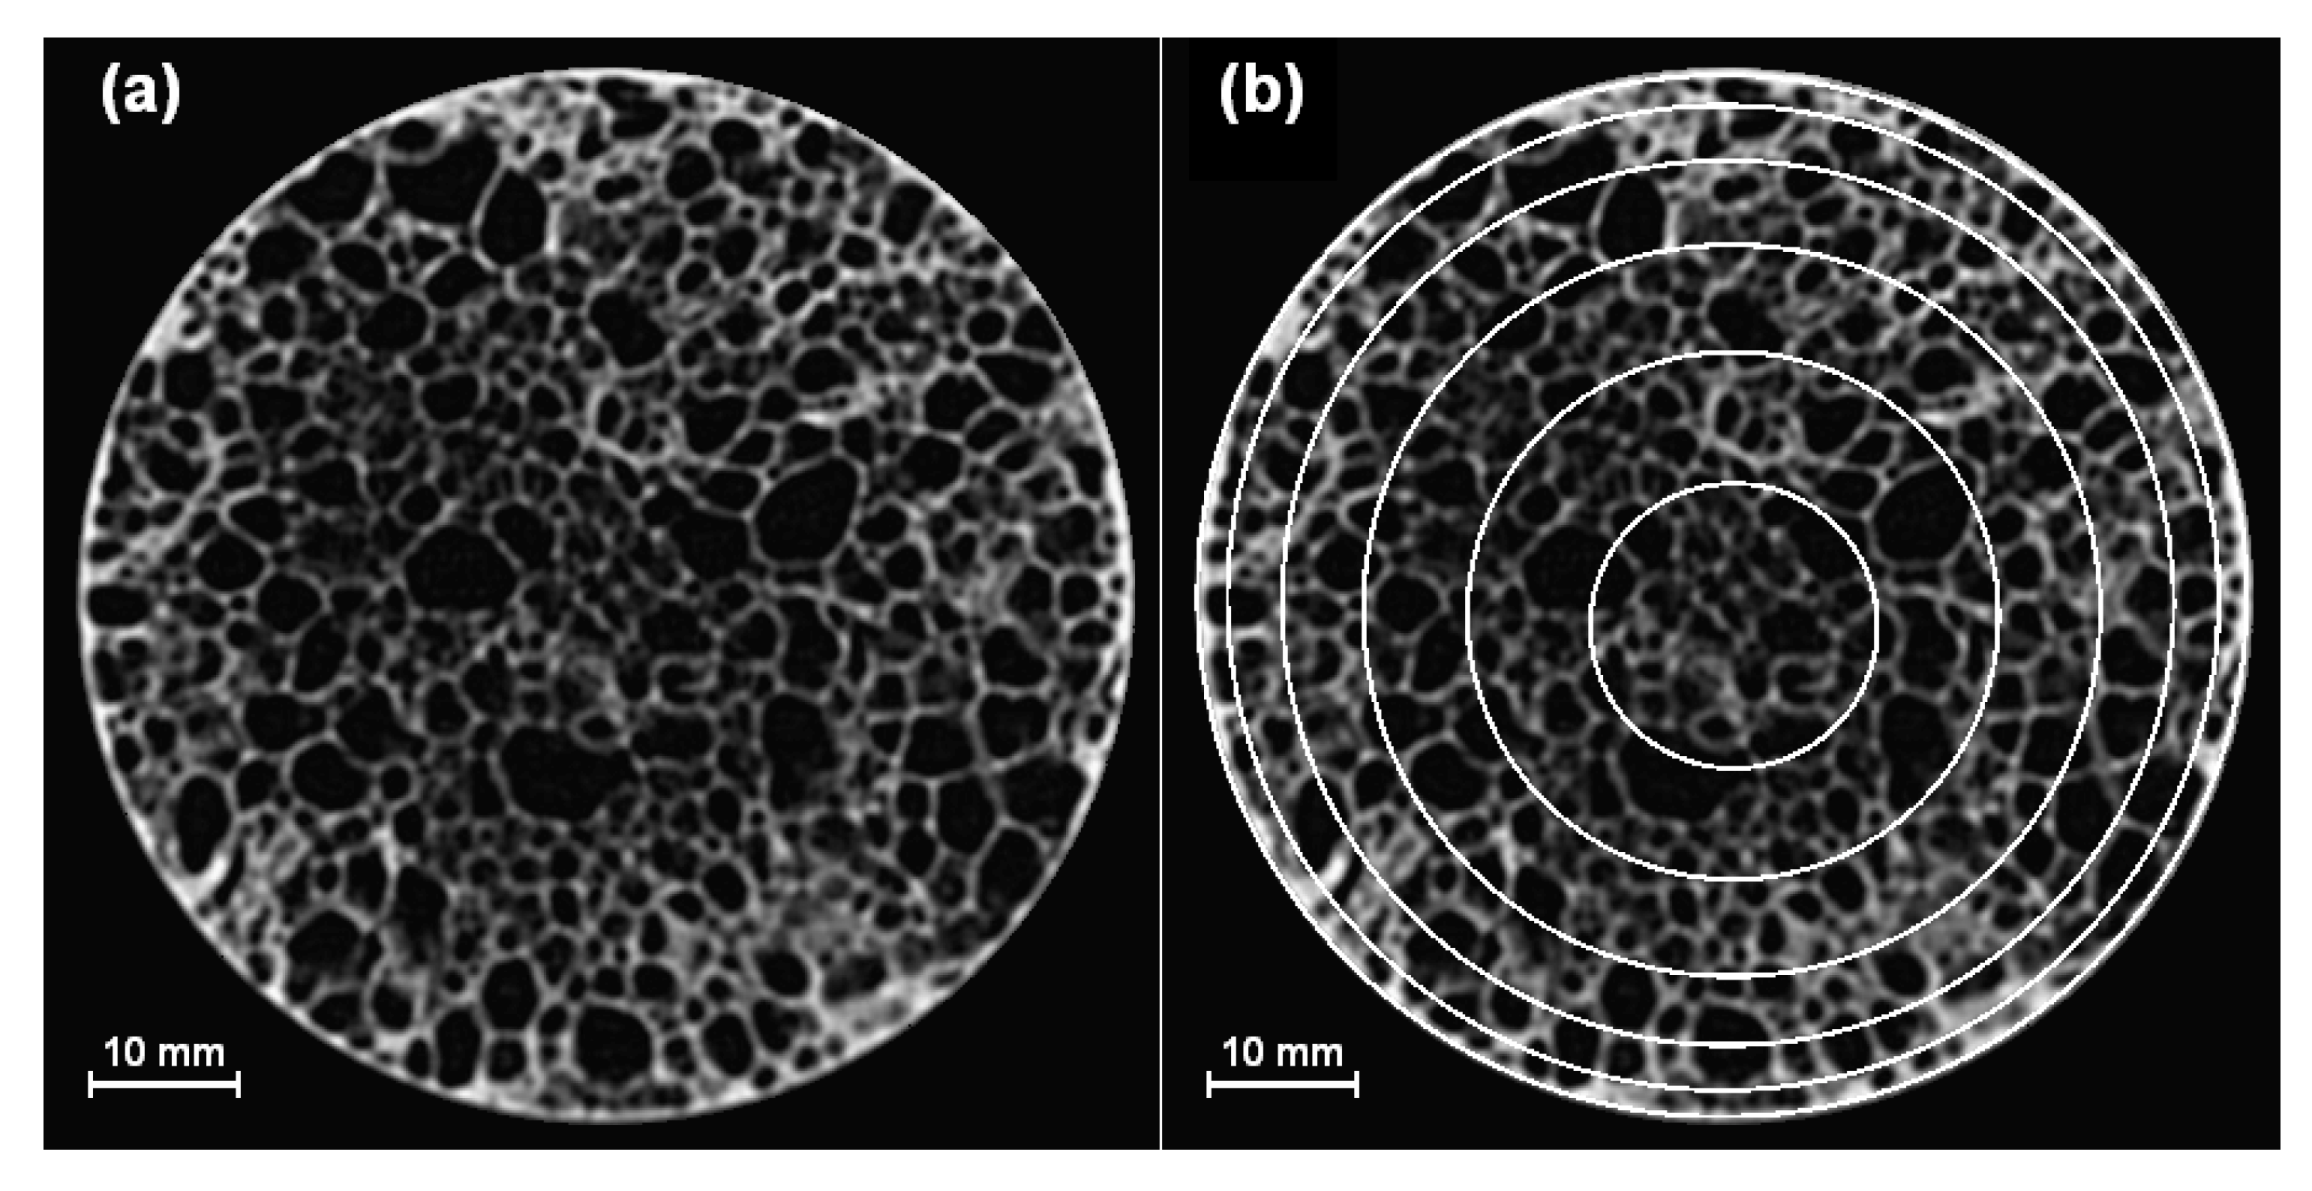
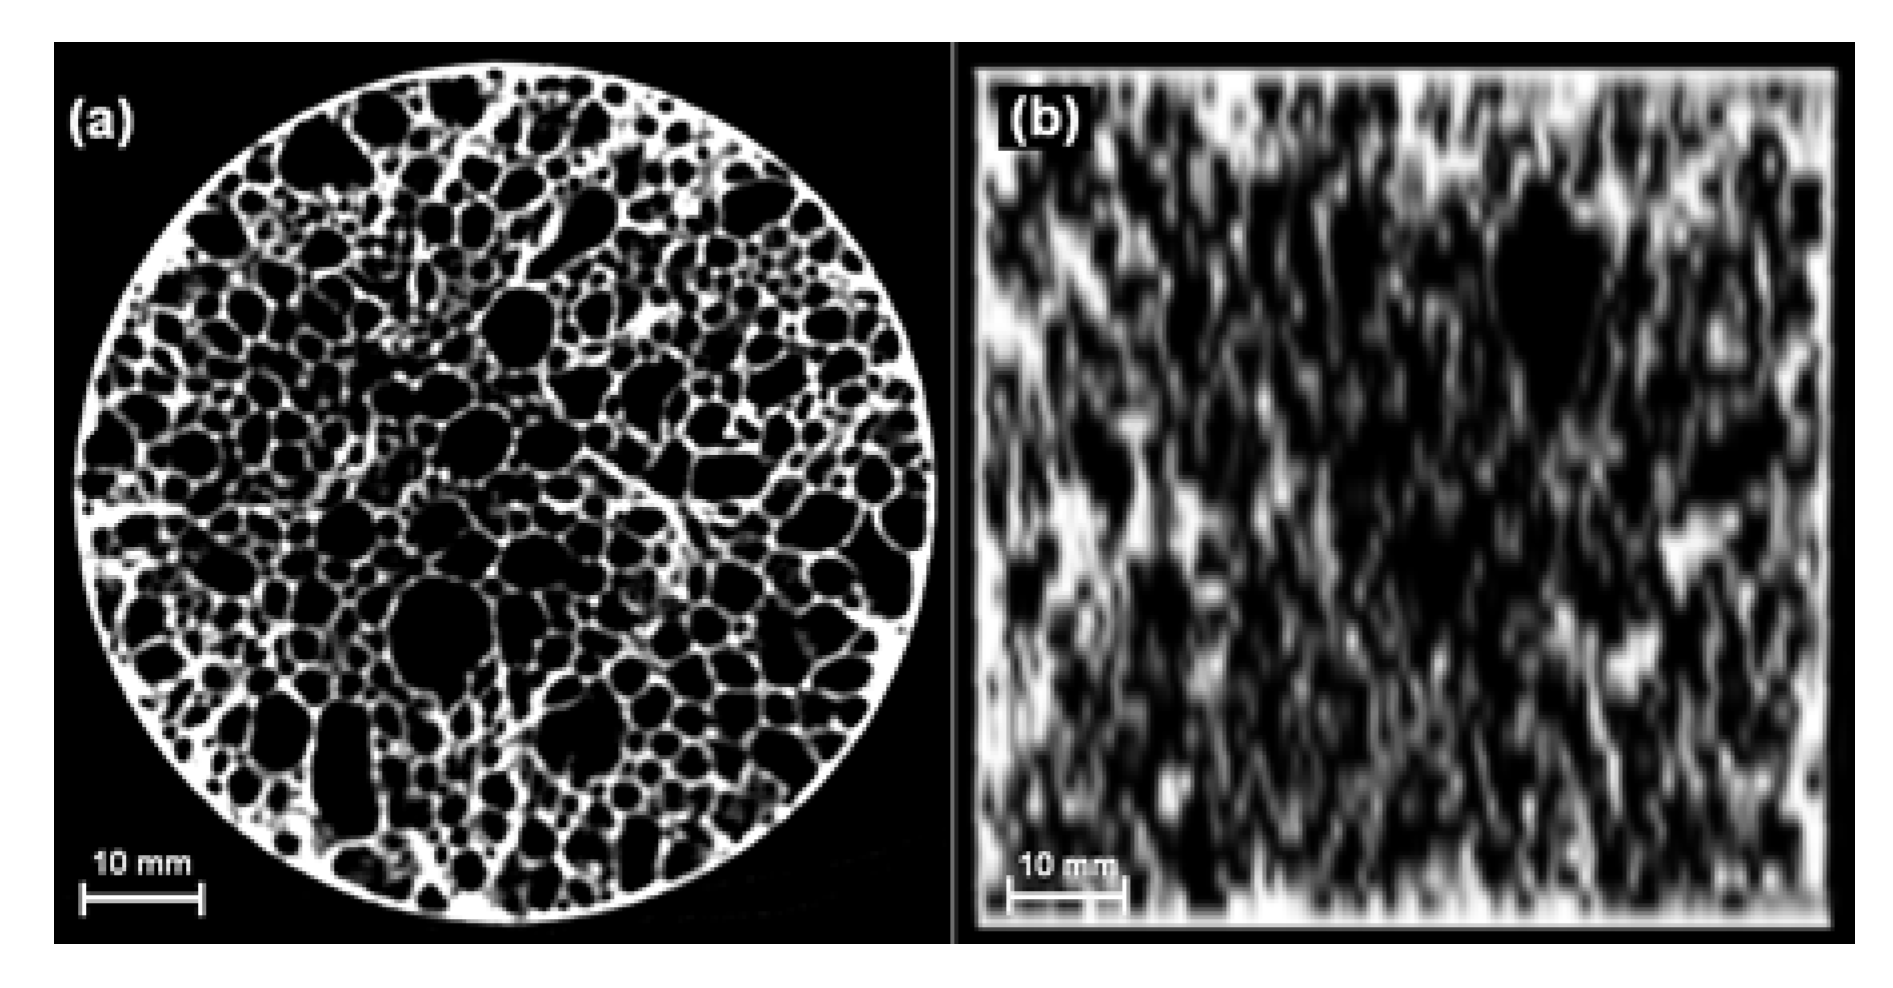
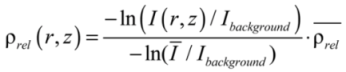
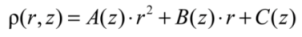
2.2. Mesoscale Density Analysis

Influence of density distribution on the heat transfer mechanism and the predicted temperature field is expected to be high. Characteristic density gradients in aluminum foam could be characterized by helical X-ray computed tomography previously [20]. Therefore this methodology has also been used in this study to characterize the internal structure of the foams prior to performing the heat treatments and subsequent cutting.
A medical helical scanner, model Siemens Somaton, with 4 detectors and controlled with the software VA40C, was employed for that purpose. The acquisition parameters used were 120 kV and 100 mA. Tomography images, with a resolution of 512 by 512 pixels and 8 bits, were reconstructed every 2 mm. This corresponds to a very low resolution in comparison with the resolution achieved with actual microtomography devices [21] (cell walls can not be completely resolved by helical CT). Nevertheless, this resolution is optimum to calculate the mesoscale density and determine the density profiles [22].
Figure 1. (a) Tomographic slice with (b) an exemplification of the SSDD method (reduced number of analyzed bands) applied in the 70/70 mm foam (ρ = 650 kg/m3).
Metals 02 00508 g001
The analysis of the slices obtained from tomography was carried out using dedicated software programmed under Image J [23]. The program automatically analyzes, in each slice, a series of 12 concentric bands with incremental width from the external skin to the center of the cylinder following the external shape of the sample (see example of incremental bands in Figure 1). This methodology allows to smoothly detect the density transition since density gradients re greater close to the skin. This kind of analysis has been called Symmetrical to Skin Density Distribution (SSDD). A similar methodology was employed elsewhere [24].
In this methodology the density of each concentric band is calculated from the average grey-scale intensity (I) through the equation 1, derived from Beer-Lambert Equation [25]. In this particular case two calibration points are necessary. One is the background intensity (Ibackground), i.e., the gray-scale of the black background in the slices. The other calibration point is obtained from the average value of the intensities collected in all the concentric bands, Ī, which corresponds to the macroscopic relative density of the foam, Metals 02 00508 i001.
Metals 02 00508 i002
This method yields a cylindrical symmetry, which means that only two coordinates are enough to describe the density distribution inside the foams. Therefore the densities obtained in the analyzed concentric bands can be fitted, with reasonably good precision, to an analytical polynomial function ρ(r,z) as described in Equation 2. This equation type implies the existence of a parabolic dependence on the radius in the perpendicular plane to z axis which, actually, is a good approximation as it has been already shown [22]. The coefficients A(z), B(z) and C(z) were parameterized as a fourth order polynomial functions (best functional fittings found). This dependence enables the possibility of asymmetry in the z axis, as expected from these materials affected from gravity-induced drainage [26].
Metals 02 00508 i003

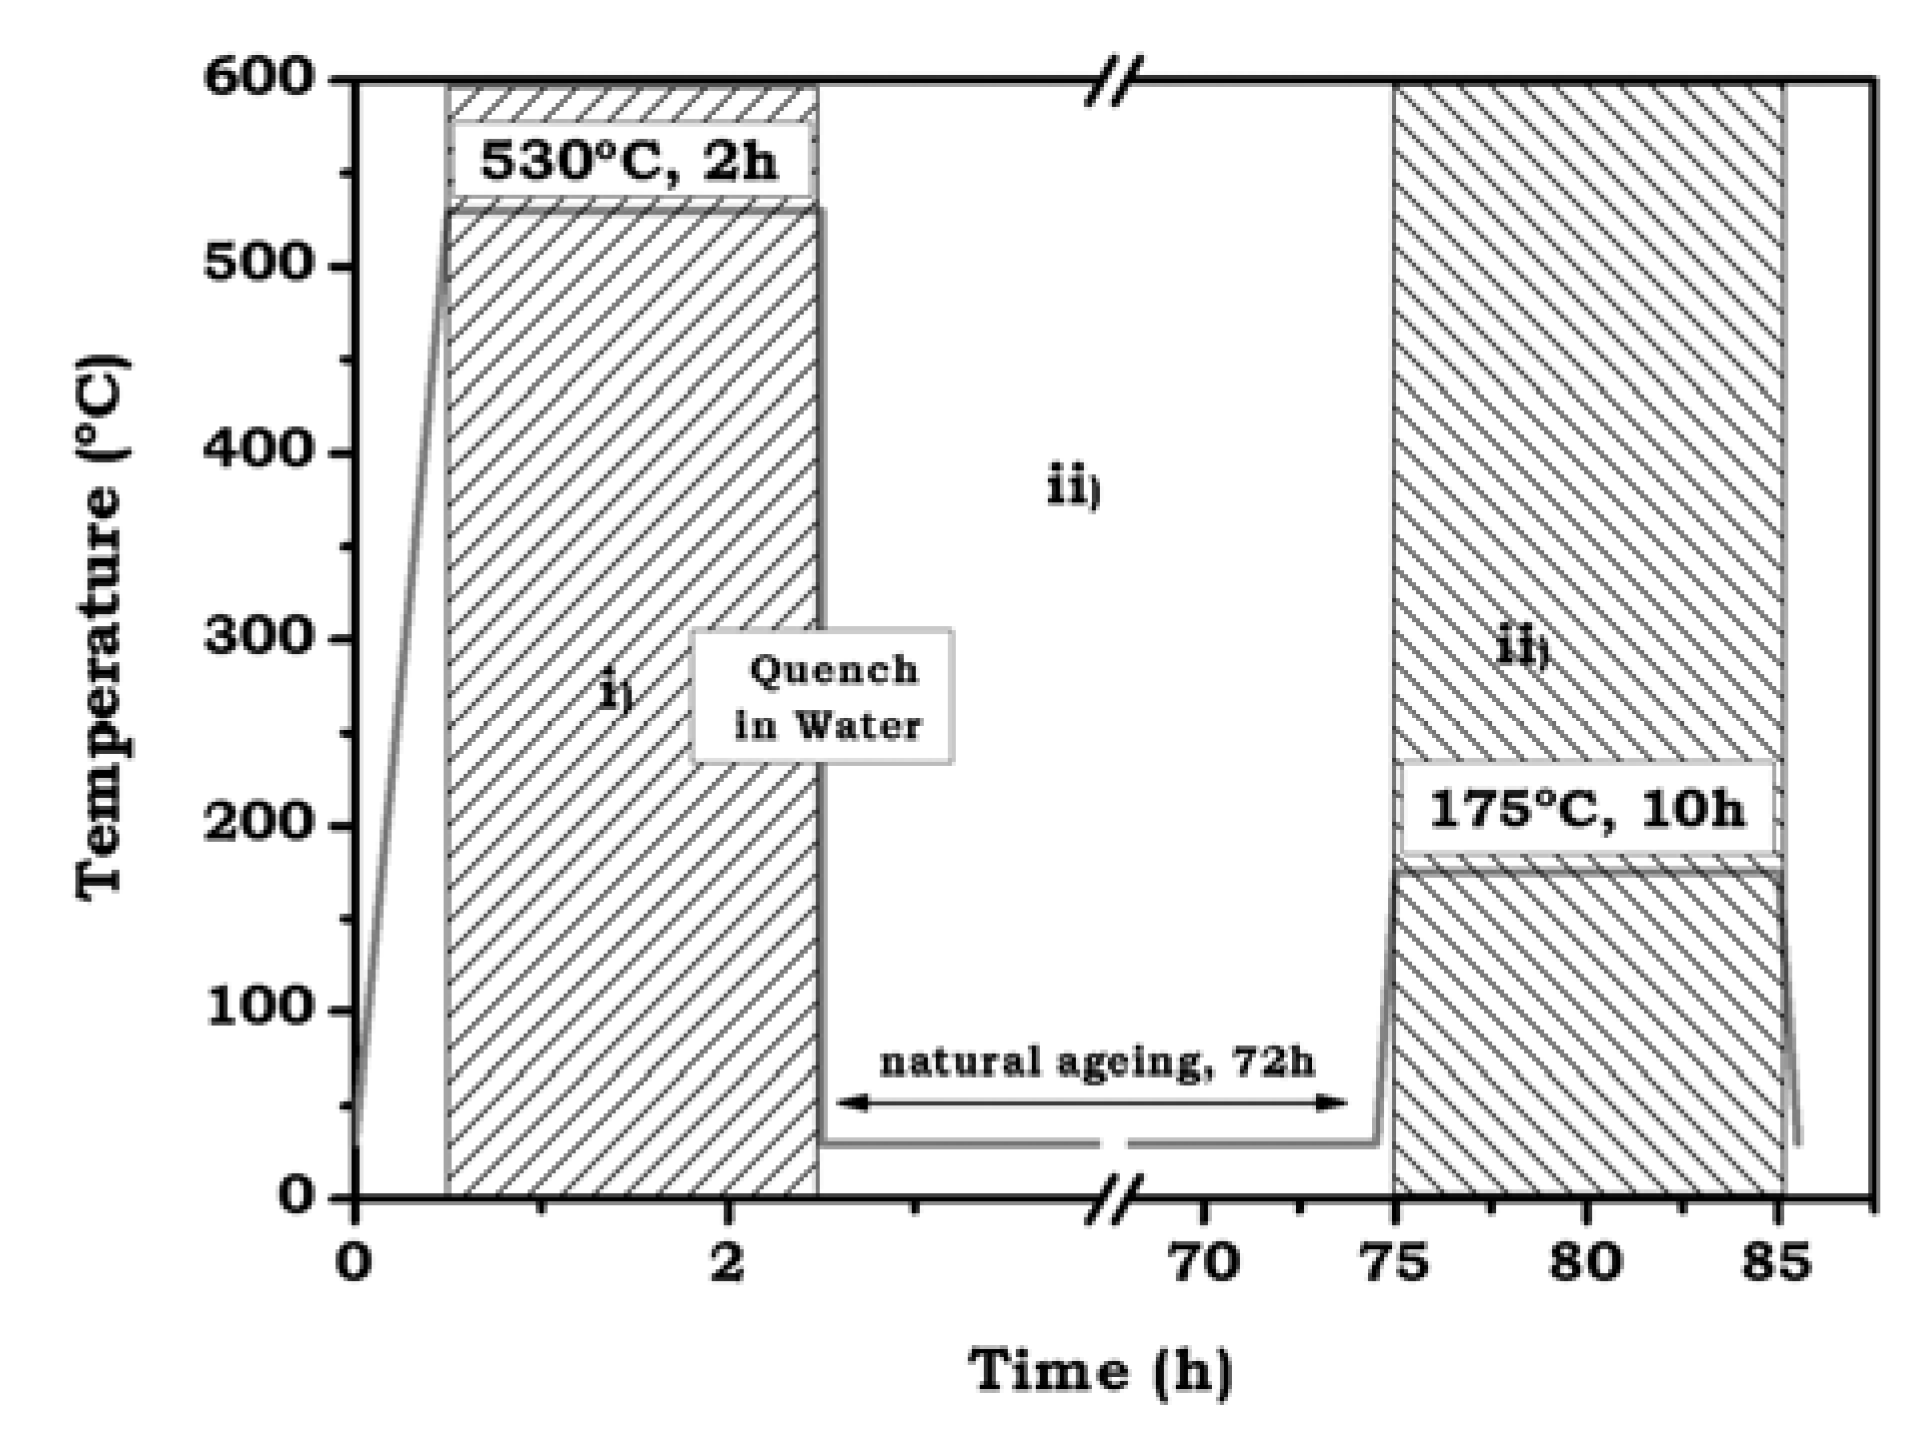
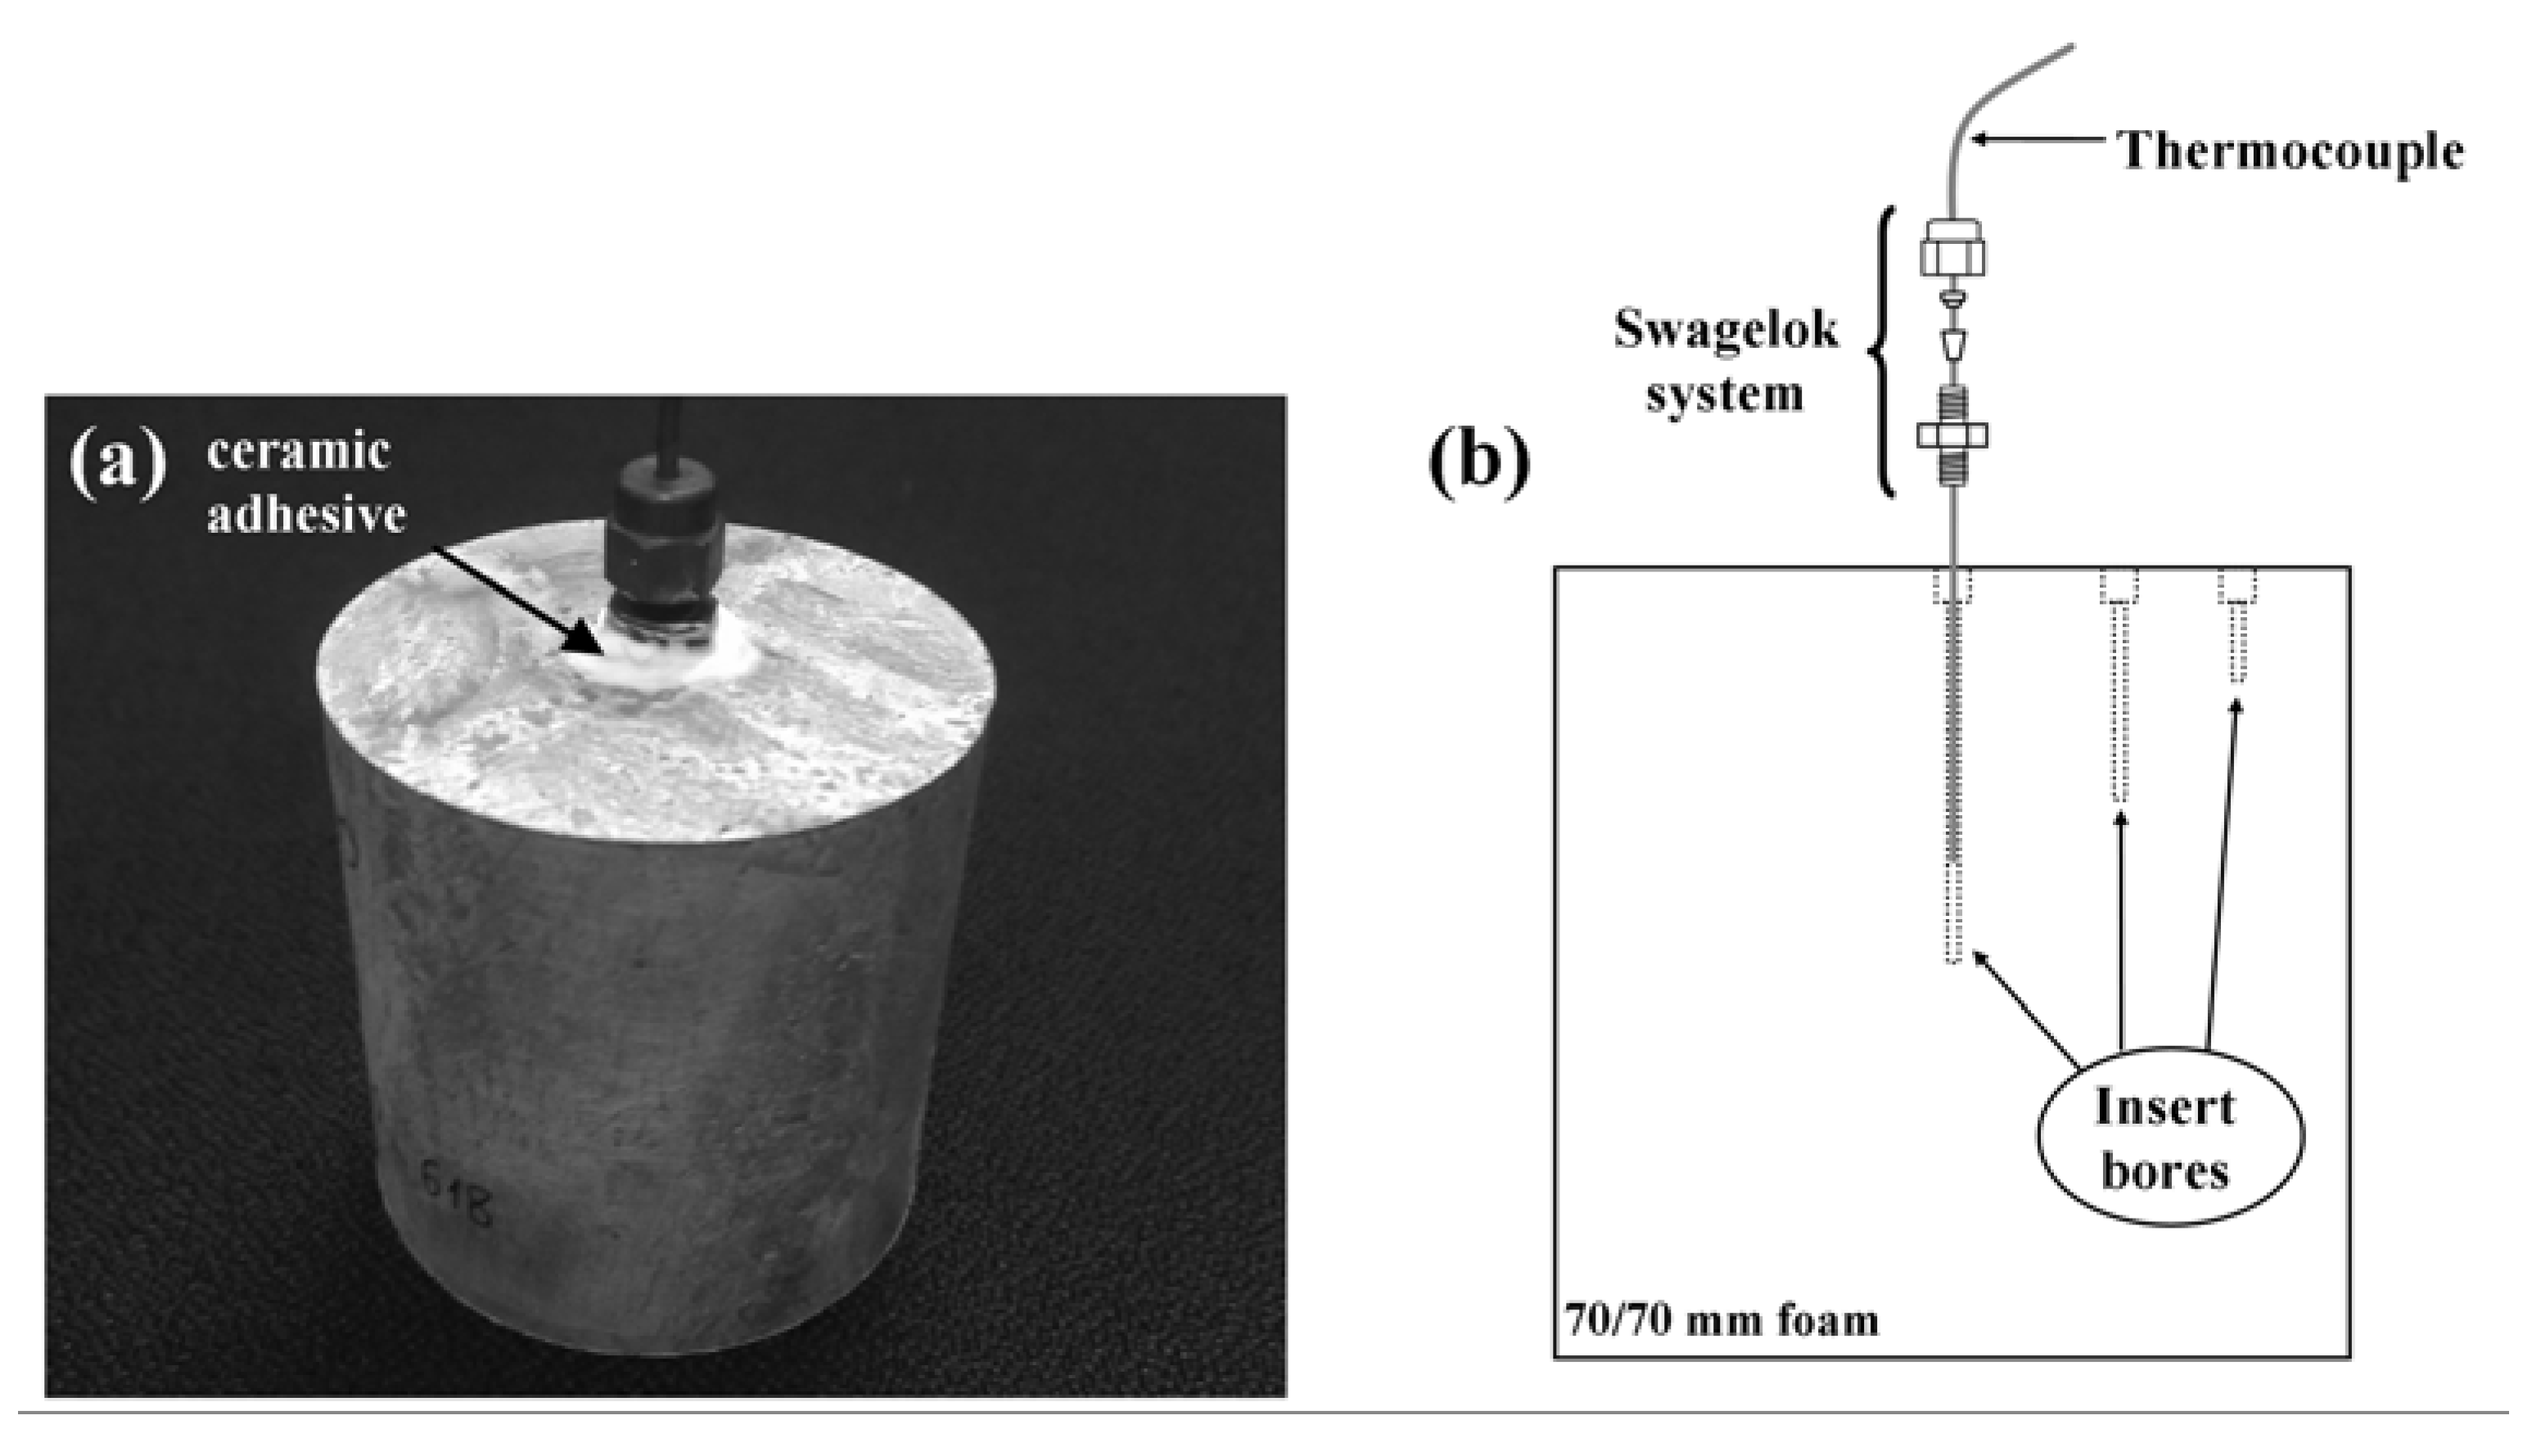
2.3. Heat Treatment and Temperature Measurement

The solid solution hardening heat treatment used in this investigation consists of three different steps that are represented schematically in Figure 2. They can be summarized as follows:
  • The specimen is introduced into a pre-heated furnace at 530 °C for 2 h, allowing the solid solution to be formed.
  • Sample is extracted from the furnace and rapidly quenched in cold water (~25 °C). Thus, the previous state is stabilized at room temperature, obtaining a supersaturated solid solution. The sample is then kept for 72 h at room temperature in order to promote natural ageing.
  • Lastly the sample is introduced into a pre-heated furnace at 175 °C for 10 h (artificial ageing) leading to the formation of precipitates in fine dispersion.
Figure 2. Temperature program followed during the heat treatment..
Metals 02 00508 g002
The aim of this treatment is to produce a uniform distribution of precipitates, which later could act as obstacles for the propagation of dislocations. Because foams present lower thermal conductivity than the bulk material, the quenching is expected to be the most critical step in this process. If the cooling is too slow, especially in the range between 400 and 290 °C, the probability of undesired grain boundary precipitate formation is high, leading to detrimental effects on hardness. That is the main reason for using water, or mixtures of water/glycerol, as quench medium. According to literature [17], the average cooling rate in the mentioned temperature range should exceed 33 K/s for an alloy with similar composition as the one selected in this study.
The quenching step was applied both to solid and foamed cylinders, while only two of the foams (50 and 70 mm) were selected to complete the whole thermal treatment. The registration and analysis of the temperature evolution during quenching was experimentally challenging, especially in the particular case of foams. A special procedure was designed to register the temperature at the geometrical center of the sample. A 2 mm bore diameter was drilled perpendicular to the upper base to reach the center of the foam. The hole allows the insertion of a stainless steel shielded K-type thermocouple of the same diameter, as shown in Figure 3. The selection of this position was not arbitrary since the central region is expected to suffer the lowest cooling rate. The analysis of the experimental data for this area will directly show whether the cooling rate was satisfied in the whole sample or not. The essential part of the system, aimed to avoid water entrance through the drilled hole, consisted in a Swagelok high pressure male-male passing connector of the same diameter that the thermocouple (1.5 mm). One part of the connector is screwed to the cylinder and the junction sealed with temperature resistant cement. The thermocouple with the nut, bi-cone and ferule is passed thought the connector and fixed. Figure 3a, shows the full assembly.
Temperature acquisition was performed with a high speed data logger registering the temperature variation at 100 Hz. Three repeated quenchings and temperature acquisition were applied on each sample to collect sufficient date to ensure the reproducibility. However a single quench was done on the samples selected to complete the whole treatment, to avoid any unexpected effect on the treatment efficiency. In the particular case of the 70/70 mm foams, the temperature drop was registered in more than one point. Two other holes were made closer to the skin (see Figure 3b) to insert two more thermocouples using the assembly already explained. This ‘extra’ data was used to further validate the FEM methodology and the simulated cooling maps.
Figure 3. (a) Photography of the assembly mounted in a 50/50 mm foam. (b) Schematic draw of the 3-thermocouples assembly used in the 70/70 mm foam.
Metals 02 00508 g003

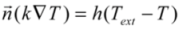
2.4. Heat Transfer Modeling

The quenching process modeling requires solving the heat transfer problem through a three dimensional finite region (cylinder). Heat transport inside closed cell aluminum foams for such quick processes is considered to be dominated mainly by solid conduction. The contribution of convection and radiation mechanisms is normally low, in comparison to conduction, even at very high temperatures [27]. Thus, the temperature distribution inside the sample, and its evolution with time, can be expressed by Equation 3, where k, ρ and CP denote, respectively, the thermal conductivity, the density and the specific heat of the material.
Metals 02 00508 i004
On the other hand, the heat exchange at the surface of the sample (represented by its normal vector Metals 02 00508 i005
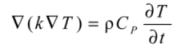
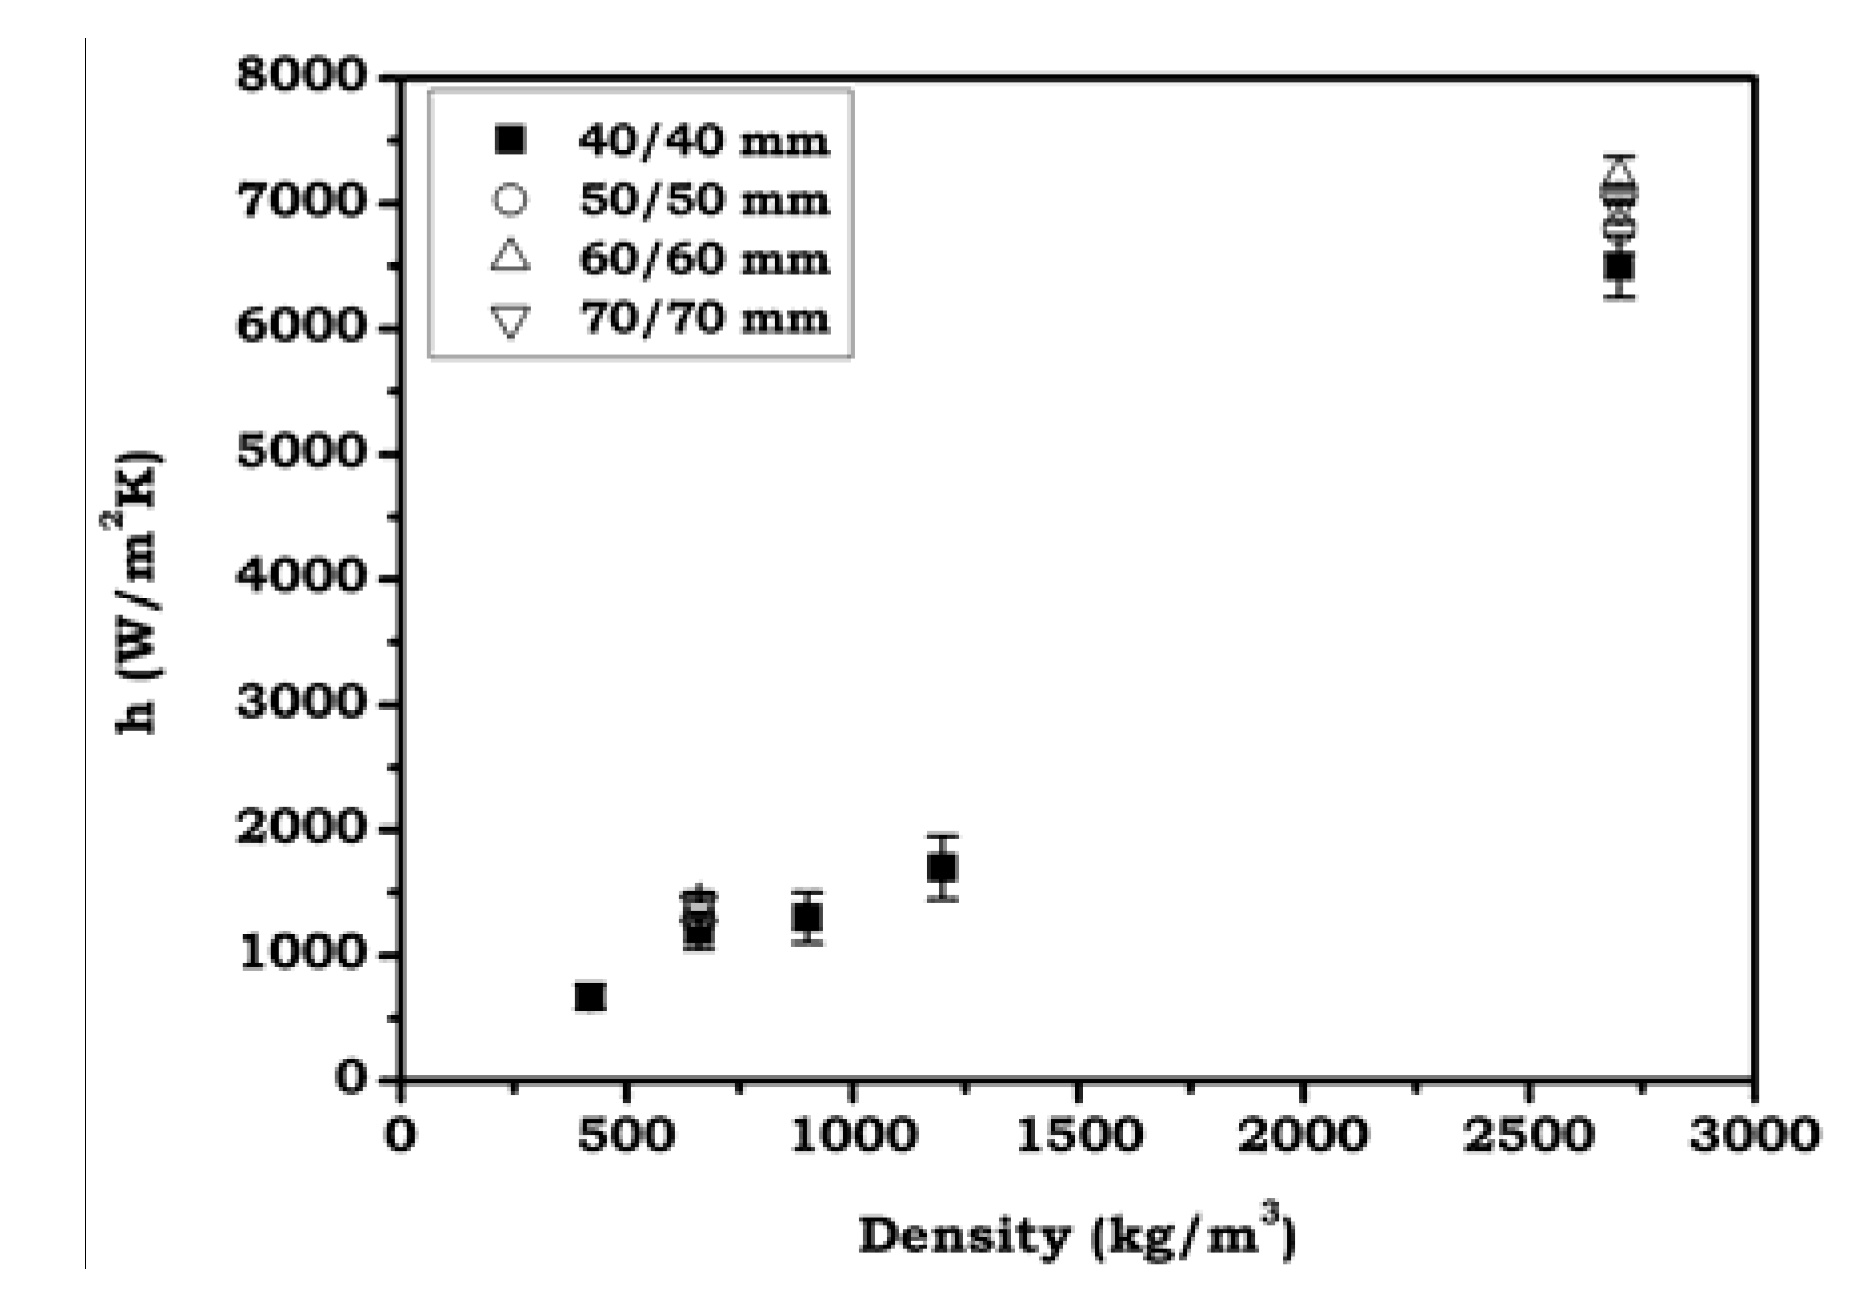
) with the external medium, at a certain temperature Text, takes place via a combination of different mechanisms that, in practice, are normally represented by an overall heat transfer coefficient, h, as expressed in Equation 4.Values for this parameter are typically in the range of 10–100 W/m2 K for air and between 500–10000 W/m2 K when using water as external medium [28]. Therefore, vales of the four parameters (k, ρ, CP and h) are need for the modeling calculations.
Metals 02 00508 i006
For some simple situations (constant parameters, simple geometries, etc.) exact analytical solutions for the heat transfer equations can be obtained. Nevertheless, considering the fact that foams are not homogenous mediums, the solving method selected was a computational one. The particular approach selected to solve the temperature field and its evolution during the quenching process was the use of Finite Element Method (FEM). This technique has been already used in different problems involving thermal transfer in cellular materials [29,30,31,32] with accurate results. In this investigation FEM software COMSOL Multiphysics linked to MATLAB 6.5 was used to implement the model. As mentioned before, an axial symmetry can be assumed for the particular part shape selected. Therefore the problem can be reduced to a two dimensional one by solving the Equations in cylindrical coordinates (r and z).
The dependence of physical magnitudes—k, ρ, CP—with the position—r, z—needs to be introduced in the model. In this sense, the density distribution inside the foam is described by the analytical polynomial function, ρ(r,z), obtained by the SSDD method. Thermal conductivity was scaled to density according to a relationship found in previous investigations [33,34]. Equation 5 shows this expression where ksolid is the thermal conductivity of the bulk alloy and n is an empirical value between 1 and 1.6. In this work a value for the exponent n = 1.26 has been selected in accordance with previous results of our group [22].
Metals 02 00508 i007
The specific heat of the foam, CP, was assumed to be identical with that of the bulk alloy since, according to the phases rule, the low mass amount of gas inside the foams (less than 1%) does not alter this value significantly.
Variation of the thermal properties of the bulk alloy in the analyzed temperature range (530–25 °C) was not considered assuming the difficulty of finding in the literature a complete data set in the whole temperature range but also considering that the computational times could increase. Furthermore, the idea of this work was trying to reproduce the temperature evolution inside the foam with a rather simple model. This approximation reduces considerably the computational costs without loosing accuracy in the results. Alternative FEM calculations using constant values for foam density, thermal conductivity and specific heat and independent from coordinates r and z were also done to check and validate the model. Values used in the simulation were ksolid = 180 W/m·K and CP = 896 J/kg [35].
Finally, it was also necessary to assign values for the overall heat transfer coefficient, h, which reflects the surface heat exchange capacity, represented by a constant value in the sample boundaries without any local dependence. Unfortunately this coefficient depends on a great number of parameters, such as the surface morphology of the samples or the properties and conditions of the external fluid. Therefore an exact value cannot be obtained theoretically and semi-empirical indirect methods are needed. An inverse method, namely the Inverse Heat Conduction Problem (IHCP) [36,37], was used to obtain values for this parameter. This method is used to find, by solving the equations iteratively, a convergence value of this unknown parameter. Differences minimization by—least squares—is used to find the convergence value by comparing the simulated cooling curve to the one obtained experimentally in the central part of the sample (temperature variation registered by the thermocouples at the center of the foams). A minimum of 15 iterative FEM simulations were required to obtain convergence values of less than 1% in the least squares residuum.
One of the advantages of using FEM modeling to simulate the temperature drop during quenching is the possibility of obtaining the temperature distribution in the whole sample domain and not only in the center. Therefore, the average quenching rate in the temperature range of interest (400 to 290 °C, critical cooling range) could be calculated for every point inside the sample and the results used to create the so-called critical cooling velocity map (Figure 12).

2.5. Microhardness Tests

Vickers microhardness was measured in different points inside the treated foams in order to evaluate the accomplishment of the thermal treatment. The results were compared with the ones obtained for a non-treated sample of the same size and density. To that end slices representing the central part (z = 0) were cut from each foam and infiltrated in epoxy resin (Specifix 20, Struers, Ballerup, Denmark) in a vacuum system (Epovac, Struers, Ballerup, Denmark) promoting the complete filling of the cut pores with the resin. The embedded samples were finally polished.
A microhardness tester, Carl Zeiss mod. MHO IB, West Germany, was used. The polished surface was divided in different regions drawing lines, which helped to distinguish each area when looking through the microscope. Vickers microhardness was then measured by testing on each zone with a load of 50 g and a loading time of 15 s (HV 0.05/15). All marks were performed following the testing standards [38], assuring enough distance (at least three times the mark size) from the center of the indentations to another’s one or to the edge of the cell wall. To compensate for the typical scatter associated with this kind of measurement at least 10 indentations were performed on each region in order to obtain the complete microhardness profile.

3. Results and Discussion

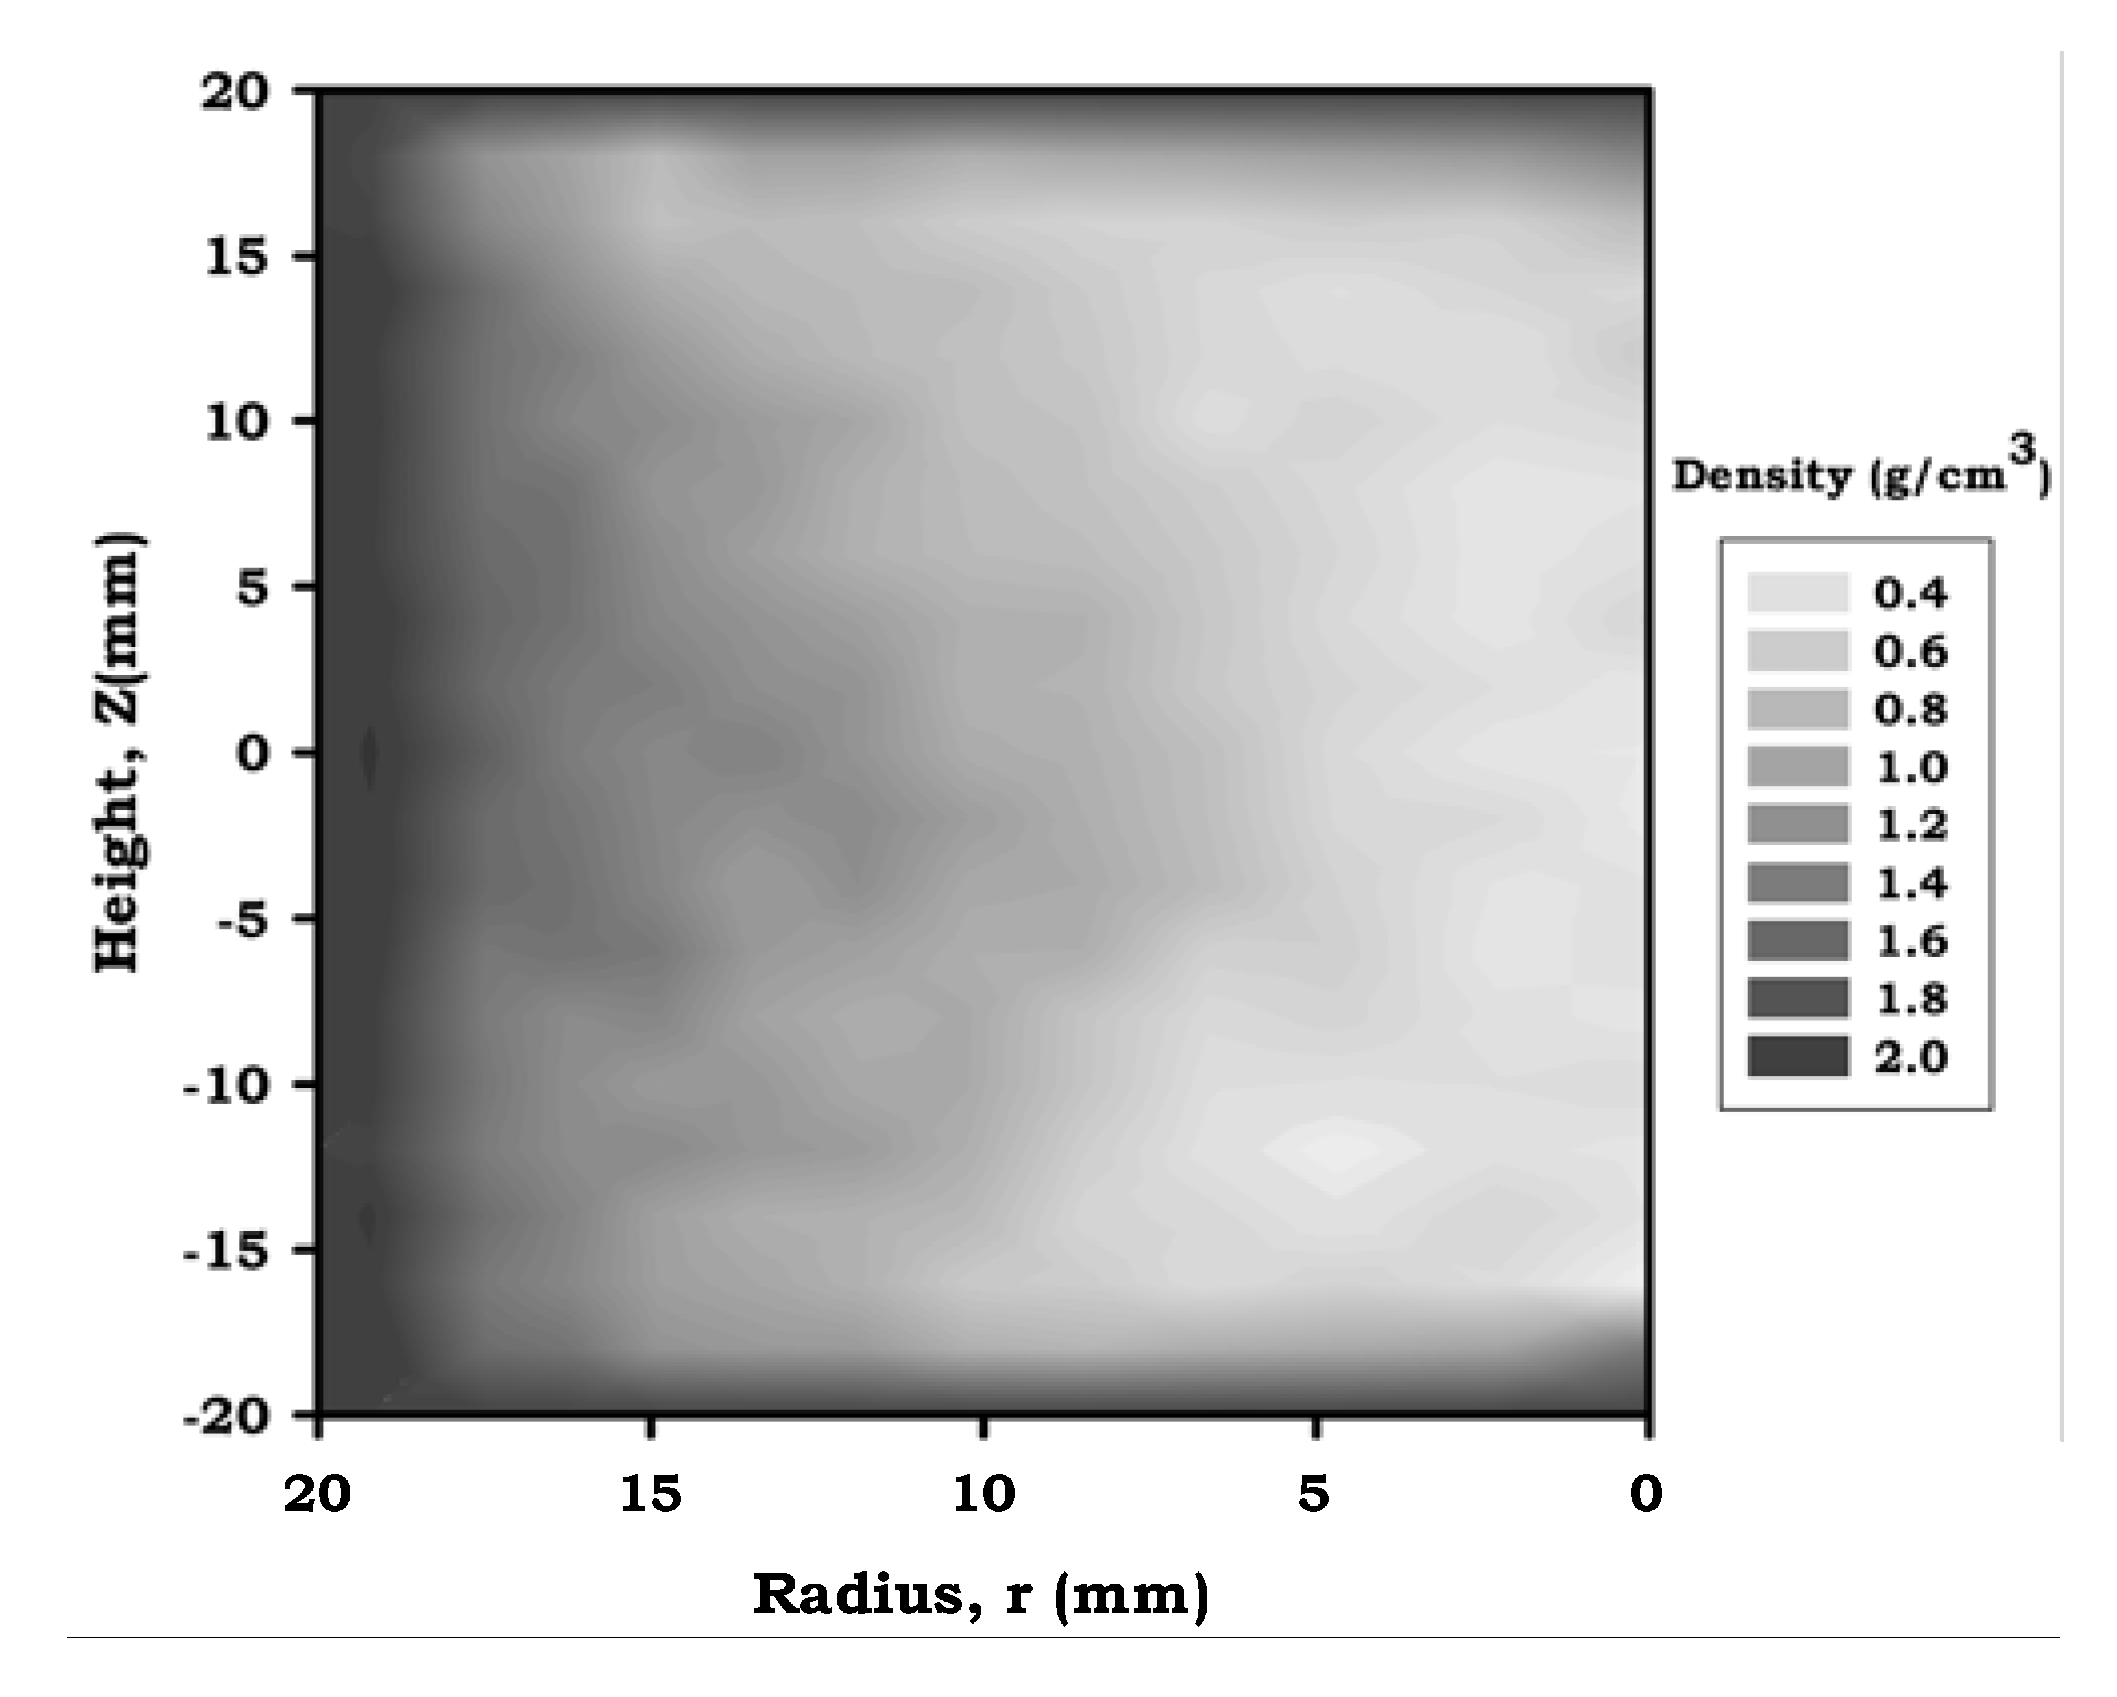
3.1. Cellular Structure and Density Distribution

Visualization of tomography images for one of the studied samples is provided in Figure 4 (Figure 4a: XY-plane slice; Figure 4b: ZX-plane slice) in which it can be observed that resolution is different for the different planes, i.e., voxel size is anisotropic. From both images, it can be appreciated how density is preferably distributed in the surrounding skins. In the XY-plane the density seems to be distributed with a cylindrical symmetry, which justifies the use on incremental width bands in the SSDD method. ZX-plane allows observing that top and bottom part of the foam cylinder also present a higher density. On the other hand, some undesirable defects can also be observed in these images. Some bigger pores appear in some parts of the foams as a consequence of coalescence. Nevertheless local defects are expected to contribute minimally to the calculated radial density distribution.
Figure 4. Tomographic slices of the 70/70 (690 kg/m3) foam: (a) XY-plane and (b) ZX-plane.
Metals 02 00508 g004
Results for the SSDD image analysis method applied to the tomographic slices are plotted as a gray-scale density map in Figure 5 for the 40/40 mm foam of 660 kg/m3. This density map presents a radial symmetry in congruence with the calculation conditions (only the half-diameter is represented). Similar information to the one deduced from the tomography images can be obtained from this three-dimensional density representation, although in this case it is direct quantitative information. It can be confirmed that the highest density is found in the outer parts of the foams skin. It reaches a value near 2 g/cm3, below the bulk alloy density, which suggests the presence of significant microporosity in the skin. A strong density gradient can be found in the transition from the skin to the center, with density becoming nearly constant in the central part of the foam.
Figure 5. Density maps obtained by the SSDD method for the 40/40 mm sample with bulk densities 660 kg/m3.
Metals 02 00508 g005
As it is explained in the experimental section, the foam density data was fitted to a continuous parabolic function (see Equation 2) by using Mathematica software. The best results were obtained when A(z), B(z) and C(z) were expressed as fourth-degree polynomials. The R-square parameter was in all cases better than 0.9. This two-coordinate dependant function represents finely both global and local density within the sample. Nonetheless a more precise idea of the effectiveness of these mathematical functions was obtained by simply integrating the density function over the whole sample volume and later dividing by the external volume in each case obtaining the bulk computed density. Table 2 compares the experimental and the computed data. An error below 8% was obtained for all the analyzed materials.
Table 2. Comparison for bulk and integrated density from the functional fittings.
Diameter/Height (mm/mm)Experimental density (kg·m−3)Computed density (kg·m−3)Percentage difference (%)
40/40420450+7.1
40/40660690+4.5
40/40900840−6.7
40/4012001120−6.7
50/50670720+7.5
60/60650700+7.7
70/70690670−2.9

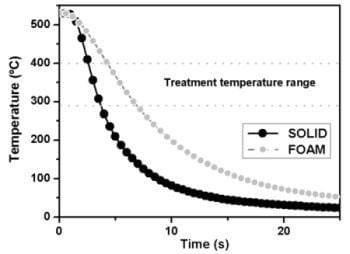
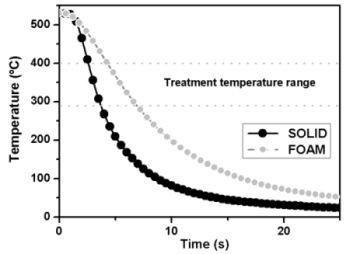
3.2. Temperature Evolution During the Quenching Process

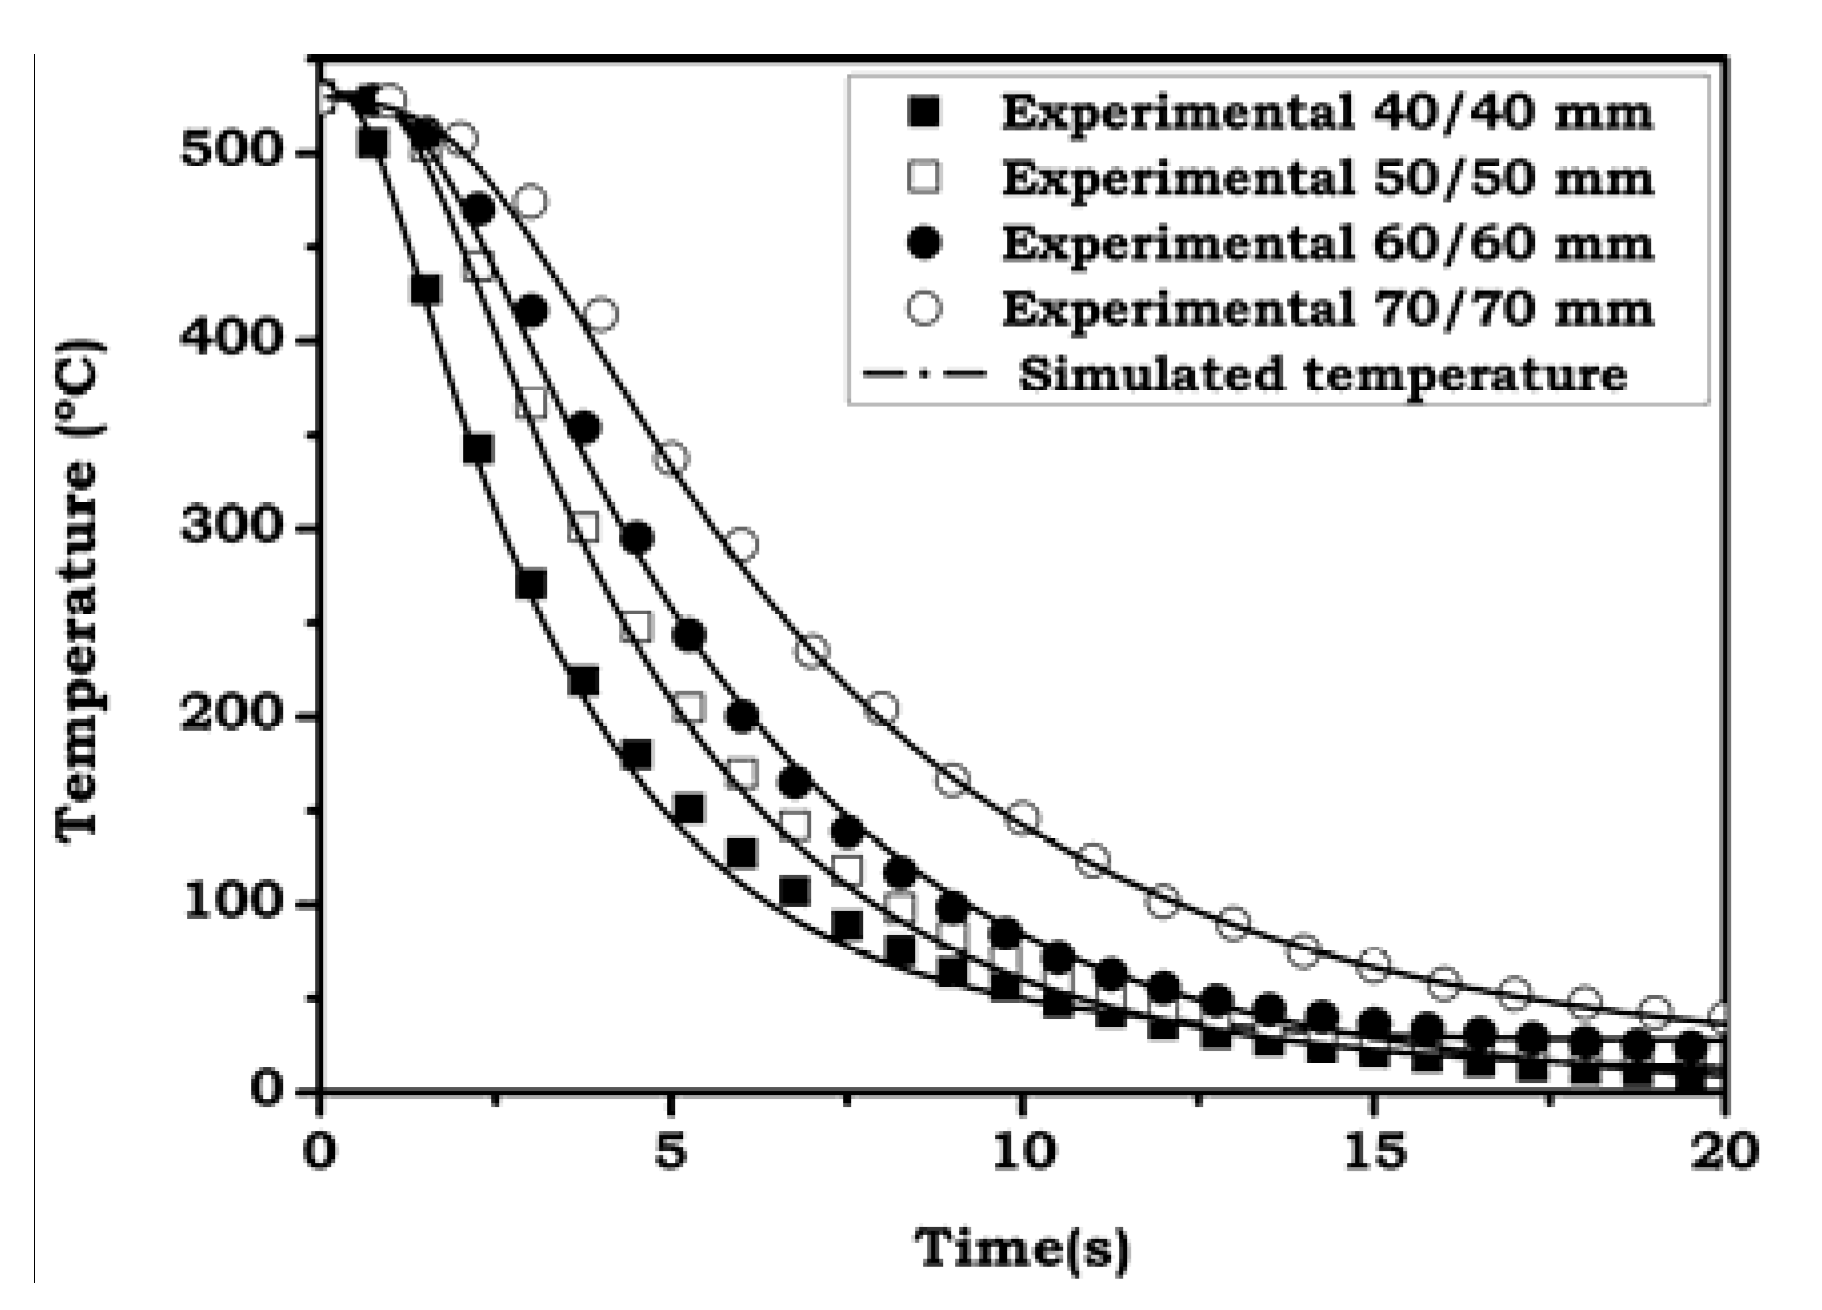
3.2.1. Solid Cylinders

Experimental values for the temperature evolution registered during quenching in the central point of the solid cylinders are presented in Figure 6a. In all of them a quasi-exponential decay behavior can be observed. As expected, the center of the 70/70 mm sample needs a longer time to cool down in comparison with the 40/40 mm one. In addition, it seems clear that the method employed to seal the holes and avoid water ingression in the sample worked well. The presence of water in the surroundings of the thermocouple would have caused a sudden temperature drop as has been reported by Lehmhus et al. [16].
On the other hand, the time evolution for the cooling velocities of the different samples is showed in Figure 6b. In this Figure, the numerical derivative of the experimental data, i.e., instantaneous cooling rate (dT/dt) has been plotted as a function of temperature. This type of representation is more adequate to appreciate the changes during cooling and the differences between samples and for this reason has been also used to present the experimental results for the foamed cylinders (Figure 7). In addition, the so-called “critical temperature range”, from 400 to 290 °C, is marked in both graphs.
Figure 6. Quenching curves for the solid samples: (a) Registered temperature variation; (b) Instantaneous cooling rate versus temperature.
Metals 02 00508 g006

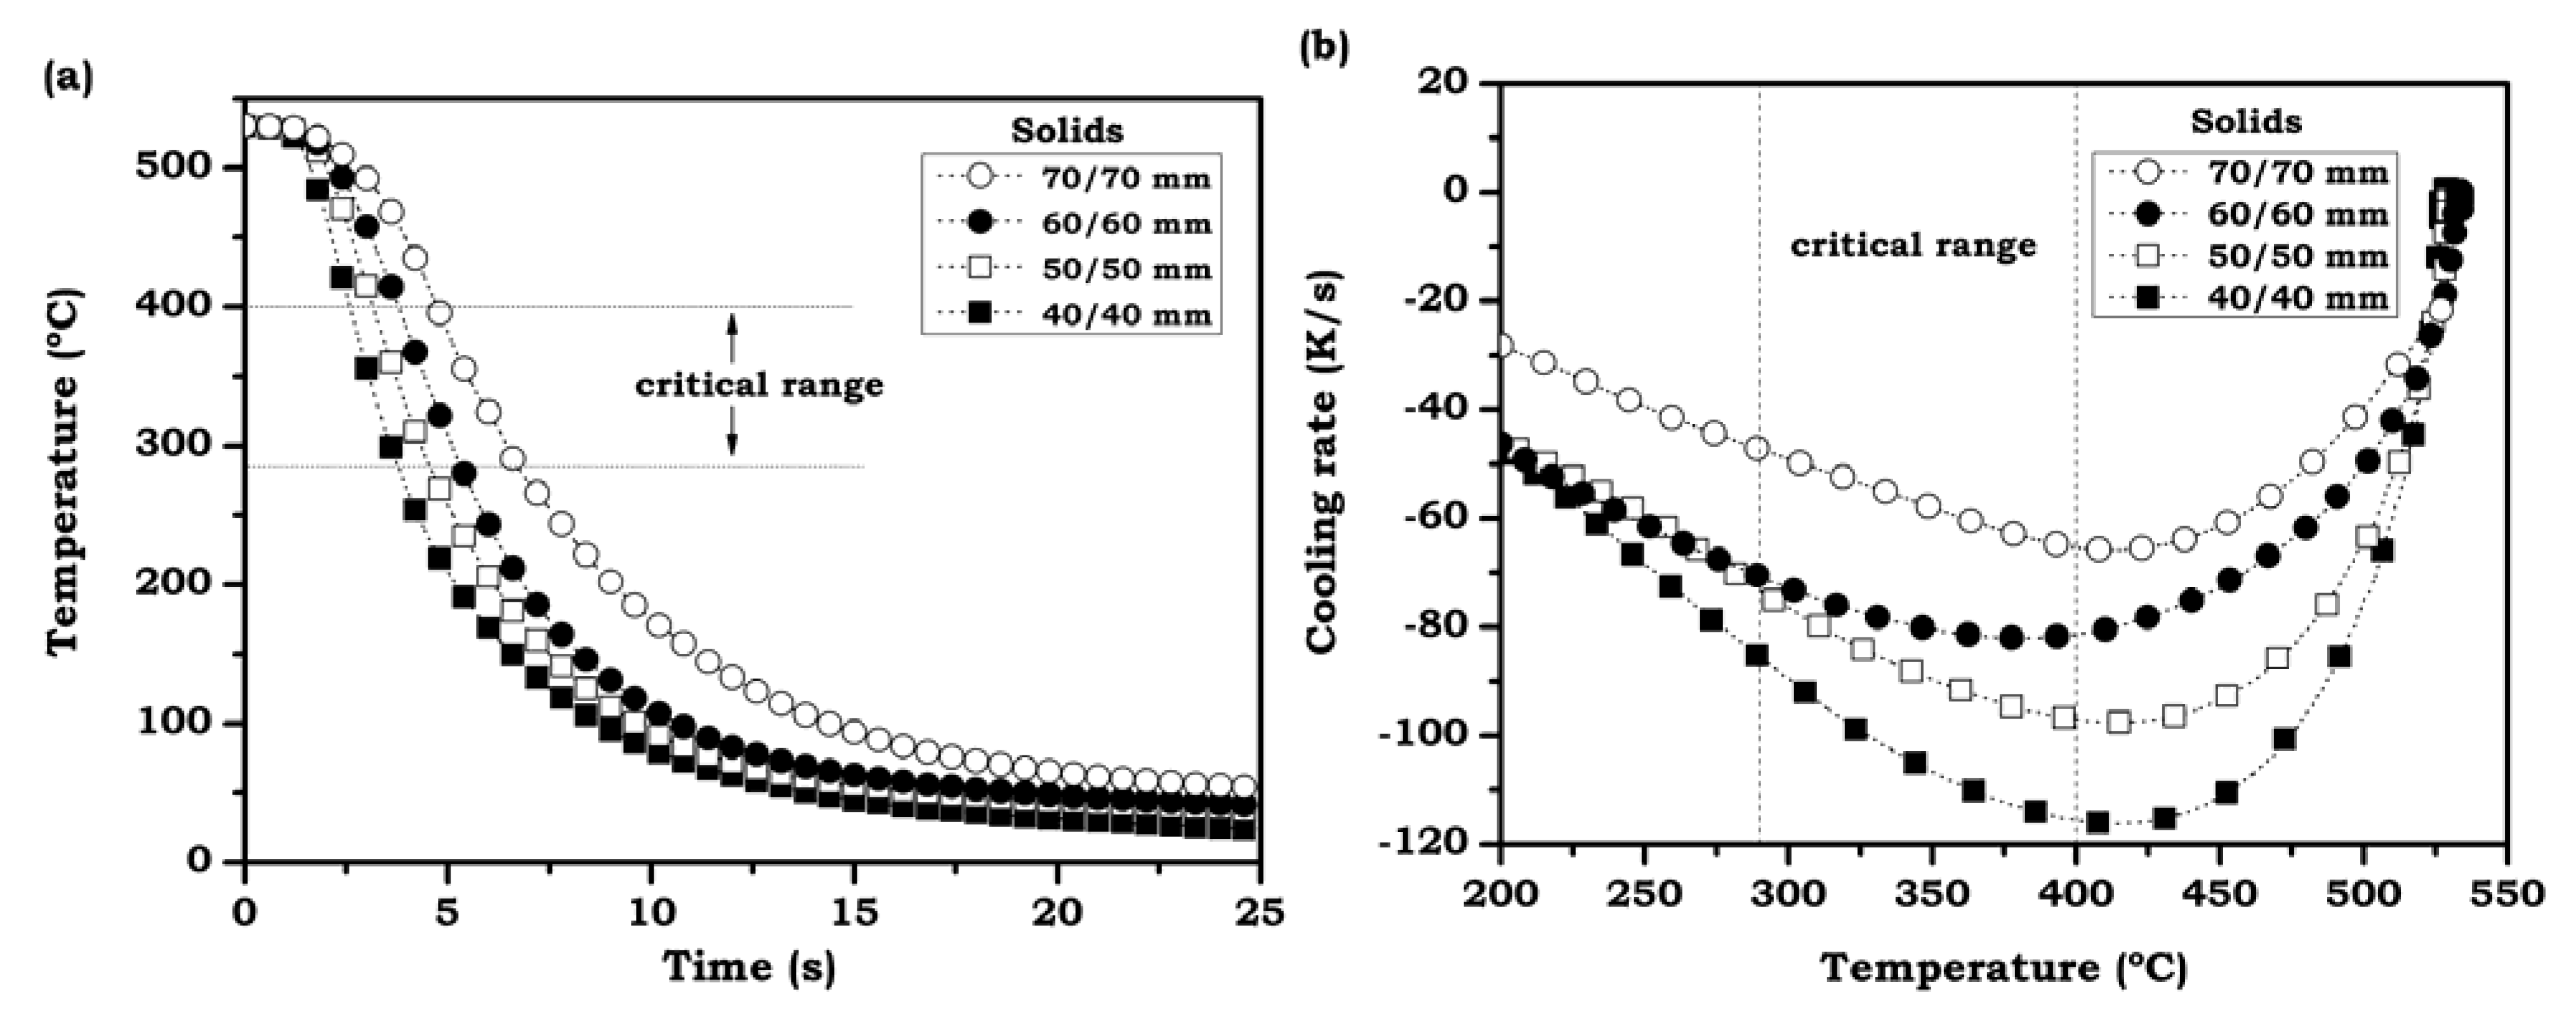
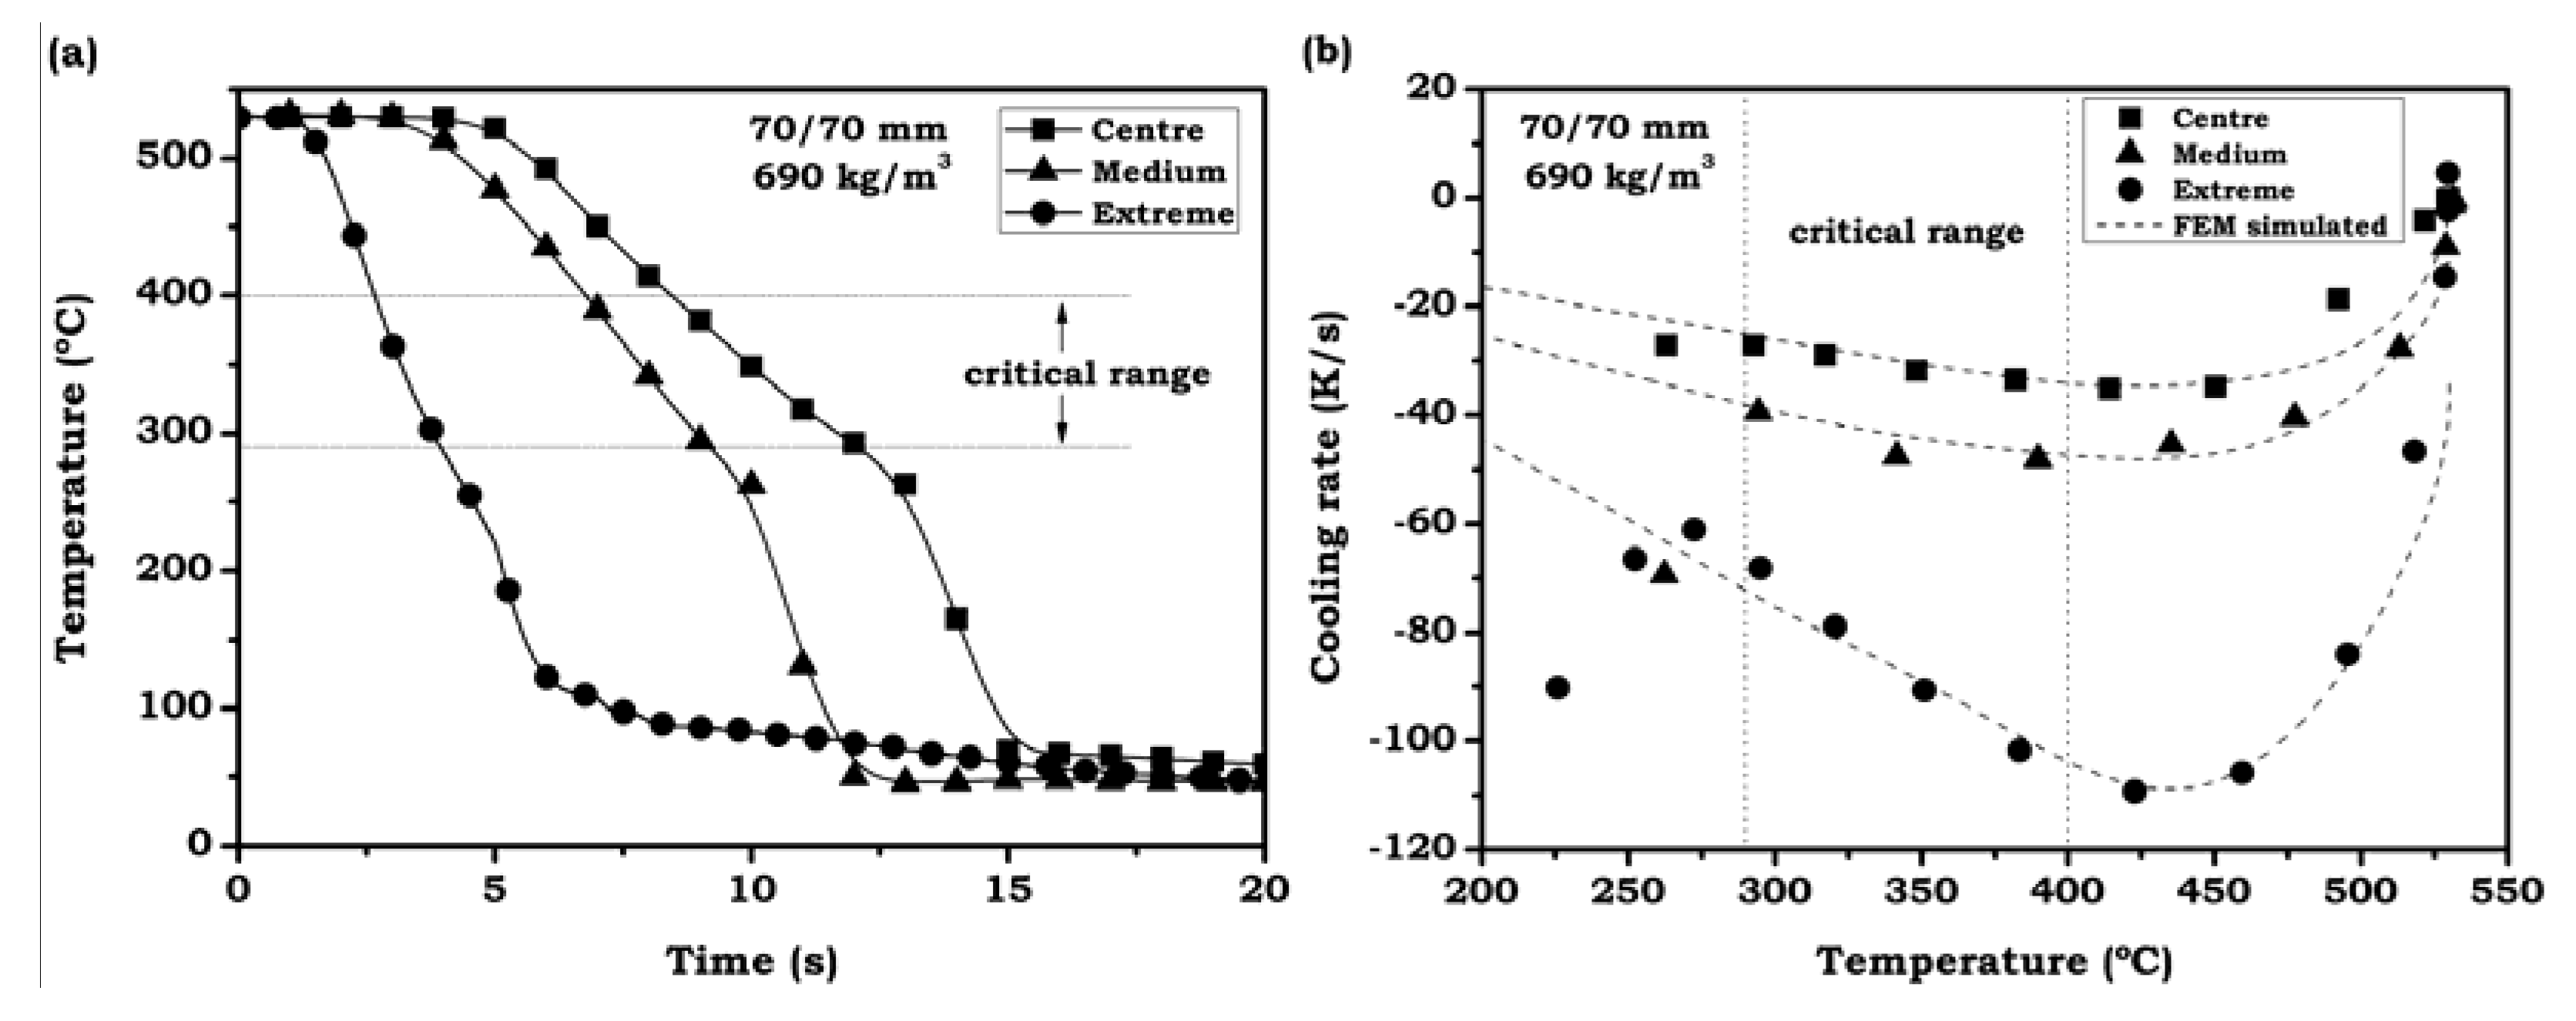
3.2.2. Foamed Cylinders

The results corresponding to foams of a similar density (approx. 650 kg/m3) and different sizes are displayed in Figure 7a. The comparison of these curves with the ones obtained for solids (Figure 6b) demonstrates that the cooling rate is much lower in the case of foamed aluminum. This effect is mostly associated to the lower thermal conductivity of foams. Clearer evidence on the effect of density on the thermal conductivity of this type of materials is shown in Figure 7b, where the cooling rates for the samples of same size (40/40 mm) and different densities have been plotted. As expected, an increase of density in samples produces a faster cooling.
On the other hand, and contrarily to the results for solid samples, it can be appreciated that some of the curves present a sudden cooling rate modification at temperatures below 290 °C which can be associated to water penetration. This will be discussed in more detail in section 3.2.4.
Figure 7. Quenching curves obtained for foam samples: (a) Effect of sample size (ρ = 650 kg/m3). (b) Effect of density (size 40/40 mm).
Metals 02 00508 g007

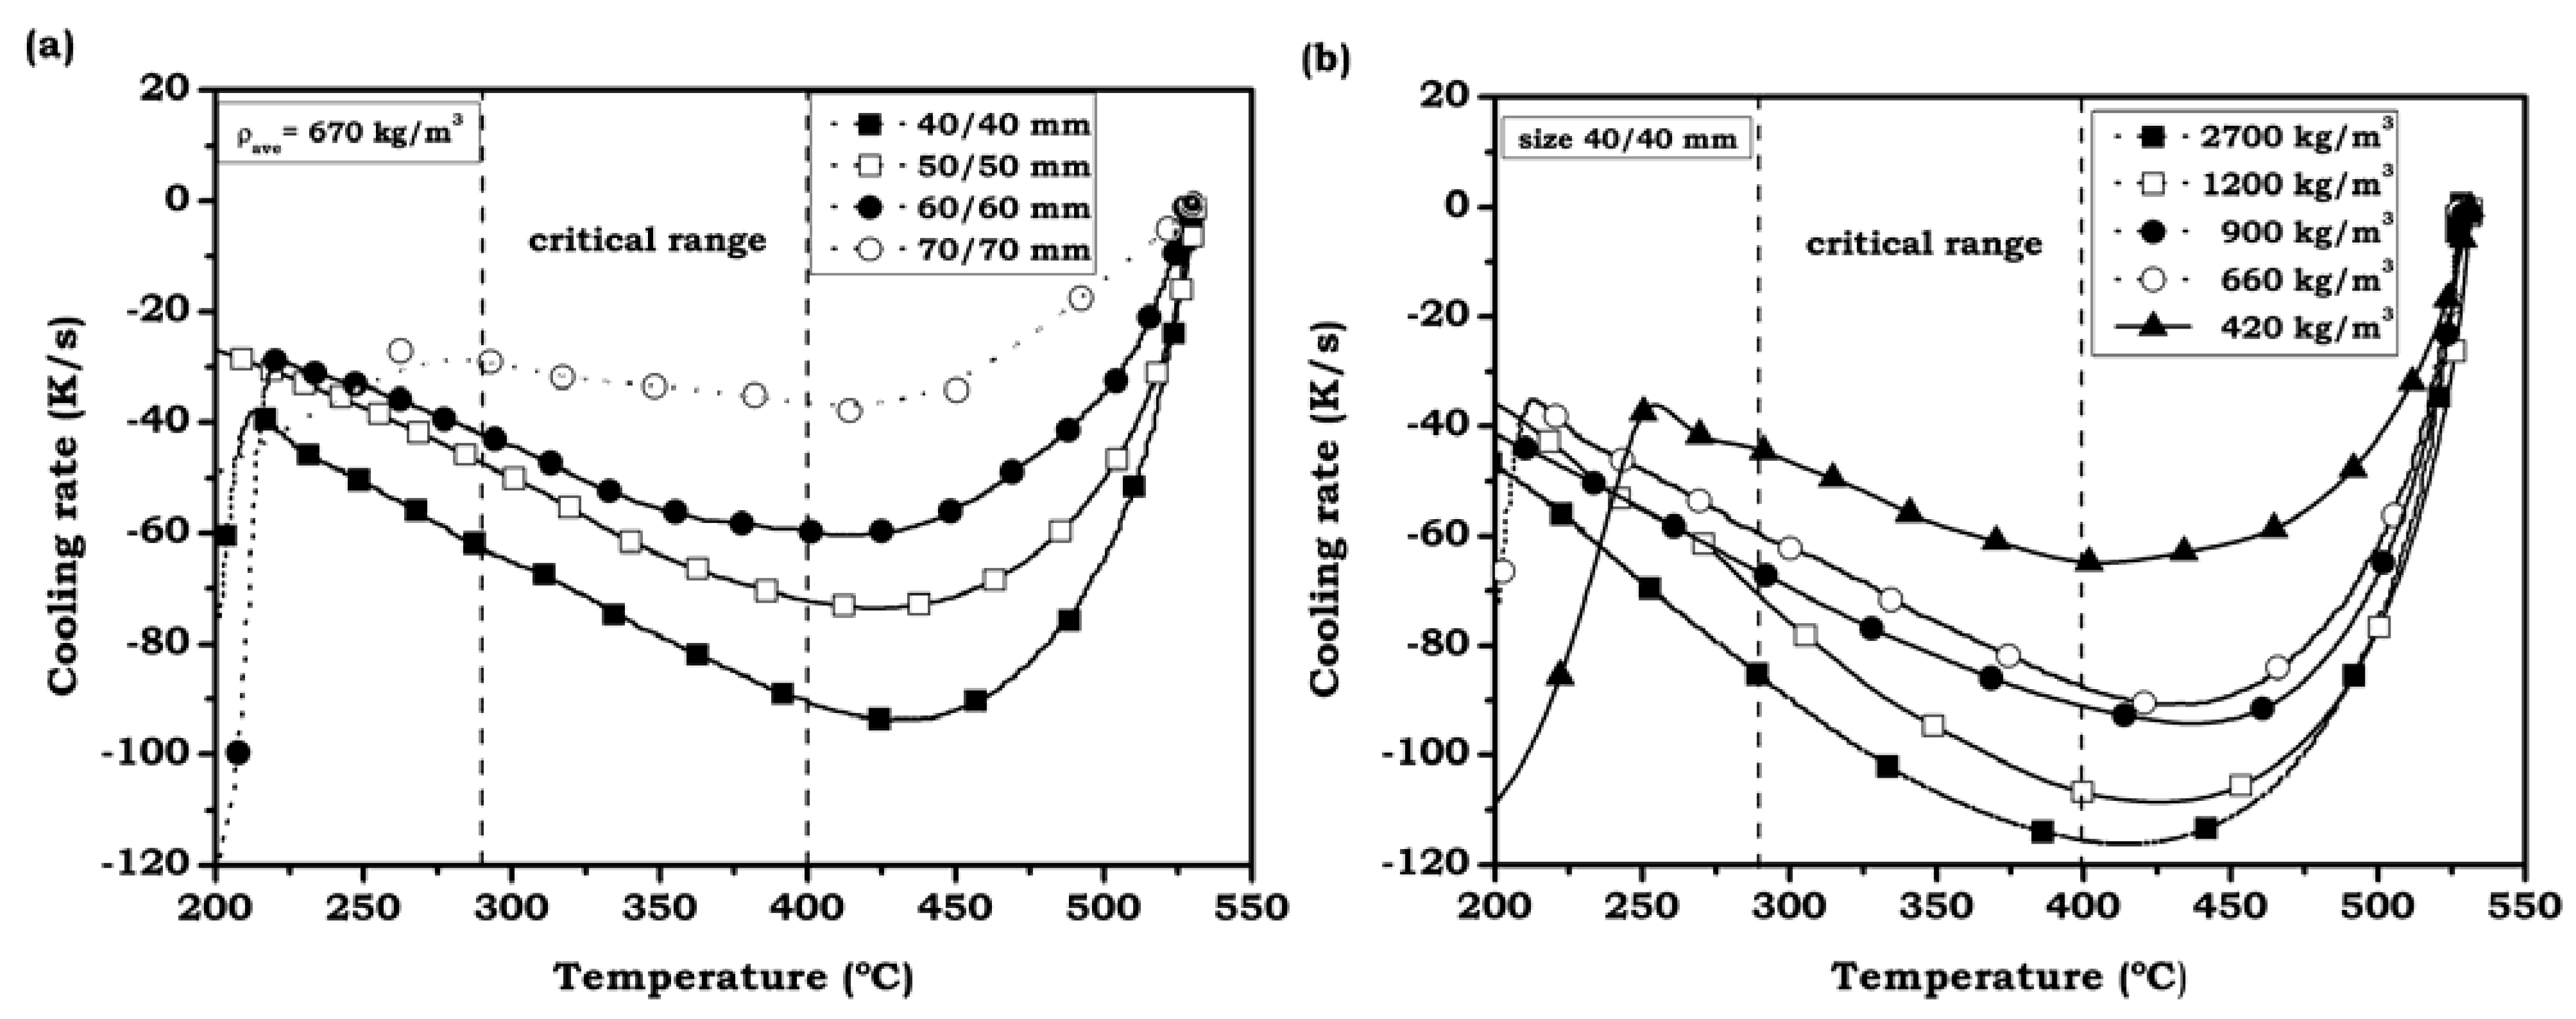
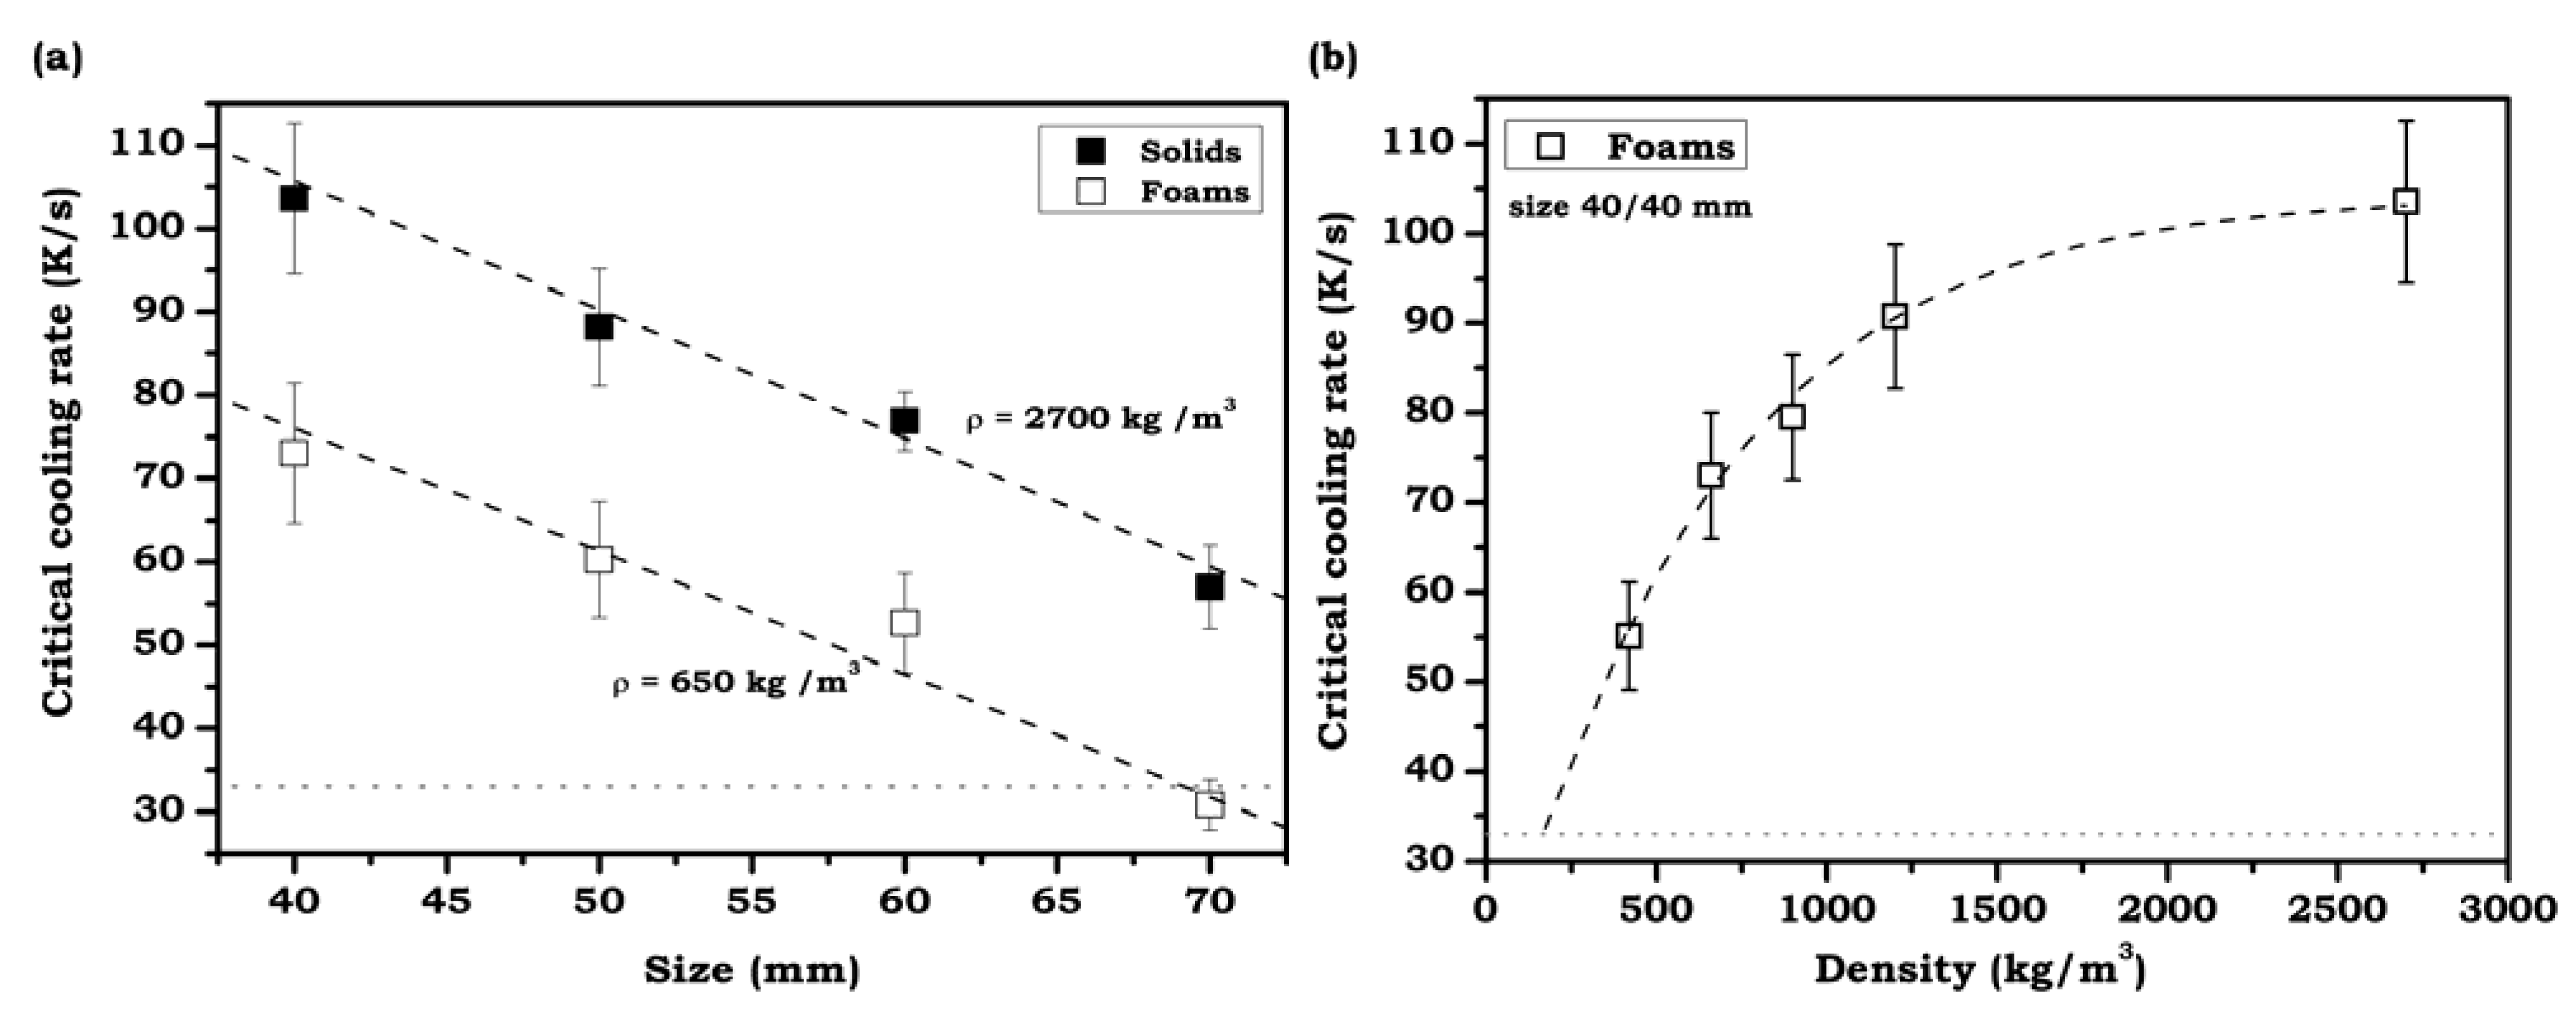
3.2.3. Average Cooling Velocities in the Critical Range

From the experimental data shown in Figure 6 and Figure 7 it is also possible to calculate the average cooling velocity in the temperate range of interest at the geometrical center. The results obtained for the foams of medium density (approx. 650 kg/m3) are presented in Figure 8a, together with the values for the solid cylinders of the same sizes. It can be appreciated that the mentioned cooling rate of 33 K/s (see section 2.3) is achieved for all the solid and foamed specimens with the exception of the biggest foam (70/70 mm).
Figure 8. Average cooling rate during the critical range: (a) Effect of size on solid samples and foams (ρ = 650 kg/m3). (b) Effect of density on 40/40 mm samples.
Metals 02 00508 g008
The linear trend plotted in the graph shows that this cooling rate, at the center, can only be reached for foams smaller than 68/68 mm. In a similar way the solid cylinders meet a size limit around 86/86 mm. This means in practice a reduction of about 20% in the specimen dimensions (approximately 175 vol.%) when comparing solids and foams of a certain density (650 kg/m3).
On the other hand, the values of critical cooling velocities for samples of a fixed size (40 mm) and different density (Figure 8b) fit quite well to an exponential curve. Extrapolation of the curve suggests a value of 190 kg/m3 as the minimum density satisfying the hardening condition in the 40/40 mm sample. This density is below the minimum achievable density in foams produced via the PM route.
If we had considered foams based on other alloys such as the AA6061, with a critical cooling rate of 100 K/s, these limits would have changed significantly. Thus, medium density foams (650 kg/m3) would have met the maximum size limit at 25/25 mm while hardening conditions would have been satisfied only at densities over 1900 kg /m3 for a size of 40/40 mm.

3.2.4. Water Ingression Inside the Foams

Based on the experimental evidence gathered during the quenching process (sudden cooling velocity increase in Figure 7) it was assumed that the sealing system did not work perfectly in foamed cylinders. However, the repeatability of the measured curves (including the temperature drops at a similar instant), the fact that some samples did not show signs of water entrance, and the realization of complementary experiments in which foams were only partially immersed -keeping the sealing system out of the water, but also still showed a temperature drop-, pointed to the fact that sealing systems worked well and there exists a different mechanism enabling water ingression into the porous structure.
The time spent from the quenching start till the moment water touches the thermocouple suggests the idea of a gradual water ingression into the foam. This way, the process first involves a penetration through the -known- skin defects [19], followed by a progressive infiltration (see Figure 11a) into the inner parts trough the cell cracks, quite abundant in this particular type of foams [5]. Collaterally, this phenomenon is empowered by the suction effect produced by the sudden temperature reduction of the air inside the cells (gas contraction reaching a pressure below the atmospheric one) that forces the outer water, when the sample is completely immersed [16] to penetrate into the cellular structure.
Under these circumstances we can assume that this phenomenon is intrinsically associated to the foam structure, which in other words means that water infiltration is an active process occurring during water quenching in any aluminum foam. The finite element methodological treatment of such process would involve a much more complex treatment with non-fixed boundaries and unknown temporal evolution of such boundaries. Nevertheless, the effect of water ingression seems to be well reflected by the introduction of an effective value of the heat transfer coefficient, h, during the cooling process, derived from the assumptions done in the modeling and imposed by the methodology employed. The successive quenchings exhibit a high repeatability, which confirms the validity of the methodology adopted. The only limit of the methodology is the impossibility of predicting the temperature drop which occurred at the moment water gets in contact with the thermocouple and the temperature evolution at instants immediately before.

3.3. FEM Simulation

3.3.1. Solid Cylinders Verification

FEM simulation in solid cylinders was accomplished with the objective of demonstrating the validity of the model assumptions explained in section 2.4. Particularly, the assumption for the temperature dependence of the thermal parameters seems to be valid according to the results shown in Figure 9. In this figure it is possible to observe a good agreement between the experimental and the simulated cooling curves. Agreement in the critical temperature range is particularly good.
Figure 9. Predicted cooling curves and experimental ones obtained for solid cylinders of different dimensions.
Metals 02 00508 g009

3.3.2. Heat Transfer Coefficients

The overall heat transfer coefficient (h) of each process/material was obtained after applying the Inverse Heat Conduction Problem (IHCP) method [36,37] (see experimental section) over the registered experimental data at the central point of the samples. The calculated convergence values are displayed in Figure 10. Although the quenchings were done always under the same conditions (immersion in calm water at the same temperature) value obtained for the coefficient was clearly not the same for 3 repeated tests. Error bars account for the standard deviation of the three calculated values by the IHCP method in the three different tests.
Figure 10. Predicted heat transfer coefficient obtained using the IHCP method over the experimental data.
Metals 02 00508 g010
For specimens of similar density (solids and foams of density 650 kg/m3) the slight variation of the calculated h with size can be associated to the little variations in the cooling process (manual procedure) and variations in the surface of the samples (rugosity and defects). No clear trend with the size of the specimen was found, as had been expected from the theoretical point of view since the heat transfer coefficient is normalized to the sample surface.
On the other hand the unexpected high variation of the calculated coefficient h with the density of the sample could be understood in terms of two different aspects. One is the obvious lower thermal conductivity (and thermal diffusivity) of foams, which can explain, in part, this effect. This way the heat flux inside the specimen is slowed down and, as a consequence, the heat flux through the surface to the external medium is also reduced.
A collateral effect that contributes to explaining the observed decrease of h is derived from the water ingression into the foam during quenching. As already mentioned, water permeation takes place through the known cracks in the cell walls. Considering that the amount of such defects increases with reduced density (thinner cell walls) a faster cooling would be expected, as a first approach, in the lighter specimens. However this is not the observed tendency. The reason is that the small size of the cracks impedes the movement of water, thus reducing water convection and heat exchange due to water mass replacement. Furthermore, inside the foam cavities some vapour might be generated, further reducing the contact and the heat exchange. This means, in practice, that the boundary conditions are completely different in solids and foams. Furthermore, this effect is empowered by the altered thermal properties of foamed aluminum.

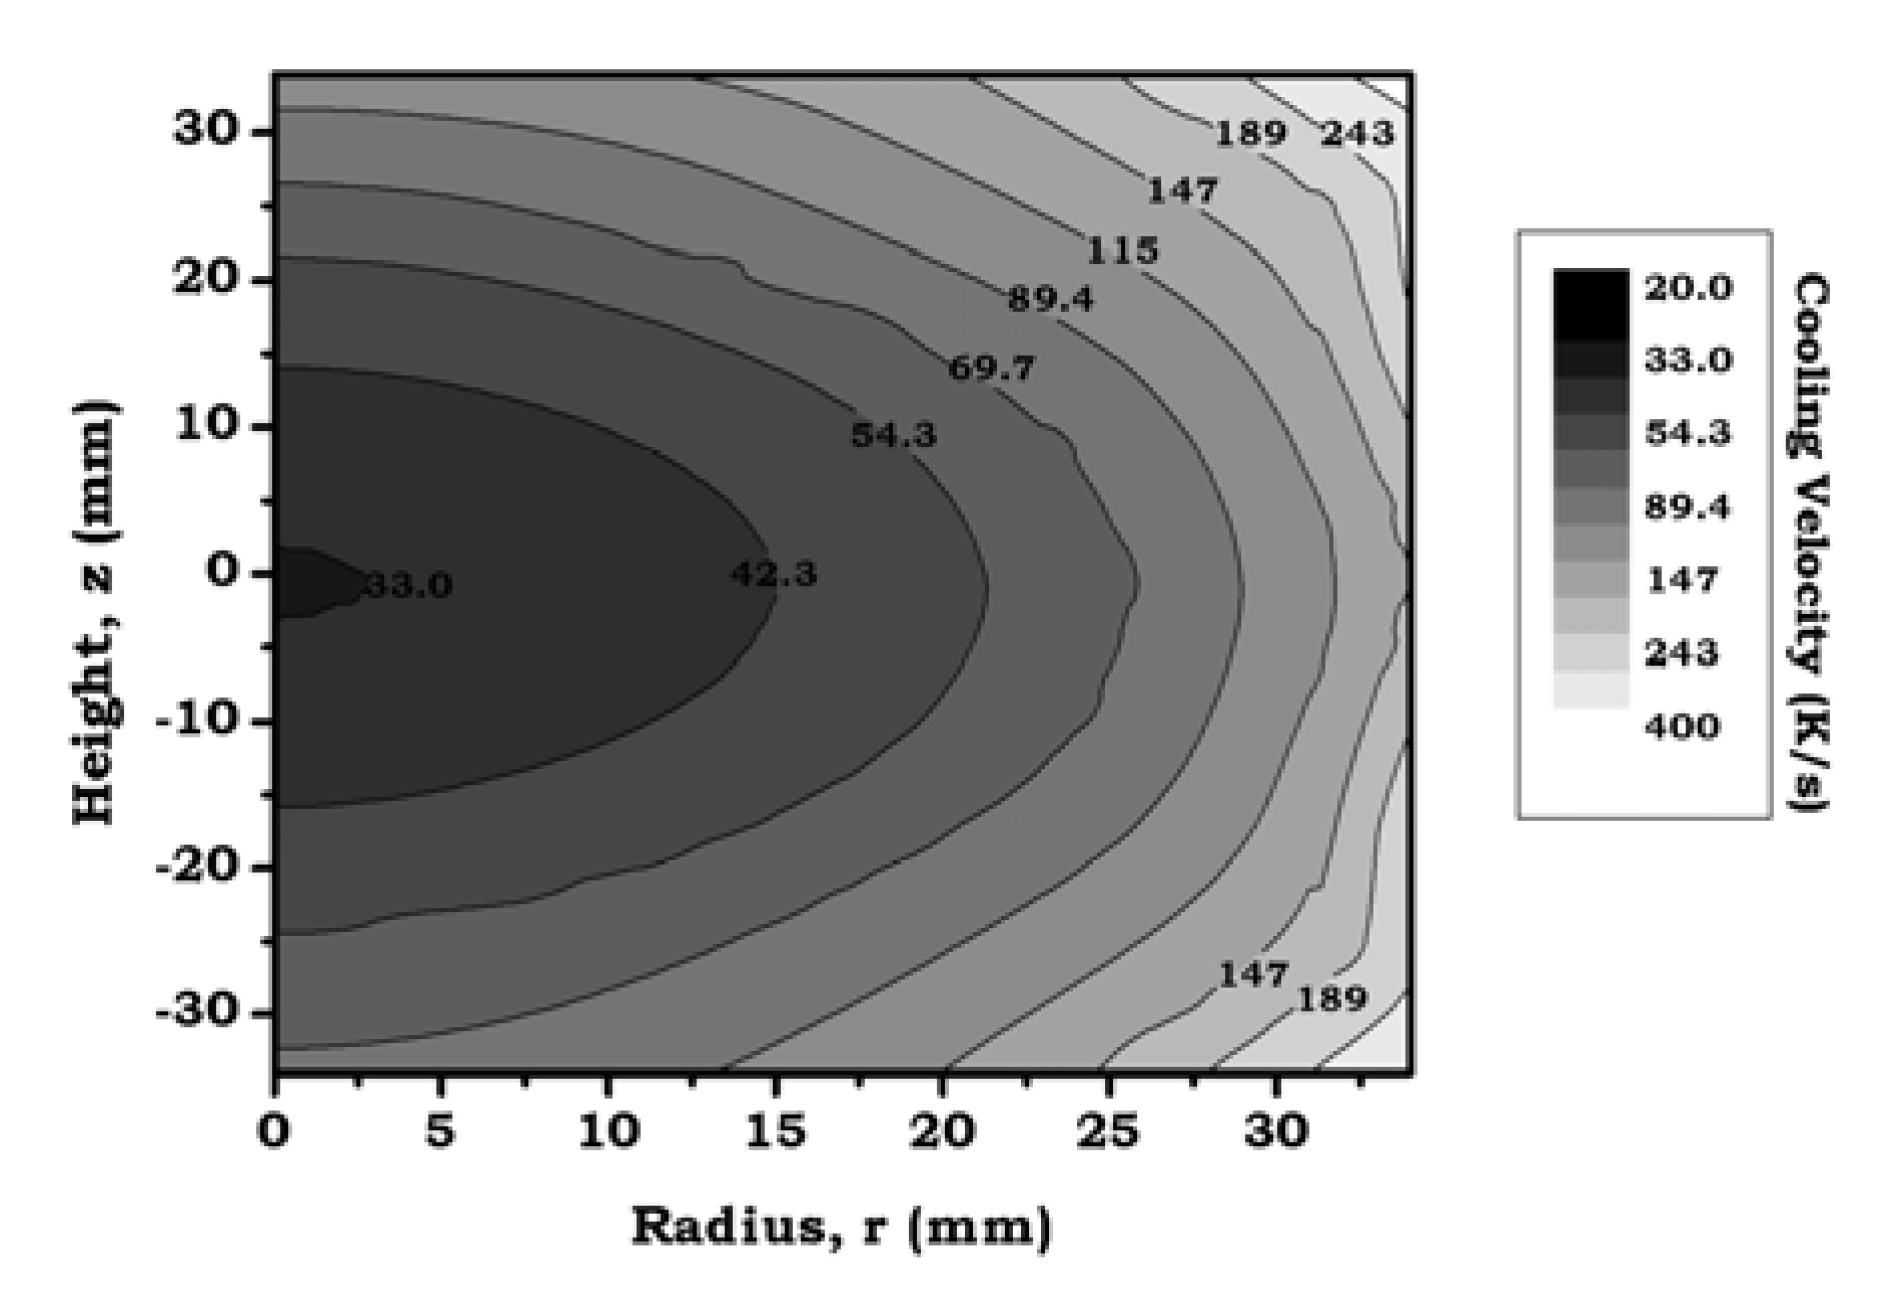
3.3.3. Temperature Distribution and Temporal Evolution

From the calculated heat transfer coefficient and using the FEM model that considers the real foam density distribution and the density scaling of the thermal constants, it is possible to reproduce the cooling rates not only at the center but at other different points inside the samples as was done experimentally on sample 70/70 mm, with three thermocouples at different positions (see Figure 3). The experimental results (Figure 11a) show the effects of distance to skin and density distribution. The point closer to the skin, where density is higher, experienced a stronger temperature variation. Moreover, the water reaches this point earlier, thus contributing to higher local cooling rates. The two other points suffer a smoother temperature evolution and water ingression is later appreciated.
Figure 11b shows a comparison between the simulated and the experimental results for the three studied points inside the 70/70 mm foam. It underlines that the temperature gradient in between the two central points (with a similar value of density) is rather small.
Good agreement between the simulated and the experimental results is found. The FEM model developed was able to satisfactorily reproduce the experimental data in points out of the center by using the exact density distribution model. This result validates the use of this model to reproduce the thermal distribution of aluminum foams. The model compliance is particularly good in the critical temperature range whereas seems to present some problems in reproducing temperature profiles at initial stages and below the critical temperature range. Mismatch at high temperatures could be associated to the approximation of having constant thermal properties during the whole process, while the deviation at lower temperatures after the critical temperature range might be associated to water intake, not directly reflected in the model, causing deviations not only in the moment the water reaches the test point but also a certain time before.
Figure 11. (a) Experimental cooling profiles at three different points inside the 70/70 mm foam. (b) Experimental data (points) and simulated cooling curves (dash lines) versus temperature.
Metals 02 00508 g011
On the other hand, the importance of knowing previously the density distribution inside the foam was found to be critical to reproduce the results with high accuracy in the whole temperature range. Several compared simulations assuming a constant bulk density profile, and using the previous h obtained by IHCP, reveal a low deviation for the temperature at the center (less than 5% in average) but a much higher mismatch in the temperature profiles of the other two points nearer the skin.
Thus, simulation results can reproduce not only the temperature variation in the 3 particular points where the thermocouples were placed, but in the whole sample. In that way, once the FEM method was validated, the results obtained for the rest of the points inside the foam where used to calculate the cooling velocity map within the range from 400 to 290 °C as it can be visualized in Figure 12. In that plot it can be observed that extremely high cooling rates are expected to be found in the outer parts near the skin while moderate cooling rates are reached in the central points, i.e. the sample presents huge temperature gradients during the cooling process, especially in the external parts. The darker area in the left represents the foam region, which did not satisfy the limit of 33 K/s. The hardening process in this region is expected to be less effective because the treatment fail to meet the requirements. Next section provides further data based on the calculations obtained and plotted in this map.
Figure 12. Cooling velocities map for the 70/70 mm foam sample.
Metals 02 00508 g012

3.3.4. Treatability

Finally, it has been possible to extend the predictions, using the simplest simulation model, to any foam density and size. To this end, the map shown in Figure 13 has been created. In this “treatment map” the expected minimum cooling velocity (central point) calculated in the critical temperature range has been plotted for aluminum foams with densities in a very wide range and for sizes up to 100/100 mm. It can be observed that treatment for samples bigger than 70/70 mm suffer from severe deficiencies since cooling velocity in the center drops dramatically. Nevertheless, this does not high volume percentage of untreated material. Utility of such kind of predictions (untreated volume percentage) would be valuable but necessarily needs the information on density gradient and, thus, it can only be obtained after complementary characterization. For that reason the predictions for larger and smaller samples have not been included.
Figure 13. Predicted cooling velocity (in the critical temperature range), at central point, for cylinders of different size and density.
Metals 02 00508 g013

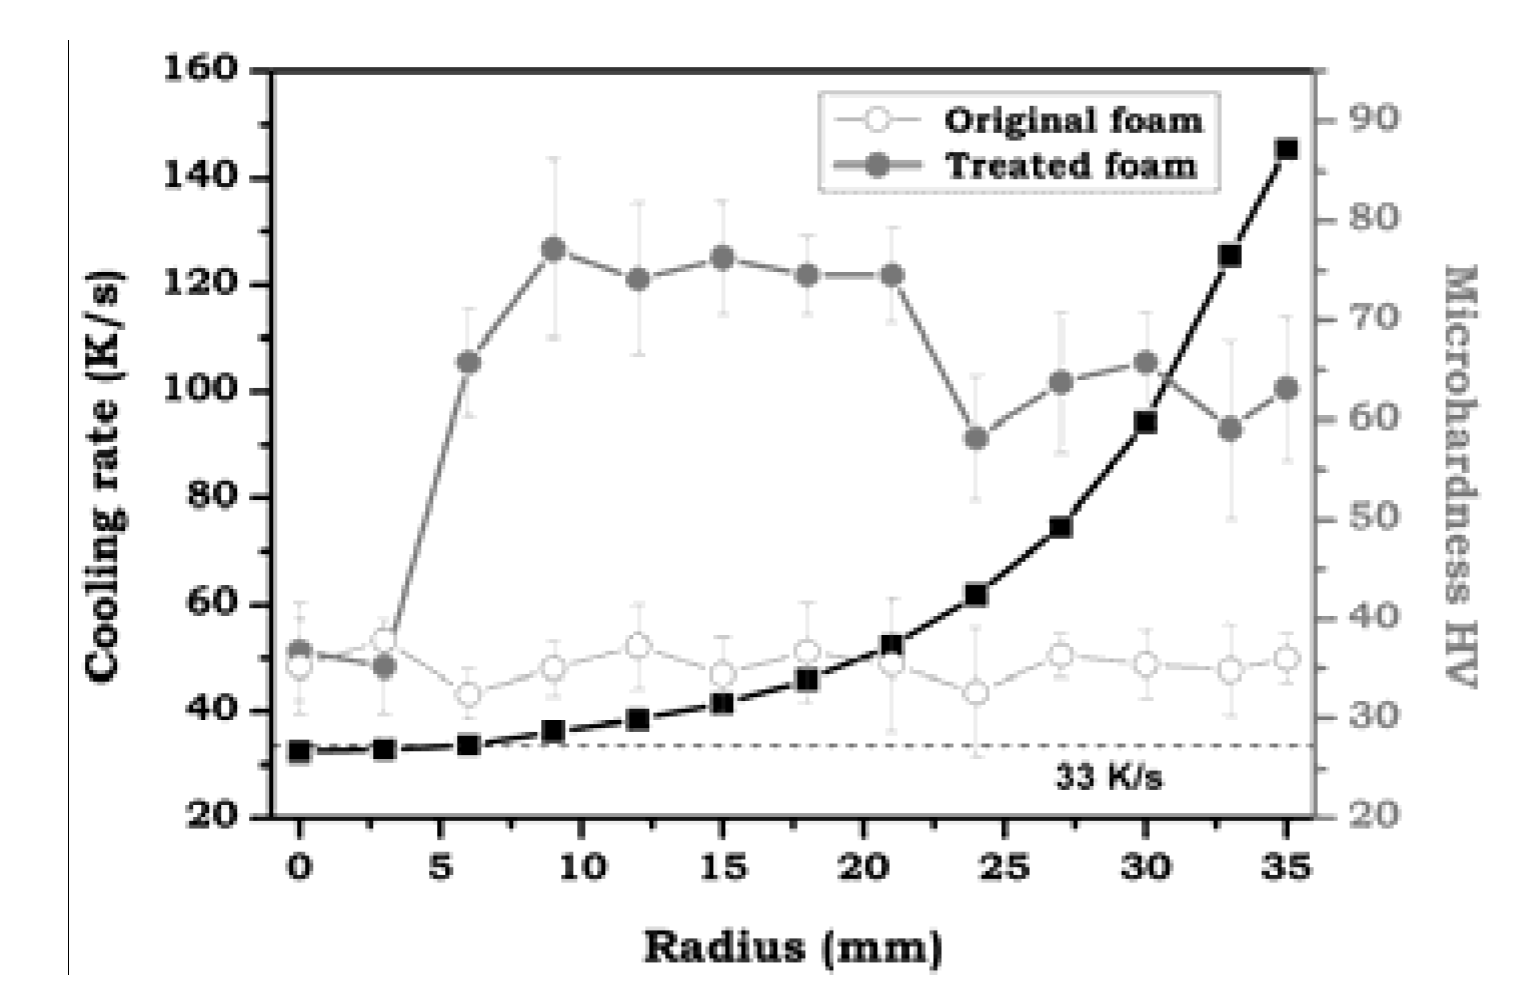
3.4. Microhardness Measurements

The comparison between the microhardness profiles for the treated and the untreated samples showed interesting results. In case of the 50/50 mm sample the microhardness value was approximately double the initial one obtained for untreated samples within the whole sample region. Nevertheless the results for the bigger foam (70/70 mm) revealed that treatment was not satisfactorily complete in the whole sample. Figure 14 shows the microhardness profiles for both the treated and the untreated foams (70/70 mm) with the same density and geometry. The simulated quenching rate (calculated in the range 400 to 290 °C), in the region z = 0, has also been represented to better visualize of the relationship between both types of data. Results indicate the treatment has been satisfactorily accomplished in most of the sample up to nearly 5 mm from the center. In that central region the microhardness values are similar to the ones corresponding to the untreated sample. The highest values of microhardness are found in the middle radius, between 9 mm and 24 mm. In this part the cooling rate (within the 400–290 °C range) is between 35 and 65 K/s. The outer parts of the sample, which have suffered the highest quenching rates, present a small decrease on the microhardness values, although they are still significantly higher than the ones for the untreated foam.
Thus, the correlation of microhardness with quenching rates from simulation is clear. In the regions in which the cooling velocity was below 33 K/s (dash line in Figure 14), the heat treatment was not effective. This result confirms the existence of a critical cooling rate for the selected hardening treatment and its value of 33 K/s for the alloy considered in this investigation, in concordance with the data available in the literature. It can also be appreciated how important and critical it is to surpass this minimum value in order to perform a successful hardening treatment. In just 3 mm (from r = 3 to r = 6 mm), where the cooling rate changes less than 1 K/s (from 32.7 to 33.6 K/s), the microhardness varies from 35 to 65 HV (+86%).
Figure 14. Simulated cooling rates in the critical range (■) at z = 0, as a function of the radius. Microhardness profiles in the central section (z = 0) of the, treated (●) and untreated (○) 70/70 mm foams.
Metals 02 00508 g014
According to the results the optimum cooling rates seem to be in the range of 35–65 K/s while slightly lower HV values measured in the outer part of the sample could be probably associated to an excessive cooling rate which could have resulted in non-optimum precipitation of the alloying elements in the supersaturated regions during the ageing step and, as a consequence, a lower hardness increase. Literature suggests some tactics aimed at cancelling out the origin of such cooling tensions [39] such as increasing the temperature of the quenching medium up to 70–100 °C although this solution would create lower cooling rates in the central parts. Hence, this could only be a good method to reduce the tensions in samples of high density or small size, but for larger (or lighter) foams there is a compromise between the fraction of sample to be treated and the effectiveness of the treatment.
Finally, it is important to comment that the untreated region in the 70/70 mm sample represents less than 1% of the total volume of the foam. For that reason no significant effects on macroscopic mechanical properties are expected. However, a lower macro-mechanical response could be expected in the case of bigger foams with higher inner untreated regions, since those areas would act as weak points producing the early failure of the cellular structure and altering the global mechanical response.

4. Conclusions

The results obtained in the present investigation reveal some interesting conclusions that can be summarized as follows:
  • The developed simulation model has been able to reproduce the experimental temperature evolution inside the foams during the quenching process. To this end, the model must consider the real density distribution -for example by using the SSDD methodology-, otherwise the temperature evolution could only be reproduced for the inner regions.
  • The observed water infiltration during the quenching reveals the presence of defects –perforated cell walls– in the cellular structure that can clearly influence the process and should be considered in future modeling. This effect was not directly considered in the present FEM model but was overcome thanks to the IHCP iterative methodology used.
  • The lower cooling rates exhibit by Al foams in comparison to solids can be explain in terms of: (i) The increased thermal resistance due to the lower density, the possible inhomogeneities in the inner structure and the small defects like cell wall cracks; (ii) The completely different boundary conditions in the case of foams due to the skin rugosity and internal defects (water infiltration through cracks in cell walls), that change the interface between the sample and the external medium. As a consequence of this, the calculated effective values for h, using the proposed model, have shown to be 3.5 to 6 times lower for aluminum foams (~1500 W/m2·K) in comparison to solid samples (~7000 W/m2·K).
  • Both predictions and experimental data confirm the existence of certain limits for a complete treatment of foamed aluminum. In one of the studied cases (70/70 mm foam) it was possible to correlate the simulation predictions with the experimental microhardness profile, confirming the limit of 33 K/s in the critical temperature range for the selected alloy. Based on this, an extended prediction has been proposed for foams of different density and size.

Acknowledgments

Financial assistance the Spanish Ministry of Science and Innovation and FEDER (MAT2009-14001-C02-01) is gratefully acknowledged. In addition, authors are grateful to the Spanish Ministry of Science and Education which supported this investigation with a FPU-doctoral grant Ref-AP-2007-03318 (Jaime Lázaro) and Juan de la Cierva grant JCI-2011-09775 (Eusebio Solórzano). Authors would also like to thank Alulight Company for having provided the precursor material used in this study.

References

  1. Banhart, J. Manufacture, characterization and application of cellular metals and metal foams. Prog. Mater. Sci. 2001, 46, 559–632. [Google Scholar] [CrossRef]
  2. Nosko, M.; Simancik, F.; Florek, R. Reproducibility of aluminum foam properties: Effect of precursor distribution on the structural anisotropy and the collapse stress and its dispersion. Mater. Sci. Eng. A 2010, 527, 5900–5908. [Google Scholar] [CrossRef]
  3. Yu, C.J.; Eifert, H.H.; Banhart, J.; Baumeister, J. Metal foaming by a powder metallurgy method: Production, properties and applications. Mat. Res. Innov. 1998, 2, 181–188. [Google Scholar] [CrossRef]
  4. Baumgärtner, F.; Duarte, I.; Banhart, J. Industrialization of powder compact foaming process. Adv. Eng. Mater. 2000, 2, 168–174. [Google Scholar] [CrossRef]
  5. McCullough, K.Y.G.; Fleck, N.A.; Ashby, M.F. Uniaxial stress-strain behaviour of aluminium alloy foams. Acta Mater. 1999, 47, 2323–2330. [Google Scholar] [CrossRef]
  6. Mukherjee, M.; Garcia-Moreno, F.; Banhart, J. Defect generation during solidification of aluminium foams. Scr. Mater. 2010, 63, 235–238. [Google Scholar] [CrossRef]
  7. Simone, A.E.; Gibson, L.J. The effects of cell face curvature and corrugations on the stiffness and strength of metallic foams. ActaMater. 1998, 46, 3929–3935. [Google Scholar]
  8. Olurin, O.B.; Fleck, N.A.; Ashby, M.F. Deformation and fracture of aluminium foams. Mater. Sci. Eng. A 2000, 291, 136–146. [Google Scholar] [CrossRef]
  9. Seeliger, H.W. Manufacture of aluminum foam sandwich (AFS) components. Adv. Eng. Mater. 2002, 4, 753–758. [Google Scholar] [CrossRef]
  10. Banhart, J.; Seeliger, H.W. Aluminium foam sandwich panels: Manufacture, metallurgy and applications. Adv. Eng. Mater. 2008, 10, 793–802. [Google Scholar] [CrossRef]
  11. Simancik, F.; Lucan, L.; Jerz, J. Reinforced Aluminium Foams. In Cellular Metals and Metal Foaming Technology; Banhart, J., Ashby, M.F., Fleck, N.A., Eds.; MIT-Verlag: Bremen, Germany, 2001; pp. 365–368. [Google Scholar]
  12. Solorzano, E.; Rodriguez-Perez, M.A.; Reglero, J.A.; de Saja, J.A. Mechanical behaviour of internal reinforced aluminium foams. Adv. Eng. Mater. 2007, 9, 955–958. [Google Scholar]
  13. Helwig, H.M.; Garcia-Moreno, F.; Banhart, J. A study of Mg and Cu additions on the foaming behaviour of Al–Si alloys. J. Mater. Sci. 2011, 46, 5227–5236. [Google Scholar] [CrossRef]
  14. Lehmhus, D.; Banhart, J.; Rodrigue-Perez, M.A. Adaptation of aluminium foam properties by means of precipitation hardening. Mater. Sci. Tech. 2002, 18, 474–479. [Google Scholar] [CrossRef]
  15. Lehmhus, D.; Marschner, C.; Banhart, J.; Bomas, H. Influence of heat treatment on compression fatigue of aluminium foams. J. Mater. Sci. 2002, 37, 3447–3451. [Google Scholar] [CrossRef]
  16. Lehmhus, D.; Banhart, J. Properties of heat-treated aluminium foams. Mater. Sci. Eng. A 2003, 349, 98–110. [Google Scholar]
  17. Davis, J.R. Alumiumand Aluminum Alloys; ASM International: Materials Park, OH, USA, 1993. [Google Scholar]
  18. Dorward, R.C.; Bouvier, C. A rationalization of factors affecting strength, ductility and toughness of AA6061-type Al–Mg–Si–(Cu) alloys. Mater. Sci. Eng. A 1998, 254, 33–44. [Google Scholar] [CrossRef]
  19. Solorzano, E.; Reglero, J.A.; Rodriguez-Perez, M.A.; de Saja, J.A.; Rodriguez-Mendez, M.L. Improvement of the foaming process for 4045 and 6061 aluminium foams by using the Taguchi methodology. J. Mater. Sci. 2007, 42, 7227–7238. [Google Scholar] [CrossRef]
  20. Kriszt, B.; Martin, U.; Mosler, U.; Maire, E.; Degischer, H.P.; Jottar, A. Characterization of Cellular Metals. In Handbook of Cellular Metals: Production, Processing, Applications; Degischer, H.P., Kriszt, B., Eds.; Wiley-VCH Verlag GmbH: Weinheim, Germany, 2002; pp. 127–178. [Google Scholar]
  21. Ohgaki, T.; Toda, H.; Kobayashi, M.; Uesugi, K.; Niinomi, M.; Akahori, T.; Makii, K.; Agura, Y. In situ high-resolution X-ray CT observation of compressive and damage behaviour of aluminium foams by local tomography technique. Philos. Mag. 2006, 86, 4417–4438. [Google Scholar] [CrossRef]
  22. Solorzano, E.; Rodriguez-Perez, M.A.; Reglero, J.A.; de Saja, J.A. Density gradients in aluminium foams: Characterisation by computed tomography and measurements of the effective thermal conductivity. J. Mater. Sci. 2007, 42, 2557–2564. [Google Scholar]
  23. Abramoff, M.D.; Magelhaes, P.J.; Ram, S.J. Image processing with image. J. Bioph. Int. 2004, 11, 36–42. [Google Scholar]
  24. Solorzano, E.; Escudero, J.; Lazaro, J.; Rodriguez-Perez, M.A.; de Saja, J.A. Critical Cooling Velocity Maps for Thermal Hardening Treatments in aluminium Foams. In Porous Metal and Metallic Foams; Lefebvre, L.P., Banhart, J., Dunand, D.C., Eds.; DEStech Publications: Lancaster, PA, USA, 2008; pp. 505–508. [Google Scholar]
  25. Garcia-Moreno, F.; Fromme, M.; Banhart, J. Real-time X-ray radioscopy on metallic foams using a compact micro-focus source. Adv. Eng. Mater. 2004, 6, 416–420. [Google Scholar] [CrossRef]
  26. Gergely, V.; Clyne, T.W. Drainage in standing liquid metal foams: Modelling and experimental observations. ActaMater. 2004, 52, 3047–3058. [Google Scholar]
  27. Lu, T.J.; Chen, C. Thermal transport and fire retardance properties of cellular aluminium alloys. ActaMater. 1999, 47, 1469–1485. [Google Scholar]
  28. Holman, J.P. Heat Transfer; McGraw-Hill: New York, NY, USA, 1989. [Google Scholar]
  29. Fiedler, T.; Solorzano, E.; Öchsner, A. Numerical and experimental analysis of the thermal conductivity of metallic hollow sphere structures. Mater. Lett. 2008, 62, 1204–1207. [Google Scholar]
  30. Solorzano, E.; Rodriguez-Perez, M.A.; Lazaro, J.; de Saja, J.A. Influence of solid phase conductivity and cellular structure on the heat transfer mechanisms of cellular materials: Diverse case Studies. Adv. Eng. Mater. 2009, 11, 818–824. [Google Scholar]
  31. Lazaro, J.; Escudero, J.; Solorzano, E.; Rodriguez-Perez, M.A.; de Saja, J.A. Heat transport in closed cell aluminium foams: Application notes. Adv. Eng. Mater. 2009, 11, 825–831. [Google Scholar] [CrossRef]
  32. Hugo, J.M.; Topin, F. Metal Foams Design for Heat Exchangers: Structure and Effectives Transport. In Heat and Mass Transfer in Porous Media; Delgado, J.M.P.Q., Ed.; Springer: Berlin, Germany, 2012; pp. 219–244. [Google Scholar]
  33. Solorzano, E.; Reglero, J.A.; Rodriguez-Perez, M.A.; Lehmhus, D.; Wichmann, M.; de Saja, J.A. An experimental study on the termal conductivity of aluminium foams by using the transient plane source method. Int. J. Heat Mass Tran. 2008, 51, 6259–6267. [Google Scholar] [CrossRef]
  34. Solorzano, E.; Rodriguez-Perez, M.A.; de Saja, J.A. Thermal conductivity of cellular metals measured by the transient plane source method. Adv. Eng. Mater. 2008, 10, 596–602. [Google Scholar]
  35. Cverna, F. Thermal Properties of Metals; ASM International: Materials Park, OH, USA, 2002; pp. 221–482. [Google Scholar]
  36. Chen, H.T.; Wu, X.Y. Investigation of heat transfer coefficients in two-dimensional inverse heat conduction problems using the hybrid inverse scheme. Int. J. Num. Method Eng. 2008, 73, 107–122. [Google Scholar] [CrossRef]
  37. Grysa, K. Iverse Heat Conduction Problems. In Heat Conduction: Basic Research; Vikhrenko, V.S., Ed.; InTech: Rikeja, Croatia, 2011; pp. 3–36. [Google Scholar]
  38. ASTM E384-11e1 Standard Test Method for Knoop and Vickers Hardness of Materials. Available online: http://www.astm.org/Standards/E384.htm (accessed on 13 December 2012).
  39. Hufnagel, W. Manual del Aluminio; Reverté: Barcelona, Spain, 1992; p. 520. [Google Scholar]

