Article

Comparative Study of Elastoplastic Constitutive Models for Deformation of Metallic Glasses

1
School of Materials Science and Engineering, Georgia Institute of Technology, Atlanta, GA 30332, USA
2
Department of Advanced Materials and Nanotechnology, College of Engineering, Peking University, Beijing 100871, China
*
Author to whom correspondence should be addressed.
Metals 2012, 2(4), 488-507; https://doi.org/10.3390/met2040488
Submission received: 7 November 2012 / Revised: 20 November 2012 / Accepted: 29 November 2012 / Published: 4 December 2012
(This article belongs to the Special Issue Amorphous Alloys)

Abstract

:
We present and compare three elastoplastic models currently used for deformation of metallic glasses, namely, a von Mises model, a modified von Mises model with hydrostatic stress effect included, and a Drucker-Prager model. The constitutive models are formulated in conjunction with the free volume theory for plastic deformation and are implemented numerically with finite element method. We show through a series of case studies that by considering explicitly the volume dilatation during plastic deformation, the Drucker-Prager model can produce the two salient features widely observed in experiments, namely, the strength differential effect and deviation of the shear band inclination angle under tension and compression, whereas the von Mises and modified von Mises models are unable to. We also explore shear band formation using the three constitutive models. Based on the study, we discuss the free volume theory and its possible limitations in the constitutive models for metallic glasses.

Graphical Abstract

1. Introduction

Metallic glass, also called amorphous alloy, is a relatively new material characterized by the random, disordered atomic arrangement which is different from the ordered crystalline structure of metals and alloys. The first metallic glass, an Au-Si eutectic alloy, was synthesized by Duwez and his coworkers in 1960 through rapid cooling the liquid to prevent crystallization [1]. In the past two decades, more metallic glass alloys with high glass-forming-ability compositions have been made with extremely lower cooling rates [2], allowing for production of the materials with large scale in three dimensions. The development of the so-called bulk metallic glasses (BMGs) have not only opened up new avenues for many practical applications [3] but also attracted interests in fundamental study of amorphous materials [4].
Extensive experimental works have been done to study the mechanical properties of BMGs. For example, tensile loading showed that BMGs can have 2% or more elastic strain limit and therefore higher yield strength than the conventional crystalline materials [5]. Moreover, BMGs are found to have very high toughness [6] and hardness by indentation test [6,7], which would be favorable for many demanding applications. However, unlike the deformation of crystalline metals, BMGs show almost no work hardening after yielding and, consequently, appear to have little ductility under unconfined loading, which poses a serious limitation.
As known [8], deformation of metallic glasses has two distinct modes: homogeneous deformation at high temperature (>0.7Tg), and inhomogeneous deformation at low temperature (<0.7Tg), where Tg is the glass transition temperature. In the inhomogeneous mode, the plastic strain is highly localized into thin bands called shear bands (SBs), which is the main reason for the brittleness. On the continuum level, the constitutive behaviors of metallic glasses at low temperature are rather simple: a nearly linear elastic regime is interrupted by either fracture, when the samples are subject to unconfined deformation loading, such as tension; or limited plastic flow, when the samples are subject to confined deformation loading, such as compression. The simplicity in the mechanical behaviors makes it difficult to formulate physically sound constitutive relations for metallic glasses from the experimental inputs alone. The additional information needed includes detailed structural and micromechanical properties of any potential defects that promote yielding and plastic deformation. However, due to the lack of the long-range translational symmetry, there is no Bragg diffraction in metallic glasses, which is a main source to detect structural defects in deformation. As a result, the atomic scale mechanism of the plastic deformation of BMGs still remains open. Nevertheless, several atomic-scale models were proposed to explain the underlying microscopic deformation mechanism of metallic glasses [8,9,10]. These models usually introduce special kinds of “flow defects” as the characteristic parameter of the structure, such as Spaepen’s free volume [8] and Argon’s shear transformation zone [9]. The physics of these models is described by Eyring’s transition state theory in which the energy barrier that atoms need to overcome when going from one defect state to another is biased by the applied stress state [11]. Recent atomistic simulations using molecular dynamics method have provided direct evidence of deformation-induced volume dilatation, or free volumes [12]. The extensive atomistic modeling performed in several binary model metallic glasses under various loading modes shows that volume dilatation is an intrinsic property accompanying not only the plastic but also elastic deformation [13,14,15,16]. The volume dilatation changes gradually in a nonlinear fashion before yielding, and increases rapidly around the yield point before reaching a critical value of about 1.2%–2% of the volume of the undeformed samples [11]. Moreover, accompanying this volume change is more disorder in the atomic configuration and dramatic elastic shear modulus softening.
The development of constitutive models for continuum modeling of the deformation behaviors has followed a path intimately connected to the free volume model. From Spaepen’s free volume model, Steif et al. developed an operational viscoelastic model that links the multiaxial stress to the plastic strain through the J2 invariant of the stress deviator [17]. Huang et al. extended this approach into an elastoplastic model in three dimensions by using the effective von Mises stress [18]. Gao implemented a numerical approach to solve the elastoplastic model based largely on Huang’s approach by finite element method with the same von Mises generalization [19]. As is already known, the von Mises criterion has been wildly used in crystalline metals, but its application in metallic glasses has been questioned based on an enormous number of experimental observations [20,21,22]. There are two salient features more commonly found in metallic glasses than in their crystalline counterparts. One is the strength differential (SD) effect and the second the deviation of shear band inclination angles (SBIA) in uniaxial tension and compression. These results suggest that hydrostatic stress (or volume strain) and/or normal stress should affect the deformation of metallic glasses, which are quite different from the von Mises criterion where volumetric effect, or hydrostatic stress and normal stress, does not play a major role. Taking into consideration the normal stress effect on shear during uniaxial deformation, Anand invoked the Coulomb-Mohr criterion, along with the volume dilation effect, in formulating a constitutive model for metallic glasses [23].
The constitutive models mentioned above are all capable of producing inhomogeneous deformation or shear localization [17,18,19]. However, except for Anand’s Coulomb-Mohr theory [23], they are unable to produce the deviations in the shear band inclination angles and the strength difference even in qualitative fashion. As we show in the following, the von Mises type of theories always gives the inclination of shear band angle at 45° and negligible strength difference. The Coulomb-Mohr type of constitutive relations, on the other hand, faces conceptual questions of how to define the shear planes in a homogeneously deformed system and how to incorporate volume dilatations in a less ad hoc fashion. As shown recently by both experiment and molecular dynamics simulations [12], volume dilatation is an integral part of the mechanical deformation in metallic glasses. However, how to incorporate this into a constitutive model that is able to reproduce some of the key experimental observations remains to be resolved.
In this paper, we conduct a comparative study on three types of elastoplastic models for metallic glasses, namely the von Mises model (J2), the von Mises model modified by hydrostatic stress effect (J2P), and the Drucker-Prager (DP) model. As in the previous studies [18,19], we will incorporate the free volume model into the constitutive formulations for plastic deformation. Constitutive equations are established first and some of the salient features, i.e., SD effect and SBIA will be explained theoretically. We then implement the constitutive models in the finite element method to simulate the deformation process under plane strain condition. From these models, we simulate shear banding as the main inhomogeneous deformation phenomenon and examine in detail the evolution of mechanical properties and free volume behaviors. Our emphasis here is focused on SD effect and the SBIA, which could provide us with a critical testing ground for these models. We hope that this comparative study could shed light on not only the inner working mechanisms of the different constitutive models but also the physics of the deformation process, that may lead us to a more reliable and better model which can capture the real materials’ mechanical responses.
The paper is organized as follows. In the next section, we shall present three elastoplastic constitutive models. The sample preparation and modeling procedures are described in section 3. In section 4, we will show and discuss the results of simple shear, tension and compression in plain strain conditions. Discussions and conclusions drawn from this work will be given in section 5.

2. Constitutive Theories

There are two different ways to set up the constitutive relationship for a material. One is based on fitting the curves obtained from experiments phenomenologically and obtaining the corresponding constitutive equations. Although this method can capture exactly the same features as the experiments show, it is less able to provide the fundamental physics and thus lacks the generality. The other is to generalize the microscopic mechanism into continuum regime. This approach could be more physically consistent but often suffer from lacking of critical details in connection between the two length scales. The free volume model [8] and the shear transformation zone theory [9] are two microscopic models discussed extensively. They both introduce an internal state parameter characterizing the local structural order and the essential mechanism of them is based on the activation process proposed by Eyring [11]. Thus they are conceptually equivalent after generalization into continuum regime. As shown below, we shall use Spaepen’s free volume theory as a microscopic basis to build a continuum model as done in some of the previous work [18,19] but introduce a different formulation, i.e., the Drucker-Prager model, to incorporate explicitly the volume effect.

2.1. Free Volume Model

In the free volume theory, the mechanism of deformation is considered as a competing process between the forward jumps of the atoms driven by the applied shear stress τ from one state to another and the backward jumps through diffusion or annihilation. During this process, an excess amount of volume, or volume dilatation, is created which is required to accommodate the moving atoms. This theory provides us with the plastic strain rate equation,
Metals 02 00488 i001
which is related to the free volumes vf with a rate equation:
Metals 02 00488 i002
where A1 and A2 are temperature-related constants, α is a geometrical factor of unit order, v* the critical volume of atom, Metals 02 00488 i029 the free volume averaged by atom numbers, Ω the atomic volume, k the Boltzmann constant and T the temperature. Metals 02 00488 i030 is the effective elastic modulus given by Eshelby’s solution for elastic inclusion [24]. nD is a constant related to diffusion with a value ranging between 3–10.
Equation 1 shows that plastic flow has a monotonic relationship with the free volume. Therefore, when free volume increases, the effective viscosity described as Metals 02 00488 i031 is reduced. Consequently, the material will be softened more at locations with high concentration of free volumes, which is the main reason perceived for strain localization. Note that this observation is based on the assumption that the material is viscoelastic and the deformation is more like a viscous flow than an elastic or a plastic deformation. In addition, in this model, only the shear stress τ is taken into account as the driving force of both the strain and free volume. In addition, with these two scalar functions, however, we are not able to deal with the second order stress tensor in multiaxial stress state. To simplify the problem, as shown below, idealized material models are introduced and different yield criterions are employed to give an effective stress.

2.2. Elastoplastic Model with von Mises Yield Criterion

In conventional elastoplastic material models, the total strain is additively decomposed into elastic and plastic parts and then treated separately:
Metals 02 00488 i003
The elastic strain is related to the stress through the generalized Hooke’s law:
Metals 02 00488 i004
where Metals 02 00488 i032 is the elastic material matrix with K the bulk modulus and G the shear modulus in an isotropic solid.
To treat the plastic flow, one of the approaches is to employ a yield criterion to first define a state where the plastic flow starts and then give the corresponding flow rule. The most widely used criterion in metals is the von Mises criterion, in which the octahedral shear stress is the only reason for yield and thus is independent of the hydrostatic stress or normal stress. The yield function is given in the form of J2, which is the second invariant of the deviatoric stress tensor.
Metals 02 00488 i005
where Metals 02 00488 i033 with s = σpI is the deviatoric stress tensor, Metals 02 00488 i034 is the hydrostatic stress, and I is the identity tensor. Note here that the hydrostatic stress p has a positive sign in tension and negative in compression, unlike that used in the engineering convention. The associated flow rule is then defined by
Metals 02 00488 i006
where λ is the proportional coefficient providing the magnitude for the flow. This flow equation indicates that (1) the principal axes of the stress and the plastic flow coincide, which is known as coaxial rule; and (2) because s is a traceless tensor, the plastic volume change Metals 02 00488 i035 will vanish. The effective stress is defined from yield function 5 therefore as
Metals 02 00488 i007
which will take the place of τ in Equations 1 and 2 as the driving force of the plastic flow and free volume.
However, deformation in metallic glasses involves volume changes as explicitly hypothesized in both the free volume model and shear transformation zone theory, and observed in experiments and atomistic simulations. One of the basic mechanisms of the free volume change is its dilatational barrier jumping, which obviously cannot be reflected by the von Mises rule alone. In the early work [17,18,19], free volume is only taken as an order parameter without the consideration of the dilatation and its coupling to hydrostatic stress. This situation will be dealt with in two separate cases in the following sections.

2.3. The von Mises Model Modified by Hydrostatic Stress Effect

It has been expected by many researchers that the hydrostatic component of the stress should affect the deformation of metallic glasses. Because the hydrostatic stress only changes the volumetric part of the strain according to the elastoplastic assumption, we can imagine that the tensile hydrostatic stress would make the free volume generation easier, while the compressive one more difficult. Such an effect was mentioned by Steif [17] and later discussed in detail by Flores et al. [25]. Flores et al. further assumed that the hydrostatic stress only has effects on the initial free volume, and the effects are different for tension and compression following Equations 8 and 9, respectively:
Metals 02 00488 i008
Metals 02 00488 i009
where vf,0 is the free volume before increment, p the hydrostatic stress, K the bulk modulus. Note here that the effect for tension is much larger than that for compression because Metals 02 00488 i036. The large difference is also confirmed recently by Guo and Li [26] in an atomistic modeling of the equation of state of a model of NiZr metallic glasses. As a modification to the von Mises model discussed in section 2.2, the free volume change will also contribute partly to the volumetric strain increment, which is assumed to follow Hooke’s law,
Metals 02 00488 i010
One of the consequences of inclusion of the hydrostatic stress is the asymmetry of tension and compression since the effect differs between them as shown above. We shall discuss this model in detail later in section 4.2.

2.4. Coulomb-Mohr Model

The attempt to incorporate hydrostatic stress or normal stress into yield criterion was done largely in granular materials [27] and also other materials such as polymers [28] where volumetric dilation is more obvious than in metallic systems due to the larger degree of incompressibility of the materials. To explain the shear band angle inclination, the most intuitive criterion is the Coulomb-Mohr model, in which the yield shear stress τy is a linear function of the normal stress σn perpendicular to the shear plane,
Metals 02 00488 i011
where c is the shear resistance and μ = tan ϕ is the internal friction coefficient with ϕ being the internal friction angle.
Figure 1. The two-dimensional illustration of the Coulomb-Mohr criterion.
Metals 02 00488 g001
Figure 1 shows a sample under a uniaxial applied tensile stress σapp, the resolved normal and shear stress on the shear plane can be expressed as
Metals 02 00488 i012
Metals 02 00488 i013
where A0 is the initial cross sectional area of the sample and θ is the inclination angle of the shear plane with respect to the loading axis. Substitute the above two equations into Equation 11, and we can get the yielding condition:
Metals 02 00488 i014
The shearing angle θ with respect to the loading axis can be determined by maximizing the left side of Equation 14. Thus,
Metals 02 00488 i015
The Coulomb-Mohr model can explain the shear band angle deviation from θ = 45° as compared with that predicted from the von Mises type of theories. Obviously, the simplicity makes the model very appealing for bulk metallic glasses where why the SBA inclination has not been rationalized clearly [20]. However, it is not fully convincing to define a preferred shear plane, as shown in Equation 11, before the yielding point when the sample is mostly under homogeneous deformation. Anand [23] chose the principal directions of stresses as the potential slip directions, which made it possible to apply the Coulomb-Mohr criterion locally. Nevertheless, there is no necessary connection between the principal stress directions and the orientations of shear planes. The finite numbers of potential slip systems obtained in this manner may reduce the possibilities of flow under complex stress state. In addition, the Coulomb-Mohr model does not consider the volumetric effects at all; and thus the effect needs to be implicitly inserted, which is often done in ad hoc fashion through the material parameters rather than in the mechanics equations, as in Equation 11.

2.5. Drucker-Prager Model

An alternative way to consider the hydrostatic stress or the volume dilatation effects is through the Drucker-Prager (DP) model based on Drucker and Prager’s work on soil plasticity that appeared in 1952 [29]. The yield function suggested by this model is an extension of the von Mises model by adding a term of hydrostatic component of the stress,
Metals 02 00488 i016
where I1 = tr(σ) is the first invariant of the stress tensor. The Drucker-Prager model can also be looked upon as a smooth generalization of the Coulomb-Mohr criterion in the yield surface [30]. From the yield function (Equation 16), we can similarly define an effective stress, or DP stress as
Metals 02 00488 i017
For the von Mises criterion, the flow rule is obtained by directly taking the stress derivative of the yield function, namely associated flow. However, there is no evidence showing that the flow vector must be connected with yield function. Another function called plastic potential function Q is introduced to give the general case [30],
Metals 02 00488 i018
Then the flow rule is
Metals 02 00488 i019
a and b are two parameters which will be discussed later. If ab the flow is called non-associated; otherwise it is associated. From Equation 19, we can similarly calculate the volumetric strain rate as Metals 02 00488 i037, which is not zero, provided that b ≠ 0. This property means that in the Drucker-Prager model, the dependence on hydrostatic stress will introduce an accompanying volume change during deformation, or vice versa [30]. This effect is physically consistent with the dilatational feature of the free volume theory, as well as the experimental results. Moreover, also from the data of molecular dynamics (MD) simulation, volume dilatation is believed to be the reason for shear softening [12].
As compared to the Coulomb-Mohr model, the volume dilatation in the Drucker-Prager model does not appear immediately apparent in its contribution to the shear band angle inclination. However, we show that contrary to this view, the nonzero plastic volume increment in the Drucker-Prager model could indeed lead to shear band angle different from 45°. This result is proved by by Zhao and Li [31] using Hill’s zero extension rate theory and Mohr’s circle.

2.6. Constitutive Equations

For the constitutive models, we can describe the displacement boundary problem in general by the following governing equations,
Metals 02 00488 i020
Metals 02 00488 i021
where u is the displacement vector and fb represents the body force which is assumed to be zero here.
For the Drucker-Prager model, by substituting Equation 19 into Equation 4, we can get the constitutive equations relating the stress to the strain in the rate form,
Metals 02 00488 i022
Metals 02 00488 i023
where Metals 02 00488 i038 is the deviatoric part of the strain tensor with εv = tr(ε) the volumetric part of the strain.
Note that the proportional coefficient λ is used to be determined by assuming a work-hardening law, for example, for crystalline metals. However, work hardening has seldom been observed in the deformation of metallic glasses. In contrast, the volume dilatation model is used to capture the strain-softening mechanism, as done by Steif [32], Huang [18], and Gao [19]. Here, we also assume that λ will follow the trend of the plastic flow shown in Equation 1. The free volume evolution is provided by Equation 2. Following the normalization scheme [32] and replacing the shear stress τ with effective stress σe defined in Equation 17, we get the expressions of λ and free volume rate,
Metals 02 00488 i024
Metals 02 00488 i025
where Metals 02 00488 i039, σ0 = 2kT/Ω, and β = v* / Ω. Note that the constitutive equations derived here are for the Drucker-Prager model. By simply setting the parameters a = b = 0, the DP equations will reduce to the case of the von Mises criterion.
By now, the boundary problem is fully described through Equations 20–25. To solve the problem of deformation and shear localization, a UMAT subroutine [33] is developed and incorporated with ABAQUS finite element software using the return mapping algorithms [19,34,35].

3. Simulation Procedures

3.1. Three Elastoplastic Models

In order to give a direct comparison of the constitutive theories developed in the above session, we will set up three elastoplastic models for each of the three theories:
  • (a) The von Mises model (J2 model): For the Equations 20–25, set a = b = 0, the model becomes the von Mises type.
  • (b) The von Mises model plus hydrostatic stress effect (J2P model): In addition to model (a), Equations 8–10 will be also included. The procedure is that before solving Equations 20–25, we calculate the initial free volume modified by hydrostatic stress from Equations 8 and 9, then run the time integration to obtain the solutions at that time step, and finally apply Equation 10 to update the hydrostatic stress in addition.
  • (c) The Drucker-Prager model (DP model): a, b ≠ 0, the hydrostatic component of stress is included in Equations 20–25.

3.2. Material Constants and Parameters

The model material that we will use in this paper is Zr41.25Ti13.75Ni10Cu12.5Be22.5 bulk metallic glass, or Vitreloy 1. The mechanical constants are available from a number of experimental tests [5,21]: the Young’s modulus E = 96 GPa, Poisson ratio ν = 0.36, and the average atomic volume Ω = 16.4 Å3. The initial average free volume can be estimated through thermal expansion equation, Metals 02 00488 i040, where ξ is the thermal expansion coefficient with the value of 4.0 × 10⁻⁵ K−1 for this Zr-based BMG. Thus, after normalization, Metals 02 00488 i041. β = v* / Ω = 0.8, the geometrical factor α = 0.105. σ0 = 2kT/Ω is used to normalize the stress with the order of 1 GPa. nD is taken to be 3.
For the DP model, there are two more parameters that need to be determined, that is, the coefficients in yield function and plastic potential function a and b. In this simulation, we assume that the flow is associated. It is shown that non-associated flow can predict an accurate plastic volume expansion by choosing a proper value of b. However, the comparison is beyond the scope of this paper [36]. Therefore, we have only one parameter a left now.
As mentioned earlier, the DP model is a smooth extension of Coulomb-Mohr criterion in the yield surface. Thus a can be obtained by matching the yield surfaces of these two models,
Metals 02 00488 i026
where ϕ is the internal friction angle defined in the Coulomb-Mohr model (Equation 11). ϕ is related to the shear band inclination angle θ through Equation 15. But, for the DP model, Equation 15 is no longer valid. However we can still estimate the coefficient a from Equations 15 and 26 and use it as our input. For shear band inclination angle θ = 48°, a = 0.045 and for θ = 51°, a = 0.087. The influence of coefficient a on the yielding has been discussed in Zhao and Li [26] in detail.

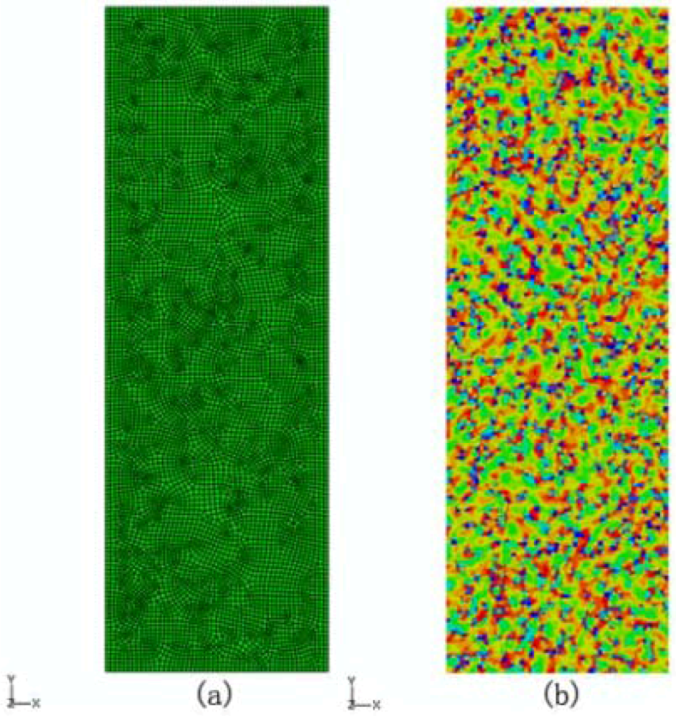
3.3. Samples and Loading

Two types of samples and different loading will be used in this work. The first is a simple shear of one CPE4 [33] element. The sample is subject to plane strain restriction. The basic material behaviors of the three models could be obtained from this simulation. Then plane strain tension and compression will be conducted on a rectangular sample with the height-to-width-ratio of three shown in Figure 2. The sample contains 8,517 CPE4 elements. All the material properties and parameters are described in section 3.2. More details on simulation can be found in [31,36].
Figure 2. A rectangular sample under plane strain tension and compression: (a) finite element mesh and (b) the contour of the initial randomly distributed free volume configuration.
Metals 02 00488 g002

4. Results and Discussions

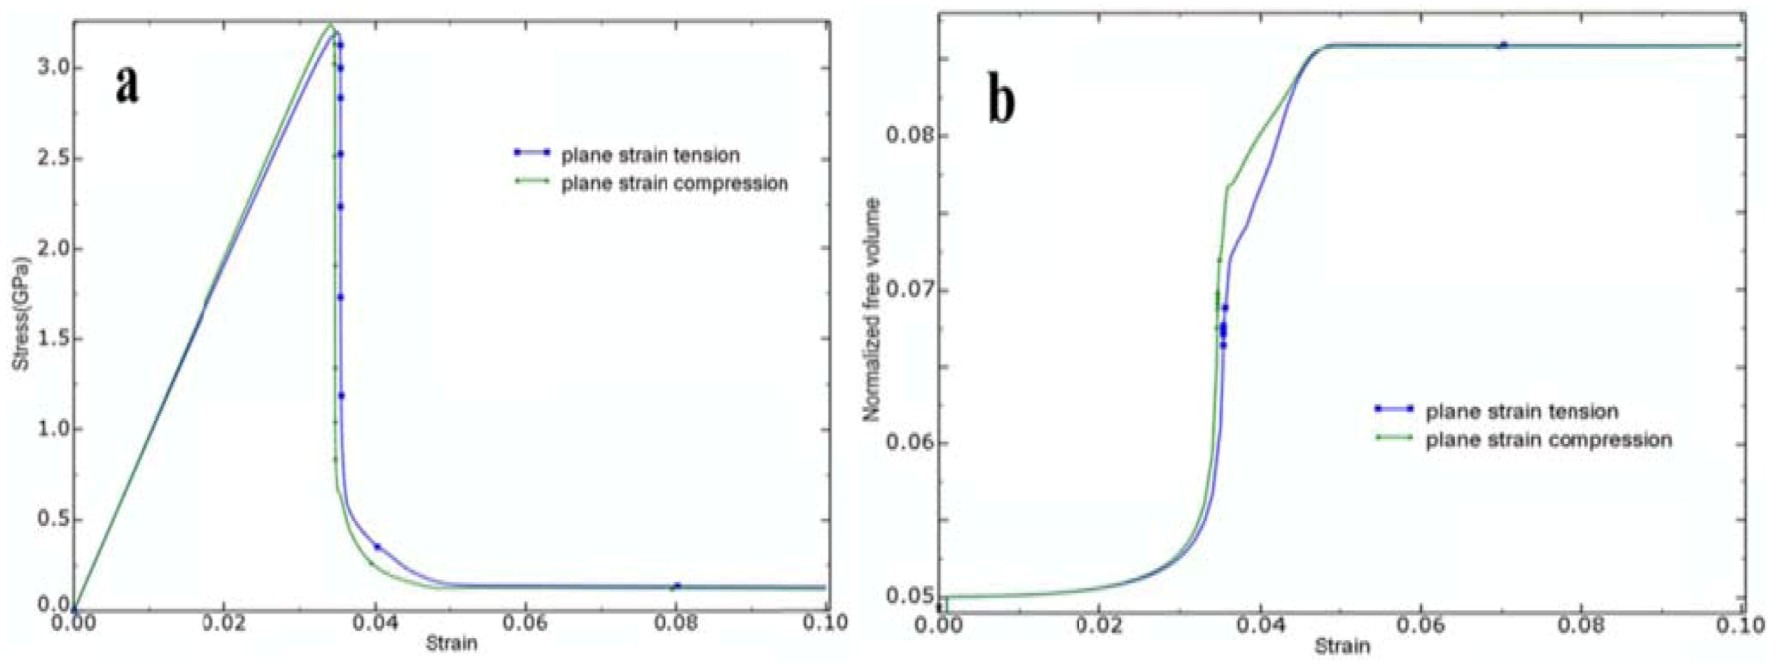
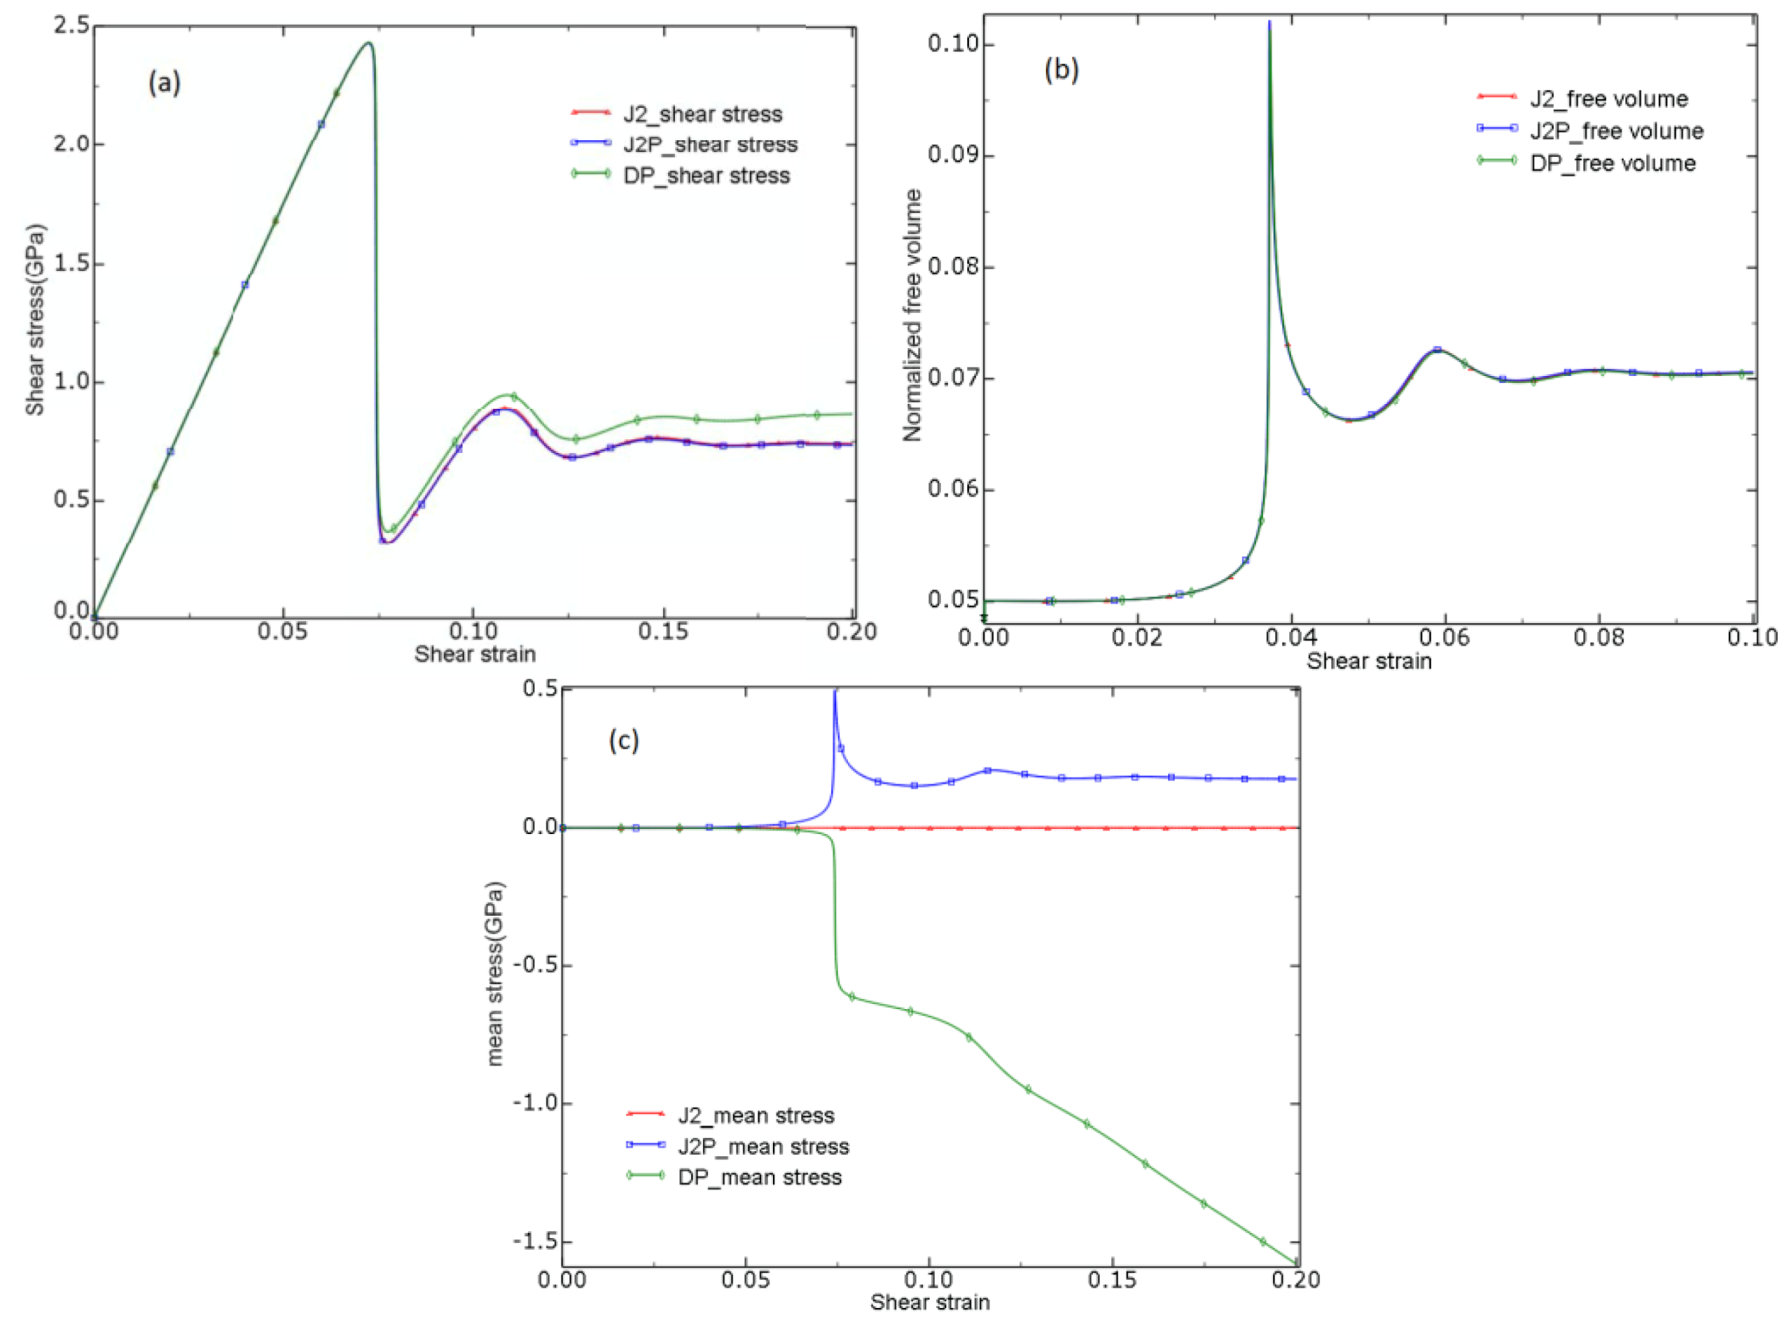
4.1.Shear-Induced Dilatation

As mentioned above, the reason of shear banding is believed to be a result of the volume dilatation, which has been elaborated in detail in the free volume theory [8]. Recent MD simulation of MG samples in simple shear also demonstrated this connection [12]. The first step of our simulation is therefore to model a simple shear in one CPE4 element using the three theoretical models. For the DP model, the coefficient a is taken to be 0.045. The results for simple shear are shown in Figure 3.
From Figure 3a,b we find that all three models give a similar trend in the shear stress strain relationship and free volume evolution. The material first deforms linear elasticity until the yield point, which is the maximum allowable stress state by the criteria. The material shows little plasticity approaching the yield point but an obvious strain softening right after the yielding. This softening is caused by the increase of the free volume as shown in Figure 3b. The free volume increases slightly at the elastic region. However, when it gets close to the yield point, it will gain an abrupt raise, which, as discussed by Spaepen [8], Steif [32], Huang [19], and Gao [19], softens the material through decreasing viscosity. Among the three models, the DP model gives a higher steady state shear stress noted from Figure 3a than the other two models, which results from the explicit hydrostatic stress dependence.
Figure 3. The results from a simple shear by the three constitutive models: (a) the shear stress strain curve, (b) the free volume, and (c) the mean stress vs. the shear strain.
Metals 02 00488 g003
The hydrostatic stresses for these three models are plotted in Figure 3c. Here we note that during the simple shear, the boundary conditions only allow strain in the shear, or xy-direction. In other words, the volume is preserved because the trace of strain tensor is zero. However, if the volume would tend to change, the material will feel an internal hydrostatic stress imposed from the boundary conditions. Basically, the volume contraction will make the material under tensile hydrostatic stress, while the expansion will result in compressive hydrostatic stress. Following our convention, the sign of the former is positive and the latter negative. Figure 3c shows that in the elastic region, these three models predict little volume change. This is consistent with Hooke’s law used in dealing with this regime. The difference, however, emerges around the yielding point. The deformation in J2 model continues with no volume change. The J2P model gives a compressive hydrostatic stress, as the pressure in Equations 8 and 9 are external, has the opposite sign to that of the internal pressure. The hydrostatic stress shows a similar trend to the free volume, which can be explained by Equation 10. According to the discussion given above, the surge of the hydrostatic stress indicates that the material is ready to expand without the boundary condition restriction. This response is the same as that predicted from the volume dilatation suggested by the free volume model [8,9] and the observation from the MD simulations [12]. On the other hand, the DP model gives an internal conjugate hydrostatic stress with a negative sign for a compressive internal hydrostatic stress, indicating a volume expansion during the simple shear deformation.

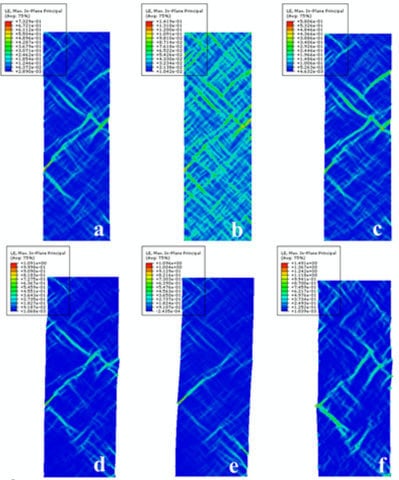
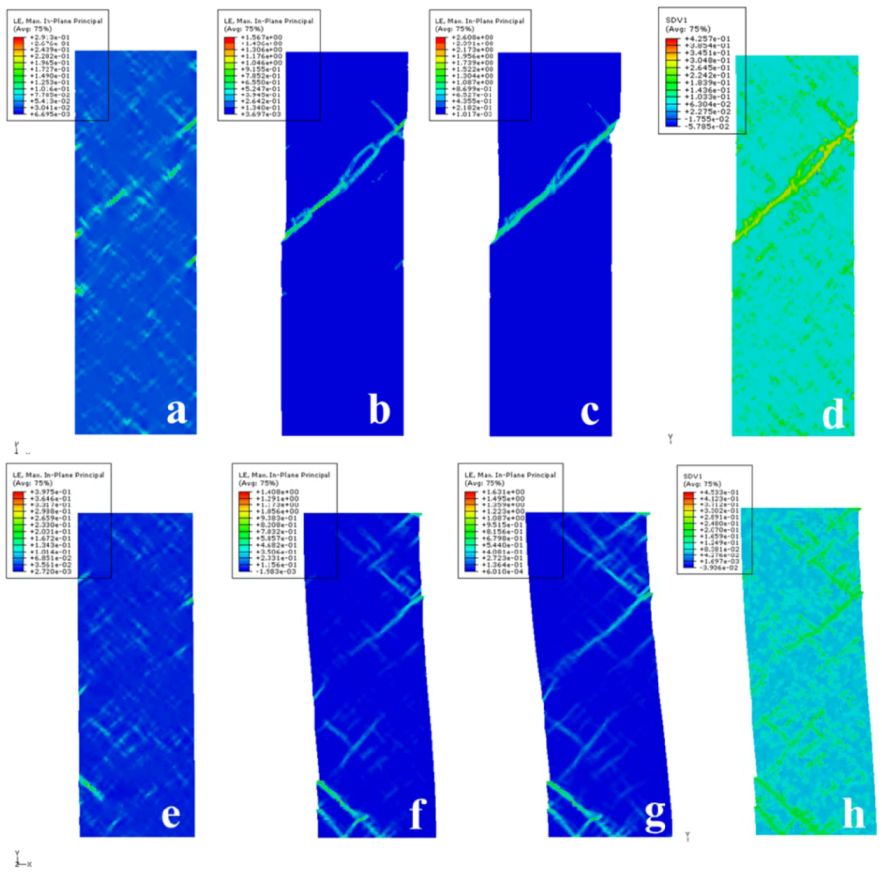
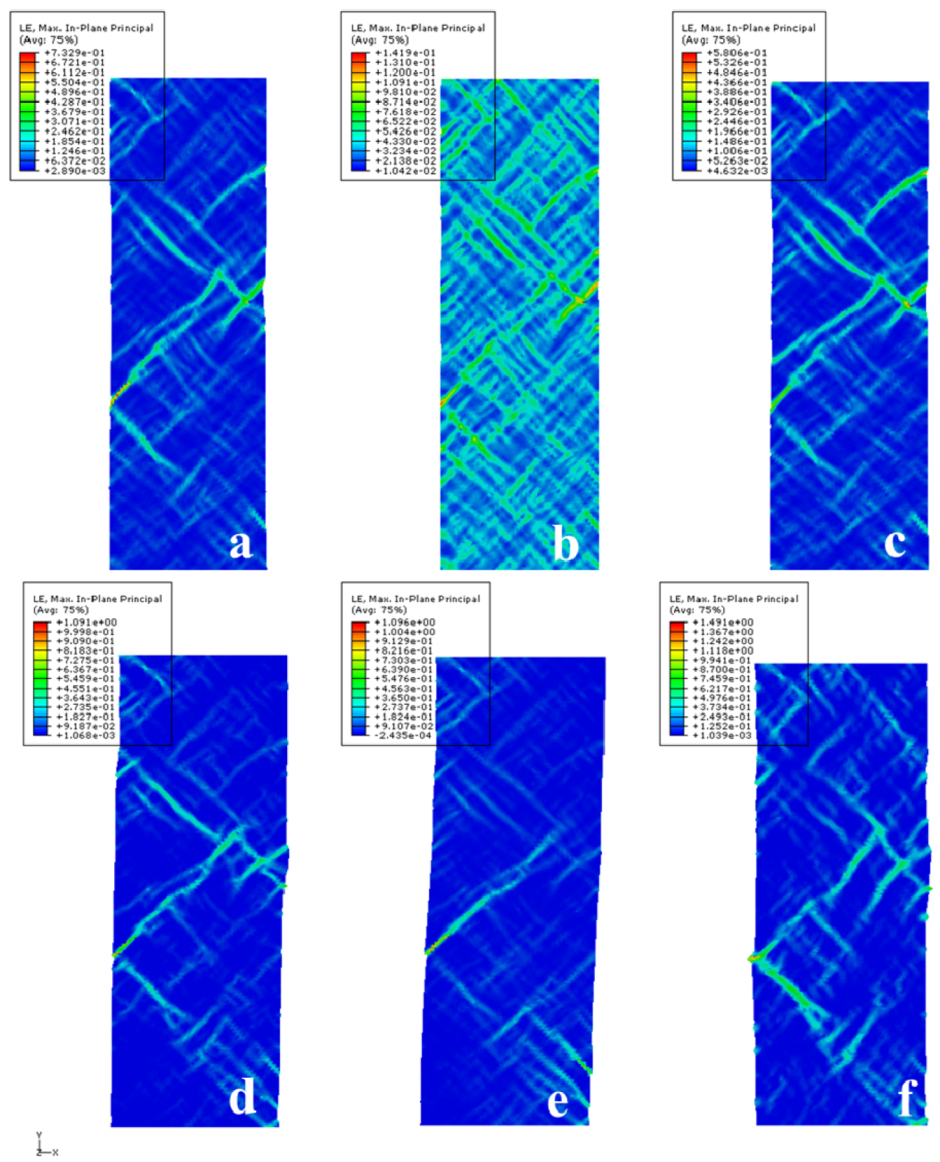
4.2. Shear Band Formation under Plane Strain Tension and Compression

The formation of the shear band under plane strain tension and compression was first simulated by using the J2 model. The sample is shown in Figure 2a. During the deformation, the bottom boundary is fixed and the upper one is displaced along y-direction at a constant rate of 1 × 10⁻⁶ s−1. For the initial free volume configuration, we randomly distribute the free volumes in each element with the mean value estimated to be 0.05 and the variance of 0.0001, which is consistent with experimental estimation. The initial free volume configuration is plotted in Figure 2b.
Figure 4 and Figure 5 show the results of the plane strain tension and compression. Stress strain curves and free volume evolution are plotted in Figure 4a,b respectively. Shear banding occurs at a very narrow time range. Basically, it starts when the material gets to the yield point and ends at the initiation of the shear region, leaving no macroscopic plasticity as seen in experiment. The compression shows a little higher yield stress but the difference is relatively small, that is, within the statistic error of the computation. The contours of strain are plotted in Figure 5, showing the process of shear banding. Before the yielding, the deformation is homogeneous in the entire sample. When the stress state reaches the yield point, strain starts to concentrate on some small regions as shown in Figure 5a,e. Then these localized regions start to propagate and connect to each other, forming the shape of narrow and extended bands. The strain inside the shear bands is calculated and is obviously larger than that in the regions outside of the bands by about two orders of magnitude, showing a severe localization phenomenon. After yielding, there is no more new shear band generated.
Figure 4. The results from plane strain tension and compression using the J2 model: (a) the stress strain curve and (b) the free volume.
Metals 02 00488 g004
For uniaxial tension (Figure 5a–c), the continuous tensile loading after localization will make the material show early signs of “necking” at the intersection of the shear band and the surfaces with a slight narrowing/shrinking in the region. Also, the upper part of the material appears to slide relative to the lower part along the shear plane as illustrated by the arrow, creating a surface offset. For compression (Figure 5d–f), the compressive loading will introduce a bending torque when shear banding occurs, which leads to buckling in the samples with the aspect ratio larger than unity. Reducing the aspect ratio will help to prevent the buckling instability from happening.
Figure 5. Shear band formation in the plane strain tension (ac) and compression (ef) using the J2 model. Strain contours for tension are shown at (a) time t = 3.5361 × 10⁴, the initiation of shear localization, (b) t = 3.5385 × 10⁴, the yielding point, and (c) t = 3.6406 × 10⁴, at the end of the shear localization. Strain contours for compression are shown at (e) t = 3.4623 × 10⁴, the initiation of shear localization, (f) t = 34676 × 104, the yielding point, and (g) t = 3.8493 × 10⁴, the end of the shear localization. The corresponding spatial distributions of the free volume at the yield point are plotted in (d) for tension and (h) for compression.
Metals 02 00488 g005
The angles between the shear plane and the loading axis are all at or very close to 45°, same as the maximum resolved shear stress direction predicted by the von Mises criterion. The corresponding free volume spatial distributions at the yield point are also plotted in Figure 5d for tension and Figure 5h for compression. We can see that the regions with higher free volume, or more “flow defects,” coincide with the strain localized regions. This connection indicates again that the increase of the free volume softens the materials and leads to localized deformation as hypothesized in the free volume model.
There has been intense discussion of the mechanisms of shear banding. Experimental observations suggest a correlation between the localization and the volume expansion during the deformation, which is manifested through such phenomena as the vein pattern on the fracture surfaces and the void formation inside and around the shear bands [37,38]. The shear localization appears to be the consequence of some excess volume and its evolution. In the continuum point of view, this localized deformation is simply represented macroscopically by the strain-softening, which we saw in Figure 5. But these observations cannot decisively distinguish whether the liquid-like patterns and voids are the results of shear banding or the cause, or whether the volume dilation is caused by local heating or geometric incompatibility of the hard cores of atoms under stress. This issue, therefore, needs to be resolved with more detailed, atomistic scale modeling and quantitative constitutive modeling. As shown in the MD work by Li and Li in an extensive MD simulation [12], the softening is due to the loss of elastic rigidity in the sense of the decreasing of material’s shear modulus caused by the volume dilatation close to the yielding point. The constitutive modeling performed here demonstrated that it is likely the latter is responsible for the initiation of the shear banding. Our recent modeling using a coupled thermal-mechanical model indicates that local heating induced localization is not the dominant mechanism, at least at low strain rate as normally seen in experiments [39].

4.3. Shear Band Inclination Angles and Strength Differential Effect

In this section, we will further investigate the shear banding by all the three models with the particular emphasis on the comparison of the shear band angles and the strength differential effect, i.e., through J2P and DP models. It is observed in experiments that the shear band angle of metallic glasses usually do not follow the directions of the maximum resolved shear stress predicted by the von Mises model [40,41]. When the von Mises model is modified through different ways to incorporate the pressure component of the stress, such as in the J2P model, no significant change is observed in the shear band angle deviation. Instead, we observe only a change in the strength asymmetry between tension and compression. To represent this asymmetry, a variable called strength differential effect defined as
Metals 02 00488 i027
is used, where σc and σt are yield stress for compression and tension, respectively.
As we see in Figure 4a, the stress difference between plain strain tension and compression are very minimum for the J2 model. For the DP model, it is not hard to find that the SD is associated with the pressure dilation coefficient a. Thus SD was calculated based on a series of simulations using different pressure dilation coefficient a. We found that the stress difference increases with the pressure dilation coefficient a. And a = 0.17 gives a reasonable SD = 24%, which agrees with the experimental investigation.
As discussed in section 2, the deviation of the shear band angles is due to the plastic dilatation (Equation 19). As shown in section 4.1, the DP model that we developed is capable of representing the plastic dilatation. Therefore, we would expect that the DP model could also predict the correct shear band inclination angle. Here we will compare the von Mises model with J2P as well as the DP models on this point. For the sake of consistency, we use exactly the same initial free volume configuration in the samples for the simulations by assigning each element with the free volume of
Metals 02 00488 i028
where NOEL is the number to label the element, which is randomly assigned when the sample is freely meshed [33]. This method can give an approximate randomly distributed free volume with mean value of 0.05 and variance of 0.0001. Moreover, the configuration is kept the same when we deform the same sample.
Figure 6 shows the contours of the strain for plane strain tension by (a) J2 model, (b) J2P model, (c) DP model with a = 0.045 and plane strain compression, (d) J2 model, (e) J2P model, (f) DP model with a different a = 0.087. All the contours are plotted at the time when the processes of shear banding are completed, that is, right after the yielding.
Figure 6. Shear band formation under plane strain tension by (a) J2 model, (b) J2P model, (c) DP model (a = 0.045), and under plane strain compression by (d) J2 model, (e) J2P model, (f) DP model(a = 0.087).
Metals 02 00488 g006
Firstly, we compare the shear band angles on these SB contours. Because we have multiple “bands” on each configuration, the quantitative measurements will contain certain fluctuations. For clarity, we first visualize the major shear bands by drawing the parallel lines along each band to indicate the orientations of shear bands and then make a direct measurement of the angles. The quantitative analysis will be considered later on. No matter for tension or for compression, the J2 and J2P models show nothing but 45°, whereas the DP model gives obvious changes. For tension, the DP model shifts the shear band up and gives an angle greater than 45°, while for compression the shear band is shifted lower and the angle is less than 45°. These angle deviations given by the DP model capture the trend qualitatively as found by extensive experimental measurements [41].
The reason we used a larger coefficient a (0.087) for compression than for tension is that compression was found not as sensitive to the coefficient a as in tension. The shear band angle change for compression by the DP model with a = 0.045 is too small for visualization in this round of comparisons. However, we show that it does give SB angle change, although it is small. [31]
Although the J2P model cannot predict the shear band angle change, it does have some effect on the shear bands. From Figure 6b,e, J2P model seems to generate more shear bands than J2 model in tension and less in compression. If we calculate the ratios of the maximum and minimum strain, the strain in shear bands from the J2P model is much less localized than those from J2 and DP model, which means that including pressure effect via Equations 8 and 9 gives the material a tendency to deform more uniformly, or increase the shear band density. As discussed above, in J2P model the tensile pressure will make the free volume production easier, resulting in more shear bands as shown in Figure 6b, whereas the compressive pressure will diminish the shear bands more effectively, as shown in Figure 6e. We also noticed that this effect is less pronounced in compression than in tension, which is consistent with the discussion in section 2.3.

5. Conclusions

Based on the free volume theory, three elastoplastic models with different yield criteria have been examined and compared in describing deformation of bulk metallic glasses. The conclusions are summarized here:
  • Shear banding as the inhomogeneous deformation mode of metallic glass was first simulated by the J2 model for both plane strain tension and compression. The results show the detailed dynamic process of formation of shear bands. Starting from the randomly distributed initial free volume configuration, severe strain localization in the form of shear bands was observed when the material yields, which is accompanied with abrupt increases of free volume.
  • Shear band angles and SD effect are two commonly observed phenomena. The shear band angles were first compared among the three models. The DP model gives a larger than 45° shear band angle in tension and a smaller than 45° in compression, all in agreement with experimental findings, while J2 and J2P models predicted the same 45° in both tension and compression. The results show that the shear band inclination angle change is related to the hydrostatic stress during the localized deformation of metallic glasses.
  • While the J2 does not predict SD effect at all, the J2P and DP models do. The SD effect described by DP model was also found to show increasing dependence of coefficient a. The most reasonable SD (24%) corresponds to the coefficient a of the value 0.17, which agrees well with the experimental result.
Despite the success of the DP model as compared with the J2 and J2P models, there might be limitations imposed by various parts of the constitutive models. One is the free volume model on which all these constitutive models are based. Although some key features can be captured including shear localization, shear band inclination angle, and tension-compression strength differential effect, we are still not able to see serrated flow. This is due partly to the rapid increase of free volumes. Another potential limitation is from the transition state theory where only the activation barrier is considered. As a result, after generalization into continuum simulation, the integration method is only performed at the single Gaussian point. It is difficult for this kind of local plasticity model to fulfill the strain compatibility requirements especially when the strain is highly localized. These issues, along with several numerical optimization methods, are currently being addressed by the authors.

Acknowledgment

We would like to thank the financial support of this work provided by an NSF EAger grant under the contract number NSF-1193590.

Conflict of Interest

The authors declare no conflict of interest.

References

  1. Webb, T.W.; Zhu, X.H.; Aifantis, E.C. A simple method for calculating shear band angles for pressure sensitive plastic materials. Mech. Res. Commun. 1997, 24, 69–74. [Google Scholar] [CrossRef]
  2. Peker, A.; Johnson, W.L. A highly processable metallic glass—Zr41.2Ti13.8Cu12.5Ni10.0Be22.5. Appl. Phys. Lett. 1993, 63, 2342–2344. [Google Scholar] [CrossRef]
  3. Ashby, M.F.; Greer, A.L. Metallic glasses as structural materials. Scr. Mater. 2006, 54, 321–326. [Google Scholar] [CrossRef]
  4. Loffler, J.F. Bulk metallic glasses. Intermetallics 2003, 11, 529–540. [Google Scholar] [CrossRef]
  5. Conner, R.D.; Rosakis, A.J.; Johnson, W.L.; Owen, D.M. Fracture toughness determination for a beryllium-bearing bulk metallic glass. Scr. Mater. 1997, 37, 1373–1378. [Google Scholar] [CrossRef]
  6. Demetriou, M.D.; Launey, M.E.; Garrett, G.; Schramm, J.P.; Hofmann, D.C.; Johnson, W.L.; Ritchie, R.O. A damage-tolerant glass. Nat. Mater. 2011, 10, 123. [Google Scholar]
  7. Schuh, C.A.; Nieh, T.G. A nanoindentation study of serrated flow in bulk metallic glasses. Acta Mater. 2003, 51, 87–99. [Google Scholar] [CrossRef]
  8. Spaepen, F. Microscopic mechanism for steady-state inhomogeneous flow in metallic glasses. Acta Metall. 1977, 25, 407–415. [Google Scholar]
  9. Argon, A.S. Plastic-deformation in metallic glasses. Acta Metall. 1979, 27, 47–58. [Google Scholar] [CrossRef]
  10. Hufnagel, T.C. Preface to the viewpoint set on mechanical behavior of metallic glasses. Scr. Mater. 2006, 54, 317–319. [Google Scholar] [CrossRef]
  11. Eyring, H. Viscosity, plasticity, and diffusion as examples of absolute reaction rates. J. Chem. Phys. 1936, 4, 283–291. [Google Scholar] [CrossRef]
  12. Li, Q.K.; Li, M. Atomistic simulations of correlations between volumetric change and shear softening in amorphous metals. Phys. Rev. B 2007, 75, 094101. [Google Scholar] [CrossRef]
  13. Li, Q.K.; Li, M. Molecular dynamics simulation of intrinsic and extrinsic mechanical properties of metallic glasses. Intermetallics 2006, 14, 1005. [Google Scholar] [CrossRef]
  14. Li, Q.K.; Li, M. Atomic scale characterization of shear bands in an amorphous metal. Appl. Phys. Lett. 2006, 88, 241903. [Google Scholar]
  15. Guo, Y.Z.; Li, M. Equation of state and topological transitions in amorphous solids under hydrostatic compression. J. Appl. Phys. 2010, 108, 113510. [Google Scholar]
  16. Li, Q.K.; Li, M. Effects of surface imperfections on deformation and failure of amorphous metals. Appl. Phys. Lett. 2006, 87, 031910. [Google Scholar]
  17. Steif, P.S. Ductile versus brittle behavior of amorphous metals. J. Mech. Phys. Solids 1983, 31, 359–388. [Google Scholar] [CrossRef]
  18. Huang, R.; Suo, Z.; Prevose, J.H.; Nix, W.D. Inhomogeneous deformation in metallic glasses. J. Mech. Phys. Solids 2002, 50, 1011–1027. [Google Scholar]
  19. Gao, Y.F. An implicit finite element method for simulating inhomogeneous deformation and shear bands of amorphous alloys based on the free-volume model. Modell. Simul. Mater. Sci. Eng. 2006, 14, 1329–1345. [Google Scholar] [CrossRef]
  20. Donovan, P.E. A yield criterion for Pd40Ni40P20 metallic-glass. Acta Metall. 1989, 37, 445–456. [Google Scholar] [CrossRef]
  21. Bruck, H.A.; Christman, T.; Rosakis, A.J.; Johnson, W.L. Quasi-static constitutive behavior of Zr41.25Ti13.75Ni10Cu12.5Be22.5 bulk amorphous-alloys. Scr. Metall. Mater. 1994, 30, 429–434. [Google Scholar]
  22. Lewandowski, J.J.; Lowhaphandu, P. Effects of hydrostatic pressure on the flow and fracture of a bulk amorphous metal. Philos. Mag. 2002, 82, 3427–3441. [Google Scholar] [CrossRef]
  23. Anand, L.; Su, C. A theory for amorphous viscoplastic materials undergoing finite deformations, with application to metallic glasses. J. Mech. Phys. Solids 2005, 53, 1362–1396. [Google Scholar]
  24. Eshelby, J.D. The continuum theory of lattice defects. Solid State Phys. 1956, 3, 79–144. [Google Scholar] [CrossRef]
  25. Flores, K.M.; Dauskardt, R.H. Mean stress effects on flow localization and failure in a bulk metallic glass. Acta Mater. 2001, 49, 2527–2537. [Google Scholar] [CrossRef]
  26. Guo, Y.Z.; Li, M. Atomistic simulation of a NiZr model metallic glass under hydrostatic pressure. Appl. Phys. Lett. 2009, 94, 051901. [Google Scholar] [CrossRef]
  27. Anand, L.; Gu, C. Granular materials: Constitutive equations and strain localization. J. Mech. Phys. Solids 2000, 48, 1701–1733. [Google Scholar] [CrossRef]
  28. Bowden, P.B.; Jukes, J.A. The plastic-flow of isotropic polymers. J. Mater. Sci. 1972, 7, 52–63. [Google Scholar]
  29. Drucker, D.C.; Prager, W. Soil mechanics and plastic analysis or limit design. Q. Appl. Math. 1952, 10, 157–165. [Google Scholar]
  30. Chen, W.F. Plasticity in Reinforced Concrete; J. Ross Publishing: New York, NY, USA, 1982. [Google Scholar]
  31. Zhao, M.; Li, M. Interpreting the change in shear band inclination angle in metallic glasses. Appl. Phys. Lett. 2008, 93, 241906. [Google Scholar] [CrossRef]
  32. Steif, P.S.; Spaepen, F.; Hutchinson, J.W. Strain localization in amorphous metals. Acta Metall. 1982, 30, 447–455. [Google Scholar]
  33. Abaqus online manual. Available online: http://www.3ds.com/products/simulia/support/documentation/ (accessed on 3 December 2012).
  34. Loret, B.; Prevost, J.H. Accurate numerical-solutions for drucker-prager elastic-plastic models. Comput. Method. Appl. Mech. Eng. 1986, 54, 259–277. [Google Scholar] [CrossRef]
  35. Hjiai, M.; Fortin, J.; de Saxce, G. A complete stress update algorithm for the non-associated Drucker-Prager model including treatment of the apex. Int. J. Eng. Sci. 2003, 41, 1109–1143. [Google Scholar] [CrossRef]
  36. Zhao, M.; Li, M. A constitutive theory and modeling on deviation of shear band inclination angles in bulk metallic glasses. J. Mater. Res. 2009, 24, 2688–2696. [Google Scholar] [CrossRef]
  37. Pampillo, C.A. Flow and fracture of amorphous alloys. J. Mater. Sci. 1975, 10, 1194. [Google Scholar] [CrossRef]
  38. Wright, W.J; Hufnagel, T.C.; Nix, W.D. Free volume coalescence and void formation in shear bands in metallic glass. J. Appl. Phys. 2003, 93, 1432. [Google Scholar] [CrossRef]
  39. Zhao, M.; Li, M. Local heating in shear banding of metallic glasses. Scr. Mater. 2011, 65, 493. [Google Scholar] [CrossRef]
  40. Lund, A.C.; Schuh, C.A. The Mohr-Coulomb criterion from unit shear processes in metallic glass. Intermetallics 2004, 12, 1159–1165. [Google Scholar] [CrossRef]
  41. Zhang, Z.F.; He, G.; Eckert, J.; Schultz, L. Fracture mechanisms in bulk metallic glassy materials. Phys. Rev. Lett. 2003, 91, 045505. [Google Scholar] [CrossRef]

