Article

Analytical Solutions and Case Studies on Stress-Dependent Corrosion in Pressurized Spherical Vessels

by
Cheng Huijuan Liu
1 and
Giuseppe Lacidogna
2,*
1
Department of Mathematics, Aberystwyth University, Aberystwyth SY23 3BZ, UK
2
Department of Structural, Geotechnical and Building Engineering, Politecnico di Torino, 10129 Turin, Italy
*
Author to whom correspondence should be addressed.
Metals 2023, 13(12), 1918; https://doi.org/10.3390/met13121918
Submission received: 6 October 2023 / Revised: 13 November 2023 / Accepted: 15 November 2023 / Published: 21 November 2023
(This article belongs to the Section Corrosion and Protection)

Abstract

:
In this paper, we present an overview of all analytical engineering solutions delivered over the past 60 years for corrosion problems in pressure vessels. We briefly detail the strengths and weaknesses of existing approaches, thus demonstrating the need for novel uniform corrosion analysis methods for both current and new applications. To complement the review, we also present a new analytical model allowing the estimation of the lifetime of pressured elastic vessels with mechanically assisted corrosion. Both internal/external pressure and internal/external corrosion are captured, and dissolution-driven corrosion is also considered. The readily implemented method improves existing analytical approaches and is shown to be effective for thin and thick shells, as well as various loading and corrosion intensity and geometrical conditions.

1. Introduction

1.1. Corrosion Research

Corrosion problems are common in pressure vessels of iron or steel during operation [1,2]. Chemical corrosion [3] often occurs when they operate in dry environments. Conversely, in a humid (or water) environment, electrochemical corrosion occurs. These two types of corrosion will cause the loss of metal, which will in turn cause the container to crack, thus losing stability/ultimate bearing capacity, shortening the service life, and greatly increasing the risk of various accidents and losses of the container. This problem also widely exists in other similar metal components, such as aerial vehicles [4], liquid hydrogen transportation pipelines [5], high temperature furnace devices, [6], oil (gas) pipelines [7], chemical building components [8], marine platform components [9], marine submarines [10], and wearable device components [11,12]. These are used as air/land/sea infrastructure, equipment (devices), and other important military or pharmaceutical components.

1.2. Corrosion Problems of Pressure Vessels

Regarding the corrosion of pressure vessels, many studies have focused on the specific development process of electrochemistry and the chemistry of metals [13,14,15,16,17,18,19,20]. Furthermore, other researchers do not discuss the chemistry process, and all possible chemical reactions are modeled with the help of certain kinetic phenomenological laws. In this paper, we mainly focus on such phenomenological models since other types of models, such as quantitative or analytical models, are relatively lacking [21].

1.2.1. Phenomenological Model

In the study of the phenomenological models, the corrosion process is usually regarded as uniform wear or dissolution of materials [19]. In pressure vessels, this is often assisted by mechanical stress. In order to establish this model, the relationship between the corrosion rate and stress of the stressed component (a circular tube) [22] must therefore first be understood.
In [23], a linear model, largely from experience, was proposed. The authors of [24] had some difficulties in expressing the effect of temperature on corrosion rate and mechanical stress. In the papers of Gutman et al. [25,26,27], an Arrhenius temperature model was introduced and, considering the classical thermodynamic laws, it was combined with a significant amount of experimental data. This model explained the relationship between environmental temperature, stress, and velocity, although it has some problems in expressing the inhibition phenomenon in corrosion processes. In [25], a corrosion inhibition coefficient was established and a mixed model with both polynomial and exponential terms was adopted. This model has been used previously to explain such corrosion inhibition phenomenon described above, but it still has problems in explaining coating protection and rupture phenomena. Quadratic, cubic, and general cubic polynomial models were proposed in [28]. These models have been instrumental in improving the description of existing experimental data and phenomena, but they have difficulties in expressing threshold stress explicitly (including temperature) and in capturing the phenomenon of coating breakage.
Recently, an idea has been advanced in [28] to introduce a stress threshold quantity into the model explained in [29], leading to a segmented corrosion model. However, it gives some results that are inconsistent with experimental phenomena when describing vessel corrosion problems with small stresses. In order to improve the above models, in 2016 Gutman, based on the model in [25], formulated a new one. Even though it achieved the purpose of simultaneously describing the relationship between media activation energy, it was not suitable for characterizing the mechanical stress induced by temperature and did not sufficiently describe its interaction with corrosion rate. Moreover, it had difficulties in describing some experimental phenomena consistently. In regards to this problem, in [30] the temperature, T j , along with a threshold temperature, T j t h , plus an empirical parameter, β i / β o , was introduced into the model already presented in [31]. However, this parameter lacks a clear physical interpretation. This last model [30] enables one to describe the effect of thermal stress on corrosion rate and mechanical stress and presents the monotonical effect of temperature difference between the outer and inner surface on corrosion rate and lifetime. However, it has some computational difficulties for a case with a temperature larger than the temperature threshold.

1.2.2. Experimental Research and Data

Most of the phenomenological models described above did not provide related experimental validation. However, before these phenomenological models were proposed, a large amount of experimental data had already been accumulated [25,26,27,32,33,34]. By reviewing the experimental research from these works, we obtained effective experiments and their data. Some of them have direct or indirect contributions (relationships) to several of the corrosion models successively proposed by Gutman’s team. If these data can be employed properly to verify the corresponding corrosion model, the lack of current model validation will be improved.

1.2.3. Theories on Corrosion Lifetime (Including Failure Criteria)

Existing Shell Stresses Distribution Equations

The accurate expression for the stress distribution (mechanical stress) on the sphere shell in the absence of temperature effects comes in the form of Lamé formulas. Researchers have always adopted the formulas of this equation with different assumptions (sometimes adding certain new terms, such as temperature) in different periods to obtain an analytical solution. In [23], such a stress distribution equation is proposed with a constant average diameter. In the works of [32,34,35,36], the average diameter is replaced by the mid-surface radius, rc, but it is still constant. In [31], based on Lamé formulas, new assumptions were introduced, but they performed poorly in mathematical operations (e.g., Taylor expansion) with an intermediate variable, η , less than or close to 1.0. In [35], the mid-plane radius, rc, was introduced into the first-order Lamé stress distribution equation. From the conclusions, an analytical solution was obtained that was as simple as the ones based on Laplace laws, but with better accuracy. However, it is difficult to describe the change of temperature stress on mechanical stress and corrosion rate. The model [30] was further improved by introducing the outer/inner radius ratio, η , and adding the temperature term. However, it has a little difficulty in expressing the effect of the inner and outer temperature values on the stress, and also adds further complexity in implementation.
In summary, the key to achieving a better model is to obtain a new analytical solution expressed by a new proper intermediate variable. For example, it will be possible to implement using the analytical solution based on x proposed in this paper.

Analytical Relationship between Vessel Stress/Thickness and Time

The first solution is based on Laplace laws, such as those in [36]. It uses a stress distribution format expressed as a constant midplane radius. There are still difficulties in a broader range of applications, but there is better accuracy in such applications. The second solution is that adopted in [35], which can be applied in a broader range and, simultaneously, ensures better accuracy. When used for medium and thick shells, it is difficult and laborious to maintain a sufficient accuracy.
Recently, [37] used the Southwell plot method, where an estimation method is proposed for the critical thickness, critical life, and critical stress of the shell, while the accurate failure criterion is avoided.

Failure Criteria for Further Life Problems (or Critical Stress or Critical Thickness) and Its Assumptions

Researchers have proposed different failure criteria to study the pressure vessel corrosion problem (life problem) [38], and they have various forms [23,27,32,34,35,36,39,40] but when stressed shells fail under the action of corrosion as well as force or pressure, their critical state will move in both space and time. However, if we want to find it precisely in time and space, there are still some difficulties, even though [38,41] discovered this phenomenon and [30] redefines failure (lifetime).

1.3. Aspects Requiring Further Analysis

Here we briefly detail the strengths and weaknesses of the existing approaches:
  • It is challenging to improve (or create a new model) the current corrosion kinetic models based on the existing amount of test data.
    One reason is the restricted amount of data from real engineering applications required to verify or improve the validity of those models used in the corrosion problem of pressure vessels. Another is the huge money and time cost of data collection for shells with a generally long lifetime.
  • The assumptions of the stress distribution equation need to be further optimized.
    These simplified stress distribution equations, based on Lamé formulas or Laplace laws, are not perfect. For some, there are many assumptions, resulting in a decrease in accuracy or a narrow range of applications. Some, with few assumptions, make it difficult to obtain an analytical solution that is easy to program or friendly to engineering applications.
  • Delivering difficulties of existing analytical methods.
  • New applications (beyond pressure vessels) urgently need more efficient and easy-to-program analytical methods.
In general, we still lack an analytical solution that is simple enough in form that can analyze both thin and thick shells, adapt to complex working conditions, and maintain accurate and rapid expressions. Furthermore, the need is increased by vessels becoming more advanced and complex in industry and other related land or sea infrastructure components.

1.4. Suggested Improvement in Analysis of the Vessel Corrosion Problems

After the previous considerations regarding the current research situation, we will seek to improve the analytical theory of general corrosion problems to cover the lifetime problem of corroded pressure vessels.
Under this theoretical framework, we will use valid test data and data processing techniques to verify the existing corrosion models and select a more appropriate one. In addition, we will employ mathematical techniques to establish time-varying failure criteria. Our goal is to obtain a new analytical method and use it more effectively to predict the lifetime of pressured elastic spherical shells with mechanically assisted corrosion. This new method will likely meet the higher demand for security assessments or regular inspections in new applications.
In Section 2 of the paper, we introduce the problem formulation. Section 3 is devoted to solving this formulation in order to obtain a new analytical method. Section 4 will address case studies of particular interest to showcase the solution’s predictive capabilities. Section 5 summarizes and discusses our findings.

2. Problem Formulation

2.1. Characterization of Shell State

We know that the boundary state can theoretically characterize the state of the shell, S ( t ) , including stress and geometry, and can be described by the state of the mass point on the inner surface, B i ( t ) . Therefore, we can choose any point, M, on the inner boundary of the shell as the research object, as shown in Figure 1. The purpose is to obtain the spatial position ( h , r c ) of this point and the associated stress, σ ( t ) , in time, and then to obtain h * , t * of the shell, which is in a critical state of failure.
As the corrosion progresses, the boundary points (such as M) may dissolve in the next moment, and the new interior points (such as M n ) will become new boundary points.

2.1.1. For Solving h and rc (Solution of the Problem for Stresses)

Following our predecessors’ practice, this paper starts fundamentally from the accurate solution for the stress balance equation, known as Lamé formulas:
σ θ r i = r i 3 r o 3 r i 3 1 + r o 3 2 r i 3 P i r o 3 r o 3 r i 3 1 + r i 3 2 r i 3 P o ,
σ θ r o = r i 3 r o 3 r i 3 1 + r o 3 2 r o 3 P i r o 3 r o 3 r i 3 1 + r i 3 2 r o 3 P o .
Firstly, in order to help in decoupling differential equations later, we introduce a new intermediate variable, x: x = h/rc. Then, using x to rewrite the Equation (1) [42], and also by conducting Taylor expansion considering that x is typically less than unity, we obtain:
σ θ r i = 1 2 x x 2 48 1 4 + 3 x 8 P i 1 2 x + x 2 16 + 3 4 + 3 x 8 P o w x ,
and
σ θ r o = 1 2 x x 2 16 3 4 + 3 x 8 P i 1 2 x + x 2 48 + 1 4 + 3 x 8 P o w x .
Here, w ( x ) = 1 /   ( 1 + x 2 12 ) .
Equation (2) can be easily rewritten as:
σ θ ( r i ) = f ( x ) ( p i p o ) p i + 3 p o 4 ,
and
σ θ ( r o ) = f ( x ) ( p i p o ) 3 p i + p o 4 .
Physically, Equation (3) represents the coefficient of the time-variant thickness-to-radius ratio that describes the effect of corrosion on the effective stress of the shell under internal and external pressures.
According to existing kinetic corrosion equations [43], the relationship between vi, vo, σ(rj), and t is given by Equation (4).
v j = d r j d t = a j + m j σ r j e b t .
Considering h(t) = ro(t) − ri(t) and rc(t) = [ro(t) + ri(t)]/2, and substituting Equation (4) into Equation (3), gives
d h d t = ( a o a i ) + ( m o m i ) [ f ( x ) Δ p p i p o 2 ] e b t ,
and
d r c d t = ( a o + a i ) 2 + ( m o + m i ) 2 [ f ( x ) Δ p ( p i + p o ) ] e b t .
By dividing Equation (5a) by Equation (5b) and considering the time-variant relationship between the geometric parameters rc, h, and x, we obtain the phase trajectory of the system for the first time:
2 ( h x r c 0 ) + ( h 0 h ) 2 ( h x r c 0 ) ( h h 0 ) = a i + m i f x Δ p p i + 3 p o 4 a o + m o f x Δ p 3 p i + p o 4 .
Note that the phase trajectory expresses an important relationship between two dependent variables, h and rc, which is founded on the new intermediate variable, x (x = h/rc), introduced in this paper.
In this study, the th relationship is re-obtained based on a combination of Equations (3a) and (6). Whether or not numerical or analytical solutions can be obtained simultaneously depends on the assumptions made.
Previous studies have always assumed that rc = rc0 [36,37] (that is, rc is no longer a time-varying physical quantity) to achieve the decoupling of rc from time, t, simply, and accordingly, rc is decoupled from h and σ simultaneously. However, in this paper we would like to remain in the time-varying field to solve this moving boundary problem in a much more general way, aiming to obtain its analytical solution. Considering that x is small (always less than 1.0), we can ignore the higher-power terms x and ax2 and then smoothly establish a new expression of phase trajectory (Equation (6)):
x = e b + c / r c o + d / h .
Employing Equation (7), we can solve Equation (5a) and Equation (5b) to obtain the expressions for h and rc.

2.1.2. For Solving σ(t)

We follow the basic formulation of Lamé as
σ θ r i = r i 3 r o 3 r i 3 1 + r o 3 2 r i 3 P i r o 3 r o 3 r i 3 1 + r i 3 2 r i 3 P , o
σ θ r o = r i 3 r o 3 r i 3 1 + r o 3 2 r o 3 P i r o 3 r o 3 r i 3 1 + r i 3 2 r o 3 P o .
And from Equation (8), we can obtain the differential naturally [37], which is widely regarded as the most accurate solution and often used as the reference method:
d σ d t = 2 Δ p r c ( σ + δ ) 2 ( a ~ + m σ ) + σ + δ 2 r c ( a = + m = σ ) e b t .
We can rewrite Equation (9),
d σ d t = ( Δ 1 + Δ 2 + Δ 3 ) e b t ,
where
Δ 1 = 2 Δ p r c ( σ + δ ) 2 a ~ + m σ
Δ 2 = m = m Δ p r c 2 ( σ + δ ) 2
Δ 3 = σ + δ 2 r c ( a = + m = σ ) m = m Δ p r c 2 ( σ + δ ) 2
Here, a ~ = a i + a o m o Δ P / 2 , m = m i + m o , a = = a i a o + m o Δ P / 2 , m = = m i m o , δ = ( p i + 3 p o ) / 4 , and Δ p = p i p o .
For solving σ , an assumption, Δ 2 , Δ 3 = 0, has already been employed in the method of [37].
In this paper, we would like to retain one more assumption and put forward a new one:
Δ 3 = 0 .
From a formula truncation view, this assumption abandons fewer items and therefore in theory must be more accurate. Thus, we confidently hold that it will help to acquire a more accurate solution than before, hopefully promising an analytical one.
Based on Equations (10)–(12), we then obtain a new differential form as
d σ d t = ( Δ 1 + Δ 2 ) e b t .
In addition, based on Equation (13), σ ( r i ) can be solved.
For the sake of brevity, we will present our results for (h, rc) and σ ( r i ) in a straightforward manner below.

3. A New Analytical Method

3.1. Promotion of the Boundary Stress, σ

This paper obtains the analytical expressions for the stress, σ ( t ) , and the spatial position (h, rc,) of point M (see Figure 1). Its stress expression is:
b = 0
t = Δ p r c 2 ( a ~ m δ σ ) m a ~ m δ σ ln ( a ~ + m σ ) ( a ~ + m σ 0 ) ( σ 0 + δ σ ) ( σ + δ σ ) + σ σ 0 ( σ + δ σ ) ( σ 0 + δ δ ) ,
b ≠ 0
t = 1 1 b ln Δ p r c 2 ( a ~ m δ σ ) m a ~ m δ σ ln ( a ~ + m σ ) ( a ~ + m σ 0 ) ( σ 0 + δ σ ) ( σ + δ σ ) + σ σ 0 ( σ + δ σ ) ( σ 0 + δ δ ) } ,
where a ~ = a i + a o m o Δ p / 2 + ( m i m o ) ( m i + m o ) / 2 / r c .
Note that Equation (14) is practically identical to those in [37], while in its Equation (14) only parameter a ~ is different ( a ~ = a i + a o m R Δ p / 2 ).

3.2. Improvement of the Vessel Thickness, h

At the same time, the analytical formula for the thickness, h, at point M is also obtained as follows:
b = 0
t = h 0 h A + B A 2 ln A h + B A h 0 + B ,
b ≠ 0
t = 1 b ln 1 b [ h 0 h A + B A 2 ln A h + B A h 0 + B ] ,
where A = a o a i + m o 3 p i + p o 4 + m i p i + 3 p o 4 + 1 2 ( p i p o ) ( m o + m i ) b 1 + c / r c 0 e , B = 1 2 ( p i p o ) ( m o m i ) d e .
Here, a = 2 a i a o m i p i + 3 p o 4 + m o 3 p i + p o 4 , b 1 = 4 p i m o + p o m i a i a o , c = 2 h 0 a i a o m i p i + 3 p o 4 + m o 3 p i + p o 4 + 4 r c o a i + a o m i p i + 3 p o 4 m o 3 p i + p o 4 ,   d = h 0 p i p o m i m o + 2 r c o p i p o m i + m o , a n d   e = 2 p i p o m i + m o .
Note that Equation (15) is identical in form to those in [37], while in its Equations (12) and (13) only parameters A and B are different: A = a o a i + m o 3 p i + p o 4 + m i p i + 3 p o 4 , B = r c 0 2 ( p i p o ) ( m o m i ) .

3.3. Presentation of the Vessel Mid-Surface Radius, rc, in Time

Finally, we obtain the analytical formula of the mid-plane radius, rc, in time at point M for the first time, as follows:
b = 0
t = r c 0 r c A + B A 2 ln A r c + B A r c 0 + B ,
b ≠ 0
t = 1 b ln 1 + b r c 0 r c A + B A 2 ln A r c + B A r c 0 + B ,
where A = ( a o + a i m o 3 p i + p o 4 m i p i + 3 p o 4 ) / 2 + 1 4 ( p i p o ) ( m o m i ) b 1 + c / r c 0 e , and B = 1 4 ( p i p o ) ( m o m i ) d e .
Equation (16) shows a non-monotonic relationship between the function, rc, and time, t. In other words, rc is a nonlinear time variable. It is easy to foresee that this solution will theoretically maintain accuracy over the long-term domain. Conversely, if rc is simply assumed to be a non-time variable, rc0, as in [37], it will not.

3.4. Additional Interesting Finding

Additionally, there is an interesting finding that our analytical solutions for h (see Equation (15)) and rc (see Equation (16)) are quite similar in form, but two term signs (positive and negative) and coefficient expressions (A and B) are different.

4. Case Studies

In this Section, the ability to calculate stress, σ , and to track the spatial position (h, rc) at the point M in a particular case, and also in general cases, are verified one by one.
The method in [44] is chosen as the reference method for the reasons mentioned in Section 2.1. The corresponding predicting errors by our method are delivered together with ones from existing methods [32,37].
These error formulations are defined here in advance. e i j represents the error for i quantity by the method j compared with reference value. Here, i could be σ , h, rc, h*, or t*, while j will take the values W, P, or G. W represents the results from this method, R represents the reference value from [44], P represents the results from [37], and G represents the results from [32]. d i ( W , P ) represents the difference between h value predicted by method W and that by method P.
For example,
e h W = h ( W ) h ( R ) h ( R ) ,   d h ( W , P ) = h ( P ) h ( W ) h ( P )

4.1. Tracking Vessel σ and (h, rc) in Special Case

A thin-shell vessel model with an identical internal and external corrosion intensity, no corrosion inhibition, and with smaller internal or external pressures, such as wearable device components [11,12], is chosen as a special case, as employed in [37] (see Case 1). Case 1: p c , l c , and t c below denote international measure system units for pressure, length, and time, respectively, and the expressions are also adopted by other studies [31]. For p , p i , p , p o , p , | σ* | , r i 0 , r o 0 , λ a o , a i , m o , m i , and b, refer to the notation list in this paper.
p = 3 p c ,   p i = 15 [ p c ] ,   p o = 12 p c ,   p = min p i ,   p o ,   | σ * | = 300 [ p c ] ,   r i 0 = 78 l c ,
r o 0 = 82 l c ,   λ = 0.05 ,   a o = a i = 0.1 [ l c / t c ] ,   m o = m i = 0.0005 [ l c / t c p c ] ,   b = 0 .
The results by the proposed method are shown in the figures below.
As can be seen from Figure 2, the σ errors predicted by methods W and P are very close. The former has only a slight advantage over the latter. Thus, the new method, W, tracks stress more accurately, even in such special case. This law also holds true when predicting thickness, and the error of method G is the largest, as shown in Figure 3.
As can be seen from Figure 4, for the value of the predicted mid-surface radius, in this time domain, the orders of magnitude of the prediction error by the three methods are all very small. Among them, this method is consistent with the reference solution, and its accuracy is the highest.
In general, the errors of σ and (h, rc) predicted by this method and the existing two methods are all very small. Among them, the error of this method is the smallest, though its superiority is weak.

4.2. Tracking the h at Point M under the General Case

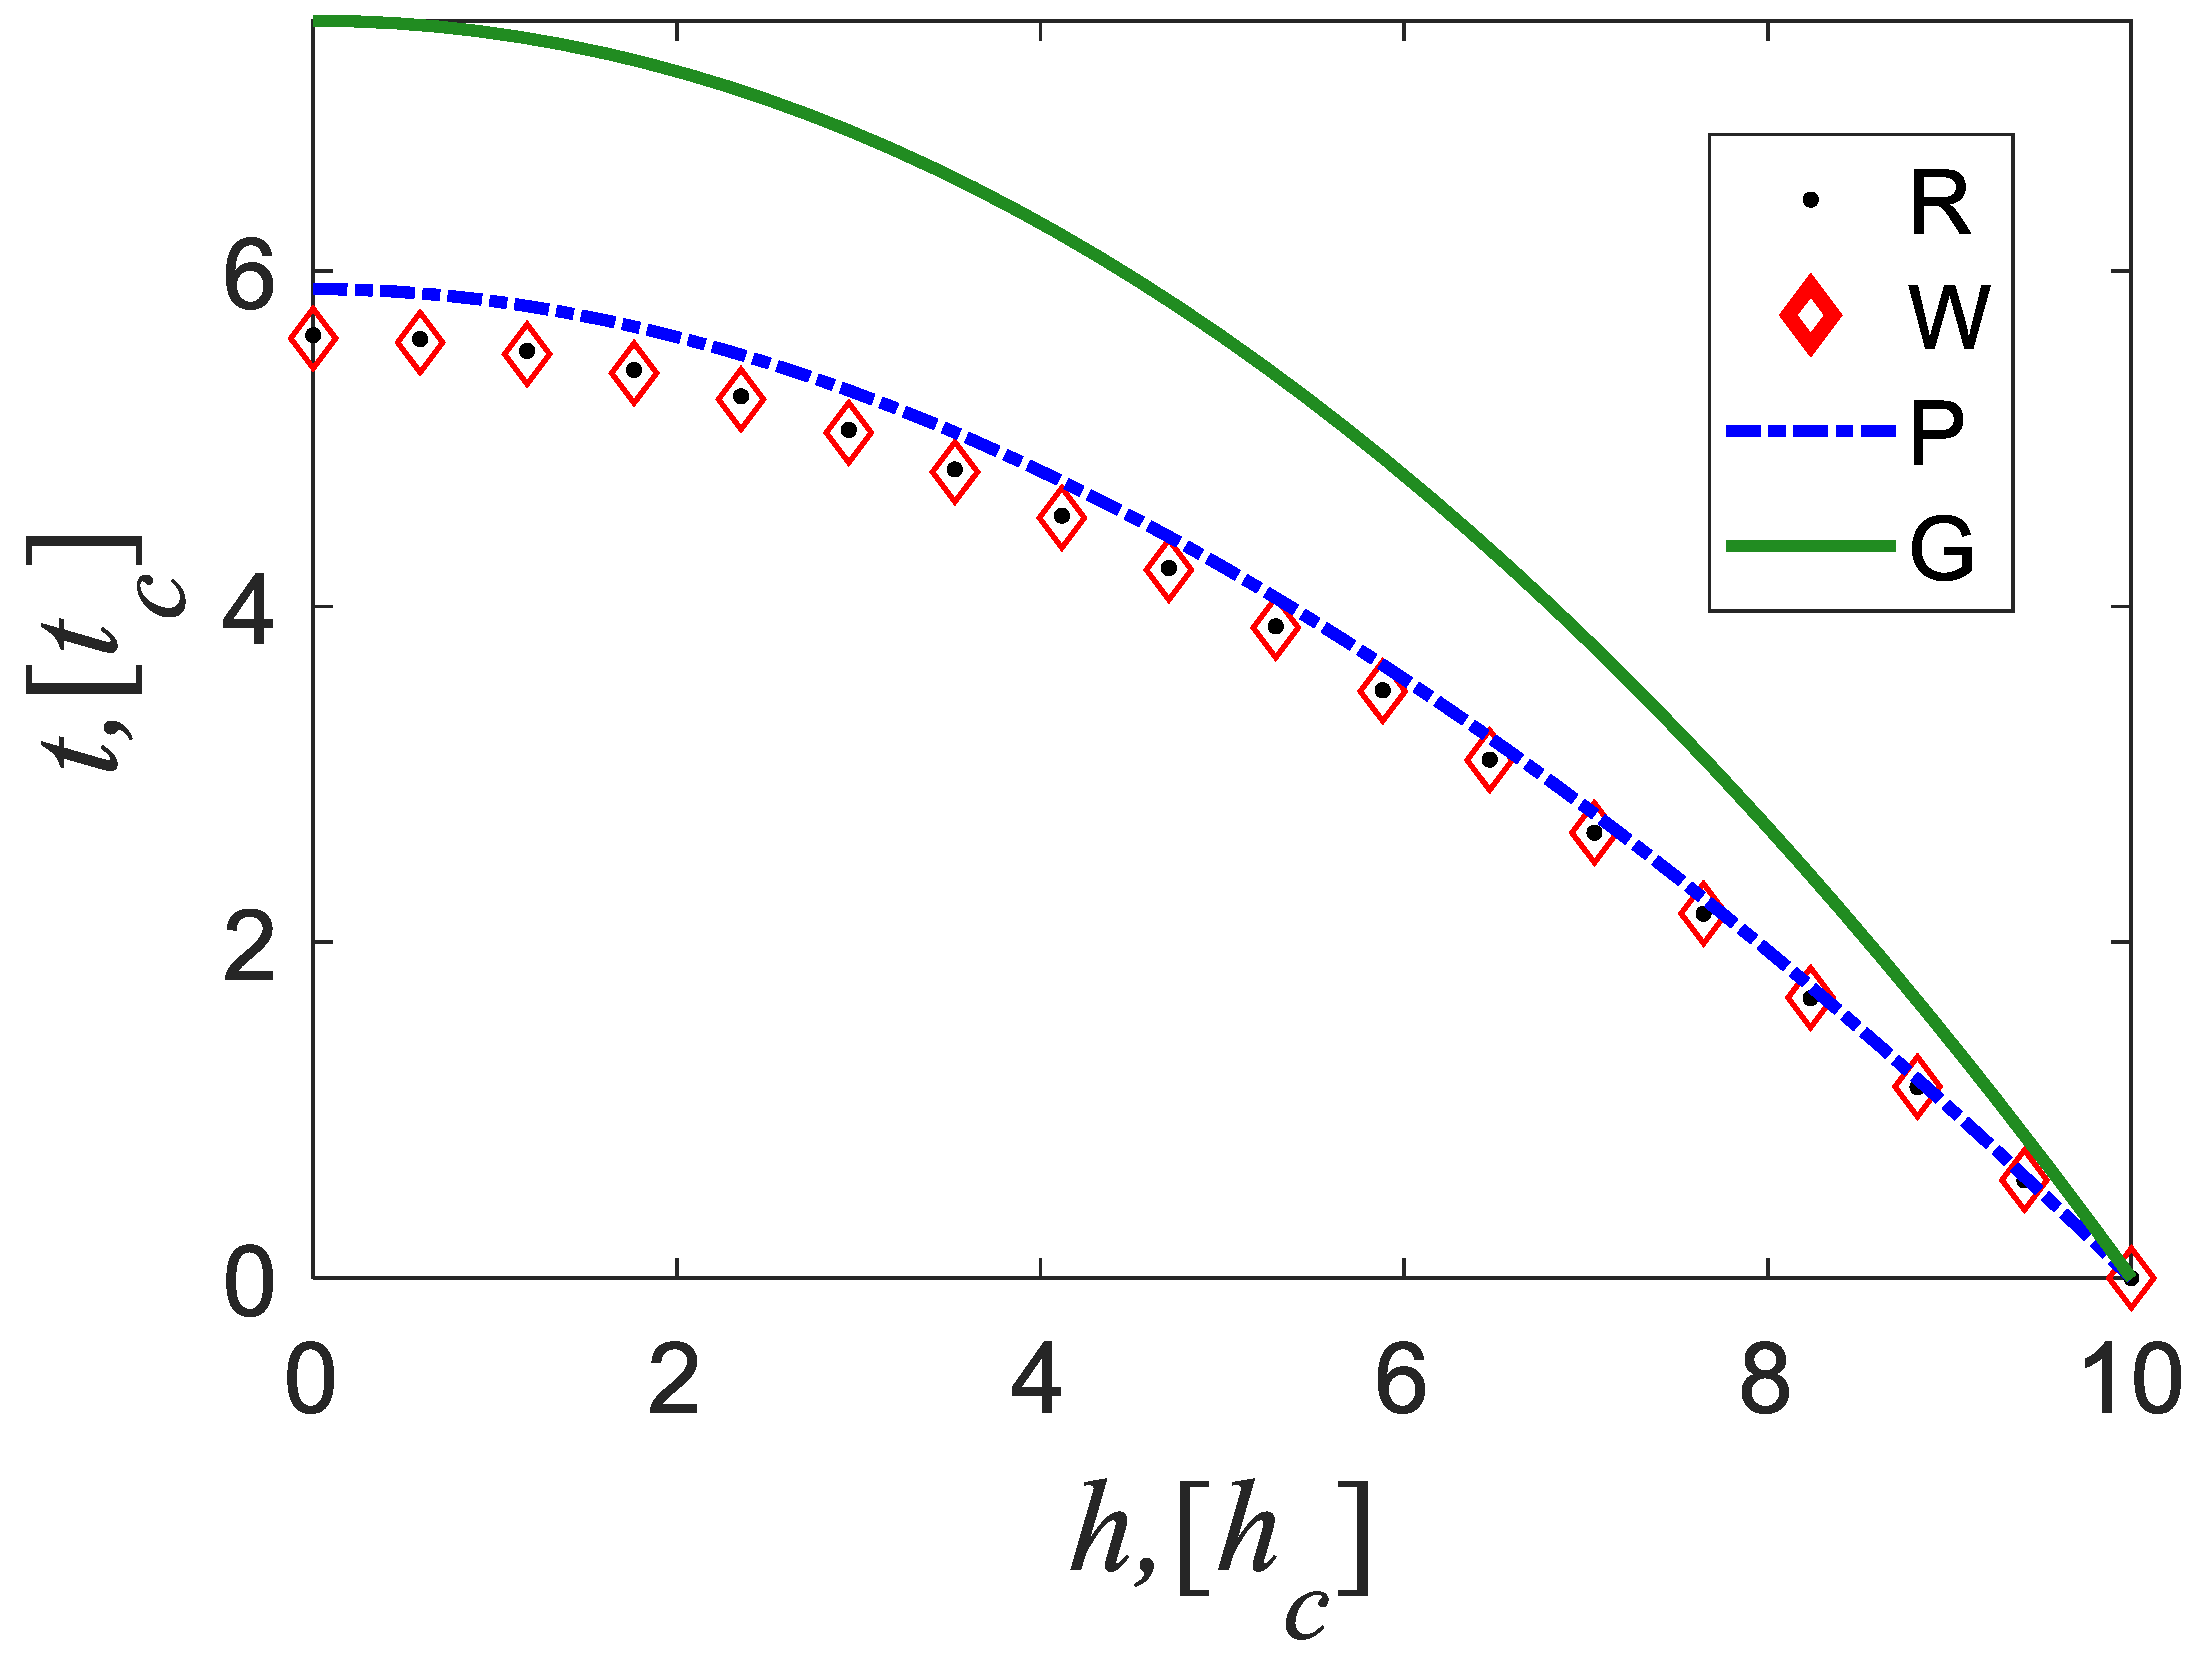
Unlike Case 1, in engineering applications such as chemical building components [8] and marine platform components [9], etc., the most common physics phenomena are that the internal and external corrosion intensity is rarely equal, the corrosion inhibition is functioning, and the vessel itself is not very thin. In order to research a more general model, we propose a new case with different internal and external corrosion strengths, non-zero corrosion inhibition, and thicker geometric dimensions; see Case 2. Its results are shown in Figure 5.
Note that the solution expression and its calculations for thickness and radius resemble Case 1; only the results for the former are delivered here for simplicity.
Case 2:
For p , p i , p o , p , | σ* | , r i 0 , r o 0 , λ , a o , a i , m o , m i , b, and v , refer to the notation list in this paper. p o = 210 p c , p i = 10 p c , λ = 0.3 , h 0 = 10 l c , a o = 0.001 [ l c / t c ], a i = 0.004 [ l c / t c ], m o = 0.004 l c t c p c , m i = 0.0016 [ l c / t c p c ], b = 0.001, E = 206,000 p c , v = 0.3 .
As shown in Figure 5, the ht curve predicted by our method almost coincides with the reference curve. Its accuracy is the highest, followed by [37], and the method in [32] is the lowest.

4.3. Tracking Vessel Boundary, Bi, and Shape, S, under the General Case

For other common engineering applications, such as oil (gas) pipelines [7] or high-temperature furnace devices [6], we seek to understand the difference between the vessel’s boundary position and shape as predicted by the proposed method and other methods. With the intention of describing this situation well, we set another general example; see Case 3. Unlike Case 2, its internal corrosion intensity is higher than the external one. Corresponding results are shown in Figure 6 and Figure 7.
Case 3:
For p o , p i , λ , h 0 , a o , a i , m o , m i , b, E, and v , refer to the notation list in this paper.
p o = 15 p c , p i = 180 p c , λ = 0.25 , h 0 = 10 l c , a o = 0.001 [ l c / t c ], a i = 0.02 [ l c / t c ], m o = 0.0004 l c t c p c , m i = 0.008 [ l c / t c p c ], b = 0.01, E = 206,000 p c , v = 0.3 .
From Figure 6, we can see that the accuracy of tracking thickness by this method is the highest. Consequently, we can quickly obtain the thickness predicted by each method at any time, tk (0 < tk < t*); in the same way, we could also obtain rc. We can then qualitatively draw the position of the boundary, B, and the shape of the shell, S, at time tk, as shown in Figure 7.
Figure 7 shows the significant differences between the three methods in tracking M positions (h, rc). MG is tracked by the method in [32]. However, tk is not a real boundary point, but an interior one. MP and MW are tracked by the method in [37] and this method, respectively. However, the two positions have already dissolved and disappeared at tk. Nevertheless, the MW by this method is the closest to the reference value.

4.4. Predicting the Shell Critical State (t*, h*)

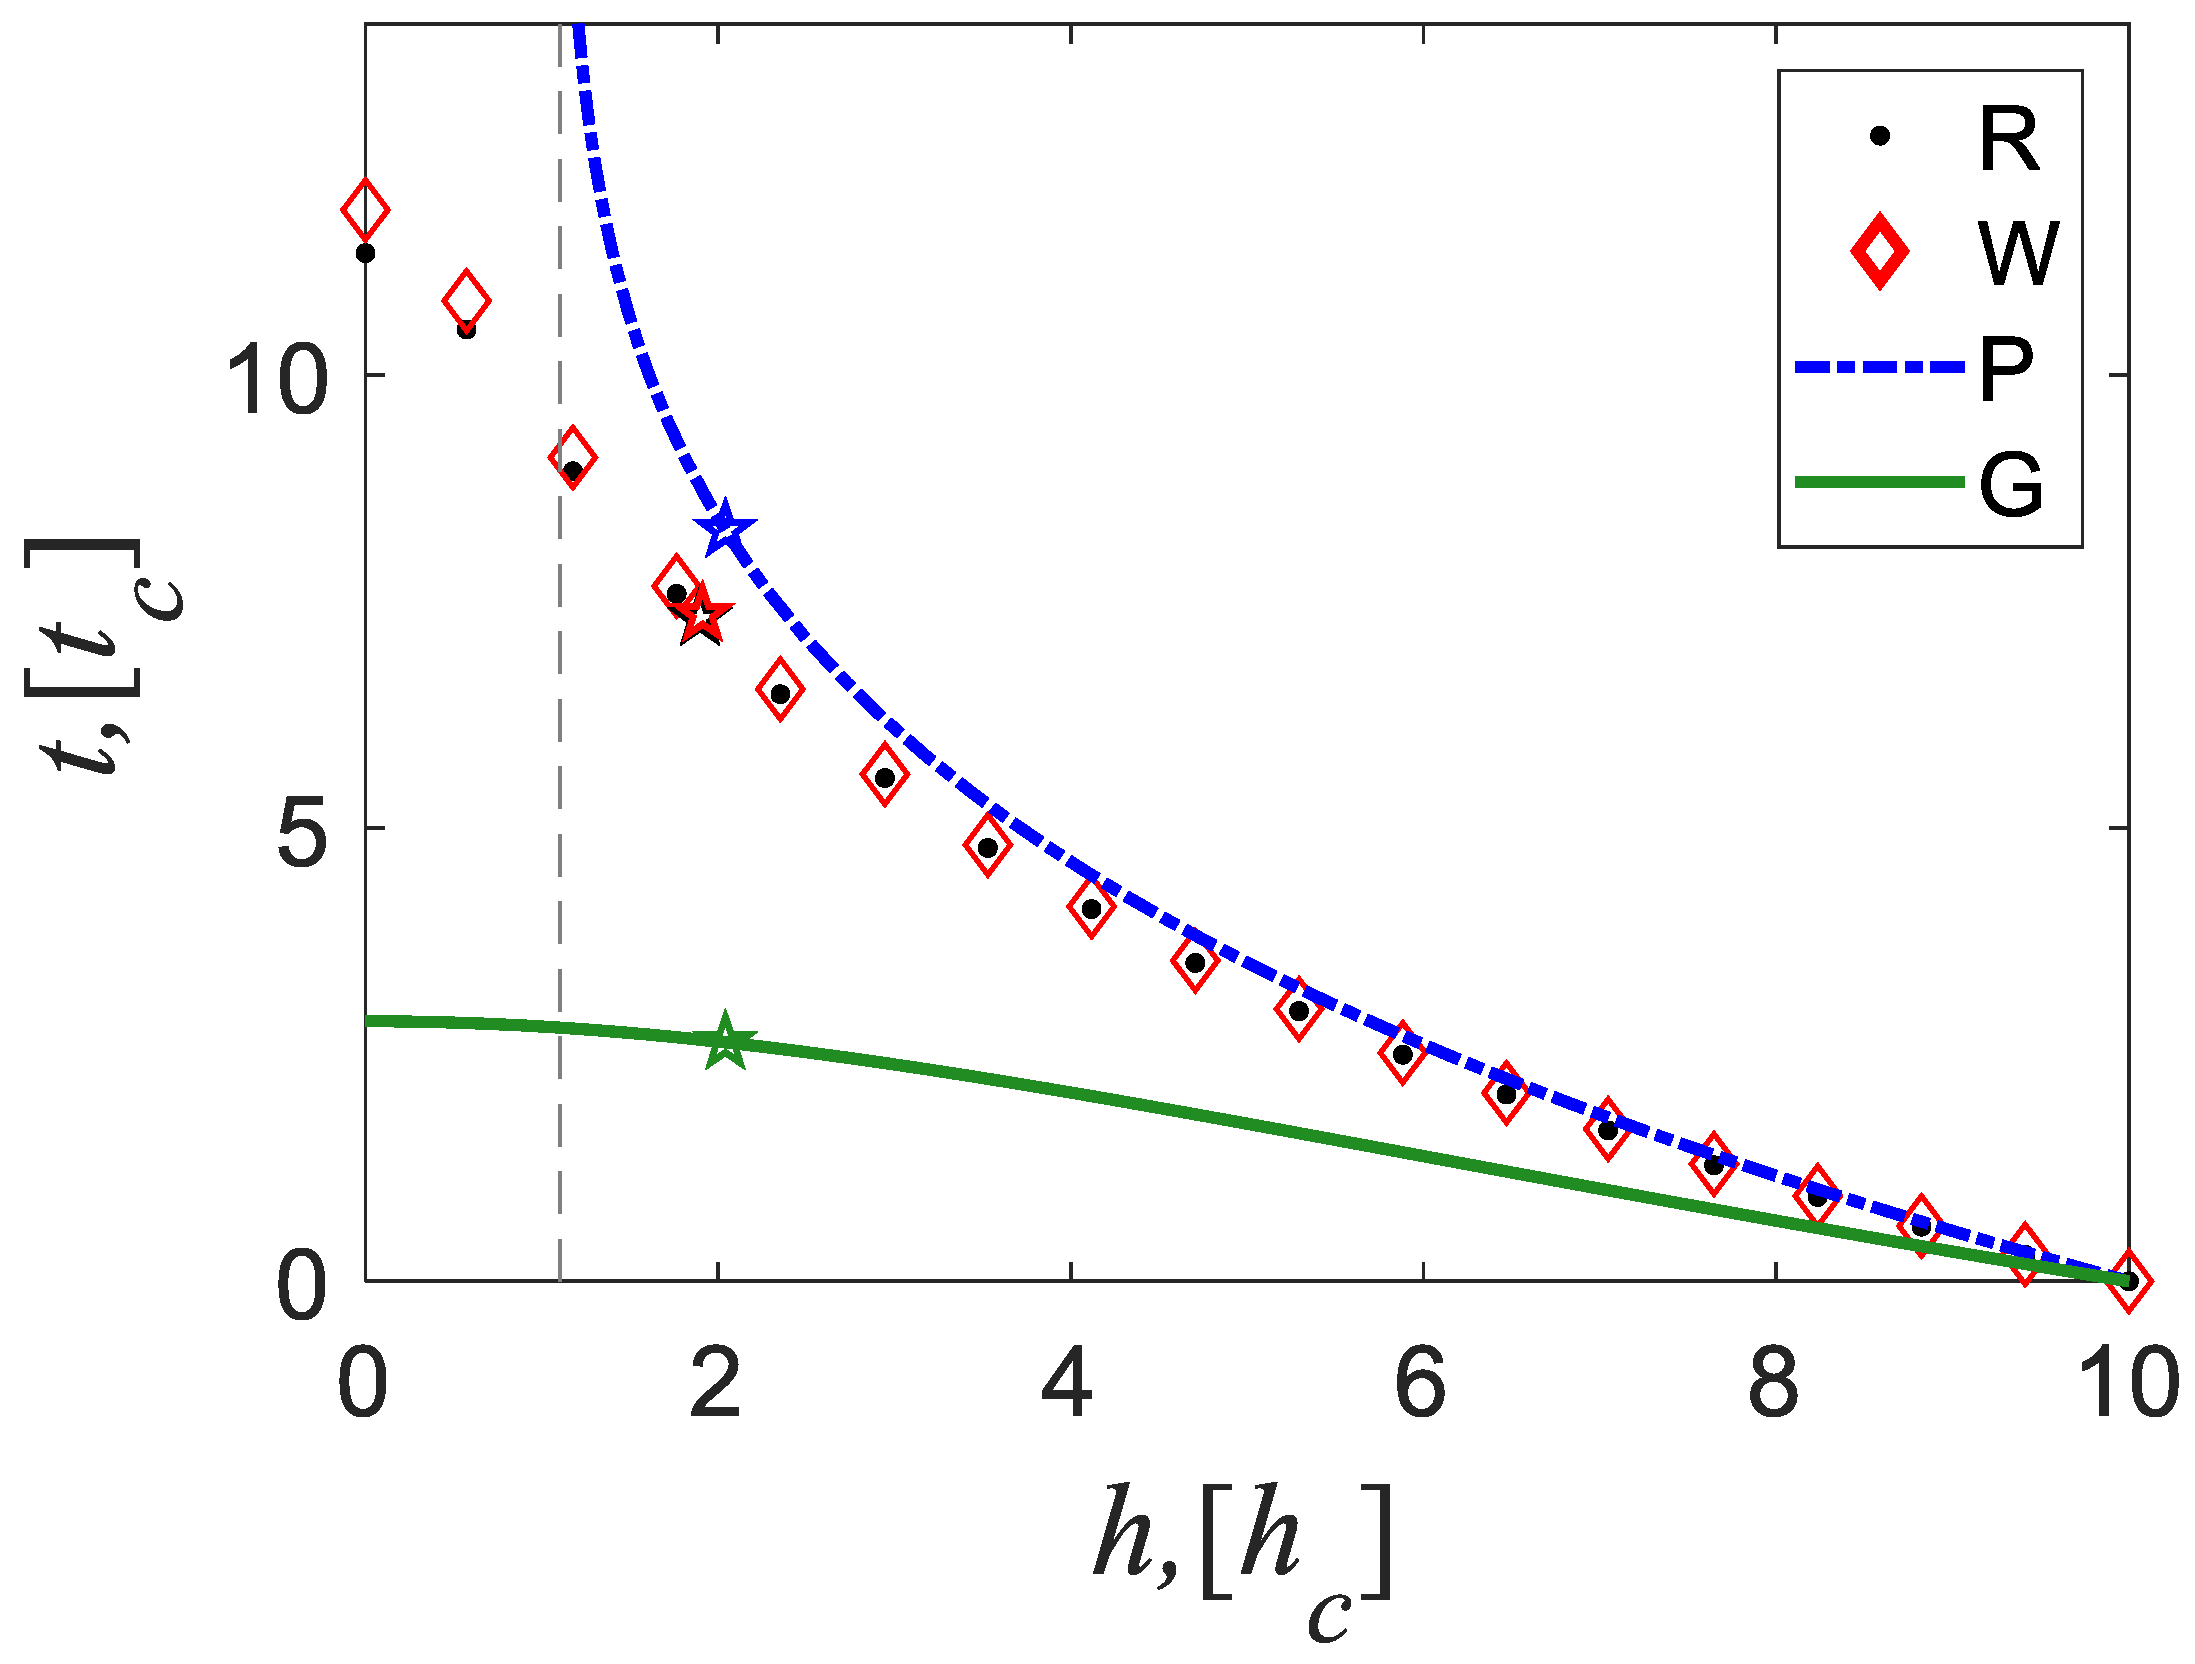
In some engineering applications, for example, aerial vehicles [4] or liquid hydrogen transportation pipelines [5], vessel pressure load is often relatively large, perhaps with a high corrosion inhibition, unlike Cases 2 and 3. It is particularly important and necessary for practitioners or operators to accurately forecast the service life of vessels in such working conditions. With this in mind, we introduce a further example as Case 4. The related results are demonstrated in Figure 8 and Table 1.
Case 4
For p o , p i , λ , h 0 , a o , a i , m o , m i , b, E, and v , refer to the notation list in this paper.
p o = 15 p c , p i = 950 p c , λ = 0.3 , h 0 = 10 l c , a o = 0.004 [ l c / t c ], a i = 0.001 [ l c / t c ], m o = 0.0016 l c t c p c , m i = 0.0004 [ l c / t c p c ], b = 0.455 , E = 206,000 p c , v = 0.3 .
Figure 8 shows the four h–t curves predicted by the different methods. The curve of this method is almost consistent with the reference method, indicating that this method has the highest accuracy, and the higher one results from the method in [37]. The lowest level of agreement is seen from the method in [32].
Note that in the curve of [37], t tends to positive infinity when h approaches 1.14 [lc]. This phenomenon shows that the shell will never completely dissolve (it has a remaining thickness of at least 1.14 [lc], no matter how much time has passed), assuming that the shell has not failed before then. This suggestion is somewhat inconsistent with physical phenomena.
Table 1 shows that the error of t* by [37] reaches 13%, which exceeds the general engineering accuracy (5%). Therefore, the lifetime it predicts does not guarantee reliability. In contrast, the error of this method is less than 1%, which is lower than the general engineering accuracy, and its predicted lifetime is much more reliable and thus more useful. The error of h* is similar.

5. Conclusions

Having described the existing research methods relating to corrosion problems in pressured vessels and discussing their evolution, advantages, and disadvantages, we have justified that there is a strong need for uniform corrosion analysis methods for both current and new applications. Existing methods struggle to meet this need. Accordingly, this paper proposes an improved approach with a view to addressing current needs. This novel approach was successfully implemented. The contribution of this new method is mainly reflected in the following: popularizing existing methods for engineering applications, research technology for physical science, nonlinear differential equation solving methods, and techniques for mathematics, etc.

5.1. Contributions to Engineering Applications

The proposed method generalizes a popular method [37] in engineering applications; the promotion and improvement are as follows:
(a)
Our method achieves a global, simultaneous tracking of shell shape (thickness and midplane radius) and stress. Therefore, we generalize those existing methods, which usually provide solutions only for thickness or only for stress.
(b)
Relative to the existing methods, our respective analytical solutions provide the following: easy to program, no more time-consuming, operator-friendly, and more accurate.
(c)
Most importantly, we can obtain higher accuracy of lifetime, t*, and critical thickness, h*, in the long-term domain.

5.2. Contributions to Research Techniques in Physical Sciences

Taking the moving boundary problem (shell boundary/stress tracking and life prediction) as an example, this paper explores a physical science research technique that promises to be universal. That is, how to improve the solution itself by physically improving the parameters of the solution (method) successfully without complicating the form of the solution or the implementation of the application.

5.3. Contributions to Methods and Techniques for Solving Systems of Nonlinear Differential Equations in Mathematics

Nonlinearity is everywhere [45] (on all time and spatial scales). The phenomena of this nonlinear excitation naturally include failure from general corrosion of pressure vessels [46]. The problem is to solve its first-order nonlinear differential equation system.
Analytical solutions for such a system of equations are generally not available in mathematics [47]. In general, one can only obtain its numerical solution, or perform some qualitative analysis of it [47]. If one wants to obtain its analytical solution, one must achieve the separation of dependent and independent variables within the system of equations (or equation decoupling).
To circumvent this difficulty, the P (or G) method simply separates the independent variable (t) and the dependent variable (rc) by assuming rc = rc0, thus reducing the system of equations to just one equation. An analytic solution for h can then be readily found.
Our approach is different. We first analyze the phase trajectory of the two dependent variables of this equation and obtain their explicit relationship. We then introduce reasonable assumptions (e.g., ignore higher-order terms of small terms) in order to simplify the relationship between the two dependent variables. This simplification in turn reduces the original system of equations to one equation, which allows us to obtain its analytical solution more elegantly.
During the solving process, this paper also proposes another mathematical technique, which is to properly introduce the intermediate variable x (x = h/rc). This distinctive introduction plays a key role in the successful separation of the original two intermediate variables ( σ i and σ o).
From the above, it is clear that by successfully solving the extremely difficult nonlinear differential equation system, we have contributed a general mathematical method (analyzing the equivalence line and obtaining the nonlinear relationship of the dependent variable) and a mathematical technique (introducing an appropriate intermediate variable, x). The successful use of both in this paper demonstrates their utility in the study of nonlinear problems.

5.4. The Proposed Method Needs Further Discussion

As is the case with any new method, the proposed one needs further study, in particular if one wishes to extend it to different geometries (ellipsoidal spherical shell, cylindrical shell, etc.) or introduce further features, such as temperature. The authors would suggest that one employs numerical solutions, analytical solutions, and qualitative analysis (studies of stability and equilibrium) for such a study.

Author Contributions

Conceptualization, C.H.L.; methodology, C.H.L.; software, C.H.L.; validation, G.L.; formal analysis, G.L.; investigation, G.L.; resources, G.L.; data curation, G.L.; writing, G.L.; visualization, G.L.; supervision, G.L.; project administration, G.L.; funding acquisition, G.L. All authors have read and agreed to the published version of the manuscript.

Funding

(1) This work was supported by the National Natural Science Foundation of China (Grant number, 52068003). (2) The sponsorship, guaranteed with basic research funds provided by Politecnico di Torino, Italy, for its financial aid in this work, is also acknowledged. (3) The opinions, findings, and conclusions expressed in this paper are those of the authors and not necessarily those of the sponsors.

Data Availability Statement

The data presented in this study are available upon request from the corresponding author.

Acknowledgments

The author (C. H. Liu) is thankful to the Department of Mathematics for hospitality during her stay at Aberystwyth University. The authors (C. H. Liu and G. Lacidogna) thank A. Vellender, D. Peck, and G. Mishuris for fruitful discussions. The author (C. H. Liu) also thanks H.Y. Cheng, from the Department of Engineering Science and Mechanics of the Pennsylvania State University, I. Burgess and S. Huang, from the Department of Civil and Structural Engineering of the University of Sheffield, and S. Shi, from the Department of Mathematics of Hefei University of Technology, for work and discussions in this study’s earlier stage.

Conflicts of Interest

The authors declare no conflict of interest.

Abbreviations

Athermal expansion coefficient of the material
aicorrosion constant for internal corrosion
aocorrosion constant for external corrosion
bcorrosion inhibition effect
drradius of two concentric spheres
Dθthe angle between the plane and the positive z-axis
dφangle between the x-axis counterclockwise and the plane
f(x)coefficient of the time-variant thickness-to-radius ratio
h, h(t)thickness
h*corresponding thickness of the shell under the critical failure state
hagiven minimal allowable thickness
micorrosion constant
mocorrosion constant
piinner pressure
poouter pressure
Δppipo
r, r(t)distance between a point in the shell material and the origin of the coordinate system
rodistance between the internal surface in the shell material and the origin of the coordinate system
rc, rc(t), ri, ri(t), ro, ro(t)middle (inner, outer) surface radius of the shell
ttime
t*time required for a corroded pressure shell to fail for the first time due to buckling or yielding
tdtime for the shell to completely dissolve
vi (vo) inner (outer) mechano-chemical corrosion rate
xthickness to mid-surface radius ratio, x = h / r c , or 2 ( r o r i ) / ( r o + r i ) for spherical shell
σ stress under longitudinal or transverse forces, cylindrical shells, spherical shells, or other shells
σ(rj)principal stress; j = i, o
σ(rj)maxmaximum principal stress
σe(r)effective stress/ the equivalent stress
σr(r)radial stress
σθ(r)hoop stress maximum hoop or simply hoop
σφ(r)meridian stress
e h M ( e r c M , e t * M , e h * M )error of h (rc, t*, h*) predicted by method M in comparison with reference method R
d h ( P , W ) , ( d r c ( P , W ) , d t * ( P , W ) , d h * ( P , W ) )difference between h (rc, t*, h*) value predicted by method P and that by method W
S ( t ) shell S state
B i ( t ) ( B o ( t ) )inner (outer) boundary of shell one line

References

  1. Okulova, D.D.; Almazova, L.A.; Sedova, O.S.; Pronina, Y.G. On Local Strength of a Spherical Vessel with Pits Distributed along the Equator. Frat. Integrità Strutt. 2023, 17, 70–80. [Google Scholar] [CrossRef]
  2. Allen, H. Corrosion Problems with Pressure Vessels. Anti Corros. Methods Mater. 1958, 5, 390–397. [Google Scholar] [CrossRef]
  3. King, R.T. Failure of a Low-carbon Steel Pressure Vessel from Caustic Embrittlement by Postassium Hydroxide. J. Fail. Anal. Prev. 2022, 22, 2106–2109. [Google Scholar] [CrossRef]
  4. Czaban, M. Aircraft Corrosion Review of Corrosion Processes and Its Effects in Selected Cases. Fatigue Aircr. Struct. 2018, 10, 5–20. [Google Scholar] [CrossRef]
  5. Somerday, B.P.; San Marchi, C. Effects of Hydrogen Gas on Steel Vessels and Piplelines; Brian P. Somerday and Chris San Marchi Sandia National Laboratories: Livermore, CA, USA, 2006; pp. 1–34. [Google Scholar]
  6. Faes, W.; Lecompte, S.; Ahmed, Z.Y. Corrosion and Corrosion Prevention in Heat Exchangers. J. Corros. Rev. 2019, 37, 131–155. [Google Scholar] [CrossRef]
  7. Askari, M.; Aliofkhazraei, M.; Afroukhteh, S. A Comprehensive Review on Internal Corrosion and Cracking of Oil and Gas Pipelines. Nat. Gas Sci. Eng. 2019, 71, 102971. [Google Scholar] [CrossRef]
  8. Hashim, N.Z.N.; Kassim, K. The Effect of Temperature on Mild Steel Corrosion in 1 M HCL by Schiff Bases. Malays. J. Anal. Sci. 2014, 18, 28–36. [Google Scholar]
  9. Liu, J.G.; Li, Z.; Li, Y.; Hou, B.R. Corrosion Process of D32 Steel Used for Offshore Oil Platform in Splash Zone. Anti Corros. Methods Mater. 2016, 63, 56–64. [Google Scholar] [CrossRef]
  10. MacLeod, I.D. Corrosion and Conservation Management of the Submarine HMAS AE2 (1915) in the Sea of Marmara, Turkey. Heritage 2019, 2, 868–883. [Google Scholar] [CrossRef]
  11. Yang, X.; Cheng, H. Recent Developments of Flexible and Stretchable Electrochemical Biosensors. Micromachines 2020, 11, 243. [Google Scholar] [CrossRef]
  12. Zhou, H.; Qin, W.; Yu, Q.; Yu, X.; Cheng, H.; Wu, H. Circumferential Buckling and Postbuckling Analysis of Thin Films Integrated on a Soft Cylindrical Substrate with Surface Relief Structures. Extrem Mech. Lett. 2020, 35, 2352–4316. [Google Scholar] [CrossRef]
  13. Yang, H.Q.; Zhang, Q.; Tu, S.S.; Wang, Y.; Li, Y.M.; Huang, Y. A Study on Time-Variant Corrosion Model for Immersed Steel Plate Elements Considering the Effect of Mechanical Stress. Ocean Eng. 2016, 125, 134–146. [Google Scholar] [CrossRef]
  14. De Meo, D.; Oterkus, E. Finite Element Implementation of a Peridynamic Pitting Corrosion Damage Model. Ocean Eng. 2017, 135, 76–83. [Google Scholar] [CrossRef]
  15. Cui, C.; Ma, R.; Martínez-Pañeda, E. A Phase Field Formulation for Dissolution-Driven Stress Corrosion Cracking. J. Mech. Phys. Solids 2021, 147, 104254–104275. [Google Scholar] [CrossRef]
  16. Kristensen, P.K.; Niordson, C.F.; Martínez-Pañeda, E. An Assessment of Phase Field Fracture: Crack Initiation and Growth. Philos. Trans. R Soc. A Math. Phys. Eng. Sci. 2021, 379, 2203–2245. [Google Scholar] [CrossRef]
  17. Al-Badour, F.A.; Adesina, A.Y.; Ibrahim, A.B.; Suleiman, R.K.; Merah, N.; Sorour, A.A. Electrochemical Investigation of the Effect of Process Parameters on the Corrosion Behavior of Aluminum-cladded Pressure Vessel Steel Using a Friction Stir Diffusion Cladding Process. Metals 2020, 10, 623. [Google Scholar] [CrossRef]
  18. Kristensen, P.K.; Niordson, C.F.; Martínez-Pañeda, E. Applications of Phase Field Fracture in Modelling Hydrogen Assisted Failures. Theor. Appl. Fract. Mech. 2020, 110, 102837. [Google Scholar] [CrossRef]
  19. Ilyin, A.; Pronina, Y.G. Internal Stress-assisted Corrosion of a Toroidal Shell under Pressure. Procedia Struct. Integr. 2023, 47, 290–295. [Google Scholar] [CrossRef]
  20. Jivkov, A.P. Deformation-Promoted Nucleation of Corrosion Cracks: State, Problems and Perspectives. Annu. Univ. Archit. 2003, 44, 97–144. [Google Scholar]
  21. Gutman, E.M.; Zainullin, R.S.; Zaripov, R.A. Kinetics of Mechanicochemical Failure and the Life of Constructional Elements in Tension in Elastoplastic Deformations. Sov. Mater. Sci. 1984, 20, 101–103. [Google Scholar] [CrossRef]
  22. Akimov, G.V. Fundamentals of the Corrosion Theory and Metal Protection; Metallurgizdat: Moscow, Russia, 1964; pp. 24–56. [Google Scholar]
  23. Dolinskii, V.M. Calculations on Loaded Tubes Exposed to Corrosion. Chem. Pet. Eng. 1967, 3, 96–97. [Google Scholar] [CrossRef]
  24. Kabrits, S.; Kolpak, E. Nonlinear Axisymmetric Deformation of Compound Shells of Revolution under Conditions of Mechanochemical Corrosion. Procedia Struct. Integr. 2023, 47, 513–520. [Google Scholar] [CrossRef]
  25. Gutman, E.M.; Zainullin, R.S.; Zaripov, R.A. The Life of High-pressure Vessels under Conditions of Mechanicochemical Corrosion. In Corrosion and Protection in the Petroleum and Gas Industry; Vsesoyuz. Nauch. Isled. Inst. Org.: Promysh, Russia, 1977; pp. 3–5. [Google Scholar]
  26. Gutman, E.M. The Mechanical Chemistry of Metals and Protection from Corrosion; Metallurgiya: Moscow, Russia, 1981; pp. 90–120. [Google Scholar]
  27. Gutman, E.M. Mechanochemistry of Solid Surfaces. In Mechanochemistry of Solid Surfaces; World Scientific: Singapore, 1994; pp. 1–80. [Google Scholar]
  28. Elishakoff, I.; Ghyselinck, G.; Miglis, Y. Durability of an Elastic Bar under Tension with Linear or Nonlinear Relationship between Corrosion Rate and Stress. Appl. Mech. Trans. ASME 2012, 79, 021013. [Google Scholar] [CrossRef]
  29. Pavlov, P.A.; Malibekov, A.K. Multicycle Fatigue of Carbon Steels. Strength Mater. 1987, 8, 41–45. [Google Scholar]
  30. Pronina, Y.; Sedova, O. Analytical Solution for the Lifetime of a Spherical Shell of Arbitrary Thickness under the Pressure of Corrosive Environments: The Effect of Thermal and Elastic Stresses. J. Appl. Mech. 2021, 88, 61004–61013. [Google Scholar] [CrossRef]
  31. Pronina, Y.G. Analytical Solution for Decelerated Mechanochemical Corrosion of Pressurized Elastic-perfectly Plastic Thick-walled Spheres. Corros. Sci. 2015, 90, 161–167. [Google Scholar] [CrossRef]
  32. Gutman, E.M.; Bergman, R.M.; Levitsky, S.P. Influence of Internal Uniform Corrosion on Stability Loss of a Thin-walled Spherical Shell Subjected to External Pressure. Corros. Sci. 2016, 111, 212–215. [Google Scholar] [CrossRef]
  33. Gutman, E.M. An inconsistency in Film Rupture Model of Stress Corrosion Cracking. Corros. Sci. 2007, 49, 2289–2302. [Google Scholar] [CrossRef]
  34. Gutman, E.; Haddad, J.; Bergman, R. Stability of Thin-walled High-pressure Vessels Subjected to Uniform Corrosion. Thin Walled Struct. 2000, 38, 43–52. [Google Scholar] [CrossRef]
  35. Gutman, E.M.; Haddad, J.; Bergman, R. Stability of Thin-walled High-pressure Cylindrical Pipes with Non-circular Cross-section and Variable Wall Thickness Subjected to Non-homogeneous Corrosion. Thin Walled Struct. 2005, 43, 23–32. [Google Scholar] [CrossRef]
  36. Bergman, R.M.; Levitsky, S.P.; Haddad, J.; Gutman, E.M. Stability Loss of Thin-walled Cylindrical Tubes, Subjected to Longitudinal Compressive Forces and External Corrosion. Thin Walled Struct. 2006, 44, 726–729. [Google Scholar] [CrossRef]
  37. Liu, H.; Yuan, H.; Zhang, W. Time-varied Stability Loss of Uniformly Compressed Hemispherical Shells Subjected to Uniform Corrosion Based on the Southwell Procedure. In Proceedings of the IASS Annual Symposia, Boston, MA, USA, 16–20 July 2018; pp. 1–8. [Google Scholar]
  38. Vukelic, G.; Vizentin, G. Composite Wrap Repair of a Failed Pressure Vessel—Experimental and Numerical Analysis. Thin Walled Struct. 2021, 169, 108488. [Google Scholar] [CrossRef]
  39. Pronina, Y.; Sedova, O.; Grekov, M.; Sergeeva, T. On Corrosion of a Thin-walled Spherical Vessel under Pressure. Int. J. Eng. Sci. 2018, 130, 115–128. [Google Scholar] [CrossRef]
  40. Alfutov, N.A. Stability of Shells. In Stability of Elastic Structures. Foundations of Engineering Mechanics; Springer: Berlin, Germany, 2000; pp. 221–285. [Google Scholar]
  41. Liu, C.H.; Lacidogna, G. A Non-Destructive Method for Predicting Critical Load, Critical Thickness and Service Life for Corroded Spherical Shells under Uniform External Pressure Based on NDT Data. Appl. Sci. 2023, 13, 4172. [Google Scholar] [CrossRef]
  42. Timoshenko, S.P.; Gere, J.M. Theory of Elastic Stability; Dover Publications: New York, NY, USA, 2009. [Google Scholar]
  43. Volʹmir, A.S. Stability of Deformable Systems; Fizmatlit: Moscow, Russia, 1970. [Google Scholar]
  44. Pronina, Y.G.; Sedova, O.S.; Kabrits, S.A. On the Applicability of Thin Spherical Shell Model for the Problems of Mechanochemical Corrosion. AIP Conf. Proc. 2015, 1648, 300008. [Google Scholar]
  45. Campbell, D.K. Nonlinear Physics: Fresh Breather. Nature 2004, 432, 455–456. [Google Scholar] [CrossRef]
  46. Jordan, D.W.; Smith, P. Nonlinear Ordinary Differential Equations. Math. Gaz. 1979, 63, 1–66. [Google Scholar]
  47. Lazard, D. Thirty Years of Polynomial System Solving, and Now? Symb. Comput. 2009, 44, 222–231. [Google Scholar] [CrossRef]
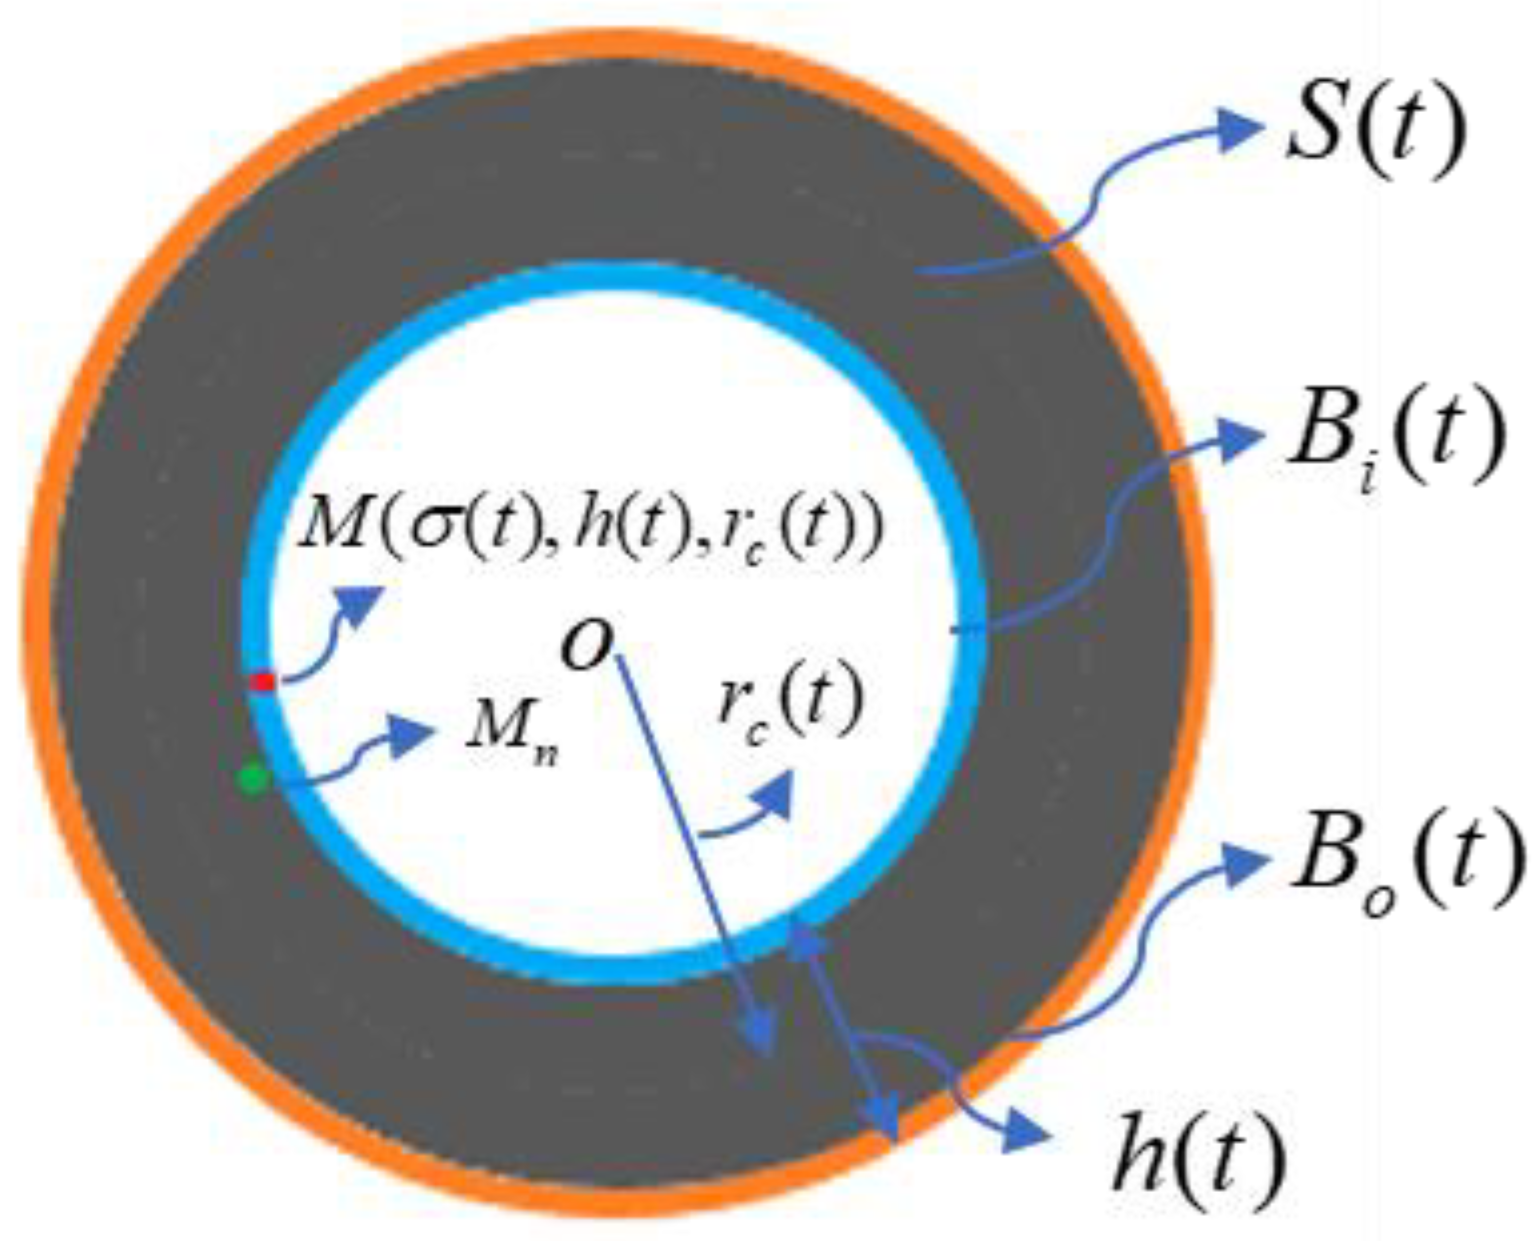
Figure 1. Characterization for shell, S, boundary, B, and a trajectory of a point, M, lying at the boundary.
Metals 13 01918 g001
Figure 2. Stress error (difference) between methods e σ W , e σ P , and d σ ( P , W ) . Note: In the figure, e h W , e h P , e h G , and d h ( P , W ) meaning see Equation (17).
Metals 13 01918 g002
Figure 3. Thickness error (difference) between methods e h W , e h P , e h G , and d h ( P , W ) .
Metals 13 01918 g003
Figure 4. Mid-surface radius error (difference) between methods e r c W , e r c P , e r c G , and d r c ( P , W ) .
Metals 13 01918 g004
Figure 5. ht curves traced by R, W, P, and G methods.
Metals 13 01918 g005
Figure 6. ht curves traced by P, W, P, and G methods.
Metals 13 01918 g006
Figure 7. Qualitative geometric shape of S, Bi, and M. Note: Red represents the results from this method, black represents reference value from [38], blue represents results from [37], and green represents results from [32]).
Metals 13 01918 g007
Figure 8. ht curves and their t*, h* traced by R, W, P, and G methods. Note: The dashed line is the asymptote of the P method, and the stars represent the lifetime.
Metals 13 01918 g008
Table 1. t* error (difference) between methods e t * j , e h * j , d t * ( P , W ) and d h * ( P , W ) (%) (j = W, P, G).
e i j   or   d i ( P , W ) e t * W e t * P e t * G d t * ( P , W )
Value 0.613.370.012.7
e i j   or   d i ( P , W ) e h * W e h * P e h * G d h * ( P , W )
Value 0.87.67.66.8
Disclaimer/Publisher’s Note: The statements, opinions and data contained in all publications are solely those of the individual author(s) and contributor(s) and not of MDPI and/or the editor(s). MDPI and/or the editor(s) disclaim responsibility for any injury to people or property resulting from any ideas, methods, instructions or products referred to in the content.