

Silicon Poisoning and Effects of Tantalum on AlSi Alloys
Institute of Casting Research, Montanuniversität Leoben, Franz-Josef-Straße 18, 8700 Leoben, Austria
*
Authors to whom correspondence should be addressed.
Metals 2023, 13(12), 1917; https://doi.org/10.3390/met13121917
Submission received: 30 September 2023
/
Revised: 27 October 2023
/
Accepted: 19 November 2023
/
Published: 21 November 2023
(This article belongs to the Special Issue Grain Refinement and Mechanical Properties of Cast Alloys)
Abstract
:Grain refinement in Al-Si alloys is crucial for enhancing material castability and mechanical properties. Industrial practice involves adding inoculants, composed of TiB2 particles coated with metastable Al3Ti via adsorption, to the melt. This introduces essential free titanium for metastable phase formation and subsequent growth restriction. The superstoichiometric grain refiner Al-5Ti-1B, with 2.2 wt.% free titanium, is applied for this purpose. A peritectic reaction forms α-aluminium from this layer. However, when silicon content exceeds 3.5 wt.%, grain coarsening occurs due to silicon’s detrimental effect. This study quantified silicon poisoning in an Al-10Si alloy using stoichiometric and superstoichiometric grain refiners through ASTM-standardized TP1 tests. Adding 0.02 wt.% tantalum acted as an antidote to the τ1 phase, resulting in a finer microstructure. This was attributed to the formation of a Ta-rich layer on TiB2 particles, which causes α-aluminium formation via a peritectic reaction without generating ternary phases with Ti or Si. Correlating to the increasing particle size curves from the TP1 tests, phases were collected in the filter cake with the help of a PoDFA apparatus. These could be examined more closely on the SEM and identified as needle- or plate-shaped. By using an EDS unit, the phases found were assigned to the poisoning phase and further investigated. After the addition of tantalum, a solubility of tantalum could be detected in former poisoning phases. In combination with the gradients of the grain size, it can thus be assumed that tantalum is both an antidote for silicon poisoning in the Al-Si-Ti system and can itself have a grain-refining effect in this system.
1. Introduction
Aluminium is one of the most widely used non-ferrous metals. The reason for this is the wide range of applications and the outstanding material properties, which include good corrosion resistance, high flowability, low shrinkage and low coefficients of expansion during solidification. In combination with the low weight, these alloys are extremely attractive for lightweight construction in the automotive industry [1,2].
Aluminium alloyed with silicon forms a simple eutectic system with a marginal solubility up to 1.65 wt.% Si at eutectic temperature. The eutectic point of the binary Al-Si phase diagram is found at 12.6 wt.% Si and a temperature of 577 °C [3].
In the past, a lot of research has been done in metallurgy around increasing strength and improving toughness. For aluminium, the grain refinement method has particularly stood out [4,5]. Guan and Tie summarised the progress, challenges and prospects of grain refinement of aluminium alloys [6]. Grain refinement by inoculants is a very commonly used method in industry to achieve a fine microstructure [6]. Widely used inoculants are Al-Ti-C, Al-Ti-B, Al-Ti, Al-Ti-B-(C)-Ce and Al-Sc, which are summarised by Sunitha et al. [7].
However, in industrial use, the grain refiner is often overdosed because too little is known about the actual grain-refining effect [8]. The mechanism of grain refinement with inoculants, i.e., by means of chemical substances, can be divided into two as [1,9]:
- heterogeneous nucleations;
Both principles are necessary for a successful grain refinement of Al-Si alloys [12,13]. As a heterogeneous nucleus, research is mainly conducted on carbides and borides. These particles have a very high melting point and can be finely distributed in the melt [6,14,15]. TiB2 particles in grain refiners are present as hexagonal prisms [16,17,18,19] and can have diameters of 0.1–10 µm, with an average diameter of 0.76 µm [20]. Quested and Greer [18], following Bunn et al. [10], looked in more detail at the particles present in a superstoichiometric grain refiner.
Often 0.1 to 1 wt.% of Al-3Ti-1B (near-stoichiometric) or Al-5Ti-1B (super-stoichiometric) are used as inoculants [21,22]. The stoichiometric grain refiner includes TiB2 particles in a matrix of aluminium. The superstoichiometric grain refiner Al-5Ti-1B consists of TiB2 particles and 2.8 wt.% free titanium above the stoichiometric ratio of TiB2, which is present in the grain refiner as aluminide Al3Ti. After the addition of the grain refiner, Al3Ti dissolves, causing the free titanium to react on the basal plane of the TiB2 particles, forming an epitaxial Al3Ti layer and wetting the basal plane of the particle [17,20,23,24,25]. The grain refiners used today usually contain TiB2 particles that are already wetted with Al3Ti.
The negative influence of silicon on grain refinement with the Al-Ti-B grain refiner in the Al-Si alloy system (with above 3.5 wt.% Si) has been investigated for decades [26,27,28,29]. The most common reason for the detrimental effect is the formation of Ti silicides, which impair or inactivate the affected TiB2 particles for heterogeneous nucleation [11,30]. However, several theories also exist to interpret the possible poisoning effect of silicon on grain refinement in the Al-Si-Ti-B system, which were summarised by Doppelhofer [31].
For a better understanding of this effect, thermodynamic and kinetic processes must be taken into account, which Gröbner et al. have addressed [22]. From the modelled quaternary phases Al-Si-Ti-B, it appears that the poisoning phase (τ1 phase) is a primary phase that prevents the peritectic reaction and, thus, can inactivate TiB2 particles for heterogeneous nucleation [22].
The aim of this work is to investigate the poisoning phase and its interaction with tantalum. The reason why tantalum is used is due to the fact that (i) tantalum forms a peritectic with aluminium, just like titanium, and (ii) the peritectic temperature is slightly higher than that of Ti and Al3Ta has no ternary phases with silicon.
For the investigation of silicon poisoning, several furnace tours were undertaken. In the beginning, the stoichiometric grain refiner was added to an Al-10Si melt and the standardised TP1 test was carried out. Subsequently, the free titanium content was successively increased up to 0.12 wt.%. Based on the knowledge of the poisoning effect, two further furnace tours were undertaken, in which TP1 tests were also carried out with PoDFA (porous disc filtration analysis) in parallel. By using the PoDFA facility, a higher concentration of particles in the filter cake could be achieved and, thus, the particles could be better analysed on the SEM and assigned to the poisoning phase using the EDS unit.
For the investigation of the TP1 samples, the produced cones were cut, metallographically prepared and optically etched with Barker etching. By using an optical filter on the light microscope, nearby grains could be viewed separately and, thus, the average grain size could be determined.
2. Materials and Methods
2.1. Material Preparation
Three furnace tours were undertaken as a part of the practical work to prepare the Al-10Si alloy. In the first furnace tour, the titanium content of a 40 kg melt was varied on a pilot scale to analyse the silicon poisoning. After degassing, the grain refiner was added to the melt and then the standardised TP1 test (see Figure 1a) was carried out. Here, the individual time steps were not exactly in accordance with the TP1 test standard and samples were cast up to 45 min after the addition of the respective master alloy, as there are no significant changes in grain size for this alloy after 45 min [32]. The free Ti content was then increased. To determine the Si poisoning of an Al-10Si alloy, a total of four TP1 test series were carried out in the following steps:
- Addition of stoichiometric grain refiner (Al-2.2Ti-1B) in the ratio of 2 kg per tonne of melt;
- Adjustment of the free Ti content to 0.03 wt.% via the addition of Al-10Ti;
- Adjustment of the free Ti content to 0.06 wt.% via the addition of Al-10Ti;
- Increasing the free Ti content to 0.12 wt.% via the addition of Al-10Ti.
Before starting the next TP1 test series, the melts were stirred to counteract the sedimentation of the fine, wetted titanium-diboride particles. This resulted in seven TP1 samples, seven samples for further analysis, one sample for spectral analysis and one thermal analysis per chemical composition. The resulting grain sizes were compared with the growth restriction factors determined using ThermoCalc to quantitatively weight the Si-Ti poisoning effect.
During the second furnace tour, PoDFA tests (see Figure 1b) were carried out on a small scale (1.5–2 kg melt) at the critical point of the free Ti content as a preliminary test. The principle of PoDFA (porous disc filtration analysis) is based on pushing or pulling melt through a filter by means of pressure differences in order to qualitatively separate undissolved impurities in the filter cake. A special crucible is used for this purpose, with a filter attached to its base. This crucible is preheated to approximately 250 °C for at least three hours before it is placed in a device and the melt is transferred directly into the crucible with the help of a ladle. A vacuum pump is then used to create a negative pressure in the chamber under the crucible, which draws the melt through the filter. The generated pressure can be read on the attached barometer and the collected, cleaned melt is weighed to monitor the progress. Typical impurities of an Al-Si alloy are Al oxides, Al carbides, Ti borides, Al nitrides and spinels, which are collected in the filter cake [33].
Based on the previous tests, PoDFA and accompanying TP1 tests were carried out during the third furnace tour with 40 kg of melt at the critical (0.12 wt.%) and supercritical (0.20 wt.%) points of the free Ti content. After the Si-Ti poisoning had already been determined in previous furnace tours, tantalum was used as an antidote in two steps (two different Ta contents). Firstly, the Ta content was adjusted to 0.02 wt.% via the addition of A-10Ta and then the Ta content was increased to 0.05 wt.%.
2.2. Characterization Techniques
The TP1 samples were needed to determine the grain size of the sample. To make the polycrystalline structure of aluminium and the orientation of the individual grains recognisable, the samples were etched according to Barker. The samples were then analysed by taking the images from the same regions with the aid of a Carl Zeiss Axio Imager. A1m using a filter in a polarized mode.
In this experiment, the analogue linear intercept method was used for grain size evaluation, in which three lines were drawn across the microstructure image created with the aid of the light microscope. Subsequently, all the cut grains were measured and these values were averaged.
For the analysis of the PoDFA samples, the filter cake could be removed after removing the seals and the filter was cut off. This cut surface and the lowest area of the transverse cut were prepared metallographically for further evaluation. Within the framework of the experiment in this work, a JOEL SEM (JSM-7200) with backscattered electron (BSE) detector and energy dispersive spectroscopy (EDS) was used. This made it possible to examine individual phases in more detail and, especially, to search for the poisoning τ1 phase.
3. Results
3.1. Investigation of the Silicon Poisoning Effect
In this series of tests, the development of grain size as a function of free titanium contents was investigated using the standardised TP1 test and PoDFA. After metallographic preparation, the TP1 samples were etched with the electrolytic Barker’s etching and examined with the optical microscope. Samples for SEM and EDS were examined directly after metallographic preparation.
3.1.1. TP1 Grain Size Evaluation
The total development of the grain size over time can be seen in Figure 2. The reason for the large standard deviations in this test is that by using the linear intercept method, small areas of grains are partially reached, while in other areas, large parts of the grains are cut. The increase in grain size after 60 min was due to sedimentation of the grain-refining particles or clustering of grain-refining particles, which is a well-known fading effect of grain refinement [34].
In the first run of the first test series, only the stoichiometric grain refiner without free titanium was used. A minimum grain size of 448.58 ± 233.94 µm was achieved after 30 min contact time, which is plotted in Figure 3a.
In the second run of the TP1 test, a Ti content of 0.03 wt.% Ti was adjusted by adding the Al-10Ti master alloy. Figure 2b shows the grain size progression. The minimum grain size obtained was 308.31 ± 186.33 µm after 20 min, see Figure 3b. Due to the free titanium in the melt, it can be assumed that Al3Ti forms on the TiB2 particle, resulting in the formation of α-aluminium via the peritectic reaction. This results in a finer microstructure compared to the first run of the TP1 test. Initial fluctuations between the first two samples were due to the fact that sedimentation was counteracted by stirring, resulting in possible differences from the ideal curve. The effects that occurred in the later course of the grain size as a function of time corresponded to those of the first run.
For the third run of the TP1 test, the free Ti content was increased to 0.06 wt.% by adding Al-10Ti. The corresponding progression of grain size over time can be seen in Figure 2c. The minimum grain size achieved was 340.45 ± 173.07 µm after 30 min contact time, see Figure 3c.
Figure 2d shows the evolution of the grain size for the last TP1 at 0.12 wt.% free Ti. The smallest grain size was obtained after 30 min and the minimum grain size of the first test series was 281 ± 152.05 µm. The corresponding microstructure is shown in Figure 3d. This indicates an efficient adsorption behaviour of Al3Ti on the heterogeneous TiB2 particle and, subsequently, the formation of α-aluminium. However, the grain size at the end of this TP1 trial was 388 ± 205.70 µm, the highest value after 60 min contact time of all three experiments with free titanium. The sedimentation behaviour of the grain-reducing particles was consistent due to the constant conditions, however, the poisoning effect occurred after a longer contact time, whereby the increase at the end of this TP1 test series was most clearly visible.
3.1.2. PoDFA Evaluation of the τ1 Phase
Samples from the preliminary tests and from the last test series were used for the analysis of the PoDFA filter cake. These were prepared metallographically and examined for the poisoning phase τ1 using SEM.
Typical images of the τ1 phase were found and detected by EDS (spectrums 14, 15) in the sample from the second run with 0.12 wt.% Ti, as shown in Figure 4.
Corresponding point analyses from the same samples are shown in Table 1. They also show small amounts of vanadium, which comes from impurities from alloying materials.
The phases were investigated using the EDS. Firstly, point EDS analyses were carried out on phases and the proportions were converted to atomic percentages. The data points were then assigned to the τ1 or (Al, Si)3Ti phase. Their assignment was based on the ratio between the Ti and Si content, as the poisoning phase consisted of 7 atoms of Ti, 6 atoms of Al and 14 atoms of Si, resulting in a ratio between Ti and Si of 1:2.
Further analyses were carried out with the samples from the second and third furnace tours. In addition to the EDS point analyses, EDS mapping was also carried out, as shown in Figure 5. This sample is a PoDFA sample from the last test series with 0.12 wt.% free Ti. In addition to the turquoise particles, porosities with oxides are also present. Furthermore, Si-containing phases are also visible in the background. Around the particles in the lower region, layers of aluminium, titanium and silicon can also be easily recognized in the outer regions of the heterogeneous particles, which indicates wetting of the particles.
Figure 6 shows an EDS mapping from the last experiments. The sample contains 0.2 wt.% free Ti and was taken together with the 20 min TP1 sample and shows a plate-like structure of the particle.
3.2. Influence of Tantalum on τ1 Phase
After the poisoning of the Al-10 Si melt, small doses of tantalum were alloyed. In the first step, 0.02 wt.% Ta was added, and in the second step, the concentration of Ta was increased to 0.05 wt.%.
3.2.1. TP1 Grain Size Evaluation
Over the progress of the third test series, the grain size curve was obtained, which can be seen in Figure 7. For the TP1 tests, the time intervals according to the ASTM standard were not used, but representative samples were taken up to 45 min after the addition of the grain refiners or master alloys, which is mentioned in the according nomenclature. Over the entire course, a significant refinement of the microstructure could be seen until the end of the test series.
As describled in the previous series of tests, a sufficient grain refinement is not possible without free titanium. After the addition of 0.12 wt.% Ti, a significant refinement of the microstructure was already visible. As could also be seen in other test series, the minimum grain size was usually always reached after 20–30 min before sedimentation occurs. However, in this test, an increase in grain size could be observed with longer contact times, which indicates the occurrence of the poisoning phase and the inactivation of the grain-hostile particles.
After increasing the Ti content to 0.2 wt.%, the gradient of the particle size also increased as a function of time. Due to the constant conditions used, the sedimentation behaviour of the particles can be assumed to remain constant. Therefore, it is assumed that grain-refining particles were inactivated due to chemical reactions and that the coarsening of the microstructure was mainly due to the sedimentation of the particles.
As an intermediate step, it was tested whether even very trace amounts (0.02 wt.%) of tantalum lead to a sufficient grain refinement and whether the poisoning effect can be counteracted and particles can be reactivated for grain refinement, which was clearly shown in the course.
The step of increasing the Ta content to 0.05 wt.% resulted in a minimum grain size of 284.72 ± 44.75 µm after 10 min contact time. Subsequently, the grain size remained at a relatively constant value until 30 min after the addition of the Ta-containing master alloy, which indicates that no poisoning of the particles occurred with tantalum.
3.2.2. PoDFA Analysis of τ1 Phase with Tantalum
Based on the PoDFA samples, which were produced after the addition of tantalum, particles that could be assigned to the τ1 phase were examined by SEM.
Several EDS point analyses were carried out, in which small amounts (up to 1.5 at.%) of tantalum were also found. Corresponding particles can be seen in Figure 8. These SEM images are from the samples with 0.2 wt.% free Ti and 0.05 wt.% Ta after the contact time of 10 (Figure 8a) to 20 min (Figure 8b), respectively. Compared to the τ1 phase shown above in the poisoned condition, the particles have a clearly changed shape and no longer appear plate- or needle-shaped.
For illustration purposes, the EDS analyses for the two particles shown in Figure 8 are also listed in Table 2. Here, you can see that the content of tantalum was very low. However, even this content was sufficient for the shape of the particles to change significantly and the grain size shown above also decreased and remained stable over a longer period of time. This indicates that the sedimentation effect occurred, but not a poisoning effect.
In combination with the decrease in grain size in the TP1 tests, this means that tantalum influenced the poisoning phase and, thus, particles can again positively influence the grain refinement process.
Figure 9 shows an EDS mapping showing the solubility of tantalum, which comes from the PoDFA sample with 0.2 wt.% free Ti and 0.05 wt.% Ta after 20 min contact time.
4. Conclusions
This paper deals with the grain refinement of Al-10Si in the Al-Ti-B system and the effect of tantalum on grain refinement and the well-known silicon poisoning effect in this system. Above a Si content of 3.5 wt.%, the formation of the τ1 phase is known, which is also described as silicon poisoning. This deactivates the epitaxial phase on the titanium diboride particles, which activates these borides for grain refinement. This could also be shown within the experiments in the scope of this work.
Based on the samples prepared, the τ1 phase was found on SEM and identified using EDS analysis. Both EDS point analysis and mapping were performed. Representative particles are also shown in this article.
The poisoning effect of the particles could also be determined from the particle size curves using the parallel TP1 test. The increasing content of free titanium up to 0.2 wt.% in the Al-10Si melt led to a larger gradient in the time course of the grain size, while the sedimentation behaviour remained the same. The higher concentration of particles due to the use of the PoDFA apparatus allowed a more detailed investigation of the poisoned titanium diboride particles.
After a poisoned melt was available, an antidote could be identified via small additions (first 0.02 wt.%, then to 0.05 wt.%) of tantalum. Using EDS analysis, dissolved tantalum was detected in former poisoning phases and a modified shape of the particles was also detected. Although the content of tantalum was below 1.5 wt.%, a clear modification of the phases could already be seen. The phases no longer appeared to be needle-shaped. Further investigations of the mechanical properties could also provide more information here. The TP1 tests carried out in combination showed a further reduction in grain size, which suggests a reactivation of the refining titanium diboride particles. In addition, the course proved to be extremely constant. This shows that the grain refining Ta-rich phases are not negatively affected by chemical reactions and are, thus, extremely suitable for grain refinement of Al-Si alloys.
Author Contributions
Conceptualization, M.P.; methodology, M.P. and J.P.; formal analysis, M.P. and J.L.; investigation, M.P. and J.P.; resources, J.L.; data curation, M.P. and J.L.; writing—original draft preparation, M.P.; writing—review and editing, J.L.; funding acquisition, J.L. All authors have read and agreed to the published version of the manuscript.
Funding
This research was funded by FWF, grant number P 32378-N37.
Data Availability Statement
The raw/processed data required to reproduce these findings cannot be shared at this time as they also form part of an ongoing study.
Conflicts of Interest
The authors declare no conflict of interest. The funders had no role in the design of the study; in the collection, analyses or interpretation of data; in the writing of the manuscript; or in the decision to publish the results.
References
- Kori, S.A.; Murty, B.S.; Chakraborty, M. Development of an efficient grain refiner for Al–7Si alloy and its modification with strontium. Mater. Sci. Eng. A 2000, 283, 94–104. [Google Scholar] [CrossRef]
- Ghosh, M.; Ghosh, A.; Roy, A. Renewable and Sustainable Materials in Automotive Industry. In Encyclopedia of Renewable and Sustainable Materials; Elsevier: Amsterdam, The Netherlands, 2020; Volume 3, pp. 162–179. [Google Scholar]
- Murray, J.L.; McAlister, A.J. The Al-Si (Aluminum-Silicon) System. Bull. Alloy Phase Diagr. 1984, 5, 74–84. [Google Scholar] [CrossRef]
- Basak, S.; Biswas, P.; Patra, S.; Roy, H.; Mondal, M.K. Effect of TiB2 and Al3Ti on the microstructure, mechanical properties and fracture behaviour of near eutectic Al-12.6Si alloy. Int. J. Miner. Metall. Mater. 2021, 28, 1174–1185. [Google Scholar] [CrossRef]
- Fan, Z.; Gao, F.; Wang, Y.; Men, H.; Zhou, L. Effect of solutes on grain refinement. Prog. Mater. Sci. 2022, 123, 100809. [Google Scholar] [CrossRef]
- Guan, R.G.; Tie, D. A Review on Grain Refinement of Aluminum Alloys: Progresses, Challenges and Prospects. Acta Metall. Sin. (Engl. Lett.) 2017, 30, 409–432. [Google Scholar] [CrossRef]
- Sunitha, K.; Gurusami, K. Study of Al-Si alloys grain refinement by inoculation. Mater. Today Proc. 2021, 43, 1825–1829. [Google Scholar] [CrossRef]
- Carlsson, S. Grain refinement of aluminium by titanium diboride particles: The importance of nucleation, growth restriction, and cooling rate. Master’s Thesis, KTH, Stockholm, Sweden, 2019. [Google Scholar]
- Kashyap, K.T.; Chandrashekar, T. Effects and mechanisms of grain refinement in aluminium alloys. Bull. Mater. Sci. 2001, 24, 345–353. [Google Scholar] [CrossRef]
- Quested, T.E.; Dinsdale, A.T.; Greer, A.L. Thermodynamic modelling of growth-restriction effects in aluminium alloys. Acta Mater. 2005, 53, 1323–1334. [Google Scholar] [CrossRef]
- Jin, D.; Li, H.; Yang, C.; Han, Y.; Zhu, Z.; Miao, Y.; Xu, C.; Chen, B. The Effects of Mg and Si Contents on the Microstructure and Solidification Behavior of Dilute Al-Mg-Si-Fe Alloys. JOM 2023, 75, 4845–4857. [Google Scholar] [CrossRef]
- Mitrašinović, A.M.; Hernández, F.C. Determination of the growth restriction factor and grain size for aluminum alloys by a quasi-binary equivalent method. Mater. Sci. Eng. A 2012, 540, 63–69. [Google Scholar] [CrossRef]
- Watanabe, Y.; Mihara-Narita, M.; Sato, H. Grain Refinement of Cast Aluminum by Heterogeneous Nucleation Site Particles with High Lattice Matching. Mater. Trans. 2023, 64, 1083–1097. [Google Scholar] [CrossRef]
- Minagawa, A. Light Metals 2020; Tomsett, A., Ed.; Springer International Publishing: Cham, Switzerland, 2000; pp. 988–993. [Google Scholar]
- Zhang, L.L.; Jiang, H.X.; Jie, H.E.; Zhao, J.Z. Kinetic behaviour of TiB2 particles in Al melt and their effect on grain refinement of aluminium alloys. Trans. Nonferrous Met. Soc. China 2020, 30, 2035–2044. [Google Scholar] [CrossRef]
- Furuta, S.; Minagawa, A.; Matsui, I.; Murakami, Y.; Omura, N.; Takeuchi, A.; Uesugi, K.; Kobayashi, M. Direct observations of nucleant TiB2 particles in cast aluminum by synchrotron radiation multiscale tomography. Materialia 2020, 10, 100663. [Google Scholar] [CrossRef]
- Li, J.; Hage, F.S.; Ramasse, Q.M.; Schumacher, P. The nucleation sequence of α-Al on TiB2 particles in Al-Cu alloys. Acta Mater. 2021, 206, 116652. [Google Scholar] [CrossRef]
- Quested, T.E.; Greer, A.L. The effect of the size distribution of inoculant particles on as-cast grain size in aluminium alloys. Acta Mater. 2004, 52, 3859–3868. [Google Scholar] [CrossRef]
- Hu, S.; Li, S.; Li, H.; Zhou, Y. Large-scale growth of TiB2 hexagonal platelets. J. Alloys Compd. 2017, 690, 930–935. [Google Scholar] [CrossRef]
- Bunn, A.M.; Schumacher, P.; Kearns, M.A.; Boothroyd, C.B.; Greer, A.L. Grain refinement by Al–Ti–B alloys in aluminium melts: A study of the mechanisms of poisoning by zirconium. Mater. Sci. Technol. 1999, 15, 1115–1123. [Google Scholar] [CrossRef]
- Dantzig, J.A.; Rappaz, M. Solidification; Presses Polytechniques et Universitaires Romandes: Lausanne, Switzerland, 2009. [Google Scholar]
- Gröbner, J.; Mirković, D.; Schmid-Fetzer, R. Thermodynamic aspects of grain refinement of Al–Si alloys using Ti and B. Mater. Sci. Eng. A 2005, 395, 10–21. [Google Scholar] [CrossRef]
- Greer, A.L.; Bunn, A.M.; Tronche, A.; Evans, P.V.; Bristow, D.J. Modelling of inoculation of metallic melts: Application to grain refinement of aluminium by Al–Ti–B. Acta Mater. 2000, 48, 2823–2835. [Google Scholar] [CrossRef]
- Greer, A.L.; Cooper, P.S.; Meredith, M.W.; Schneider, W.; Schumacher, P.; Spittle, J.A.; Tronche, A. Grain refinement of aluminium alloys by inoculation. Adv. Eng. Mater. 2003, 5, 81–91. [Google Scholar] [CrossRef]
- Zhang, L.; Jiang, H.; He, J.; Zhao, J. Improved grain refinement in aluminium alloys by re-precipitated TiB2 particles. Mater. Lett. 2022, 312, 131657. [Google Scholar] [CrossRef]
- Kori, S.A.; Murty, B.S.; Chakraborty, M. Influence of silicon and magnesium on grain refinement in aluminium alloys. Mater. Sci. Technol. 1999, 15, 986–992. [Google Scholar] [CrossRef]
- Johnsson, M. Grain refinement of aluminium studied by use of a thermal analytical technique. Thermochim. Acta 1995, 256, 107–121. [Google Scholar] [CrossRef]
- Mohanty, P.S.; Gruzleski, J.E. Grain refinement mechanisms of hypoeutectic Al Si alloys. Acta Mater. 1996, 44, 3749–3760. [Google Scholar] [CrossRef]
- Wang, Y.; Que, Z.; Hashimoto, T.; Zhou, X.; Fan, Z. Mechanism for Si poisoning of Al-Ti-B grain refiners in Al alloys. Metall. Mater. Trans. 2020, 51, 5743–5757. [Google Scholar] [CrossRef]
- Bolzoni, L.; Babu, N.H. Towards industrial Al-Nb-B master alloys for grain refining Al-Si alloys. J. Mater. Res. Technol. 2019, 8, 5631–5638. [Google Scholar] [CrossRef]
- Doppelhofer, B. Kornfeinung in AlSi-Legierungen. Master’s Thesis, University of Leoben, Leoben, Austria, 2014. [Google Scholar]
- Pammer, M.; Jiehua, L.I.; Schumacher, P. Einfluss von Tantal auf die Kornfeinung einer Al10SiMg Legierung. Giess. Rundsch.-Proguss-Austria 2021, 2, 15–20. [Google Scholar]
- Haberl, K.; Geier, G.; Schumacher, P. Die Eignung des Unterdruckdichtetests zur Bestimmung der Schmelzereinheit von Aluminiumlegierungen. Giess. Rundsch. Proguss-Austria 2008, 55, 100–104. [Google Scholar]
- Quested, T.E. Understanding mechanisms of grain refinement of aluminium alloys by inoculation. Mater. Sci. Technol. 2004, 20, 1357–1369. [Google Scholar] [CrossRef]
Figure 1.
(a) Experimental setup of TP1 test apparatus; (b) PoDFA (porous disc filtration analysis) apparatus used during the experiments.
Figure 1.
(a) Experimental setup of TP1 test apparatus; (b) PoDFA (porous disc filtration analysis) apparatus used during the experiments.
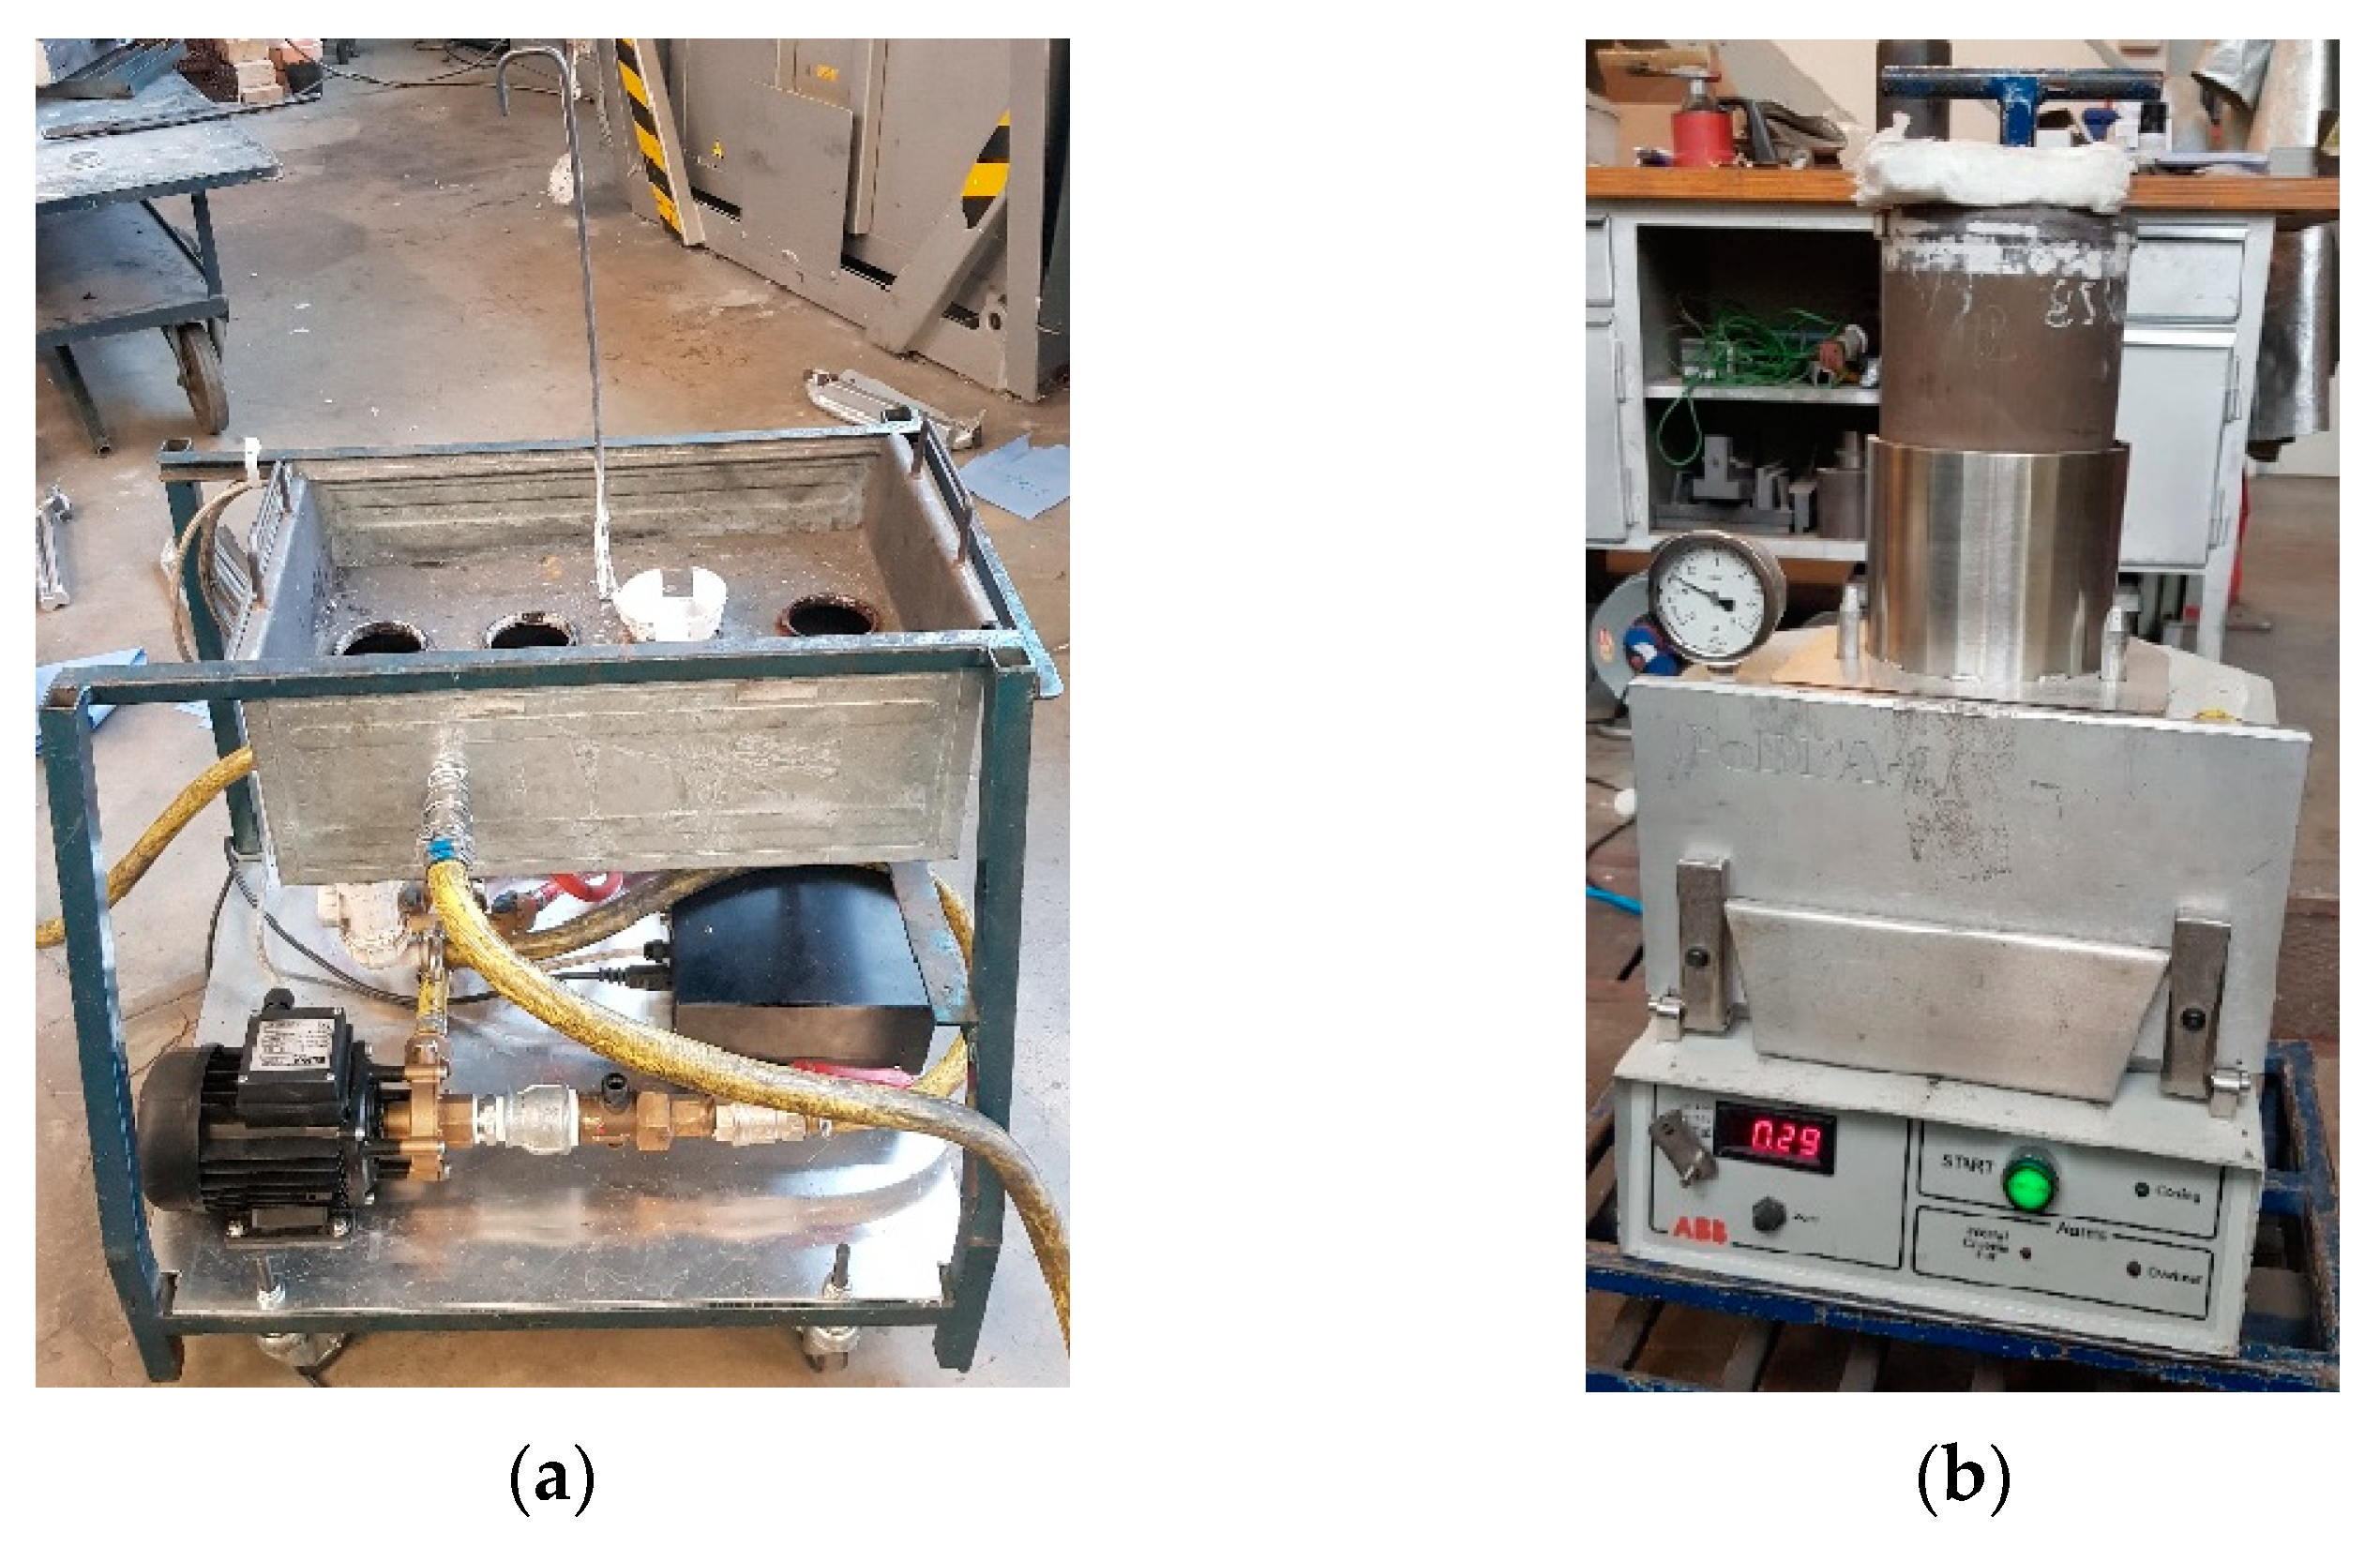
Figure 2.
Grain size evolution for the determination of silicon poisoning using TP1 test after additions of (a) stoichiometric grain refiner, (b) stoichiometric grain refiner and 0.03 wt.% free Ti, (c) stoichiometric grain refiner and 0.06 wt.% free Ti and (d) stoichiometric grain refiner and 0.12 wt.% free Ti.

Figure 3.
Microstructure of the smallest grain size from each TP1 test of the first furnace run with Al-10Si and the associated varying concentrations, contact times and resulting grain sizes: (a) stoichiometric grain refiner, 30 min, 448.58 ± 233.94 µm; (b) stoichiometric grain refiner and 0.03 wt.% free Ti, 20 min, 308.31 ± 186.33 µm; (c) stoichiometric grain refiner and 0.06 wt.% free Ti, 20 min, 340.45 ± 173.07 µm and (d) stoichiometric grain refiner and 0.12 wt.% free Ti, 30 min, 281 ± 152.05 µm.


Figure 4.
SEM image of τ1 phase (detected by EDS (spectrums 14, 15)) in the sample from the second run with 0.12 wt.% Ti.
Figure 4.
SEM image of τ1 phase (detected by EDS (spectrums 14, 15)) in the sample from the second run with 0.12 wt.% Ti.
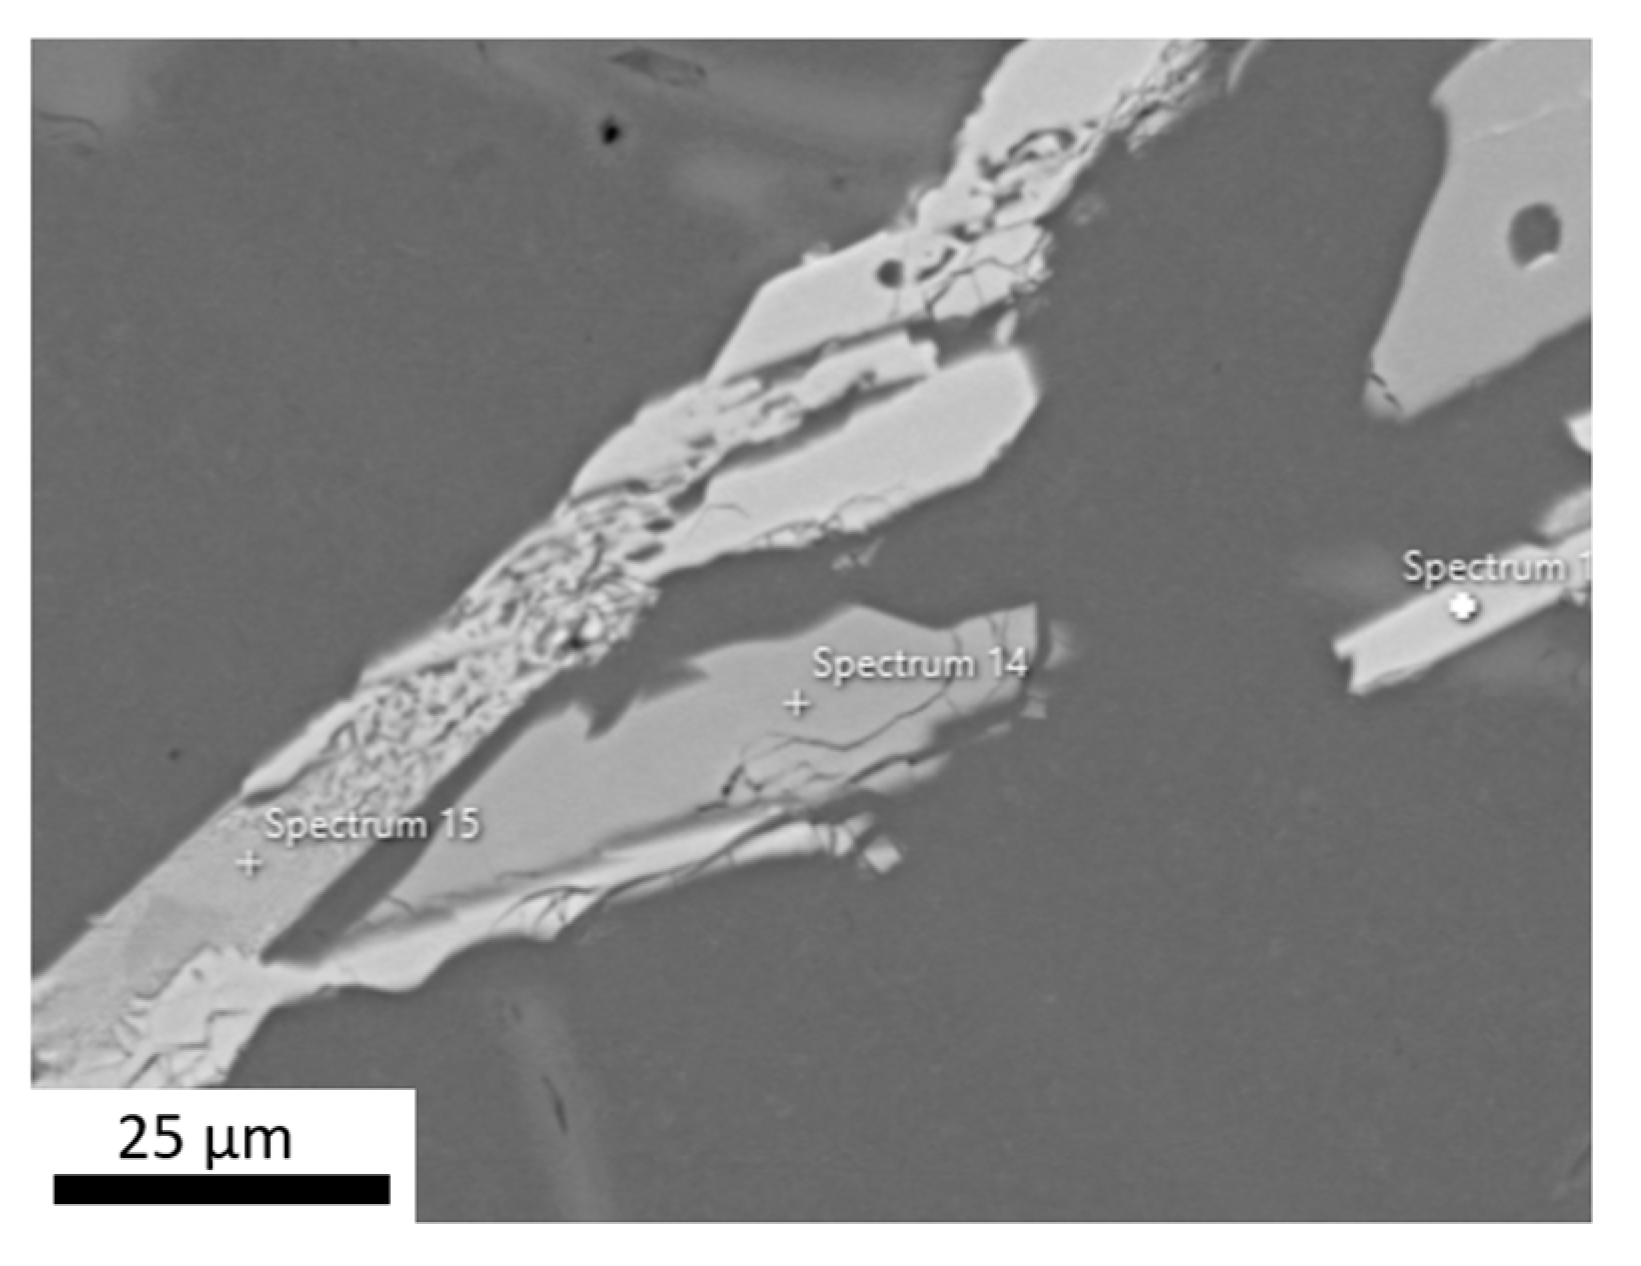
Figure 5.
EDS mapping of an agglomerate of poisoned titanium boride particles in a sample from the PoDFA experiment with 0.12 wt.% free titanium.
Figure 5.
EDS mapping of an agglomerate of poisoned titanium boride particles in a sample from the PoDFA experiment with 0.12 wt.% free titanium.

Figure 6.
EDS mapping of a poisoned particle (τ1 phase) of a sample from the last furnace tour with 0.20 wt.% free Ti, which could be filtered using the PoDFA apparatus.
Figure 6.
EDS mapping of a poisoned particle (τ1 phase) of a sample from the last furnace tour with 0.20 wt.% free Ti, which could be filtered using the PoDFA apparatus.

Figure 7.
Grain size curve during poisoning of the melt and after the addition of tantalum.
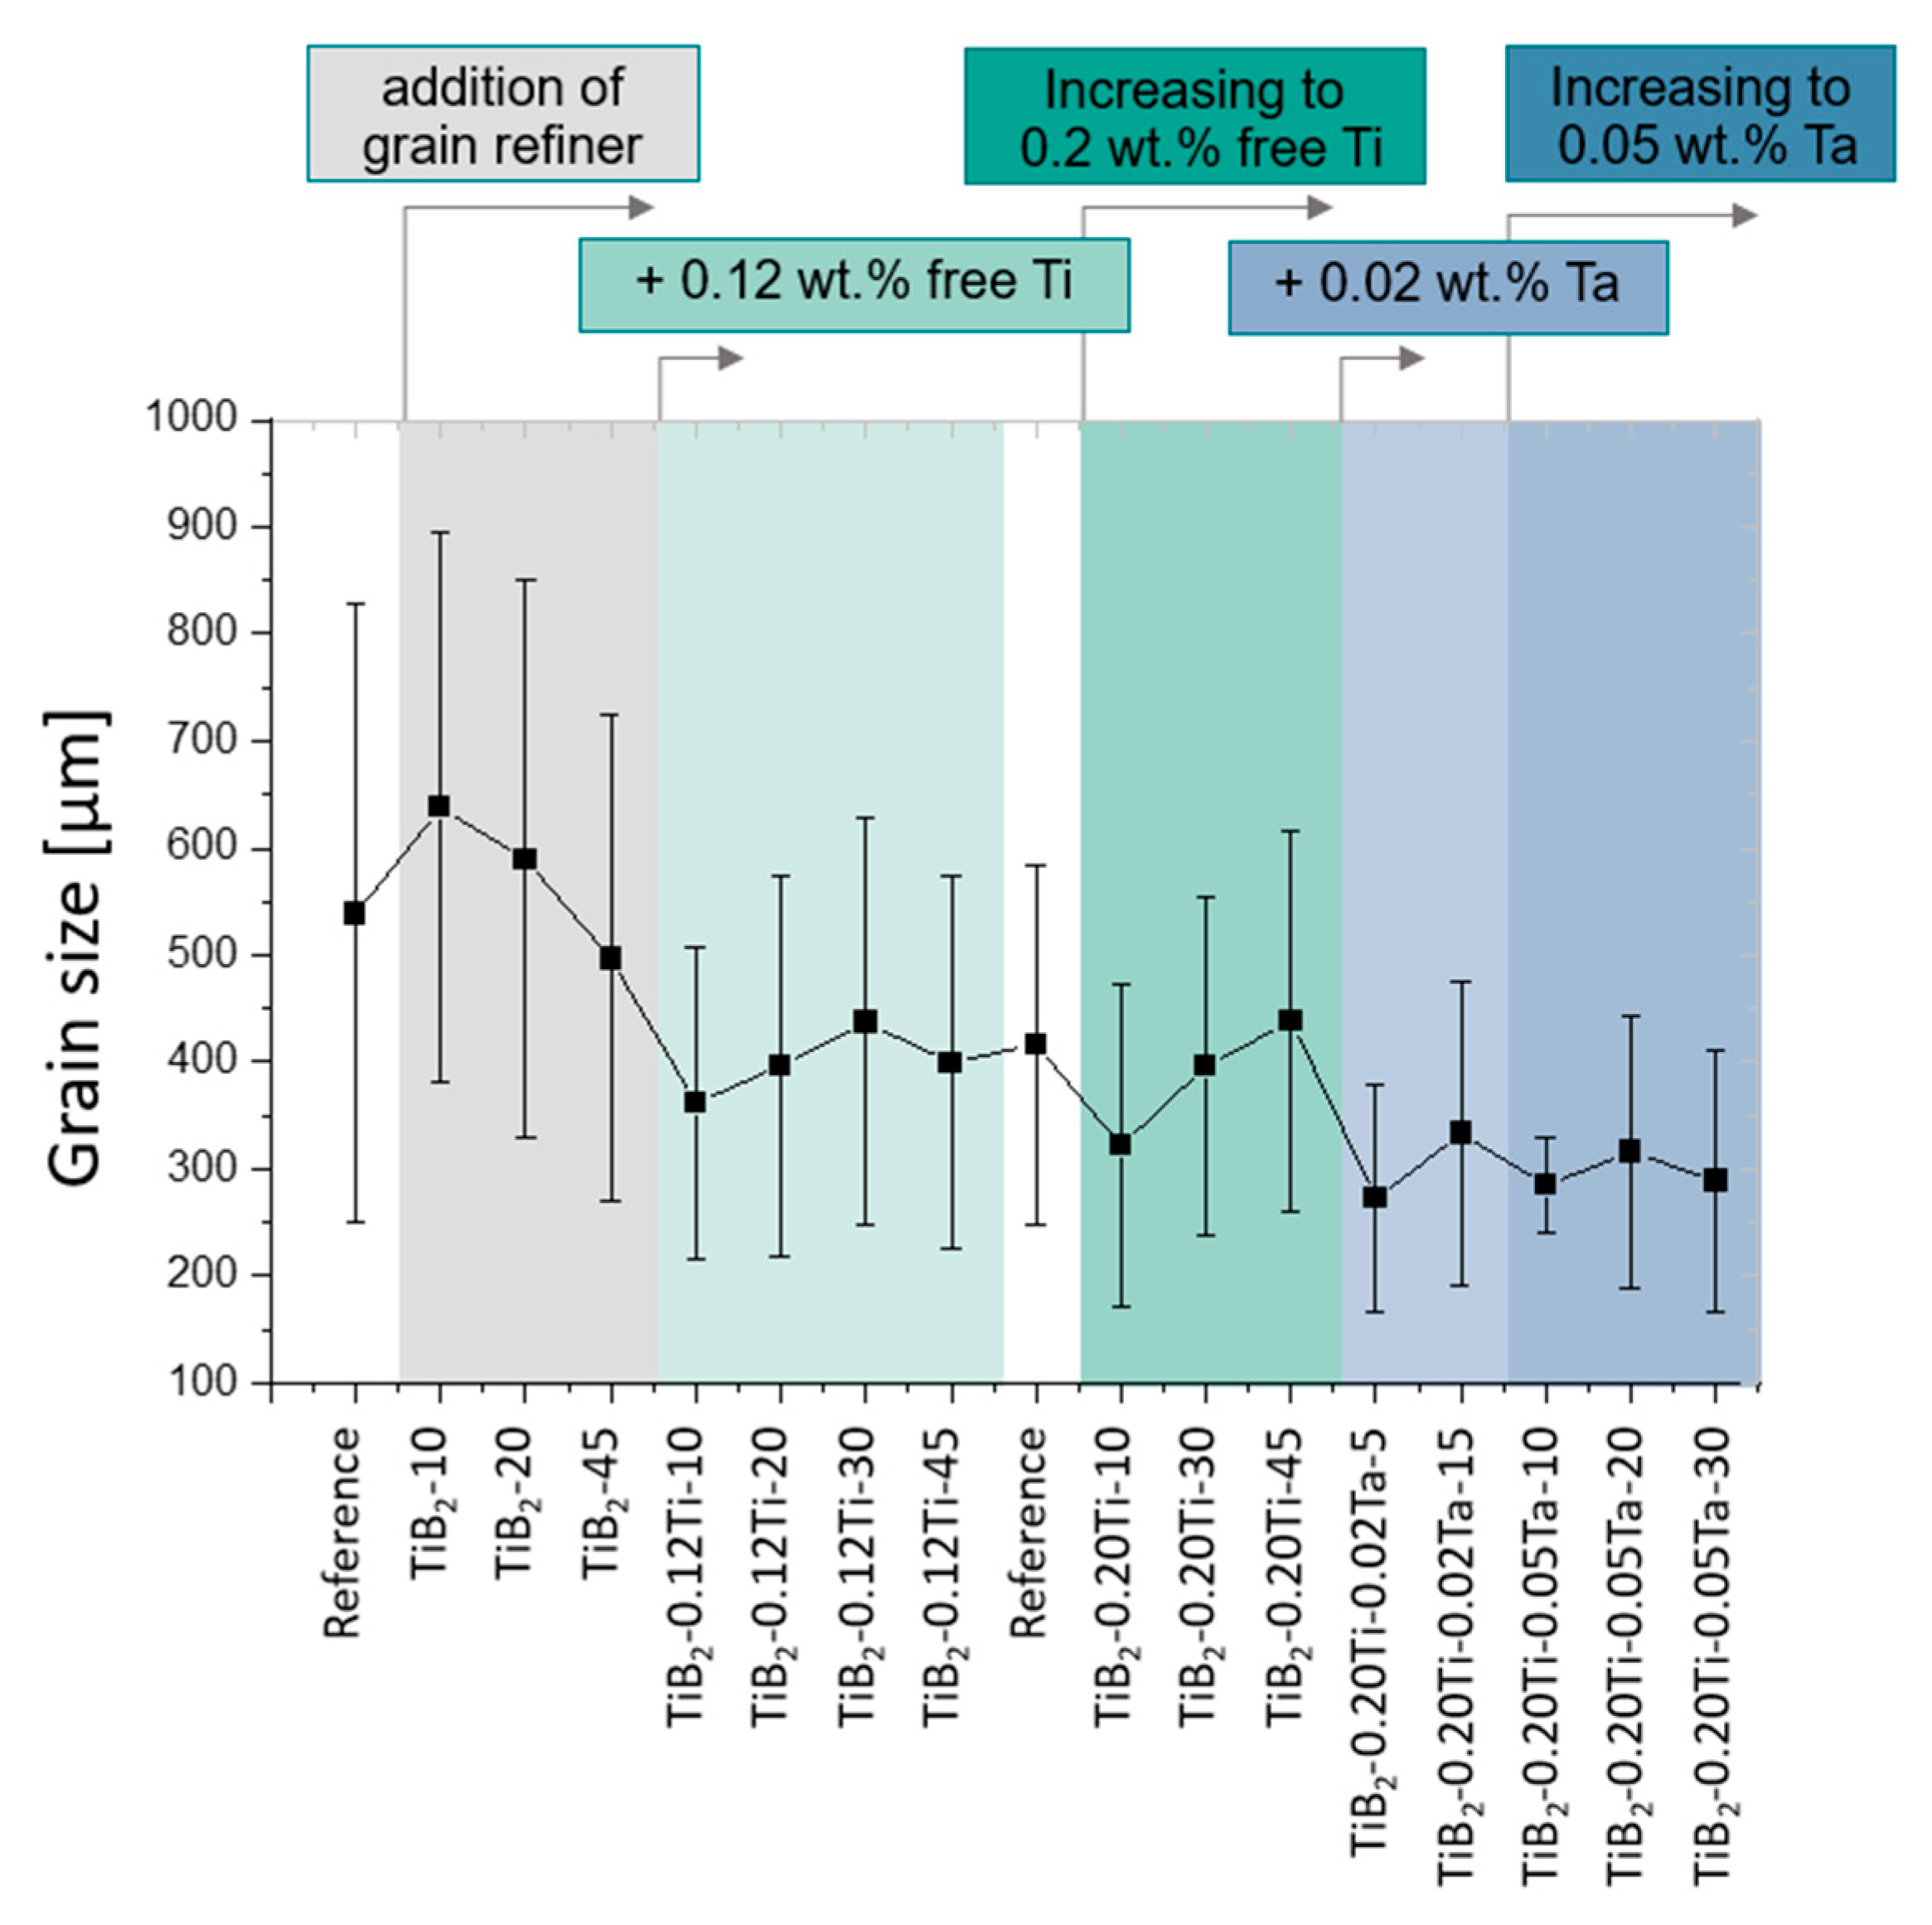
Figure 8.
SEM images of particles of the τ1 phase with Ta in the EDS analyses of the samples with 0.2 wt.% free Ti and 0.05 wt.% Ta after the contact time of 10 (a) to 20 min (b).
Figure 8.
SEM images of particles of the τ1 phase with Ta in the EDS analyses of the samples with 0.2 wt.% free Ti and 0.05 wt.% Ta after the contact time of 10 (a) to 20 min (b).

Figure 9.
SEM image of the modified τ1 phase showing the solubility of Ta using EDS analysis.


Table 1.
EDS analyses for the poisoning phases shown in Figure 4 (at.%).
Table 1.
EDS analyses for the poisoning phases shown in Figure 4 (at.%).
| Si | Ti | V | Al |
|---|---|---|---|
| 44.79 | 23.42 | 0.32 | Bal. |
| 48.43 | 29.03 | 0.69 | Bal. |
| 39.48 | 24.57 | 0.37 | Bal. |
Table 2.
EDS analyses of the poisoning phase with dissolved tantalum shown in Figure 8 (at.%).
Table 2.
EDS analyses of the poisoning phase with dissolved tantalum shown in Figure 8 (at.%).
| Si | Ti | Ta | Al | |
|---|---|---|---|---|
| (a) | 13.61 | 24.94 | 1.46 | Bal. |
| (b) | 12.92 | 25.01 | 0.51 | Bal. |
Disclaimer/Publisher’s Note: The statements, opinions and data contained in all publications are solely those of the individual author(s) and contributor(s) and not of MDPI and/or the editor(s). MDPI and/or the editor(s) disclaim responsibility for any injury to people or property resulting from any ideas, methods, instructions or products referred to in the content. |
© 2023 by the authors. Licensee MDPI, Basel, Switzerland. This article is an open access article distributed under the terms and conditions of the Creative Commons Attribution (CC BY) license (https://creativecommons.org/licenses/by/4.0/).
Share and Cite
MDPI and ACS Style
Pammer, M.; Pölzl, J.; Li, J. Silicon Poisoning and Effects of Tantalum on AlSi Alloys. Metals 2023, 13, 1917. https://doi.org/10.3390/met13121917
AMA Style
Pammer M, Pölzl J, Li J. Silicon Poisoning and Effects of Tantalum on AlSi Alloys. Metals. 2023; 13(12):1917. https://doi.org/10.3390/met13121917
Chicago/Turabian StylePammer, Maria, Johannes Pölzl, and Jiehua Li. 2023. "Silicon Poisoning and Effects of Tantalum on AlSi Alloys" Metals 13, no. 12: 1917. https://doi.org/10.3390/met13121917
Note that from the first issue of 2016, this journal uses article numbers instead of page numbers. See further details here.