
The Effect of Powder Temperature on Semi-Solid Powder Rolling AA2024 Based on Experiments and Numerical Simulation

1
School of Automobile and Transportation Engineering, Guangdong Polytechnic Normal University, Guangzhou 510665, China
2
National Engineering Research Center of Near-Net-Shape Forming for Metallic Materials, South China University of Technology, Guangzhou 510640, China
3
School of New Energy and Materials, Southwest Petroleum University, Chengdu 610500, China
*
Authors to whom correspondence should be addressed.
Metals 2023, 13(12), 1919; https://doi.org/10.3390/met13121919
Submission received: 21 September 2023
/
Revised: 14 November 2023
/
Accepted: 16 November 2023
/
Published: 22 November 2023
(This article belongs to the Special Issue Advanced Forming Process of Light Alloy)
Abstract
:Semi-solid powder rolling (SSPR) is widely used to produce alloy strips with fine grains and excellent performances in the automotive, aerospace and shipbuilding industries. During SSPR, powder temperature, as a very important parameter, greatly affects strips’ microstructures and mechanical properties, which have been investigated by many researchers, but its effect on the forming process and mechanism has rarely been studied. Therefore, based on online experimental detection and transient simulation, the microstructures, strip temperatures, relative densities and rolling forces at different conditions were, respectively, measured, calculated, compared and analyzed in order to study the deformation process and mechanism during SSPR. The result shows that with the increase in powder temperature, the strip temperature and relative density increase, while the rolling force decreases. The grains of the strips are refined after SSPR, and fine and dense microstructures are obtained at 600 °C, which is the optimum powder temperature. In the main deformation sections (II and III), when the contact normal force exists and reaches a maximum, the relative density and rolling force increase rapidly. At these sections, the strips rolled at 600 °C are mainly in a porous solid state, and powder crushing dominates the strip deformation. Therefore, SSPR at 600 °C and below can be considered porous or powder hot rolling, integrating powder crushing, solidification, deformation, densification and grain coarsening. Moreover, as the simulated values are basically consistent with experimental values, the thermomechanical coupling model based on the Fourier equation and its parameters are confirmed to be reasonable.
1. Introduction
Semi-solid powder forming (SSPF), with advantages of fine grains, net shaping, a simple process and so on [1,2,3,4], has been widely used to prepare excellent composites by many researchers in recent years [5,6,7,8]. Semi-solid powder rolling (SSPR) is a kind of SSPF [9,10,11], which is mainly used to produce alloy or composite strips with high performances in the automotive, aerospace, shipbuilding industries and so on [12,13,14]. During SSPR, powder temperature is a very important parameter, which not only determines the liquid fraction and the material deformation resistance but also affects the solidification and densification process of semi-solid powder materials and, consequently, determines the size and shape, microstructure and mechanical properties of finished products [15,16,17]. Therefore, it is necessary to investigate the effect of powder temperature on the SSPR process.
However, research on the influence of semi-solid powder temperatures is presently concentrated on the influence of the microstructures and performances of products [6,8]. The effect on the forming process and cause and mechanism of this impact are ambiguous and rarely studied, as the changing process and rule of temperatures, relative densities and rolling forces during SSPF cannot be directly observed in experiments. Hence, a combined method of online experimental detection and transient simulation is needed to study the effect of powder temperature. However, there are few studies on SSPF simulation. The SSPR process based on the combined constitutive model was simulated in our previous studies, which focused on the constitutive relationship calculation of semi-solid materials [9]. Moreover, based on the above constitutive formula and Shima yield criterion, the influence of roller temperature, compression ratio, rotational velocity and friction factor on strips was analyzed through SSPR simulation [10]. Mei et al. [17] established a numerical model of a segmented PbTe-BiTe-based thermoelectric leg based on the coupled equations to optimize performance. The microstructure modeling of a sintered Al-4Si-0.6Mg alloy extruded in semi-solid temperature ranges was built by Nithin et al. [18]. Luo et al. [19] analyzed the deformation micromechanisms and constitutive behaviors of semi-solid powder materials. In a word, the influence of powder temperature was not deeply investigated in these models.
Therefore, in order to study the effect of powder temperature on the forming process during SSPR, the thermomechanical coupling finite element model of semi-solid AA2024 was established according to the Fourier equation. Based on the model, the temperature, relative density and rolling force of strips during SSPR with different powder temperatures were calculated, analyzed and compared with experimental values. The microstructure of the strips after SSPR was studied. Finally, the optimum powder temperature was determined, and the forming mechanism of SSPR was researched.
2. Experiments
The powder used in this work is commercial AA2024, which was gas-atomized with a spherical shape. Its chemical composition is shown in Table 1. The material of the rollers is stainless steel (86CrMoV7). The DSC curve of powders in Figure 1a was obtained by using the STA 449C thermal analyzer, which was heated from 25 to 700 °C at a rate of 10 °C/min. As seen in Figure 1a, the solidus and liquidus temperatures are, respectively, 509 and 648.3 °C. The liquid fraction in Figure 1b was calculated from the DSC curve (detailed methods in ref. [16]). The semi-solid state is highlighted yellow in Figure 1, while the liquid state is highlighted in cyan.
The powders placed in a thermal resistance furnace were heated respectively to semi-solid temperatures of 520, 540, 560, 580, 590, 600 and 610 °C and then held for 30 min and were protected by argon. Subsequently, the semi-solid powders were poured into the hopper and then rolled by preheated rollers. Finally, a strip was produced with a thickness of about 1.2–2 mm (±0.5 mm) and a width of about 100 mm (±10 mm), as shown in Figure 2a. As a result of inhomogeneous rolling and insufficient supply of semi-solid powders, the front, end and edge of the strip are serrated or even missing. The rolling equipment and schematic are shown in Figure 2b,c. The width of the rollers is 100 mm, the diameter is 150 mm and the rotational speed is 0.1 rad/s. The rollers were inductively preheated to 300 °C and then kept by a flame. The temperature of the strips during SSPR was measured by a thermocouple placed between the rollers and under the hopper, which was finally embedded in the strip after rolling. The rolling force during SSPR was determined by a device with the NI-9317 data collection card and LabVIEW 2014 software, which was installed in the rolling equipment. Samples were taken from the center of the strips after rolling, along the rolling direction, for further analytical testing. The relative density of five samples rolled under each condition was determined three times using Archimedes’ method. To observe the microstructure of strips using a LcicaDM1500M, the samples were polished and then corroded with Keller agents. The microstructure of different sheets after SSPR in each condition was taken in about 50 images, from which the most clear and representative images were selected.
3. Theoretical Background
During SSPR, the heat of semi-solid powders or strips is taken away by convection, radiation and conduction when they are in contact with gas or rollers, making the strip temperature decrease. On the other hand, the solidification of semi-solid powders results in the release of latent heat, the plastic deformation of strips generates new heat and the friction between powders or strips and rollers also produces new heat, which will increase the strip temperature. Therefore, the variety of strip temperatures during SSPR is especially complicated. Consequently, based on the Fourier equation, the principle of conservation of energy was induced to derive the transient thermal conduction differential equation during SSPR, as follows:
where ρstr is the density of strips (kg/m3), Cstr is the specific heat capacity (J/kg·K), T is the temperature (K), t is the rolling time (s), L is the latent heat at a unit mass (J/kg), fL is the liquid fraction, Q is the heat generated from the heat source per unit volume (W/m3), λstr is the thermal conductivity (W/m·K), assuming strips and rollers as isotropic materials.
Wu et al. [7] compared the thermocalc prediction (incorporating the Scheil equation), DSC experiment and metallographic analysis to determine the liquid fraction of gas-atomized powders in a semi-solid state. The results show that the DSC experiment is the most suitable method, but it cannot be used directly in the simulation as a result of the lack of a mathematical formula as well as the metallographic analysis. Thus, the relationship between dfL and dT in this study was calculated using the Scheil equation [20]:
where TL and Ts are the liquidus and solidus temperatures of powders (K), ker is a partition coefficient.
Equation (2) was introduced into Equation (1), and then Equation (3) was obtained:
The specific heat capacity Cstr and the thermal conductivity λstr of the strips actually change with the temperature during SSPR and are not constant values. At present, the thermal and elastic property coefficient used in thermal formation simulations is mostly invariant, resulting in certain errors between the experimental and simulated values [21,22,23]. Thus, the coefficients varying with temperature are necessary in SSPR simulation. However, it is difficult to accurately measure these coefficients during the experimental process of SSPR, which is restricted by the equipment and conditions. Therefore, according to the chemical composition of the strips and rollers, their coefficients in Figure 3 were calculated using JMatPro 1.0 software. It is seen from Figure 3 that the thermal parameters of the rollers vary little with the temperature, compared to those of the strips. This is because rollers stay solid throughout the rolling temperature range, but strips solidify from a semi-solid state to a solid state. The calculated temperature range under equilibrium conditions was chosen as 25–700 °C, according to the experimental forming temperature of the SSPR.
For SSPR, the Q in Equation (3) refers to the total heat including solidification latent heat, friction heat, plastic deformation heat, convection heat, radiation heat and conduction heat as shown in Figure 4. Latent heat from liquid solidification is converted into a specific heat capacity, as shown in Figure 3 using the equivalent heat capacity method [24]. The heat flux generated by the friction between strips and rollers can be expressed using Equation (4):
where p(Φ) is the normal component of rolling pressure (MPa), vr is the relative velocity of the rollers, Kf is the partition coefficient of frictional work and the heat converted from friction.
The heat flux converted from the deformation of strips can be written as
where Kp is the conversion coefficient from plastic deformation work into heat (commonly 0.9 for aluminum alloy [21]), is the equivalent effective stress, is the equivalent effective strain, which can be achieved through a thermomechanical coupling model.
Otherwise, the heat flux qsgas convected on the powder or strip surface can be written as:
where hg1 is the convective heat transfer coefficient at the powder or strip interface during SSPR, and Tg is the gas temperature, which is 298 K in simulation. The value of hg is commonly chosen as 100–200 W/m2·K [25] and is 100 W/m2·K in this study.
The heat flux qsrad that is radiated by powders or strips to the environment can be expressed as:
where the Stefan–Boltzmann constant ξ is 5.6697 ∗ 10−8 W·m−2·K−4, ω is the surface radiation coefficient.
The heat flux qroller convected and radiated between the roller and external environment can be calculated by:
where hg2 is the convective heat transfer coefficient on the roller surface during SSPR.
At the interface of powders or strips and rollers, the heat flux qcon between them can be determined by the following:
where hcon is the contact heat conductivity and Troll is the roller temperature (K). For semi-solid rolling of aluminum alloy, the range of hcon is 1000 to 5000 W/m2·K [26].
4. Results and Discussion
4.1. The Effect of Powder Temperature on the Strip Microstructure
Figure 5 shows the microstructure of the strips rolled at different semi-solid powder temperatures, which is taken from the center area of the strips. As shown in Figure 5, the microstructure changes greatly with the increase in powder temperature. When the powder temperature is 520 °C, most of the powders in Figure 5a maintain the initial spherical shape and a small amount of black dotted substances marked with red arrows (namely the solidified liquid pocket in ref. [27]) are distributed randomly inside powders. The black dotted substance is Al2Cu in ref. [9]. There are many large pores marked by red circles in Figure 5a, and a little metallurgical bonding is also observed between powders. When the powder temperature is 540 °C, there are some small particles, most of them with polygonal shapes, and the number of pores is significantly reduced, as shown in Figure 5b. According to ref. [28], the powder at a higher temperature may slide along the grain boundary inside the powders, resulting in powder breakage during semi-solid powder compression. Combined with the changes in the grain size and shape of the powders in Figure 5b, it can be deduced that some powders break down at 540 °C, resulting in pores being reduced. Moreover, a number of deformed powders appear under a large rolling force, which also causes pores to decrease. When the powder temperature is 560 °C, more powders break down to form fine irregular grains, and the black dot substances in the powders increase in Figure 5c, confirming that the liquid phase increases. In addition, there is a small amount of finer solidified microstructures (in red boxes). When the powder temperature is 580 °C, the grains are obviously refined and the large particles are basically invisible in Figure 5d. The liquid phase is distributed mainly on the grain boundary [29], and pores are in the form of micropores between grains. This is because the liquid fraction at 580 °C increases significantly, which is 12.1% in Figure 1b. Therefore, the breakage resistance of the powders is greatly reduced and thus more powders are crushed into small particles (red squares in Figure 5d) under rolling force. The liquid phase released from the powders solidifies into fine grains and simultaneously forms the metallurgical bonding between broken powders or fragments, which makes large pores disperse and many tiny pores distribute between grains [11]. When the powder temperature is 590 °C, the microstructure is similar to that at 580 °C. When the powder temperature is 600 °C, the microstructure of the strips consists of many fine grains with fewer pores. This is because the liquid fraction is 20.1% at 600 °C (Figure 1b), and almost all powders are broken up during SSPR. Thus, more of the liquid phase is released to fill the pores, while it forms a more firm metallurgical bonding. When the powder temperature is 610 °C, the grain of the strips becomes larger and cracks are visible. It is because the liquid phase at 610 °C is 28.2% (Figure 1b), which is more conducive to element diffusion. Consequently, the coarsening of the grain is dominant and more liquid phase is squeezed and flows out to cause crack generation under rolling force [30].
In a word, the grain size of the strips first decreases and then increases, while the pores decrease with increasing temperature. Therefore, the optimal powder temperature during SSPR is considered to be 600 °C. The crushing of powder during SSPR makes the grains smaller and the liquid phase together with the fragments flows and fills the pores. The higher the temperature, the more powders crush, and then more liquid fills the pores. In addition, at a higher temperature, more coarse grains and new holes are generated, which is consistent with the results in ref. [16]. Therefore, it can be concluded that powder crushing, liquid solidification, densification and grain coarsening exist simultaneously during SSPR.
4.2. Simulation and Analysis of the Strip Temperature Field
4.2.1. Establishment of the Model
In order to analyze the temperature distribution characteristics of the strips during SSPR, a finite element thermomechanical coupling model of AA2024 based on the theoretical principle of Section 3 was established, and the results calculated by the model were compared with the experimental results. According to the symmetry of SSPR, a two-dimensional model with half the strip and one roller was built using the software MARC 2017, as shown in Figure 6. Node 1 of the strip is marked in Figure 6a, while Figure 6b is the close-up view of Figure 6a. The roller was set as a rigid heat conduction body, while the strip was set as a deformable body which complies with Shima criteria. In addition to a strip and a roller, the model also consists of a symmetric rigid body and a push plate, which helps the strip to be successfully bitten by the roller. The discretization of the roller was performed by the 39# element, which was unevenly divided into 603 elements and 640 nodes. The mesh of the roller area contacted with the strip is dense, whereas that of the uncontacted area is loose. The discretization of the strip was performed by the 11# element, which was evenly divided into 500 elements and 606 nodes.
Because the thickness and density of the strips at the beginning and end stages of SSPR fluctuate greatly (seen in Figure 2a), the strips rolled at a stable stage are our main researched objects. As discussed in Section 4.1, the temperature of 600 °C is the optimal powder temperature during SSPR. Therefore, a section of the strip rolled at 600 °C (along the rolling direction) was chosen for simulation and its initial length was set as 50 mm, assuming that the model runs in a steady state. A total loading time is 6 s, and one incremental step is fixed as 0.6 s in the simulation. As the bottom width of the feeding hopper is 5 mm, the initial thickness of the strips was set as 5 mm (1/2 strip is 2.5 mm). The thickness of the deformation was chosen as 3.75 mm, because the thickness of the strips after rolling is generally 1.2–2 mm. The deformation behavior of AA2024 is characterized by stress–strain curves in Figure 7 (for details, see ref. [28]). As seen in Figure 7, the peak stress decreases with increasing temperature, indicating that the deformation resistance decreases. In addition, all rolling parameters are listed in Table 2.
4.2.2. Analysis and Verification of the Strip Temperature Field
The temperature field is actually the integration of the temperature distribution of all nodes, which determines the state and performance of each node. Therefore, it is particularly important and helpful to understand deeply the forming process of SSPR. Figure 8 shows distribution diagrams of the strip temperature field and the contact normal force field at incremental step 57 when the powder temperature is 600 °C. According to ref. [28], it is known that semi-solid powder material can be treated as a porous solid material during SSPF when the powder temperature is between 509 and 580 °C. Therefore, Figure 8a is divided into three states: semi-solid state, porous solid state and solid state. Moreover, based on different contact normal forces in Figure 8b, Figure 8a,b are simultaneously divided into four rolling sections: I, II, III and IV, corresponding to the sections in Figure 2c. The direction of the arrows in Figure 8b indicates the direction of the normal contact force. The length of the arrows represents the magnitude of the normal contact force.
As shown in Figure 8a, the strip temperature in section I (with a yellow color) has been reduced from the initial value of 600 °C to about 590.6 °C, and thus it is in a semi-solid state. As seen in Figure 8, the strip is not contacting the roller, its thickness remains unchanged and the contact normal force (related to the rolling force; their relationship will be discussed in Section 4.4) is not observed. Hence, there is little deformation in section I. With the contact of strip and roller increasing in section II, the strip temperature rapidly decreases to about 550 °C (pale red), the contact normal force slowly increases, and the strip has a little deformation, which is mainly in a porous solid state. When entering section III, the strip is greatly compacted by the roller, and its temperature still rapidly reduces and reaches about 490 °C (blue) below the solidus temperature. The surface temperature of the strips is slightly lower than the central temperature because the strip is very thin. The contact normal force increases to the maximum and then reduces, and the strip deformation becomes large, which is actually the strip compaction stage. The strip in this section is partly in a porous solid state and partly in a solid state. When entering section IV, the strip temperature is lower than 490 °C and remains unchanged. The strip does not contact the roller, so the contact normal force returns to zero and there is no obvious deformation, which is all in a solid state. In other words, the porous solid state dominates in the major deformation sections (II and III) of the SSPR. Therefore, it can be considered that the strip obtained by SSPR at 600 °C is actually rolled in a porous solid state.
To verify the precision of the model and its parameters, the temperature vs. time curve of node 1 (marked in Figure 6) rolled at 600 °C was calculated by the model and it was compared with the measured value, shown in Figure 9. As the thermocouple was placed first at the bottom of the hopper and then rolled into the strip with powders, the temperature of the front strip was measured, and thus node 1 was chosen for comparison. According to different temperatures and rolling stages, Figure 9 is also divided into three states and four sections, yellow for the semi-solid state and orange for the porous solid state. The microstructure of the strips obtained by stopping rolling in different sections is shown in Figure 9 I, II, III and IV (corresponding to each section).
Because the distance between the first powders (node 1) and the roller is very short, the feeding time is only 0.12 s in section I, as shown in Figure 9. As the powders do not touch the roller in this section (discussed above), the powders in the hopper move downward under their own gravity, and the heat of the powders is lost mainly through convection and radiation with the surrounding environment. Thus, the temperature of strips decreases slowly, and it is close to the experimental value, which is in a semi-solid state. In this section, the microstructure in Figure 9 I consists of many pores, large spherical powders with fine grains and some fragments. It indicates that only a small amount of powders in section I have been broken. But all powders at 600 °C crush during the semi-solid compression of porous AA2024 [28]. This is because although the breakage resistance of powders at 600 °C is very small, the rolling force (details discussed in Section 4.4) in section I of SSPR is also small and thus only a part of powders may reach the breakage condition.
When the time is from 0.12 to 0.9 s, it enters into section II. In this section, the powder is rolled into the gap between the strip and the rollers under the friction force produced by the rotated rollers. As shown in Figure 9, the strip temperature decreases rapidly because heat quickly dissipates through contact with rollers, in addition to convection and radiation. Additionally, the plastic deformation and friction of strips produce new heat, which slows the temperature reduction. The actual cooling rate of strips rolled at 600 °C is 67.1 °C/s, and the simulated rate is 52.3 °C/s, which is close to the former. It is illustrated that the established model and the selected parameters are reasonable and consistent with the actual situations. As shown in Figure 9, the strip temperature is basically above 550 °C in section II. The deformation resistance increases slightly, but the rolling force also increases; thus, most powders crush and fragments are further compacted and deformed into finer grains as shown in Figure 9 II. Consequently, pores may be simultaneously filled. But pores still exist in the microstructure, because the rolling force in this section is not large enough.
When entering section III from 0.9 to 1.98 s, the strip temperature still decreases rapidly as shown in Figure 9. In the end of section III, the liquid solidification releases the latent heat, and it delays the drop of strip temperature. Therefore, the temperature of the simulated strip slowly decreases and reaches near 509 °C, but it is still in a porous solid state. However, the experimental temperature reaches about 460 °C, and its difference from the simulated value is attributed to the influence of the density and the temperature on the thermal coefficient of powders and rollers. In this section, as the normal contact force increases rapidly to the maximum and then decreases as discussed above, the broken powder is further compacted and bitten by the rollers. And then it flows, rearranges, squeezes and fills pores under the large rolling force, which consequently forms finer microstructures with few holes as shown in Figure 9 III. Moreover, the liquid phase solidifies to form a solid metallurgical bonding between grains in section III.
With time and the beginning of section IV, the strip is rolled out of rollers and it completes a rolling process. The simulated and experimental temperatures of the strip in this section are all lower than 509 °C and thus it is in a solid state, indicating that the strip has completely solidified. Although the simulated results in this section are much greater than the experimental results, it will not have much impact on the strip quality, as the normal contact force vanishes and the rolling deformation is basically completed. Only under the action of residual stresses is the strip slightly compacted and uniform and fine grains are observed in Figure 9 IV.
In conclusion, the strip temperature calculated by the SSPR model is close to the experimental value in sections I, II and III, which proves the accuracy of the model and its parameters. Because SSPR at 600 °C is mainly in a porous solid state when the force is large, it can be considered as a porous hot rolling. In addition, it can be deduced that the SSPR is a complex forming process that simultaneously combines powder crushing, deformation, densification and solidification.
4.3. The Effect of Powder Temperature on the Strip Temperature
The temperature vs. arc length curve (at increment step 57) of strips rolled at different powder temperatures of 520, 540, 560, 580, 590 and 600 °C is shown in Figure 10. As cracks were found in the rolled strip at 610 °C, which may seriously affect the mechanical properties of the strips, the temperature at 610 °C was not simulated. The microstructures in Figure 5 were placed together with the temperature curve to be better compared and analyzed.
As shown in Figure 10, the tendency of change in the temperature of strips rolled at different powder temperatures is basically the same. The strip temperature increases slightly in section I, drops rapidly in sections II and III and then basically remains unchanged in section IV. It increases with the increase in powder temperatures. Strips rolled at a powder temperature below 600 °C in section I are almost all in a porous solid state, except for 520 °C (in a solid state). Most of the strips rolled at 580, 590 and 600 °C in sections II and III are in a porous solid state, while the strips rolled at 540 and 560 °C are partly in a porous solid state and partly in a solid state, and the strip rolled at 520 °C is completely in a solid state. All strips rolled in section IV are in a solid state.
Comparing microstructures rolled at 580, 590 and 600 °C, it is discovered that these microstructures all consist of finer grains but the strip at a higher temperature is denser. This is because they are all in a porous solid state as shown in Figure 10, when the rolling force dominates the deformation in sections II and III. Hence, it is deduced that the SSPR at 580, 590 and 600 °C has the same forming mechanisms, which are powder breakage, liquid solidification and densification as discussed above. The SSPR at 600 °C is considered as a porous hot rolling. Therefore, it can be concluded that the SSPR at 580, 590 and 600 °C is a porous hot rolling. Comparing microstructures obtained at 520, 540 and 560 °C, it is discovered that their grains are all larger than those obtained at 580, 590 and 600 °C, which partially keep the initial powder morphology. That is to say, they have similar microstructures. Seen from the temperature vs. arc length curve in Figure 10, strips rolled at 520, 540 and 560 °C are mainly in a solid state. Therefore, it can be concluded that the SSPR at 520, 540 and 560 °C is a powder hot rolling.
4.4. The Effect of Powder Temperature on the Relative Density and Rolling Force
Figure 11 shows the change curve of the relative density and rolling force of the strips measured at different powder temperatures. The initial apparent density of the powders is 0.408, and the relative density of the rolled strips is basically above 0.80. With increasing temperature, the relative density slowly increases from 0.806 at 520 °C to 0.856 at 560 °C, increases rapidly after 560 °C, reaches a maximum value of 0.938 at 600 °C and then decreases to 0.913 at 610 °C, as shown in Figure 11. The change in relative density with powder temperature below 600 °C agrees with that of pores in microstructures (Figure 5). As cracks are produced in strips rolled at 610 °C, the relative density is reduced. Therefore, the strips produced by SSPR cannot reach the full density. However, the changing tendency of the rolling forces is opposite to that of the relative densities, which decreases with the increase in the powder temperatures. It agrees well with the changing law of peak stresses during semi-solid powder compression discussed in Section 4.2.
Figure 12 shows the rolling force vs. time curve calculated by the model at different powder temperatures. Because the simulated rolling force of strips (the deformable body) is not accurate, the simulated rolling force in Figure 12 is actually the rolling force of the rollers (the rigid body), which is related to the normal contact force but different from it. The normal contact force is an instantaneous value when the strip contacts the rollers, while the rolling force of the rollers is a cumulative value during the whole SSPR process. In other words, when the normal contact force between strips and rollers is large in sections I, II and III, the simulated rolling force of rollers is also large. But the former reduces to zero in section IV because the strip is separated from rollers, while the latter basically remains unchanged as rollers continuously contact new powders.
In section I, there is basically no rolling force as powders do not contact rollers. In section II, the rolling force increases slowly because powders just come into contact with rollers. In section III, the rolling force first increases rapidly and then increases slowly and finally reaches the maximum value. In section IV, the rolling force mainly stays constant although there are some fluctuations. As shown in Figure 12, the simulated rolling force decreases with the increase in the powder temperatures, due to the decrease in the deformation resistance of the semi-solid powder materials. The rolling force calculated at 1.98 s was chosen as the maximum rolling force and compared with the experimental value, as shown in Figure 13. It can be seen that the simulated rolling forces have the same order of magnitude as the experimental values, further confirming the correctness of the model.
Figure 14 shows the relative density vs. arc length curve (at incremental step 57) of strips simulated at different powder temperatures. Curves at different powder temperatures have a similar variation tendency. As shown in Figure 14, the relative density of the strips remains basically unchanged at 0.4 in section I, since the rolling force is zero. In section II, it gradually increases as the rolling force slightly increases, but the increasing rate is lower than that in section III. The relative density increases rapidly and then slowly when the rolling force reaches the maximum in section III. In section IV, the relative density stays basically unchanged at first, and then decreases rapidly due to insufficient powder supplement at the end of rolling. As seen in Figure 14, the simulated relative densities of the strips increase with the increase in powder temperatures, which agrees well with the trend change in the actual experiment and the relative density values in Figure 11. Although the error between the simulated and experimental rolling force is large, the relative density error is small (maximum 1.94%), again indicating that the model can basically simulate the SSPR process at each semi-solid powder temperature of 600 °C and below.
5. Conclusions
- (1)
- The grain of strips after SSPR is refined with the increase in the semi-solid powder temperature, and finer microstructures with fewer pores are obtained at 600 °C due to a higher liquid fraction and more broken powders, while the grain coarsening and cracks appear at 610 °C due to much liquid flowing. On the basis of microstructure analysis, it is deduced that powder crushing, liquid solidification, densification and grain coarsening exist simultaneously during SSPR.
- (2)
- As the simulated temperature of strips is mainly consistent with the experimental value in sections I, II and III, it is confirmed that the model based on the Fourier equations and its parameter setting are correct, which considers heat exchange of solidification, deformation, friction, convection, radiation and conduction. As the strip temperature in the main deformation sections (II and III) is between 580 and 509 °C (in a porous solid state), the SSPR at 600 °C can be considered as a porous hot rolling, integrating powder crushing, deformation, densification and solidification.
- (3)
- According to the analysis of microstructures and simulated strip temperatures during SSPR, it is concluded that the SSPR at powder temperatures of 580, 590 and 600 °C is actually a porous hot rolling, as it has similar finer microstructures and is mainly in a porous solid state in sections II and III (the rolling force plays a major role in deformation). The SSPR at powder temperatures of 520, 540 and 560 °C can be regarded as a powder hot rolling, because it has similar larger particles and is basically in a solid state in sections II and III.
- (4)
- Under the combined actions of powder crushing, grain coarsening and liquid flowing, the measured and calculated relative densities increase with increasing powder temperature and reach a maximum at 600 °C, and then the measured relative density decreases at 610 °C, which confirms that it is unable to obtain a full density during SSPR. The measured and calculated rolling forces decrease with increasing powder temperature, because the liquid fraction increases and the deformation resistance decreases. Therefore, combined with the results of the microstructure analysis, the optimal powder temperature for SSPR is 600 °C. The simulated rolling force and relative density are very low in section I, increase slowly in section II and then rapidly increase to the maximum in section III, finally keeping constant in section IV. The effect of powder temperature on the simulated rolling force and relative density of the strips is basically in good agreement with the experimental results, which further confirms that the established SSPR model is reasonable.
Author Contributions
M.W.’s contributions: literature search, experimental design, testing data, data analysis, data interpretation, software validation, writing original draft and writing—review and editing. R.C.’s contributions: modeling, model validation, data analysis and providing financial support. Y.W.’s contributions: drawing, model setting, data analysis and revising the final draft. X.L.’s contributions: providing the experimental data analysis and guidance, providing financial support and revising the final draft. J.Y.’s contributions: providing the experimental resources and helping with testing. X.Z.’s contributions: project supervision and management and revising the final draft. All authors have read and agreed to the published version of the manuscript.
Funding
The authors acknowledge the financial support from the National Natural Science Foundation of China (12302081), Science and Technology Planning Projects of Guangzhou (202102080110), the Sichuan Science and Technology Program (2020YFH0151) and the Guangdong Polytechnic Normal University Talent Scientific Research Launch Project (2021SDKYA187, 2021SDKYA062 and 2021SDKYA006).
Data Availability Statement
The data supporting the findings of this study are available within the article.
Conflicts of Interest
The authors declare that they have no known competing financial interests or personal relationships that could have appeared to influence the work reported in this paper.
References
- Huang, M.; Jiang, J.; Wang, Y.; Liu, Y.; Zhang, Y.; Dong, J. Thixotropic deformation behavior, rapid spheroidization and solid-liquid homogenization of semi-solid Al0. 8Co0. 5Cr1. 5CuFeNi HEA with multilevel microstructure. Scr. Mater. 2023, 229, 115384. [Google Scholar] [CrossRef]
- Aghajani, S.; Pouyafar, V.; Meshkabadi, R.; Volinsky, A.A.; Bolouri, A. Mechanical characterization of high volume fraction Al7075-Al2O3 composite fabricated by semisolid powder processing. Int. J. Adv. Manuf. Technol. 2023, 125, 2569–2580. [Google Scholar] [CrossRef]
- Wang, Y.; Zhang, X.; Chen, T. Heterogeneous lamella structure design to simultaneously strengthen and toughen aluminum alloys. J. Alloys Compd. 2023, 930, 167456. [Google Scholar] [CrossRef]
- Ye, Y.; Xia, H.; Lin, Y.; Chen, F.; Shen, Q. Refined WC grain size and improved mechanical properties in a hardmetal WC-8Co processed via short-time semi-solid hot pressing. J. Alloys Compd. 2021, 889, 161560. [Google Scholar] [CrossRef]
- Zhang, X.; Wang, Y.; Chen, T.; Xu, H.; Ma, J. Achieving a heterogeneous lamella-structured aluminum alloy with excellent synergy of strength and ductility by powder thixoforming. Mater. Sci. Eng. A 2022, 838, 142781. [Google Scholar] [CrossRef]
- Son, Y.G.; Jung, S.S.; Park, Y.H.; Lee, Y.C. Effect of Semi-Solid Processing on the Microstructure and Mechanical Properties of Aluminum Alloy Chips with Eutectic Mg2Si Intermetallics. Metals 2021, 11, 1414. [Google Scholar] [CrossRef]
- Chen, L.; Qi, Y.; Fei, Y.; Du, Z. Enhanced Mechanical Properties and Thermal Conductivity for GNPs/Al2024 Composites with In Situ SiC Nanorods. Met. Mater. Int. 2021, 27, 4263–4270. [Google Scholar] [CrossRef]
- Li, P.; Chen, L.; Cao, B.; Shi, K. Hierarchical microstructure architecture: A roadmap towards strengthening and toughening reduced graphene oxide/2024Al matrix composites synthesized by flake powder thixoforming. J. Alloys Compd. 2020, 823, 153815. [Google Scholar] [CrossRef]
- Wu, M.; Wang, B.; Luo, X.; Liu, M.; Wang, Y.; Yu, J.; Li, Y. Deformation behavior and forming process simulation of semi-solid powder rolling based on the combined constitutive model. Mater. Res. Express 2022, 9, 126510. [Google Scholar] [CrossRef]
- Wu, M.; Liu, J.; Luo, X.; Liu, Y.; Liu, M.; Kong, C.; Wang, Y. Numerical Simulation and Parameter Optimization for Semi-solid Powder Rolling of Al–Cu–Mg Alloy. Trans. Indian Inst. Met. 2023, 76, 1771–1780. [Google Scholar] [CrossRef]
- Wojtaszek, M.; Korpała, G.; Śleboda, T.; Zyguła, K.; Prahl, U. Hot Processing of Powder Metallurgy and Wrought Ti-6Al-4V Alloy with Large Total Deformation: Physical Modeling and Verification by Rolling. Met. Mater. Trans. A 2020, 51, 5790–5805. [Google Scholar] [CrossRef]
- Kapranos, P. Current State of Semi-Solid Net-Shape Die Casting. Metals 2019, 9, 1301. [Google Scholar] [CrossRef]
- Fang, J.X.; Wang, J.X.; Wang, Y.J.; He, H.T.; Zhang, D.B.; Cao, Y. Microstructure evolution and deformation behavior during stretching of a compositionally inhomogeneous TWIP-TRIP cantor-like alloy by laser powder deposition. Mater. Sci. Eng. A 2022, 847, 143319. [Google Scholar] [CrossRef]
- Zhu, Z.Y.; Liu, Y.L.; Gou, G.Q.; Gao, W.; Chen, J. Effect of heat input on interfacial characterization of the butter joint of hot-rolling CP-Ti/Q235 bimetallic sheets by Laser+ CMT. Nat. Publ. Group 2021, 11, 10020. [Google Scholar] [CrossRef]
- Peng, S.; Wang, J.; Wang, M.; Dong, X.; He, X.; Yu, L.; Zhang, X. Investigation on the compression properties of semi-solid Be-Al alloy. Mater. Lett. 2022, 321, 132431. [Google Scholar] [CrossRef]
- Chen, G.; Lin, F.; Yao, S.; Han, F.; Wei, B.; Zhang, Y. Constitutive behavior of aluminum alloy in a wide temperature range from warm to semi-solid regions. J. Alloys Compd. 2016, 674, 26–36. [Google Scholar] [CrossRef]
- Mei, D.; Wang, H.; Yao, Z.; Li, Y. Numerical modeling and optimization of the segmented PbTe–BiTe-based thermoelectric leg. J. Appl. Phys. 2016, 120, 124503. [Google Scholar] [CrossRef]
- Nithin, A.M.; Davidson, M.J.; Rao, C.S.P. Microstructure modeling of a sintered Al–4Si–0.6 Mg alloy extruded at semi-solid temperature ranges. Proc. Inst. Mech. Eng. Part E J. Process Mech. Eng. 2022, 236, 394–403. [Google Scholar]
- Luo, X.; Li, M.; Ren, J.; Zhao, Y.; Wu, M.; Huang, B. Deformation Micromechanism and Constitutive Analysis behind the Semisolid Powder Compression of Medical Mg-Zn Alloy. JOM 2022, 74, 899–908. [Google Scholar] [CrossRef]
- Hu, Z.; Li, J.; Tan, Y.; Jiang, D.; Li, P. Interaction of impurity distribution and groove at the micro-zone of solid/liquid interface in silicon. Mater. Des. 2022, 214, 110384. [Google Scholar] [CrossRef]
- Li, F.; Chen, P.; Han, J.; Deng, L.; Yi, J.; Liu, Y.; Eckert, J. Metal flow behavior of P/M connecting rod preform in flashless forging based on isothermal compression and numerical simulation. J. Mater. Res. Technol. 2019, 9, 1200–1209. [Google Scholar] [CrossRef]
- Wang, Y.; Zhao, S.; Guo, Y. Numerical Simulation and Experimental Investigation of the Preparation of Aluminium Alloy 2A50 Semi-Solid Billet by Electromagnetic Stirring. Materials 2020, 13, 5470. [Google Scholar] [CrossRef]
- Zhang, Y.; Liu, J.; Fu, Y.; Jie, J.; Lu, Y.; Guo, Q.; Wang, T.; Li, T. Microstructure and Fabrication of Cu-Pb-Sn/Q235 Laminated Composite by Semi-Solid Rolling. Metals 2018, 8, 722. [Google Scholar] [CrossRef]
- Li, F.; Liu, Y.; Yi, J. Modeling the Thermal Fields of Deposited Materials during the Spray Rolling Process. Metall. Mater. Trans. A Phys. Metall. Mater. Sci. 2014, 45, 4012–4021. [Google Scholar] [CrossRef]
- Wang, D.; Zhou, C.; Xu, G.; Huaiyuan, A. Heat transfer behavior of top side-pouring twin-roll casting. J. Mater. Process. Technol. 2014, 214, 1275–1284. [Google Scholar] [CrossRef]
- Li, F.; Yi, J.; Eckert, J. Deformation Behavior of Powder Metallurgy Connecting Rod Preform During Hot Forging Based on Hot Compression and Finite Element Method Simulation. Metall. Mater. Trans. A 2017, 48, 2971–2978. [Google Scholar] [CrossRef]
- Wu, Y.; Kim, G.Y. Compaction behavior of Al6061 powder in the semi-solid state. Powder Technol. 2011, 214, 252–258. [Google Scholar] [CrossRef]
- Wu, M.; Liu, J.; Luo, X.; Liu, Y.; Cai, R.; Kong, C.; Wu, Q. The Powder Breakage Behavior and Mechanism during Semi-Solid Powder Forming. JOM 2023, 75, 2511–2524. [Google Scholar] [CrossRef]
- Aghajani, S.; Pouyafar, V.; Meshkabadi, R. Wear behavior of high volume Al2O3-reinforced Al7075 matrix composites fabricated by semi-solid powder processing. Proc. Inst. Mech. Eng. Part E J. Process Mech. Eng. 2022, 236, 2689–2700. [Google Scholar] [CrossRef]
- Wu, Y.; Kim, G.-Y.; Anderson, I.E.; Lograsso, T.A. Experimental study on viscosity and phase segregation of Al-Si powders in microsemisolid powder forming. J. Manuf. Sci. Eng. 2010, 132, 3–7. [Google Scholar] [CrossRef]
Figure 1.
The characteristic curves of AA2024 powders: (a) DSC curve; (b) liquid fraction curve.
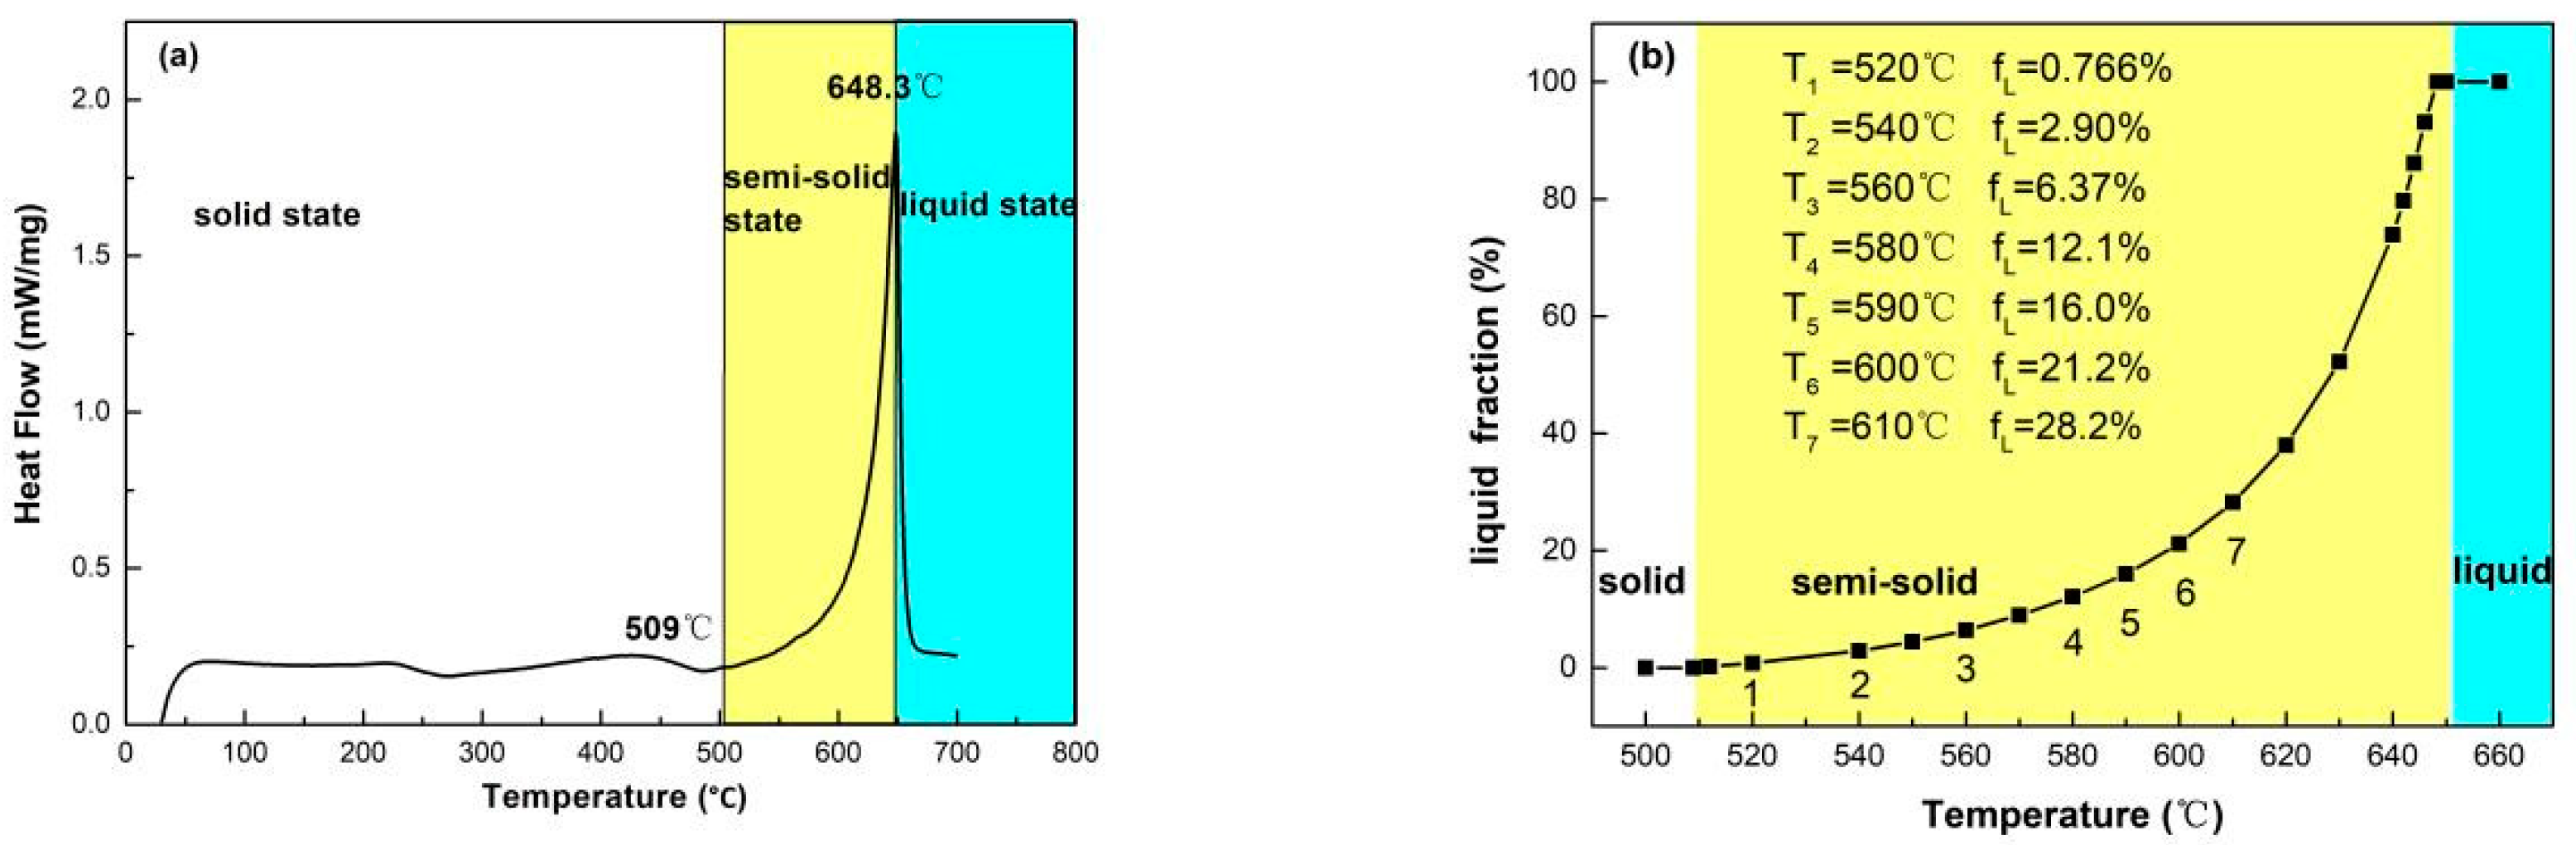
Figure 2.
Diagrams of SSPR: (a) the strip; (b) the rolling equipment; (c) the schematic.

Figure 3.
Coefficients of strips and rollers calculated using JMatPro 1.0 software: (a) thermal conductivity and specific heat; (b) Young’s modulus and Poisson’s ratio.
Figure 3.
Coefficients of strips and rollers calculated using JMatPro 1.0 software: (a) thermal conductivity and specific heat; (b) Young’s modulus and Poisson’s ratio.

Figure 4.
Heat exchanged during SSPR.
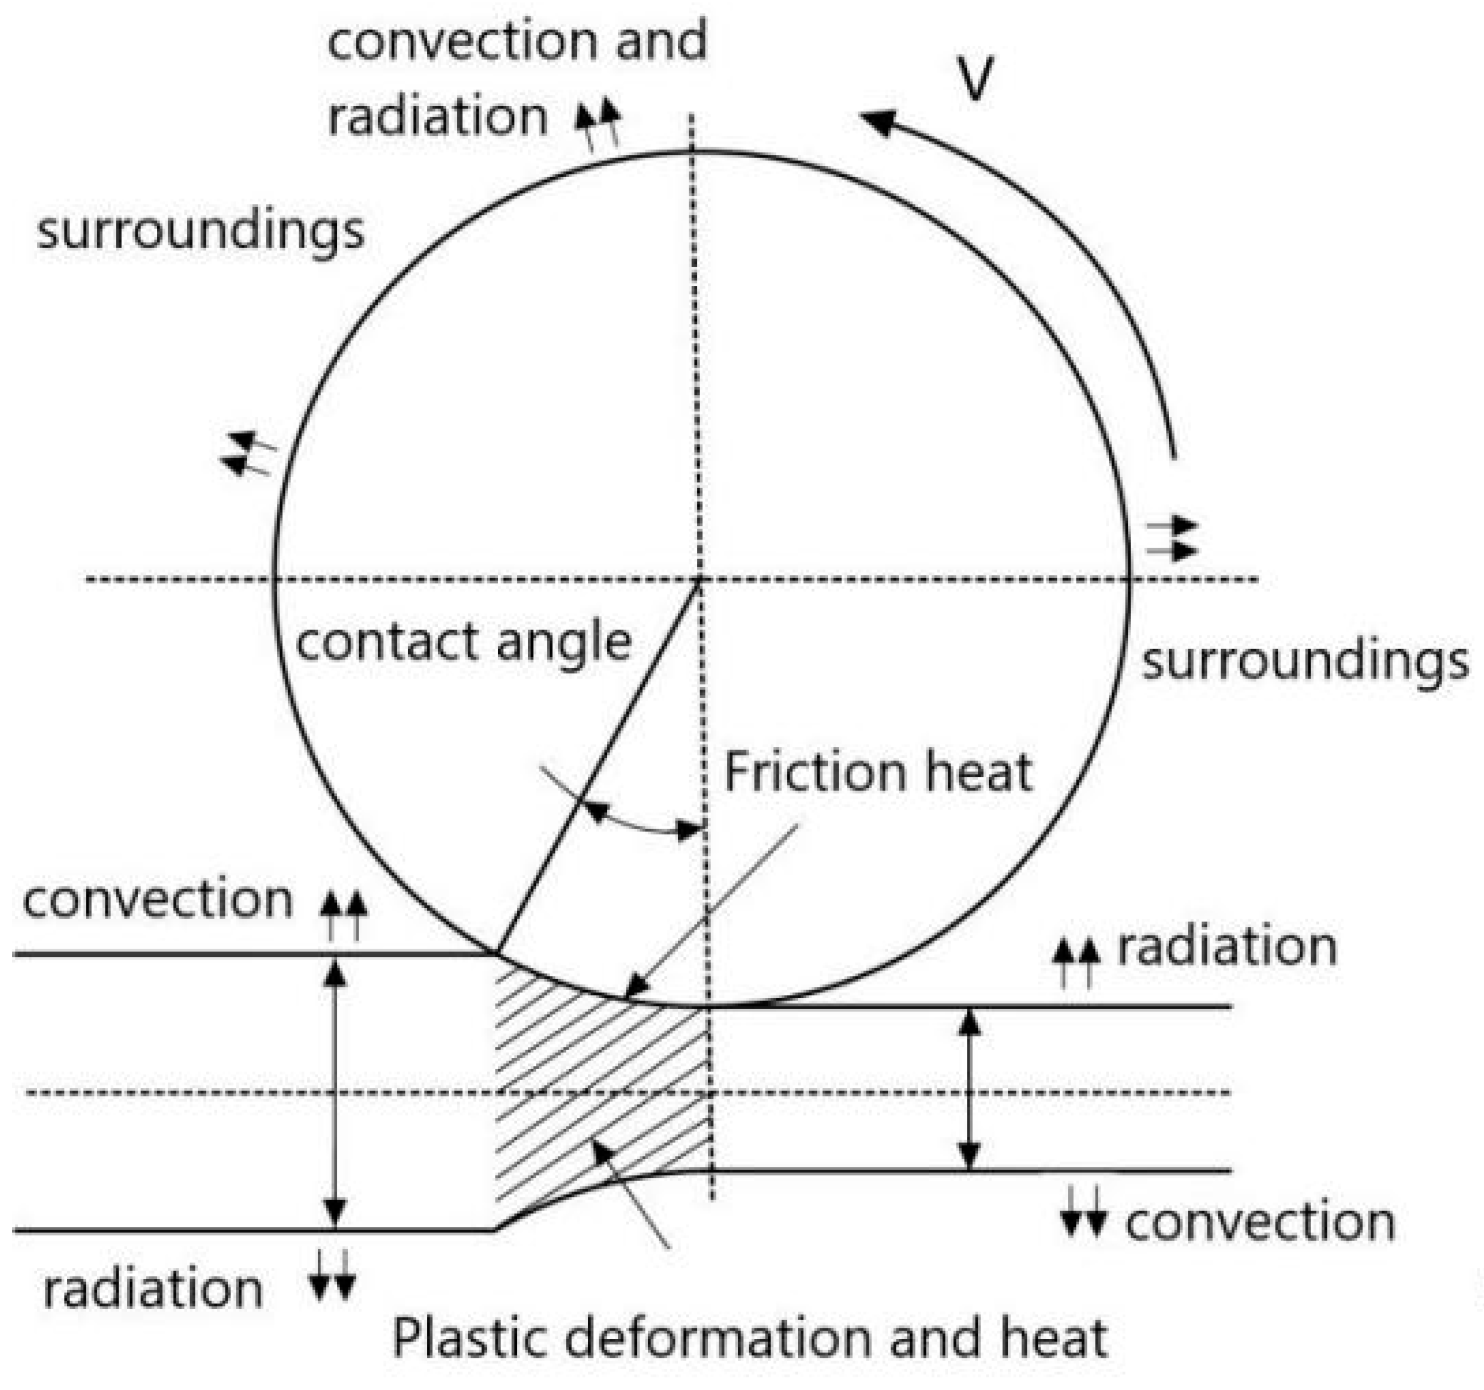
Figure 5.
Microstructures of strips rolled at different powder temperatures: (a) 520 °C; (b) 540 °C; (c) 560 °C; (d) 580 °C; (e) 590 °C; (f) 600 °C; (g) 610 °C.
Figure 5.
Microstructures of strips rolled at different powder temperatures: (a) 520 °C; (b) 540 °C; (c) 560 °C; (d) 580 °C; (e) 590 °C; (f) 600 °C; (g) 610 °C.
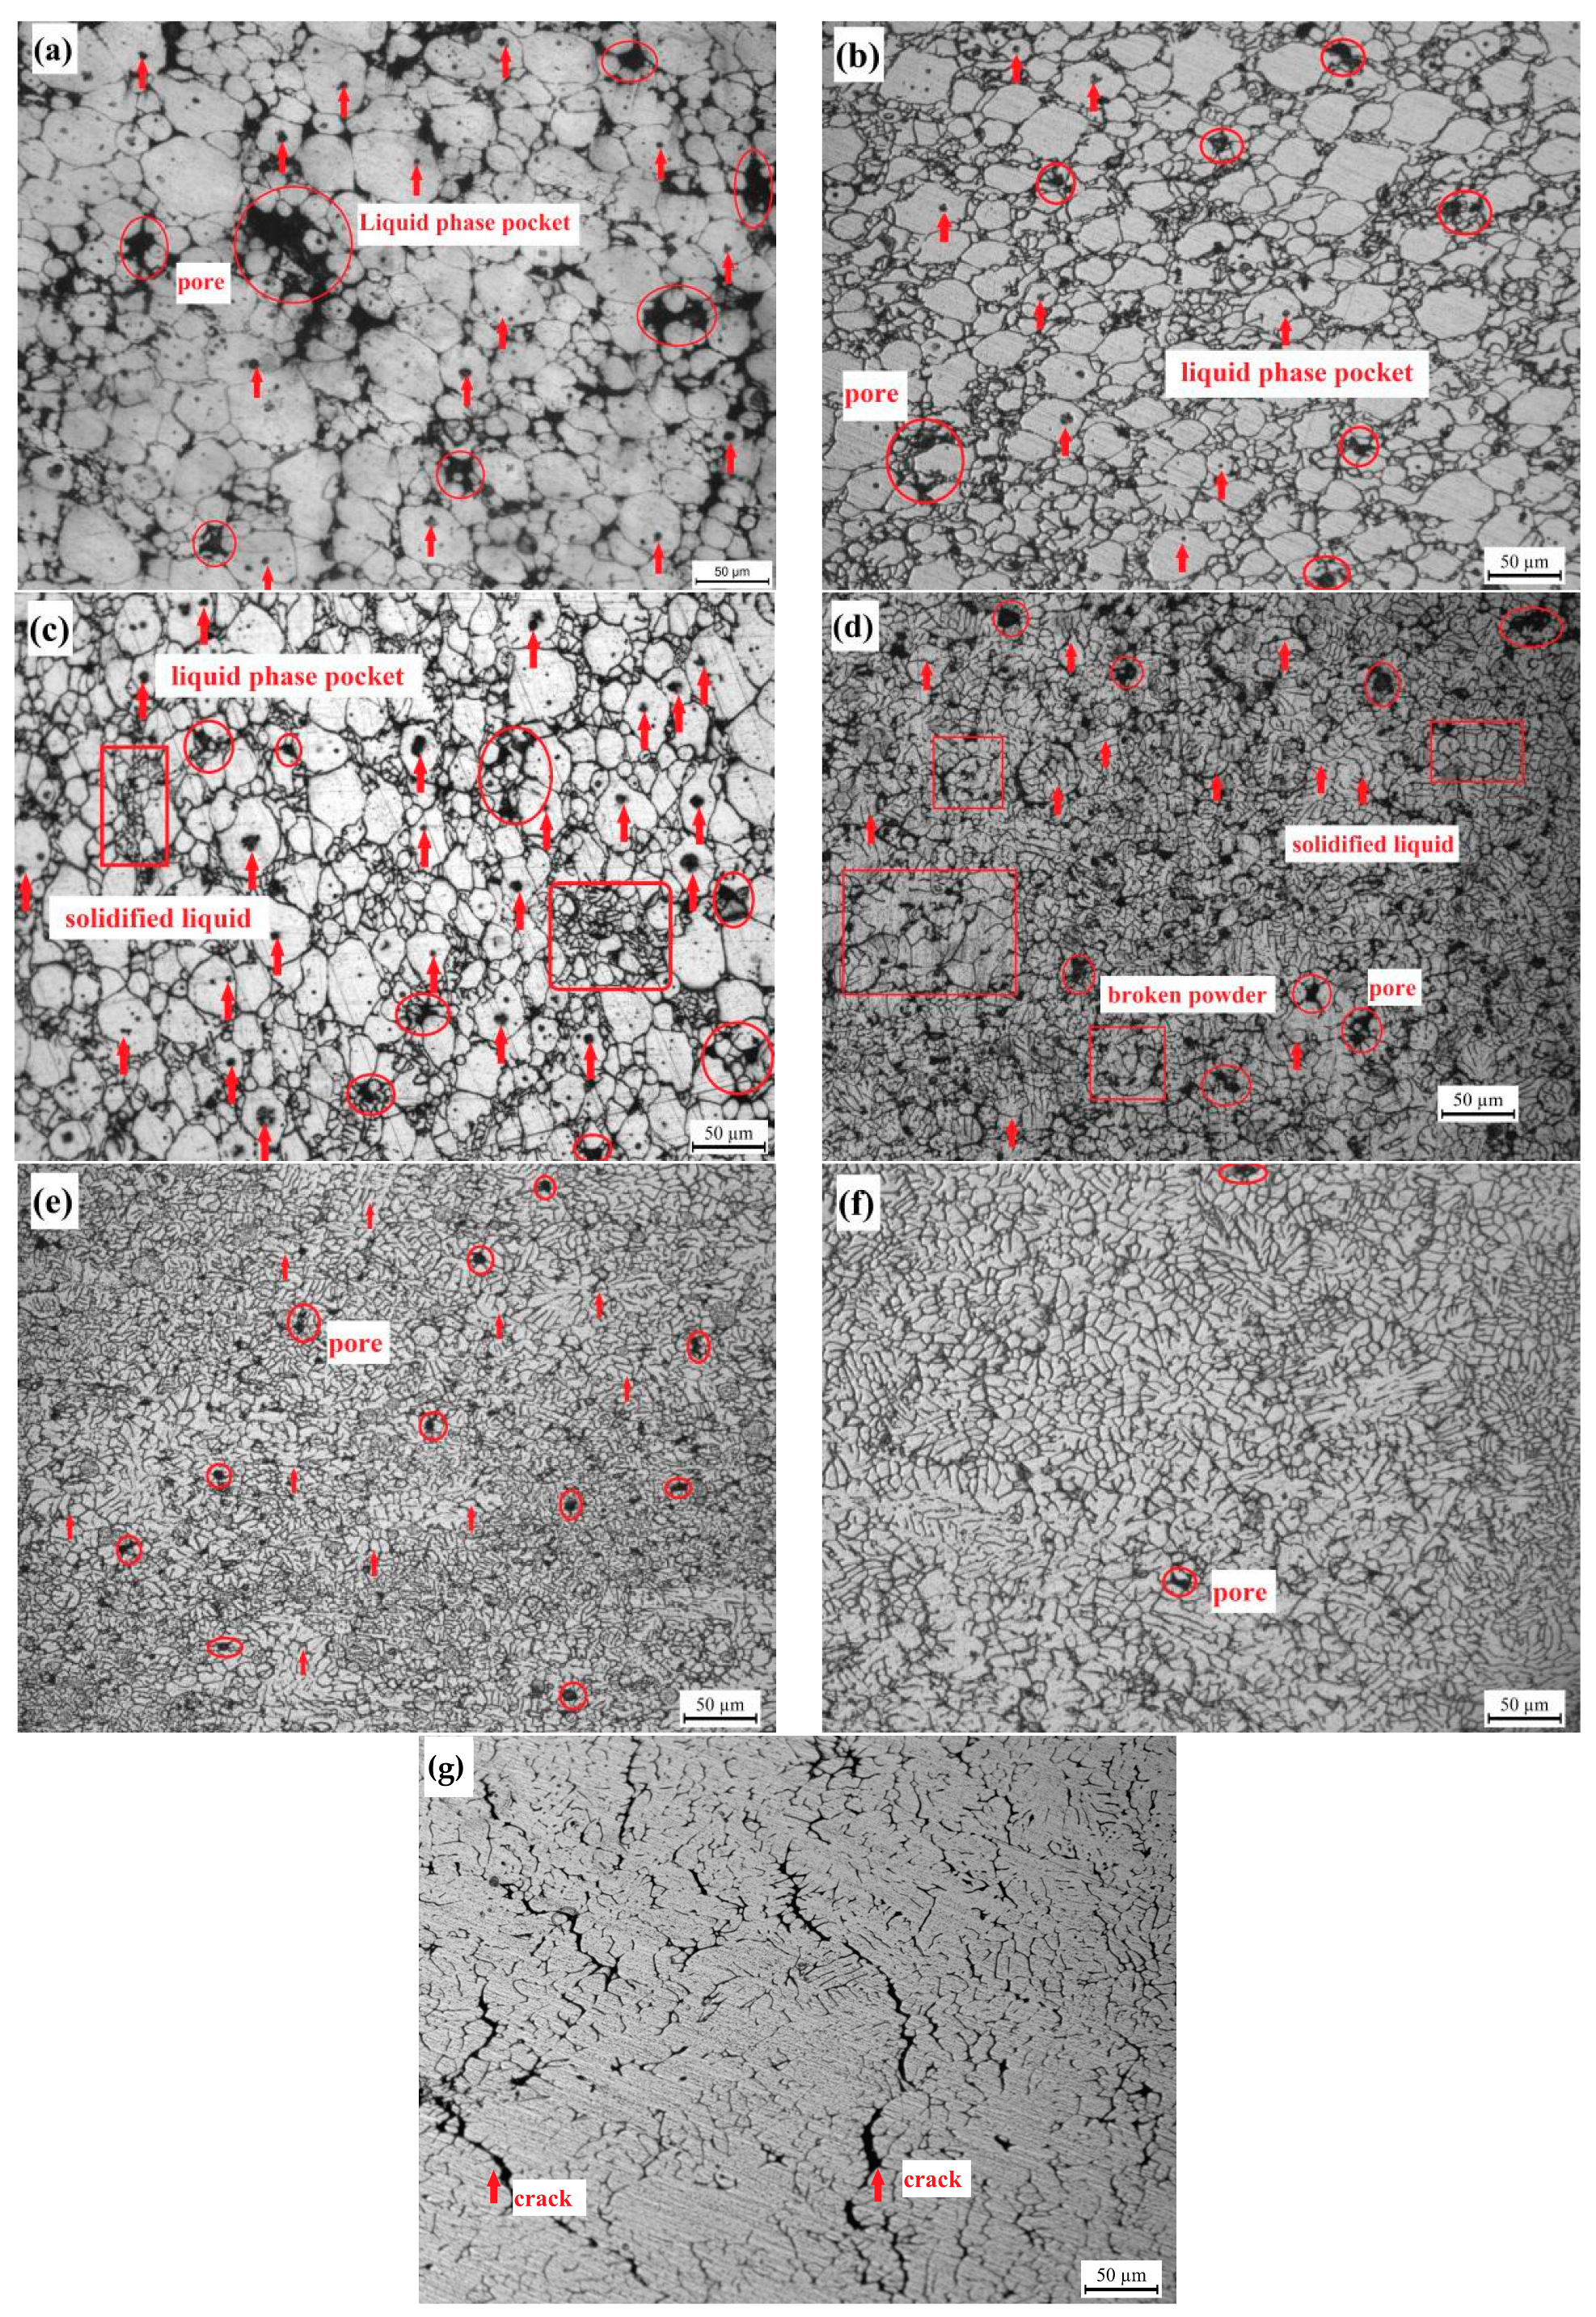
Figure 6.
The thermomechanical coupling finite element model of SSPR: (a) the whole model; (b) the close up of the model.
Figure 6.
The thermomechanical coupling finite element model of SSPR: (a) the whole model; (b) the close up of the model.
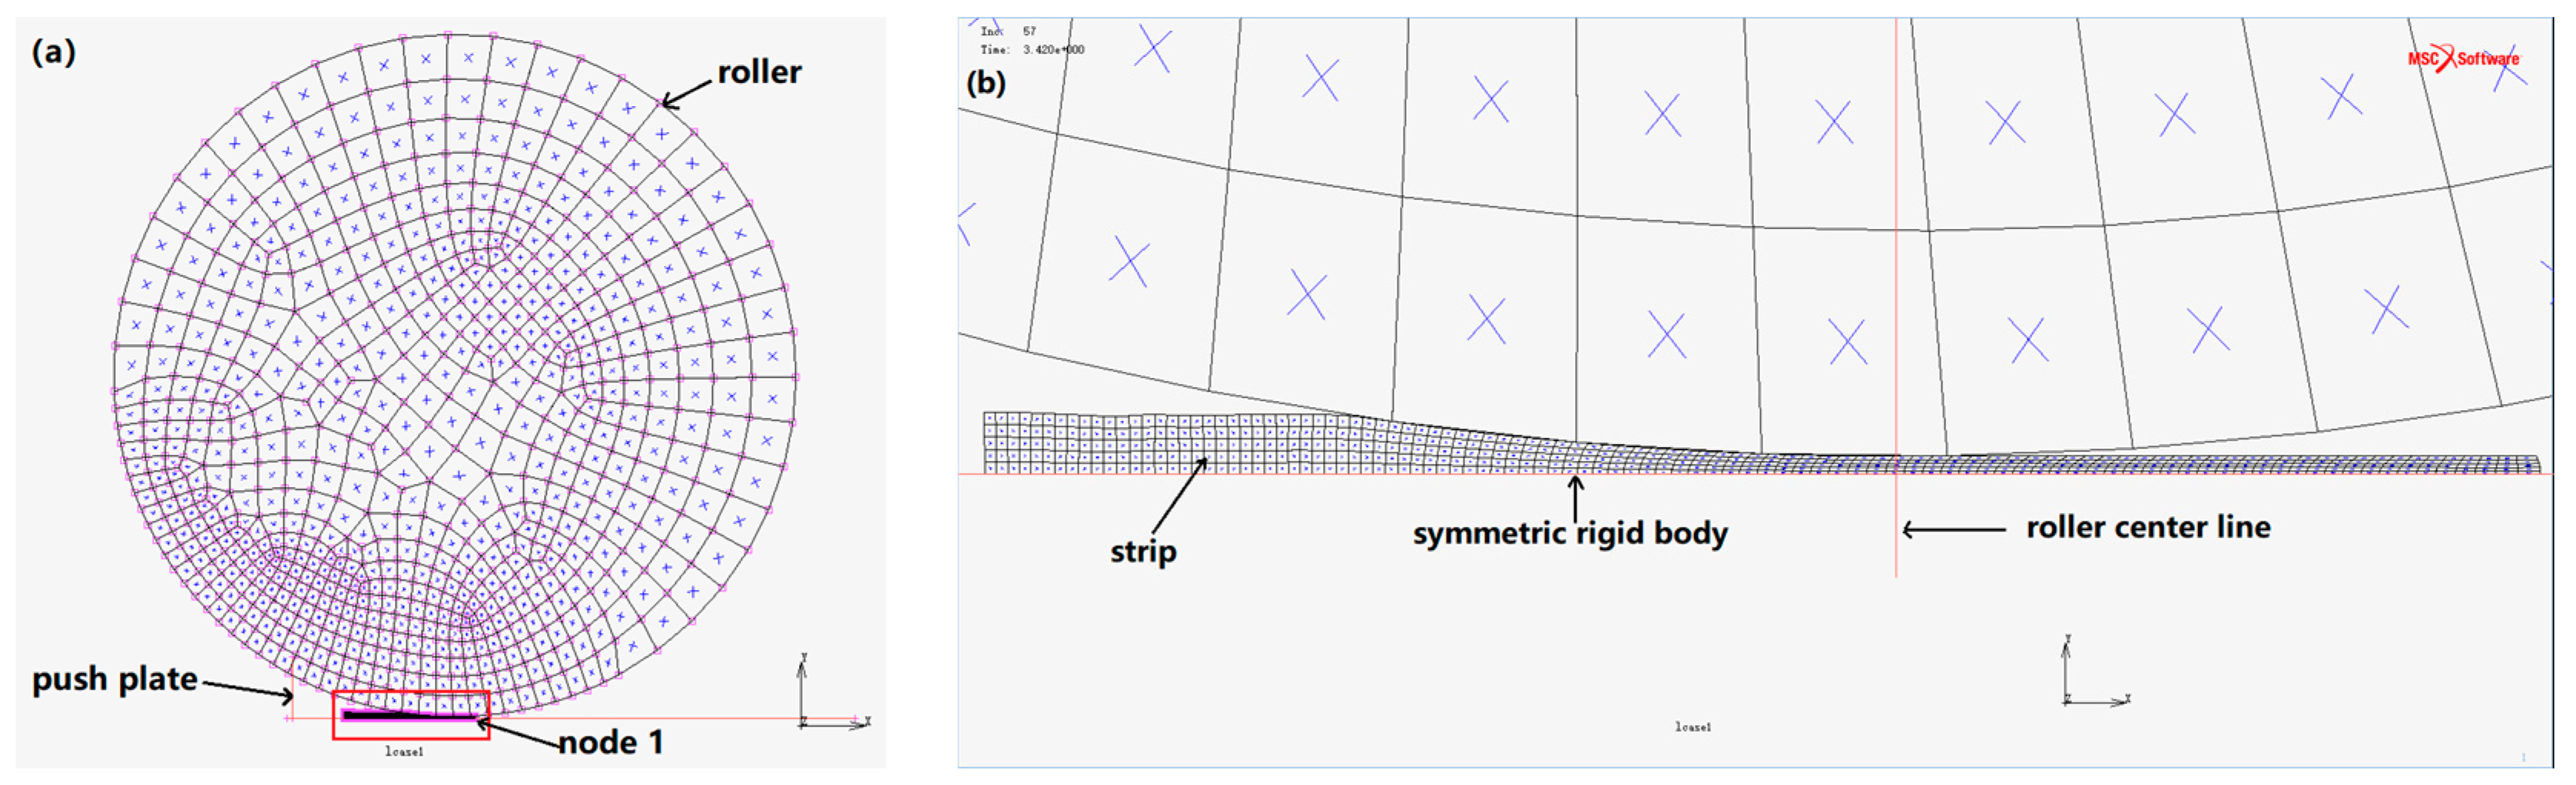
Figure 7.
Stress–strain curves of AA2024 compressed with a strain rate of 1 s−1 at different temperatures.
Figure 7.
Stress–strain curves of AA2024 compressed with a strain rate of 1 s−1 at different temperatures.

Figure 8.
Distribution diagrams of strips rolled at 600 °C during SSPR (at increment step 57): (a) temperature field; (b) contact normal force field.
Figure 8.
Distribution diagrams of strips rolled at 600 °C during SSPR (at increment step 57): (a) temperature field; (b) contact normal force field.

Figure 9.
The temperature vs. time curve obtained by the experiment and simulation and the microstructures measured in different sections during SSPR (at 600 °C).
Figure 9.
The temperature vs. time curve obtained by the experiment and simulation and the microstructures measured in different sections during SSPR (at 600 °C).
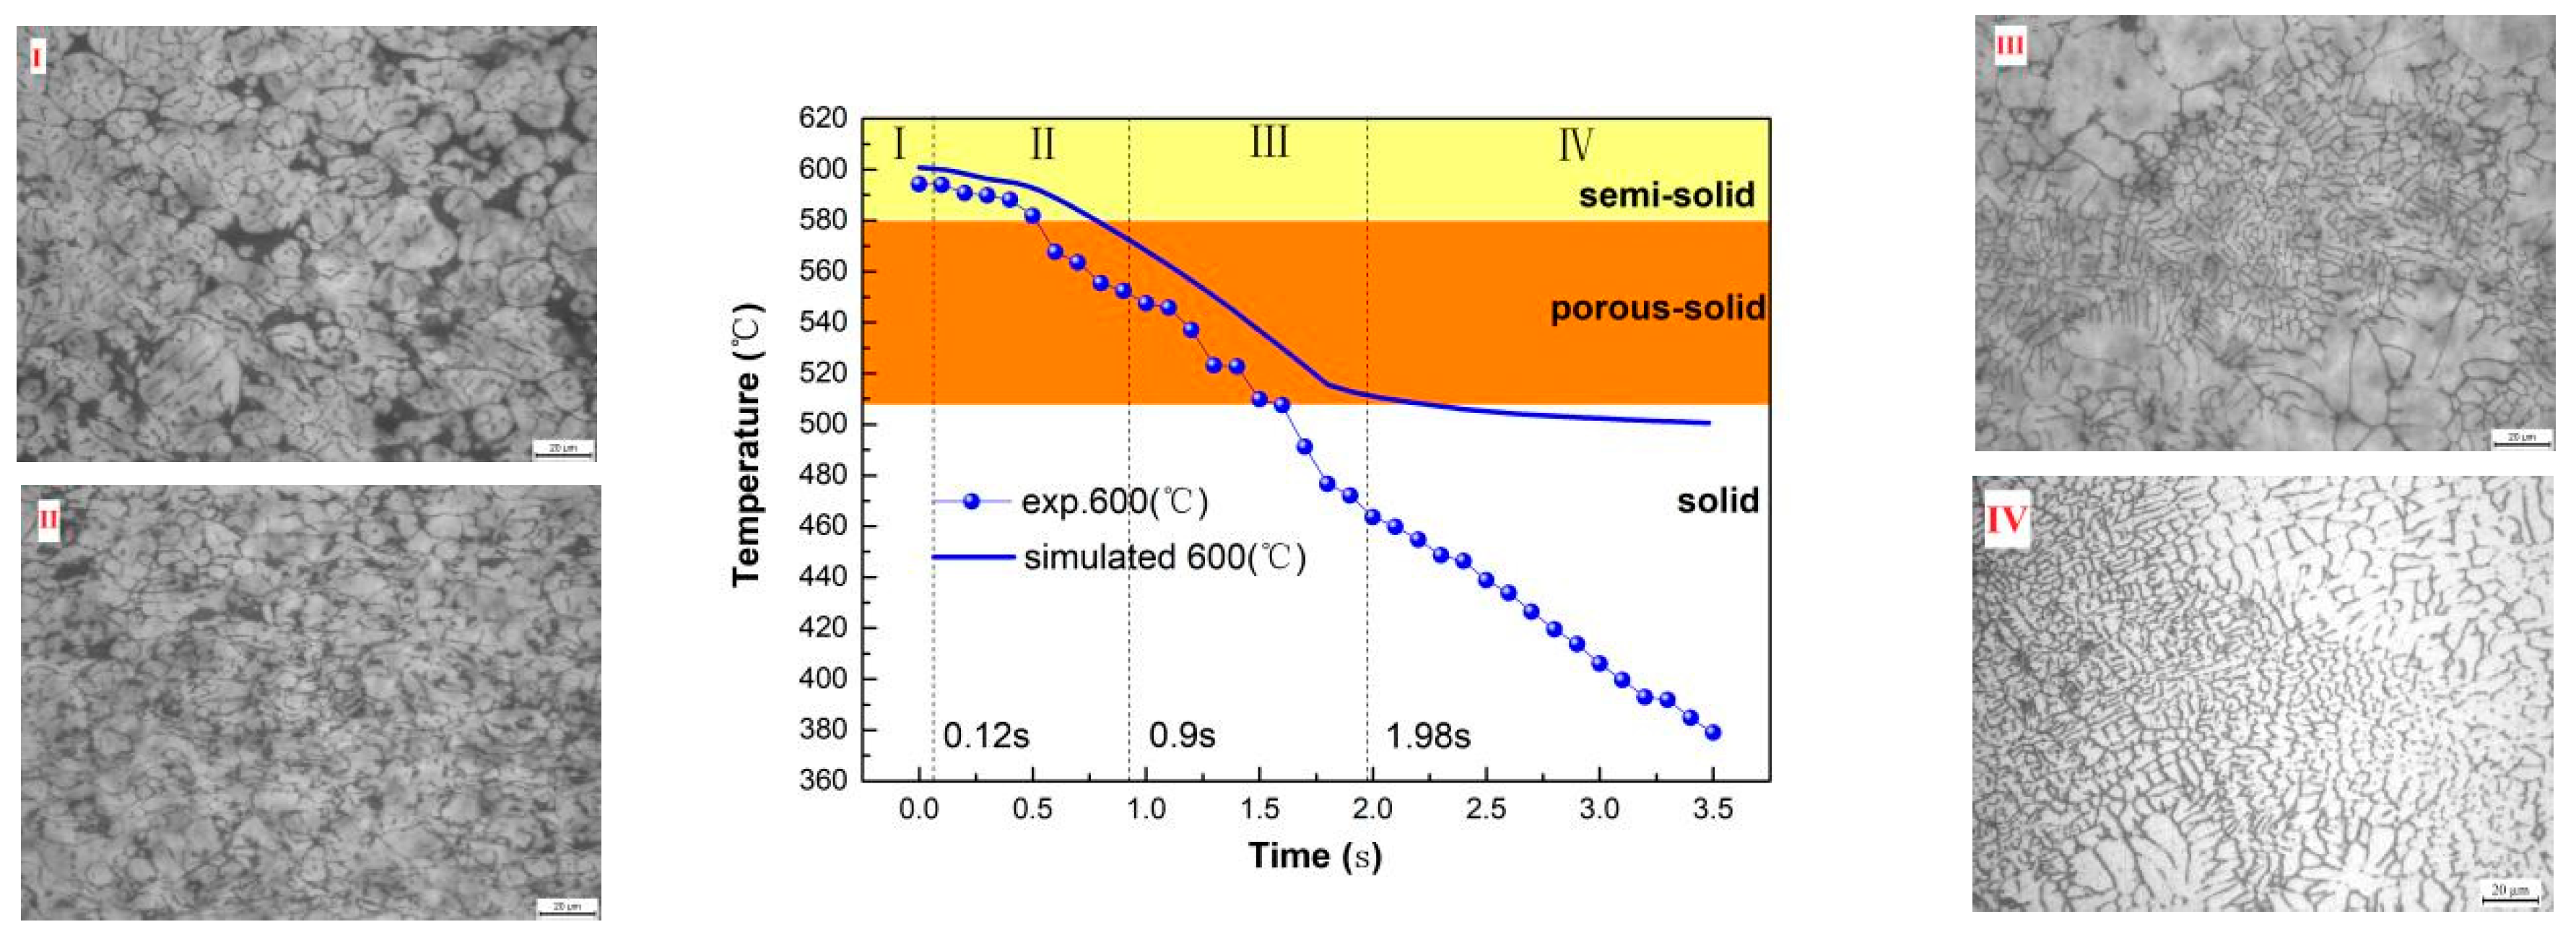
Figure 10.
The temperature vs. arc length curve of strips simulated at different powder temperatures (at increment step 57) and the microstructures of Figure 5.
Figure 10.
The temperature vs. arc length curve of strips simulated at different powder temperatures (at increment step 57) and the microstructures of Figure 5.
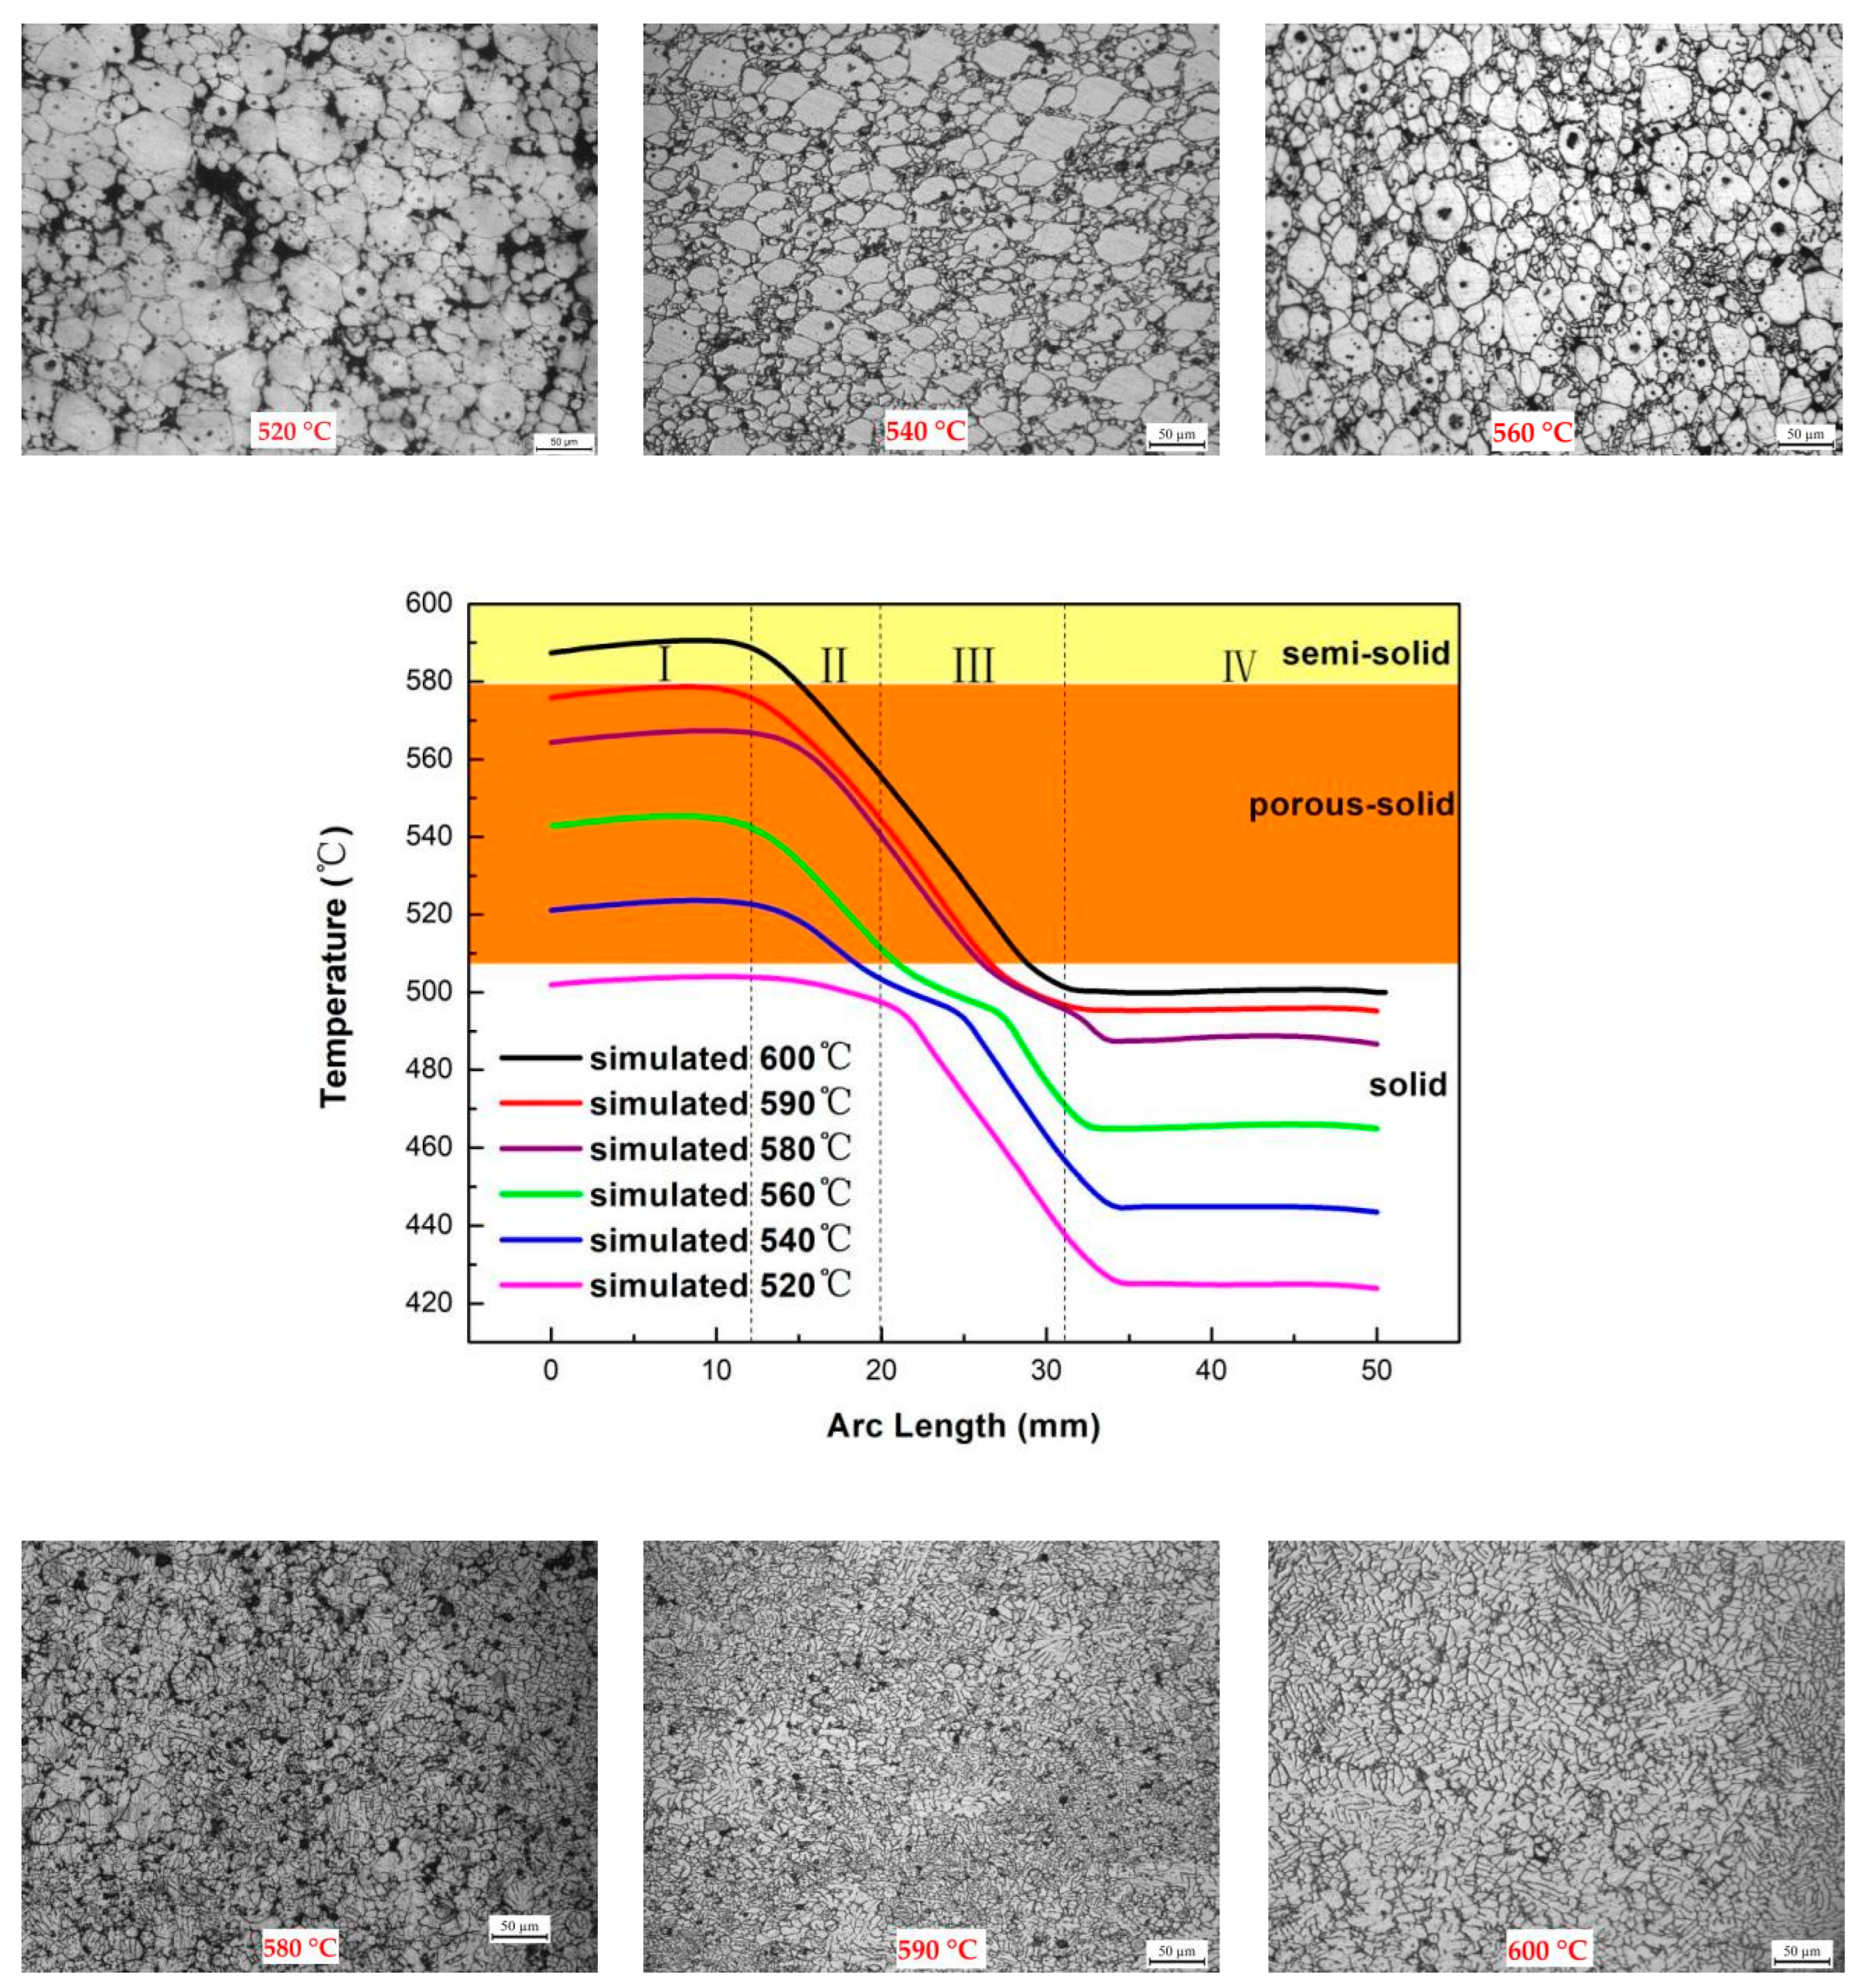
Figure 11.
Relative density and rolling force of strips rolled at different powder temperatures.
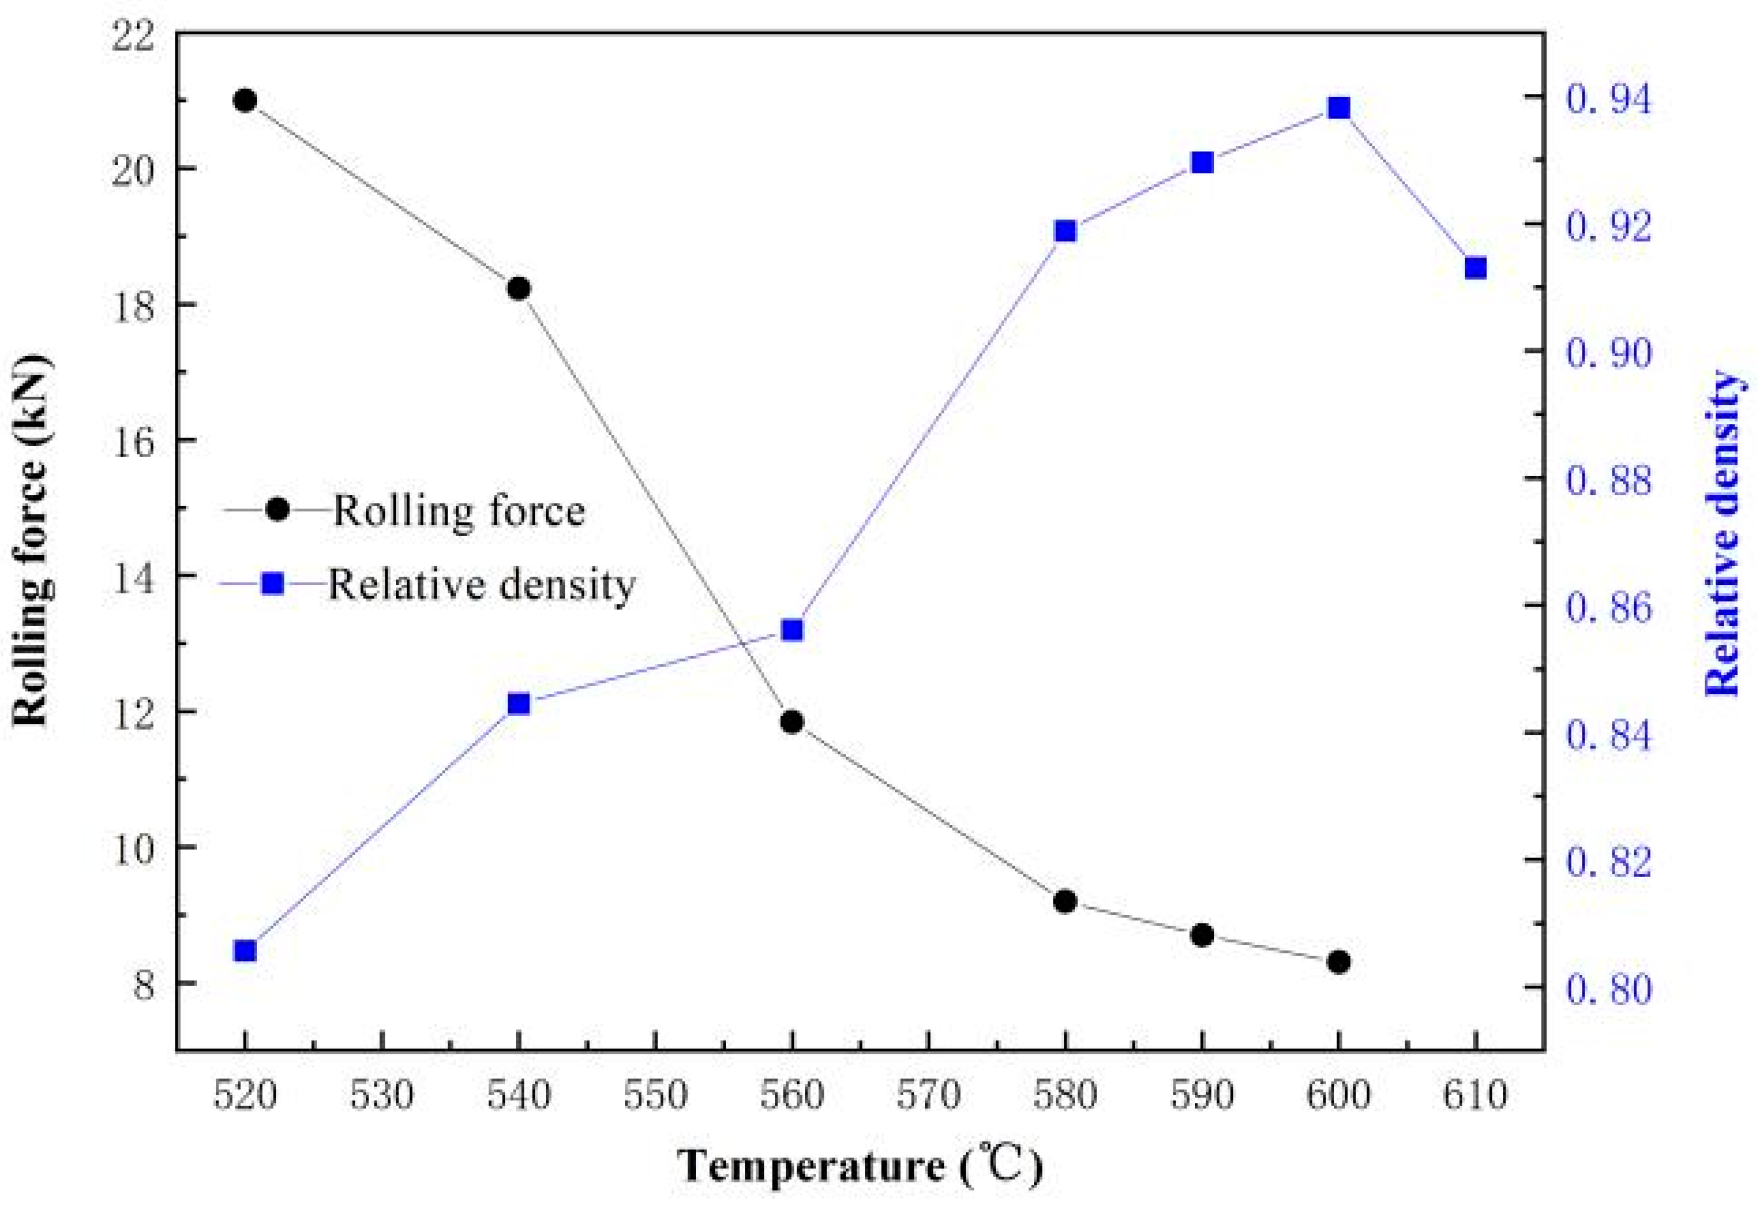
Figure 12.
Rolling force vs. time curve of rollers calculated at different powder temperatures.
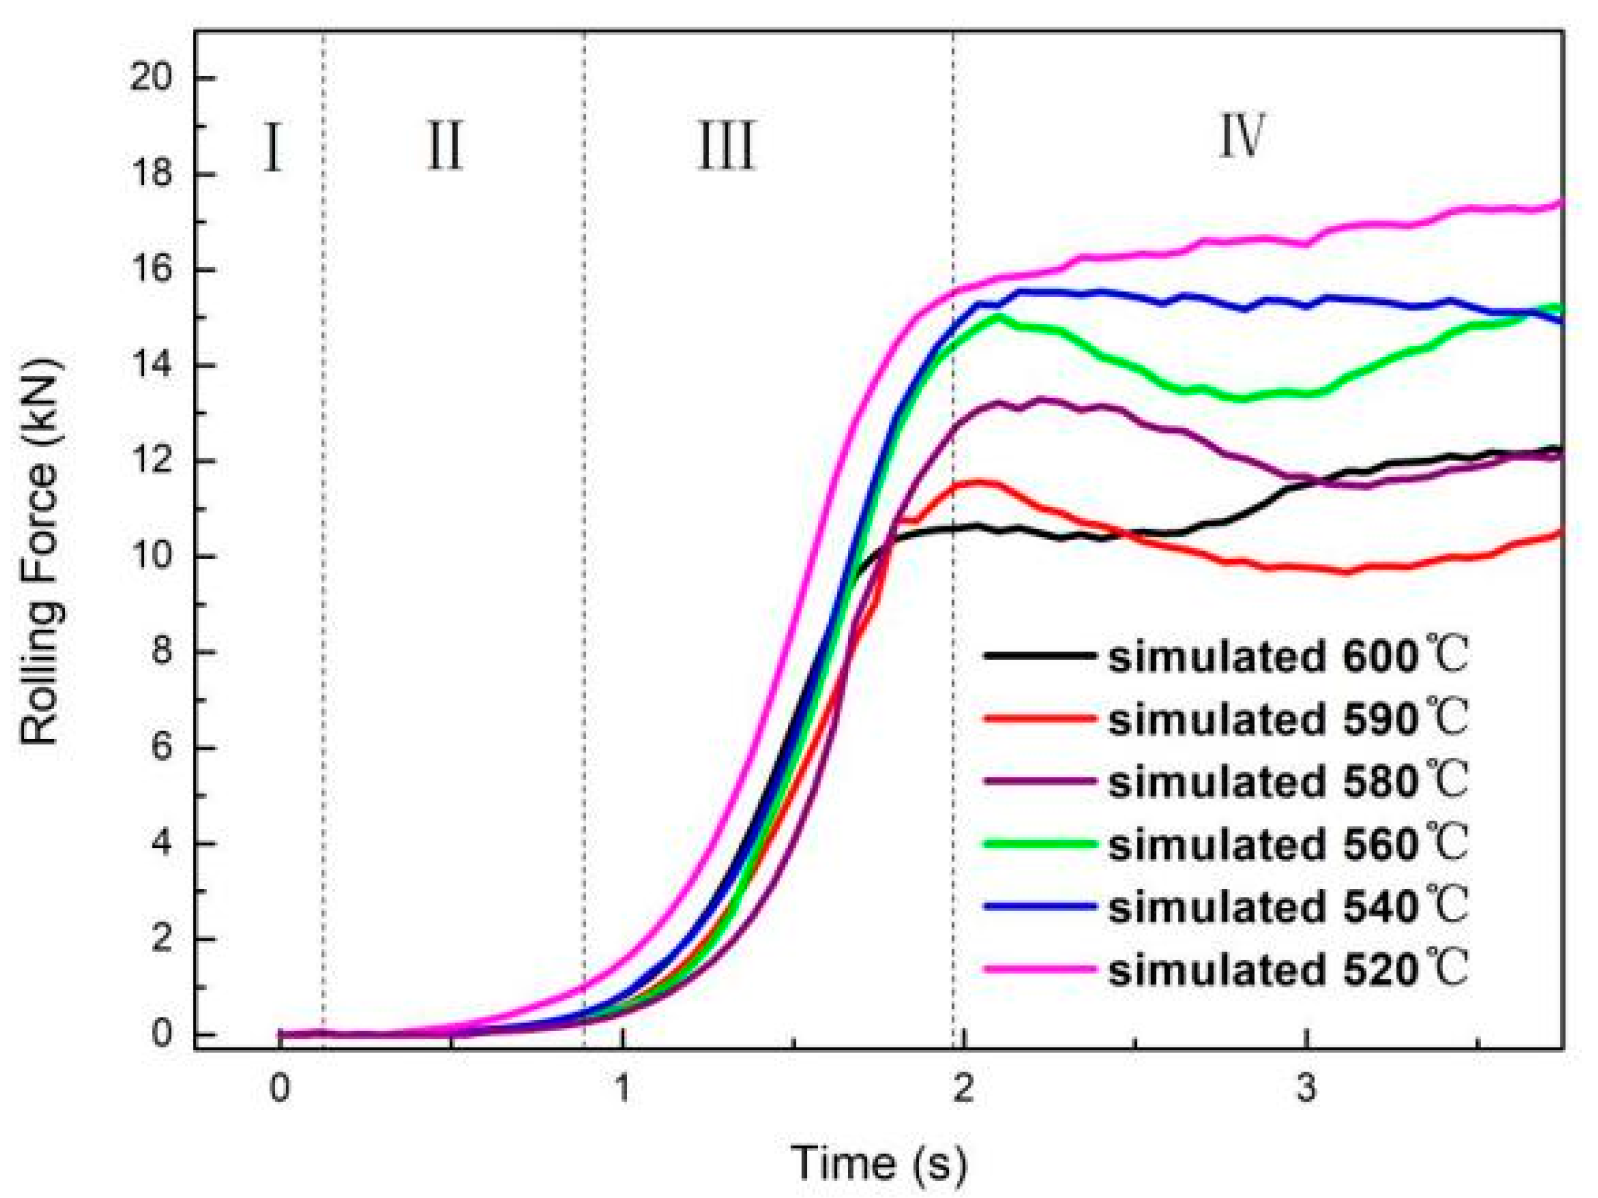
Figure 13.
Simulated and experimental comparison of the maximum rolling forces at different powder temperatures.
Figure 13.
Simulated and experimental comparison of the maximum rolling forces at different powder temperatures.
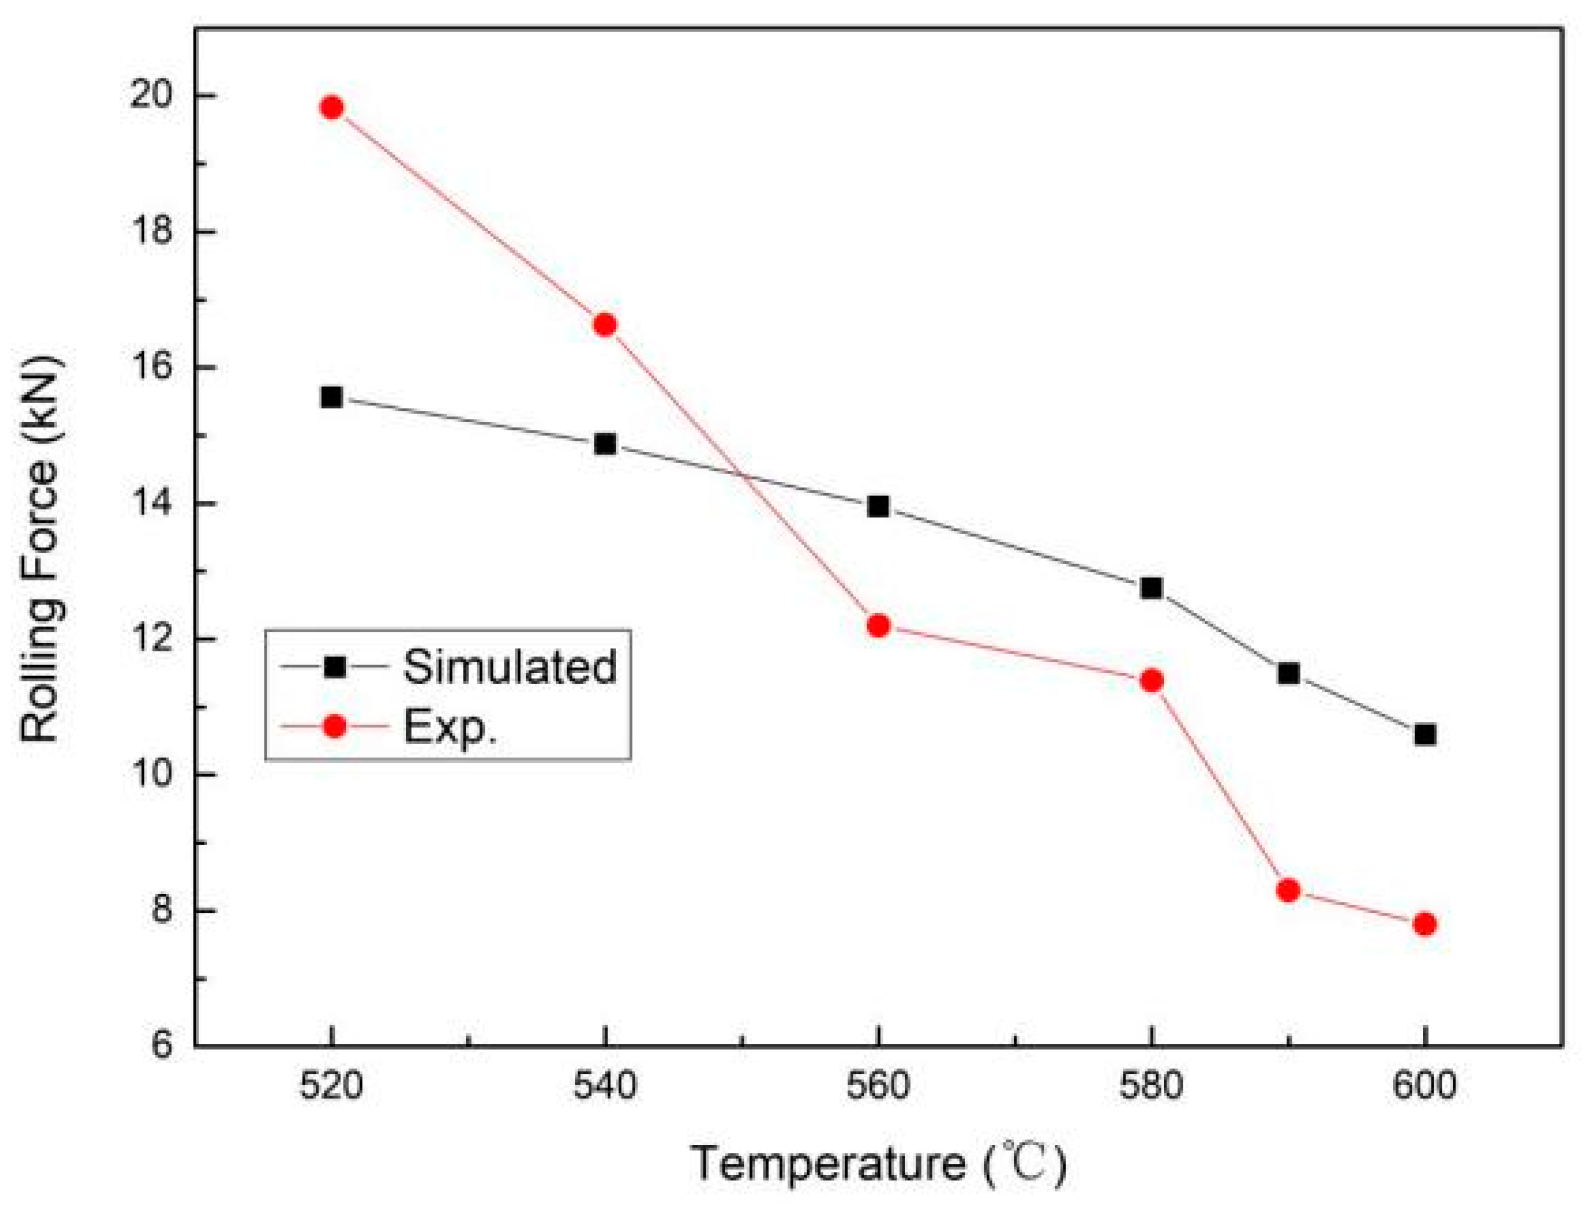
Figure 14.
The relative density vs. arc length curve of strips calculated and measured at different powder temperatures (at increment step 57).
Figure 14.
The relative density vs. arc length curve of strips calculated and measured at different powder temperatures (at increment step 57).


Table 1.
Chemical composition of AA2024 powders (wt %).
| Cu | Mg | Mn | Fe | Si | Zn | Ti | Cr | Al |
|---|---|---|---|---|---|---|---|---|
| 4.09 | 1.8 | 0.54 | 0.21 | 0.12 | 0.06 | 0.02 | 0.10 | Bal |
Table 2.
Rolling parameters used in the SSPR simulation.
| Rolling Parameter (86CrMoV7) | Material Parameters (2024 Al) | ||
|---|---|---|---|
| Supply thickness (mm) | 5 | Powder temperature (°C) | 600 |
| Roller size (mm) | Φ150 × 100 | ||
| Deformation thickness (mm) | 3.75 | Density (g/cm3) | 2.77746 |
| Rolling speed (rad/s) | 0.1 | Initial relative density | 0.4 |
| Roller temperature (°C) | 300 | Heat dissipation coefficient between rollers and the billet (W/m2 K) | 2700 |
| Friction factor | 0.26 [10] | ||
Disclaimer/Publisher’s Note: The statements, opinions and data contained in all publications are solely those of the individual author(s) and contributor(s) and not of MDPI and/or the editor(s). MDPI and/or the editor(s) disclaim responsibility for any injury to people or property resulting from any ideas, methods, instructions or products referred to in the content. |
© 2023 by the authors. Licensee MDPI, Basel, Switzerland. This article is an open access article distributed under the terms and conditions of the Creative Commons Attribution (CC BY) license (https://creativecommons.org/licenses/by/4.0/).
Share and Cite
MDPI and ACS Style
Wu, M.; Cai, R.; Wang, Y.; Luo, X.; Yu, J.; Zeng, X. The Effect of Powder Temperature on Semi-Solid Powder Rolling AA2024 Based on Experiments and Numerical Simulation. Metals 2023, 13, 1919. https://doi.org/10.3390/met13121919
AMA Style
Wu M, Cai R, Wang Y, Luo X, Yu J, Zeng X. The Effect of Powder Temperature on Semi-Solid Powder Rolling AA2024 Based on Experiments and Numerical Simulation. Metals. 2023; 13(12):1919. https://doi.org/10.3390/met13121919
Chicago/Turabian StyleWu, Min, Renye Cai, Yankun Wang, Xia Luo, Junjie Yu, and Xiangkun Zeng. 2023. "The Effect of Powder Temperature on Semi-Solid Powder Rolling AA2024 Based on Experiments and Numerical Simulation" Metals 13, no. 12: 1919. https://doi.org/10.3390/met13121919
Note that from the first issue of 2016, this journal uses article numbers instead of page numbers. See further details here.