Prediction of Fatigue Crack Growth in Metallic Specimens under Constant Amplitude Loading Using Virtual Crack Closure and Forman Model


.JPG)
Department of Engineering Mechanics, Faculty of Engineering, University of Rijeka, Vukovarska 58, 51000 Rijeka, Croatia
*
Author to whom correspondence should be addressed.
Metals 2020, 10(7), 977; https://doi.org/10.3390/met10070977
Submission received: 5 June 2020
/
Revised: 6 July 2020
/
Accepted: 19 July 2020
/
Published: 20 July 2020
Abstract
:This paper considers the applicability of virtual crack closure technique (VCCT) for calculation of stress intensity factor range for crack propagation in standard metal specimen geometries with sharp through thickness cracks. To determine crack propagation rate and fatigue lifetime of a dynamically loaded metallic specimen, in addition to VCCT, standard Forman model was used. Values of stress intensity factor (SIF) ranges ΔK for various crack lengths were calculated by VCCT and used in conjunction with material parameters available from several research papers. VCCT was chosen as a method of choice for the calculation of stress intensity factor of a crack as it is simple and relatively straightforward to implement. It is relatively easy for implementation on top of any finite element (FE) code and it does not require the use of any special finite elements. It is usually utilized for fracture analysis of brittle materials when plastic dissipation is negligible, i.e., plastic dissipation belongs to small-scale yielding due to low load on a structural element. Obtained results showed that the application of VCCT yields good results. Results for crack propagation rate and total lifetime for three test cases were compared to available experimental data and showed satisfactory correlation.
1. Introduction
One of the main tasks of advanced structural analysis is the consideration of the crack occurrence in structure [1], as well as structure lifetime estimation due to fatigue. Fatigue life in general consists of two phases: crack initiation period and crack growth period [2,3]. Related to that fact, estimation of the ability of the mentioned structures to resist growth of these cracks is of utmost importance for estimating the remaining life of the structure in its entirety. Some of the parameters that are commonly used to characterize and analyze the behavior of a structure containing a crack are energy release rate G, stress intensity factor K (SIF), Crack Tip Opening Displacement (COTD), and J – integral [4,5,6]. To predict the value of the mentioned crack parameters, analytical or numerical methods can be used.
One of the most common numerical method used to analyze complex structures is finite element analysis (FEA) [7,8]. In conjunction with additional calculations, it can be used to determine SIF for a crack and predict a lifetime of a structure in which that crack is contained. To predict the growth of an already existing crack in a structure, many different approaches can be used [2], including adaptive and moving mesh approaches [9,10,11,12]. The decision on which approach and fracture parameter will be used is dependent on a multitude of factors related to the material and geometry of a structure. One of the first constant amplitude loading crack propagation models that used SIF range to model crack growth was a model proposed by Paris, Gomez, and Anderson [13]. It is a simple model that has only two material parameters that are easily obtained by fitting the model to the available material data. The biggest shortcoming of that model was that it does not model the threshold region of crack growth or accelerated crack growth in the region where SIF range approaches values of critical stress intensity range Kc. On top of that, it does not take into account the effects of stress ratio, so particular model parameters are required for a stress ratio of interest for a particular problem. These shortcomings of the Paris model are more or less accounted for by various proposed models that take into account some or all of these effects [2,4,14].
In this paper, crack propagation in metallic specimens containing sharp through thickness crack was analyzed using material parameters available in the literature, SIF range and Forman model in conjunction with the Barsom equation for crack propagation threshold [15]. SIF range for a dynamically loaded cracked element was calculated from results obtained from FEA in conjunction with the virtual crack closure technique (VCCT) [16,17]. VCCT was chosen since it can be easily implemented on top of any basic finite element (FE) code as it is a relatively simple FE post-processing method that does not require any special finite element types to determine the value of stress intensity factor at the crack tip. It is easy to implement in a wide range of basic 2D and 3D FE codes that use ordinary finite element types and linear-elastic analysis. Most frequently, it is used for fracture analysis of brittle materials that do not exhibit significant plasticity, i.e., for delamination of laminated composites. The groundwork for VCCT was first presented in the works of Hellen [18] and Parks [19], while the first application on finite element method (FEM) was done by Rybicki and Kanninen [17] and Rybicki et al. [20]. More recent books and research papers that cover VCCT theory and applications were published by many authors, including, but not limited to, Kuna [21], Krueger [16], Leski [22], Bonhomme et al. [23], Tavares et al. [24], etc.
The outline of this paper is as follows. Section 2 presents and overview of theoretical background used in the numerical algorithm presented in this paper, as well as some available analytical solutions for stress intensity factors, used for comparison and validation of VCCT results. Section 3 presents computer algorithm of the used numerical procedure in more detail. In Section 4, details on test cases used for validation are presented. Finally, in Section 5, results obtained from numerical algorithm are presented and compared to experimental data available from other published articles.
2. Theoretical Background
2.1. Crack Propagation Model
In real structures, fatigue crack growth in most cases occurs with variable amplitude time dependable loading. It is already well established that during these loadings various loading sequence effects can occur and significantly change the crack growth process. For example, crack tip plasticity during high load cycles in metals that exhibit significant plastic behavior can cause crack retardation effect, i.e., decreased crack propagation rate. This has an effect of the prolonged life of the structure made of such material [14,15]. Nevertheless, since it has been determined that sequence effects can often cancel each other out, and are often completely unpredictable, simple constant amplitude crack growth models can be used [2]. These simple models based on constant amplitude loading can be used to obtain results of sequences of constant amplitude loadings, representing real load sequence and neglecting mentioned sequence effects. The advantage is that this approach is relatively simple and gives a conservative estimate of life of a cracked structure.
The simplest, most widely used model is the Paris model. Since, as mentioned earlier, Paris model does not take into account many effects, a little more complex model can be used if enough material and load data are available. So, for the purpose of the numerical procedure presented in this paper, Forman model [2] will be used:
When material constants for crack growth, CF and mF, and critical stress intensity Kc are known, the Forman model can model the effect of load asymmetry and the effect of accelerated crack growth as the SIF range approaches the critical value of SIF range. In order to model the behavior of plates of various thicknesses and link them to more universal material property, critical stress intensity value was linked to plane–strain fracture toughness KIc. Irwin presented a model to connect these two values [4]:
and this model is used in a numerical procedure presented in this paper. This requires additional material property, yield stress σy, to be known. Since it is always available for metals, this does not limit the applicability of the presented numerical procedure. To more accurately account for stopping of crack growth when SIF range approaches threshold value ΔKth, the threshold value of SIF range was modeled in such a way to account for load asymmetry with the use of stress ratio R, using Barsom Equation [15]:
This requires threshold value of SIF for pulse loading ΔKth0 to be known. In case when ΔKth0 is not available, for stress ratio R ≥ 0.1 the threshold value can be computed using expression [25]:
2.2. Virtual Crack Closure Formulation for 4 and 8-Node Two-dimensional (2D) FEA
In numerical procedure presented in this paper, virtual crack closure technique (VCCT) was used to calculate SIF range based on FEA results for the models of the particular specimen containing sharp through thickness crack.
In the available literature, VCCT is also referred to as modified or virtual crack closure method. VCCT is derived from the crack closure method or two-step crack closure method that is based on Irwin’s crack closure integral [16]. It assumes that crack extension from a + Δa to a + 2Δa does not alter the state at the crack tip in a significant manner. Therefore, the displacements behind the crack tip at node B are approximately equal to the displacements behind the crack tip at node A when cracks tips are located at nodes C and B, respectively (Figure 1a). In comparison to two-step crack closure method, which requires two finite element analyses, VCCT is faster to compute, i.e., more computationally efficient. The assumption from the VCCT enables us to calculate the work required to close the crack from one single FE analysis [16] and strain energy release rate G can be calculated by dividing the work with the created crack surface.
When 4-node two-dimensional (2D) elements are used to model a crack, strain energy release rate can be calculated by dividing the work required to close the crack ΔW with the newly created crack surface:
where t is element thickness, ∆a is the length of the elements at the crack front, FxB and FyB are shear and opening forces at crack tip node B, and ∆uA and ∆vA are shear and opening displacements at a crack surface node A.
In the expression (4), we can distinguish two parts of energy release rate. One is a result of mode I crack opening, and other is a result of mode II crack opening (in-plane shear mode), so we can write:
where GI and GII are energy release rates for the corresponding crack opening modes.
In the case we model a crack with 8-node 2D elements (Figure 1b), the strain energy release rates for the corresponding crack opening modes can be calculated as:
It has to be noted that, if VCCT is used for the simulation of crack propagation, a kinematically compatible node releasing scheme has to be used in order to obtain reliable results of strain energy release rate. If 8-node 2D elements are used, elementwise node release scheme has to be used, i.e., edge and midside nodes have to be released simultaneously [16,26].
For test cases in this paper, the calculation of SIF was necessary only for mode I crack opening, so only the calculation for the value of GI was used. In the case only small-scale yielding is present at the crack tip, SIF can be calculated from the value of known strain energy release rate GI [4] as:
where KI is the value of SIF for mode I crack opening. Value denoted E* is different for the case of plane-stress or plane-strain condition. In the case of plane-stress condition, it is equal to elasticity modulus E, where in the case of plane-strain condition it can be calculated as
where ν represents Poisson’s ratio.
If we calculate SIF only for mode I (opening mode), which is the main crack opening mode in examples used in this article, the following equations can be derived:
For the evaluation of the size of elements needed for the FE mesh on the crack path, known analytical solutions for SIF of the middle tension (M(T)) specimen, given by Irwin and Fedderson [14], are used:
where normal stress σ is calculated as:
where F represents specimen load, and t and w represent specimen thickness and specimen width, respectively.
3. Computer Algorithm
The numerical procedure presented in this paper was programmed in MATLAB and implemented in computer program VC-CGrow. As input data for this program, it is required to have available certain material data mentioned earlier, and results of crack surface displacements and crack tip forces acquired from FEA model. Based on this data, the program calculates SIF and crack propagation rate for a given load and given crack length. Since the program is based on VCCT and finite steps of crack propagation, SIF between crack length a and a + Δa is linearly interpolated to give a more accurate value of SIF for the current crack length. Crack propagation rate and crack propagation threshold are calculated using Equation (1) and Equation (4), respectively. End of crack propagation and finite life (cycles at failure) are determined by achieving critical SIF value. It has to be noted that the implemented procedure does not include the effects of crack tip plasticity, crack closure effects or effects of overload. Those effects will be studied in future research and implemented in further development of numerical procedure presented in this article. A more detailed representation of the numerical procedure currently implemented in program VC-CGrow can be seen in Figure 2, Figure 3 and Figure 4.
4. Test Cases and FEA Details
Considering the fact that the experimental data for crack propagation for standard test specimens was available in various published articles, standard test specimens were selected for the validation of the presented numerical procedure. These specimens also have known SIF solutions and, as such, were suitable for the validation of SIF calculated by VCCT in this procedure. Therefore, the numerical procedure presented in this paper was tested on three different test cases of standard metal specimens containing sharp through-thickness cracks, subjected to constant amplitude loading. The first test case refers to the single edge cracked plate made of aluminum alloy 2024-T3 (test case 1) [27]. Second test case was middle tension specimen (M(T)), [28], made of martensitic structural steel 18G2A (Steel 1.0562, S355) [29] and third was compact tension specimen (C(T)), [28], made of welded pressure vessel steel A516 Grade 70 (Steel 1.0473, P355GH) with 45% overmatch weld [30]. All data regarding materials used in the preparation of test cases are presented in Table 1.
Forman constants are either taken from appropriate articles or, if they were not available, obtained by fitting curves to available experimental data or Paris models. It should be noted that material fracture properties used in test case 3 were for weld material and not for the base metal. These values are denoted with ** in Table 1. In addition, since values of plane-strain fracture toughness were not available for steels used in this paper, values were estimated based on Charpy impact energy (CVN) for a given material using Roberts–Newton formula [4,31]:
and are denoted with * in Table 1. Specimen dimensions can be seen in Figure 5 and Figure 6. Basic geometry data and loads of test specimens for particular test cases are shown in Table 2.
KIC = 8.47 · (CVN)0.63
FEA was used to get the required data for various crack sizes, i.e., nodal forces and displacements needed for VCCT post-processing. Aluminum alloy specimens were modeled as a quarter model and steel specimens as a half model to alleviate some of the computational load. For the use of VCCT, crack front for all test cases was meshed with sufficiently small 8-noded 2D finite elements. Based on tests of VCCT calculated SIF accuracy in regard to FE size on the crack front, the size of 2 mm × 2 mm was chosen as a sufficiently small element size that gives reasonably accurate SIF results. A comparison of VCCT solutions for SIFs with various element sizes at the crack front and known analytical solutions can be seen in Figure 7. Elements smaller than 2 mm × 2 mm were unnecessary as they should not significantly contribute to the accuracy of calculated SIFs, only resulting in waste of available computer resources. Final FE meshes used in crack propagation tests are shown in Figure 8. In the end, results obtained from the numerical procedure integrated into the program VC-CGrow were compared with experimental data available in the literature [27,29,30].
5. Results
For test cases 1 and 2, calculated crack propagation rate was evaluated in comparison to experimental data available from the works of Mohanty, Verma, and Ray [27] and Skorupa and Skorupa [29]. For test case 1, it was found that there is a very good correlation with experimental data for load asymmetry ratio value of R = 0.1 (Figure 9). For test case 2, calculated crack propagation rate was compared to experimental data and was found to be very accurate for load asymmetry ratio of R = 0.15. From Figure 10, it can be seen that calculated values for crack propagation rate for load asymmetry ratio R = 0.5 were somewhat overestimated in comparison to experimental data available from Skorupa and Skorupa [29].
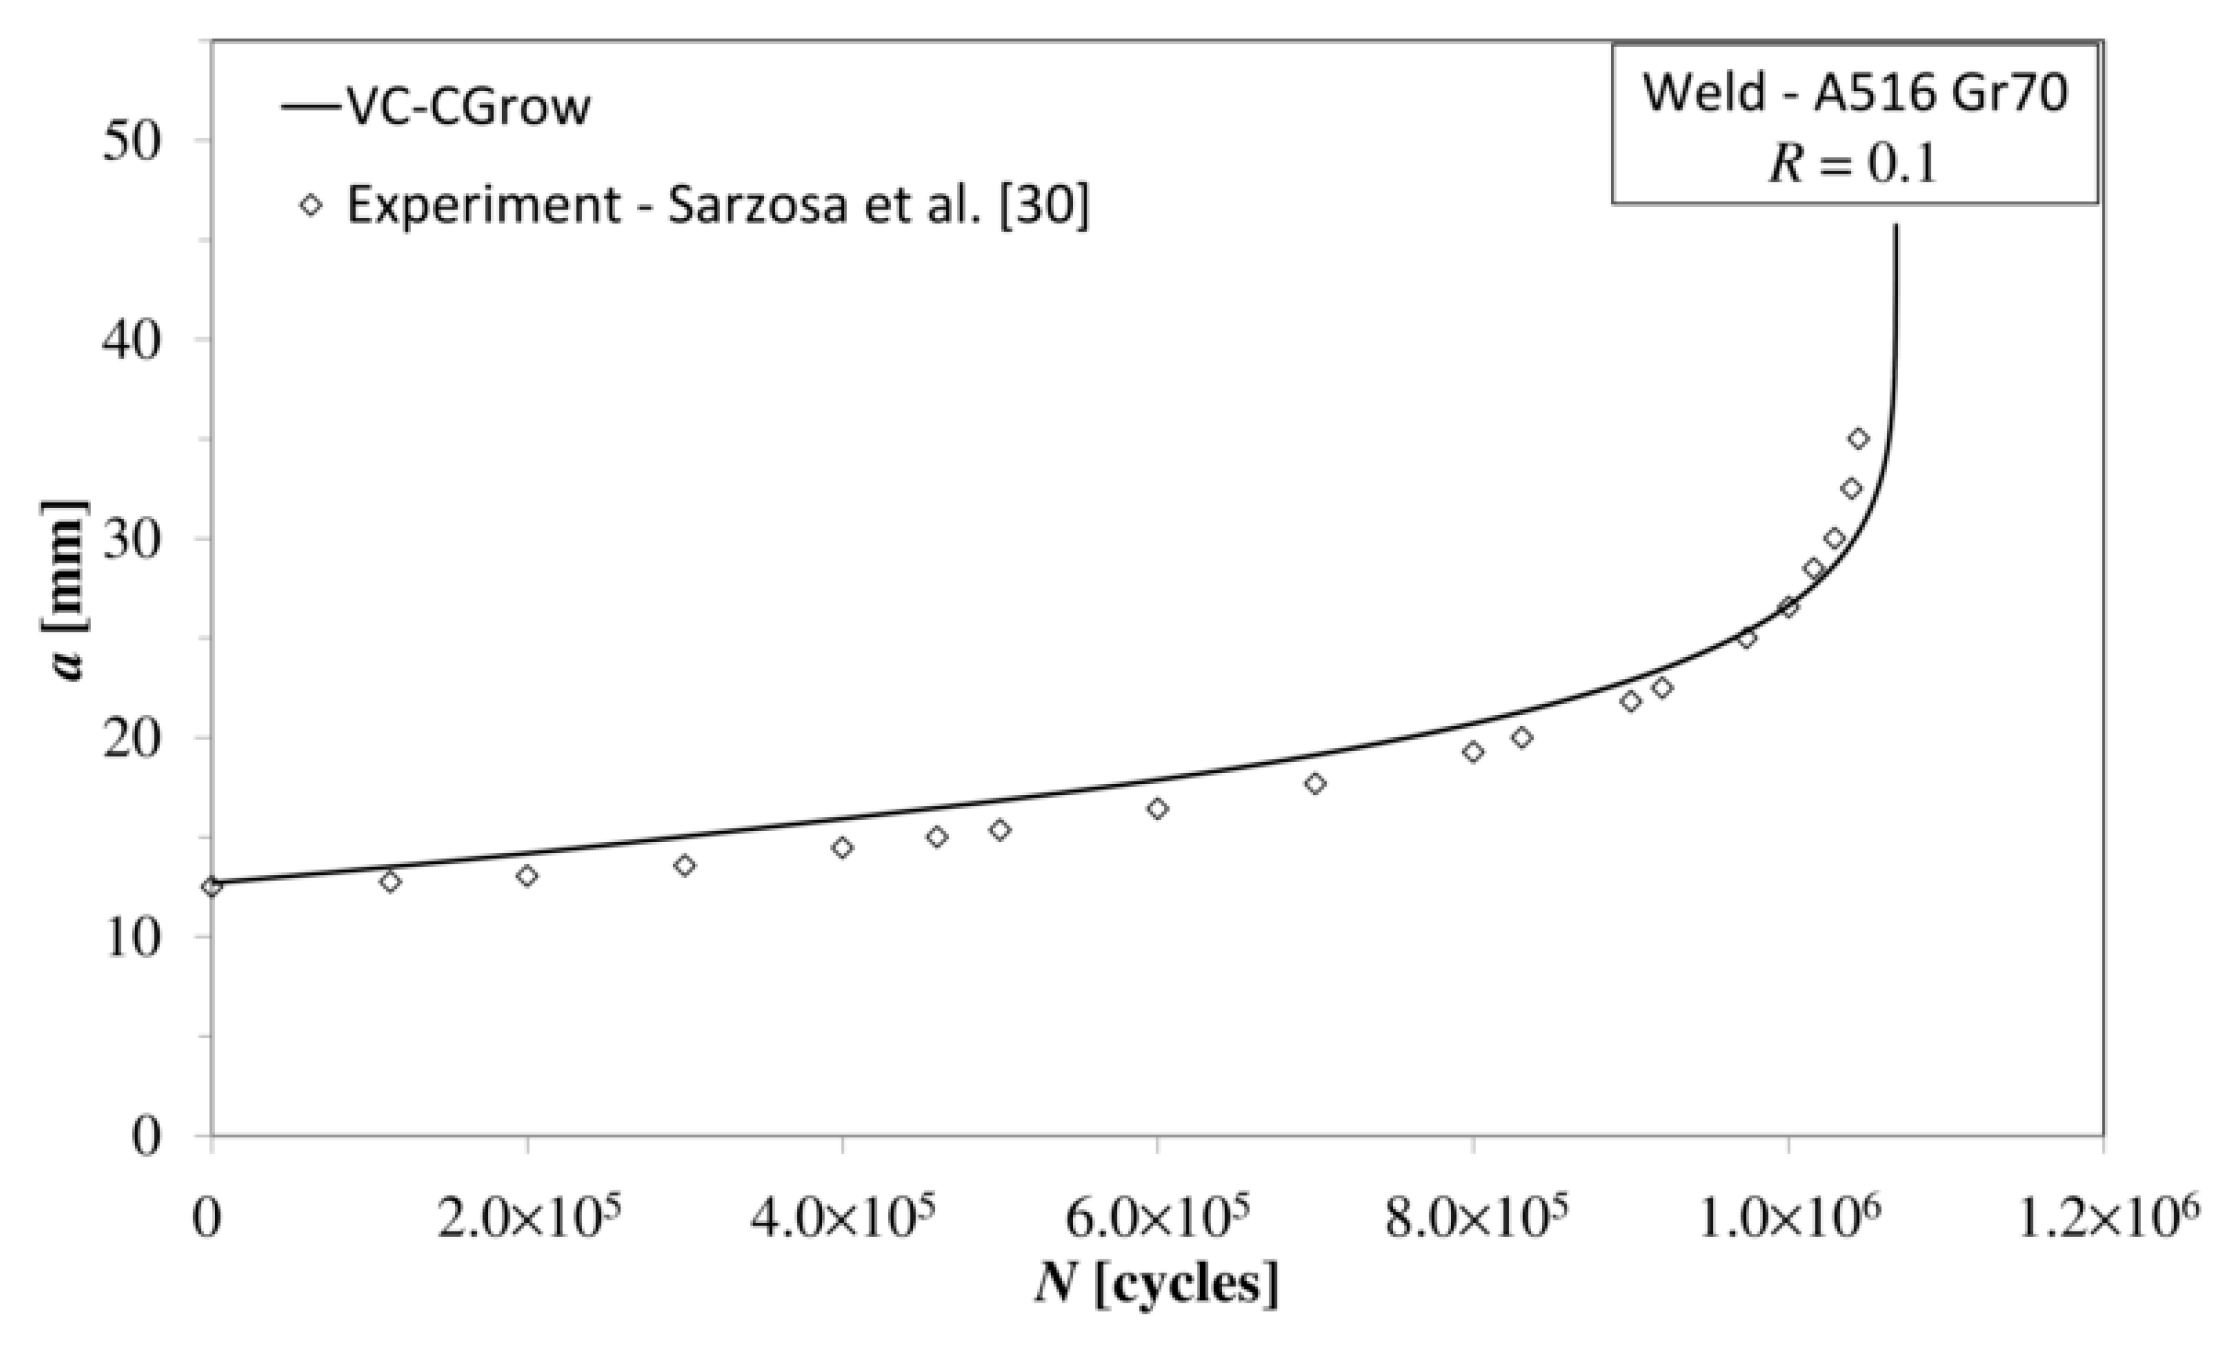
Results for crack size versus the number of cycles, obtained with the presented numerical procedure, were compared to experimental data available in the before mentioned articles, for load asymmetry ratios given in Table 2. Results can be seen in Figure 11 and Figure 12. Good correlation of crack growth curve with available experimental data was determined for both test cases. For test case 3, data for crack size vs. the number of cycles, calculated with numerical procedure implemented in program VC-CGrow, was compared to experimental data available from the article by Sarzosa et al. [30]. Good correlation with experimental data can also be seen in this case (Figure 13).
Predicted lifetime of structural elements was compared to available data where possible. Experimental data for number of cycles to failure was available in the above-mentioned articles for test cases 1 and 3. Accuracy in comparison to data available from experiments was found to be 2.3% or less. Predicted number of cycles to failure for all test cases, as well as available experimental data, can be seen in Table 3.
6. Discussion
In this paper, the numerical procedure for calculating crack propagation was presented and results obtained with the use of the presented procedure was analyzed. The numerical procedure relies on FEA and VCCT method for the calculation of SIF range, and on available material data for the calculation of crack growth rate. Test cases included side cracked plate made from aluminum alloy, M(T) specimen made from 18G2A steel and a C(T) specimen made from A516 Grade70 welded steel, with crack progressing through weld material. These test cases were selected because of the availability of experimental data in published articles. Mentioned experimental data was used for the validation of the presented numerical procedure. Calculated crack propagation rate curves were compared to experimental data for two test cases, side cracked plate and M(T) specimen. In addition, crack propagation curves were validated against available experimental data for all test cases, and the calculated fatigue lifetime of cracked specimens was compared to experimental values for side cracked plate and C(T) specimen.
Two-dimensional VCCT was shown to provide reliable results for SIF range needed in the calculation of crack growth rate. Calculated results for crack propagation and structural lifetime were compared to experimental data available in three different articles. Linear interpolation between SIF results for two VCCT steps did not have any noticeable impact on the calculated fatigue lifetime of the structure. In addition, negative impact of linear interpolation between two values of SIF calculated by VCCT cannot be seen or identified on any of the calculated crack propagation curves, given that the calculated curves closely follow the experimental data. Calculated fatigue lifetime was in line with experimental results. Since numerical procedure did not include various effects, such as plastic zone size, crack retardation effects, etc., further attempts are needed to include these effects in the existing numerical procedure. This should enable us to assess the influence of the mentioned effects on the prediction of fatigue lifetime for cracked specimens using the numerical procedure presented in this article.
Author Contributions
Conceptualization, S.K. and J.B.; methodology, S.K.; software, S.K.; validation, S.K.; investigation, S.K.; writing—original draft preparation, S.K.; writing—review and editing, S.K. and J.B.; visualization, S.K.; supervision, J.B.; funding acquisition, J.B. All authors have read and agreed to the published version of the manuscript.
Funding
This research received no external funding.
Acknowledgments
This work has been financially supported by the University of Rijeka within the project: uniri-tehnic-18-42, “Investigation, analysis and modeling the behavior of structural elements stressed at room and high temperatures”.
Conflicts of Interest
The authors declare no conflict of interest. The funders had no role in the design of the study; in the collection, analyses, or interpretation of data; in the writing of the manuscript, or in the decision to publish the results.
Nomenclature
| a0 | initial crack size |
| ai | crack size for cycle i |
| a | crack size |
| a/w | relative crack size |
| CF, mF | material constants for Forman model |
| CVN | Charpy impact energy |
| da/dN | crack propagation rate |
| Δa | crack extension, length of the elements at the crack front |
| ΔK | stress intensity factor range for a load cycle |
| ΔKth0 | threshold stress intensity factor range for R = 0 |
| ΔKthR | threshold stress intensity factor range for specific load asymmetry ratio R |
| Δu | shear displacement at crack surface node |
| Δv | opening displacement at crack surface node |
| ΔW | work required to close the crack along one element side |
| E | elasticity modulus |
| F | specimen loading force |
| Fmin | minimum loading force in a cycle |
| Fmax | maximum loading force in a cycle |
| Fx | shear force at the crack tip |
| Fy | opening force at the crack tip |
| G | strain energy release rate |
| GI | strain energy release rate for crack opening mode I |
| GII | strain energy release rate for crack opening mode II |
| K | stress intensity factor |
| KI | stress intensity factor for crack opening mode I |
| KII | stress intensity factor for crack opening mode II |
| Kmin | minimum stress intensity factor in a load cycle |
| Kmax | maximum stress intensity factor in a load cycle |
| KIc | critical stress intensity factor for plane-strain conditions, fracture toughness |
| Kc | critical stress intensity factor |
| Nef | experimental results for cycles to failure |
| Npf | predicted cycles to failure |
| R | load asymmetry ratio |
| σ | normal stress |
| σUTS | ultimate tensile strength |
| σmin | minimum normal stress in a cycle |
| σmax | maximum normal stress in a cycle |
| σy, σ0.2 | yield stress |
| t | specimen and element thickness |
| u | x-coordinate of crack surface node after load |
| v | y-coordinate of crack surface node after load |
| w | specimen width |
| ν | Poisson ratio |
References
- Ina, J.; Vallentyne, M.; Hamandi, F.; Shugart, K.; Boin, M.; Laughlin, R.; Goswami, T. Failure Analysis of PHILOS Plate Construct Used for Pantalar Arthrodesis Paper I–Analysis of the Plate. Metals 2018, 8, 180. [Google Scholar] [CrossRef] [Green Version]
- Beden, S.M.; Abdullah, S.; Arrifin, A.K. Review of Fatigue Crack Propagation Models for Metallic Components. Eur. J. Sci. Res. 2009, 28, 364–397. [Google Scholar]
- Schijve, J. Fatigue of Structures and Materials, 2nd ed.; Springer Science + Bussines Media: Dordrecht, The Netherlands, 2009; pp. 14–32. [Google Scholar]
- Brnić, J. Engineering Structures and Material Behavior; John Wiley and Sons Ltd.: Hoboken, NJ, USA, 2018; pp. 239–309. [Google Scholar]
- Anderson, T.L. Fracture Mechanics: Fundamentals and Applications, 2nd ed.; CRC Press LLC: Boca Raton, FL, USA, 1995; pp. 29–255. [Google Scholar]
- Sudhakar, Y.; Wall, A.W. Mesh refitting approach: A simple method to model mixed-mode crack propagation in nonlinear elastic solids. Adv. Model Simul. Eng. Sci. 2017, 4, 2. [Google Scholar] [CrossRef]
- Vukelic, G.; Brnic, J. Predicted Fracture Behavior of Shaft Steels with Improved Corrosion Resistance. Metals 2016, 6, 40. [Google Scholar] [CrossRef] [Green Version]
- Hamandi, F.; Laughlin, R.; Goswami, T. Failure Analysis of PHILOS Plate Construct Used for Pantalar Arthrodesis Paper II—Screws and FEM Simulations. Metals 2018, 8, 279. [Google Scholar] [CrossRef] [Green Version]
- Fabbrocino, F.; Funari, F.M.; Greco, F.; Lonetti, P.; Luciano, R. Numerical modeling based on moving mesh method to simulate fast crack propagation. Fra. Int. Strut. 2019, 14, 410–422. [Google Scholar] [CrossRef]
- Murotani, K.; Yagawa, G.; Choi, J.B. Adaptive finite elements using hierarchical mesh and its application to crack propagation analysis. Comput. Method Appl. M 2013, 253, 1–14. [Google Scholar] [CrossRef]
- Funari, M.F.; Lonetti, P.; Spadea, S. A crack growth strategy based on moving mesh method and fracture mechanics. Theor. Appl. Fract. Mec. 2019, 102, 103–115. [Google Scholar] [CrossRef]
- Fabbrocino, F.; Funari, F.M.; Greco, F.; Lonetti, P.; Luciano, R.; Penna, R. Dynamic crack growth based on moving mesh method. Compos. Part B-Eng. 2019, 174, 107053. [Google Scholar] [CrossRef]
- Paris, P.C.; Gomez, M.P.; Anderson, W.E. A rational Analytical Theory of Fatigue. Trend Eng. 1961, 13, 9–14. [Google Scholar]
- Stephens, R.I.; Fatemi, A.; Stephens, R.R.; Fuchs, H.O. Metal Fatigue in Engineering, 2nd ed.; John Wiley & Sons Inc.: New York, NY, USA, 2001; pp. 166–176. [Google Scholar]
- Farahmand, B. Fracture Mechanics of Metals, Composites, Welds, and Bolted Joints: Aplication of LEFM, EPFM, and FMDM Theory; Kluwer Academic Publishers: Norwell, MA, USA, 2001; pp. 137–155. [Google Scholar]
- Krueger, R. Virtual crack closure technique: History, approach and applications. Appl. Mech. Rev. 2004, 57, 109–143. [Google Scholar] [CrossRef]
- Rybicki, E.F.; Kanninen, M.F. A Finite Element Calculation of Stress Intensity Factors by a Modified Crack Closure Integral. Eng. Fract. Mech. 1977, 9, 931–938. [Google Scholar] [CrossRef]
- Hellen, T.K. On the Method of Virtual Crack Extension. Int. J. Numer. Method Eng. 1975, 9, 187–207. [Google Scholar] [CrossRef]
- Parks, D.M. Virtual Crack Extension: A General Finite Element Technique for J-integral Evaluation. In Proceedings of the First International Conference of Numerical Methods in Fracture Mechanics, Swansea, UK, 9–13 January 1978; Pineridge Press: Swansea, UK, 1978; pp. 464–479. [Google Scholar]
- Rybicki, E.F.; Schmueser, D.W.; Fox, J. An Energy Release Rate Approach for Stable Crack Growth in the Free-Edge Delamination Problem. J. Compo. Mater. 1977, 11, 470–487. [Google Scholar] [CrossRef]
- Kuna, M. Finite Elements in Fracture Mechanics: Theory–Numerics–Aplications; Springer Science + Bussines Media: Dordrecht, The Netherlands, 2013; pp. 227–240. [Google Scholar]
- Leski, A. Implementation of the Virtual Crack Closure Technique in Engineering FE Calculations. Finite Elem. Anal. Des. 2007, 43, 261–268. [Google Scholar] [CrossRef]
- Bonhomme, J.; Argüelles, A.; Viña, J.; Viña, I. Numerical and experimental validaton of computational models for mode I composite fracture failure. Comp. Mater. Sci. 2009, 45, 993–998. [Google Scholar] [CrossRef]
- Tavares, S.M.O.; Moreira, P.M.G.P.; Pastrama, S.D.; de Castro, P.M.S.T. Stress Intensity Factors by Numerical Evaluation in Cracked Structures. In Proceedings of the 11th Portuguese Conference on Fracture, Lisbon, Portugal, 13–15 February 2008. [Google Scholar]
- Dowling, L.E. Mechanical Behavior of Materials, 4th ed.; Pearson: Boston, MA, USA, 2013; pp. 542–619. [Google Scholar]
- Raju, I.S. Calculation of strain-energy release rates with higher order and singular order elements. Eng. Fract. Mech. 1987, 28, 251–278. [Google Scholar] [CrossRef]
- Mohanty, J.R.; Verma, B.B.; Ray, P.K. Prediction of fatigue crack growth and residual life using an exponential model: Part I (constant amplitude loading). Int. J. Fatigue 2009, 31, 418–424. [Google Scholar] [CrossRef]
- ASTM Standards. Annual Book of ASTM Standards, Metals-Mechanical Testing; Elevated and Low-Temperature Tests; Metallography, Vol. 03.01; ASTM International: Baltimore, MD, USA, 2018. [Google Scholar]
- Skorupa, M.; Skorupa, A. Experimental results and predictions on fatigue crack growth in structural steel. Int. J. Fatigue 2005, 27, 1016–1028. [Google Scholar] [CrossRef]
- Sarzosa, D.F.B.; Godefroid, L.B.; Ruggieri, C. Fatigue crack growth assessment in welded components including crack closure effects: Experiments and 3-D numerical modeling. Int. J. Fatigue 2013, 47, 279–291. [Google Scholar] [CrossRef] [Green Version]
- Brnic, J.; Krscanski, S.; Lanc, D.; Brcic, M.; Turkalj, G.; Canadija, M.; Niu, J. Analysis of the mechanical behavior, creep resistance and uniaxial fatigue strength of martensitic steel X46Cr13. Materials 2017, 10, 388. [Google Scholar] [CrossRef] [Green Version]
Figure 1.
Modified crack closure method for (a) 4-node; (b) 8-node two-dimensional (2D) finite element (FE) model.
Figure 1.
Modified crack closure method for (a) 4-node; (b) 8-node two-dimensional (2D) finite element (FE) model.
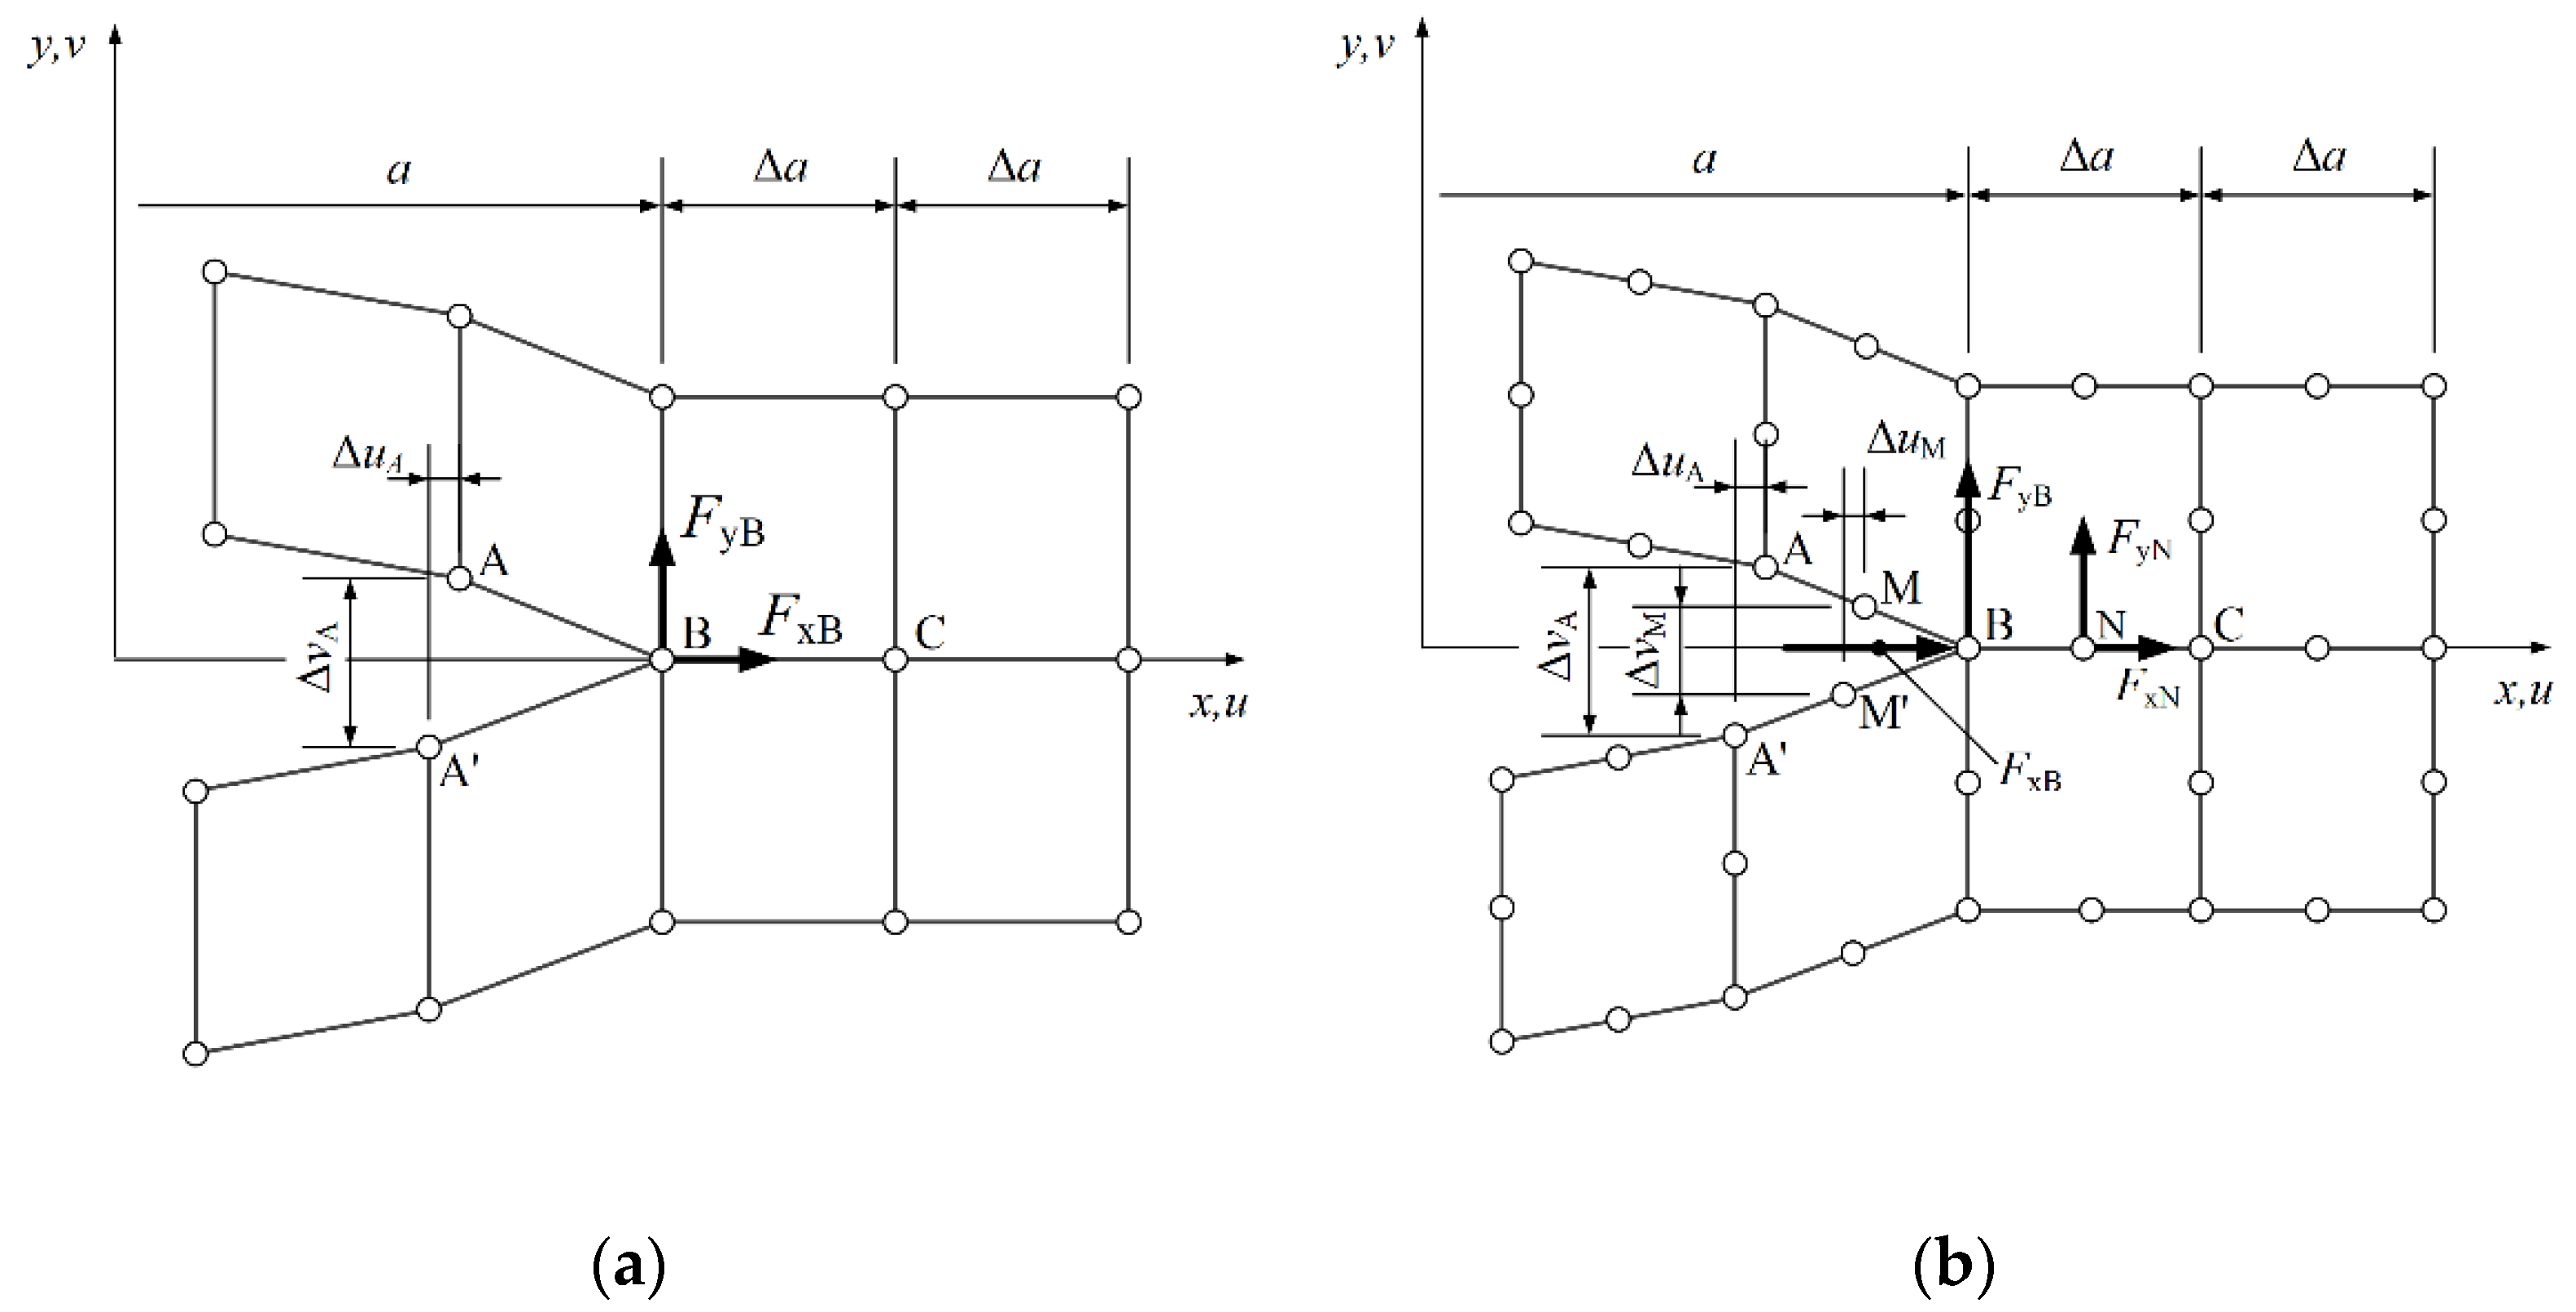
Figure 2.
Main block diagram of the program VC-CGrow.
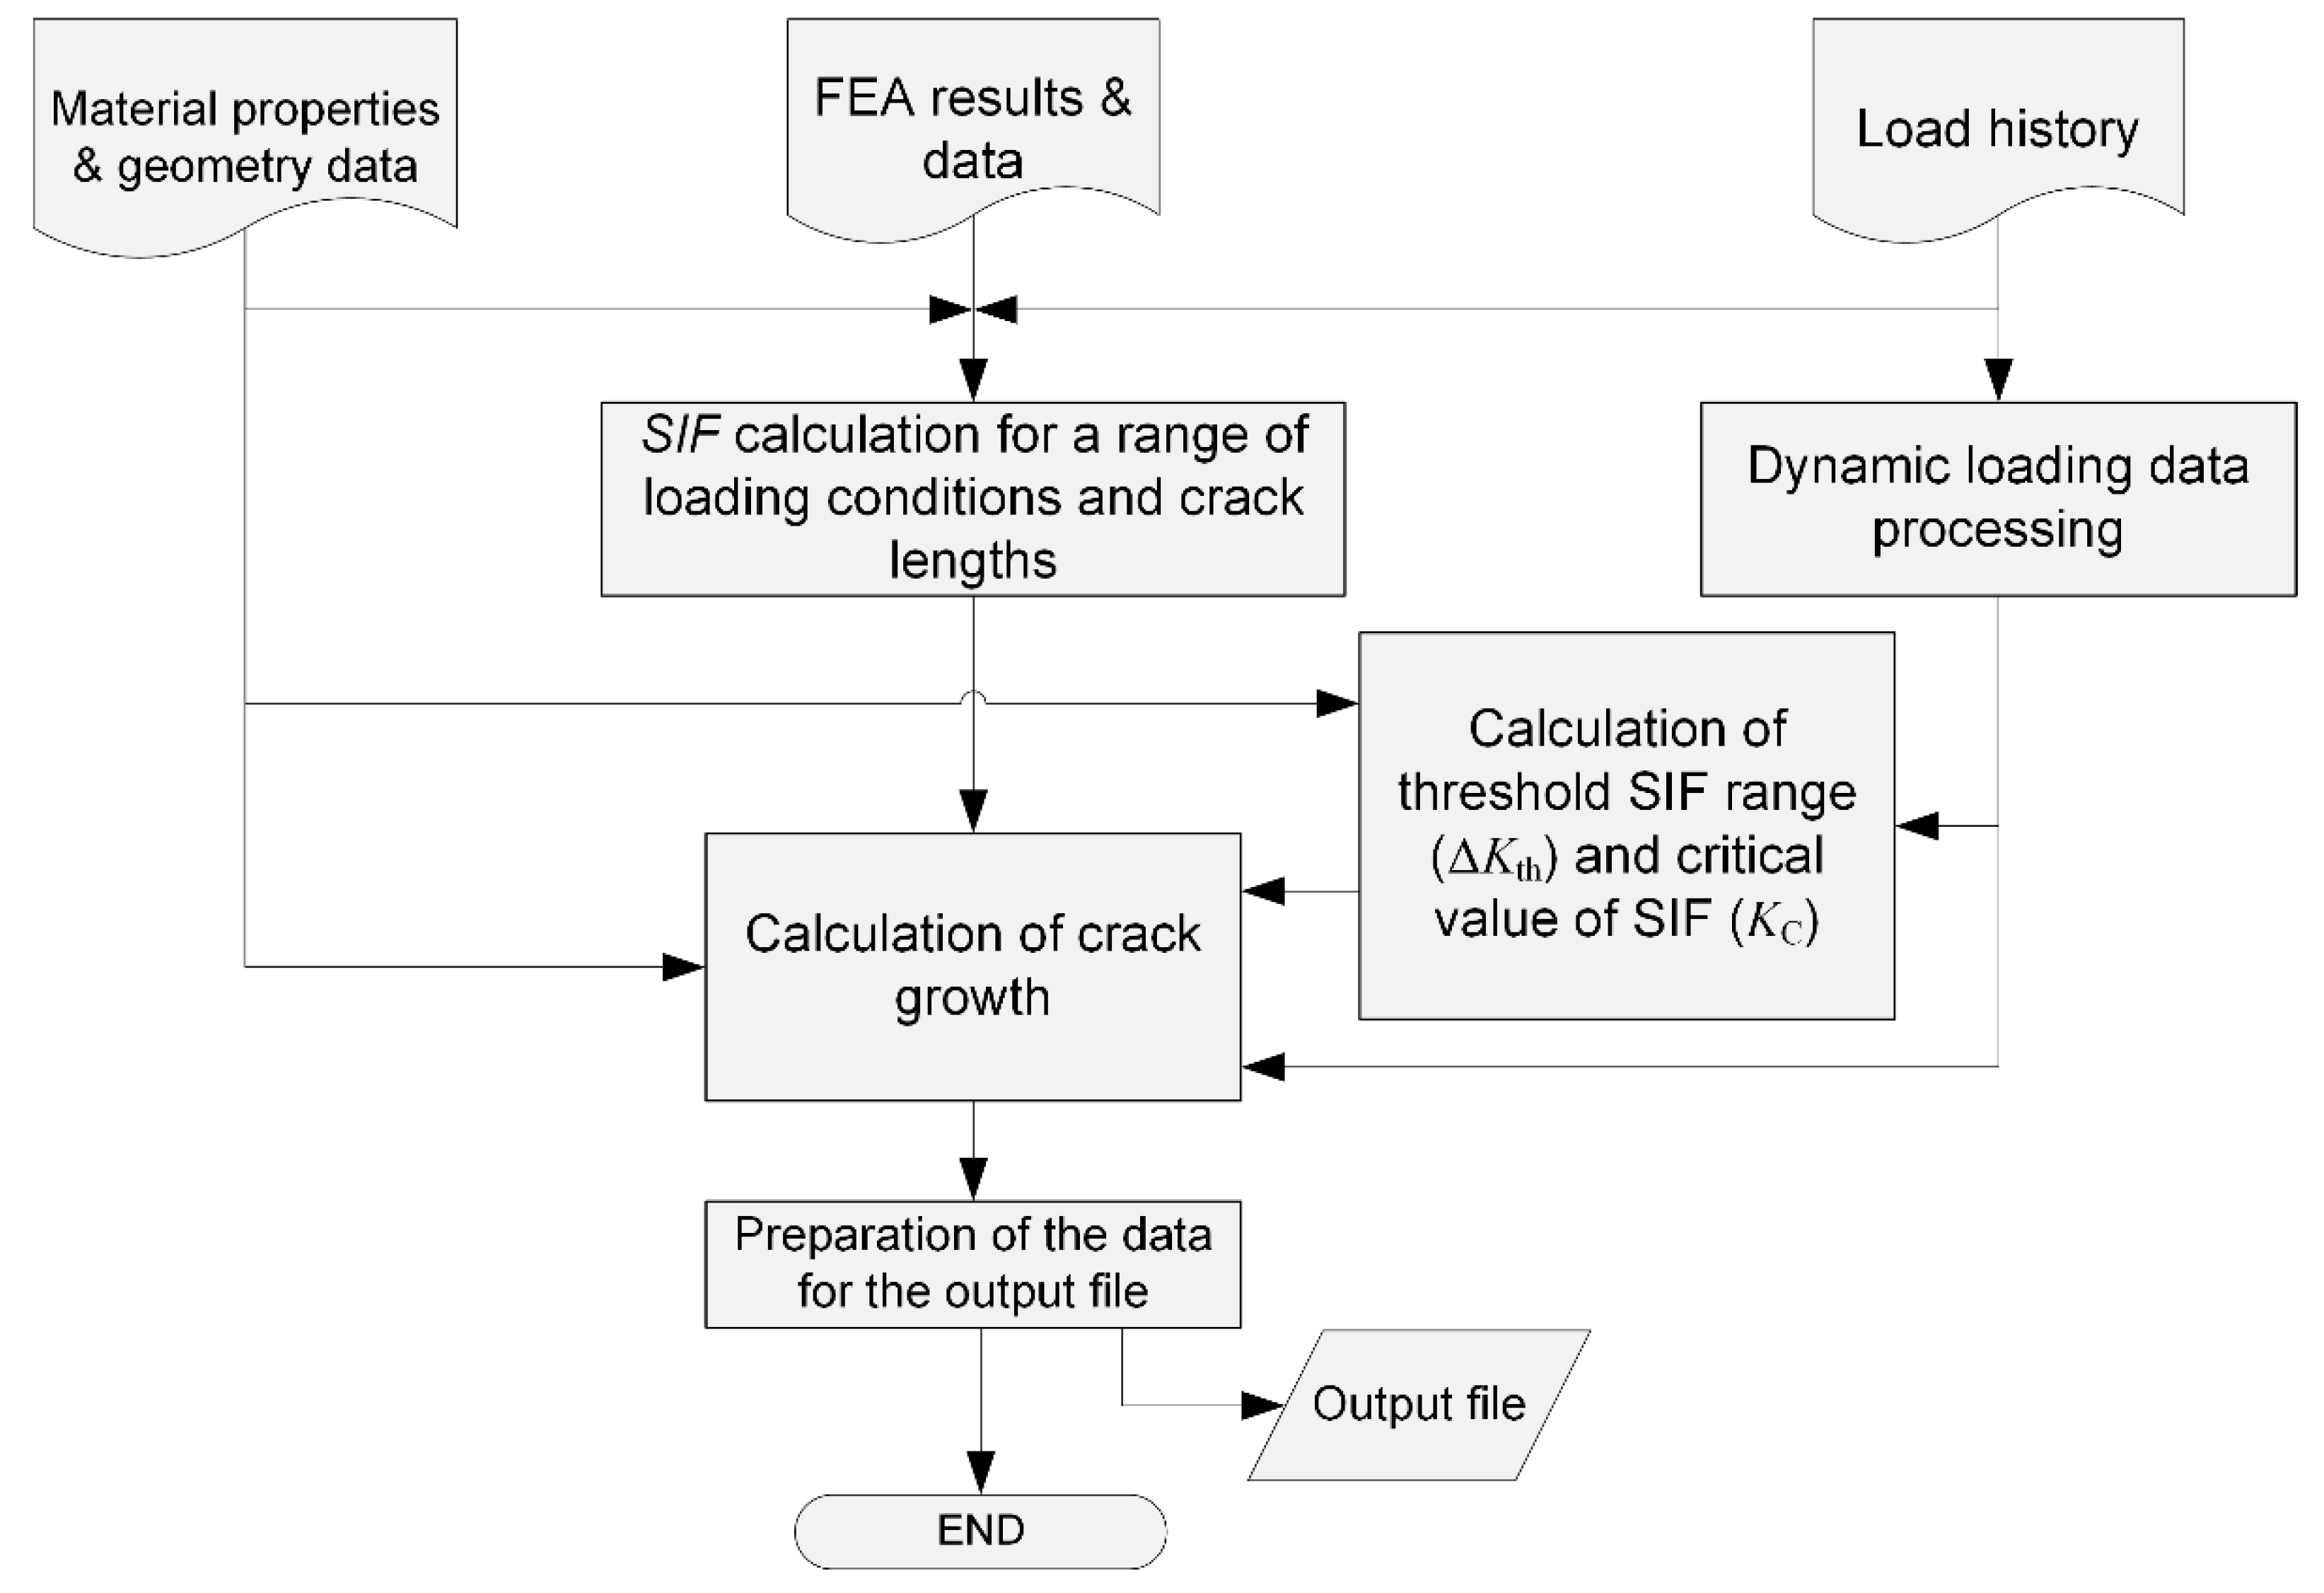
Figure 3.
Subroutine for the calculation of stress intensity factor (SIF) using virtual crack closure technique (VCCT).
Figure 3.
Subroutine for the calculation of stress intensity factor (SIF) using virtual crack closure technique (VCCT).
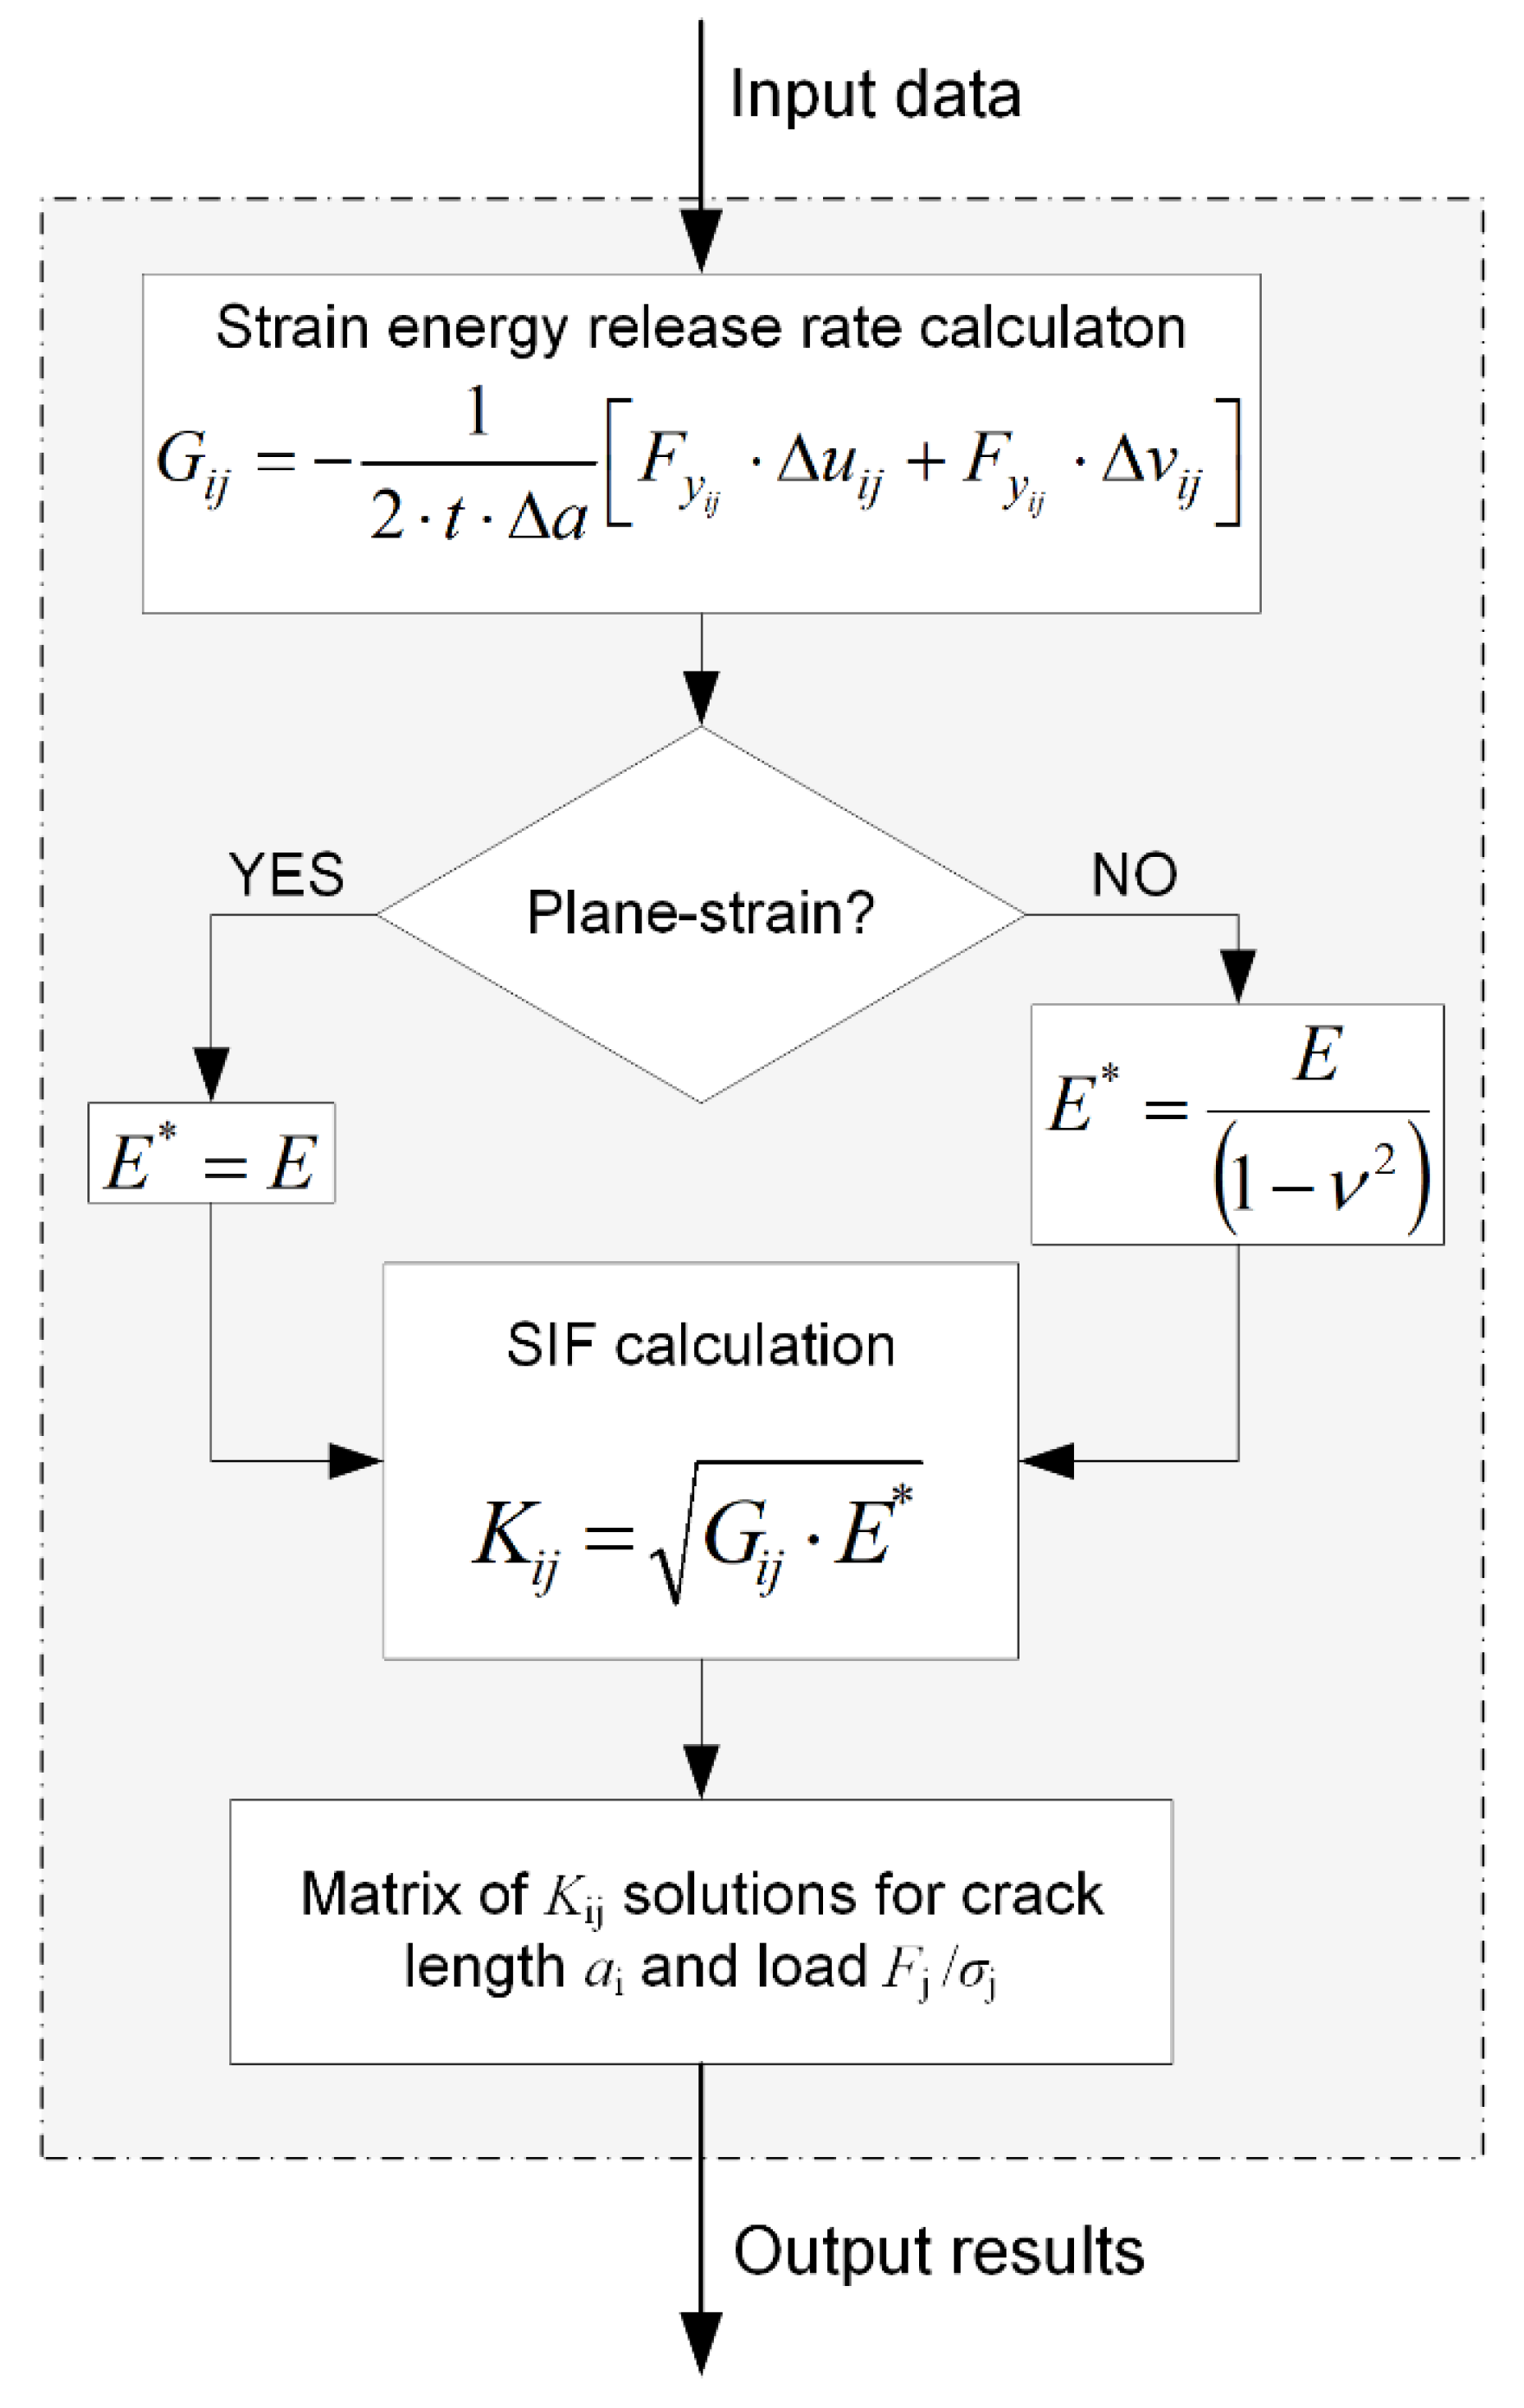
Figure 4.
Subroutine for the calculation of crack growth.
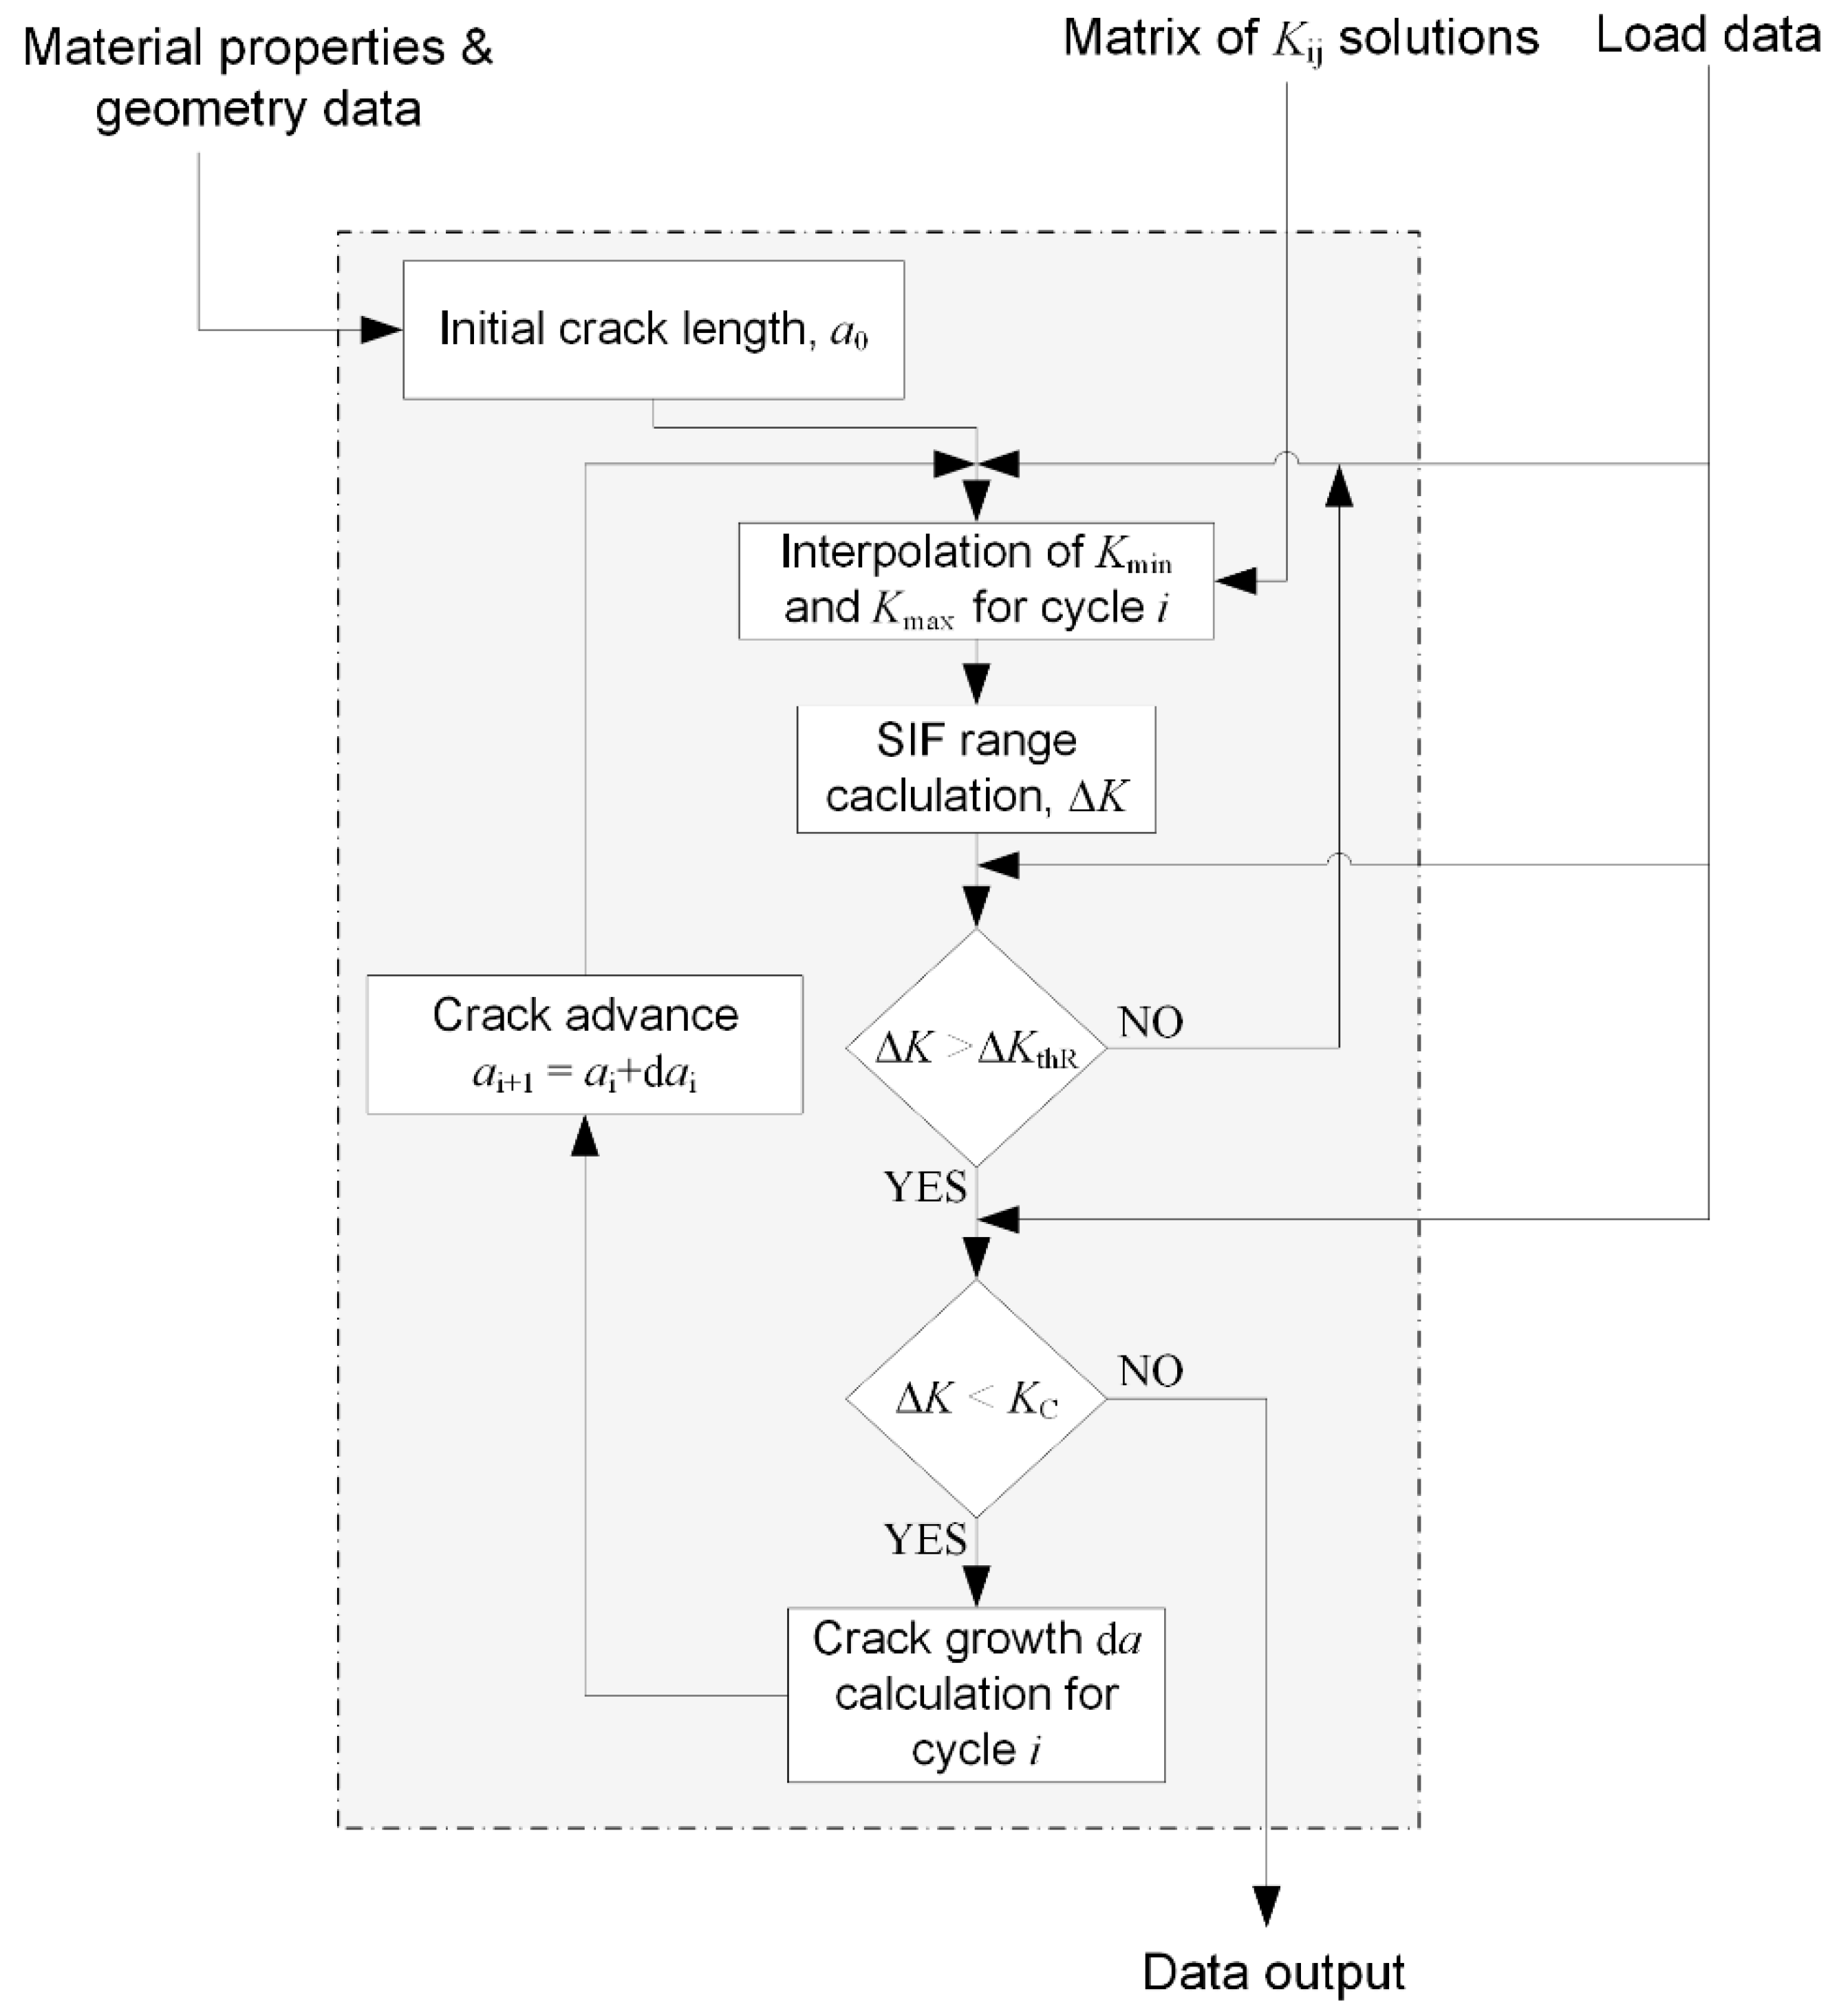
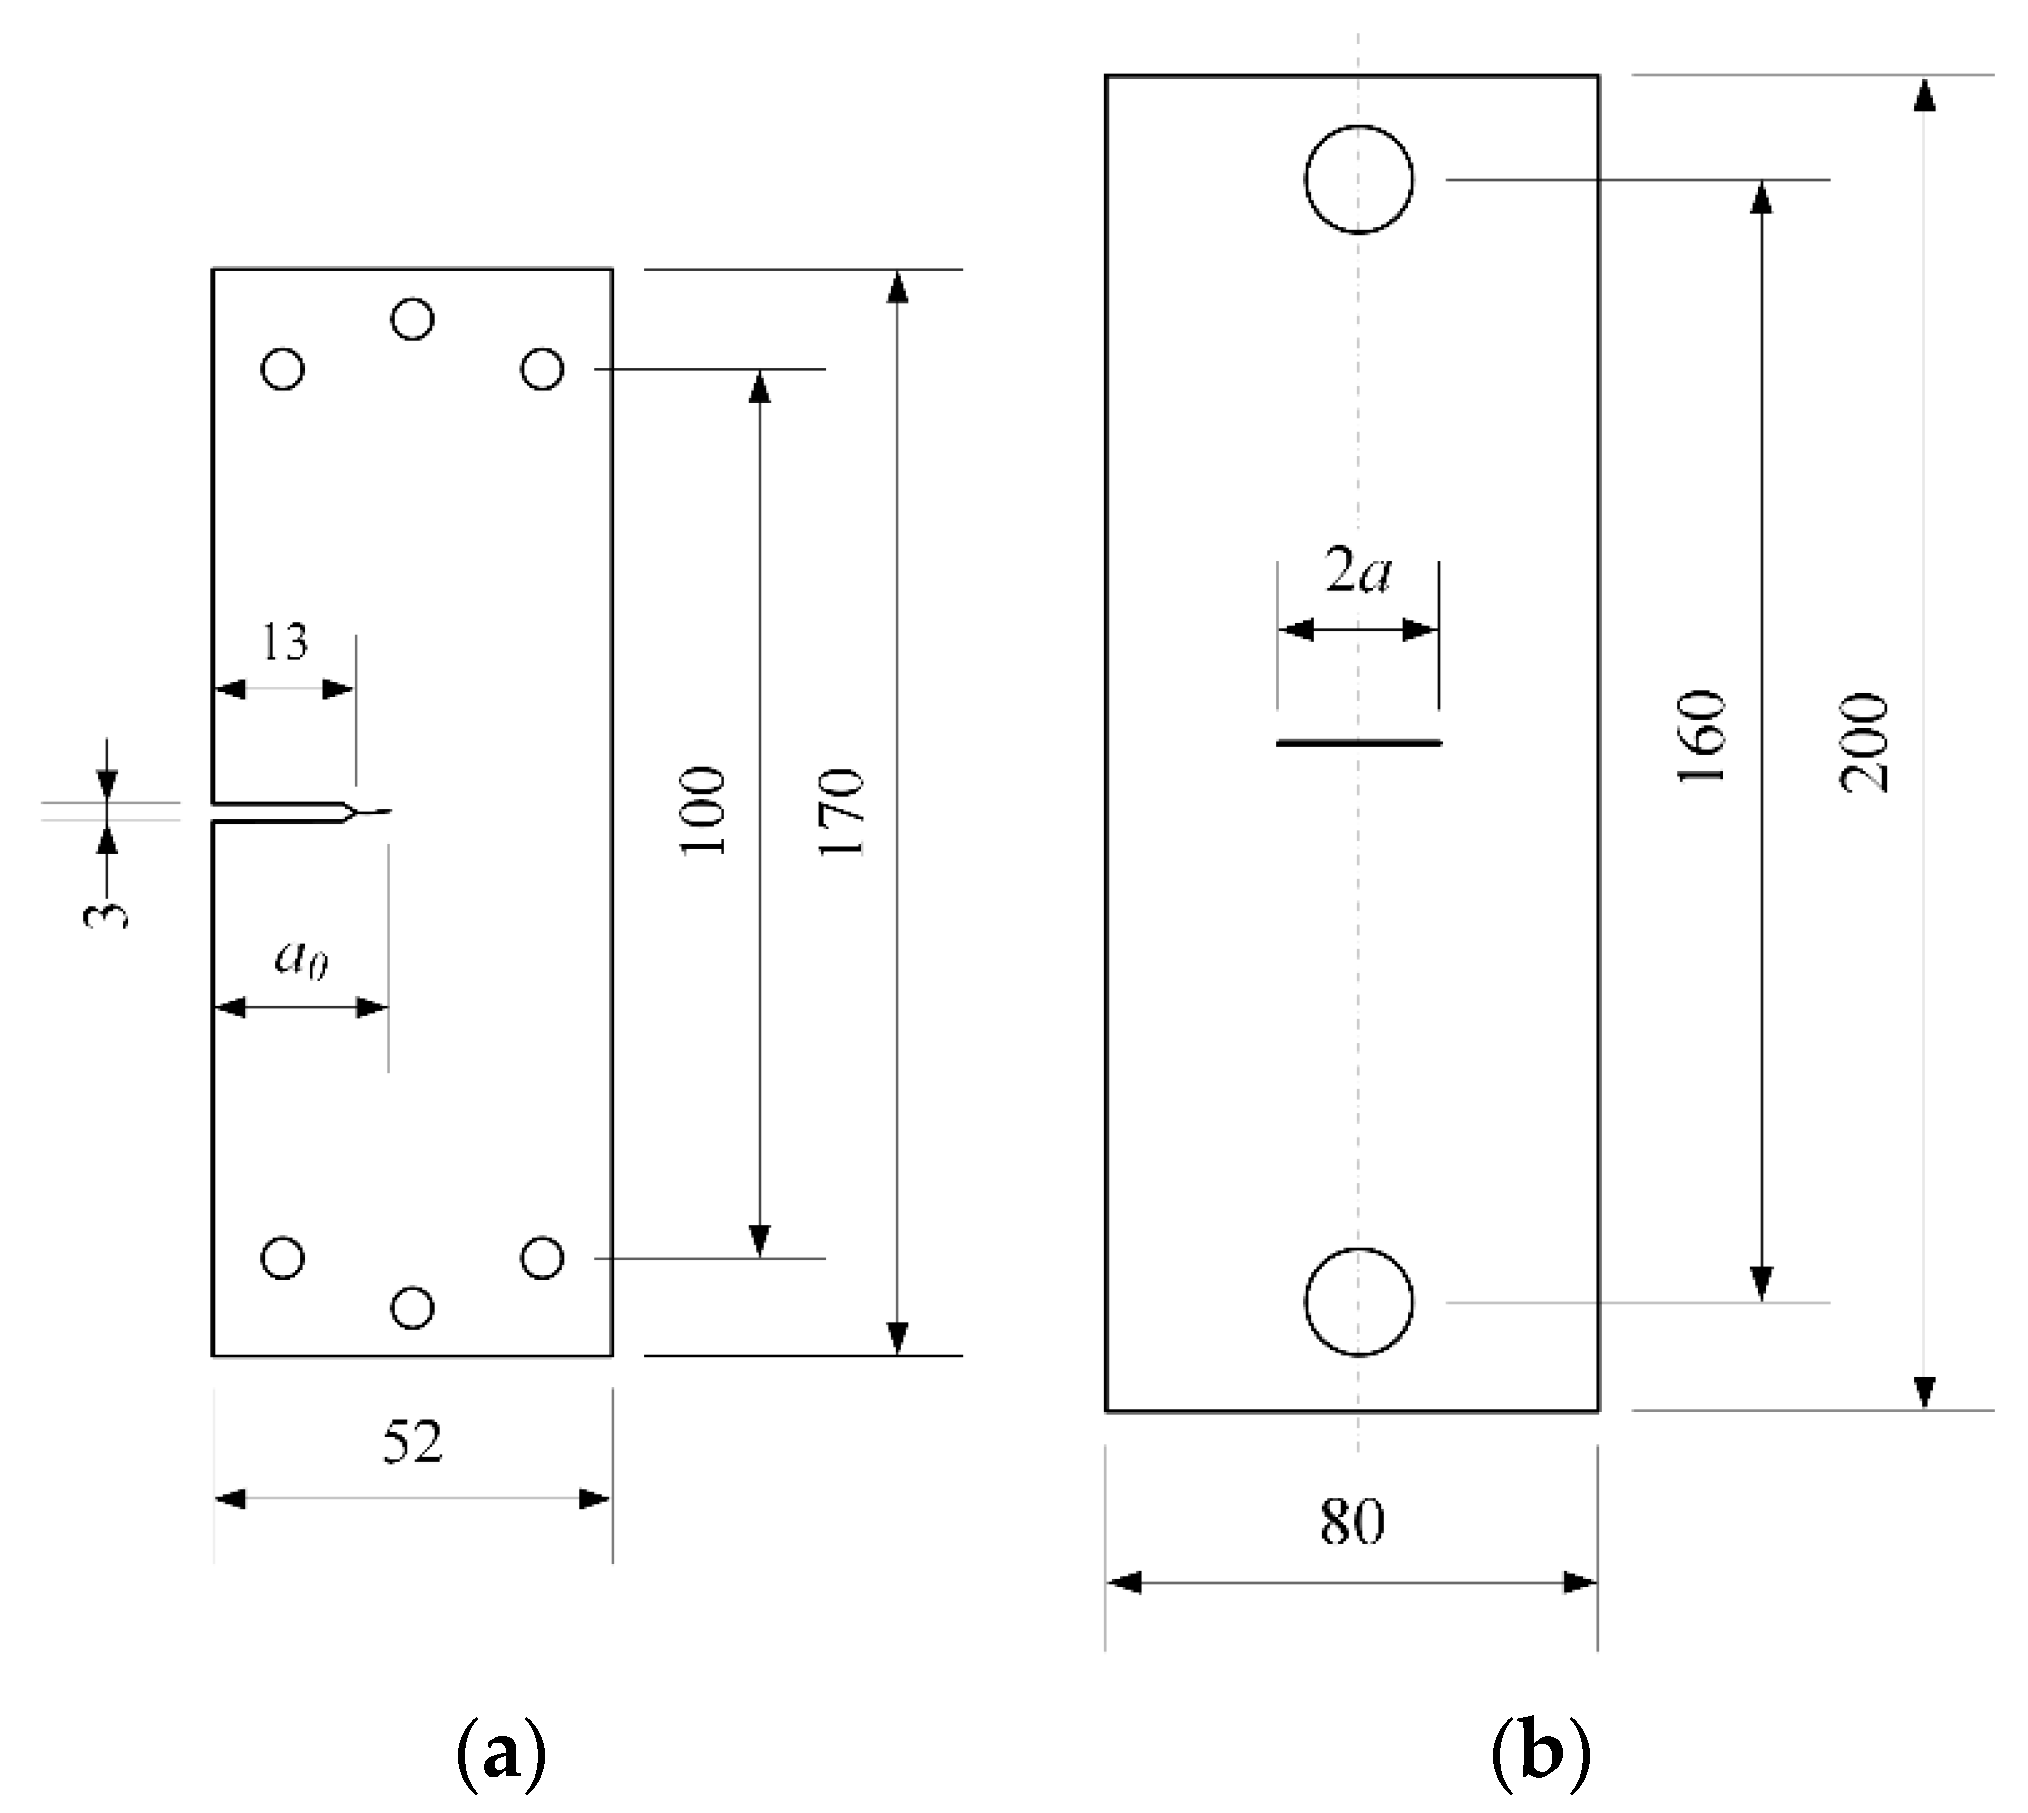
Figure 6.
Sample geometry for test case 3, data from [30].
Figure 6.
Sample geometry for test case 3, data from [30].

Figure 7.
Dependence of VCCT SIF values for different element sizes, for middle tension (M(T)) specimen modeled with 8-noded 2D elements in comparison with Irwin and Fedderson analytical solutions.
Figure 7.
Dependence of VCCT SIF values for different element sizes, for middle tension (M(T)) specimen modeled with 8-noded 2D elements in comparison with Irwin and Fedderson analytical solutions.
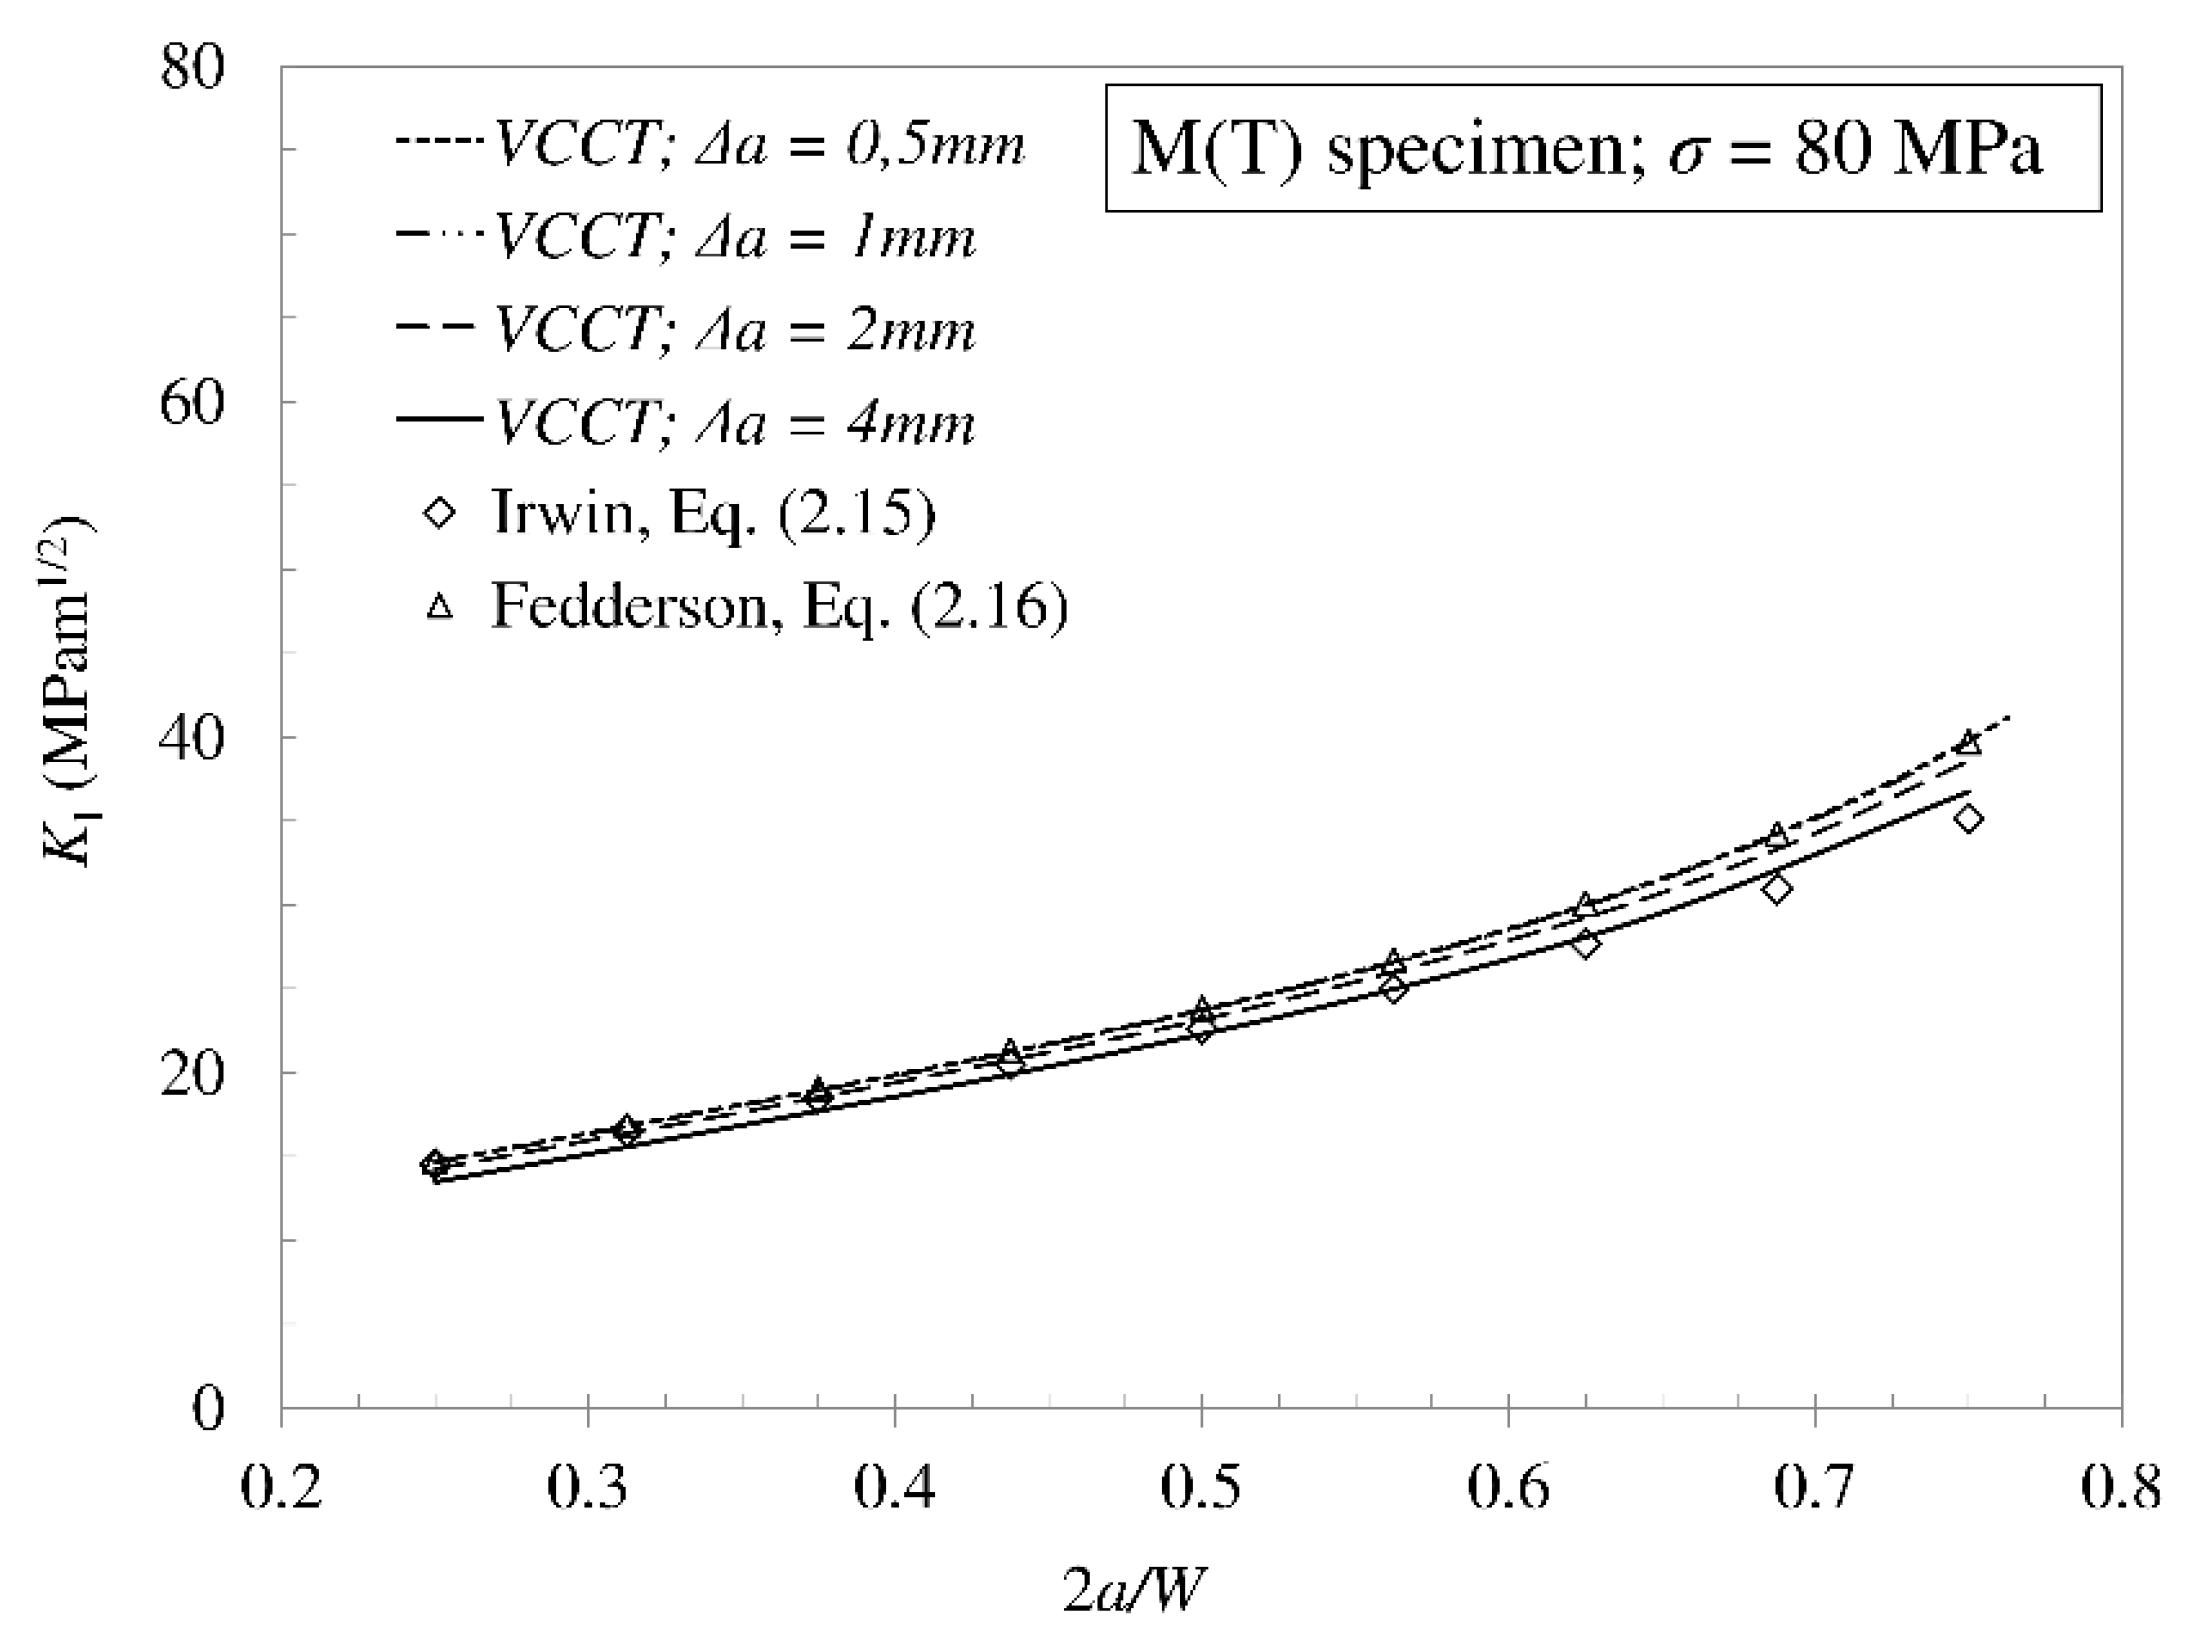
Figure 8.
Finite element (FE) mesh for (a) test case 1; (b) test case 2 (loaded); (c) test case 3.

Figure 9.
Calculated crack propagation rate for test case 1 (side cracked plate, 2024-T3).
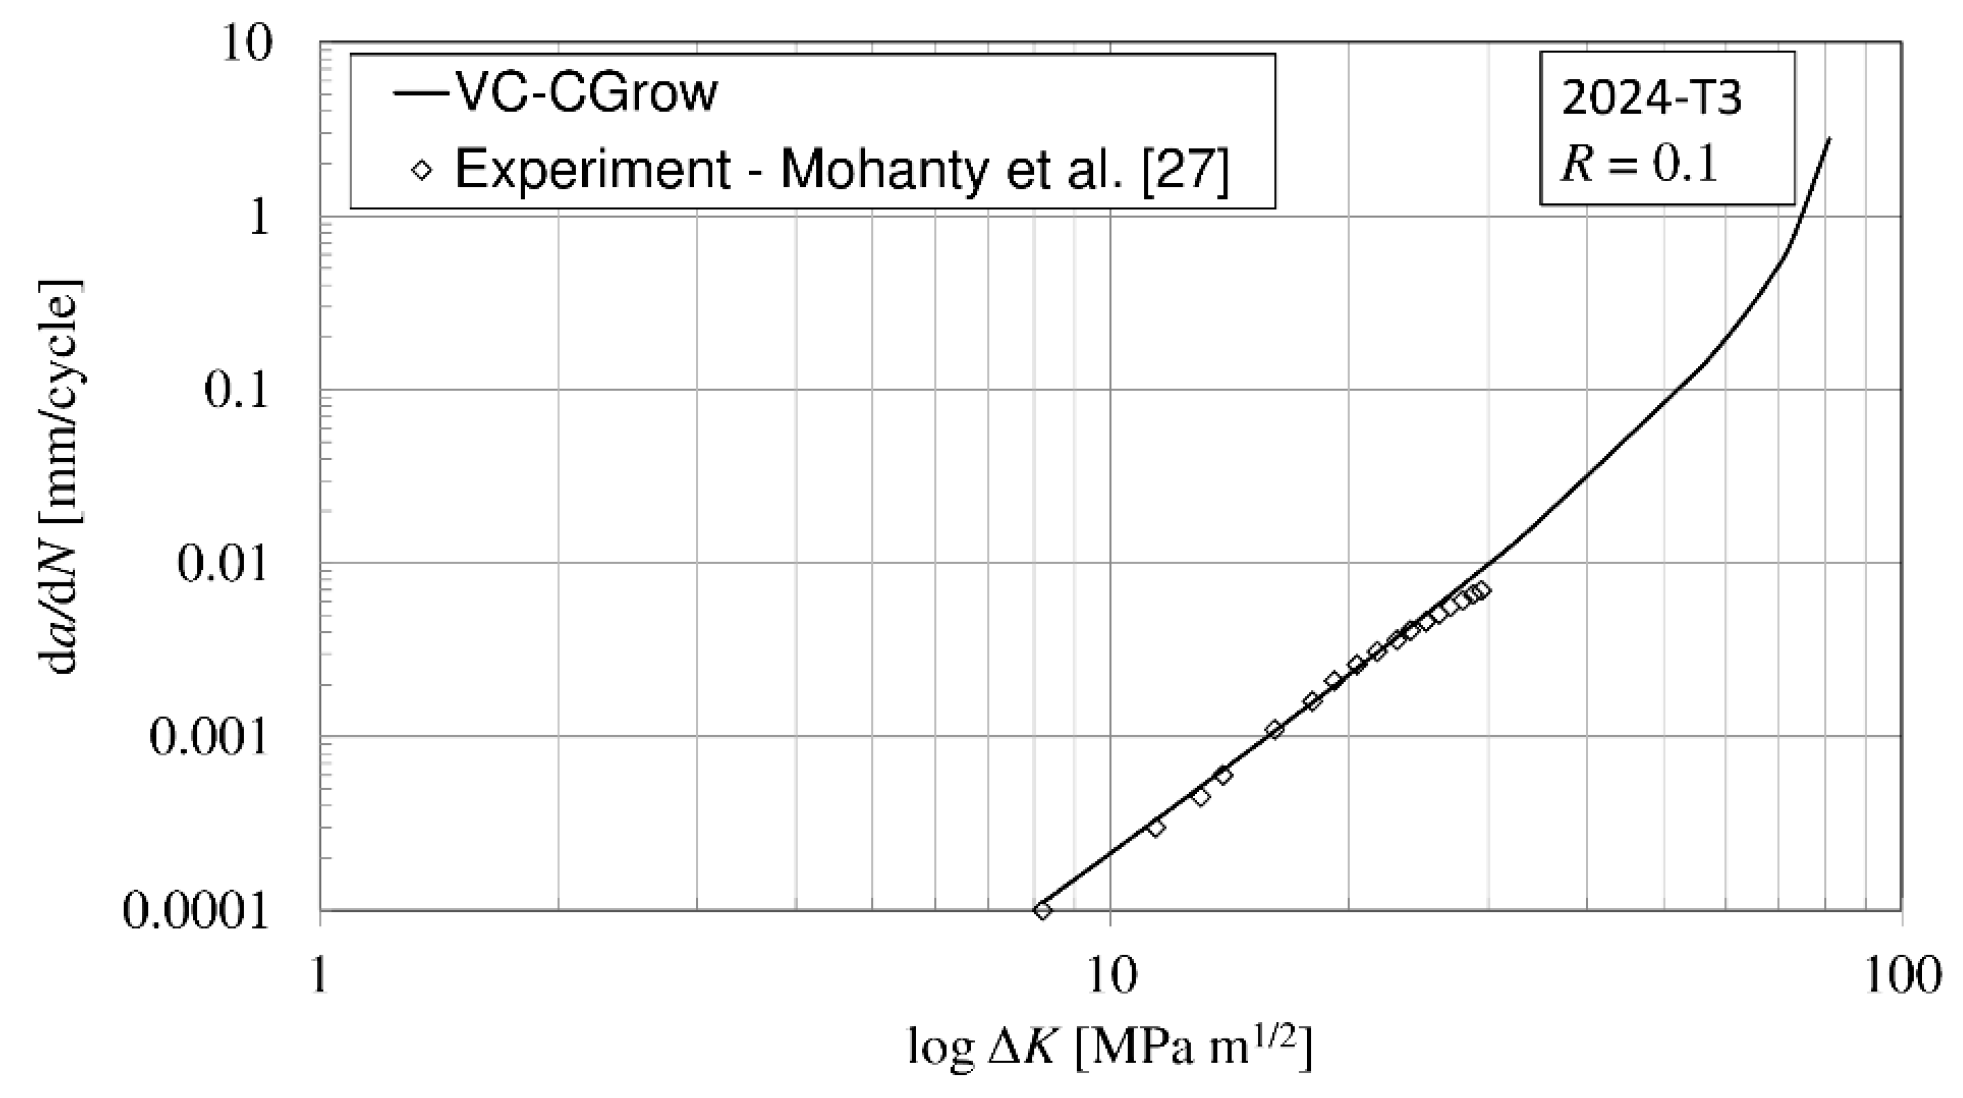
Figure 10.
Calculated crack propagation rate for test case 2 (M(T) specimen, 18G2A steel).
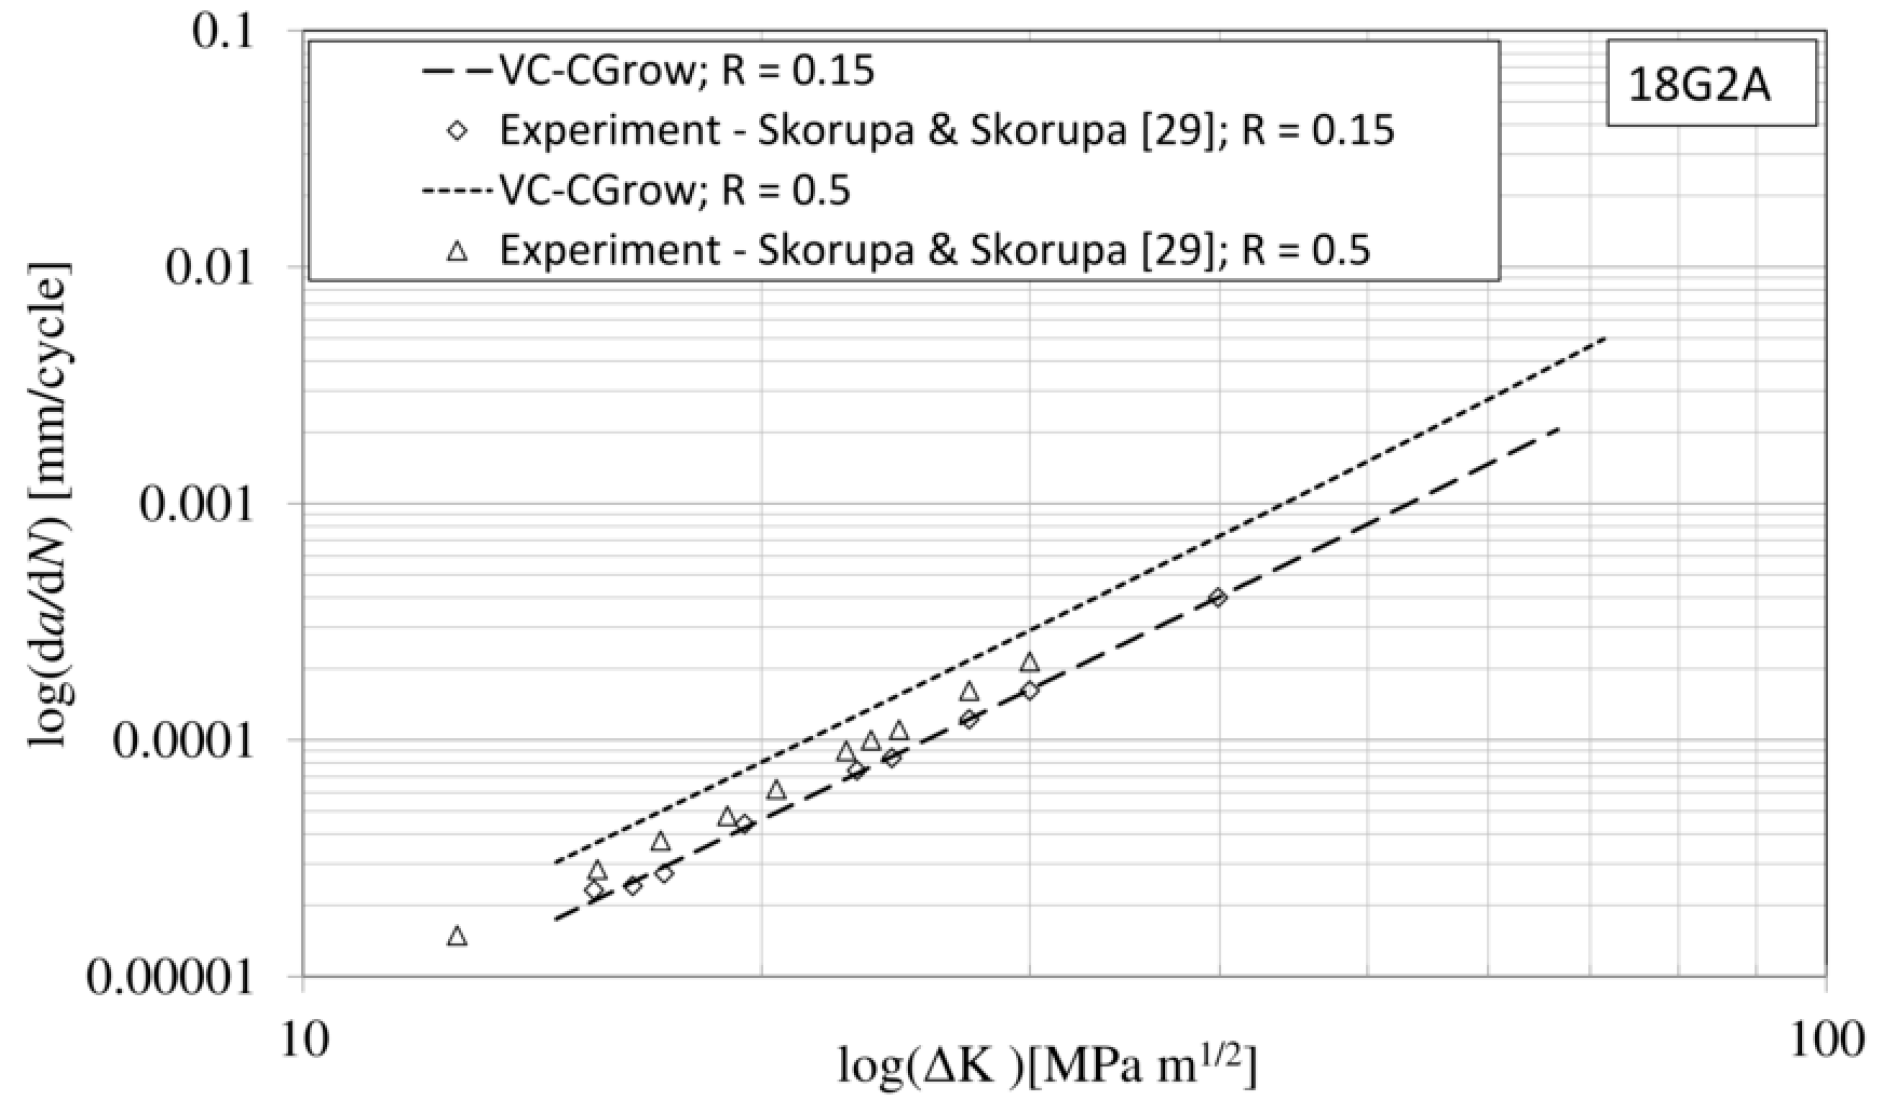
Figure 11.
Crack propagation curve for test case 1 (side cracked plate, 2024-T3).
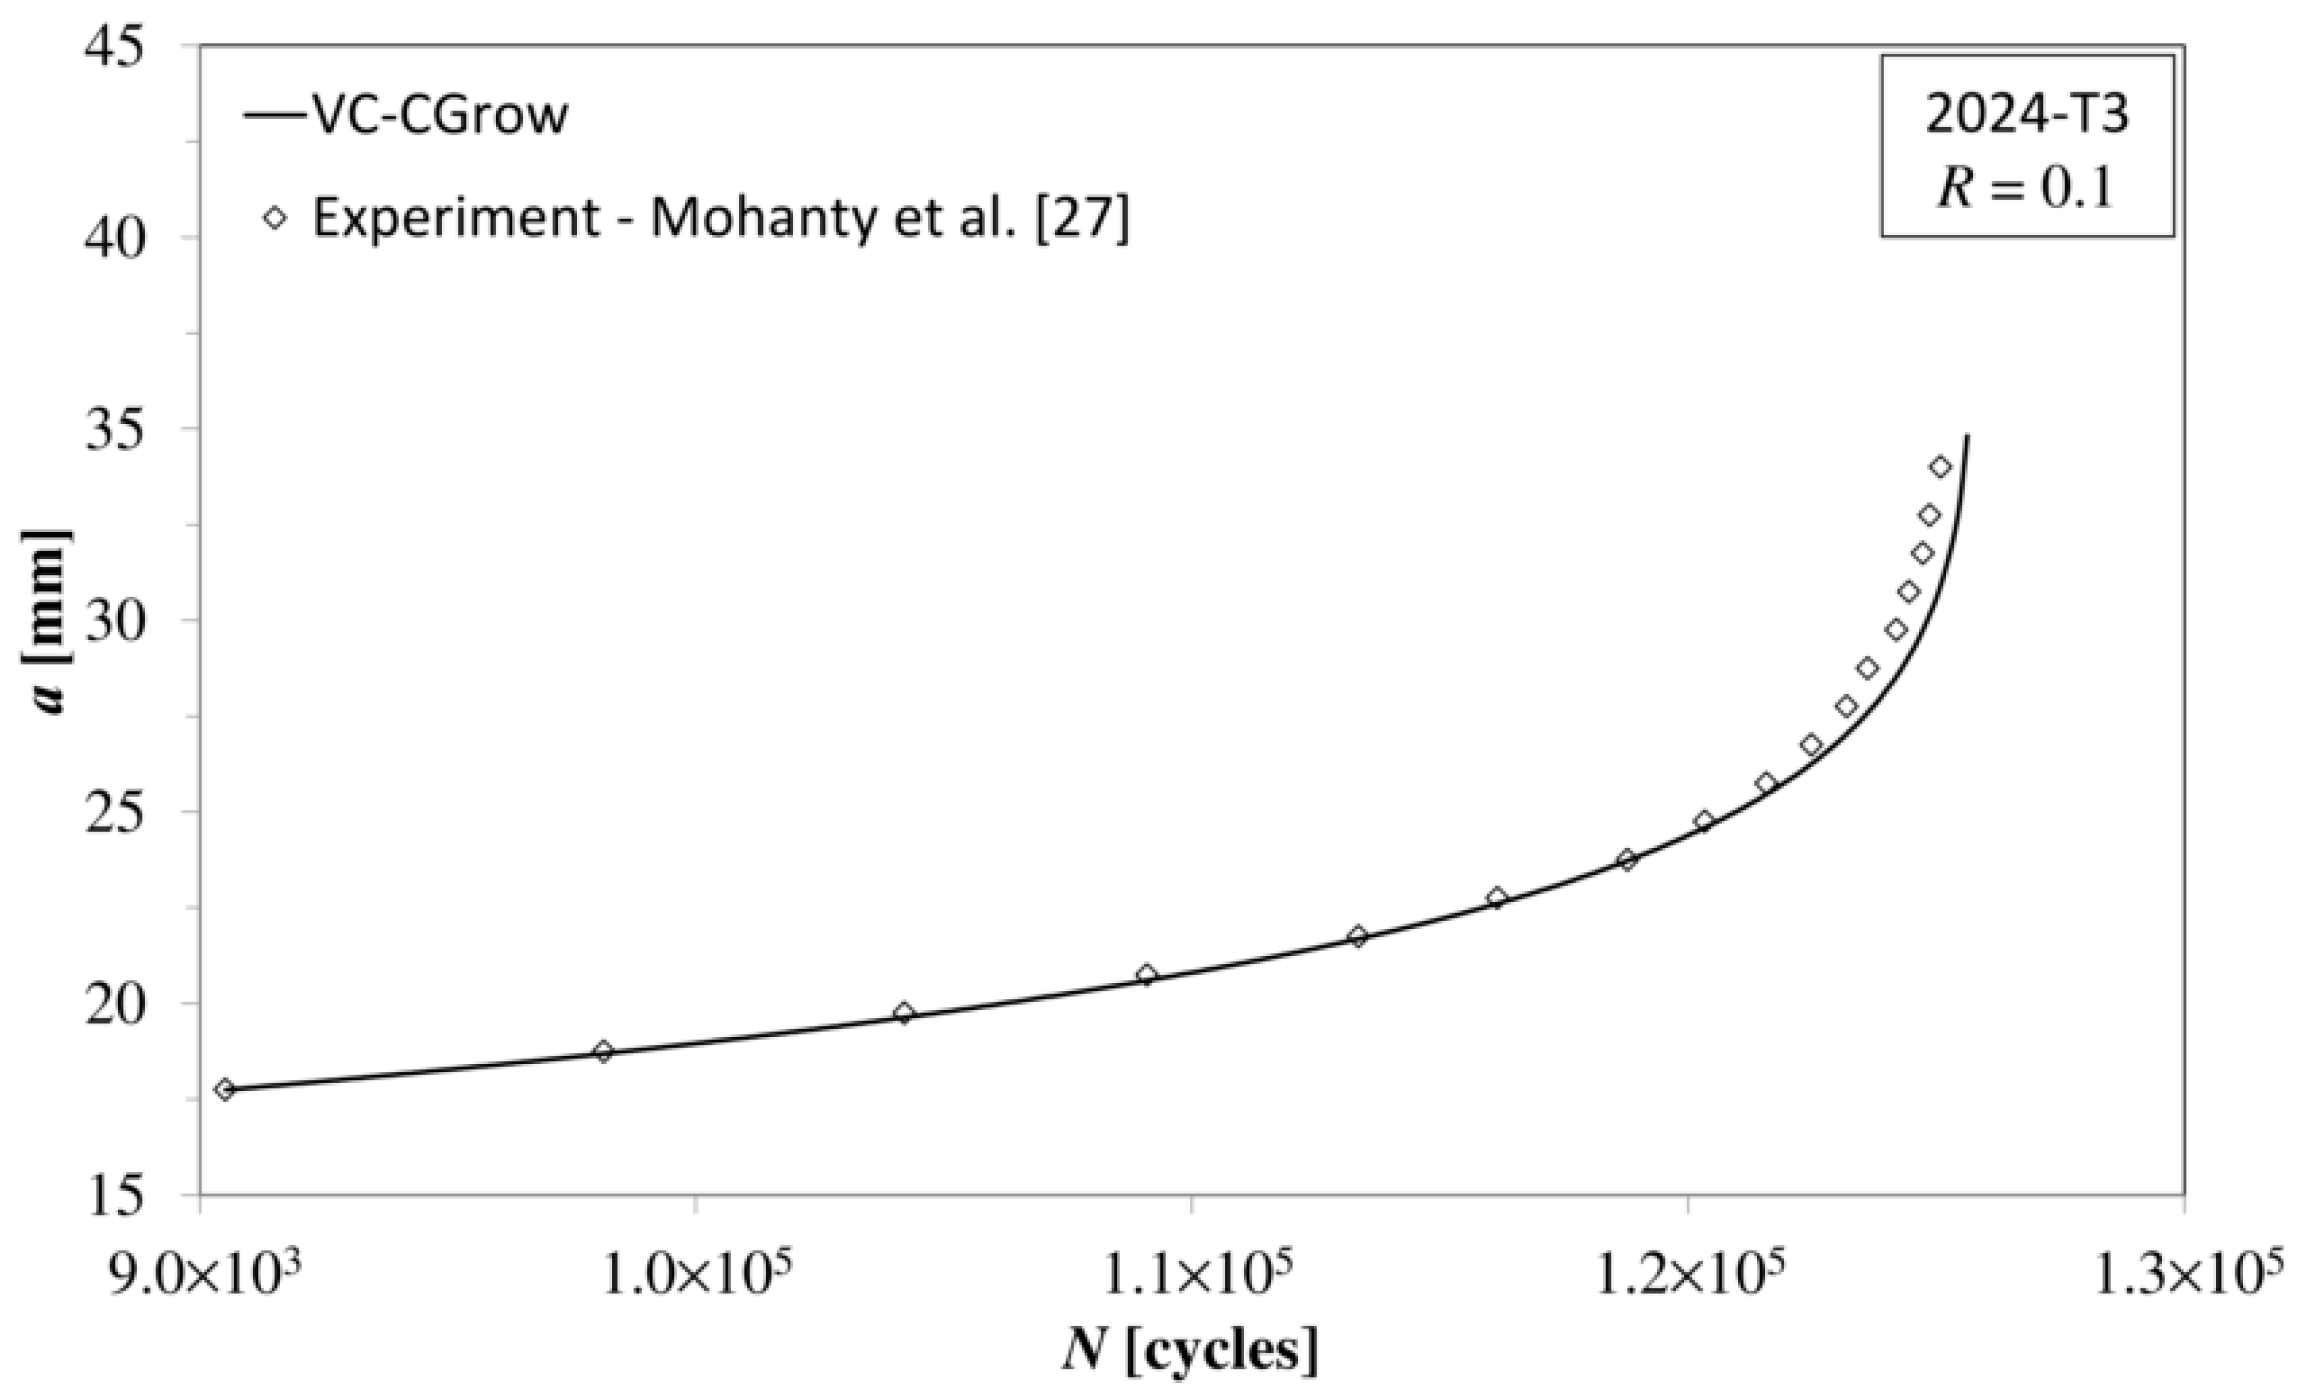
Figure 12.
Crack propagation curve for test case 2 (M(T) specimen, 18G2A steel).
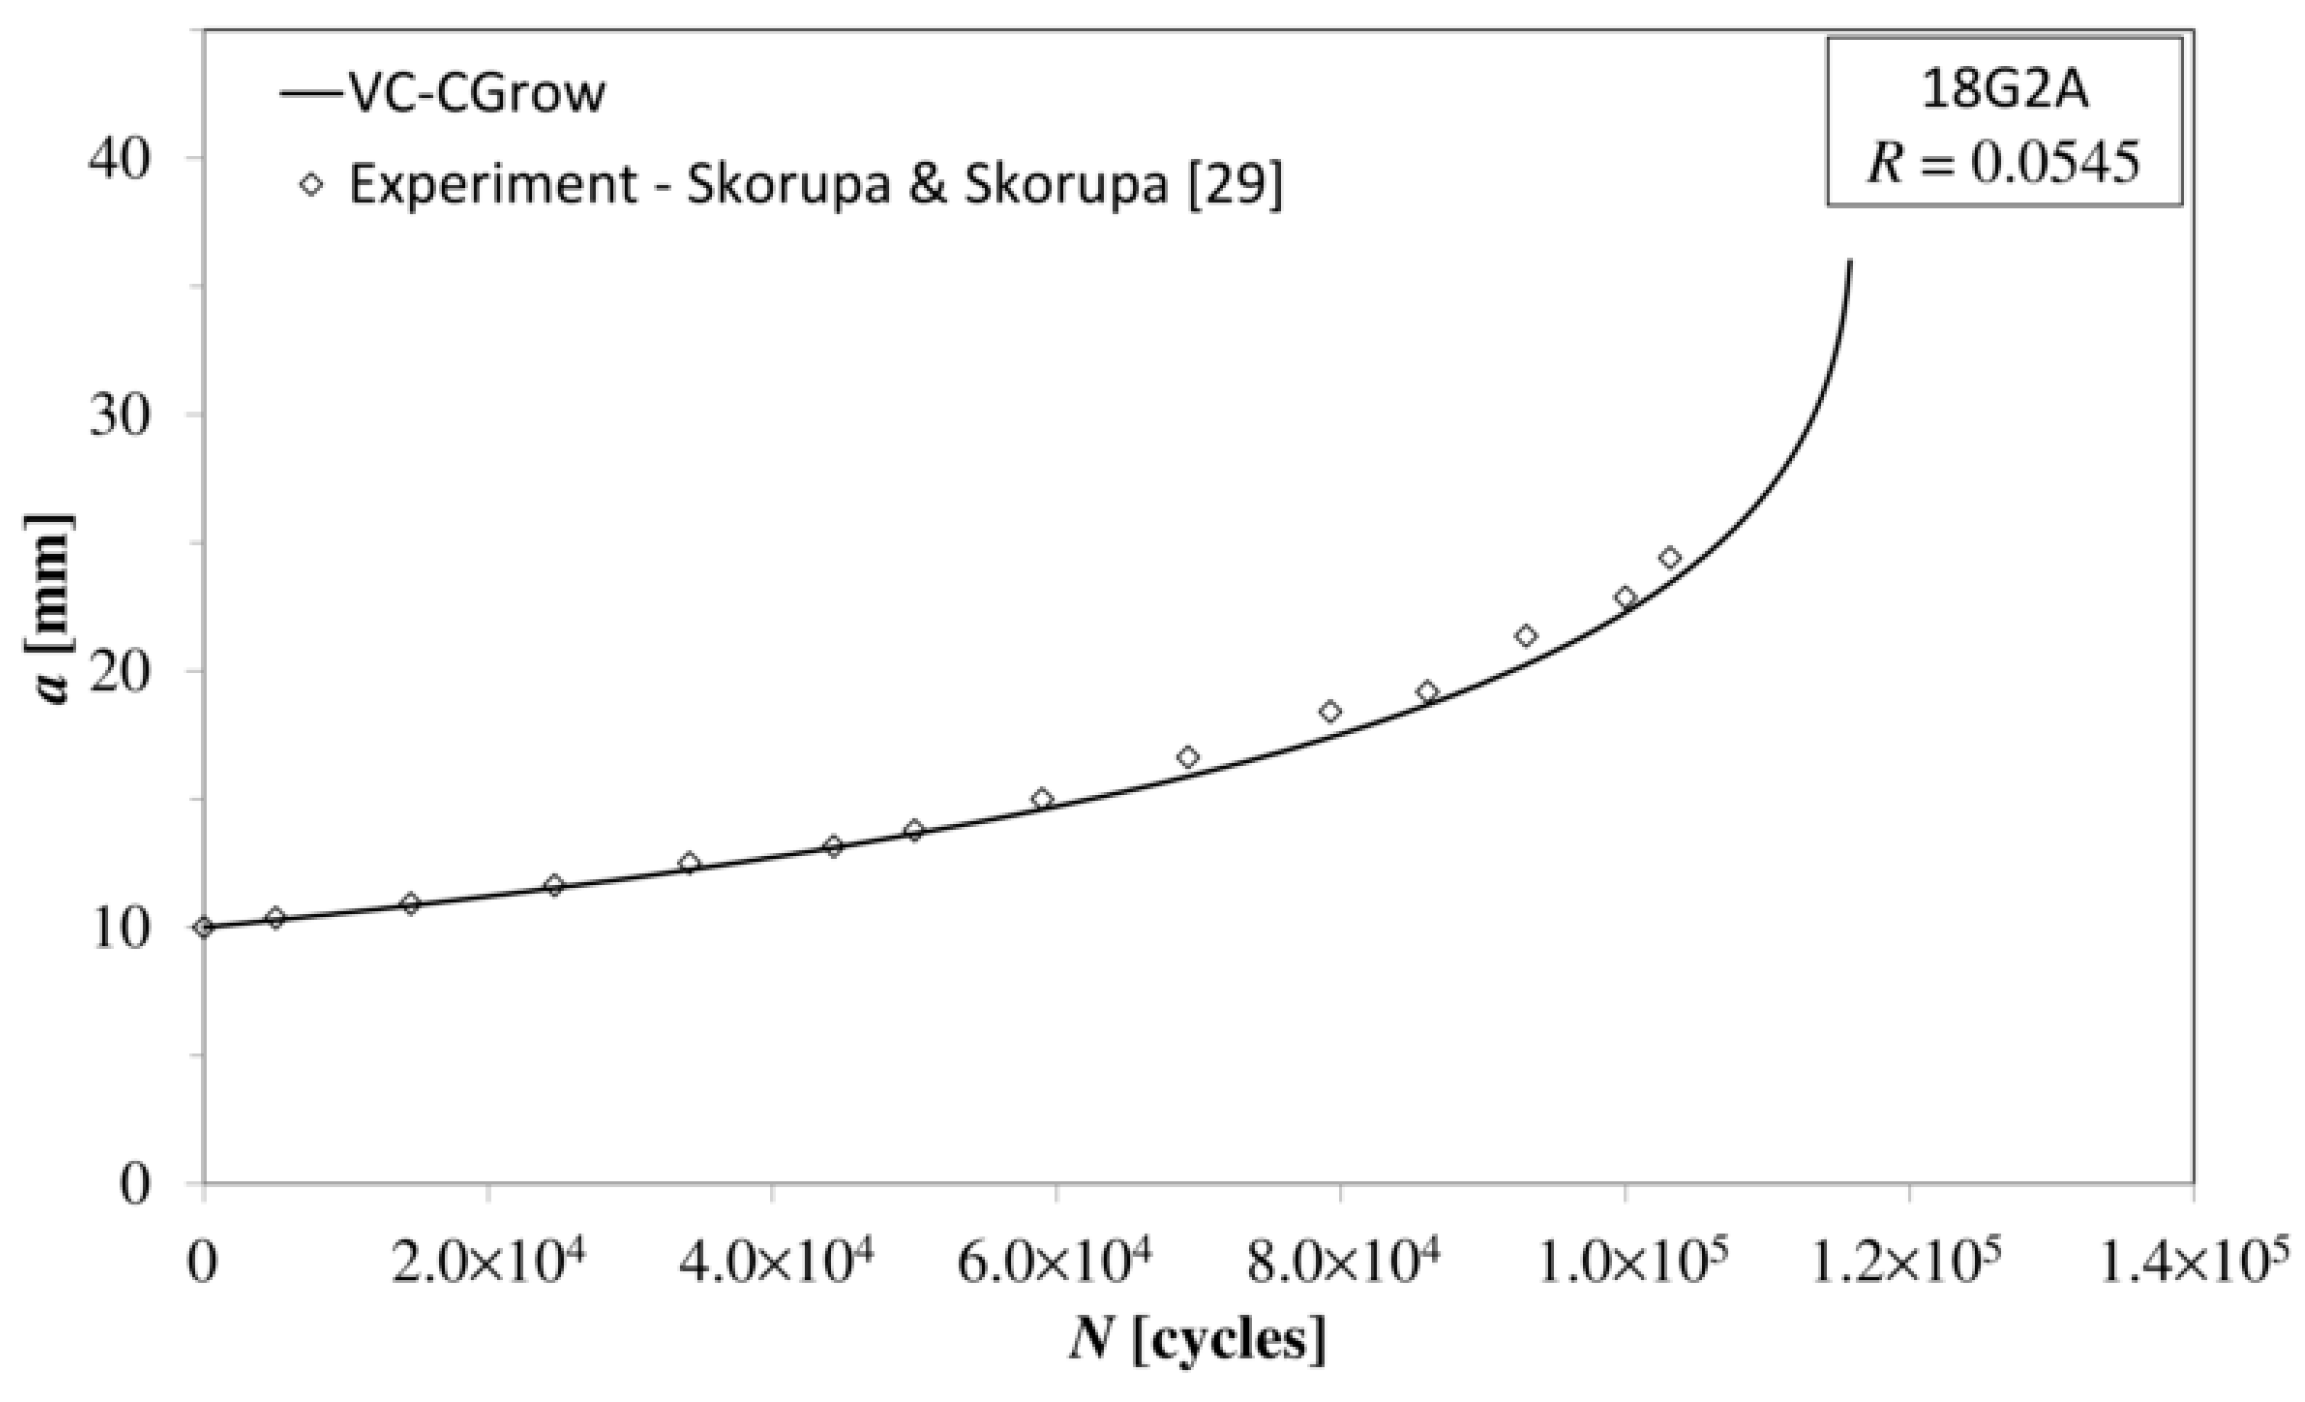
Figure 13.
Crack propagation curve for test case 3 (compact tension (C(T)) specimen, A516 Grade70 welded steel).
Figure 13.
Crack propagation curve for test case 3 (compact tension (C(T)) specimen, A516 Grade70 welded steel).

Table 1.
Mechanical properties of used materials.
| TEST CASE | 1 | 2 | 3 | |
|---|---|---|---|---|
| Material | 2024-T3 | 18G2A (1.0562) | A516 Gr70 (1.0473) 45% overmatch weld | |
| Yield Strength σy, MPa | 324 | 398 | 511 | |
| Ultimate Tensile strength σUTS, MPa | 469 | 540 | 580 | |
| Young Modulus E, GPa | 73.1 | 210 | 210 | |
| Poisson ratio ν | 0.33 | 0.3 | 0.3 | |
| Plane-Strain Fracture Toughness KIc, MPa | 37 | 68 * | 91 * | |
| Forman Constants | CF | 1 × 10⁻⁵ | 2.23 × 10⁻⁶ | 5.31 × 10⁻⁷ ** |
| mF | 3.2094 | 3.073 | 3.256 ** | |
* estimated value; ** for weld material.
Table 2.
Geometry and loads for all test cases.
| TEST CASE | 1 | 2 | 3 | |
|---|---|---|---|---|
| Specimen Geometry | Single Edge Cracked Plate | M(T) | C(T) | |
| Specimen Thickness t, mm | 6.5 | 4 | 12.5 | |
| Initial Crack Size a0, mm | 17.75 | 10 | 12.7 | |
| Maximum Load | Fmax. kN | 7.2 | - | 7.061 |
| σmax. MPa | 21.3 | 137.5 | - | |
| Minimum Load | Fmin. kN | 0.72 | - | 0.7061 |
| σmin. MPa | 2.13 | 7.5 | - | |
| Load Asymmetry Ratio R | 0.1 | 0.0545 | 0.1 | |
© 2020 by the authors. Licensee MDPI, Basel, Switzerland. This article is an open access article distributed under the terms and conditions of the Creative Commons Attribution (CC BY) license (http://creativecommons.org/licenses/by/4.0/).
Share and Cite
MDPI and ACS Style
Krscanski, S.; Brnic, J. Prediction of Fatigue Crack Growth in Metallic Specimens under Constant Amplitude Loading Using Virtual Crack Closure and Forman Model. Metals 2020, 10, 977. https://doi.org/10.3390/met10070977
AMA Style
Krscanski S, Brnic J. Prediction of Fatigue Crack Growth in Metallic Specimens under Constant Amplitude Loading Using Virtual Crack Closure and Forman Model. Metals. 2020; 10(7):977. https://doi.org/10.3390/met10070977
Chicago/Turabian StyleKrscanski, Sanjin, and Josip Brnic. 2020. "Prediction of Fatigue Crack Growth in Metallic Specimens under Constant Amplitude Loading Using Virtual Crack Closure and Forman Model" Metals 10, no. 7: 977. https://doi.org/10.3390/met10070977
Note that from the first issue of 2016, this journal uses article numbers instead of page numbers. See further details here.