Article

Microstructure Evolution and Competitive Reactions during Quenching and Partitioning of a Model Fe–C–Mn–Si Alloy

1
CNRS, Univ. Bordeaux, Bordeaux INP, ICMCB, UMR 5026, F-33600 Pessac, France
2
Normandie Université, UNIROUEN, INSA Rouen, CNRS, Groupe de Physique des Matériaux, 76000 Rouen, France
3
Institut Jean Lamour, UMR CNRS-UL 7198, 54011 Nancy, France
4
Maizières Automotive Products, Arcelormittal Maizières Research SA, 57283 Maizières les Metz, France
*
Author to whom correspondence should be addressed.
Metals 2020, 10(1), 137; https://doi.org/10.3390/met10010137
Submission received: 23 December 2019 / Revised: 10 January 2020 / Accepted: 13 January 2020 / Published: 16 January 2020
(This article belongs to the Special Issue Advanced High Strength Steels by Quenching and Partitioning)

Abstract

:
The mechanisms behind the carbon enrichment of austenite during quenching and partitioning are still a matter of debate. This work investigates the microstructural evolution during the quenching and partitioning of a model Fe–C–Mn–Si alloy by means of in situ high energy X-ray diffraction (HEXRD) atom probe tomography, and image analysis. The ultra-fast time-resolved quantitative information about phase transformations coupled with image analysis highlights the formation of carbide-free BCT bainite, which is formed within a very short range during the reheating and partitioning step. Its transformation rate, which is a better indicator than the intrinsic volume fraction, depends on the quenching temperature (QT). It is shown to decrease with decreasing QT, from 45% at QT = 260 °C to 20% at QT = 200 °C. As a consequence, a significant part of the carbon enrichment observed in austenite can be attributed to bainite transformation. Furthermore, a large part of carbon was shown to be trapped into martensite. Both the formation of Fe2.6C iron carbides and the segregation of carbon on lath boundaries in martensite were highlighted by atom probe tomography. The energy for carbon segregation was determined to be 0.20 eV, and the carbon concentration on the lath boundaries was obtained to be around 25 at %. Therefore, the carbon enrichment of austenite is the result of competitive reactions such as carbon partitioning from martensite, bainite transformation, and carbon trapping in martensite.

1. Introduction

The need to improve fuel efficiency and safety has led to a high and growing demand for high-strength steels in the automotive industry [1]. In that context, quenching and partitioning (Q&P) steels have received much attention, and they can be considered as one of the third generation of advanced high-strength steels (AHSS) for automotive applications. Their development relies on a processing route, originally proposed by Speer et al. [2,3], that involves quenching below the martensite start temperature (Ms) followed by a rapid heating and aging above the initial quench temperature. The aging step, usually performed between 300 and 500 °C, is also termed the “partitioning step”, since carbon enrichment in austenite is expected to occur during this stage.
The benefits of such treatment in terms of improved mechanical properties have been clearly demonstrated [3,4]. It depends strongly on the austenite stability and thus on the level of carbon enrichment in austenite during the partitioning step. However, despite the large amount of knowledge acquired in this decade, the Q&P is still a matter of debate. Indeed, the Q&P microstructures are extremely difficult to characterize by traditional metallographic methods as well as by electron backscatter diffraction (EBSD), since their constituents are on the submicron scale and respond in a similar way to etching [5,6]. In addition, the mechanism of carbon enrichment in retained austenite during the partitioning step is still controversial. Strong experimental evidences of carbon partitioning from martensite to austenite exist [7,8], but carbon partitioning from supersaturated bainitic ferrite to austenite is still possible [9,10]. Moreover, from a kinetics point of view, it has been suggested that the temperature is too low for carbon diffusion and that carbon supersaturation in martensite can be eliminated by carbides precipitation during the partitioning step [3,11]. The formation of bainite during partitioning cannot be completely ruled out and could explain the carbon enrichment measured in retained austenite, as the temperatures are consistent with those for bainite formation [7,10]. As a consequence, both the amount and the kinetics of carbon enrichment into austenite would depend on competitive reactions between carbon partitioning from martensite, carbides precipitation into martensite, and bainite transformation. Carbon segregation on defects in martensite is another phenomenon that is often neglected and deserves further consideration. Indeed, a large amount of carbon can be trapped into dislocations and/or lath boundaries and, as a consequence, it may limit the total amount of carbon partitioning from martensite to austenite.
It was recently demonstrated that in situ high-energy X-ray diffraction (HEXRD) is a powerful method to obtain time-resolved precise quantitative information about phase transformation during the quenching and partitioning of conventional transformation induced plasticity (TRIP) steels [10,12]. In the present work, the microstructure evolution during the Q&P process of conventional TRIP steel was investigated by coupling both in situ HEXRD experiments and atom probe tomography. The results clarify both the time and temperature evolutions of microstructure and the competitive reactions that take place.

2. Materials and Methods

A Fe–0.3wt%C–2.5wt%Mn–1.5wt%Si alloy was cast in a vacuum induction melting furnace. The ingots were homogenized at 1250 °C during 16 h before a hot rolling step in order to obtain sheets 10 mm thick. Finally, the obtained sheets were machined into Φ4 standard (cylinder of diameter 4 mm, 10 mm in length).
High-energy X-ray diffraction (HEXRD) experiments have been conducted at the Deutsches Elektronen-Synchrotron (DESY) in Hamburg, Germany, on a beamline Petra P-07. The Φ4 samples were placed into a commercial Bähr DIL805D dilatometer (Bähr, Thermoanalyse GmbH, Hüllhorst, Germany) available on the line in order to reproduce the chosen Q&P treatments and obtain dilatometry curves. A schematic representation of the experimental setup is shown in Figure 1 below. The high-energy monochromatic beam (100 keV) permits to work in transmission, and the association with a fast 2D detector enables high acquisition rates (10 Hz) suitable to study a “real-time” process on a bulk sample. The detector was placed 1 m away from the sample, giving access to full Debye–Scherrer rings with a maximum 2θ angle of 12°.
The Q&P heat treatments were reproduced using the dilatometer (see Figure 1). Then, the samples were first heated up to 900 °C at 5 °C/s and held for 5 min at this temperature in order to achieve a full austenitic state. The samples were successively cooled down rapidly at 50 °C/s to three different quenching temperature (QT = 260, 230, and 200 °C). This step was followed by a homogenization step of 5 s at QT and then reheated at about 30 °C/s to a partitioning temperature (PT) of 400 °C, held at PT for 200 s, and finally quenched down rapidly to room temperature. The corresponding thermal paths are given in Figure 2.
The 2D diffraction patterns obtained with the detector were integrated circularly using the Fit2D software to obtain 1D diffractograms. In order to determine the nature and volume fractions of the phases formed during Q&P heat treatments, the diffractograms were analyzed with a full Rietveld refinement procedure [13]. Diffraction peaks were modeled using pseudo-Voigt functions using FullProf software with 20 degrees of freedom for each record (background, phase fraction, lattice parameters, shape of peaks, and temperature effects). The phase fractions were extracted from the peak integral breaths. The uncertainty on both phase fractions and lattice parameters were estimated to be roughly ±1% and 0.005 Å, respectively.
Two phases were considered in the refinement: austenite and ferrite. While the symmetry used to describe austenite is straightforward, i.e face-centered cubic (FCC), Fm-3m, two different symmetries were tested to fit the ferritic phase: a body-centered cubic (BCC, Im-3m) and a body-centered tetragonal (BCT, I4/mmm). The weighted profile Rwp, which is largely used in the Rietveld refinement procedure as a discrepancy index between the experimental and the calculated profiles [14], was used to discriminate BCC structures from BCT structures; a lower Rwp indicated a better fit. The weighted profile Rwp is expressed as [14]:
R w p = [ i w i ( y i y c i ) 2 i w i ( y i ) 2 ] 1 2
where wi is the weight of the different reflexions, yi and yci are the observed and calculated intensities, and i is the 2θ angle.
The Rwp turned out to be lower when considering a BCT structure than with a BCC structure for ferrite. Hence, the ferrite peaks were fit with BCT (I4/mmm) symmetry.
First of all, and prior to any microstructural analysis, it was necessary to find the appropriate metallographic preparation that will effectively highlight the differences between phases. The purpose of the Q&P treatment being the redistribution of carbon between phases, it was thus logic to use a carbon-discriminating etchant. Nital etching (a mixture of nitric acid HNO3 and ethanol) is largely used to reveal ferrite grains boundaries in steels and is very effective to reveal a martensite lath structure. A good contrast between martensite and austenite was obtained; the latter appears with a bright contrast on scanning electron microscopy (SEM) images taken using a JEOL FEG7001F (JEOL, Tokyo, Japan). In addition, Picral etchant (a mixture of picric acid C6H3N3O7 and ethanol) was also used for its ability to obtain a better definition of the carbide structure in martensite/bainite. The etching sequence consisted of a Picral etch of a few seconds followed by a very quick Nital 1% etch (so-called “flash” etching).
By using SEM techniques in secondary electron mode (SE), the main information obtained is a topological one. The etching step was selected in order to highlight the difference in carbon concentration between the different phases. In other words, a phase presenting low carbon content will be more easily etched and will appear “dug”, in contrast to a high-carbon content phase that will appear in relief. Moreover, due to their high carbon content, carbides will appear in an even higher relief contrast.
In order to couple morphological information from SEM images with crystallographic information, EBSD was used on Q&P samples.
After a classical mechanical polishing step (grinding and polishing down to 1 µm cloth on an automatic polishing machine), a combination of automatic and then manual polishing using oxide polishing (OP-U) allowed to reach a sufficiently clean surface for EBSD observation. Then, an EBSD map acquisition was done on a JEOL FEG7001F SEM (JEOL, Tokyo, Japan) equipped with a Bruker Crystal align B400 (Bruker, Karlsruhe, Germany), the sample was tilted at 70°, and the working distance was set to 12 mm with a probe current parameter of 13 (u.a). The magnification was set at ×1500 and the step size used was 100 nm (giving a map of 822 points on the X-axis and 616 points on the Y-axis). Once the EBSD map was done, a Nital etching was applied to reveal the mapped zone. Indeed, due to probe pollution during EBSD mapping, the mapped zone will appear unetched. Then, this area was marked by hardness points in order to be easily located. Then, the sample was quickly polished with dry OPU in order to remove the polluted surface but with taking care to not remove too much matter in order to have the same microstructure as the one observed with EBSD. Finally, the sample was chemical etched with Picral and Nital flash for SEM observations of the previously marked area.
Due to its proven ability to map both interstitial and substitutional elements distribution at the subnanometer scale, atom probe tomography (APT) was used to investigate the carbon redistribution in phases. Specimens were analyzed using a CAMECA LEAP® 4000 HR (AMETEK, Inc – CAMECA SAS, Gennevilliers, France) under the following conditions: 0.3% average detection rate, 200 kHz pulse repetition rate, 50 K temperature, and 20% pulse fraction.

3. Results and Discussion

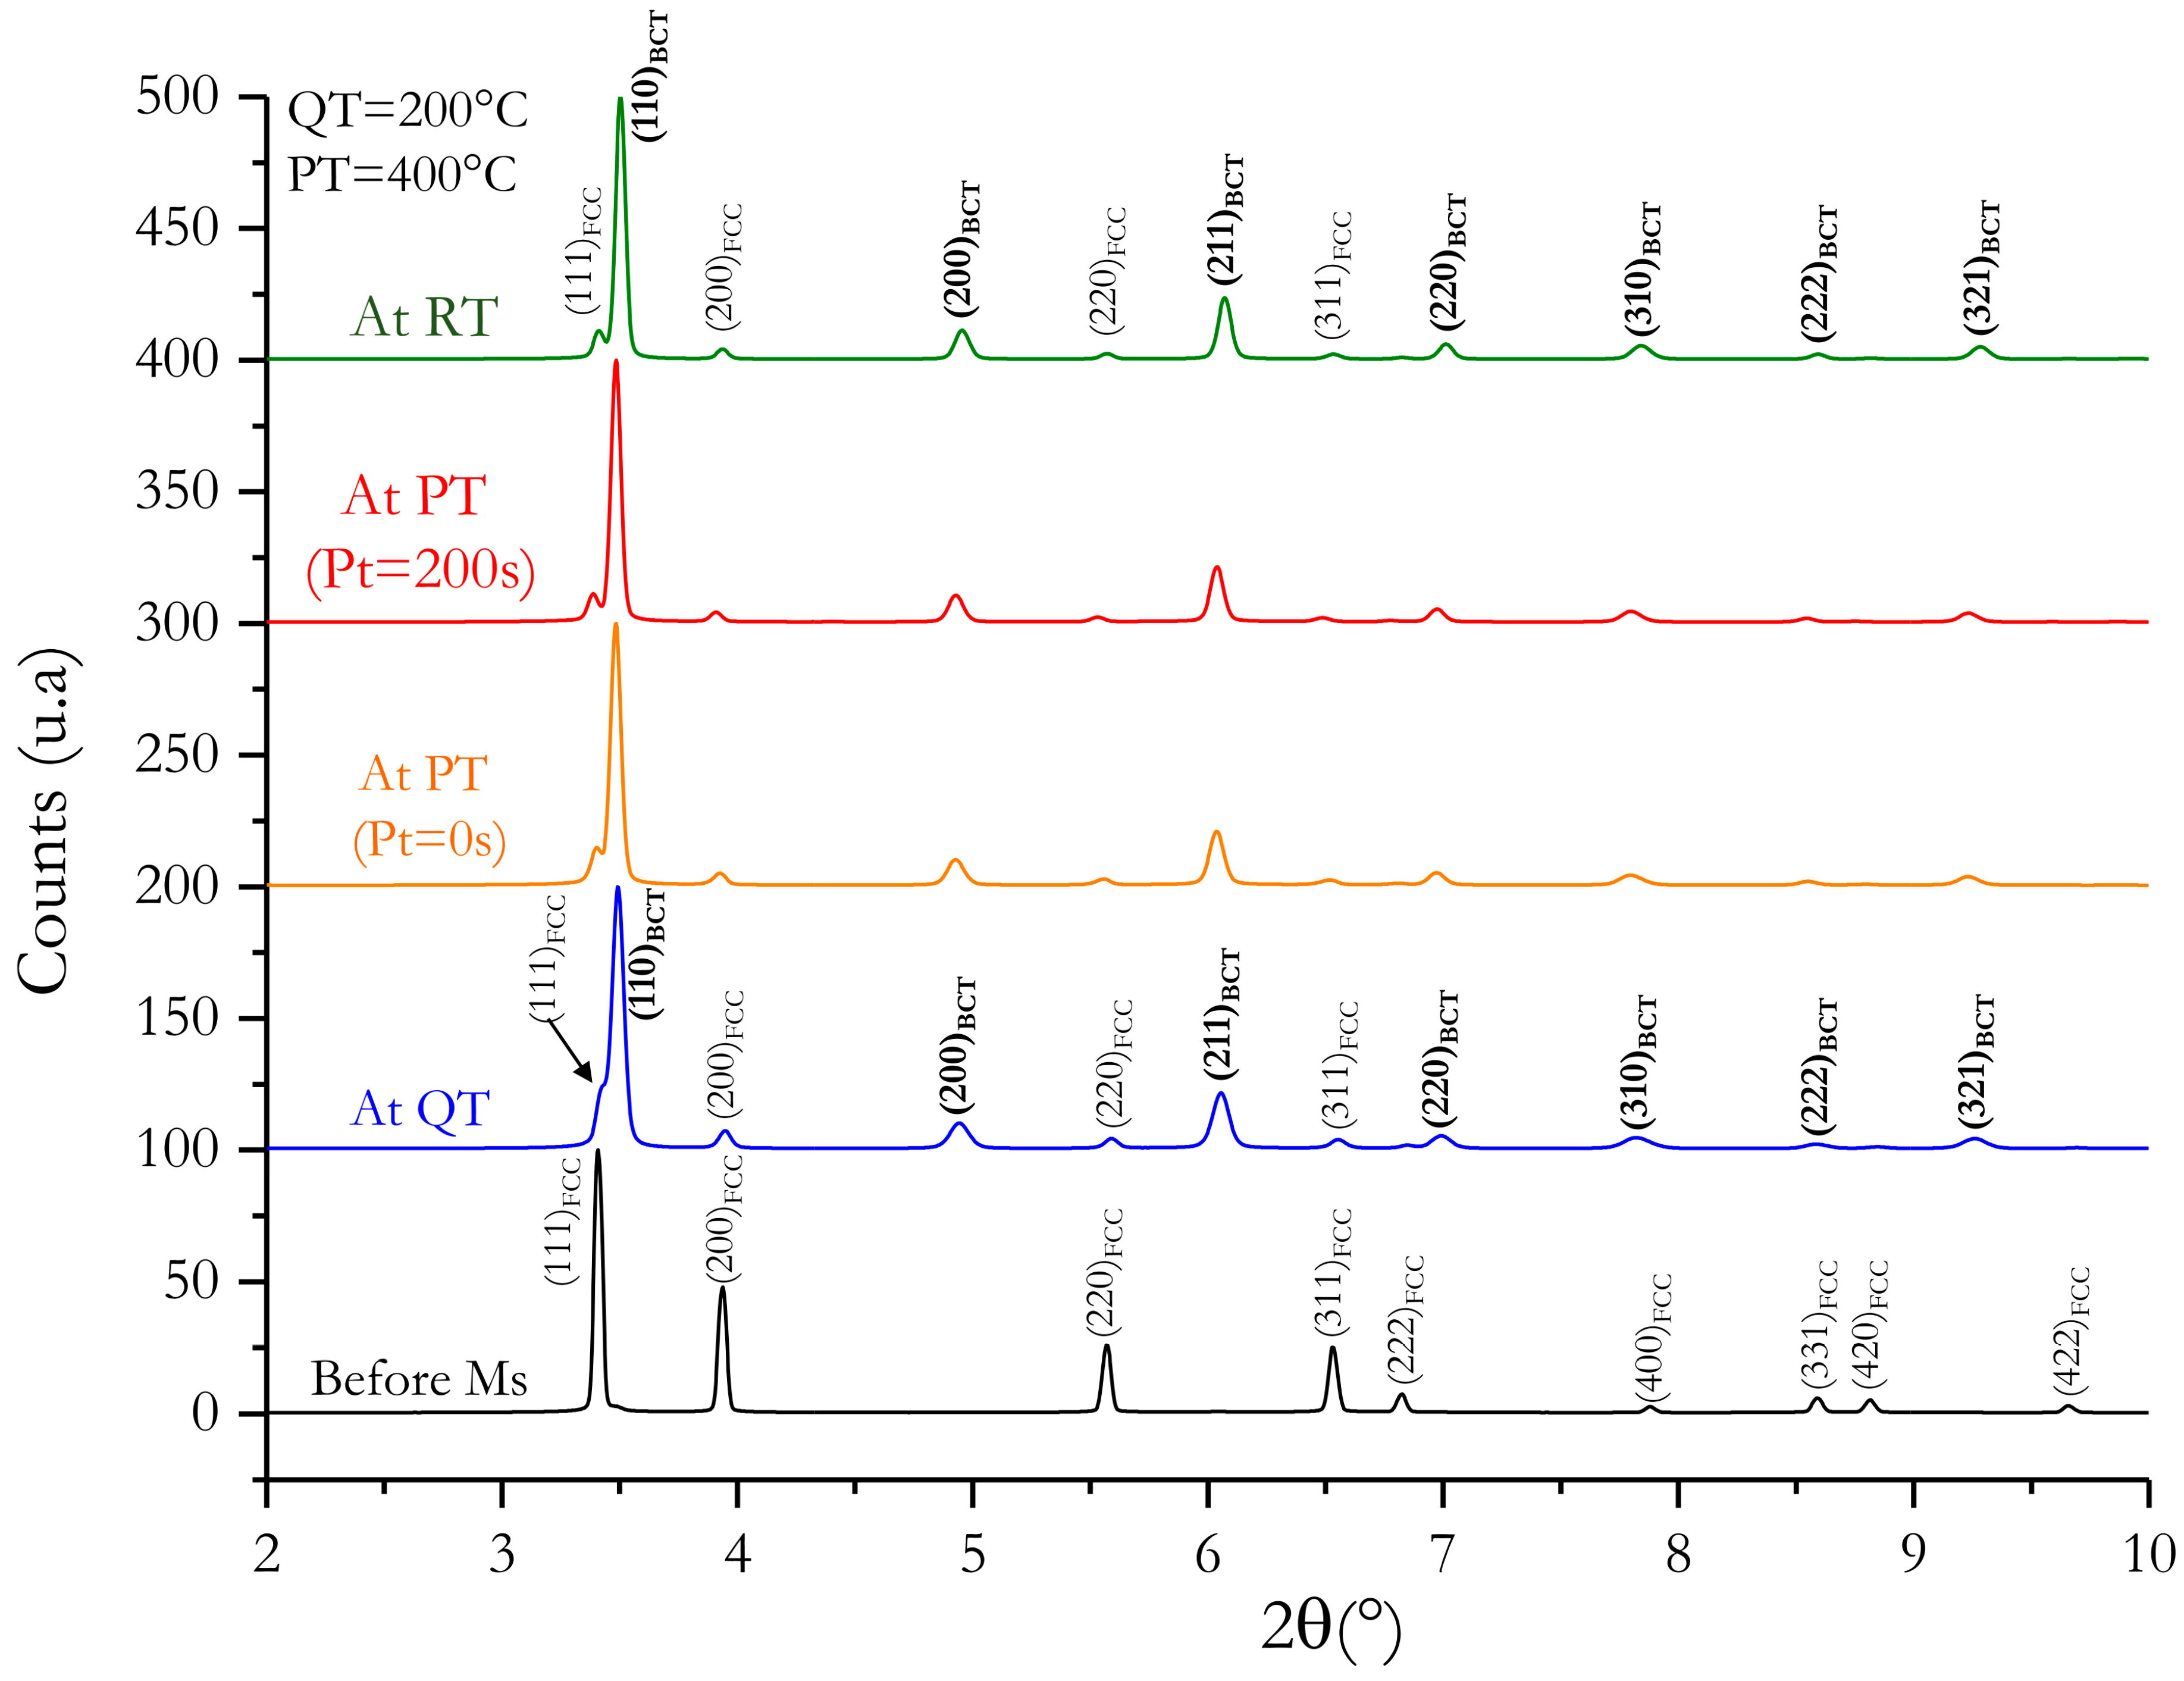
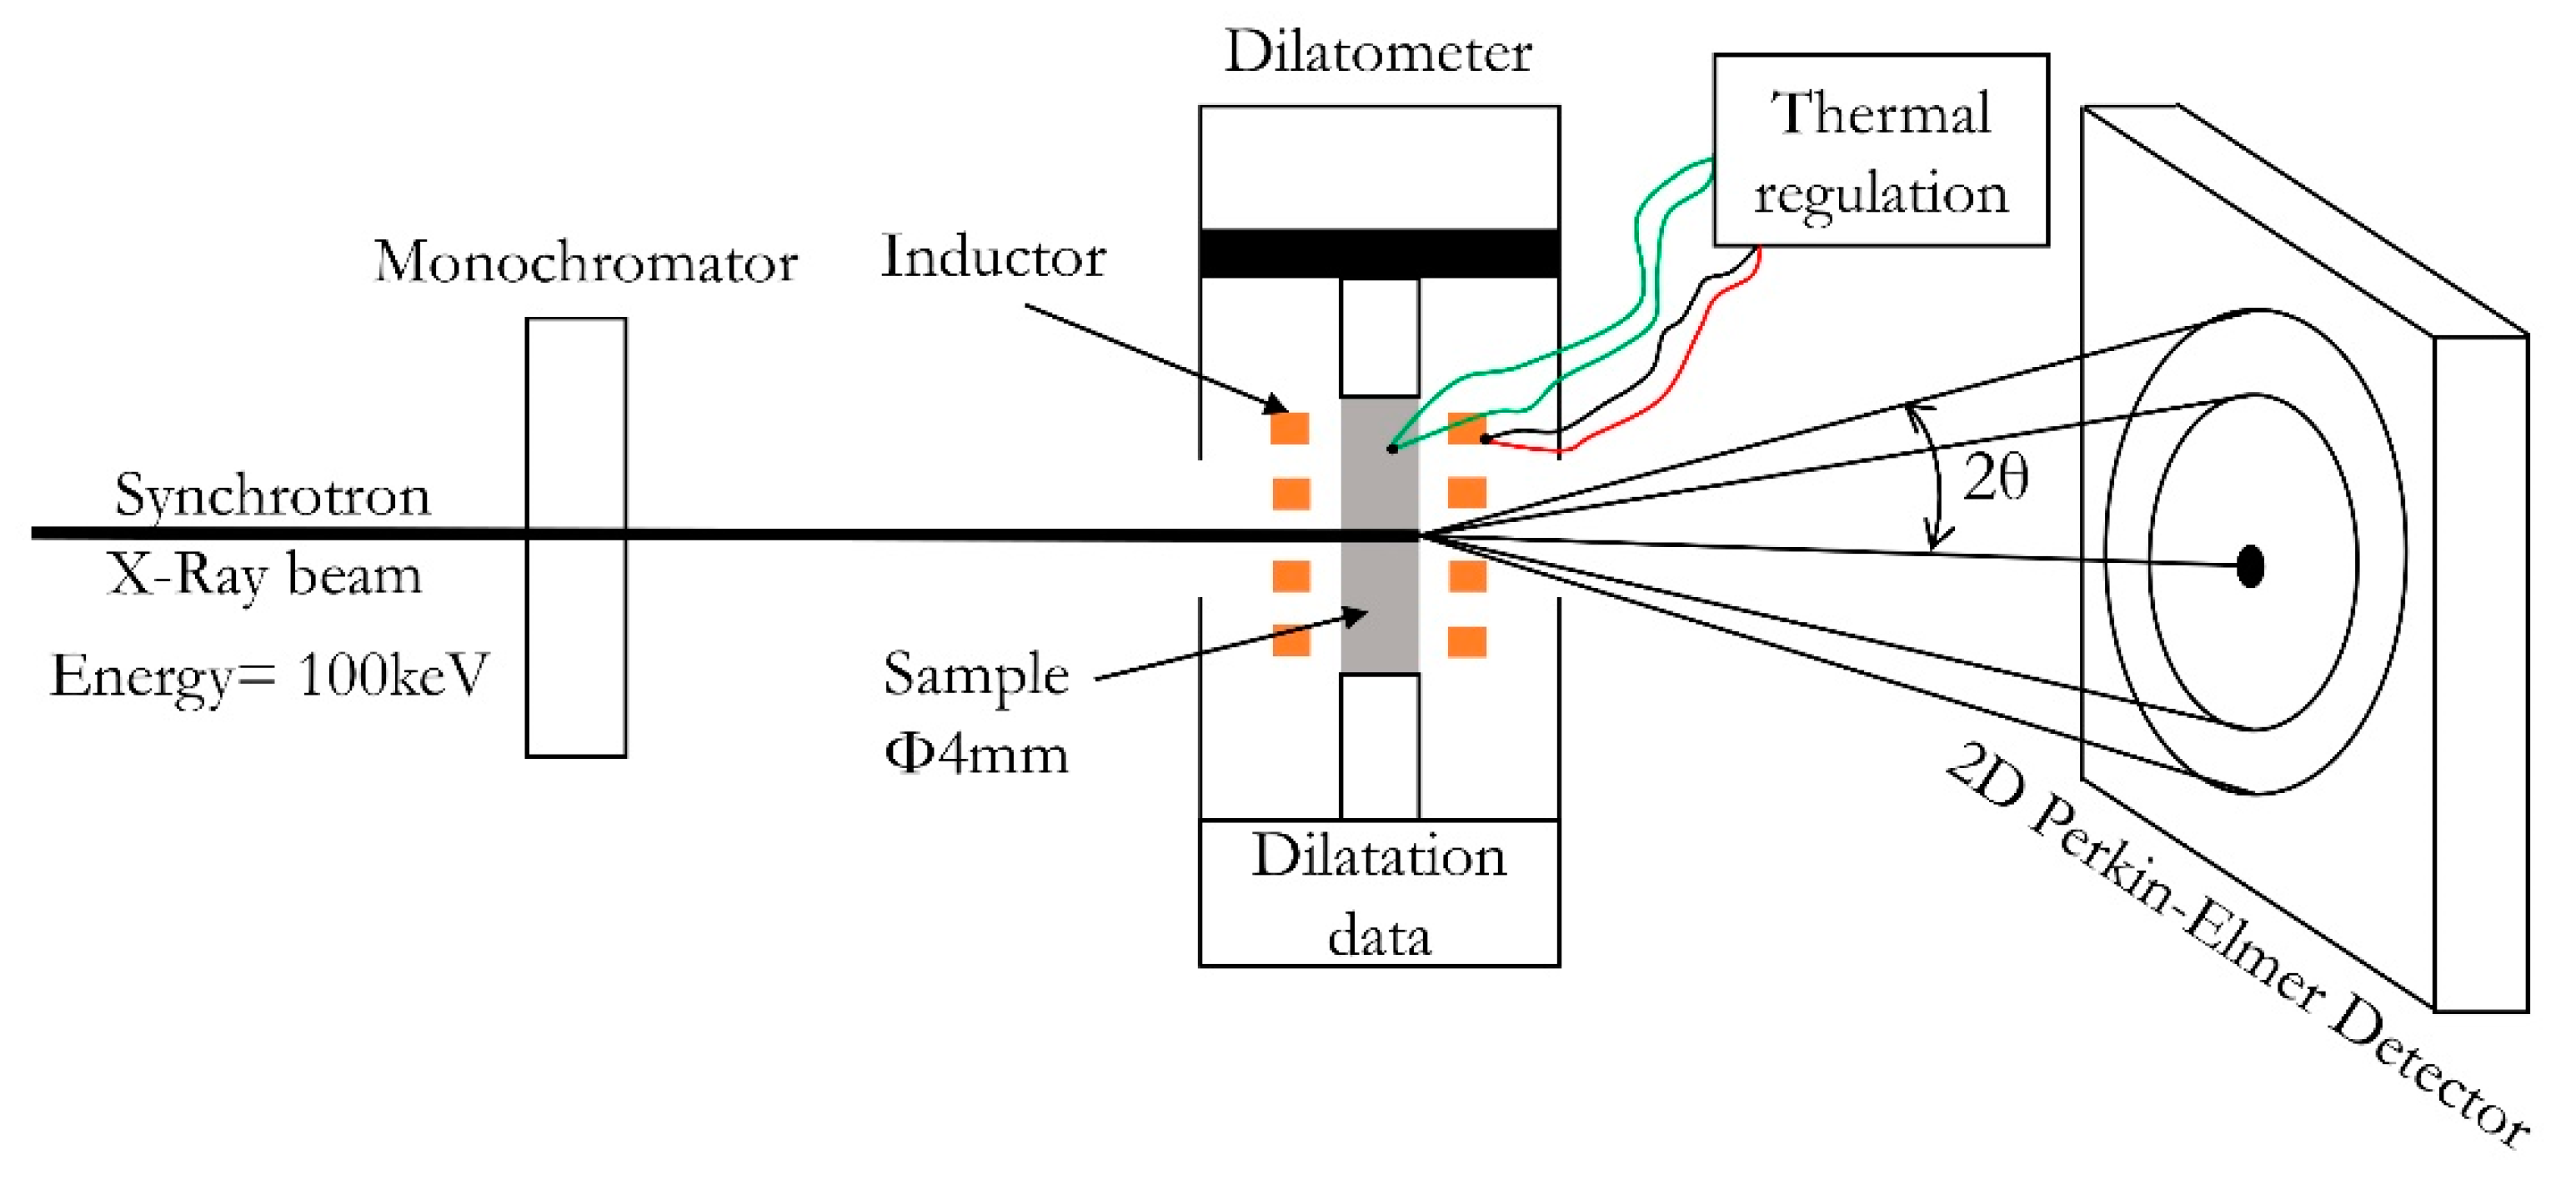
3.1. In Situ Investigation by High-Energy X-ray Diffraction Experiments

Key times during the Q&P treatment were chosen as shown in Figure 3, and the diffractograms corresponding to these points are shown in Figure 4.
The first diffractogram taken just before Ms (black dot on Figure 3 and black line on Figure 4) shows peaks characteristics of a FCC phase. Then, once under Ms and when QT is reached, the FCC peaks weakens, and peaks that can be characteristics of a BCT phase are observed.
The thermal path together with the phase fraction evolutions of austenite, martensite, and an unidentified phase called new BCT are given for the three QTs shown in Figure 5. The reference time (t = 0 s) is taken at the beginning of the initial quench from 900 °C.
The evolution of the phase fraction can be decomposed into several stages:
(1)
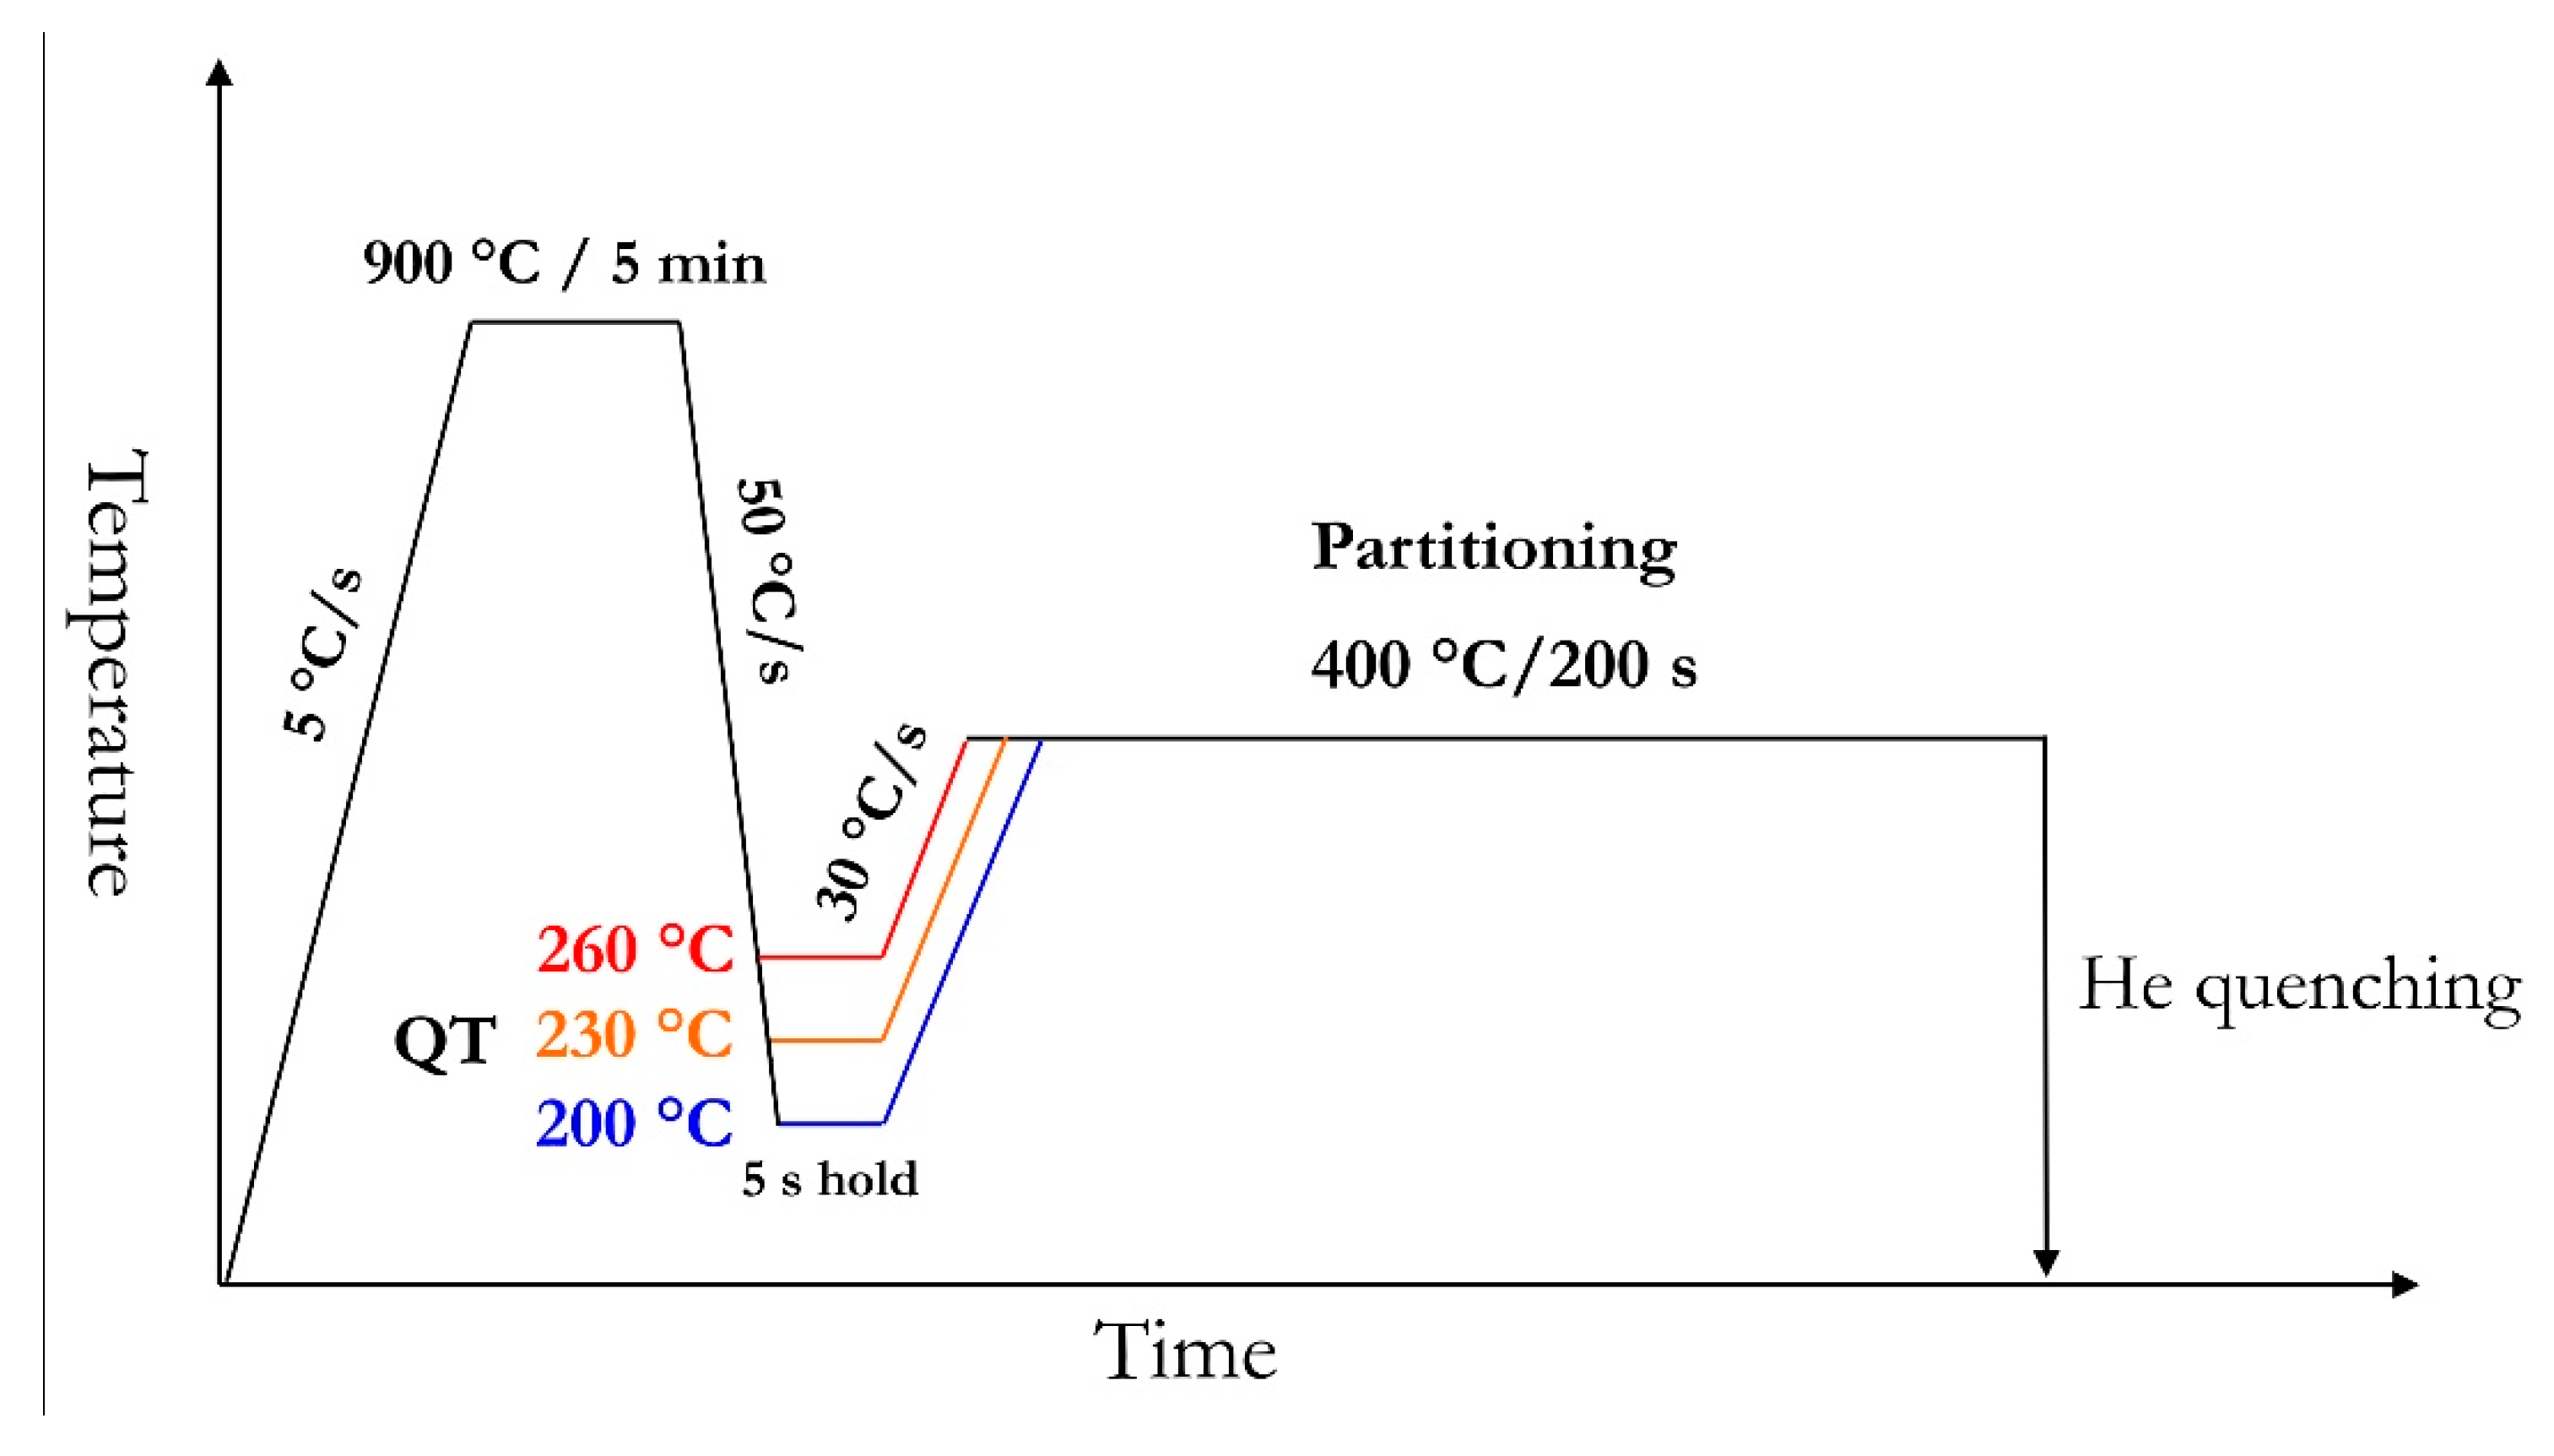
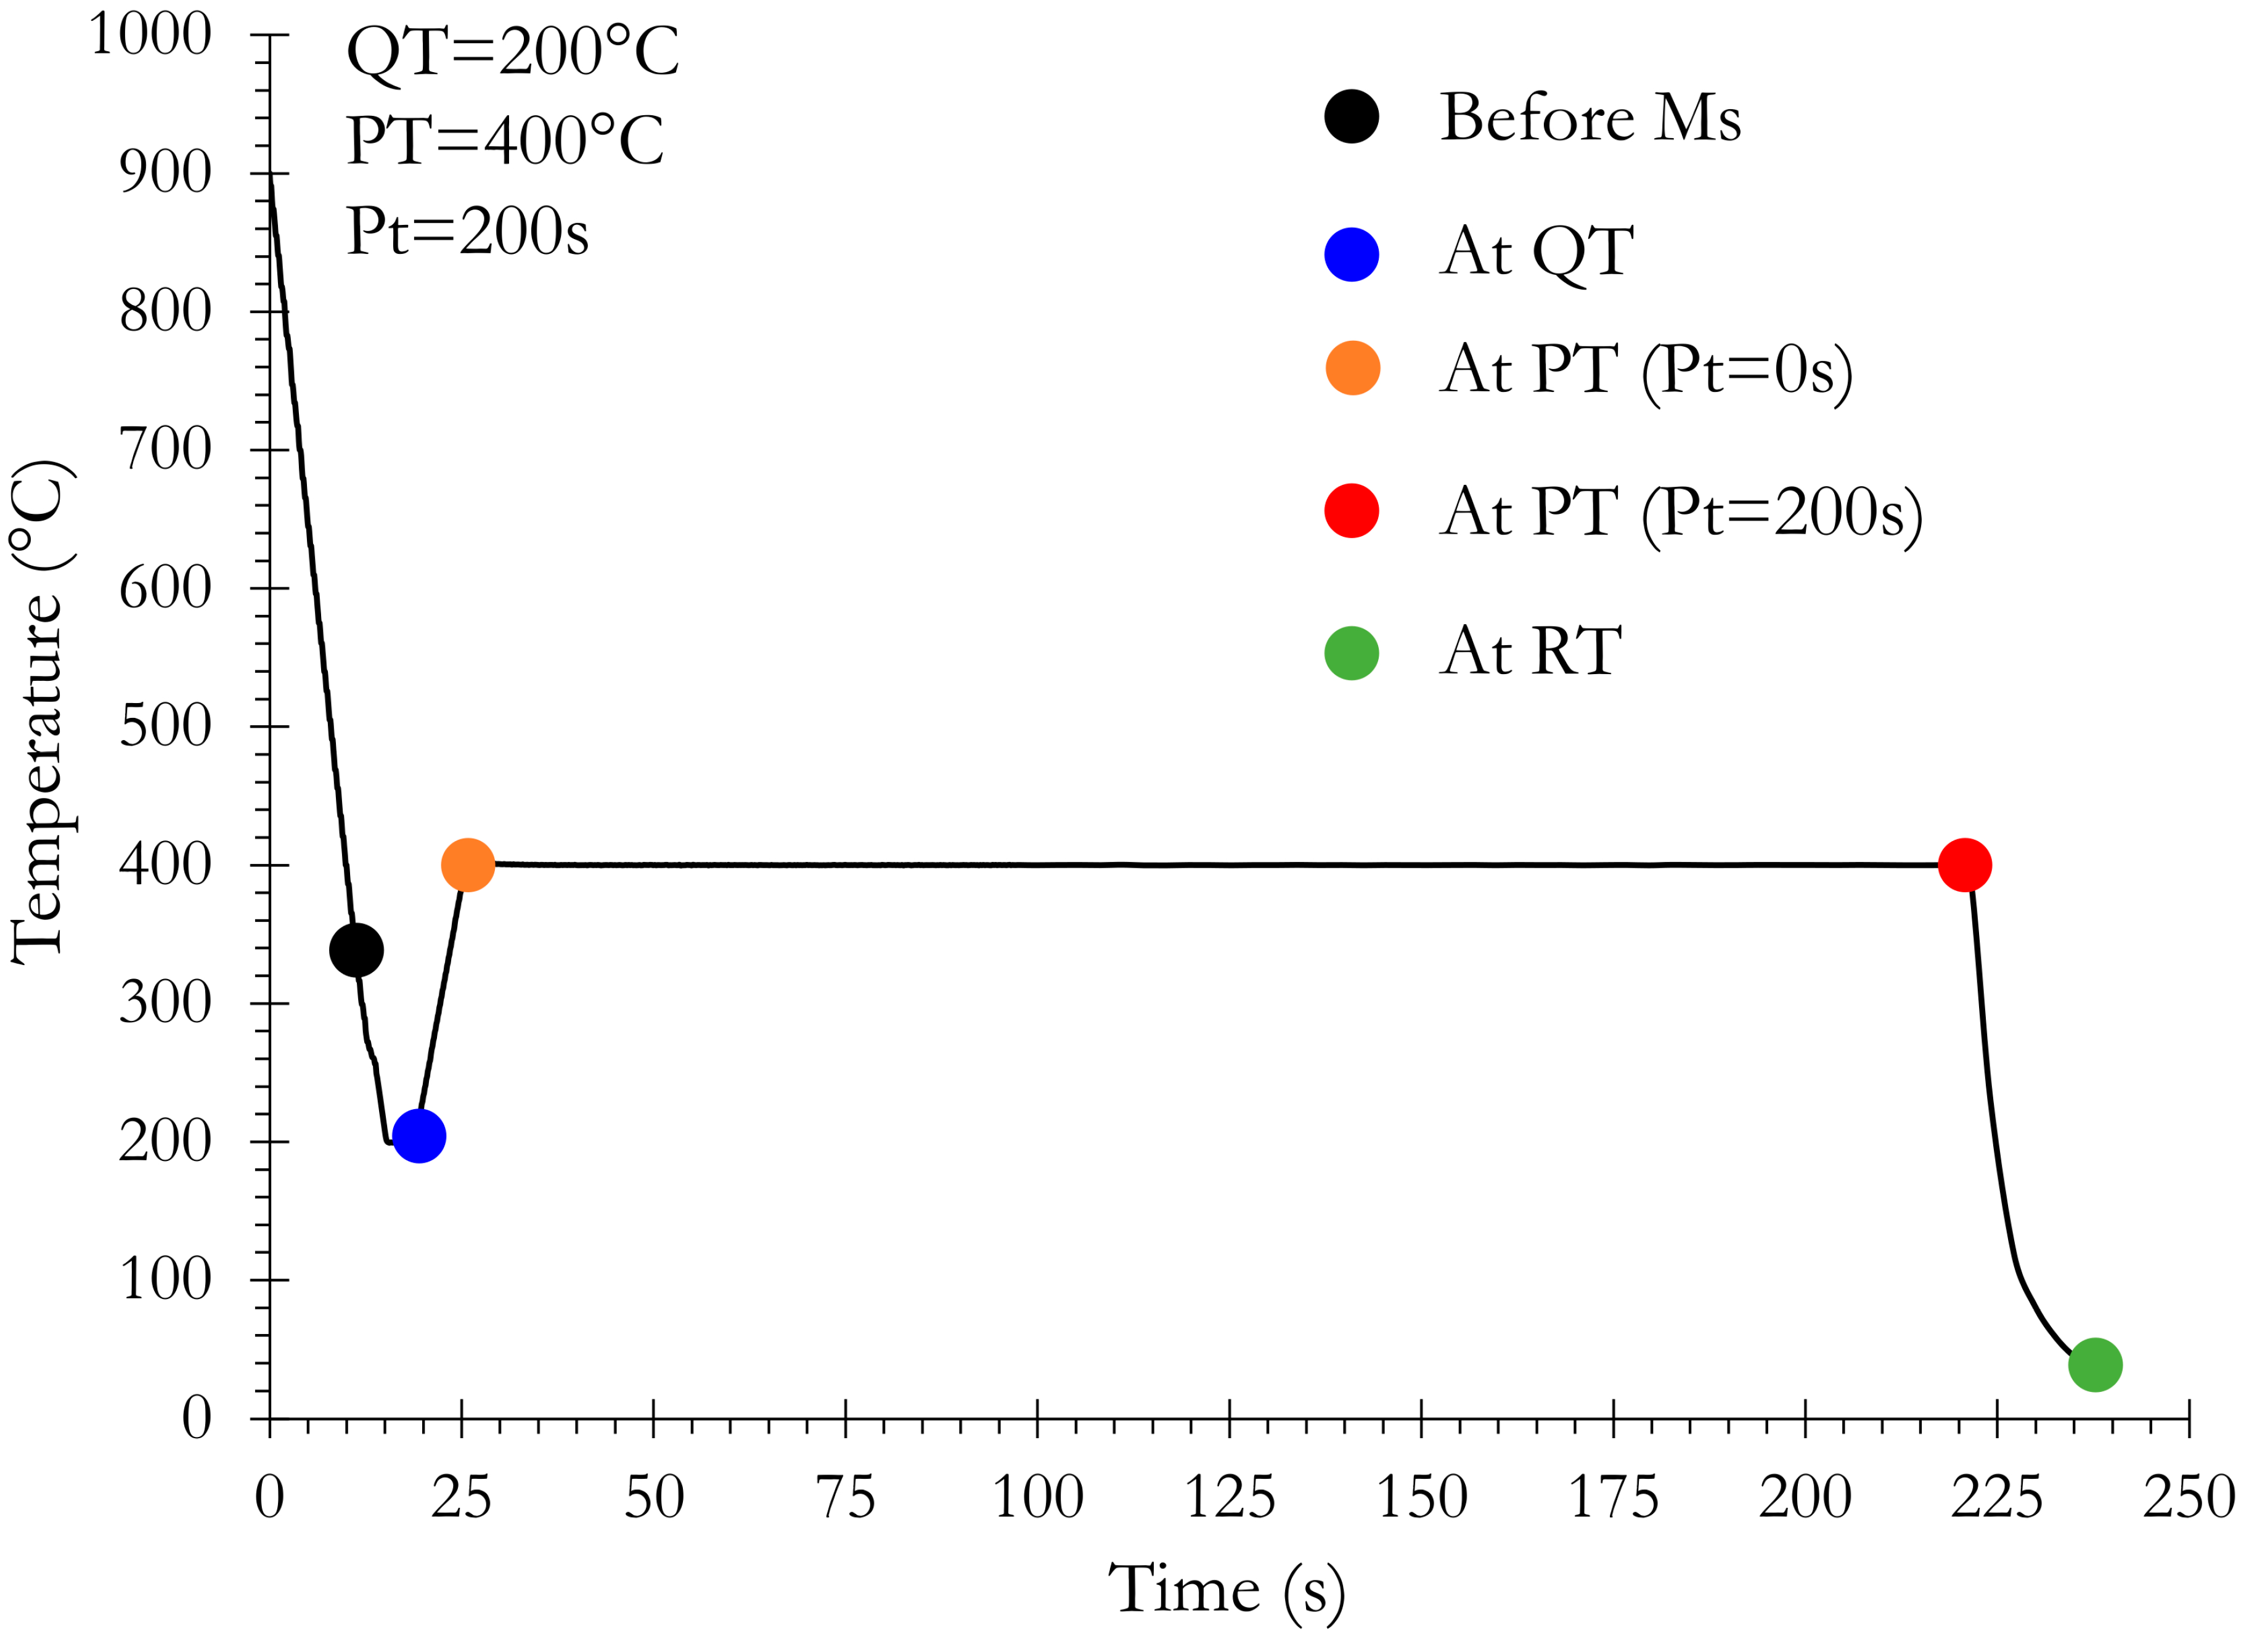
A quenching from the fully austenitic domain (900 °C) to a temperature Ms during which no phase transformation occurs,
(2)
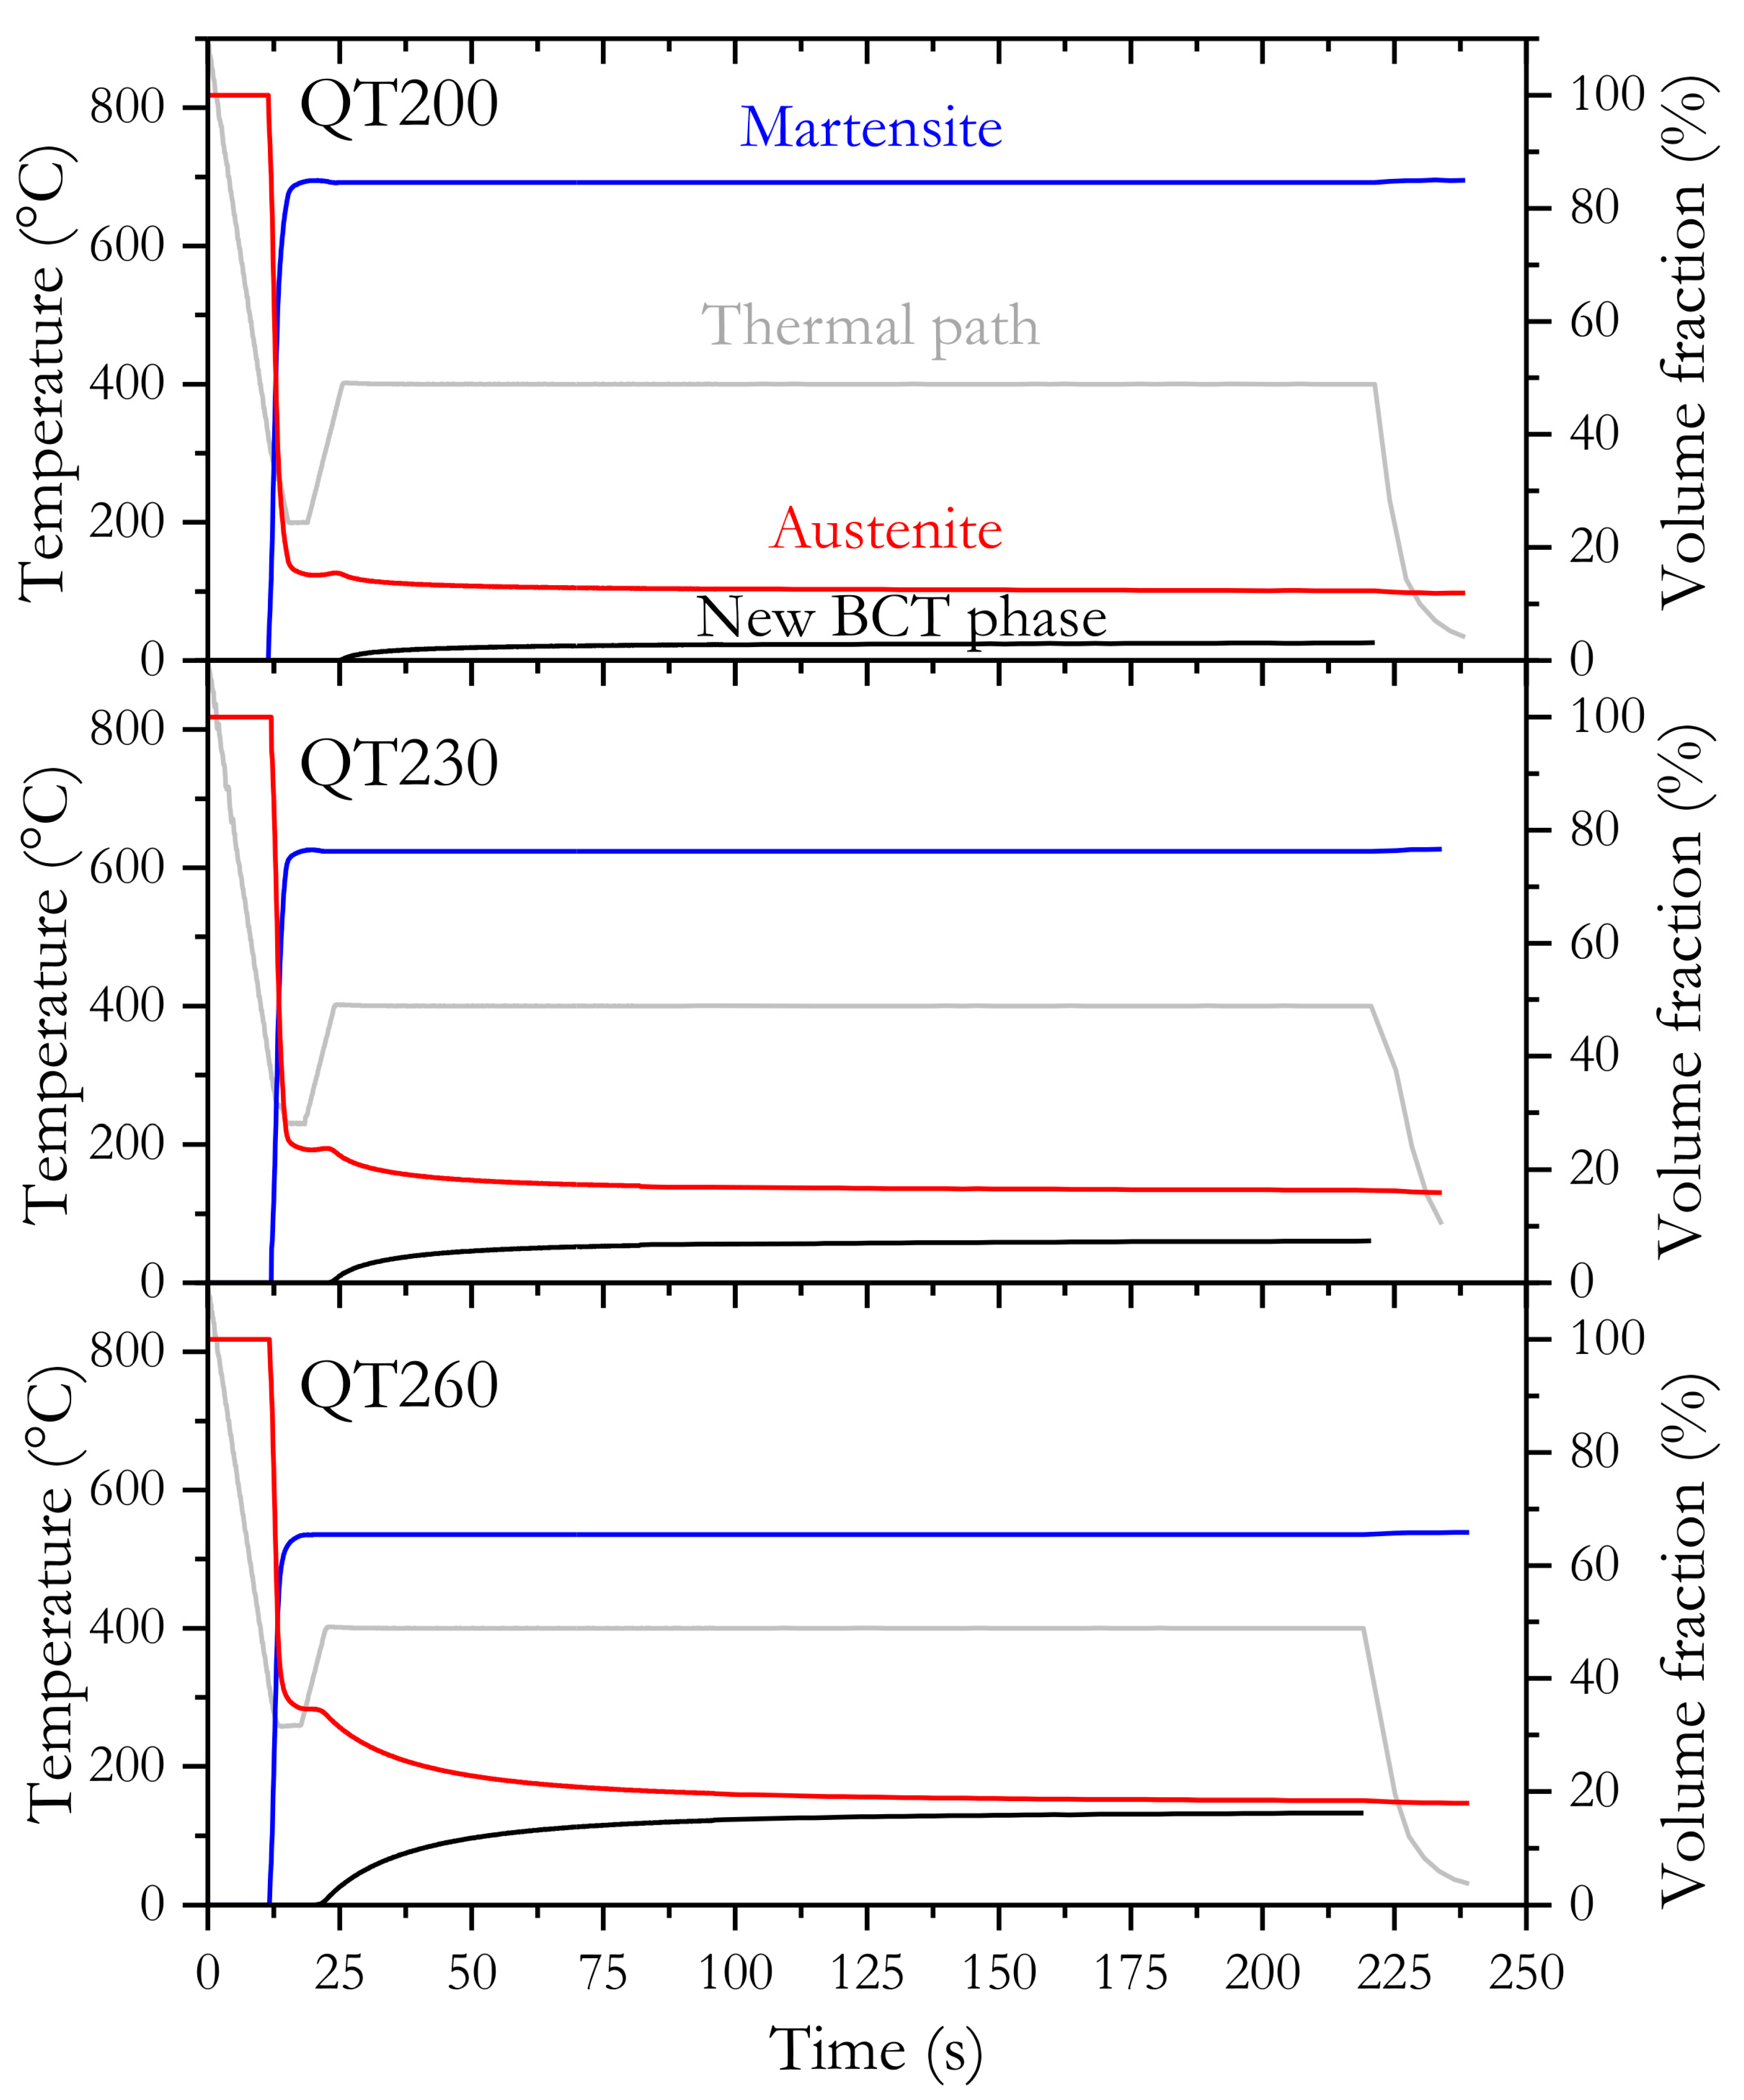
A temperature from Ms to QT (260, 230, and 200 °C) during which a significant increase in the BCT phase at the expense of austenite occurs. Martensite starts to form during the initial quench to QT at 324 °C, 301 °C, and 315 °C for respectively QT200, QT230, and QT260. At the end of the QT step, once the temperature of the sample is homogenized, the initial volume fraction of martensite depends on the following QTs: 85% at QT200, 76% at QT230, and 65% at QT260. The rate of this transformation is very fast in the first stages and becomes more sluggish at the final stage. This behavior has already been observed by [15] and was attributed to martensite transformation. Furthermore, the measured martensite start temperature (Ms) corresponds perfectly to the Ms temperature measured by dilatometry for the same alloy and in the same conditions of cooling [16] as calculated from empirical equations proposed by [17].
(3)
A stagnant stage during reheating from the QT in which the microstructural state remains globally unchanged. The duration of this stage, clearly visible on the evolution of austenite fraction, is longer with the decreasing QT.
(4)
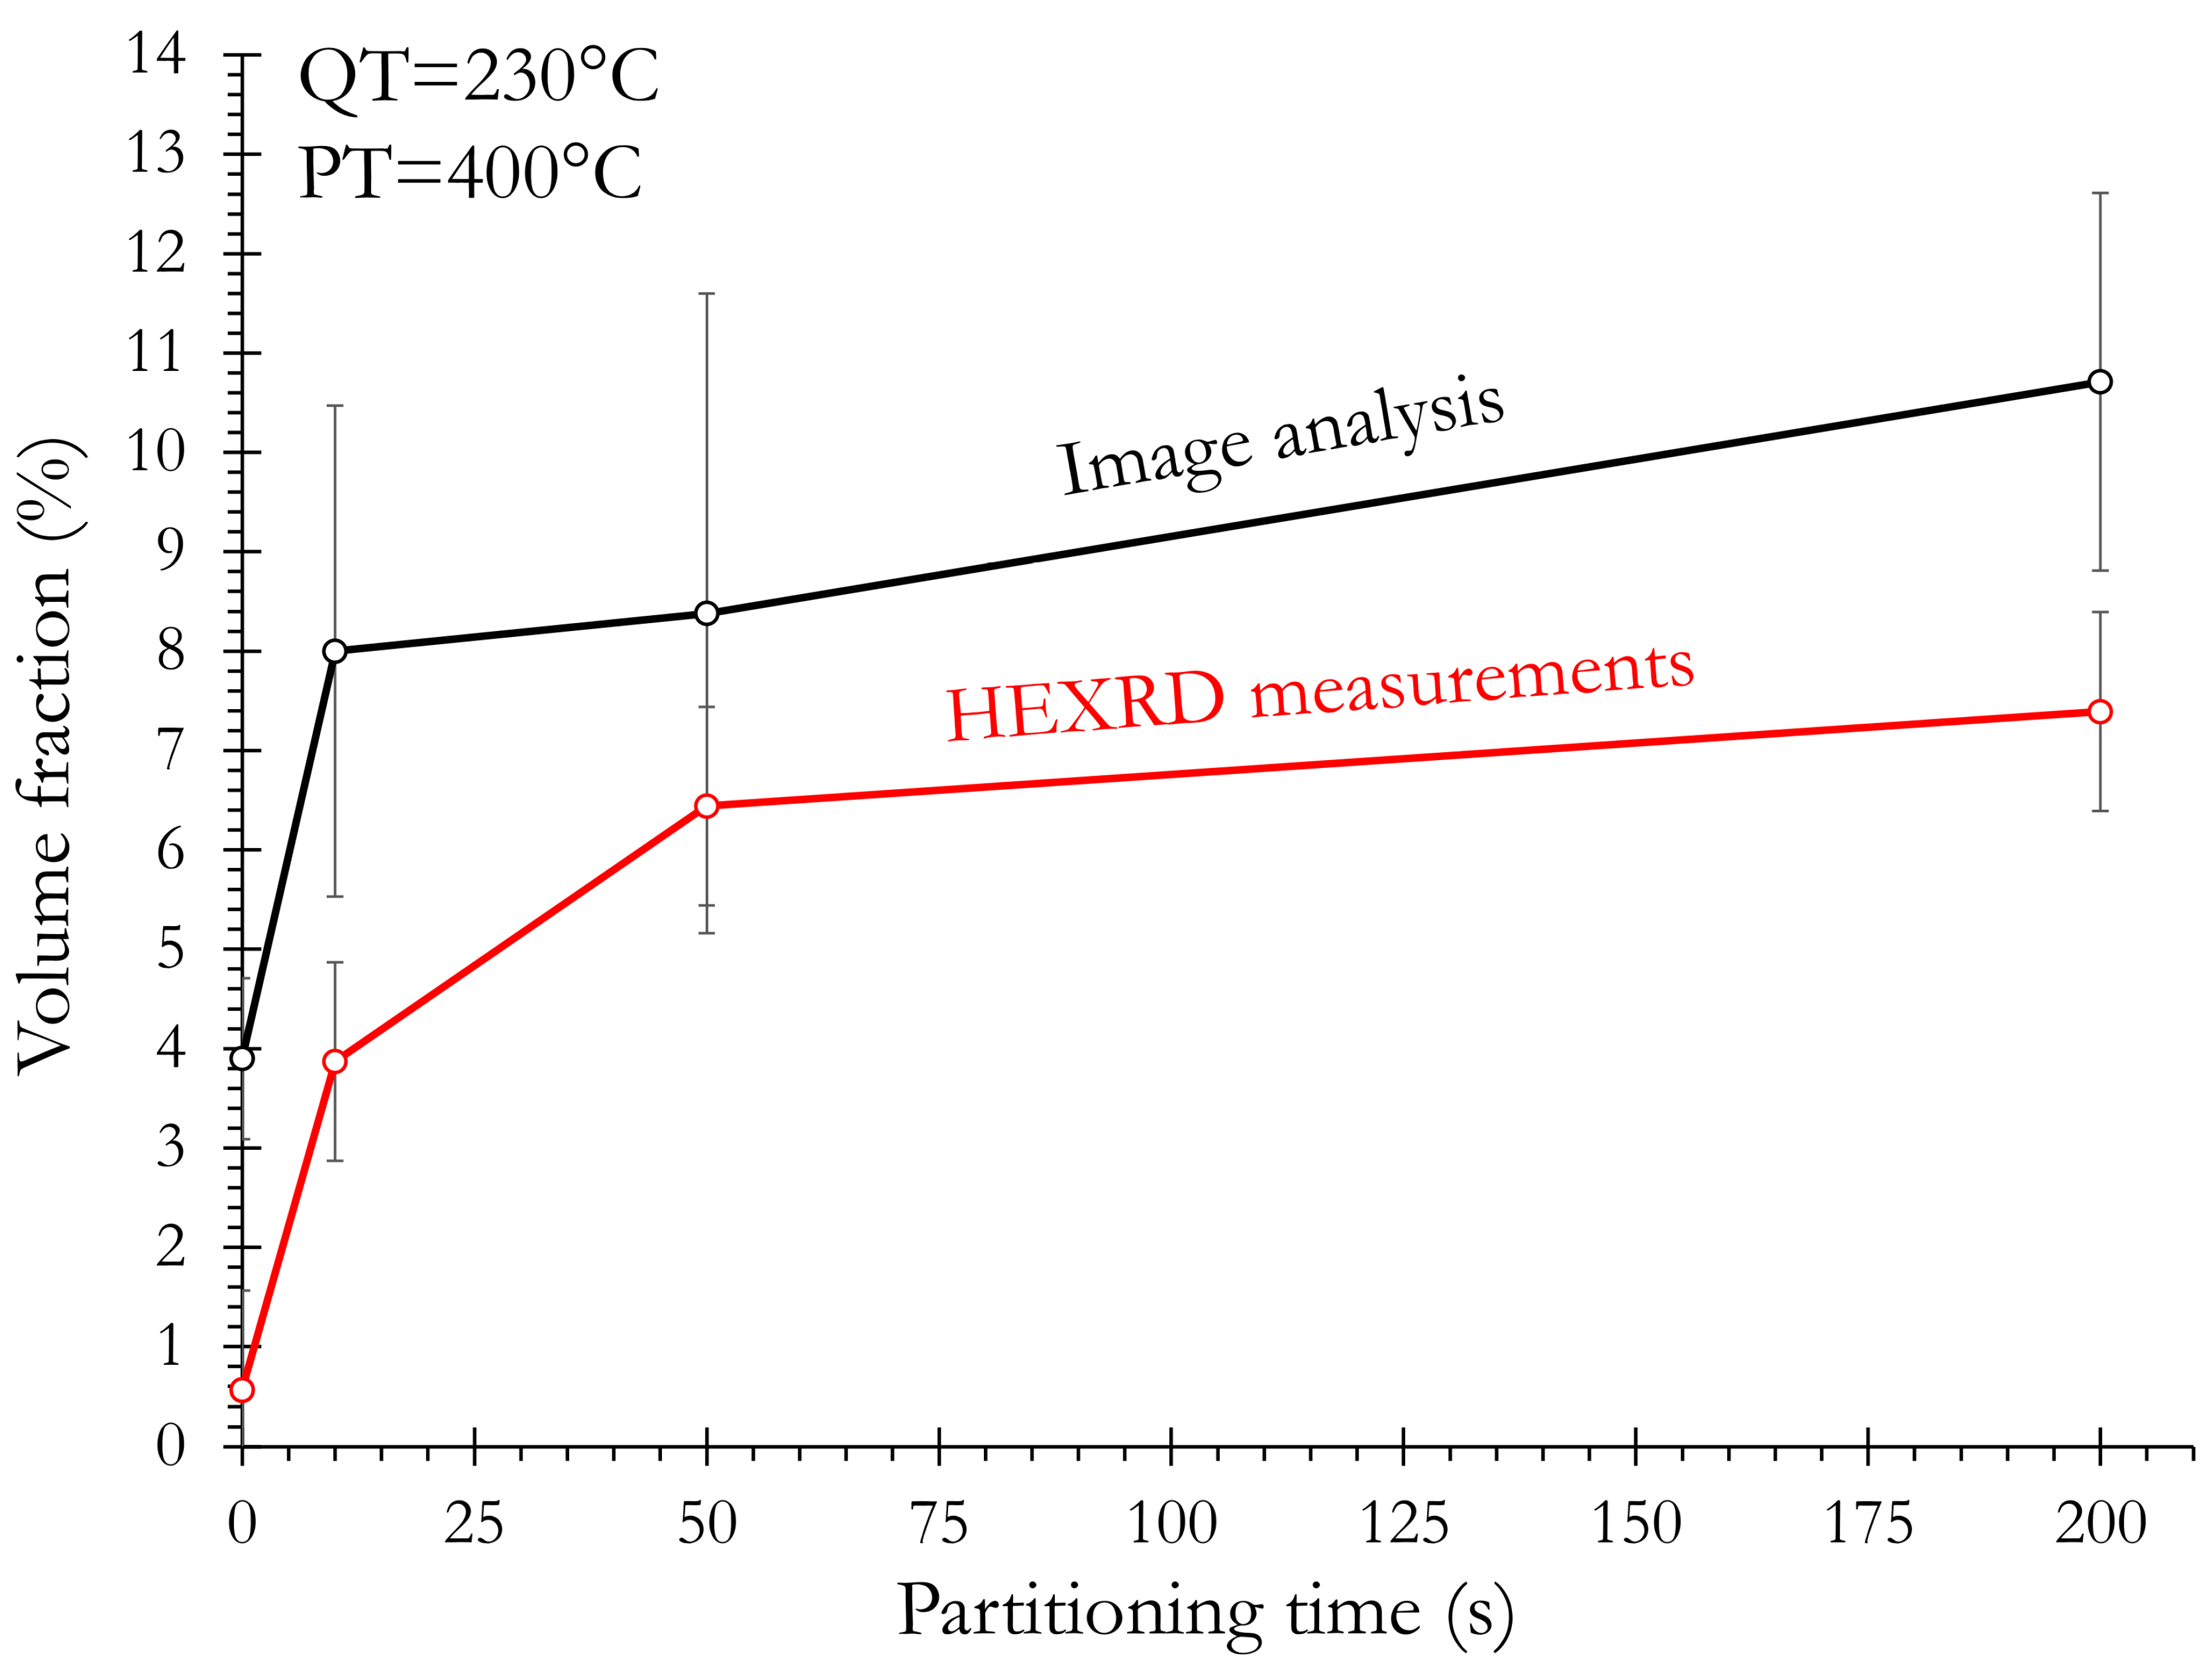
A significant and slow increase in a new BCT phase fraction at the expense of austenite occurs during both reheating and the partitioning step. The nature of this new BCT phase is subject to much debate as it can be either bainite, isothermal martensite, or the marker of the motion of the α’/γ interface. We shall return more deeply to this point later.
In order to go further, both the kinetics of the new BCT phase fraction and the amount of austenite transformed into the new BCT phase (i.e., the transformation rate) are given in Figure 6 as a function of QT.
It is worth noting that the new BCT phase starts to form during reheating for the three QTs and the lower the QT, the higher the temperature for its formation. The new BCT start temperatures (i.e., when an increase in the BCT phase fraction is measured while the martensite transformation is over) for the three QTs are given in Table 1. The transformation rate, which is a better indicator than the intrinsic volume fraction, depends on the QT. It is shown to decrease with the decreasing QT, from 45% at QT = 260 °C to 20% at QT = 200 °C. For the three QTs studied, the major part of the new BCT is formed within a very short time: 75% is formed within 28 s, 24 s, and 30 s respectively for QT200, QT230, and QT260.

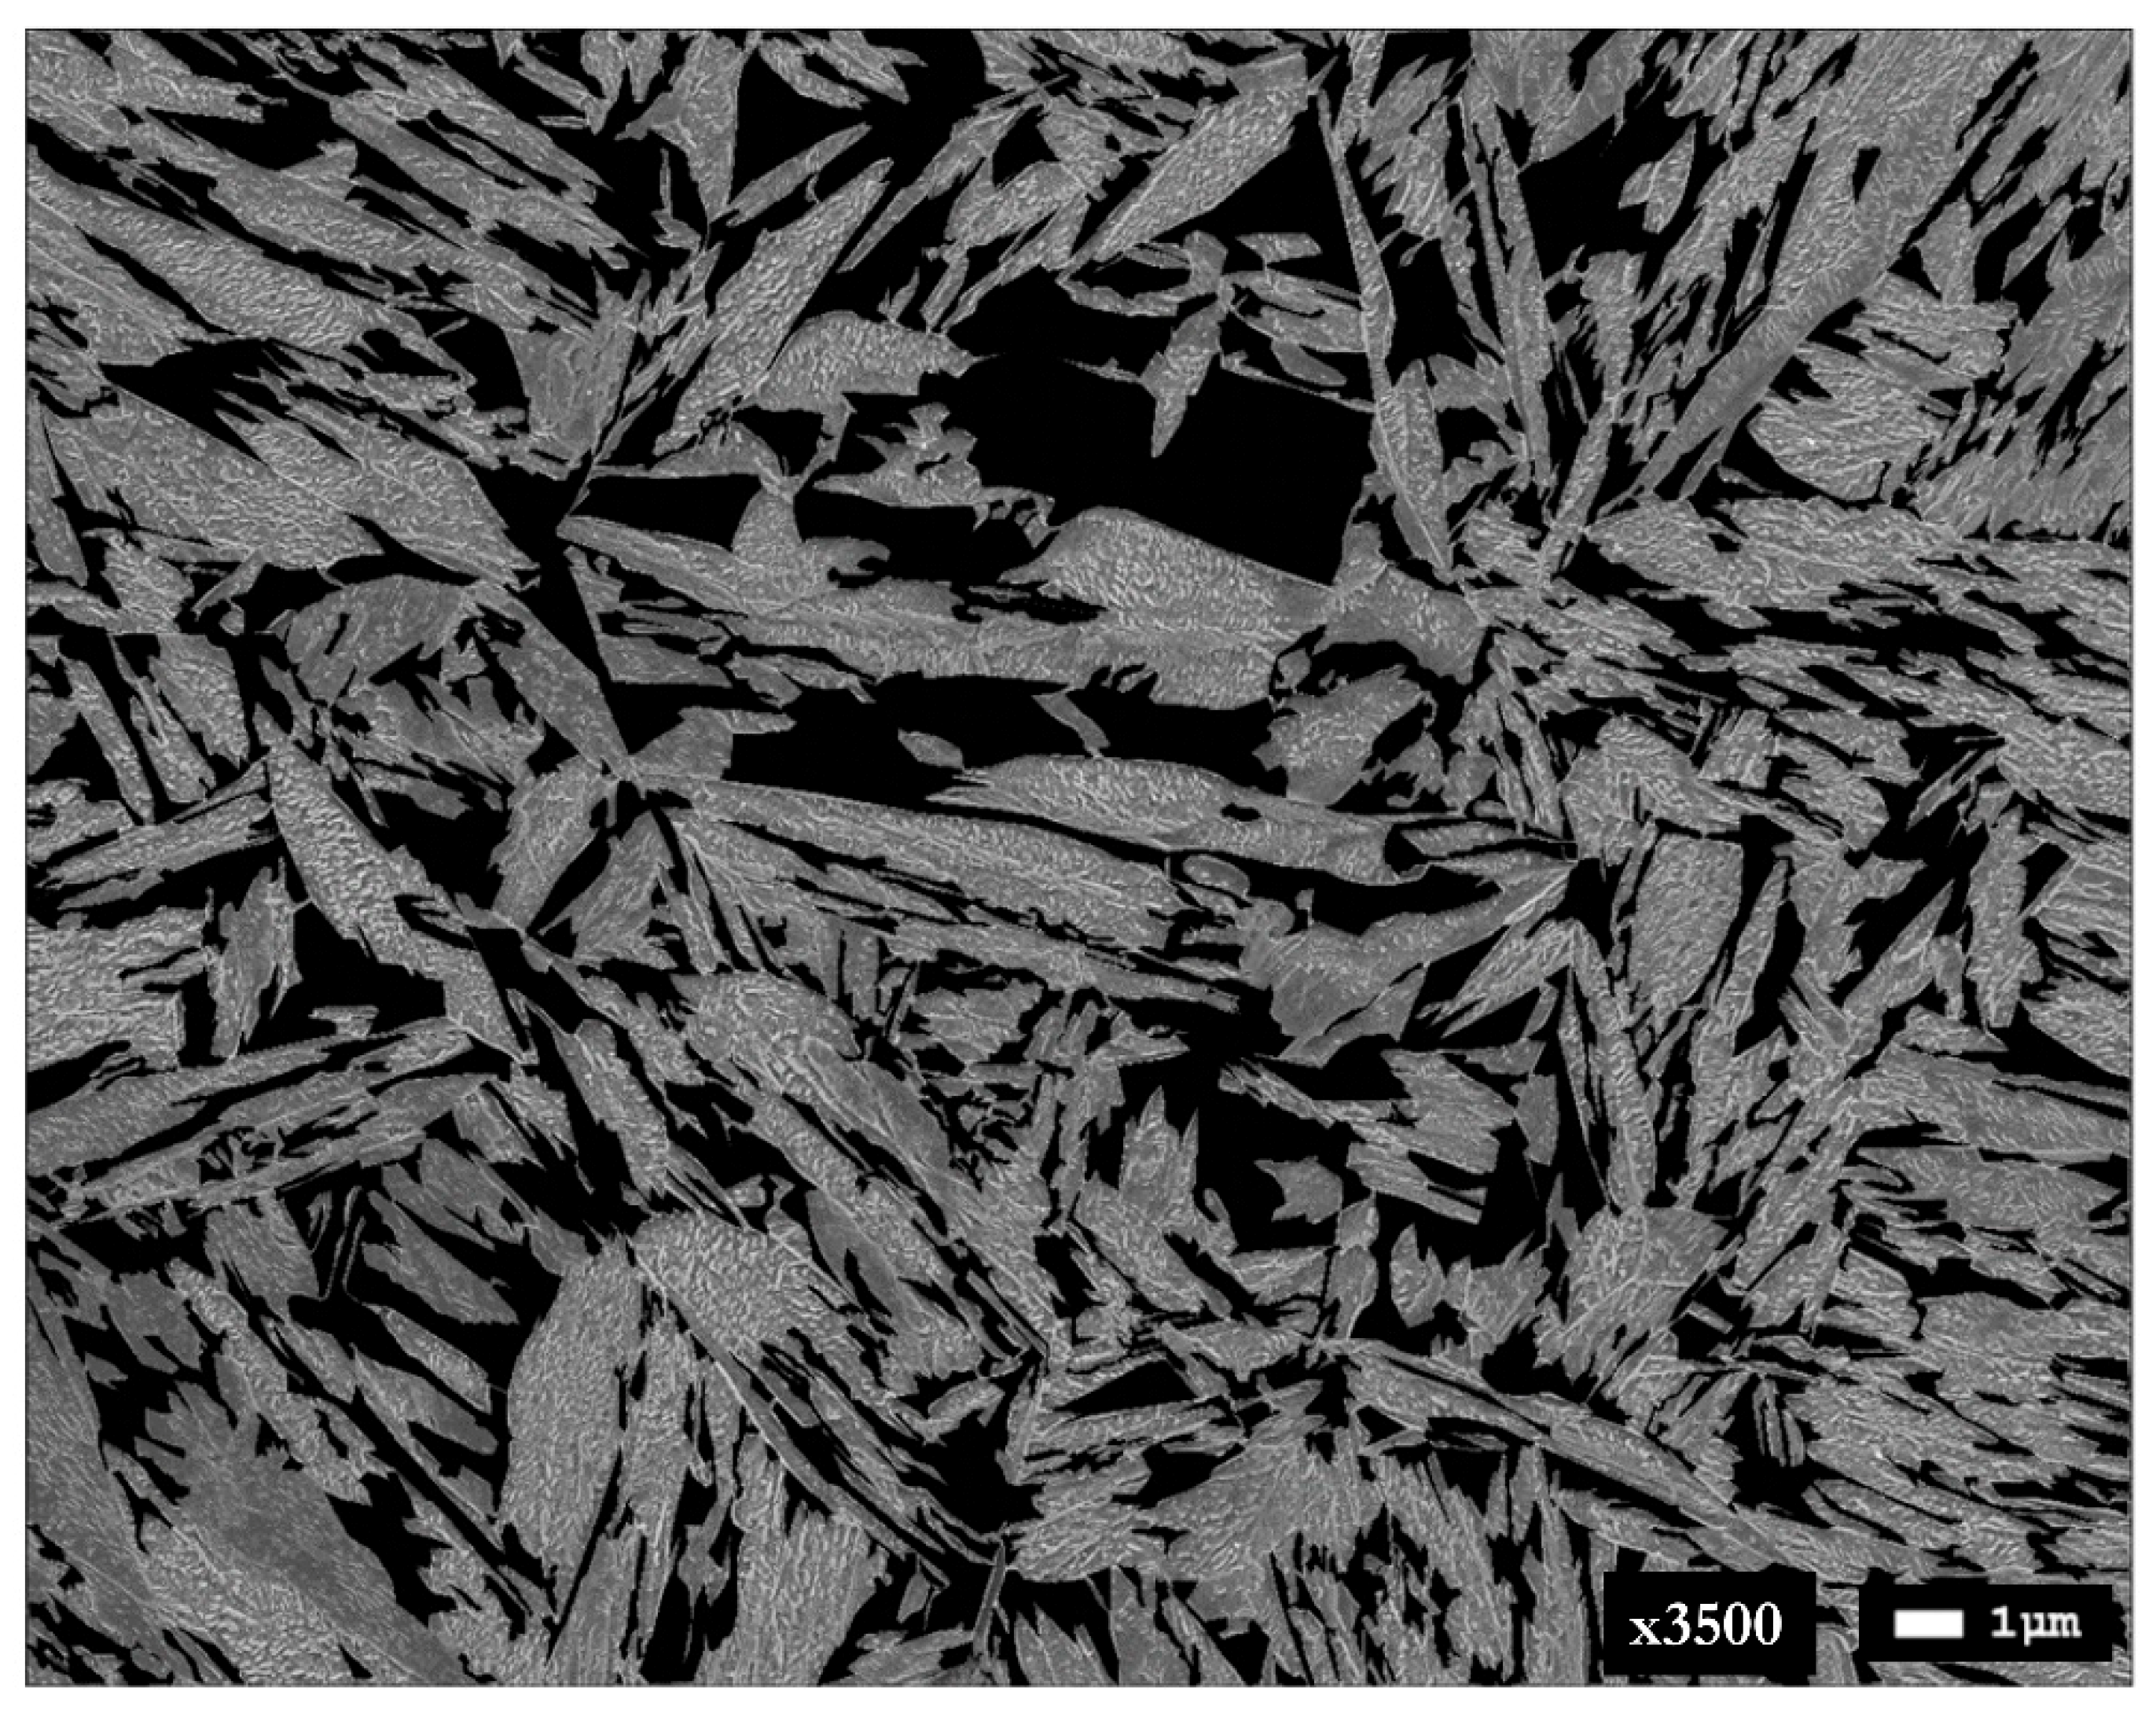
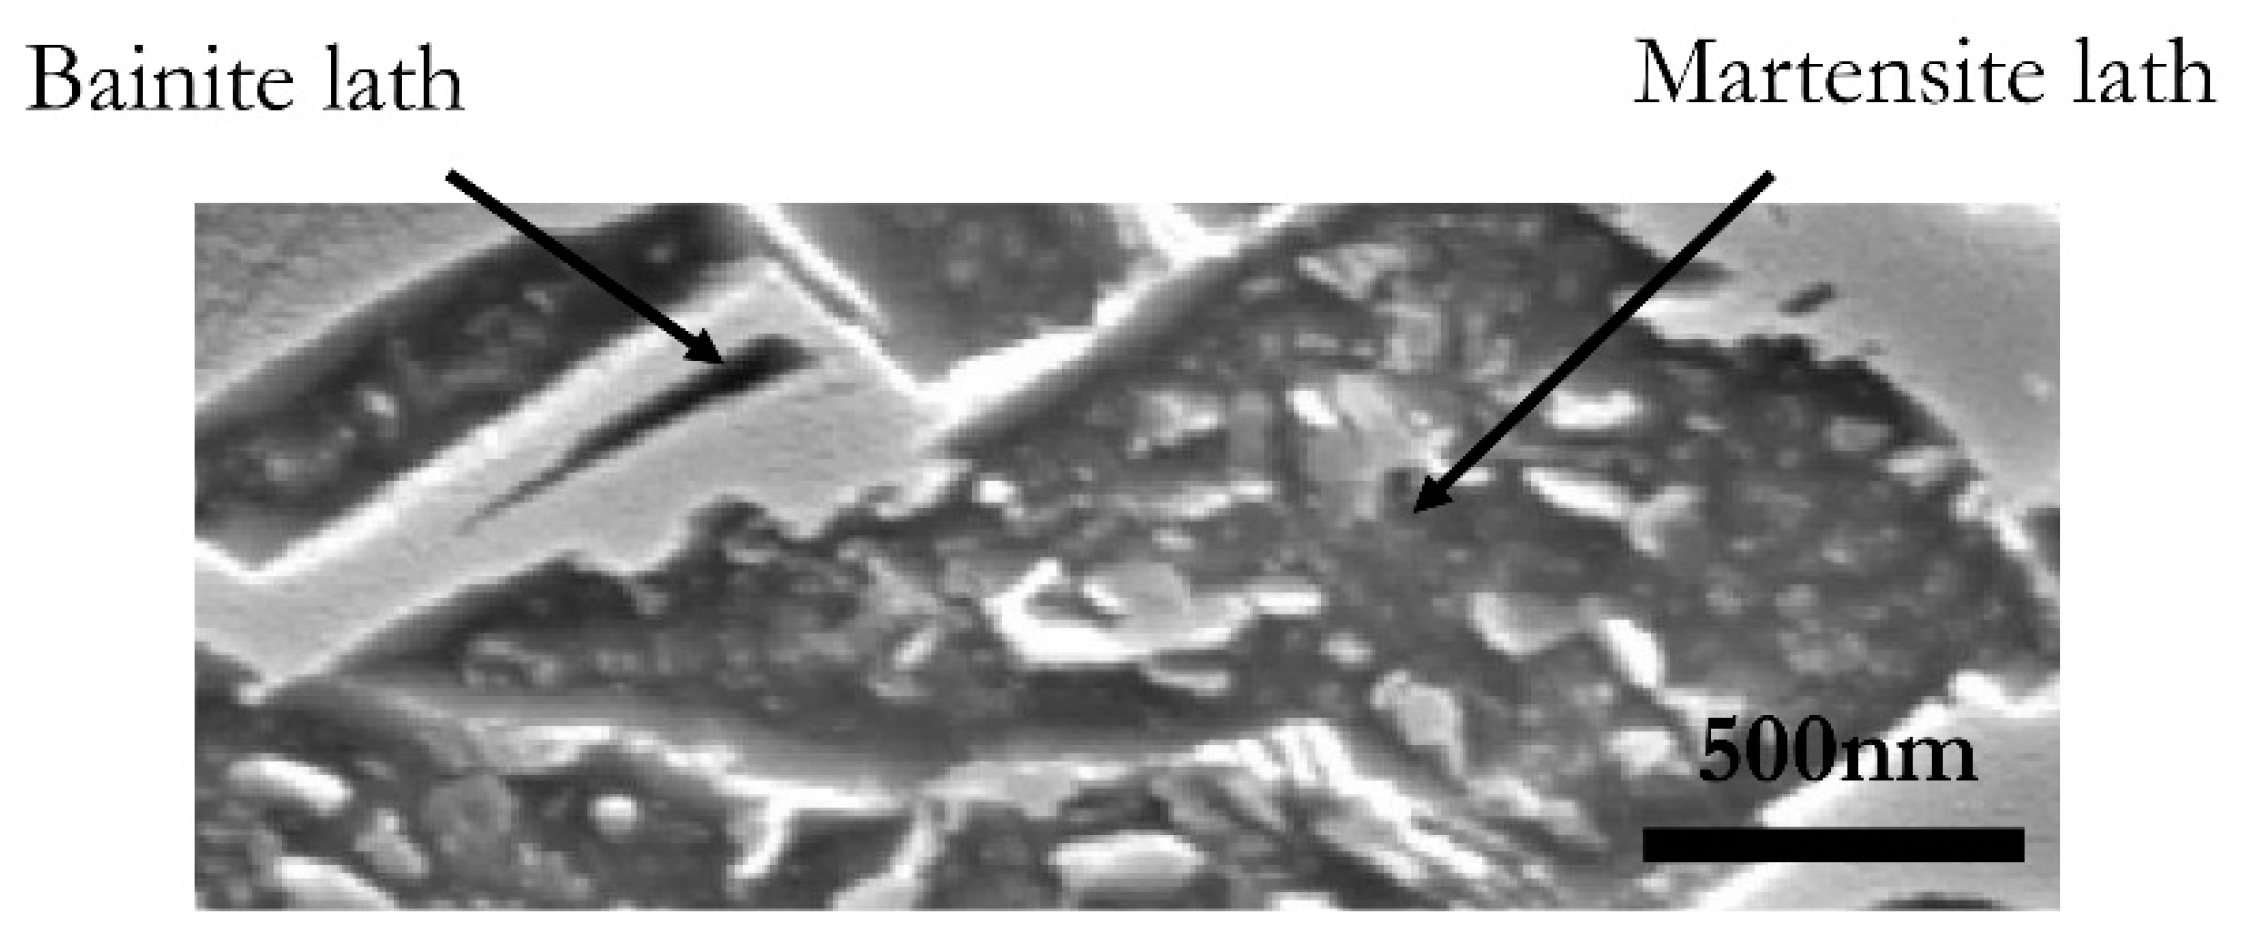
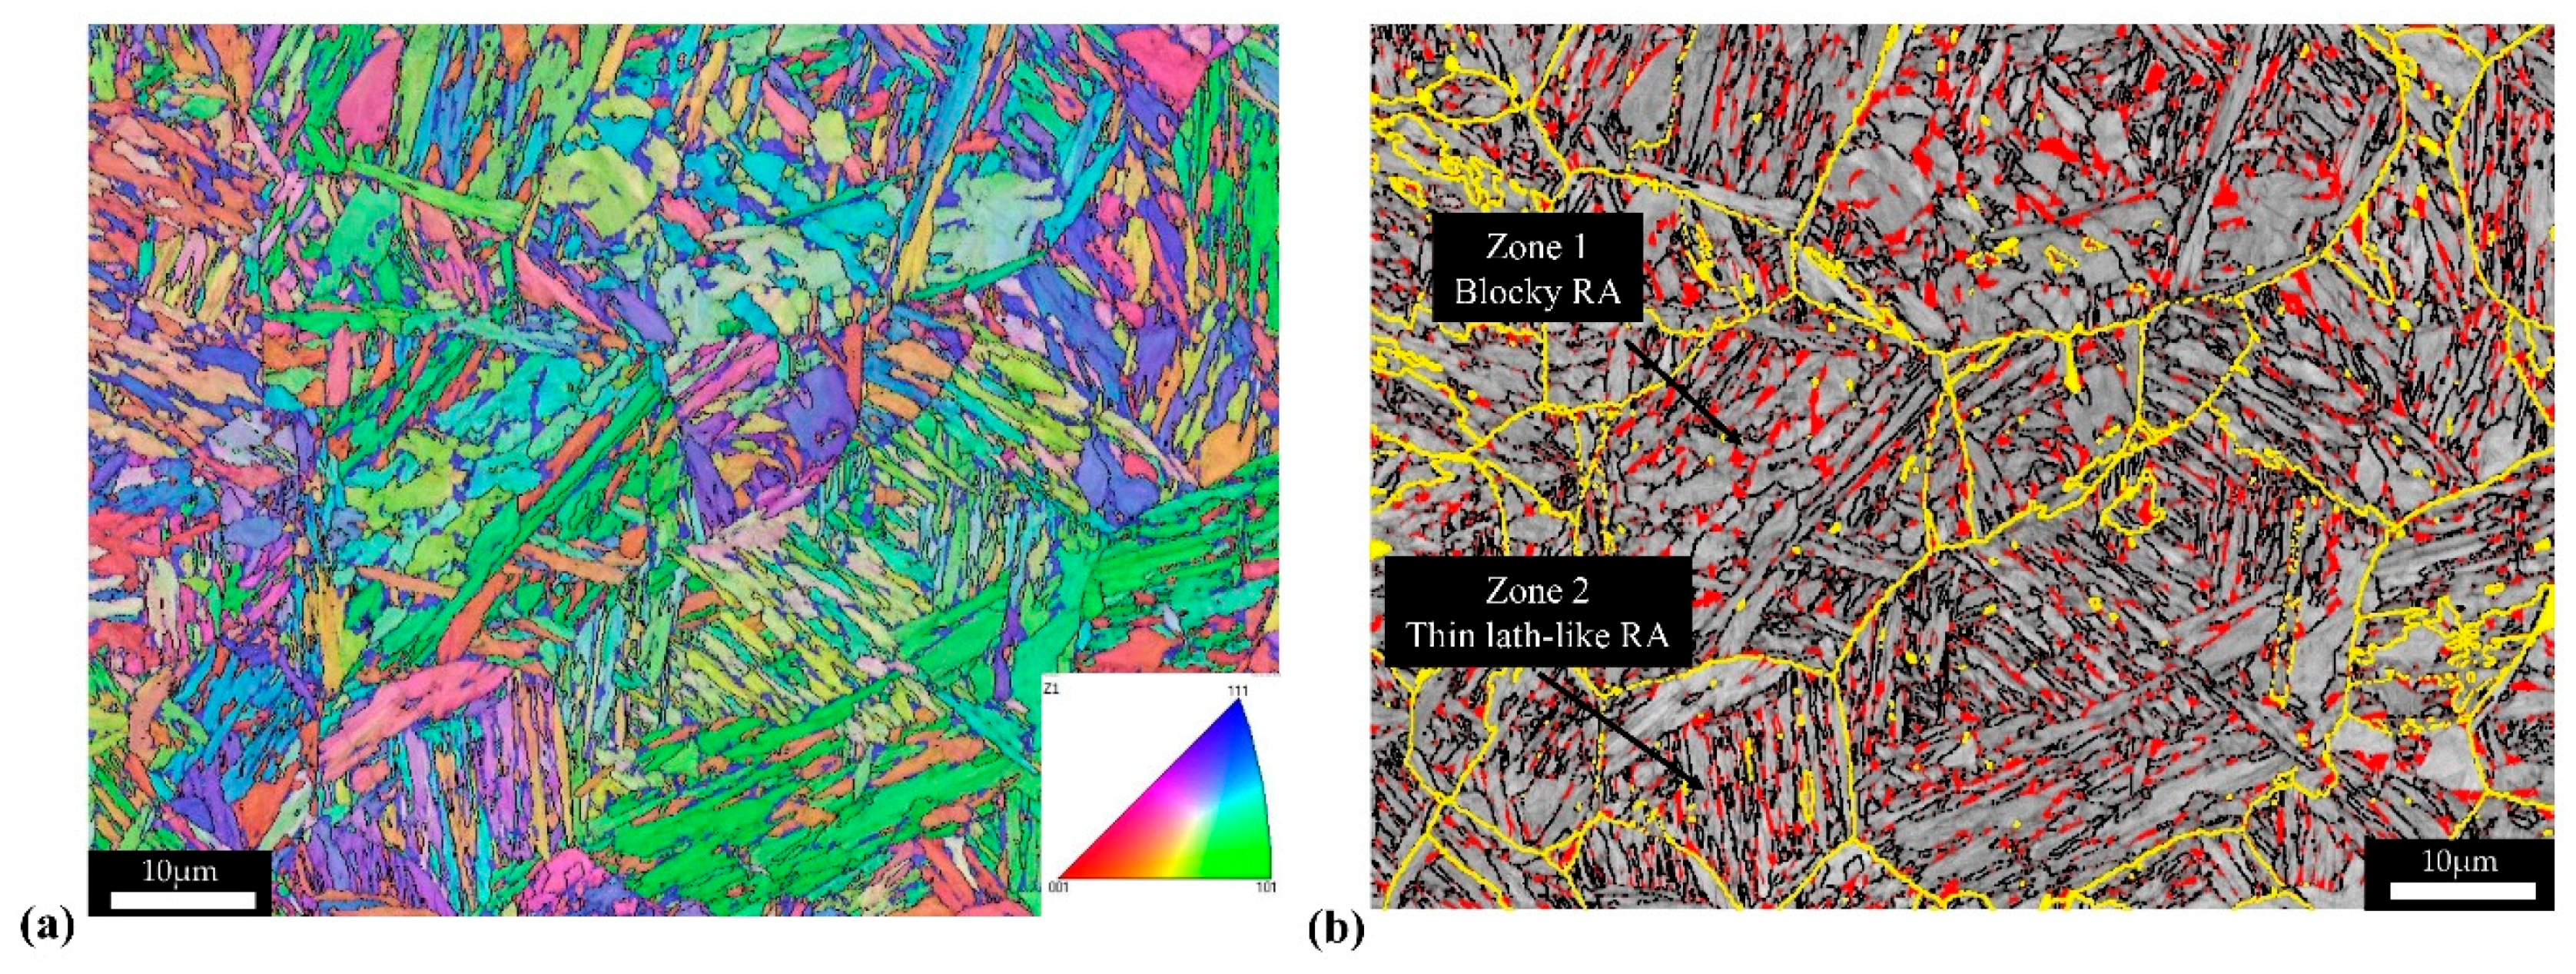
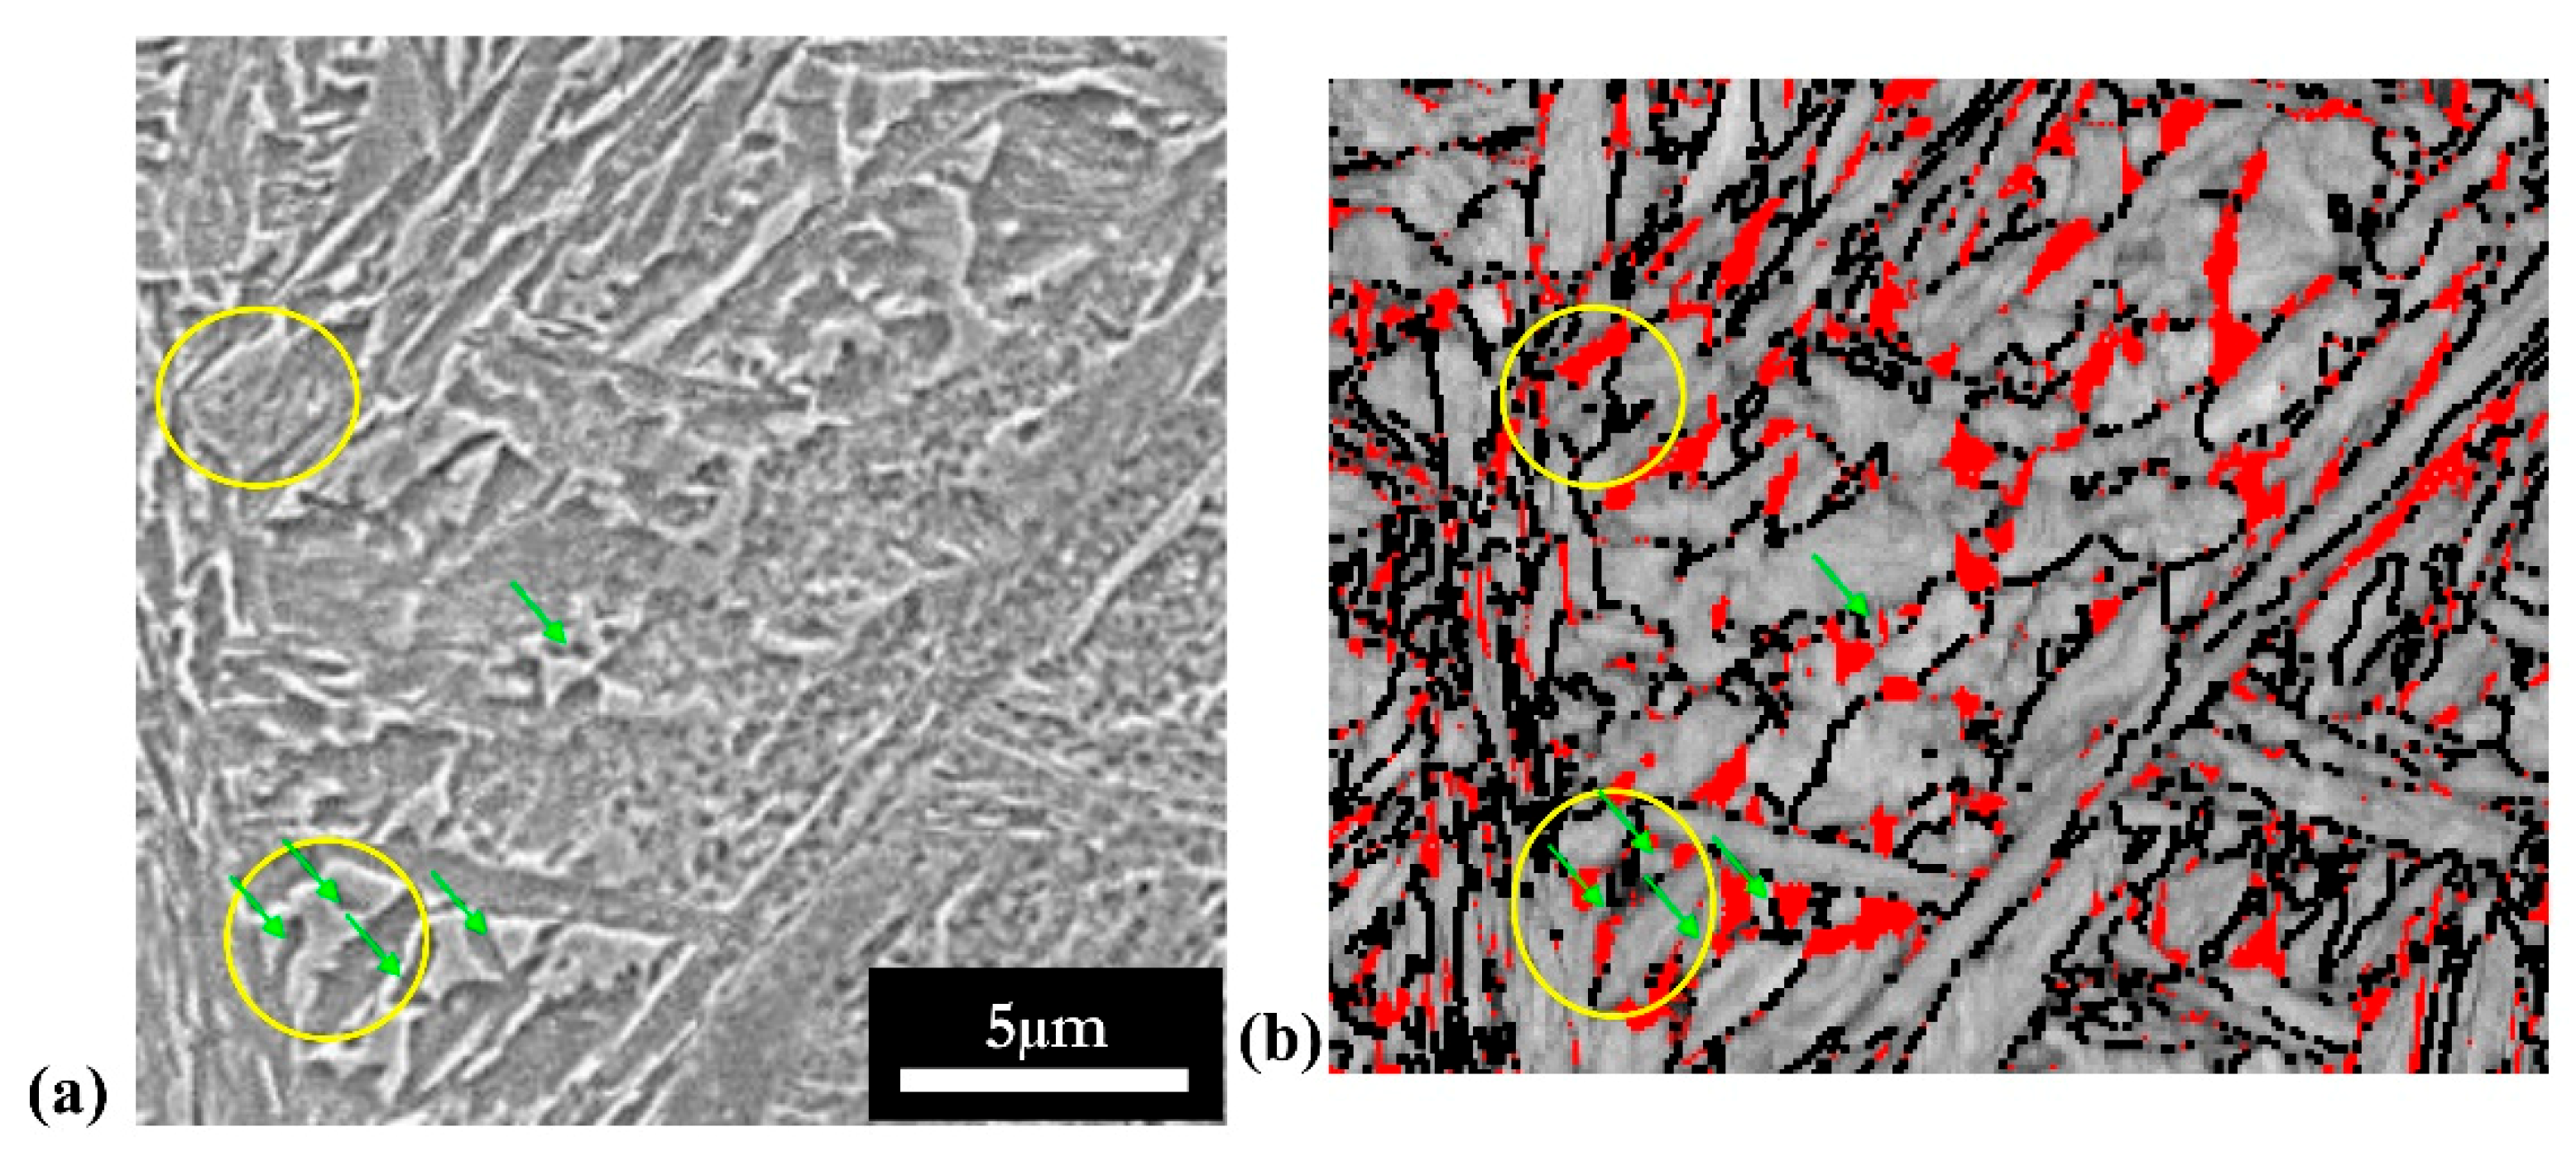
3.2. Metallographic Analysis

The SEM image in Figure 7a corresponds to a sample that underwent a Q&P treatment with QT = 230 °C and PT/t = 400 °C/0 s. The time spent at the PT is very brief, but as the HEXRD experiments showed (Figure 5), both martensite and the new BCT phase were formed.
The topological aspect of phases was the first discriminating criterion used to sort out our Q&P microstructures. The image analysis software ImageJ was used in this study. The use of automatic selection tools based on differences in pixel brightness was made difficult; thus, every martensite/austenite (MA) island was delineated manually, as shown in Figure 7b.
The volume fraction of MA islands and the other BCT phases were measured to be 34% and 66%, respectively. So for now, a two phase-group classification was obtained, and some characteristics can be extracted from the image analysis.
The MA islands present a quite smooth surface aspect (even though some internal structure can be observed) and are mainly present as large islands, even though some present a finer lath-like morphology. The different features and characteristics of MA islands in the Q&P microstructures are summarized in Table 2.
By filling in black all the identified MA phases as in Figure 8, the remaining phases we previously called “other BCT phases” become apparent.
Once again, we can extract two main features based on their morphological characteristics: large laths with carbides and small laths without carbides.
The most striking characteristic of this microstructure is the presence of numerous carbides that are contained in large elongated laths. These laths are often surrounded by several similar parallel laths. Real-time precipitation kinetics were followed by HEXRD, and it was observed that carbide precipitation starts during reheating toward the partitioning temperature [18].
The small carbide-free laths present the same characteristics as the small bainitic laths observed in the carbide-free bainite (CFB) microstructure [16]. Moreover, it is interesting to note that we also observed some bainitic lath growing in the large MA islands. The microstructural study of Navarro-Lopez et al. above and below Ms led to the same conclusion: that is, bainitic features are presented as either thin units with no carbides or larges laths with irregular shapes (identified as granular bainite in our study for the CFB microstructure but absent in the Q&P microstructure) [19]. Martensitic features only appeared either with carbides in it, similar to the long laths we observed in our Q&P structure or in the internal structure of the MA islands as fresh martensite (the latter being hardly etched due to its high carbon content).
Moreover, in addition to the ‘lack of carbides’ criterion, a second ‘size’ criterion was introduced for the bainitic laths. Indeed, some martensitic laths seemed to have experienced a lesser extent of tempering, and carbide precipitation is less obvious on the SEM images. It can also be due to a variation in the reaction to the chemical etching with some martensite laths exhibiting clear carbide contrast while others did not (due to a difference in carbide orientation and variants). Therefore, they might be etched more lightly and will not appear as defined and numerous as the carbide-filled martensite lath presented in Table 3. Figure 9 is an example of a martensitic lath with poorly defined carbides together with a carbide-free bainitic lath. The bainitic lath is in the size range previously stated (200–800 nm), while the martensite lath is much larger.
In order to go further, the evolution of the volume fractions of the product identified as bainite by image analysis was compared with those of the new BCT phase measured by HEXRD. The corresponding results are given in Figure 10.
The two curves follow the same tendency with a rapid increase in the first moments of the BCT phase formation and with a more sluggish increase during the rest of the partitioning step. The error on phase fraction measurement by HEXRD was estimated to be 1%. The final bainite volume fraction is almost the same with the two methods: 10.7 ± 1.9% by image analysis and 7.4 ± 1% by HEXRD. The relative accuracy on image analysis results is given following the ASTM E562 norm [20]. Furthermore, the evolutions of the volume fraction of the new BCT phase measured by HEXRD at the end of the partitioning step were compared with those measured by image analysis for the three QTs studied. The results obtained in Figure 11 show clearly that the two curves follow the same trend with an increasing BCT phase fraction with increasing QT. Taking into account the measurement errors, the volume fractions at a given QT are very close. In general terms, it is worth noting that the measurements by image analysis tend to overestimate the bainite fraction. In view of both temperature of transformation (Table 1) and the above observations, it can be suspected that the new BCT phase corresponds to bainite. The possible tetragonal nature of bainite (instead of cubic) is of prime interest. This was already observed and reported in the literature at the beginning of transformation and/or for bainite formed below 350 °C [21,22]. The tetragonality observed can be a direct consequence of carbon ordering onto one of the three possible sets of octahedral sites of the BCC structure. The occurrence of the ordered phase can be explained by two mechanisms at least. First, there is the displacive transformation character of the FCC austenite to bainite, which imposes that the octahedral interstitial sites of the parent FCC lattice transform into the interstitial sites of only one of the three octahedral sublattices of the BCC or BCT structure. In that case, the tetragonal distortion is a consequence of the reconstruction process itself. This ordering can also be viewed as a self-induced preferential distribution of solute atoms in one of the three types of tetragonal interstitial positions, which is commonly referred to as Zener ordering [23]. However, as recently suggested, carbon clustering in bainite can also lead to an increase of the c/a ratio. At all events and more interestingly, the non-cubic structure of bainite is a marker of carbon supersaturation in bainite, as observed by APT [24,25]. Some recent calculations based on the theory of Zener and Khachaturyan show that carbide suppression can lead to tetragonality. An increase of 40% to 60% of carbon solubility in BCT compared to the BCC structure was highlighted [26].
The localization of retained austenite in the microstructure can give valuable information regarding the nature of the surrounding phases. Thus, EBSD was coupled with SEM on the same zone of a sample in order to combine morphological and crystallographic information.
The sample studied followed a Q&P treatment at QT = 230 °C and PT/t = 400 °C/200 s. Figure 12a,b shows the z-direction inverse pole figure (IPF-Z) EBSD map and a combination of band contrast image with the gamma phase represented in red and the grain boundary 10° as black lines, respectively. The prior austenite grain boundary (PAGB) was determined with MERENGUE 2 (see Figure 12b) in yellow lines).
As the only two phases given to the EBSD software to index were FCC and BCC, all the microconstituents that are not red are either martensite (tempered or fresh) or bainite (carbides were too small to be probed with the current mapping settings). Retained austenite was present in two different morphologies: either as blocky RA as in Zone 1 or as thin lath-like RA as in Zone 2 (see Figure 12). It is interesting to note that ultra-fine RA laths were rarely detected via EBSD. This led to an underestimation of the amount of RA (9.7% via EBSD, 14% via XRD).
Bainite was present in both zones as small carbide-free laths (green arrows on Figure 13 and Figure 14) and was very often surrounded by retained austenite.
Navarro-Lopez et al. highlighted the fact that martensite is often surrounded by bainite laths, creating ledge-like protrusions [19]. Such features were indeed observed and are shown in Figure 14 by green arrows (taken on the same sample but from another area than the previous images). This further supports the study of Toji et al., who showed that martensite laths provide a preferential nucleation site for bainite [27].

3.3. Carbon Trapping in Martensite

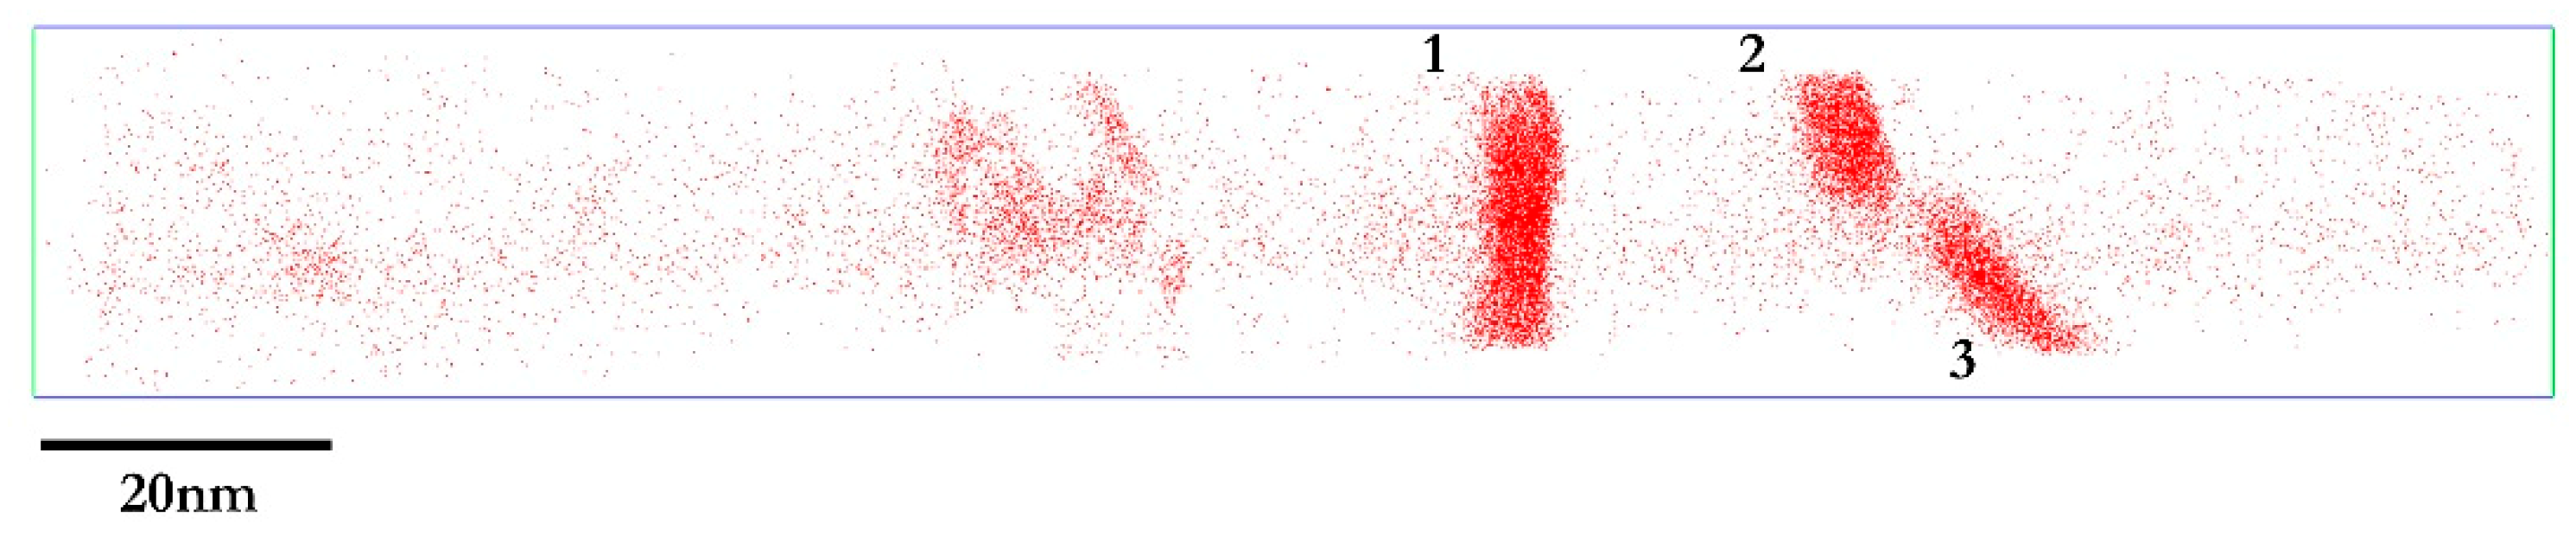
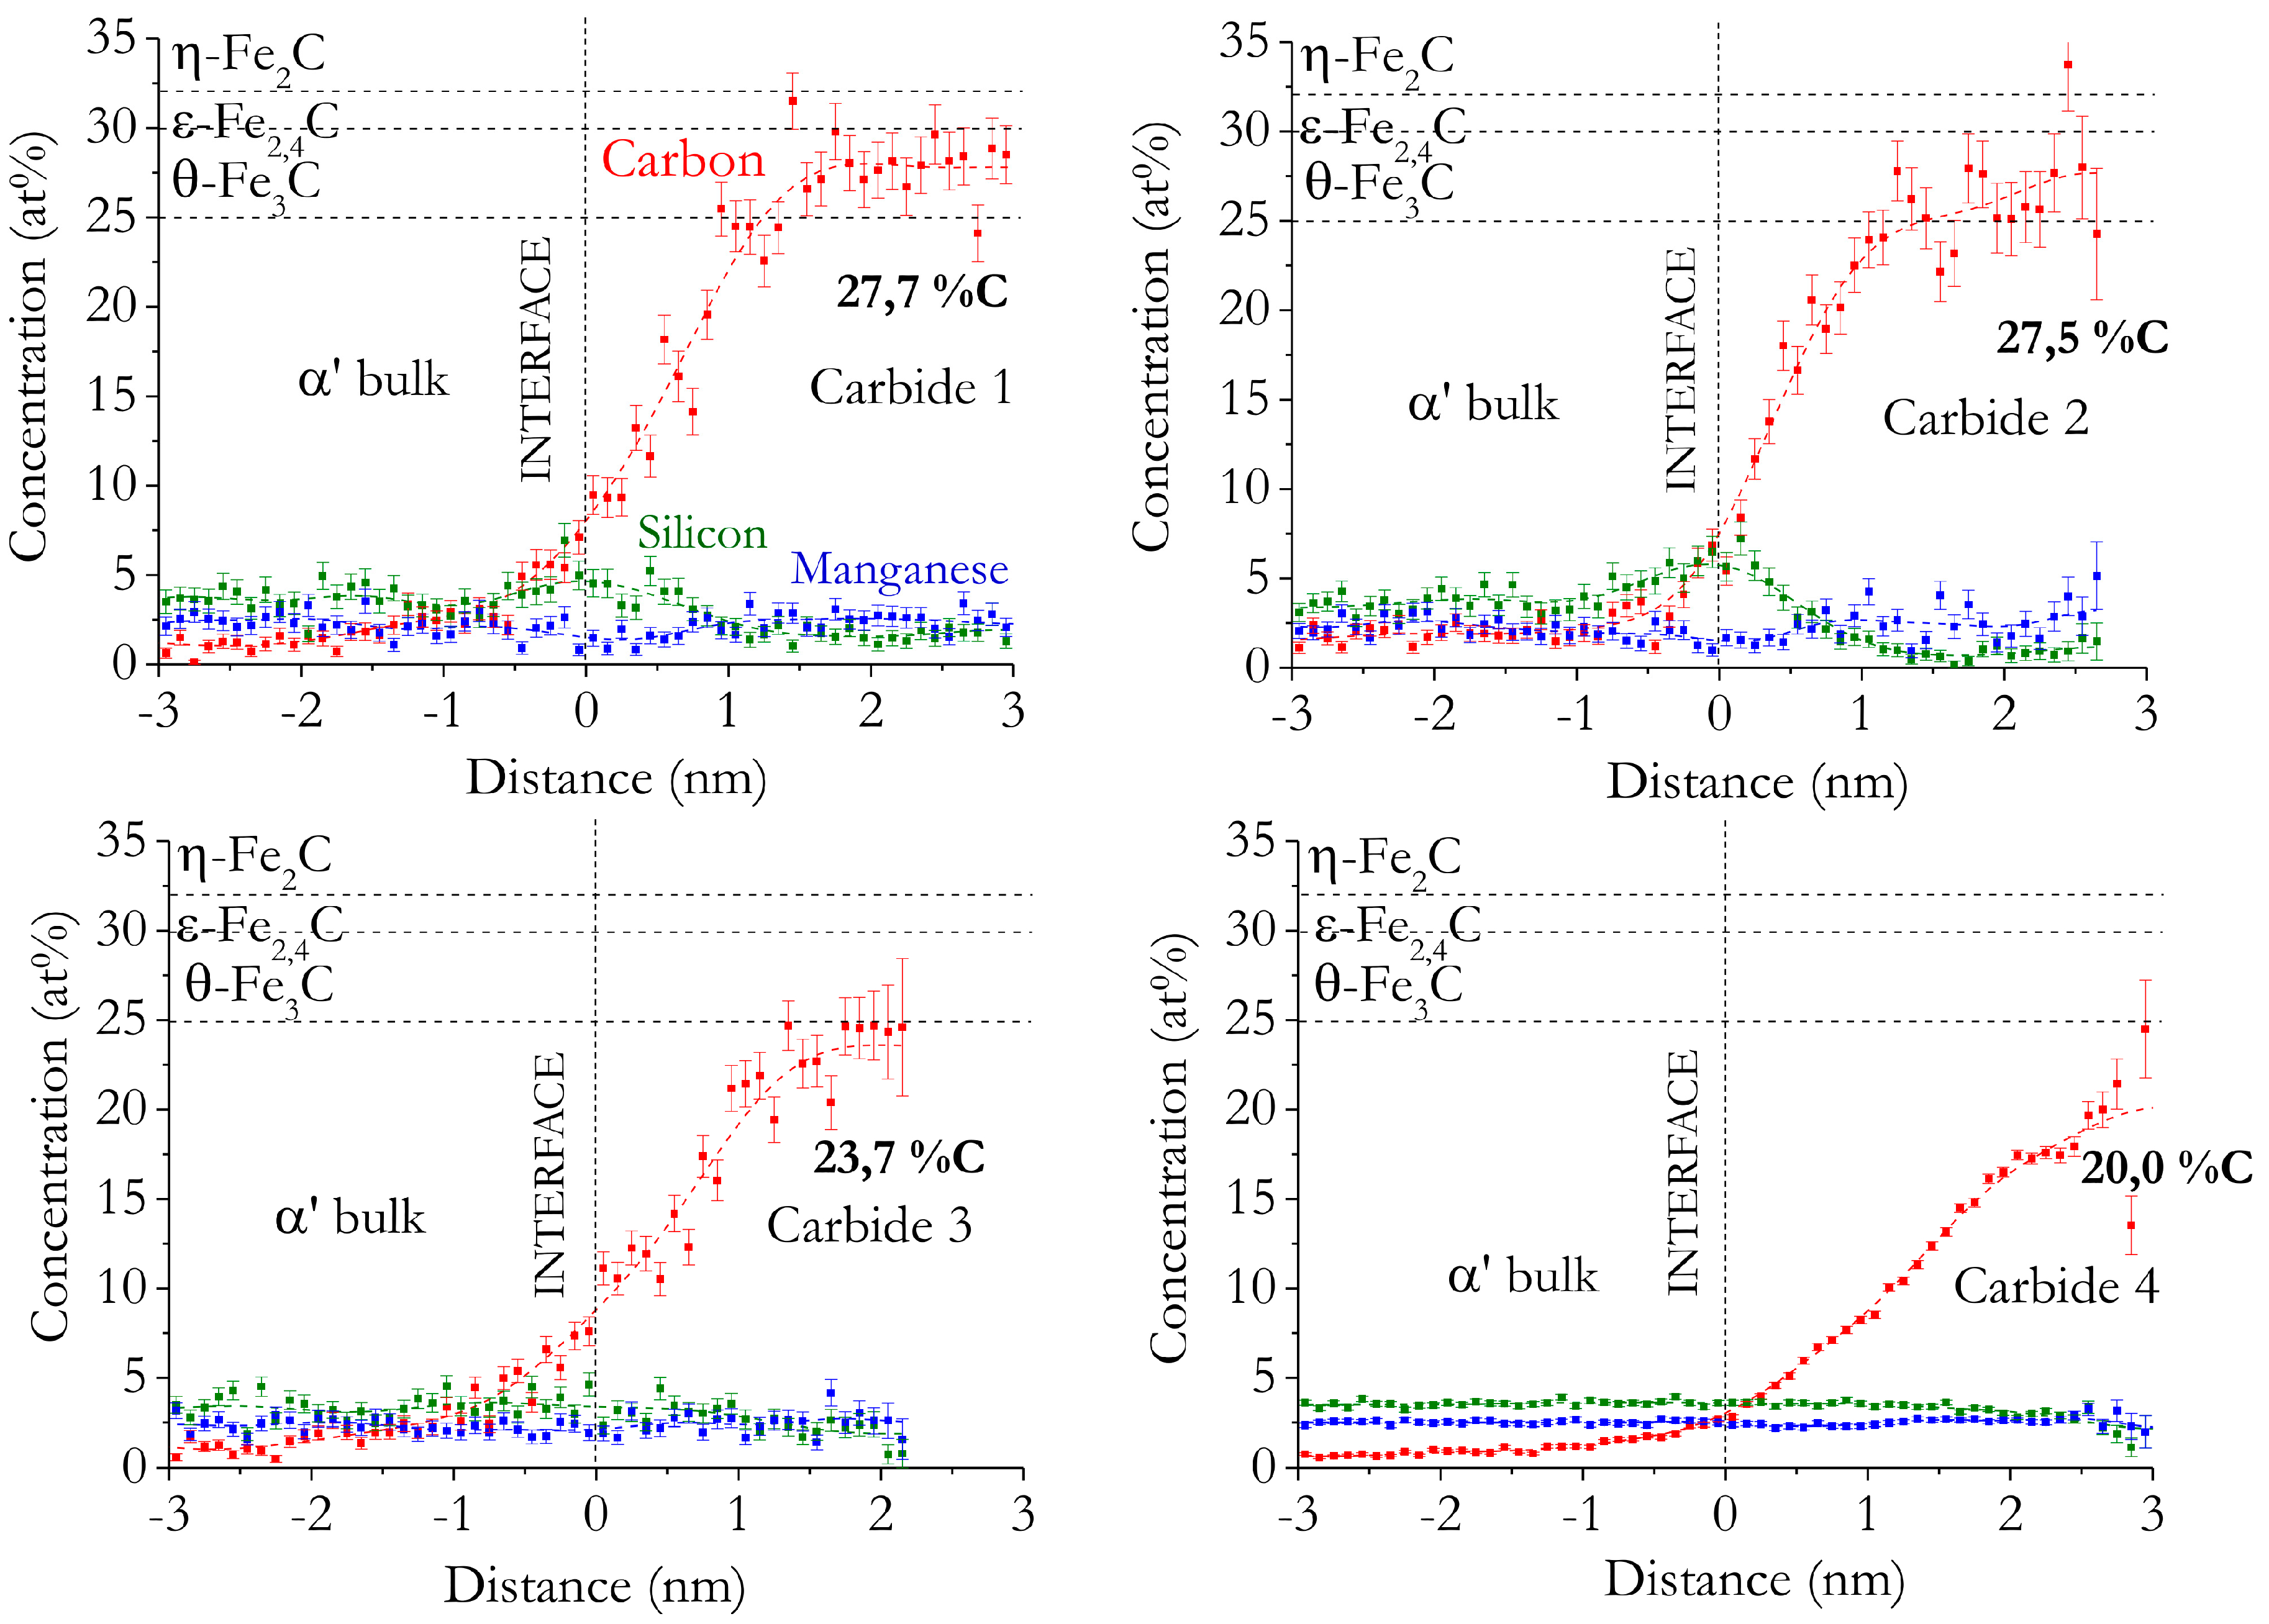
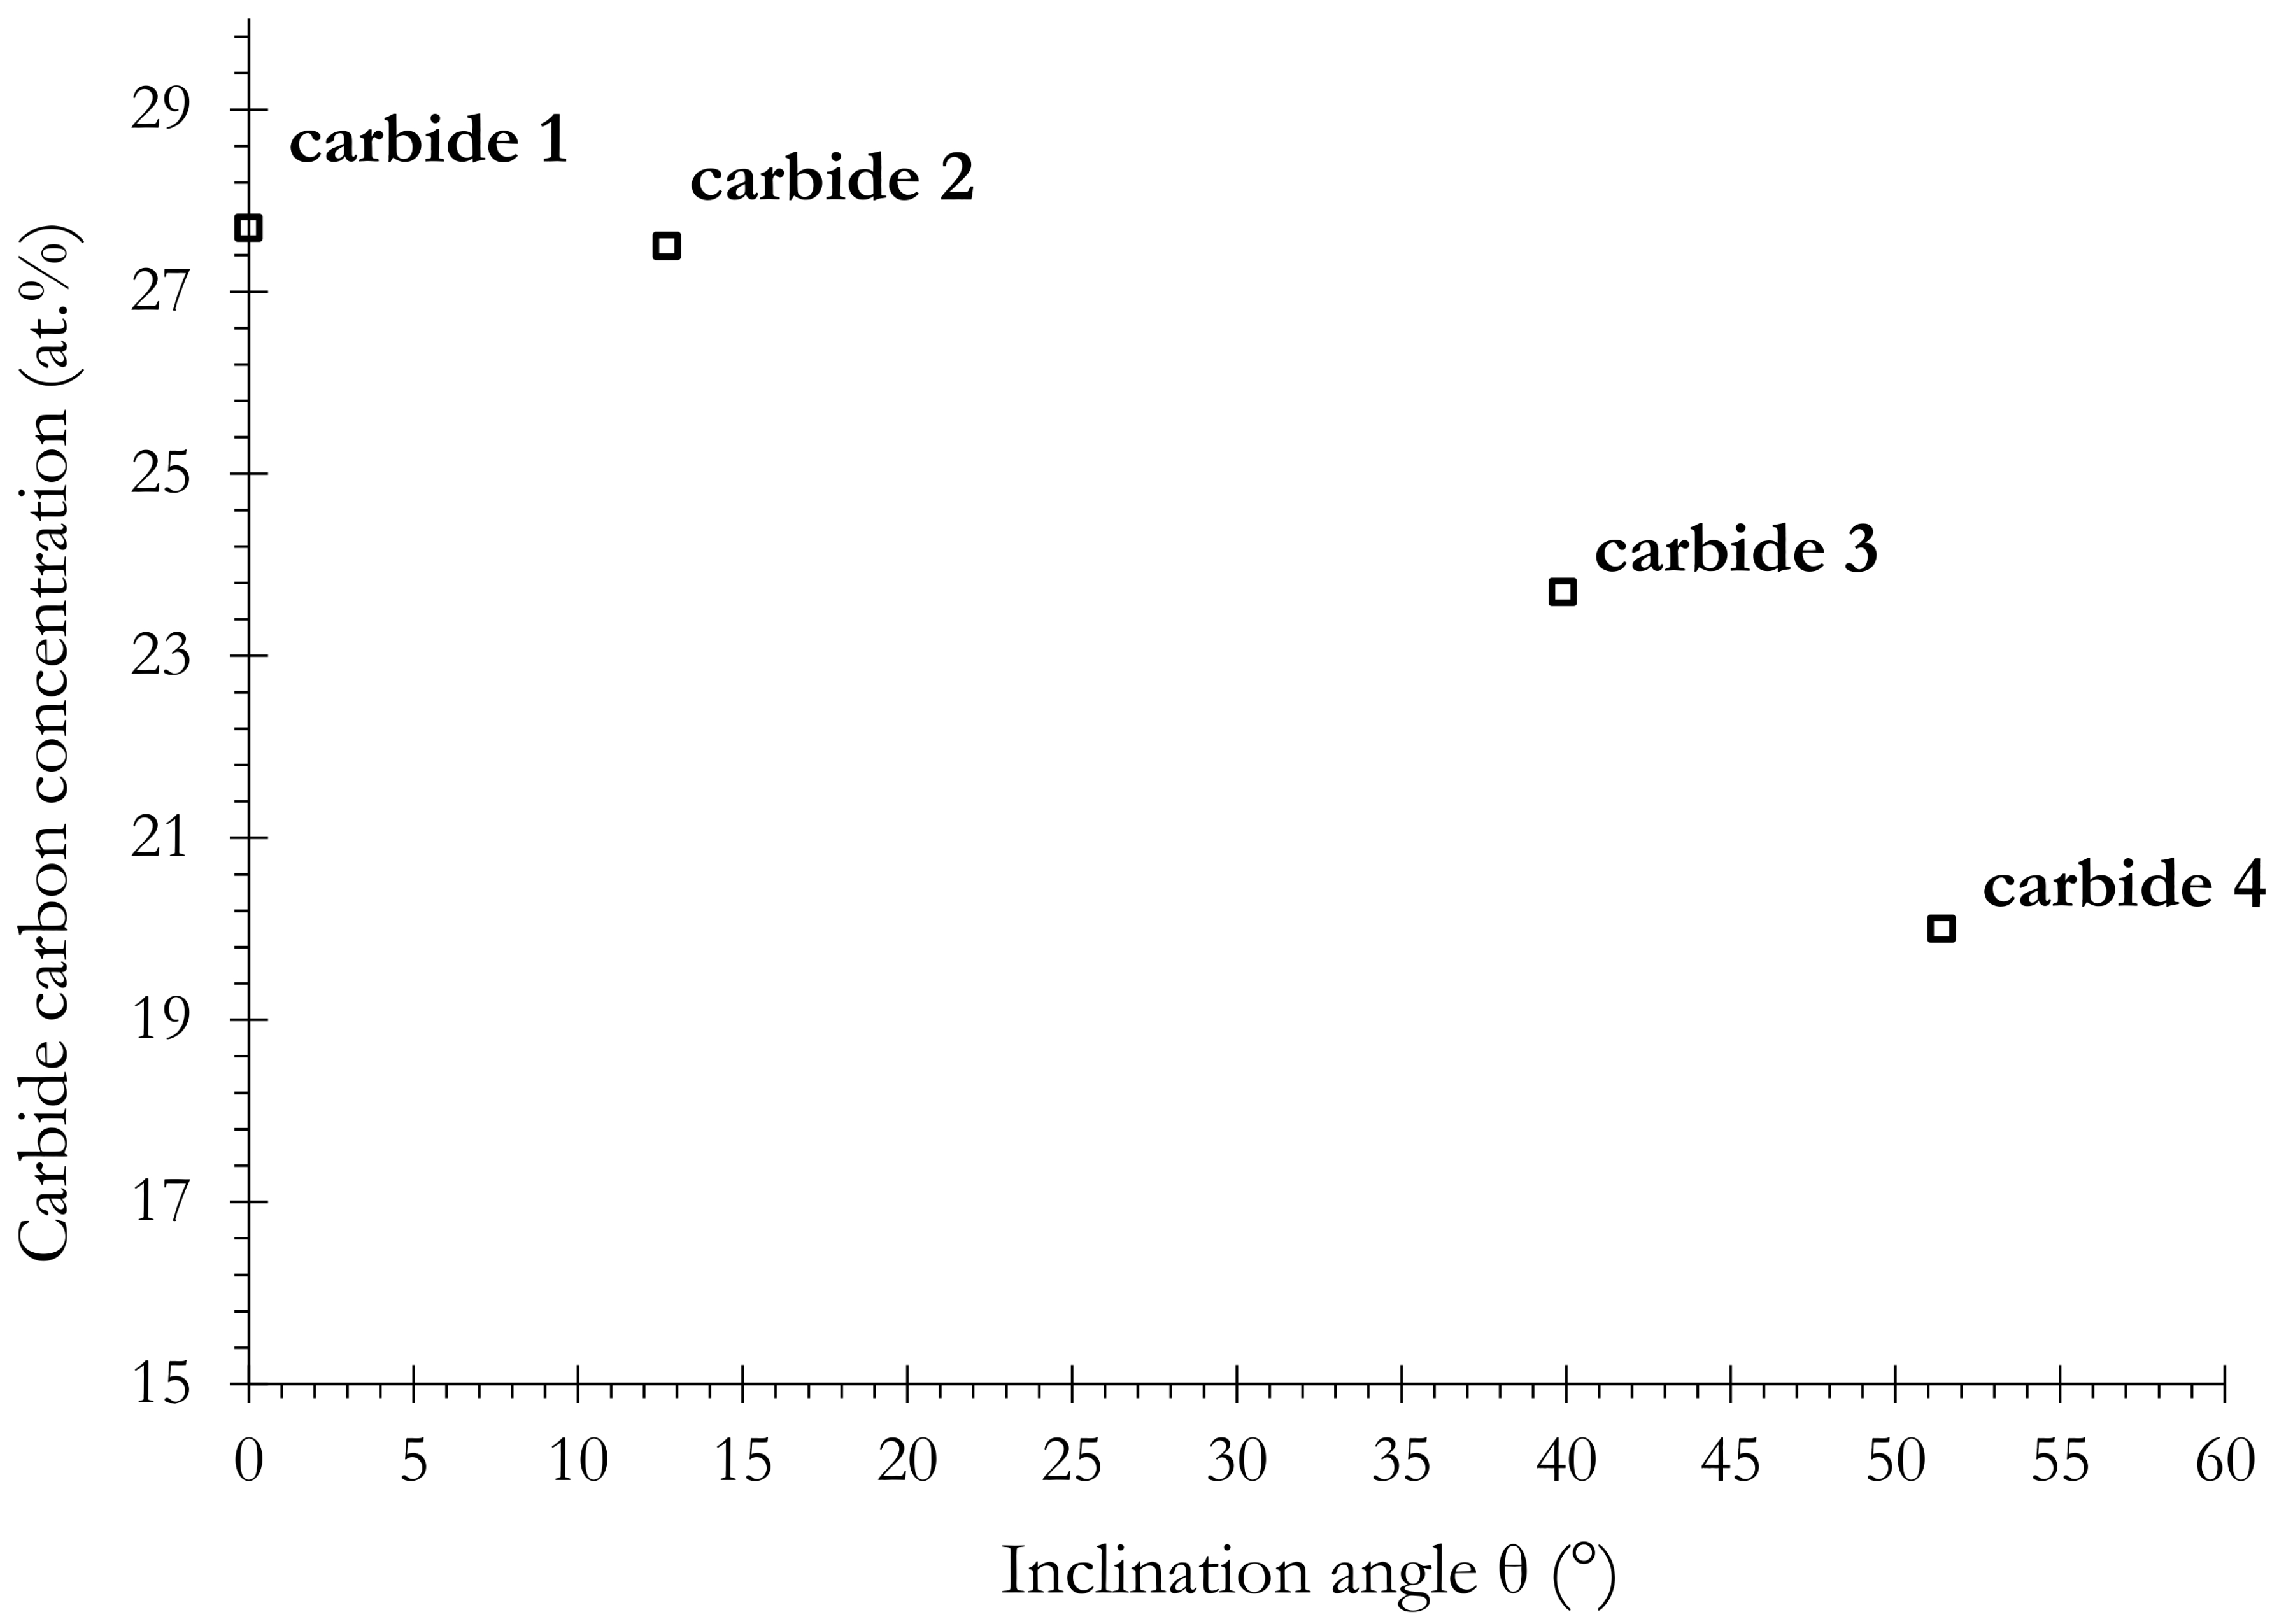
3.3.1. Carbide Precipitation in Martensite

The image analysis study showed that martensite undergoes tempering during the Q&P treatment and presents a significant amount of carbides. As the main goal of Q&P treatments is the carbon partitioning from martensite to austenite, any carbon trapping mechanism into martensite is detrimental. Therefore, the following part aims at studying one of the main sources of carbon trapping: carbides precipitation and carbon segregation.
As the crystallographic nature of the phases is not directly given by APT, the identification of the phases observed was made based on compositional arguments. Thus, regions with a relatively low carbon concentration (as compared to the nominal carbon content) and presenting features with high carbon contents were identified as tempered martensitic phase with carbides.
APT measurements related to carbides were mainly conducted on the Q&P treatment with the highest martensitic volume fraction, i.e., with the lowest QT in order to increase the probability of probing carbides.
A sample presenting low carbon content with discrete features of high carbon concentration is shown in Figure 15. The phase observed is considered to be tempered martensite (due to its low carbon content), and the three high concentration features are likely to be carbides. A similar microstructure is also presented in Figure 16 with a carbide in a martensitic matrix.
A common method to represent carbon concentration in a precipitate (carbide) is the so-called proxigrams (for proximity histograms). Indeed, rather than plotting a concentration profile along a line or an axis of a region of interest (ROI), proxigrams correspond to a profile with respect to the distance from a predefined interface (usually a user-defined isosurface of concentration) [28]. This method is particularly suited to study curved interfaces (encountered in most realistic cases). By using proxigrams, it is possible to avoid the common measurement bias introduced by the use of 1D concentration profile measurements such as the artificial widening of interfacial regions [28].
The proxigrams corresponding to the four carbides observed in Figure 15 and Figure 16 are presented in Figure 17.
Since the goal of this section is to give information on the nature of the observed carbides through compositional measurements, the stoichiometry of the three possible carbides (θ, ε, and η) are reported in the proxigrams in the form of horizontal dashed lines for the sake of comparison. Carbide carbon concentrations were determined by taking the average value on the last 5% of the proxigrams (0% being the concentration value at 0 nm and 100% being the last concentration value at the right end of the proxigram); this zone can be considered as the most representative of the carbide core composition.
Firstly, it must be highlighted that adding silicon does not prevent any precipitation of carbides in martensite.
While carbides 1 and 2 showed similar carbon compositions (approximately 27.5% C), situating them in between θ and ε carbides, carbide 3 and to a larger extent carbide 4 presented a lower carbon content (respectively 23.7% C and 20.0% C). These values indicated that the carbides encountered in Q&P microstructures might not be of the same nature or/and at the same stage of formation (transition from a η/ε to a θ for example). Mössbauer studies conducted by Pierce et al. [29,30] suggested that non-stoichiometric transitional carbides (Fe3C η-carbides for example) can be found.
Another possible explanation for the distribution in carbides carbon content is the local magnification effect taking place during the APT measurements, as already shown by Lu et al. [31]. Indeed, as the matrix (martensite) and the carbide require different electric fields to evaporate, atoms located near the interface can be mispositioned. In the case of a low-field precipitate (such as iron carbides), the preferential flattening of the carbide surface will result in a lower field region that will deviate the atoms inwards, causing an apparent increase in density of the impacts. For a high-field precipitate, the opposite mechanism takes place.
This effect has proven to be negligible when the carbide is perpendicular to the analysis direction (inclination angle = 0°) and increases with the inclination angle. The inclination angle with respect to the analysis axis was measured on the carbides probed by APT, and the carbide carbon concentration as a function of the inclination angle was plotted in Figure 18. The range of angles covered by the four studied carbides is 0–50°. As carbide 1 exhibited a 0° inclination angle, this made its carbon concentration (27.7 at % C) less prone to be altered by the local magnification effect. Thus, the difference in carbide concentration can come from this measurement artefact.
Another indication about the nature of carbides can be found by analyzing the matrix/carbide distribution of substitutional elements. It is usually considered that cementite cannot precipitate under paraequilibrium condition and that Si must diffuse away from the carbide. Such a redistribution of Si is indeed significantly noticable in carbides 1 and 2. Interestingly, the carbides that presented the highest carbon content (and thus are more likely to be transitional carbides due to their stoichiometry) were the ones with the more advanced silicon redistribution (and thus closest to the characteristics of cementite). However, complementary transmission electron microscopy (TEM) studies and the HEXRD diffraction patterns analysis presented in [18] ruled out the presence of cementite and support the identification of transition carbides. It is worth mentioning that no significant Mn redistribution was noticeable, as shown in Figure 17.

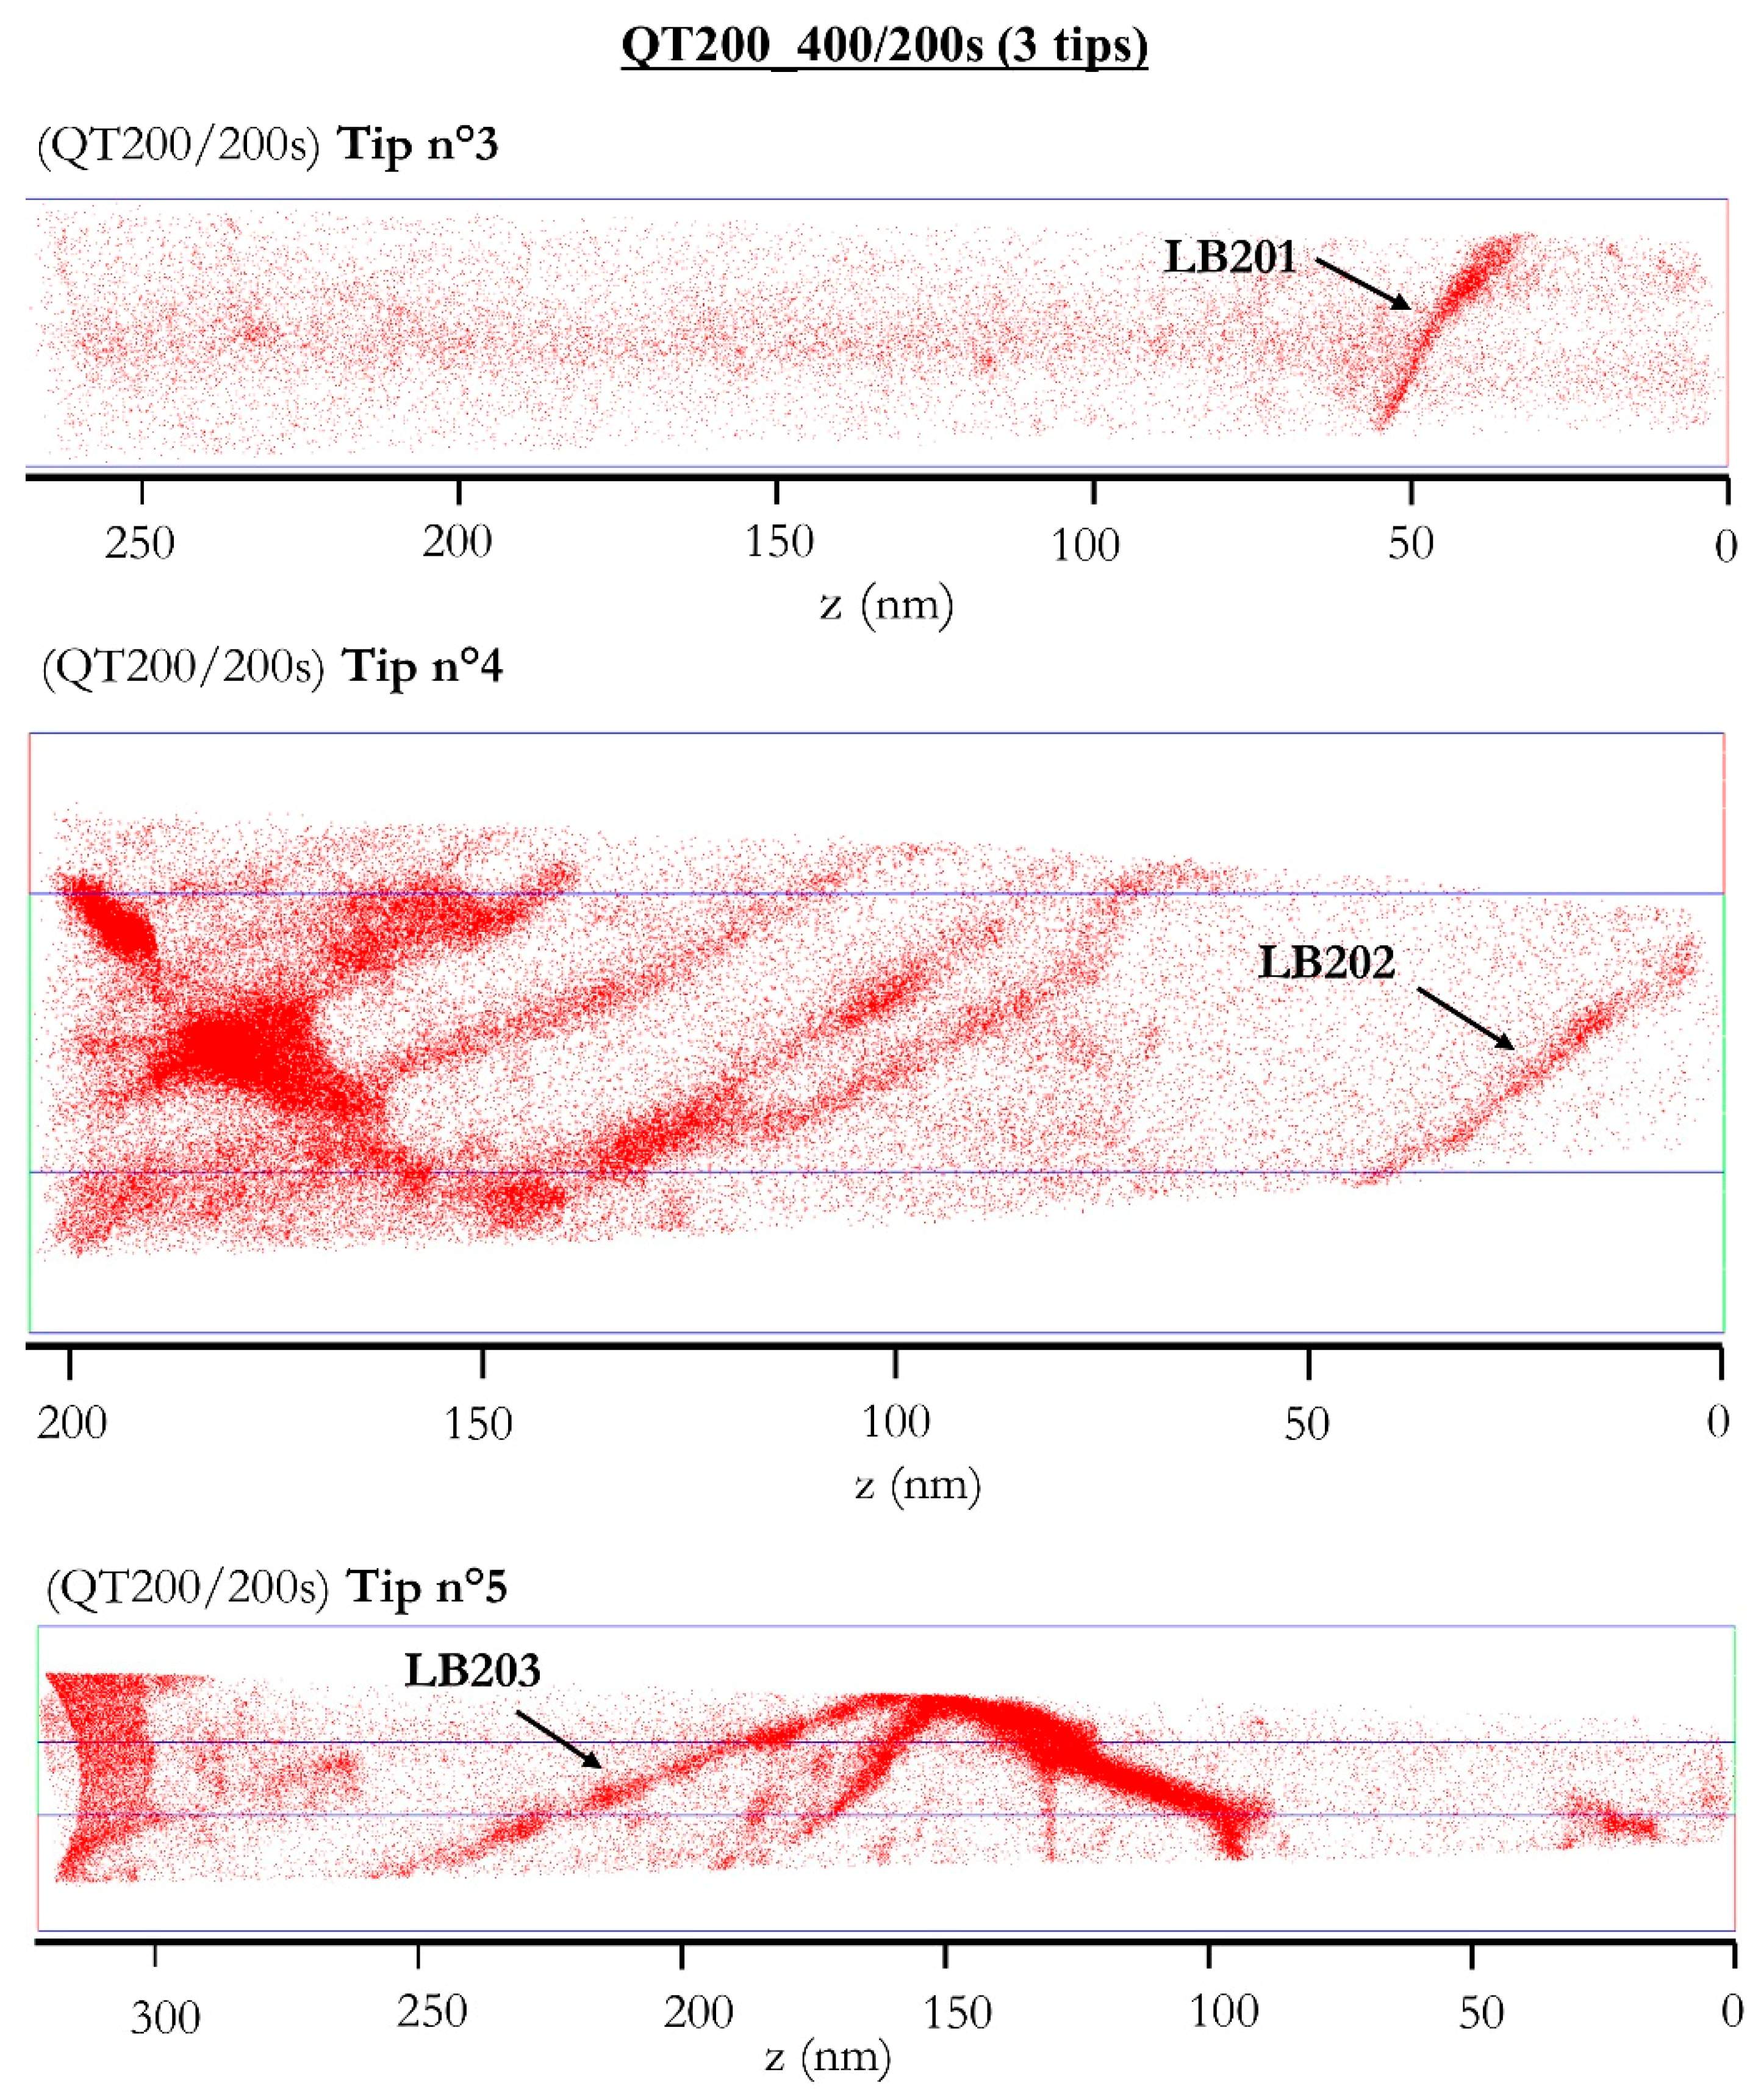
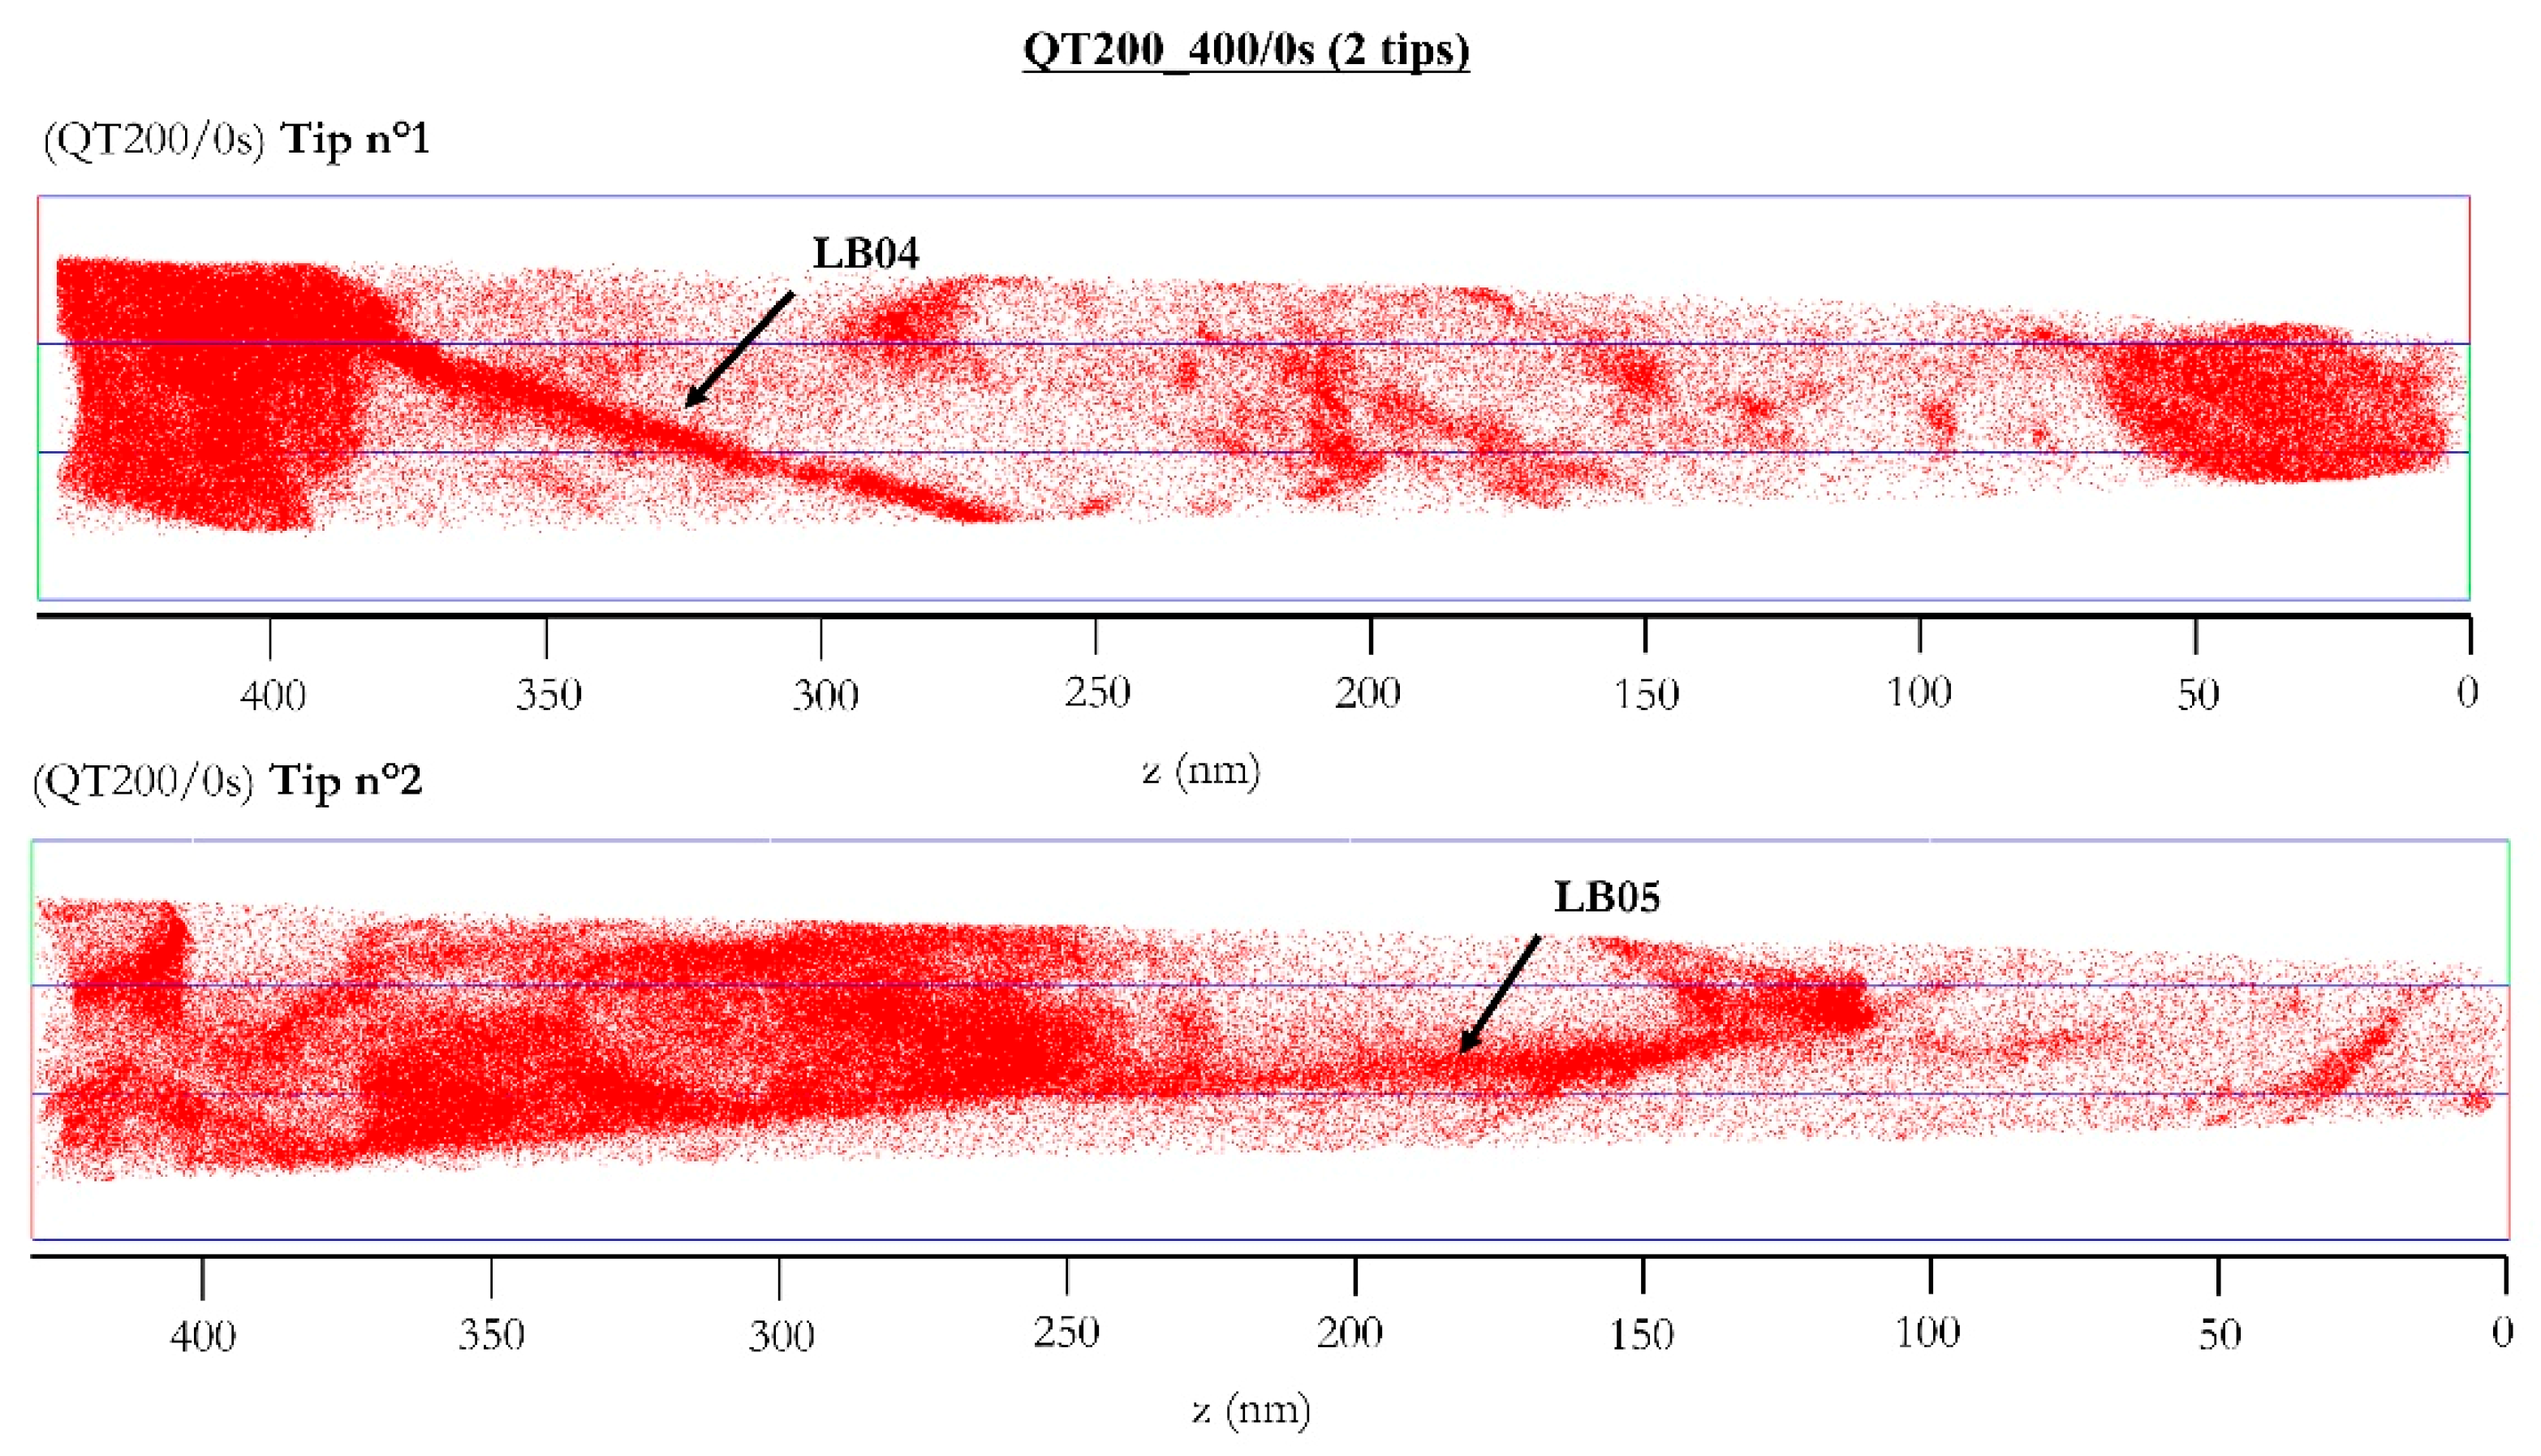
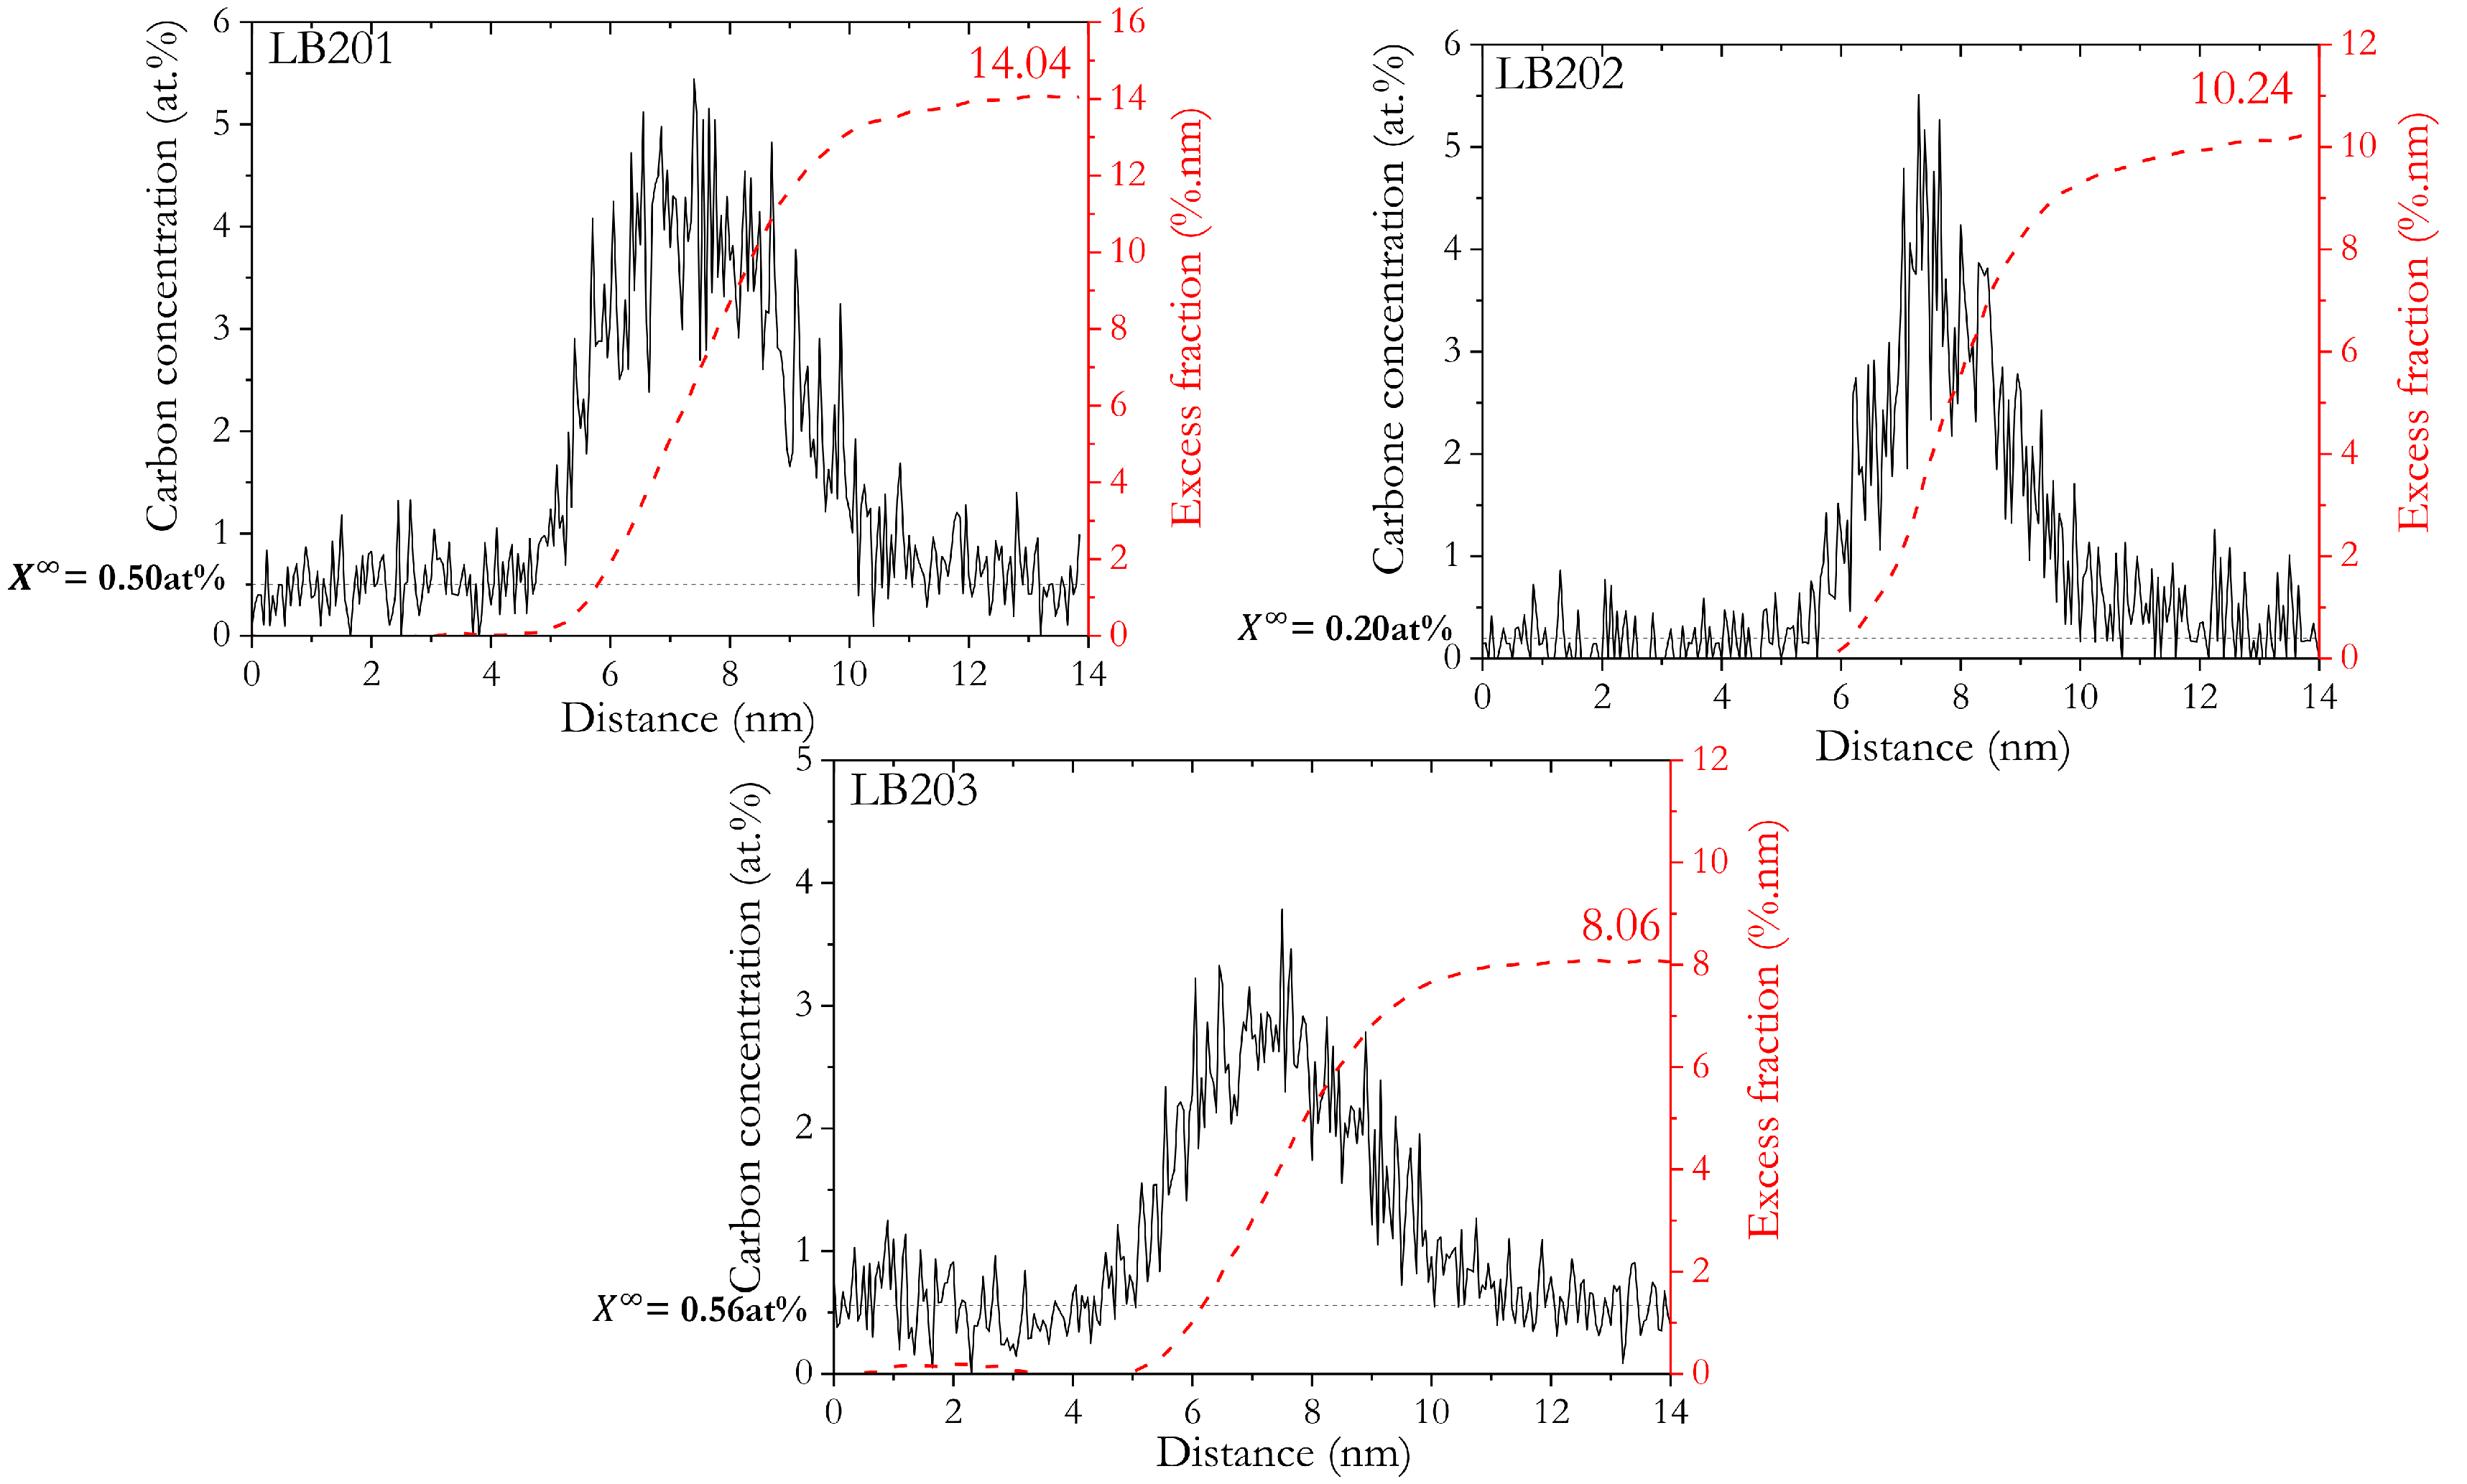
3.3.2. Carbon Segregation Evolution at Martensite Boundaries during Partitioning

Carbon can also segregate at martensite boundaries such as laths, blocks, and packets but also on dislocations. In order to study the time evolution of carbon segregation on defects in martensite, two different partitioning times were considered: at the beginning and at the end of the partitioning step at 400 °C for a quenching temperature of 200 °C, being referred to as QT_200/0 s and QT_200/200 s in the following. More than 10 tips were probed, but only two or three representative will be shown here. The obtained 3D distribution maps of carbon atoms are given in Figure 19 and Figure 20. Important carbon redistribution was highlighted. Several planar carbon segregations were highlighted in all five tips (black arrows on Figure 19 and Figure 20). It would correspond to carbon segregation on lath boundaries (LB); since these features have a 2D-planar morphology, they go through the whole of the tips and they separate two low-carbon regions. These features were similar to the α/α’ boundary already observed by Maugis et al. [32]. Moreover, carbon segregations ranging from 3 at % to 6 at % observed in between martensite lath boundaries are very consistent with those described by Pierce et al. [33] in Q&P samples. However, the level of carbon segregation is lower than the one measured in fresh martensite by Clarke et al. [34]. Very surprisingly, very few carbon segregations on 1D defects, i.e., on dislocations, were clearly highlighted in our samples. As suggested by Xiao et al., carbon atoms gain greater energy to migrate toward laths boundaries when the tempering temperature is increased above 170 °C [35]. Thus, a change in carbon segregation sites from dislocations to lath boundaries is expected. As a consequence, even if martensitic structures might present high dislocation density, segregation onto lath boundaries might be the main source of carbon trapping in our study.
In order to study the carbon segregated on the five laths boundaries shown in Figure 19 and Figure 20, cylindrical regions of interest (ROI) were placed so that their axes were perpendicular to the boundary planes. Traditionally, the amount of segregation is measured by plotting a concentration profile along the axis of the cylinder and by taking the maximum of the plot as representative of the segregation level of the studied species. However, as Maugis et al. pointed out, the maximum concentration of the segregated element (in particular at lath boundaries) is not a thermodynamical variable in addition to being extremely sensitive to the measurement methods [32]. Concentration profiles collected through a ROI were still used, but instead of measuring a peak concentration, the total amount of solute in surplus in the vicinity of the interface was measured. This excess interfacial concentration is resolution-independent and is often expressed in at.nm−2. When using an atomic fraction as the measurement unit, X e x , the excess fraction in the length unit is the integral of the concentration profile over a distance L that encompasses the whole boundary as follows:
X e x = L / 2 + L / 2 ( X ( z ) X ) d z
where X e x is the excess fraction of solute in % nm, X ( z ) is the concentration of solute at the distance z in at %, and X is the concentration of solute far from the interface in at %.
The concentration profiles were measured along the z-axis of cylinders that encompass the LBs and with bin widths of 0.05 nm. Figure 21 presents the concentration profiles (black solid lines) along the three LBs of the QT_200/200 s condition. The excess fraction is represented by a dashed red line. The value of X is indicated by a horizontal dashed black line on each graph. The integration of the profile with Equation (2) is represented on each graph as a red dashed line. The asymptotical value of X e x is indicated in red.
A MacLean approach was applied to calculate the segregation energy of each LB. As shown in [36], the classical Mc Lean equation can be rewritten as:
Γ Γ m a x Γ = X 1 X exp ( Es R T )
where Γ is the excess concentration of solute measured in at.nm−2, Γ m a x is the maximum excess of solute in at.nm−2, X is the concentration of solute far from the interface in % at, and Es is the Gibbs free energy of segregation in J mol−1.
The excess concentration of solute in at.nm−2 is linked to X e x by V a t , the average volume occupied by an atom in the crystal structure as:
Γ = X e x V a t
where Γ is the excess concentration of solute in at.nm−2, X e x is the excess fraction of solute in %.nm, and V a t is the average volume occupied by an atom in the crystal structure in at.nm−3.
For a ferritic structure containing 5.9 at % C (in the range of the carbon values measured in our LB), Jang et al. calculated that the atomic volume of ferrite was 12.43 Å3 [37]. In order to assess the maximum excess concentration, a hypothesis regarding where carbon atoms segregate must be made. Indeed, the excess concentration must be “concentrated” on a chosen distance in order to translate the results in more classical quantities such as segregation energies or solute concentrations. We assume that the carbon atoms are segregated on the octahedral sites of two (100) ferrite planes. Thus, the maximum excess concentration for carbon Γ m a x (every site available for carbon segregation is occupied) is equal to 72.02 at.nm−2. Consequently, the measured values ( X e x and X ) and the calculated one ( Γ m a x ) can now be used in order to determine the segregation energy using Equation (3).
Moreover, by using the hypothesis of carbon segregation on two (100) planes, it becomes possible to calculate the ratio of C to Fe atoms on these planes in order to estimate the stoichiometry in the case where a defined compound forms in the LB as:
% C = ξ 1 + ξ × 100 with   ξ = Γ 2 C F e S
where %C is the carbon concentration of the defined compound (in at %) and ξ is the ratio of experimentally measured carbon atoms Γ to the theoretical surface density of iron in (100) planes.
The results are presented in Table 4.
These data must be interpreted with caution because of the relatively low number of LB probed. However, it remains possible to draw some conclusions.
Firstly, the calculated lath boundaries’ segregation energy is around 0.20 eV and in the order of magnitude of the dislocations segregation energy. Indeed, depending on the framework used for the calculation, values found for the C-dislocation biding energy in the literature are within the range of 0.41 eV [38] and 0.75 eV [39].
The carbon concentration on the laths boundaries obtained is around 25 at %; hence, it is close to the transitional carbides stoichiometry. Thus, the total amount of carbon trapped on the lath boundaries can be expected to be high and could be one of the main carbon-trapping mechanisms hindering carbon partitioning from martensite toward austenite.
Indeed, Kalish et al. calculated that for a steel with less than 0.2 wt % C, about 85% of the available carbon is trapped on defects (dislocations in their case), and as they calculated that the carbon/defect binding energy is higher than the one of carbon/ε-carbide (approximately 0.27 ev), carbon will not move away from the defects to form precipitates [40]. This trapping effect was experimentally observed by Speich et al. [41] using resistivity measurements and confirmed that 90% of the carbon atoms are trapped at defects sites for steels containing up to 0.2 wt % C. However, as the segregation energy of lath boundaries calculated in our study is lower than the segregation energy of carbides calculated by Kalish et al. [40], it is expected that carbon desegregation from laths boundaries toward carbides happens later in the treatment.
As the nature of Q&P treatment is complex because of the numerous change in temperature (hence the change of preferential sites for carbon segregation [35]), the simultaneous carbon partitioning from martensite toward austenite, and the carbide precipitation, the segregation/desegregation sequence between defects and carbides is difficult to establish and requires further investigation.
The fact that both carbide and lath boundaries segregation is observed shows that complex interactions between carbon precipitation, segregation on defects, and carbon partitioning can take place during the Q&P treatment.

4. Conclusions

The microstructural evolution during the quenching and partitioning of a model Fe–C–Mn–Si alloy was analyzed by coupling in situ high-energy XRD, atom probe tomography, and image analysis. The main highlights can be summarized as follows.
(1)
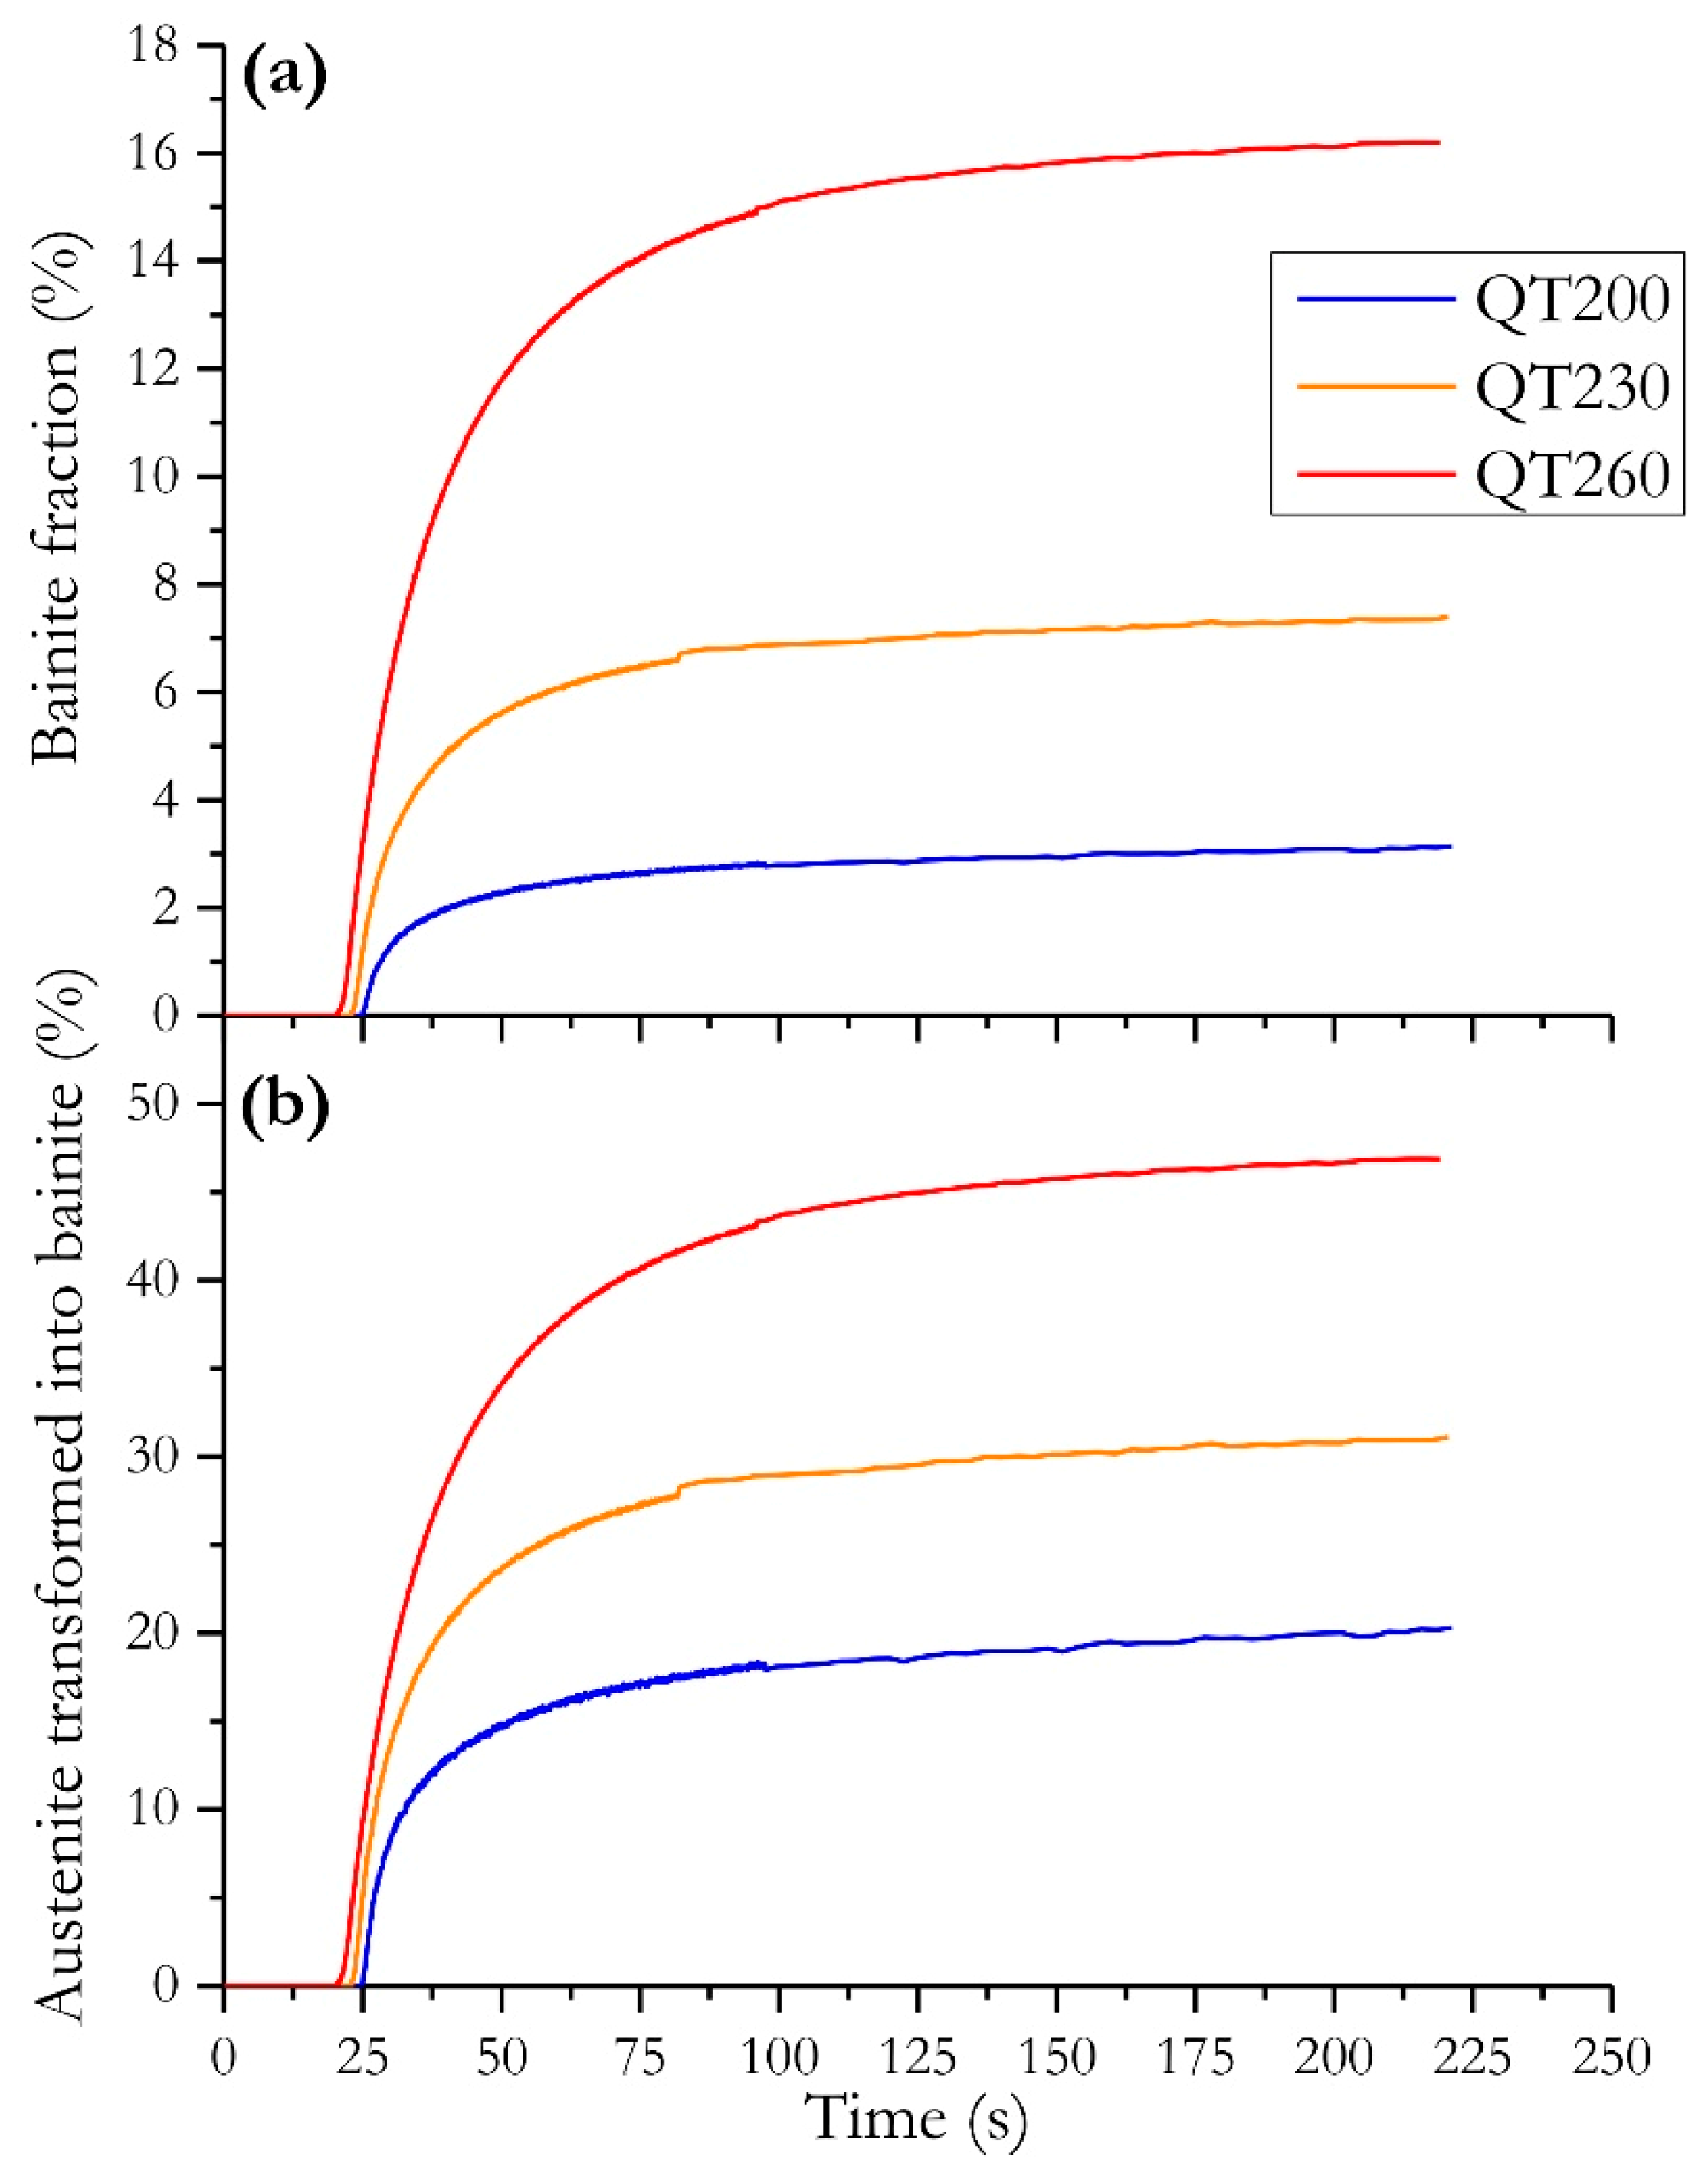
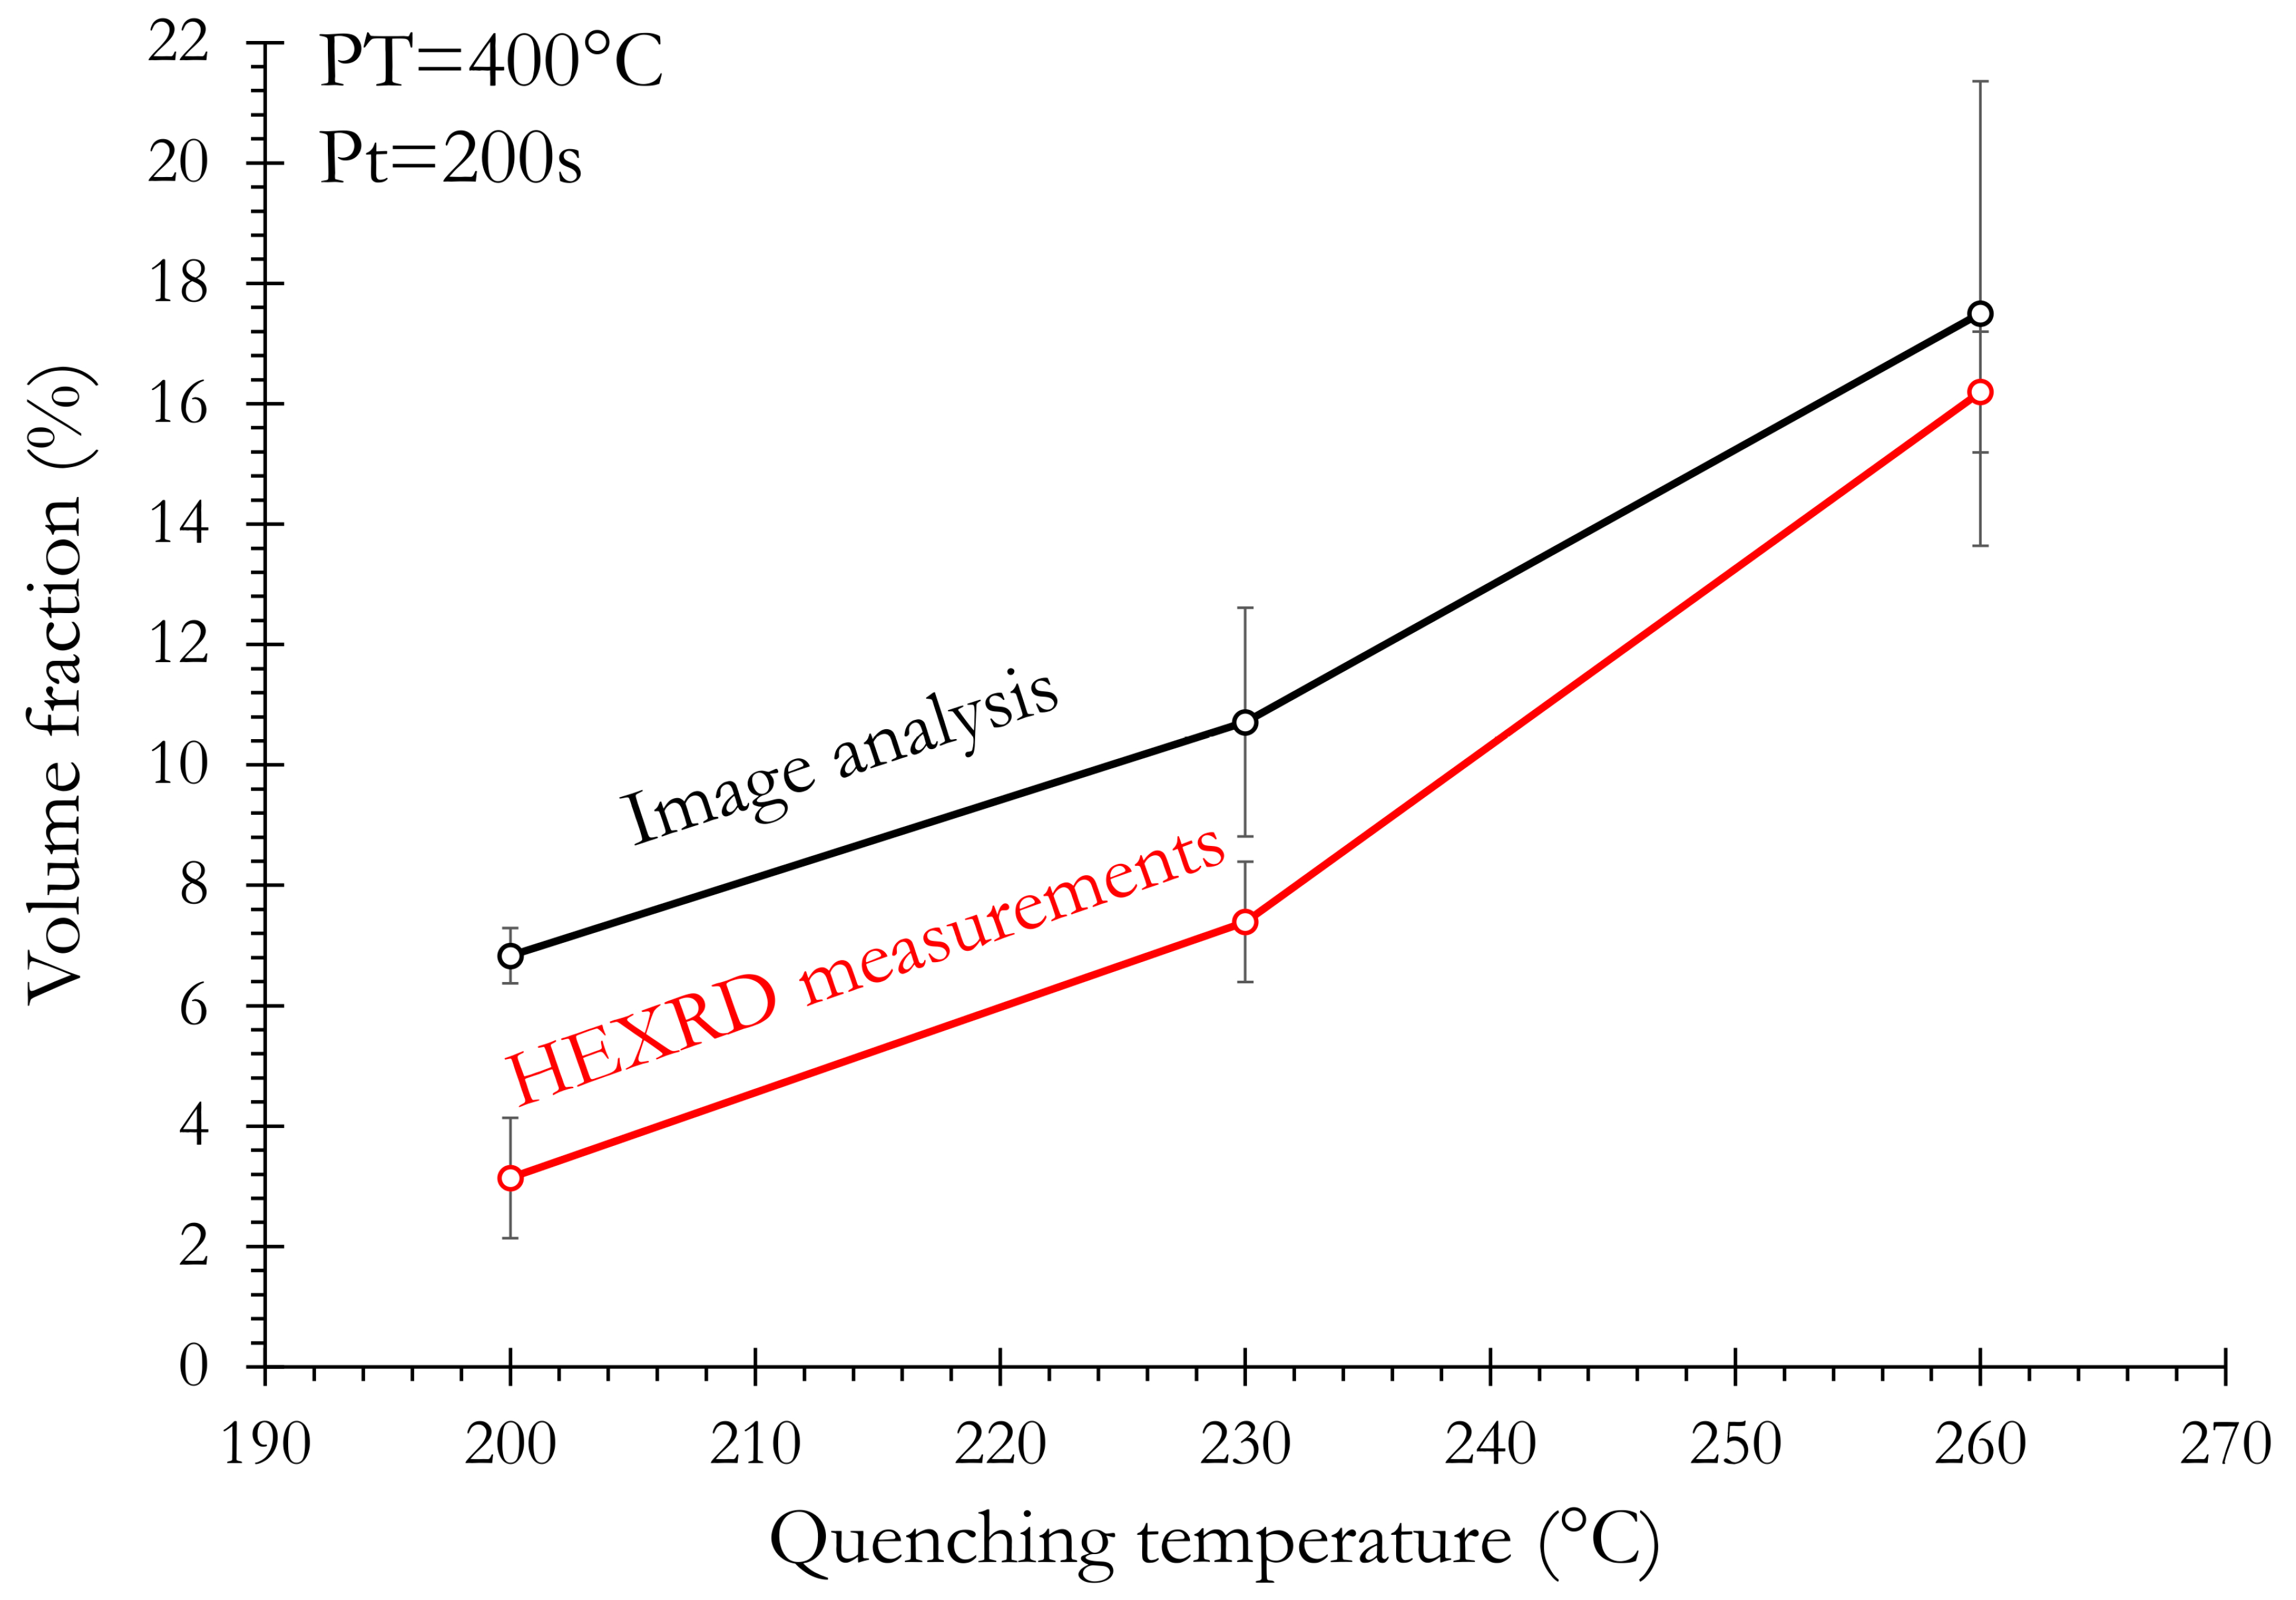
Carbide-free BCT bainite is formed within a very short range during the reheating and partitioning step. Its transformation rate and kinetics depend on the QT. The highest transformation rate (45%) was measured at QT = 260 °C. As a consequence, a significant part of the carbon enrichment observed in austenite can be attributed to bainite transformation;
(2)
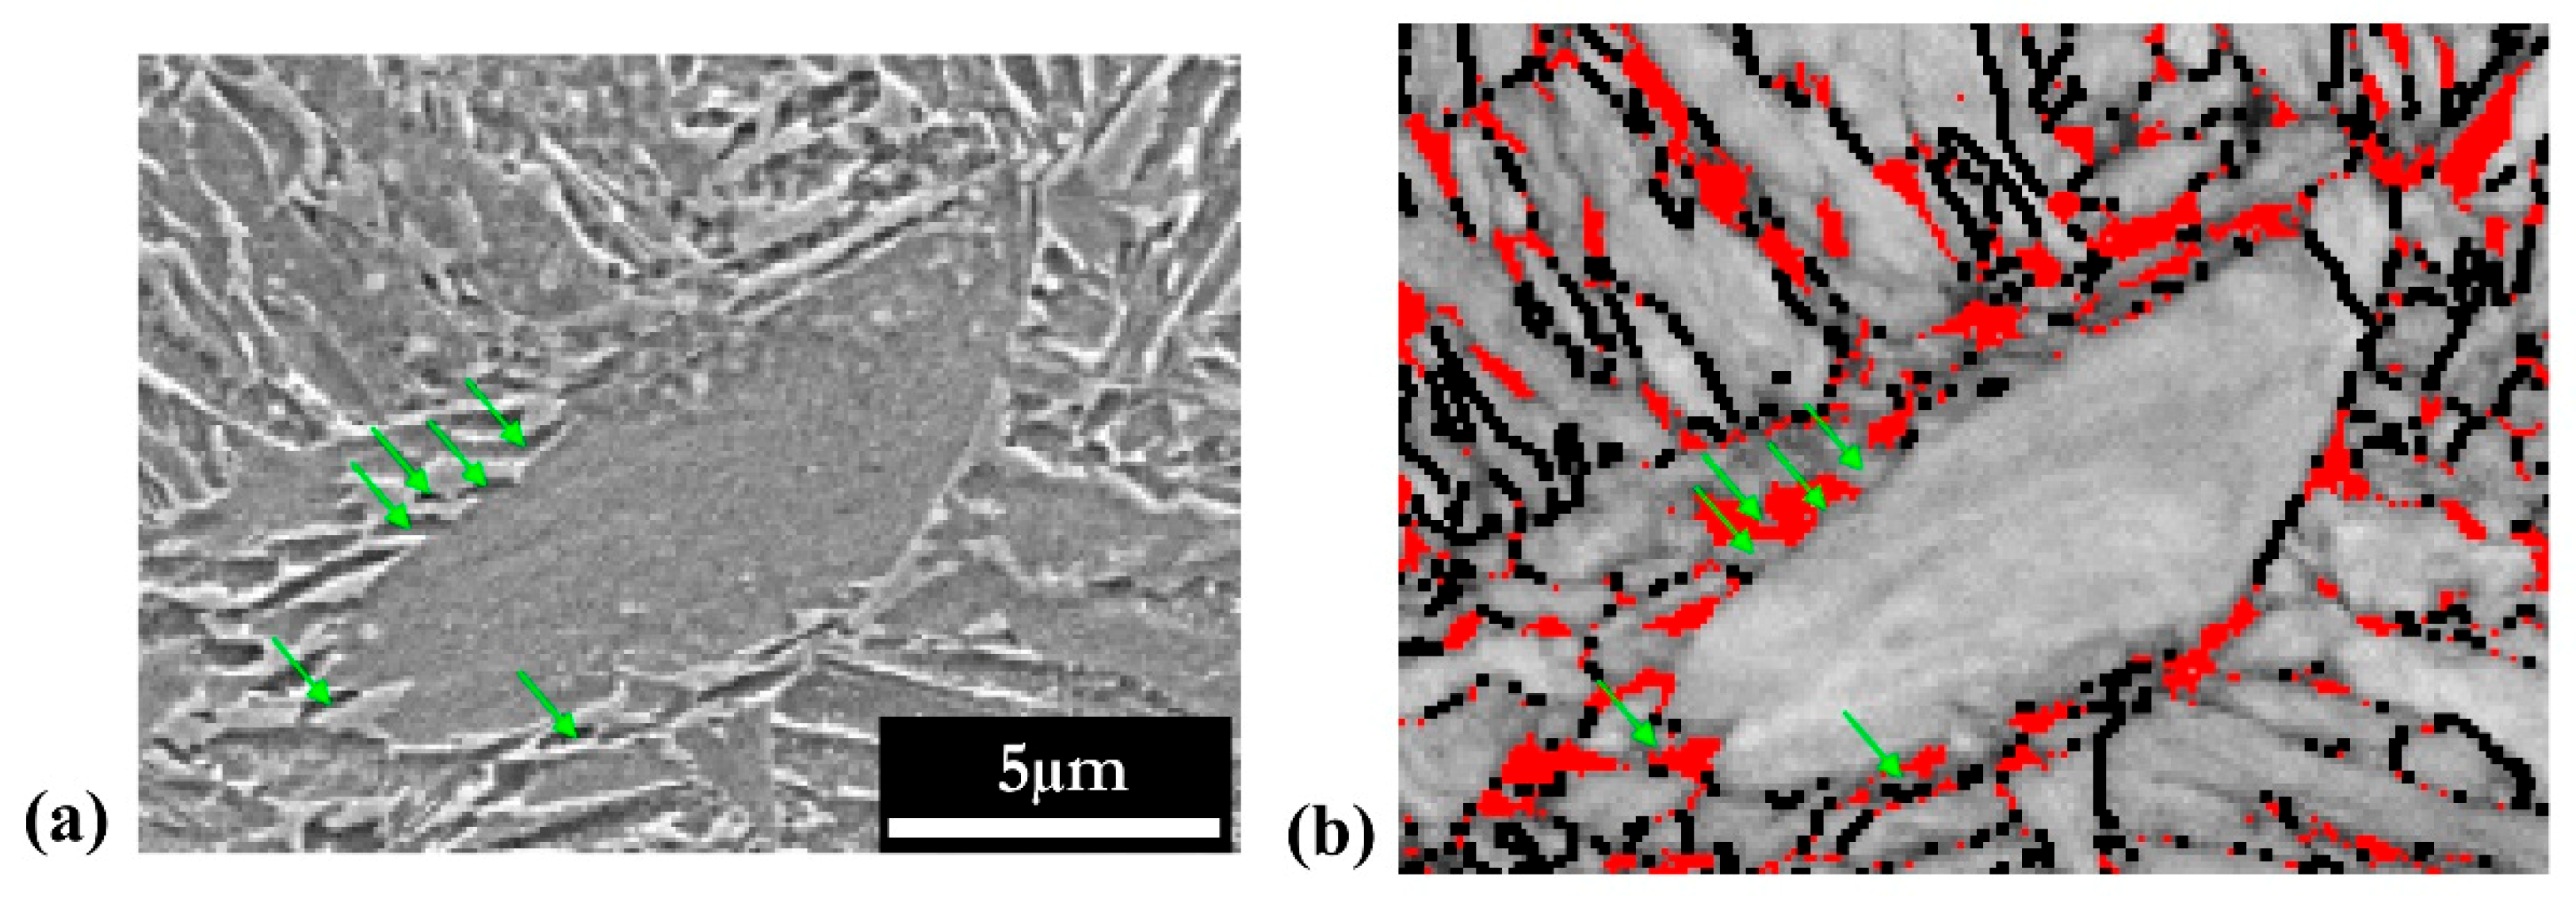
An image analysis methodology using SEM and EBSD was developed allowing the identification of bainite in Q&P steels;
(3)
A large part of carbon was shown to be trapped in martensite in the form of both Fe2.6C iron and segregation on lath boundaries. The energy for carbon segregation was determined to be 0.20 eV, and the carbon concentration on the lath boundaries was obtained to be around 25 at %. The carbon that is strongly trapped in martensite is a drag on carbon partitioning from martensite to austenite;
(4)
Thus, the carbon enrichment into austenite results from competitive reactions such as carbon partitioning from martensite, bainite transformation, and carbon trapping in martensite.

Author Contributions

Conceptualization, M.G. and S.A.; investigation, S.A., M.G., F.D., S.Y.P.A., G.G., S.G., M.S., and J.-C.H; writing—original draft preparation, S.A.; writing—review and editing, S.A., M.G., S.Y.P.A., M.S., and F.D.; project administration, S.Y.P.A.; funding acquisition, S.Y.P.A., M.G., F.D., and M.S.; All authors have read and agreed to the published version of the manuscript.

Funding

This work was supported by the French State through the project “CAPNANO” referenced by ANR-14-CE07-0029 and also through the program “Investment in the future” operated by the National Research Agency (ANR) and referenced by ANR-11-LABX-0008-01 (LabEx DAMAS). This work was partly carried out owing the experimental GENESIS platform. GENESIS is supported by the region Haute-Normandie, the Metropole Rouen Normandie, the CNRS via LABEX EMC, and the French National Research Agency as part of the program “Investissement d’Avenir” ANR 11-EQPX-002.

Acknowledgments

The synchrotron experiments were realized in December 2016 under the P160 grant at DESY PETRA P-07 in Hamburg, which is fully acknowledged. The authors would like also to thank MATERALIA cluster (Region Grand Est) for their support.

Conflicts of Interest

The authors declare no conflict of interest.

References

  1. Iung, T.; Azuma, M.; Bouaziz, O.; Gouné, M.; Perlade, A.; Quidort, D. A Model for the Prediction of Microstructure and Mechanical Properties in Cold Rolled and Annealed TRIP Steels. Mater. Sci. Forum 2003, 426, 3849–3854. [Google Scholar] [CrossRef]
  2. Speer, J.G.; Matlock, D.K.; De Cooman, B.C.; Schroth, J.G. Carbon partitioning into austenite after martensite transformation. Acta Mater. 2003, 51, 2611–2622. [Google Scholar] [CrossRef]
  3. Speer, J.G.; Edmonds, D.V.; Rizzo, F.C.; Matlock, D.K. Partitioning of carbon from supersaturated plates of ferrite, with application to steel processing and fundamentals of the bainite transformation. Curr. Opin. Solid State Mater. Sci. 2004, 51, 2611–2622. [Google Scholar] [CrossRef]
  4. Hu, F.; Wu, K.M. Nanostructured high-carbon dual-phase steels. Scr. Mater. 2011, 65, 351–354. [Google Scholar] [CrossRef]
  5. De Knijf, D.; Petrov, R.; Föjer, C.; Kestens, L.A.I. Effect of fresh martensite on the stability of retained austenite in quenching and partitioning steel. Mater. Sci. Eng. A 2014, 615, 107–115. [Google Scholar] [CrossRef]
  6. Angeli, J.; Füreder, E.; Panholzer, M.; Kneissl, A.C. Etching Techniques for Characterizing the Phases of Low-Alloy Dual-Phase and TRIP Steels. Pract. Metallogr. 2006, 43, 489–504. [Google Scholar] [CrossRef]
  7. Clarke, A.J.; Speer, J.G.; Miller, M.K.; Hackenberg, R.E.; Edmonds, D.V.; Matlock, D.K.; Rizzo, F.C.; Clarke, K.D.; De Moor, E. Carbon partitioning to austenite from martensite or bainite during the quench and partition (Q&P) process: A critical assessment. Acta Mater. 2008, 56, 16–22. [Google Scholar]
  8. Gouné, M.; Danoix, F.; Allain, S.; Bouaziz, O. Unambiguous carbon partitioning from martensite to austenite in Fe-C-Ni alloys during quenching and partitioning. Scr. Mater. 2013, 68, 1004–1007. [Google Scholar] [CrossRef]
  9. Caballero, F.G.; Miller, M.K.; Clarke, A.J.; Garcia-Mateo, C. Examination of carbon partitioning into austenite during tempering of bainite. Scr. Mater. 2010, 63, 442–445. [Google Scholar] [CrossRef] [Green Version]
  10. Allain, S.Y.P.; Geandier, G.; Hell, J.C.; Soler, M.; Danoix, F.; Gouné, M. In-situ investigation of quenching and partitioning by High Energy X-Ray Diffraction experiments. Scr. Mater. 2017, 131, 15–18. [Google Scholar] [CrossRef]
  11. Santofimia, M.J.; Zhao, L.; Sietsma, J. Overview of Mechanisms Involved During the Quenching and Partitioning Process in Steels. Met. Mater. Trans. A 2011, 42, 3620–3626. [Google Scholar] [CrossRef] [Green Version]
  12. Huyghe, P.; Caruso, M.; Collet, J.; Dépinoy, S.; Godet, S. Into the quenching & partitioning of a 0.2C steel: An in-situ synchrotron study. Mater. Sci. Eng. A 2019, 743, 175–184. [Google Scholar]
  13. Rietveld, H.M. A profile refinement method for nuclear and magnetic structures. J. Appl. Crystallogr. 1969, 2, 65–71. [Google Scholar] [CrossRef]
  14. Young, R.A. Introduction to the Rietveld method. In The Rietveld Method; Young, R.A., Ed.; Oxford University Press: Oxônia, UK, 1993; pp. 1–38. [Google Scholar]
  15. Epp, J.; Hirsch, T.; Curfs, C. In situ X-Ray Diffraction Analysis of Carbon Partitioning during Quenching of Low Carbon Steel. Metall. Mater. Trans. A 2012, 43, 2210–2217. [Google Scholar] [CrossRef]
  16. Aoued, S. Study of the Mechanisms of Carbon Enrichment in Austenite in Q&P Steels. Ph.D. Thesis, Université de Bordeaux, Bordeaux, France, 2019. [Google Scholar]
  17. van Bohemen, S.M.C. Bainite and martensite start temperature calculated with exponential carbon dependence. Mater. Sci. Technol. 2012, 28, 487–495. [Google Scholar] [CrossRef]
  18. Allain, S.Y.P.; Aoued, S.; Quintin-Poulon, A.; Gouné, M.; Danoix, F.; Hell, J.-C.; Bouzat, M.; Soler, M.; Geandier, G. In Situ Investigation of the Iron Carbide Precipitation Process in a Fe-C-Mn-Si Q&P Steel. Materials 2018, 11, 1087. [Google Scholar] [CrossRef] [Green Version]
  19. Navarro-Lopez, A.; Hidalgo, J.; Sietsma, J.; Santofimia, M.J. Characterization of bainitic/martensitic structures formed in isothermal treatments below the MS temperature. Mater. Charact. 2017, 128, 248–256. [Google Scholar] [CrossRef]
  20. ASTM E562-02. Standard Test Method for Determining Volume Fraction by Systematic Manual Point Count; ASTM International: West Conshohocken, PA, USA, 2002; ISBN 5957529001. [Google Scholar]
  21. Hulme-Smith, C.N.; Lonardelli, I.; Dippel, A.C.; Bhadeshia, H.K.D.H. Experimental evidence for non-cubic bainitic ferrite. Scr. Mater. 2013, 69, 409–412. [Google Scholar] [CrossRef] [Green Version]
  22. Garcia-Mateo, C.; Jimenez, J.A.; Yen, H.W.; Miller, M.K.; Morales-Rivas, L.; Kuntz, M.; Ringer, S.P.; Yang, J.R.; Caballero, F.G. Low temperature bainitic ferrite: Evidence of carbon super-saturation and tetragonality. Acta Mater. 2015, 91, 162–173. [Google Scholar] [CrossRef] [Green Version]
  23. Zener, C. Theory of strain interaction of solute atoms. Phys. Rev. 1948, 74, 639–647. [Google Scholar] [CrossRef]
  24. Caballero, F.G.; Garcia-Mateo, C.; Santofimia, M.J.; Miller, M.K.; García de Andrés, C. New experimental evidence on the incomplete transformation phenomenon in steel. Acta Mater. 2009, 57, 8–17. [Google Scholar] [CrossRef] [Green Version]
  25. Caballero, F.G.; Miller, M.K.; Garcia-Mateo, C.; Cornide, J.; Santofimia, M.J. Temperature dependence of carbon supersaturation of ferrite in bainitic steels. Scr. Mater. 2012, 67, 846–849. [Google Scholar] [CrossRef] [Green Version]
  26. Mirzayev, D.A.; Mirzoev, A.A.; Buldashev, I.V.; Okishev, K.Y. Thermodynamic analysis of the formation of tetragonal bainite in steels. Phys. Met. Metallogr. 2017, 118, 517–523. [Google Scholar] [CrossRef]
  27. Toji, Y.; Miyamoto, G.; Raabe, D. Carbon partitioning during quenching and partitioning heat treatment accompanied by carbide precipitation. Acta Mater. 2015, 86, 137–147. [Google Scholar] [CrossRef]
  28. Larson, D.J.; Prosa, T.J.; Ulfig, R.M.; Geiser, B.P.; Kelly, T.F. Local Electrode Atom Probe Tomography; Springer: New York, NY, USA, 2013; ISBN 978-1-4614-8720-3. [Google Scholar]
  29. Pierce, D.T.; Coughlin, D.R.; Williamson, D.L.; Clarke, K.D.; Clarke, A.J.; Speer, J.G.; Moor, E. De Characterization of transition carbides in quench and partitioned steel microstructures by Mössbauer spectroscopy and complementary techniques. Acta Mater. 2015, 90, 417–430. [Google Scholar] [CrossRef] [Green Version]
  30. Pierce, D.T.; Coughlin, D.R.; Williamson, D.L.; Kähkönen, J.; Clarke, A.J.; Clarke, K.D.; Speer, J.G.; Moor, E. De Quantitative investigation into the influence of temperature on carbide and austenite evolution during partitioning of a quenched and partitioned steel. Scr. Mater. 2016, 121, 5–9. [Google Scholar] [CrossRef] [Green Version]
  31. Lu, W.; Herbig, M.; Liebscher, C.H.; Morsdorf, L.; Marceau, R.K.W.; Dehm, G.; Raabe, D. Formation of eta carbide in ferrous martensite by room temperature aging. Acta Mater. 2018, 158, 297–312. [Google Scholar] [CrossRef]
  32. Maugis, P.; Hoummada, K. A methodology for the measurement of the interfacial excess of solute at a grain boundary. Scr. Mater. 2016, 120, 90–93. [Google Scholar] [CrossRef]
  33. Pierce, D.T.; Coughlin, D.R.; Clarke, K.D.; De Moor, E.; Poplawsky, J.; Williamson, D.L.; Mazumder, B.; Speer, J.G.; Hood, A.; Clarke, A.J. Microstructural evolution during quenching and partitioning of 0.2C–1.5Mn-1.3Si steels with Cr or Ni additions. Acta Mater. 2018, 151, 454–469. [Google Scholar] [CrossRef]
  34. Clarke, A.J.; Miller, M.K.; Field, R.D.; Coughlin, D.R.; Gibbs, P.J.; Clarke, K.D.; Alexander, D.J.; Powers, K.A.; Papin, P.A.; Krauss, G. Atomic and nanoscale chemical and structural changes in quenched and tempered 4340 steel. Acta Mater. 2014, 77, 17–27. [Google Scholar] [CrossRef]
  35. Xiao, Y.; Li, W.; Zhao, H.S.; Lu, X.W.; Jin, X.J. Investigation of carbon segregation during low temperature tempering in a medium carbon steel. Mater. Charact. 2016, 117, 84–90. [Google Scholar] [CrossRef]
  36. Da Rosa, G. Mécanismes et Conséquences de La Ségrégation du Bore Aux Joints de Grains Austénitiques Dans Les Aciers à Très Haute Résistance. Ph.D. Thesis, Université d’Aix-Marseille, Marseille, France, 2018. [Google Scholar]
  37. Jang, J.H.; Bhadeshia, H.K.D.H.; Suh, D.W. Solubility of carbon in tetragonal ferrite in equilibrium with austenite. Scr. Mater. 2013, 68, 195–198. [Google Scholar] [CrossRef]
  38. Clouet, E.; Garruchet, S.; Nguyen, H.; Perez, M.; Becquart, C.S. Dislocation interaction with C in α-Fe: A comparison between atomic simulations and elasticity theory. Acta Mater. 2008, 56, 3450–3460. [Google Scholar] [CrossRef] [Green Version]
  39. Cochardt, A.W.; Schoek, G.; Wiedersich, H. Interaction between dislocations and interstitial atoms in body-centered cubic metals. Acta Metall. 1955, 3, 533–537. [Google Scholar] [CrossRef]
  40. Kalish, D.; Cohen, M. Structural changes and strengthening in the strain tempering of martensite. Mater. Sci. Eng. 1970, 6, 156–166. [Google Scholar] [CrossRef]
  41. Speich, G.R. Tempering of low-carbon martensite. Trans. TMS-AIME 1969, 245, 2553–2564. [Google Scholar]
Figure 1. Schematic representation of the experimental setup as used at the Deutsches Elektronen-Synchrotron (DESY) beamline P07.
Metals 10 00137 g001
Figure 2. The three quenching and partitioning (Q&P) conditions studied by high-energy X-ray diffraction (HEXRD).
Metals 10 00137 g002
Figure 3. Critical times selected in the thermal treatment corresponding to (QT = 200 °C PT/Pt = 400 °C/200 s). PT: partitioning temperature, QT: quenching temperature.
Metals 10 00137 g003
Figure 4. Diffractograms corresponding to the critical times selected in Figure 3.
Metals 10 00137 g004
Figure 5. Evolution of the phase fraction during the Q&P treatment for the three QTs studied.
Metals 10 00137 g005
Figure 6. Evolution of (a) the new body-centered tetragonal (BCT) fraction and (b) amount of austenite transformed into new BCT for the three QTs studied.
Metals 10 00137 g006
Figure 7. SEM images of a Q&P sample (QT = 230 °C PT/t = 400 °C/0 s). (a) The carbon-rich martensite/austenite (MA) islands appear unetched and the carbon depleted phases appear etched, (b) delineation of the MA island features on the SEM image of the Q&P sample (QT = 230 °C PT/t = 400 °C/0 s).
Metals 10 00137 g007
Figure 8. SEM image of the Q&P sample (QT = 230 °C PT/t = 400 °C/0 s) after having filled in black all the MA islands phases.
Metals 10 00137 g008
Figure 9. SEM image of a bainite lath together with a martensite lath with poorly defined carbides.
Metals 10 00137 g009
Figure 10. Comparison of the evolution of the bainite fraction measured by image analysis (black curve) and the new BCT phase measured by high-energy X-ray diffraction (HEXRD) (red curve) (QT = 230 °C PT/t = 400 °C).
Metals 10 00137 g010
Figure 11. Comparison of bainite fraction measured by image analysis (black curve) and the new BCT phase measured by HEXRD (red curve) at the end of the partitioning step for the three QTs.
Metals 10 00137 g011
Figure 12. (a) Z-direction inverse pole figure (IPF-Z) map of a sample after Q&P treatment (QT = 230 °C and PT/t = 400 °C/200 s) (b) Band contrast and 10° grain boundaries (in black) together with retained austenite (in red) and prior austenite grain boundary (PAGB) (in yellow).
Metals 10 00137 g012
Figure 13. Zoom of Zone 1 in Figure 12. (a) SEM image (b) Band contrast and 10° grain boundaries (in black) together with retained austenite (in red) of the same zone than (a) obtained by EBSD. Yellow circles: martensite/austenite (MA) islands. Green arrows: bainite.
Metals 10 00137 g013
Figure 14. Large martensite lath with surrounding bainite laths (green arrows). (a) SEM image (b) Band contrast and 10° grain boundaries (in black) together with retained austenite (in red) of the same zone than a) obtained by EBSD.
Metals 10 00137 g014
Figure 15. Carbon distribution map in martensite with three carbides (QT200/200s). The total volume analyzed was 30 nm × 30 nm × 140 nm containing 20 × 105 ions. Each red dot is one individual carbon atom detected.
Metals 10 00137 g015
Figure 16. Carbon distribution map in martensite with one carbide (QT200/200 s). The total volume analyzed was 60 nm × 60 nm × 500 nm containing 37 × 106 ions. A 5 at % C isosurface is also represented in red to highlight the carbide.
Metals 10 00137 g016
Figure 17. Proxigrams corresponding to the carbides in Figure 15 and Figure 16 (QT200/200 s).
Metals 10 00137 g017
Figure 18. Impact of the inclination angle on the measurements of carbon concentration of carbides during atom probe tomography (APT) experiments.
Metals 10 00137 g018
Figure 19. Carbon distribution maps in martensite showing two carbon segregations on lath boundaries in tip n°1 and tip n°2 (LB04 and LB05) (QT200 PT/t = 400 °C/0 s).
Metals 10 00137 g019
Figure 20. Carbon distribution maps in martensite showing three carbon segregations on lath boundaries in tip n°4, tip n°5, and tip n°6 (LB201, LB202, and LB203) (QT200 PT/t = 400 °C/200 s).
Metals 10 00137 g020
Figure 21. Concentration profiles (black solid line) of the lath boundaries (LBs) presented in Figure 20 along with the integral (dashed red line) representing the excess fraction (QT200 PT/t = 400 °C/200 s).
Metals 10 00137 g021
Table 1. New BCT starting temperature for the three QT conditions.
Quenching ConditionNew BCT Start Temperature
QT200381 °C
QT230369 °C
QT260335 °C
Table 2. The different features and characteristics of martensite/austenite islands in the Q&P microstructure.
FeatureCharacteristics
Large islands
Metals 10 00137 i001
Large block of martensite/austenite
Smooth surface
Length: 400 nm to 6 µm
May present internal structure
Phase: fresh martensite + retained austenite
Packets of small laths
Metals 10 00137 i002
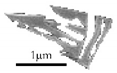
Groups of thin laths
Length of individual laths: 200 to 900 nm
Phase: retained austenite
Long laths
Metals 10 00137 i003
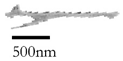
Long thin laths surrounded by other BCT phases
Appears quite bright
Length: 1–2.5 µm
Very high aspect ratio
Phase: retained austenite
Table 3. The different features and characteristics of the other BCT phases in the Q&P microstructure.
FeatureCharacteristics
Large laths with carbides
Metals 10 00137 i004
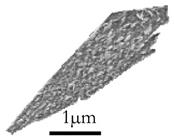
Long laths
Contain carbides
Length: 1–5 µm
Phase: tempered martensite
Small carbide-free laths
Metals 10 00137 i005
Thin acicular shaped laths
Carbide free
Length: 200–800 nm
Phase: bainite
Small laths in large MA Islands
Metals 10 00137 i006
MA Islands (in grey) with embedded bainite (yellow contouring)
Length: 200–800 na
Phase: bainite
Table 4. Results of the measurements of carbon segregation on lath boundaries for different Q&P conditions.
HeadingHeading X e x (%.nm) Γ (at.nm−2) X (at%) Γ Γ m a x (%)Es (eV)%C (%at)
QT200_400/0 sLB04 (tip n°1)10.258.240.5211.450.17925.41
LB05 (tip n°2)10.258.240.9011.450.14925.41
Average10.258.240.7111.450.16425.41
QT200_400/200 sLB201 (tip n°3)14.0411.300.5015.680.20231.82
LB202 (tip n°4)10.248.240.2011.440.23325.40
LB203 (tip n°5)8.066.480.569.000.16021.13
Average9.157.360.3810.220.19723.26

