Article

Temperature Dependence of the Static and Dynamic Behaviour in a Quenching and Partitioning Processed Low-Si Steel

by
Florian Vercruysse
1,*,
Carola Celada-Casero
2,3,
Bernd M. Linke
4,
Patricia Verleysen
1 and
Roumen H. Petrov
1,2
1
Department of Electromechanical, Systems & Metal Engineering, Research Group Materials Science and Technology, Ghent University, Tech Lane Science Park Campus A, 9052 Zwijnaarde, Belgium
2
Department of Materials Science and Engineering, Delft University of Technology, Mekelweg 2, 2628 CD, 2600AA Delft, The Netherlands
3
Tata Steel Europe, P.O. Box 10000, 1970 CA, 19700 IJmuiden, The Netherlands
4
ThyssenKrupp Steel Europe AG, Kaiser-Wilhelm-Strasse 100, DE-47166 Duisburg, Germany
*
Author to whom correspondence should be addressed.
Metals 2020, 10(4), 509; https://doi.org/10.3390/met10040509
Submission received: 1 April 2020 / Revised: 11 April 2020 / Accepted: 13 April 2020 / Published: 15 April 2020
(This article belongs to the Special Issue Advanced High Strength Steels by Quenching and Partitioning)

Abstract

:
Because of their excellent combination of strength and ductility, quenching and partitioning (Q & P) steels have a great chance of being added to the third generation of advanced high strength steels. The large ductility of Q & P steels arises from the presence of 10% to 15% of retained austenite which postpones necking due to the transformation induced plasticity (TRIP) effect. Moreover, Q & P steels show promising forming properties with favourable Lankford coefficients, while their planar anisotropy is low due to a weak texture. The stability of the metastable austenite is the key to obtain tailored properties for these steels. To become part of the newest generation of advanced high strength steels, Q & P steels have to preserve their mechanical properties at dynamic strain rates and over a wide range of temperatures. Therefore, in the present study, a low-Si Q & P steel was tested at temperatures from −40 °C to 80 °C and strain rates from 0.001 s−1 to 500 s−1. Results show that the mechanical properties are well-preserved at the lowest temperatures. Indeed, at −40 °C and room temperature, no significant loss of the deformation capacity is observed even at dynamic strain rates. This is attributed to the presence of a large fraction of austenite that is so (thermally) stable that it does not transform in the absence of deformation. In addition, the high stability of the austenite decreases the elongation at high test temperatures (80 °C). The additional adiabatic heating in the dynamic tests causes the largest reduction of the uniform strain for the samples tested at 80 °C. Quantification of the retained austenite fraction in the samples after testing confirmed that, at the highest temperature and strain rate, the TRIP effect is suppressed.

1. Introduction

Driven by increasingly stringent emission and safety regulations, considerable research efforts have been devoted to the development of steels that meet the needs of the automotive industry. Since the early 1970s, a tremendous evolution in advanced high strength steels (AHSS) has taken place [1,2,3]. The first generation includes dual-phase (DP) and transformation induced plasticity (TRIP) steels. Even though generally low amounts of expensive alloying elements are used, these steels already provide a good combination of strength and ductility [4,5,6,7]. The second generation includes twinning induced plasticity (TWIP) and austenitic steels. These steels have excellent properties, though their use is limited because they require large amounts of expensive alloying elements such as Ni, Mn and Cr [8,9,10,11]. In recent years, a third generation of AHSS is being developed. Steels which may claim to be part of the third generation are medium to high manganese steels [12,13,14,15], complex phase steels [16], steels produced via severe plastic deformation [17] or ultrafast thermal processing routes [18,19,20,21], and quenched and partitioned (Q & P) steels [22,23].
Q & P steels first appeared in literature in 2003 and have gained research interest since then [23]. Q & P steels combine high strength and ductility because of their complex multi-phase microstructure. This microstructure is obtained by imposing a (two-step) thermal cycle to low carbon steel with Si/Al as most the important alloying elements. After initial austenisation, the material is quenched to the quenching temperature situated in between the martensite start (Ms) and martensite finish temperature (Mf). This creates a microstructure of martensite and austenite of equal carbon content. The fractions of both are determined by the quenching temperature [24]. In the second step, the material undergoes a partitioning step. Partitioning is carried out either at the quenching temperature or, very often, at a higher temperature, denoted as partitioning temperature. During the partitioning step, carbon is redistributed from the supersaturated martensite into the austenite, which increases the stability of the austenite phase [23,25]. The kinetic hindering of cementite/carbide formation by the presence of Si (and Al) during the partitioning allows the carbon to efficiently stabilise the austenite [26]. A final quench to room temperature results in a microstructure consisting of a carbon-depleted martensite matrix and 10–15% of retained austenite (RA). The latter allows benefiting from the TRIP effect, which postpones necking and leads to more homogenous straining and a high potential for energy absorption [27]. By the effects of varying process parameters, i.e., austenitisation temperature, quenching temperature, partitioning temperature and time on phase fractions, the microstructure and the mechanical properties have been extensively studied [25,28,29,30,31,32]. Additionally, the consequences of intercritical annealing resulting in a ferrite/martensite/retained austenite microstructure were investigated [33,34]. In [35,36] the partitioning potential of microalloying elements was assessed. Furthermore, the effect of the crystallographic orientation of the retained austenite on its stability was elaborated in [37].
The majority of AHSS applications are found in the automotive industry. The properties and performance of automotive steels at temperatures ranging from −40 °C to 80 °C are of great importance to spread their application to arctic environments and/or to mimic the temperature conditions close to the engine. The mechanical properties of Q & P steels, however, are to a large degree dependent on the temperature. The stability of retained austenite, i.e., its tendency to transform into martensite under straining, is highly temperature-dependent. Research has strongly focussed on low temperatures, since austenite might spontaneously, without imposed deformation, transform to martensite in an athermal manner when the temperature is lowered. Therefore, in [38], the low-temperature stability of RA grains was studied in unloaded as well as loaded conditions. Since the stability of RA at high temperatures is not considered to be critical, only a few studies are available regarding the high-temperature behaviour of Q & P steels [38].
Additionally, in the event of a car crash, automotive steels might be subjected to high strain rates which give rise to adiabatic heating of the material. Both the increased temperature and strain rate affect the mechanical response of steels, especially of steels with a (meta)stable austenite fraction. Several authors reported excellent behaviour of Q & P steels tested at high strain rates (500–2000 s−1), certainly concerning the deformation capacity [39,40].
Although static tests were performed at high and low temperatures and dynamic room temperature tests, all revealed interesting aspects on the mechanical behaviour of Q & P steels and limited to no data is available on the dynamic response of Q & P steels at temperatures different from room temperature. Assessment and understanding of the combined effect of high strain rates and temperatures deviating from room temperature on the metastable austenite are crucial in evaluating the potential of Q & P steels. Indeed, the outcome might be decisive for their claim to be part of the third generation advanced high strength steels.
Therefore, aiming at an in-depth understanding of the combined effect of strain rate and temperature, in the present study, results are presented of an extensive test series on a low-Si Q & P steel. Static and dynamic experiments, with strain rates ranging from 0.001 s−1 to 500 s−1, were performed at −40 °C, 20 °C and 80 °C. Additionally, the microstructure of the steel was investigated prior to and after testing using electron backscatter diffraction (EBSD). The thus obtained information on RA fraction and related TRIP effect at the studied temperatures was used to explain the observed mechanical response.

2. Materials

The start material was a steel with the chemical composition shown in Table 1.
The material was cast, hot-rolled and cold-rolled to a total cold rolling reduction of 50% into sheets with a final thickness of 1.5 mm and dimensions of 300 mm × 160 mm. Details on the hot rolling are reported in [41]. The microstructure of the material after hot rolling is a banded ferrite/pearlite structure [42]. The Q & P cycle was designed based on dilatometer measurements to maximise the fraction of retained austenite and to minimise the formation of fresh martensite during the final cooling to room temperature. Samples with dimensions 200 mm × 300 mm × 1.5 mm, oriented with their longest axis along the sheet rolling direction, were heated in a Vatron MULTIPAS annealing simulator (Vatron GmbH, Linz, Austria) to 870 °C and soaked for 100 s to homogenise the carbon content in the material. The Si content of the investigated steel (1.25 wt.% Si) enables full austenitisation at lower temperatures than in Q & P steels with, usually, higher Si contents. This is rather advantageous for industrial reasons. Although Si and Al have a similar effect on the hindering of cementite/carbide formation during partitioning, Al causes a significant increase in the AC3 temperature [43]. Subsequently, the material was quenched to 300 °C at which, according to the calculations based upon the Koistinen–Marburger model [24], the steel contains 11% retained austenite. This temperature was selected based on dilatometry experiments in order to have a high fraction of retained austenite without large fractions of fresh martensite. Indeed, fresh martensite was reported to be detrimental to the elongation properties of Q & P steels [44]. A partitioning temperature of 400 °C and duration of 50 s was chosen. The temperature of the process was controlled by a K1-type thermocouple and resulted in a homogenous heat-treated area of 100 mm × 200 mm × 1.5 mm from which the samples needed for mechanical testing, as well as microstructural analyses, were machined.

3. Experimental Techniques

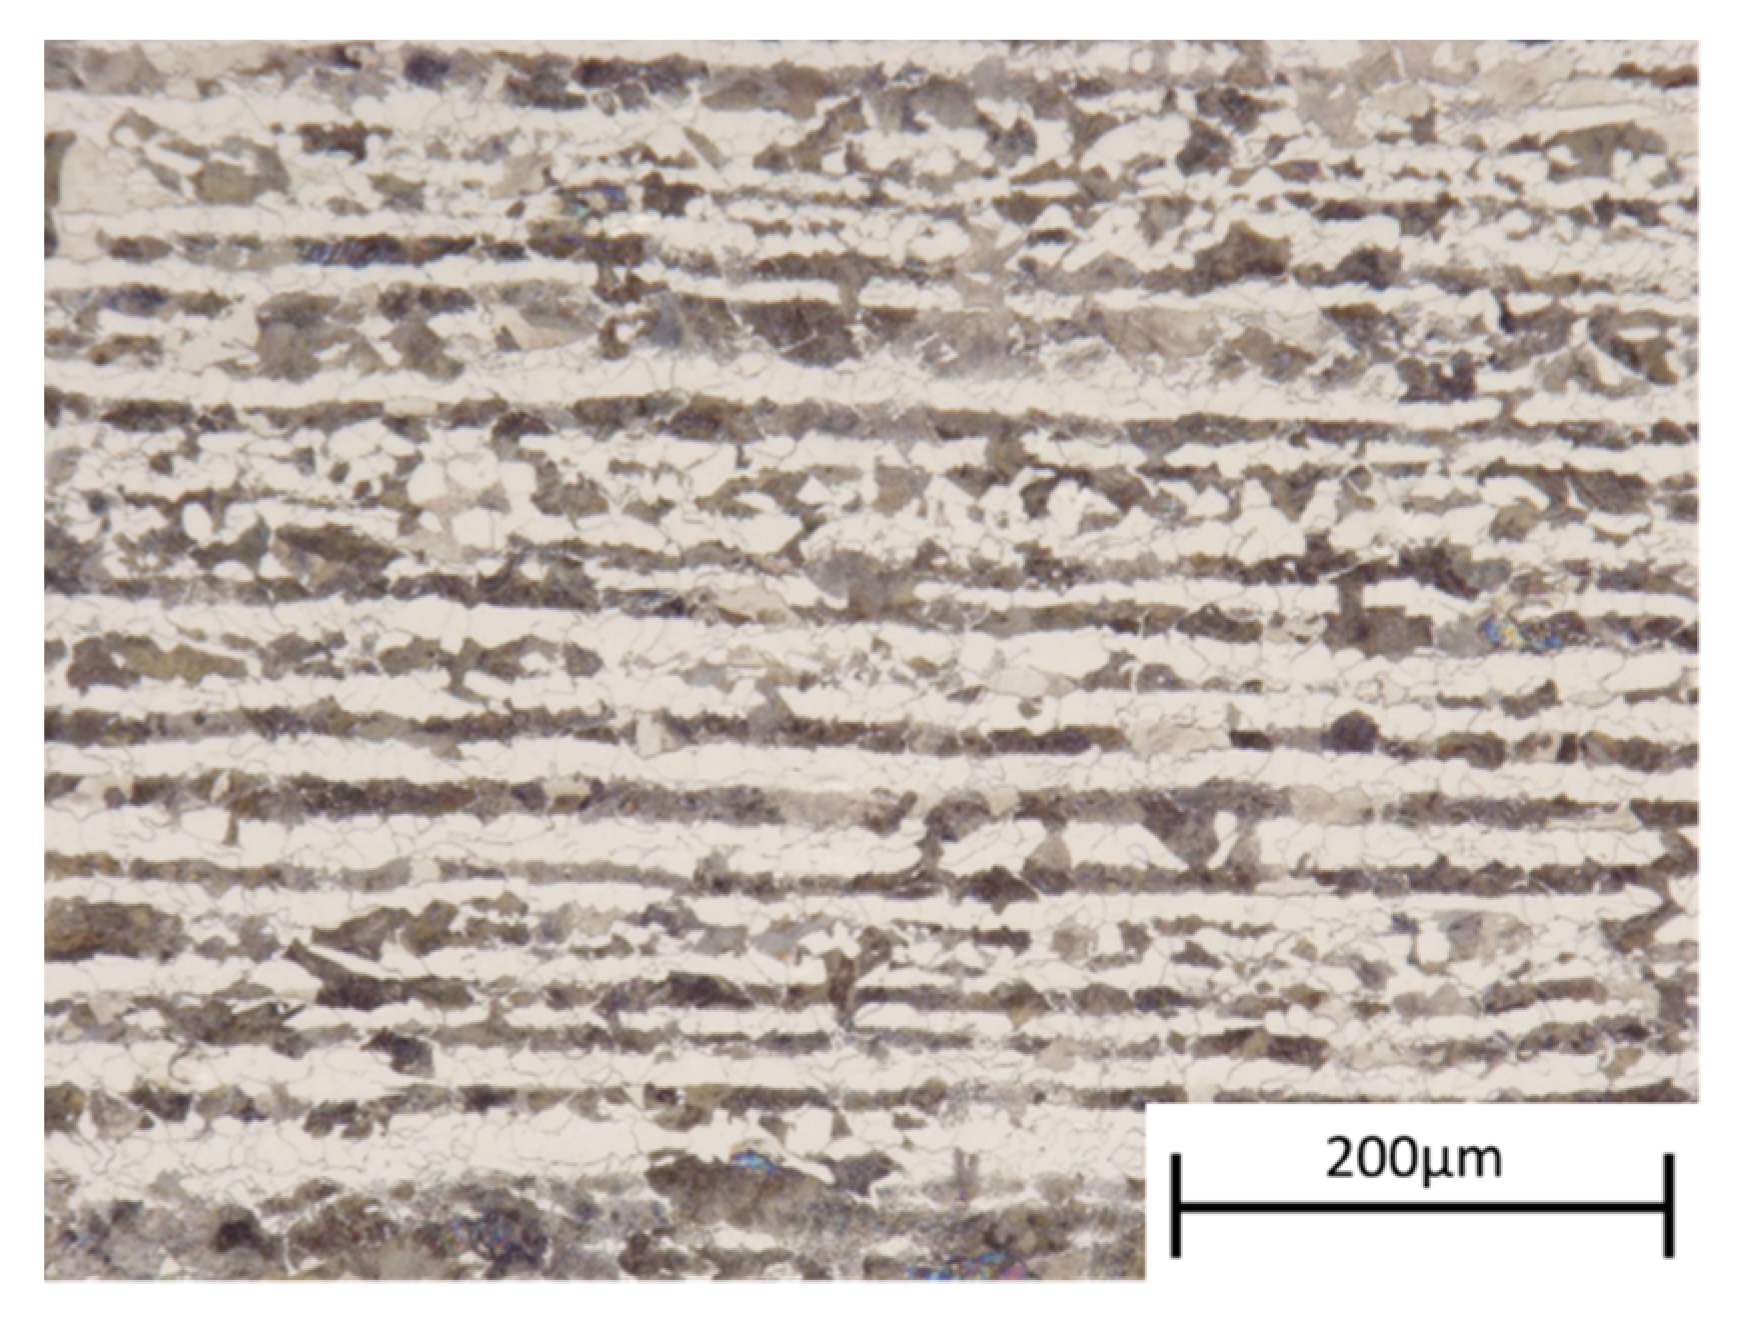
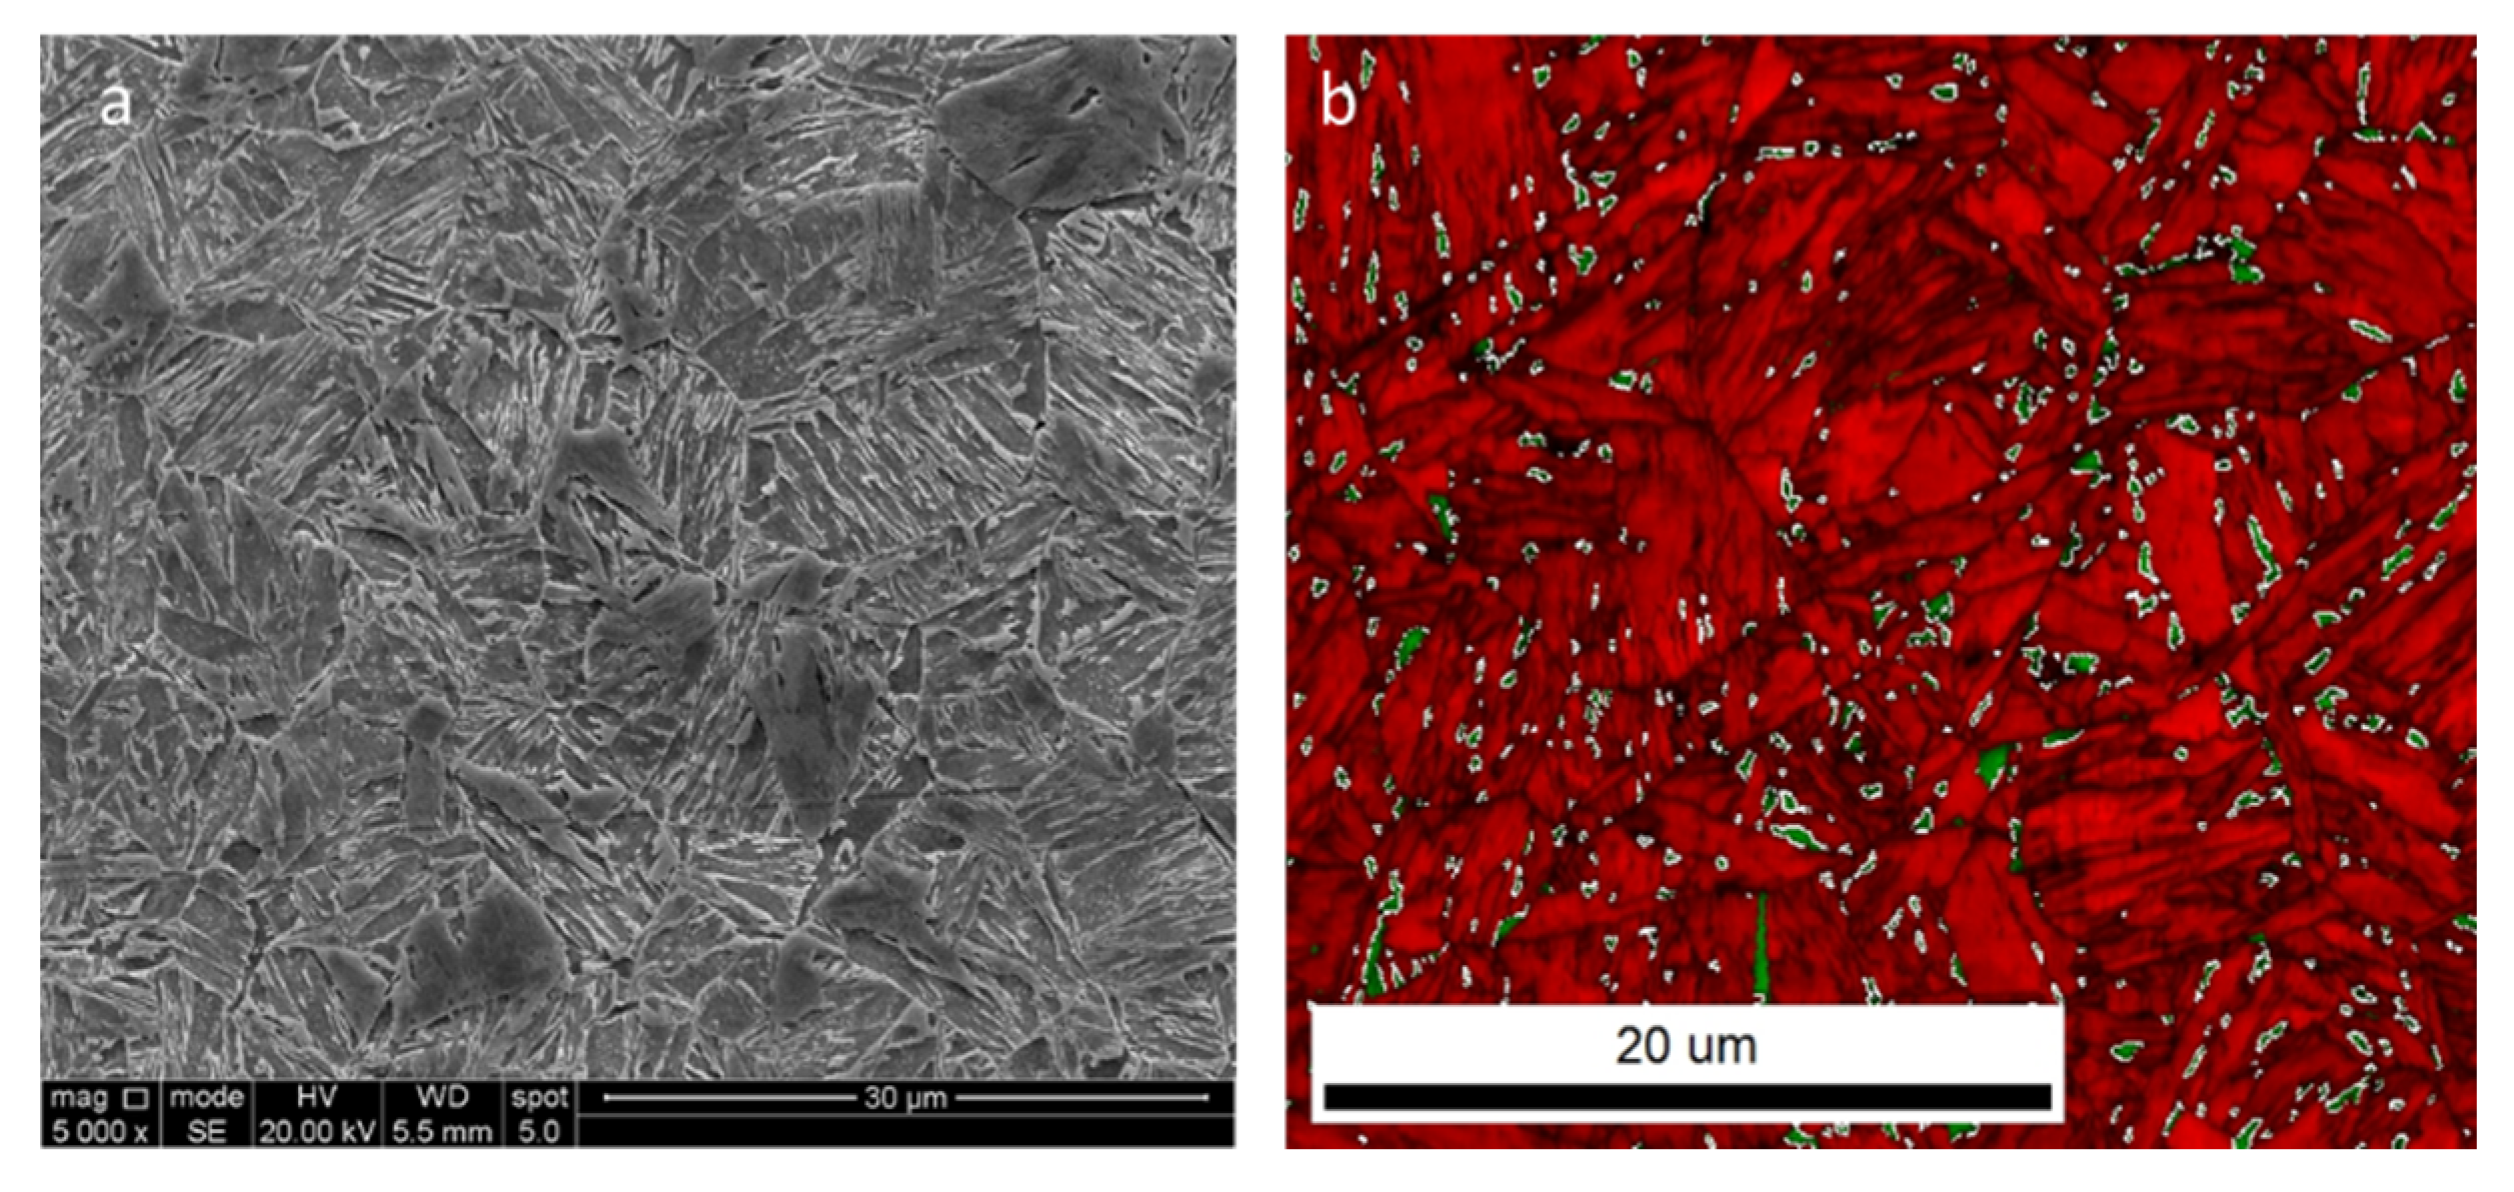
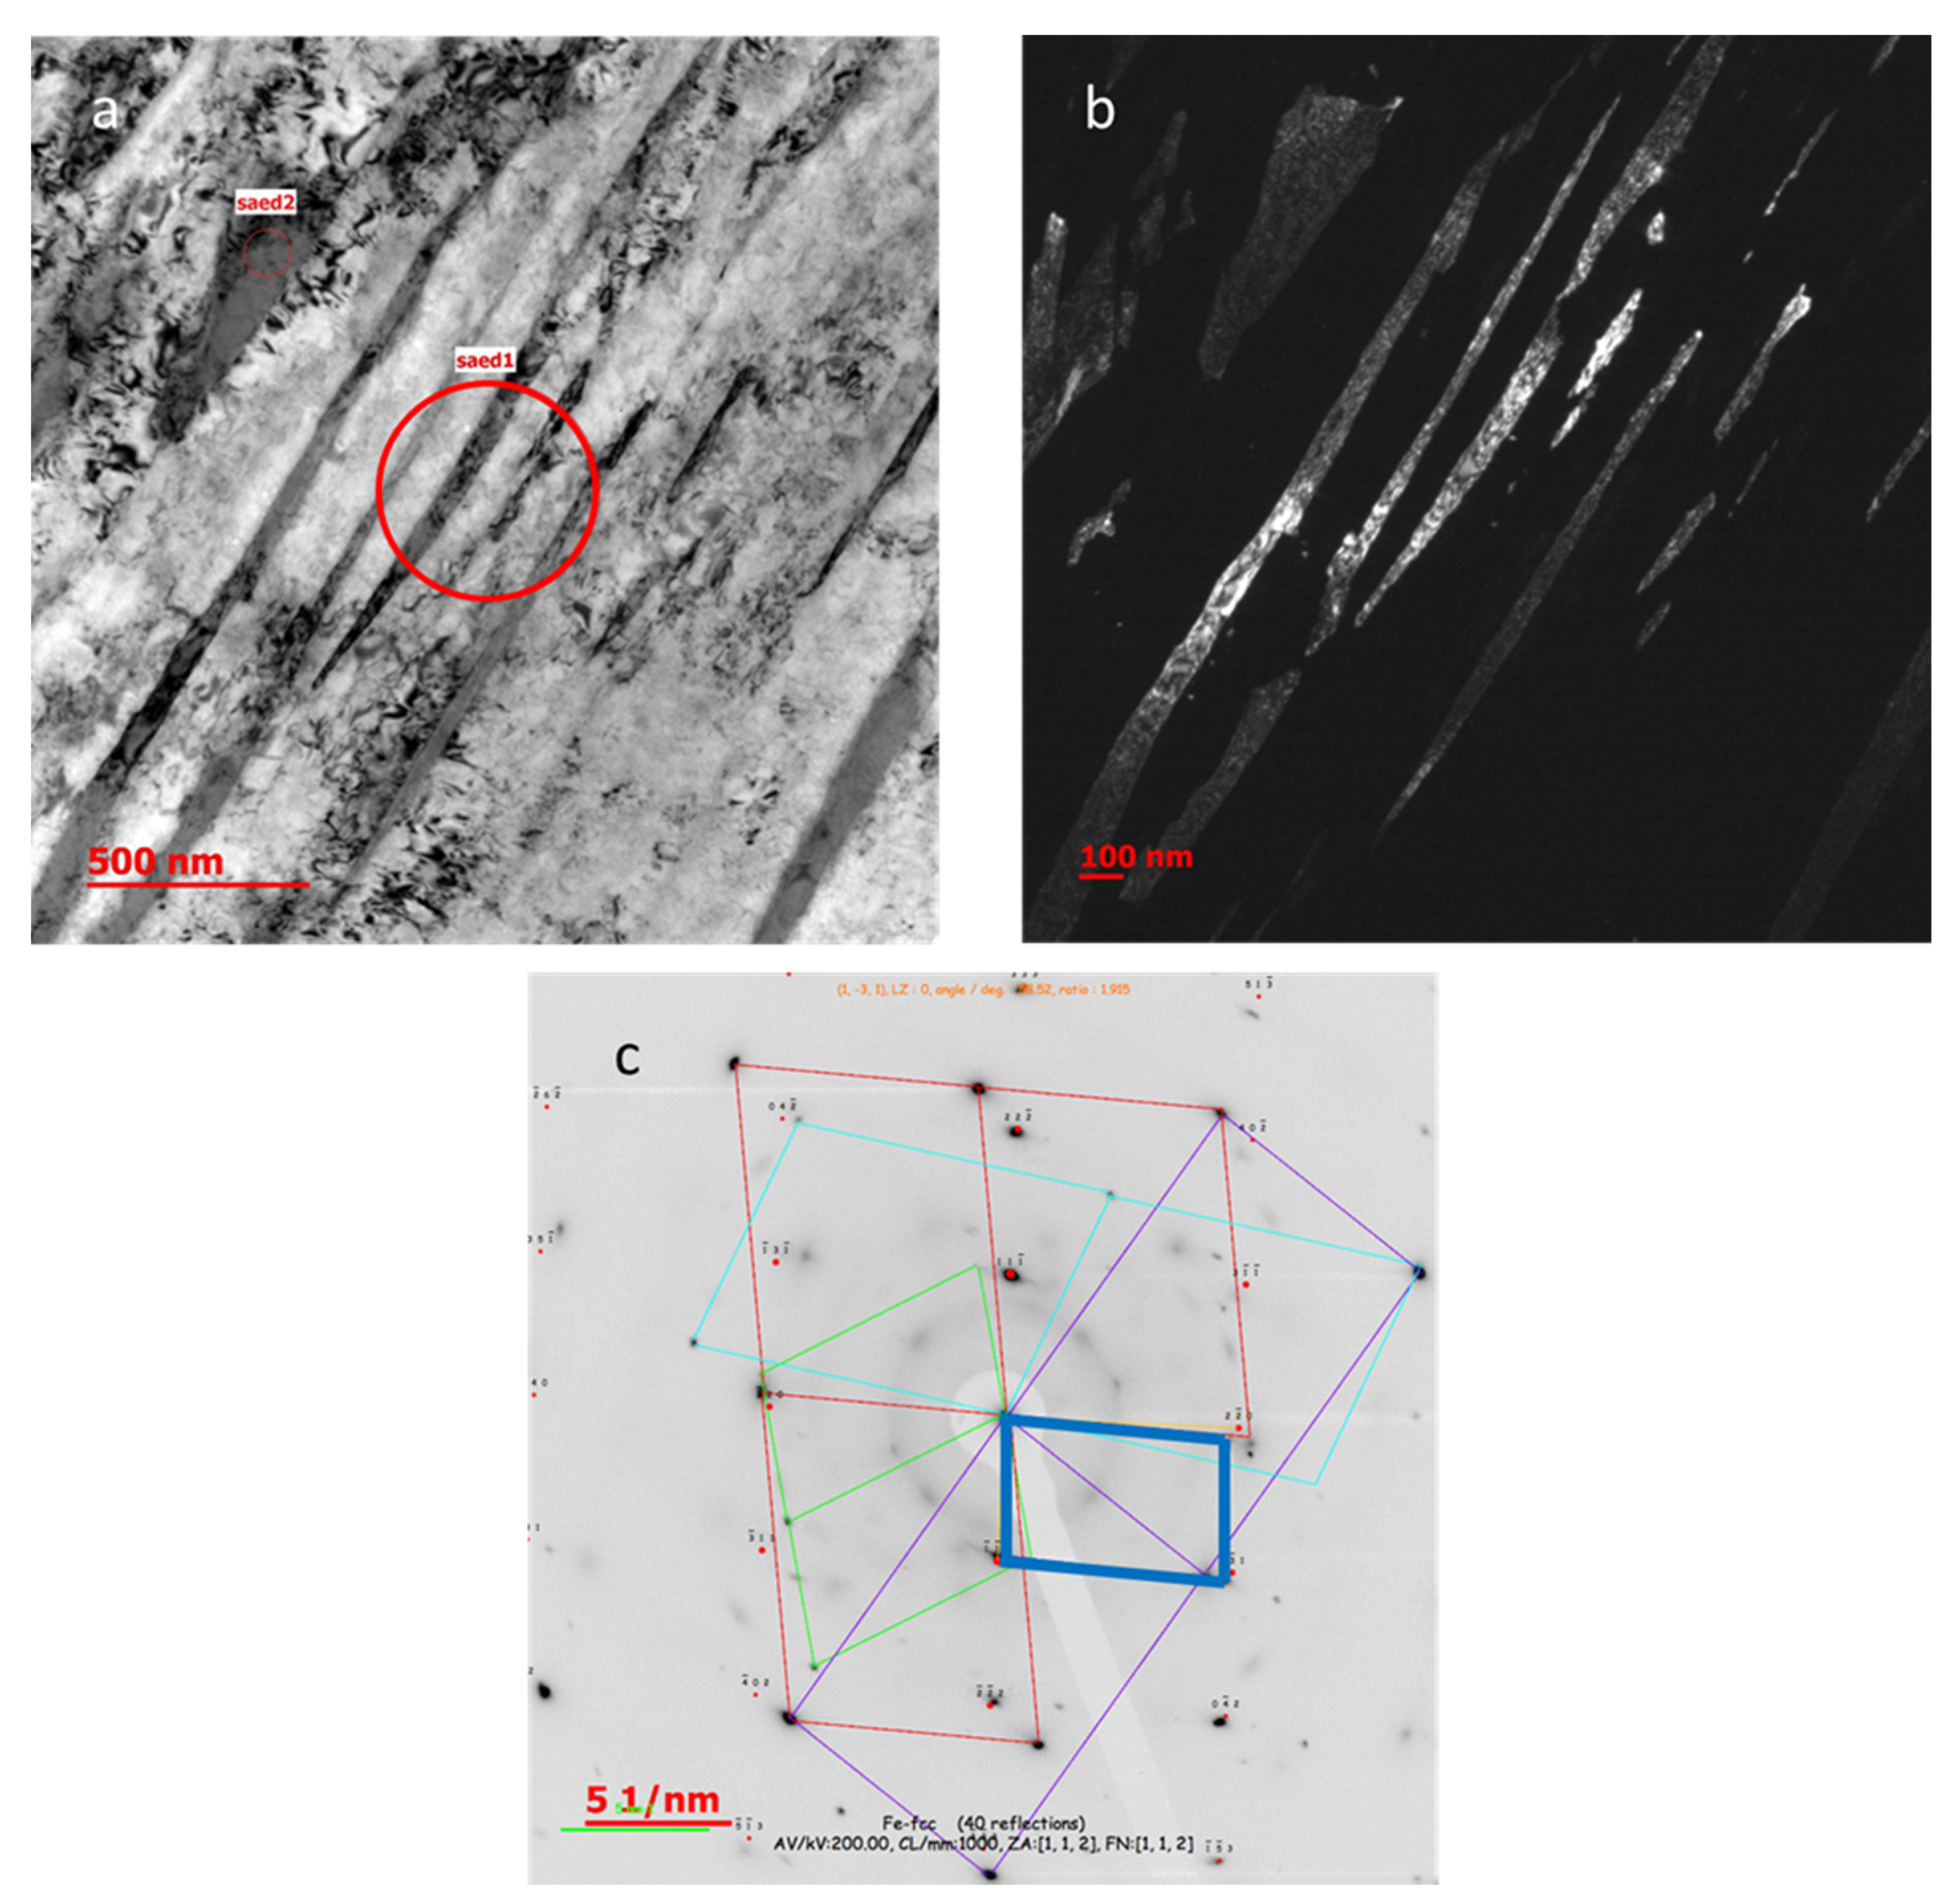
3.1. Microstructural Observation

The microstructures of the steel samples were investigated by scanning electron microscopy (SEM). A 4% Nital solution, i.e., 4 vol % HNO3 dissolved in ethanol, was used for ~10 s as an etching agent to generate the contrast needed after classical grinding and polishing procedure up to 1 µm diamond paste. An additional polishing step with colloidal silica (OPS) with a particle size of 35 nm was used for 45 min with a force of ~10 N and disc speed of 120 rpm to prepare samples for electron backscatter diffraction (EBSD). Coupled with the Quanta 450 FEG-SEM (ThermoFisher, Hillsboro, OR, USA), an AMETEK EDAX-TSL electron backscattered diffraction (EBSD) system (EDAX AMETEK BV, Tilburg, The Netherlands) was used for data acquisition. The EBSD system was operated in the following conditions: a sample tilt of 70°, a working distance of 16 mm, an accelerating voltage of 20 kV, beam current of ~2.2 nA and a step size of 50 nm in a hexagonal scan grid. The 50 nm step size was selected in order to detect the retained austenite which typically has a small grain size in Q & P steels. The BCC phase data file form OIM TSL data collection software v. 7.3 (Version 7.3, Tilburg, The Netherlands) was used to identify the martensite in the Q & P steel which is in accordance with the worldwide accepted and common practice in the EBSD characterisation of the steels. The reason for this approach is that the XRD patterns of the steel did not show any indication for tetragonality (Appendix A: Figure A1) and the expected tetragonality of the martensite for the steel with 0.2% is c/a = 1.006 [45], which is below the detection limit of the EBSD systems. The orientation data were post-processed by means of AMETEK EDAX-TSL-OIM Data analysis v. 7.3 (Version 7.3, Tilburg, The Netherlands) after applying the “grain confidence index standardisation” and “grain dilatation” clean-up procedures in one step to the original orientation data. Grains were defined as a region of the scan that contains a minimum of 5 neighbouring points, with misorientation between two points of less than 5°. After the clean-up procedures, less than 2% of the orientations were changed.
The grain size and fractions of carbon-depleted martensite, fresh martensite and retained austenite were determined from the EBSD data. Separation between the fresh and the tempered martensite was carried out based on the grain average image quality (GAIQ), bearing in mind that the fresh martensite has a low GAIQ due to the high dislocation density [46]. Clusters with data points larger than 5 pixels, containing multiple rows and image quality (IQ) values below 0.1 were attributed to fresh martensite [47]. The fresh martensite, also known as untempered martensite, forms in the Q & P steel during the final quench from the austenite with high carbon content. Hence, the fresh martensite has high carbon content compared to the carbon-depleted one which results in high dislocation density and consequently low quality of diffraction patterns of the fresh martensite due to distortions in the lattice [47]. The selected setting for the EBSD measurements allows determining structural elements (austenite, martensite) with grain size larger than 150–200 nm. The validation of the correct identification of retained austenite was checked by the use of the Kurdjumov–Sacks (KS) relationship with a tolerance of 5°. This orientation relationship was represented as “axis-angle orientation” [112] at 90° and presented in white grain boundaries in Figure 3b.
As there are detection limits inherently present in EBSD measurements, the total fraction of retained austenite was also determined by XRD measurement using a Siemens Kristalloflex D5000 diffractometer (Brücker Belgium SA/NV, Kontich, Belgium) operating with a Mo-Kα source at 40 kV and 40 mA. The retained austenite fraction was determined based on the {200}α, {211}α, {220}γ and {311}γ diffraction peaks after subtracting the Kα2 and the background radiation from the raw data [48]. The used Mo-Kα source can resolve lattices with a spacing of 0.036 nm. The detectable size and volume fraction of retained austenite are in the range of 10 Å and 0.5 vol %, respectively [49].
The fraction of retained austenite was measured after mechanical testing. The scanned zone was situated in the gauge section of the tensile samples, right in the middle between the shoulders of the tensile specimen and the fracture surface. The material at this location was strained until the uniform elongation value; i.e., strain at which the ultimate tensile strength (UTS) is reached, and the deformation in this zone was homogeneously distributed according to the data of digital image correlation (DIC) measurement.
To visualise the interlath retained austenite, often with a size below 100 nm, a higher resolution is needed than can be achieved by EBSD measurements [30]. Therefore, transmission electron microscope (TEM) micrographs were taken with a JEOL JEM-2200FS (Jeol (Europe) BV, Zaventem, Belgium). The device, equipped with an aberration correction of the objective lens and a column electron energy filter, was operated at an accelerator voltage of 200 kV. The samples were thinned with SIC abrasive paper to a thickness of 80–100 um. Discs of 3 mm diameter were punched from this sheet and subsequently, via the use of a Struers Tenupol-5 (Struers, Cleveland OH, USA), thinned from both sides via twin-jet electropolishing in an electrolyte composed of 4% HCLO4 in 63% water-diluted CH3COOH at a temperature of −20 °C.

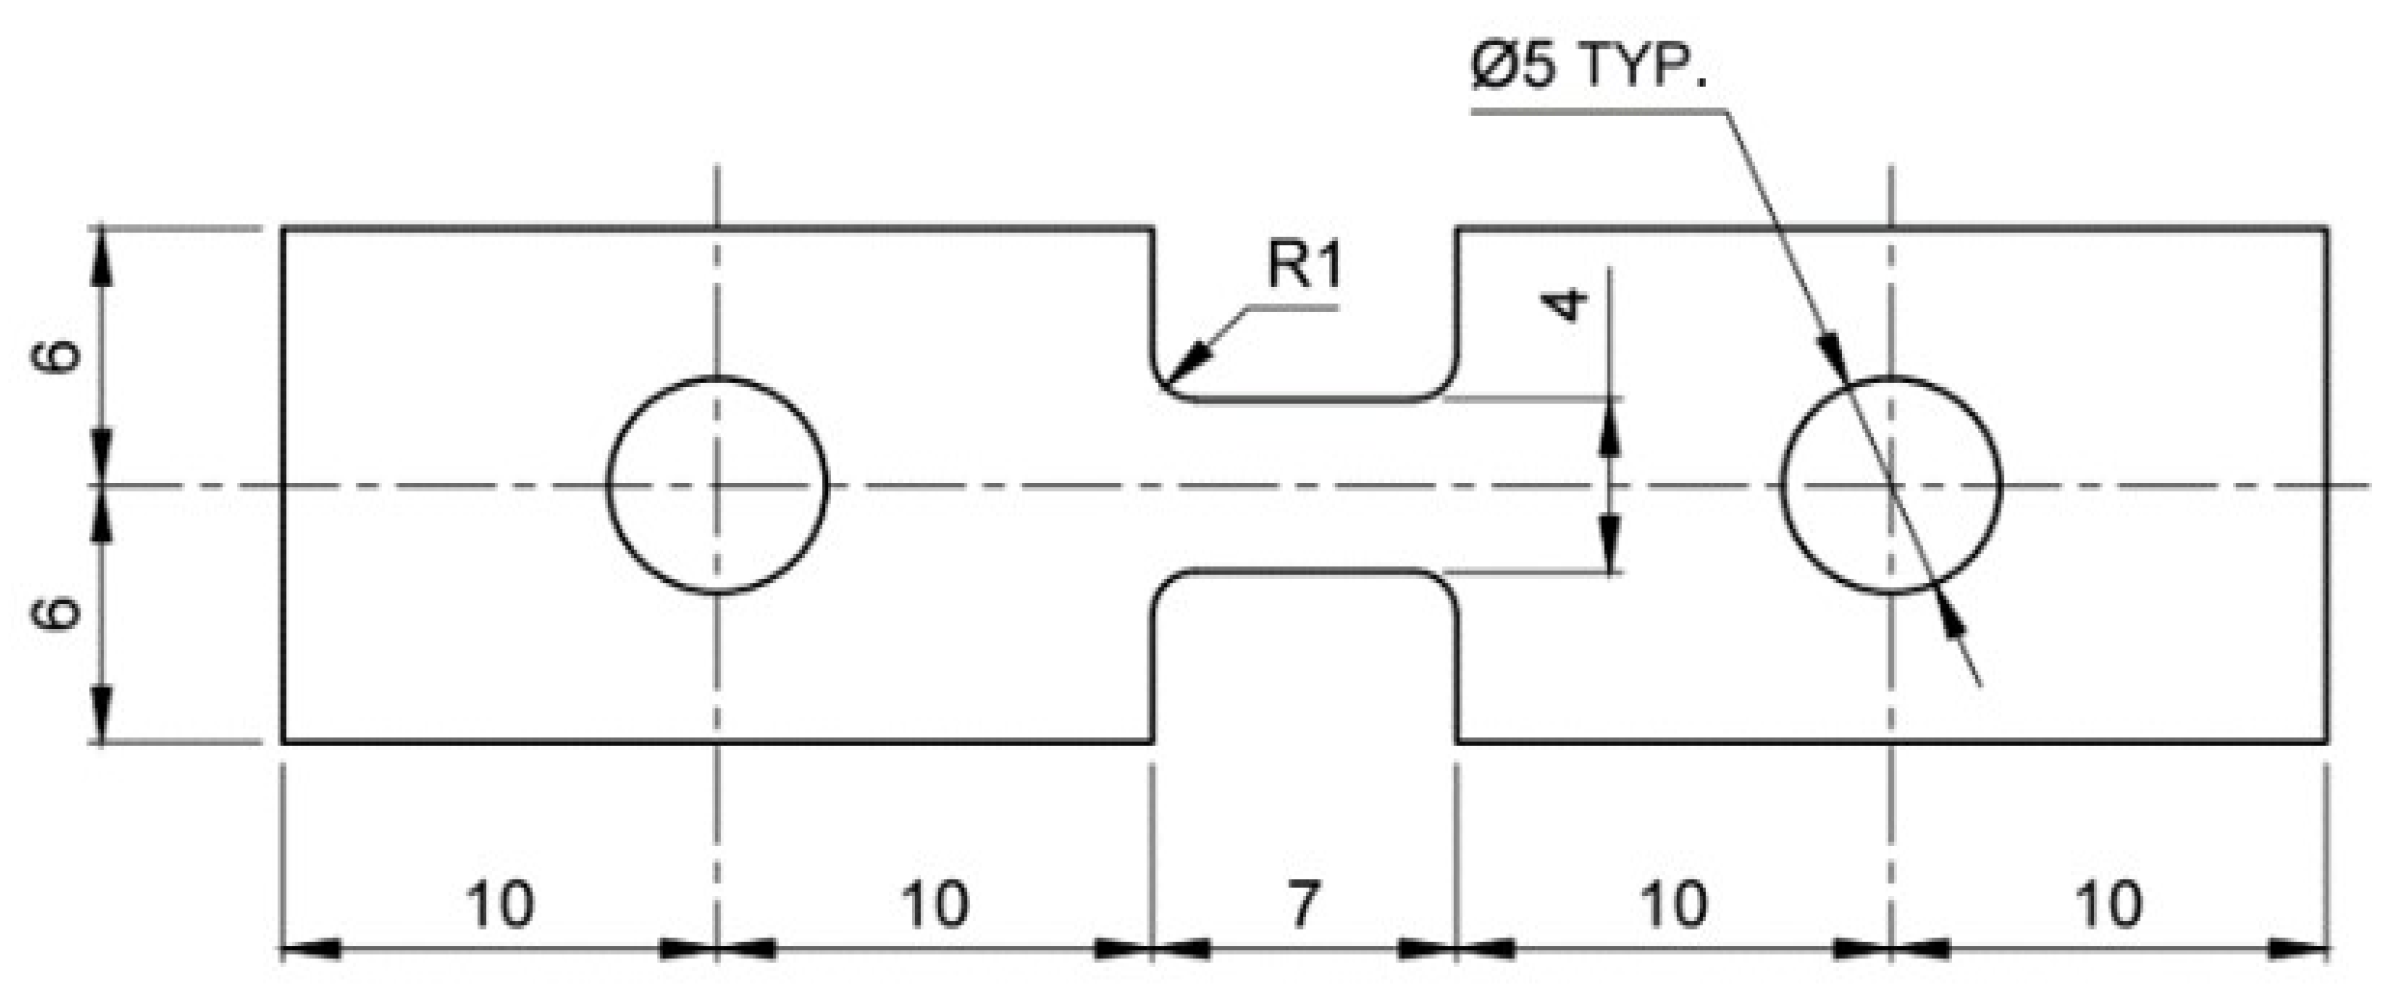
3.2. Mechanical Characterisation

To characterise the quasi-static mechanical properties, a conventional InstronTM 5569 tensile test device (Instron, Boechout, Belgium) equipped with a 50 kN load cell was used. The tensile tests were performed at varying temperatures using a thermal chamber around the sample. In the chamber, a liquid at the desired temperature continuously circulated around the sample. The machine clamp speed was chosen to reach a nominal strain rate of 0.001 s−1 in the gauge section. Samples were extracted along the rolling direction, 45° and transverse direction of the cold-rolled sheet.
A Split Hopkinson Tensile Bar (SHTB) facility, in-house developed at DyMaLab of Ghent University, was used to characterise the dynamic properties [50]. In the SHTB test, the sample was fixed between two long bars and loaded by a mechanical tensile wave. Adjusting the amplitude of the tensile wave allowed controlling the strain rate in the sample. For the materials studied here, a strain rate of approximately 500 s−1 was aimed at. Inherent to the test technique, for SHTB testing, sub-sized tensile samples had to be used. The sample geometry and dimensions are presented in Figure 1. A gauge length of 5 mm and width of 4 mm were selected for all samples in line with guidelines given in [51]. In order to avoid any influence of the sample geometry on the test results, the same small samples were used for the static tests. For all tests, pins were used to fix the samples in the test benches. To this purpose, holes were drilled in the sample clamp regions. Since identical sample geometries and boundary conditions were used in the static and dynamic tests, differences between the test results can entirely be attributed to the effect of strain rate on the material behaviour [51].
The use of small samples might result in inaccurate, overestimated strain values [52,53]. Therefore, to obtain reliable strain values in the gauge section of the sample, for the static and dynamic room temperature tests, the digital image correlation (DIC) technique was used. To this purpose, prior to testing, a black and white speckle pattern was applied to the sample surface by an airbrush set. During testing the deformation of the speckle pattern was recorded with two, static or high speed, cameras positioned under an angle of 15°. The recorded images were subsequently processed with the commercial DIC software MatchID (Version 2018, MatchID, Ghent, Belgium) to obtain full-field displacement and strain data. Displacement noise floor levels, i.e., accuracy levels of ≈10−5 mm and ≈10−4 mm were achieved for the static setup and dynamic setup, respectively. The displacements measured in the experiments were of the order of mm’s and, hence, the noise floor levels were negligibly small.
For each test condition, 3 experiments were conducted. The reported yield strength (YS), UTS, maximum uniform strain (US) and fracture strain (FS) are average values, while the presented curves are well-selected representative curves. The YS was calculated as 0.2% proof stress, while UTS was selected at the maximum value of the stress-strain curve. The US was determined as the engineering strain corresponding with the UTS. The FS was derived as the maximum strain value of the engineering stress-strain curve. The material hardening was calculated as the slope of the true stress-true strain tensile curve. All of these are according to the ASTM standard E8-E8m-13a [54].

4. Results

4.1. Microstructural Observations

After the Q & P cycle, the material is characterised by a martensite/austenite microstructure. The SEM images and EBSD maps shown in Figure 3 reveal that, after cold rolling and Q & P treatment, the material is with a homogenous microstructure, irrespectively of the banded structure observed in the hot-rolled conditions (Figure 2). Hereafter, the EBSD map (Figure 3b) displays the distribution of the retained austenite in between the martensite structures. The validity of the correct identification of the retained austenite was checked by visualising the Kurdjumov–Sachs relationship. The latter relationship is (partially) fulfilled nicely in most of the grains. Fresh martensite (α’f), although we intended for it to be minimised, was present in the steel and was quantified to be less than 2% whereas the retained austenite was 5% according to the EBSD data. The rest is attributed to carbon-depleted martensite (93%) as no other phases were present in the steel. However, the XRD measurements showed that the material contained 10.4% of retained austenite. Such differences between the XRD and EBSD data for the RA austenite fractions are always reported in the literature and are associated to the fact that the XRD is able to detect very small regions of interlath austenite that are below the detection limits of the EBSD [44,55]. Hence, it can be considered that the XRD data are more representative than the EBSD data with respect to the quantity of the retained austenite.
A TEM study (Figure 4) was, for its high resolution when compared to EBSD, conducted in order to explain the discrepancy between the fraction of retained austenite derived via EBSD and the one measured by XRD. The red circle on Figure 4a shows the position of the TEM aperture where the diffraction pattern shown in Figure 4c for determination of the retained austenite was acquired. It was seen that large retained austenite grains (>200 nm) were present as well as smaller (film-type) grains wedged in between martensite laths. The sizes of these films ranged from 5 nm to several 10 nm.
From the EBSD data, texture analysis was carried out. The orientation distribution function (ODF) presented later was derived imposing rolling (orthotropic) symmetry and harmonic series expansion with L = 16 and a Gaussian half-width of 5°. The orientation data were acquired via EBSD on a surface of 400 µm × 400 µm containing at least 10 000 individual grains. Points with CI < 0.1 were excluded from the data for texture calculation. The ODF (Figure 5) shows a typical BCC transformation texture known as transformation BCC-beta fibre texture in which the product BCC texture originates from austenite with a Brass ({011}<211>), Goss ({011}<100>} and Cube ({001}<100>) texture [56,57,58]. The overall texture intensity is low, indicating that the material is not strongly textured with a maximum value of 1.35 multiples of random density (mrd).
The textures of the RA texture before and after the tensile deformation at RT and 80 °C are shown in Figure 6. The main FCC texture components, most easily observed in the Phi2 = 45°, 65° and 90° sections of the Euler space, are presented in Figure 7. It is observed that the RA texture before tensile testing shows the prominent presence of the Copper ({112} <111>) with an intensity of 1.5 mrd, Brass ({001}<211>) with an intensity of 2 mrd, S ({123}<634>) with an intensity of 2 mrd, Cube ({001}<100>) with an intensity of 1.9 mrd and Goss ({110}<001>) with an intensity of 1.3 mrd texture components. Upon tensile testing till US at RT, specific texture components were reduced in intensity or disappeared completely. The Copper and Cube components are not present anymore and the intensity of the S-component intensity decreases from ≈2 mrd to ≈1.3 mrd. The Brass component is affected less, but still, a decrease from ≈2 mrd to ≈1.4 mrd is observed. After static tensile testing at 80 °C a similar conclusion can be drawn regarding the Copper which is equally not present. The Cube component, however, is weakened (from ≈2 mrd to ≈1.5 mrd) in this sample. The S-component is similarly weakened but less with respect to the sample tested at room temperature. The Brass component seems, again, the component less affected (decrease from ≈2 mrd to ≈1.6 mrd) after the tensile testing.
The thermal stability of retained austenite as a function of the testing temperature is presented in Figure 8. It was noticed that the RA content decreases gradually with a decrease of the temperature. Upon cooling below −40 °C, no significant additional transformation of austenite to martensite occurred.

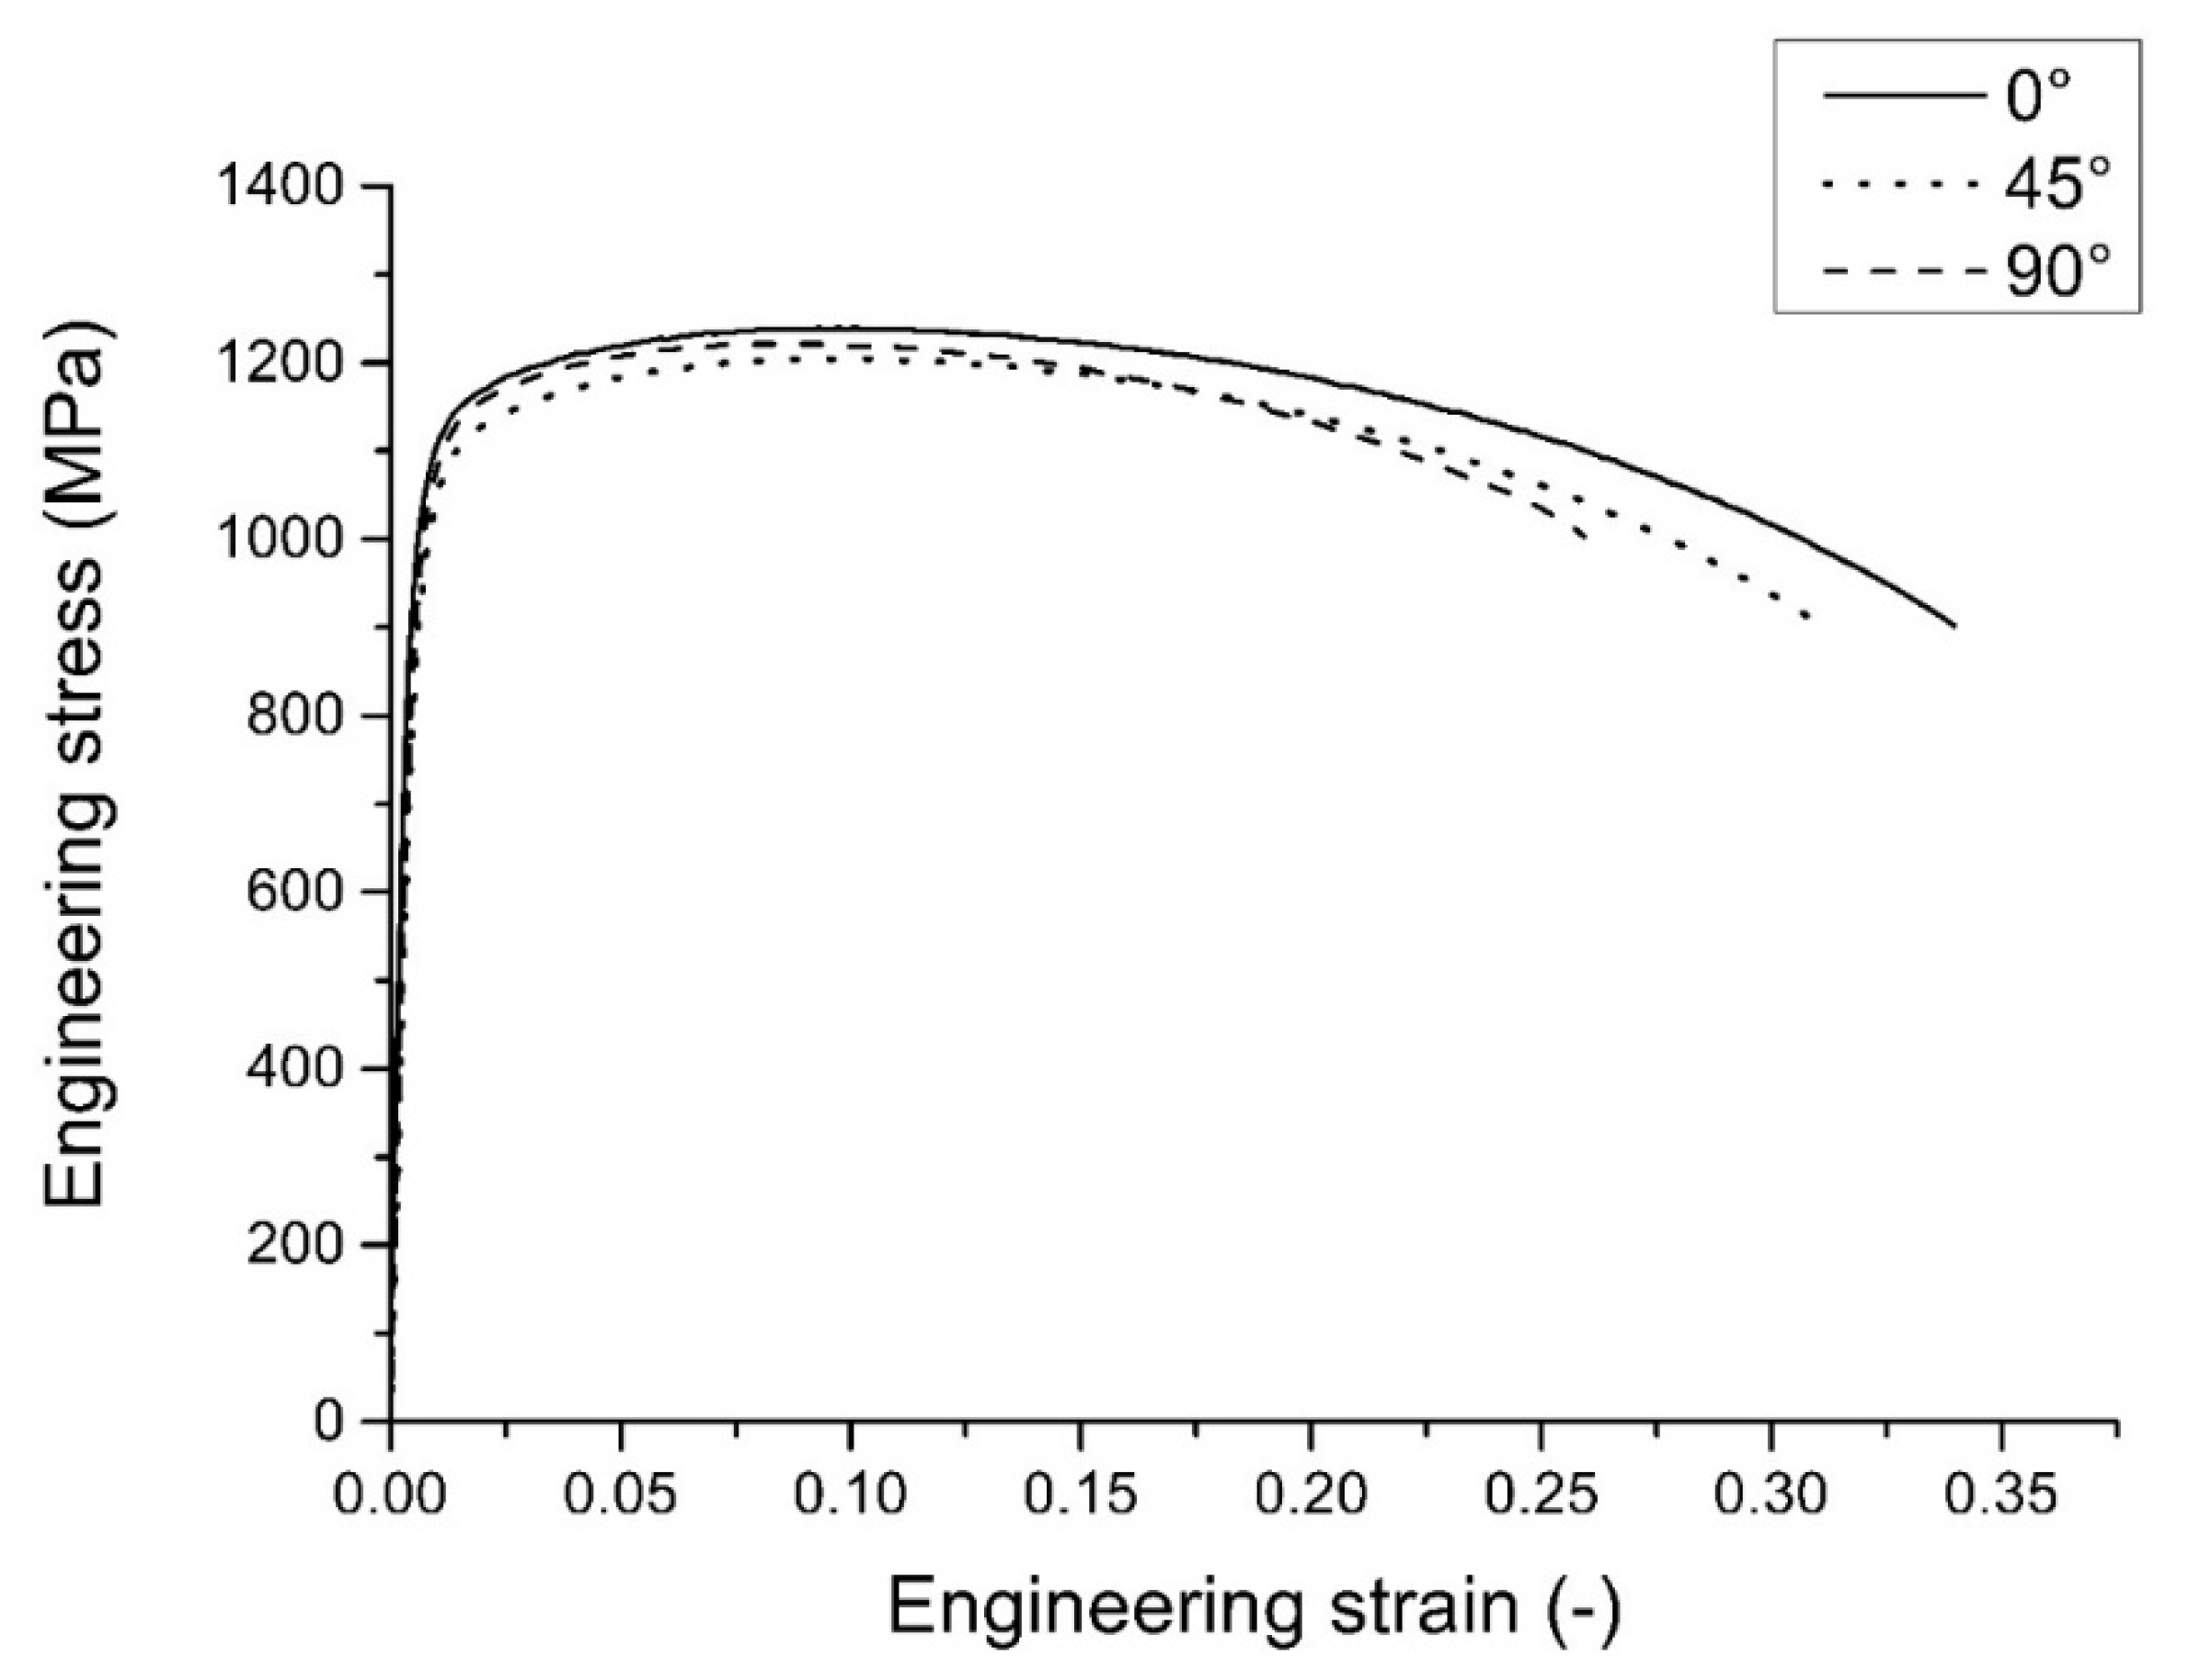
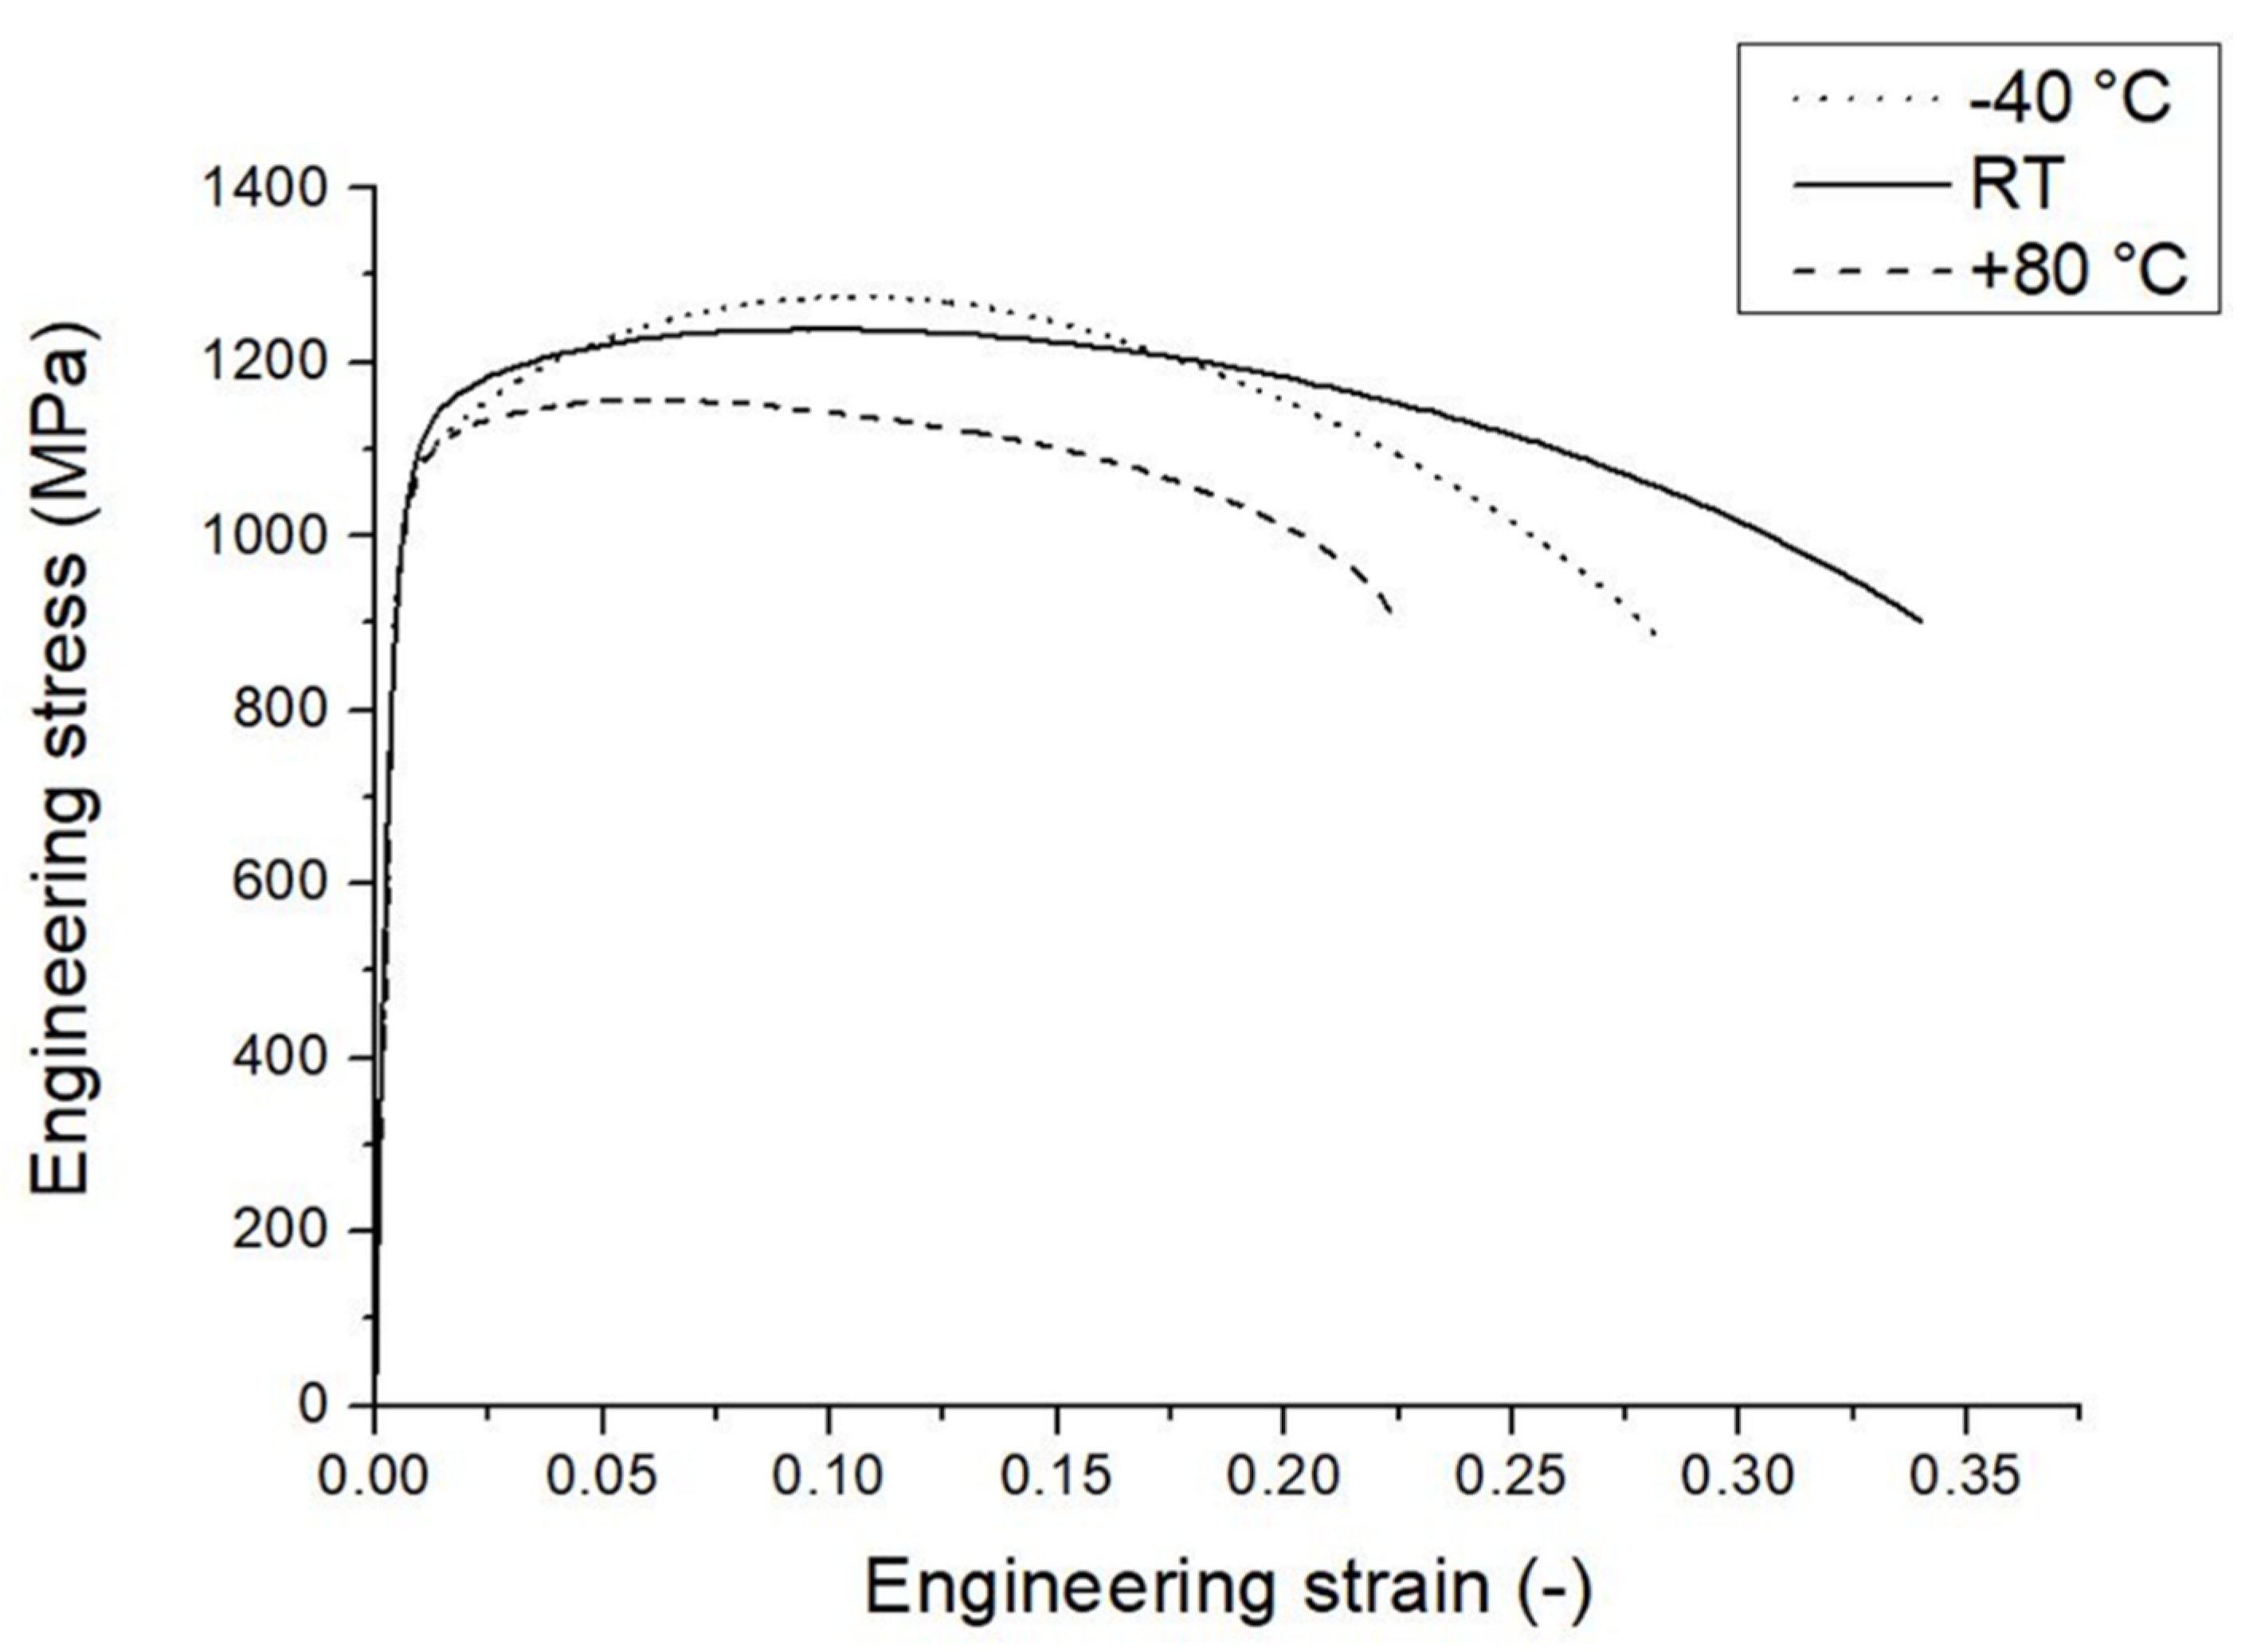
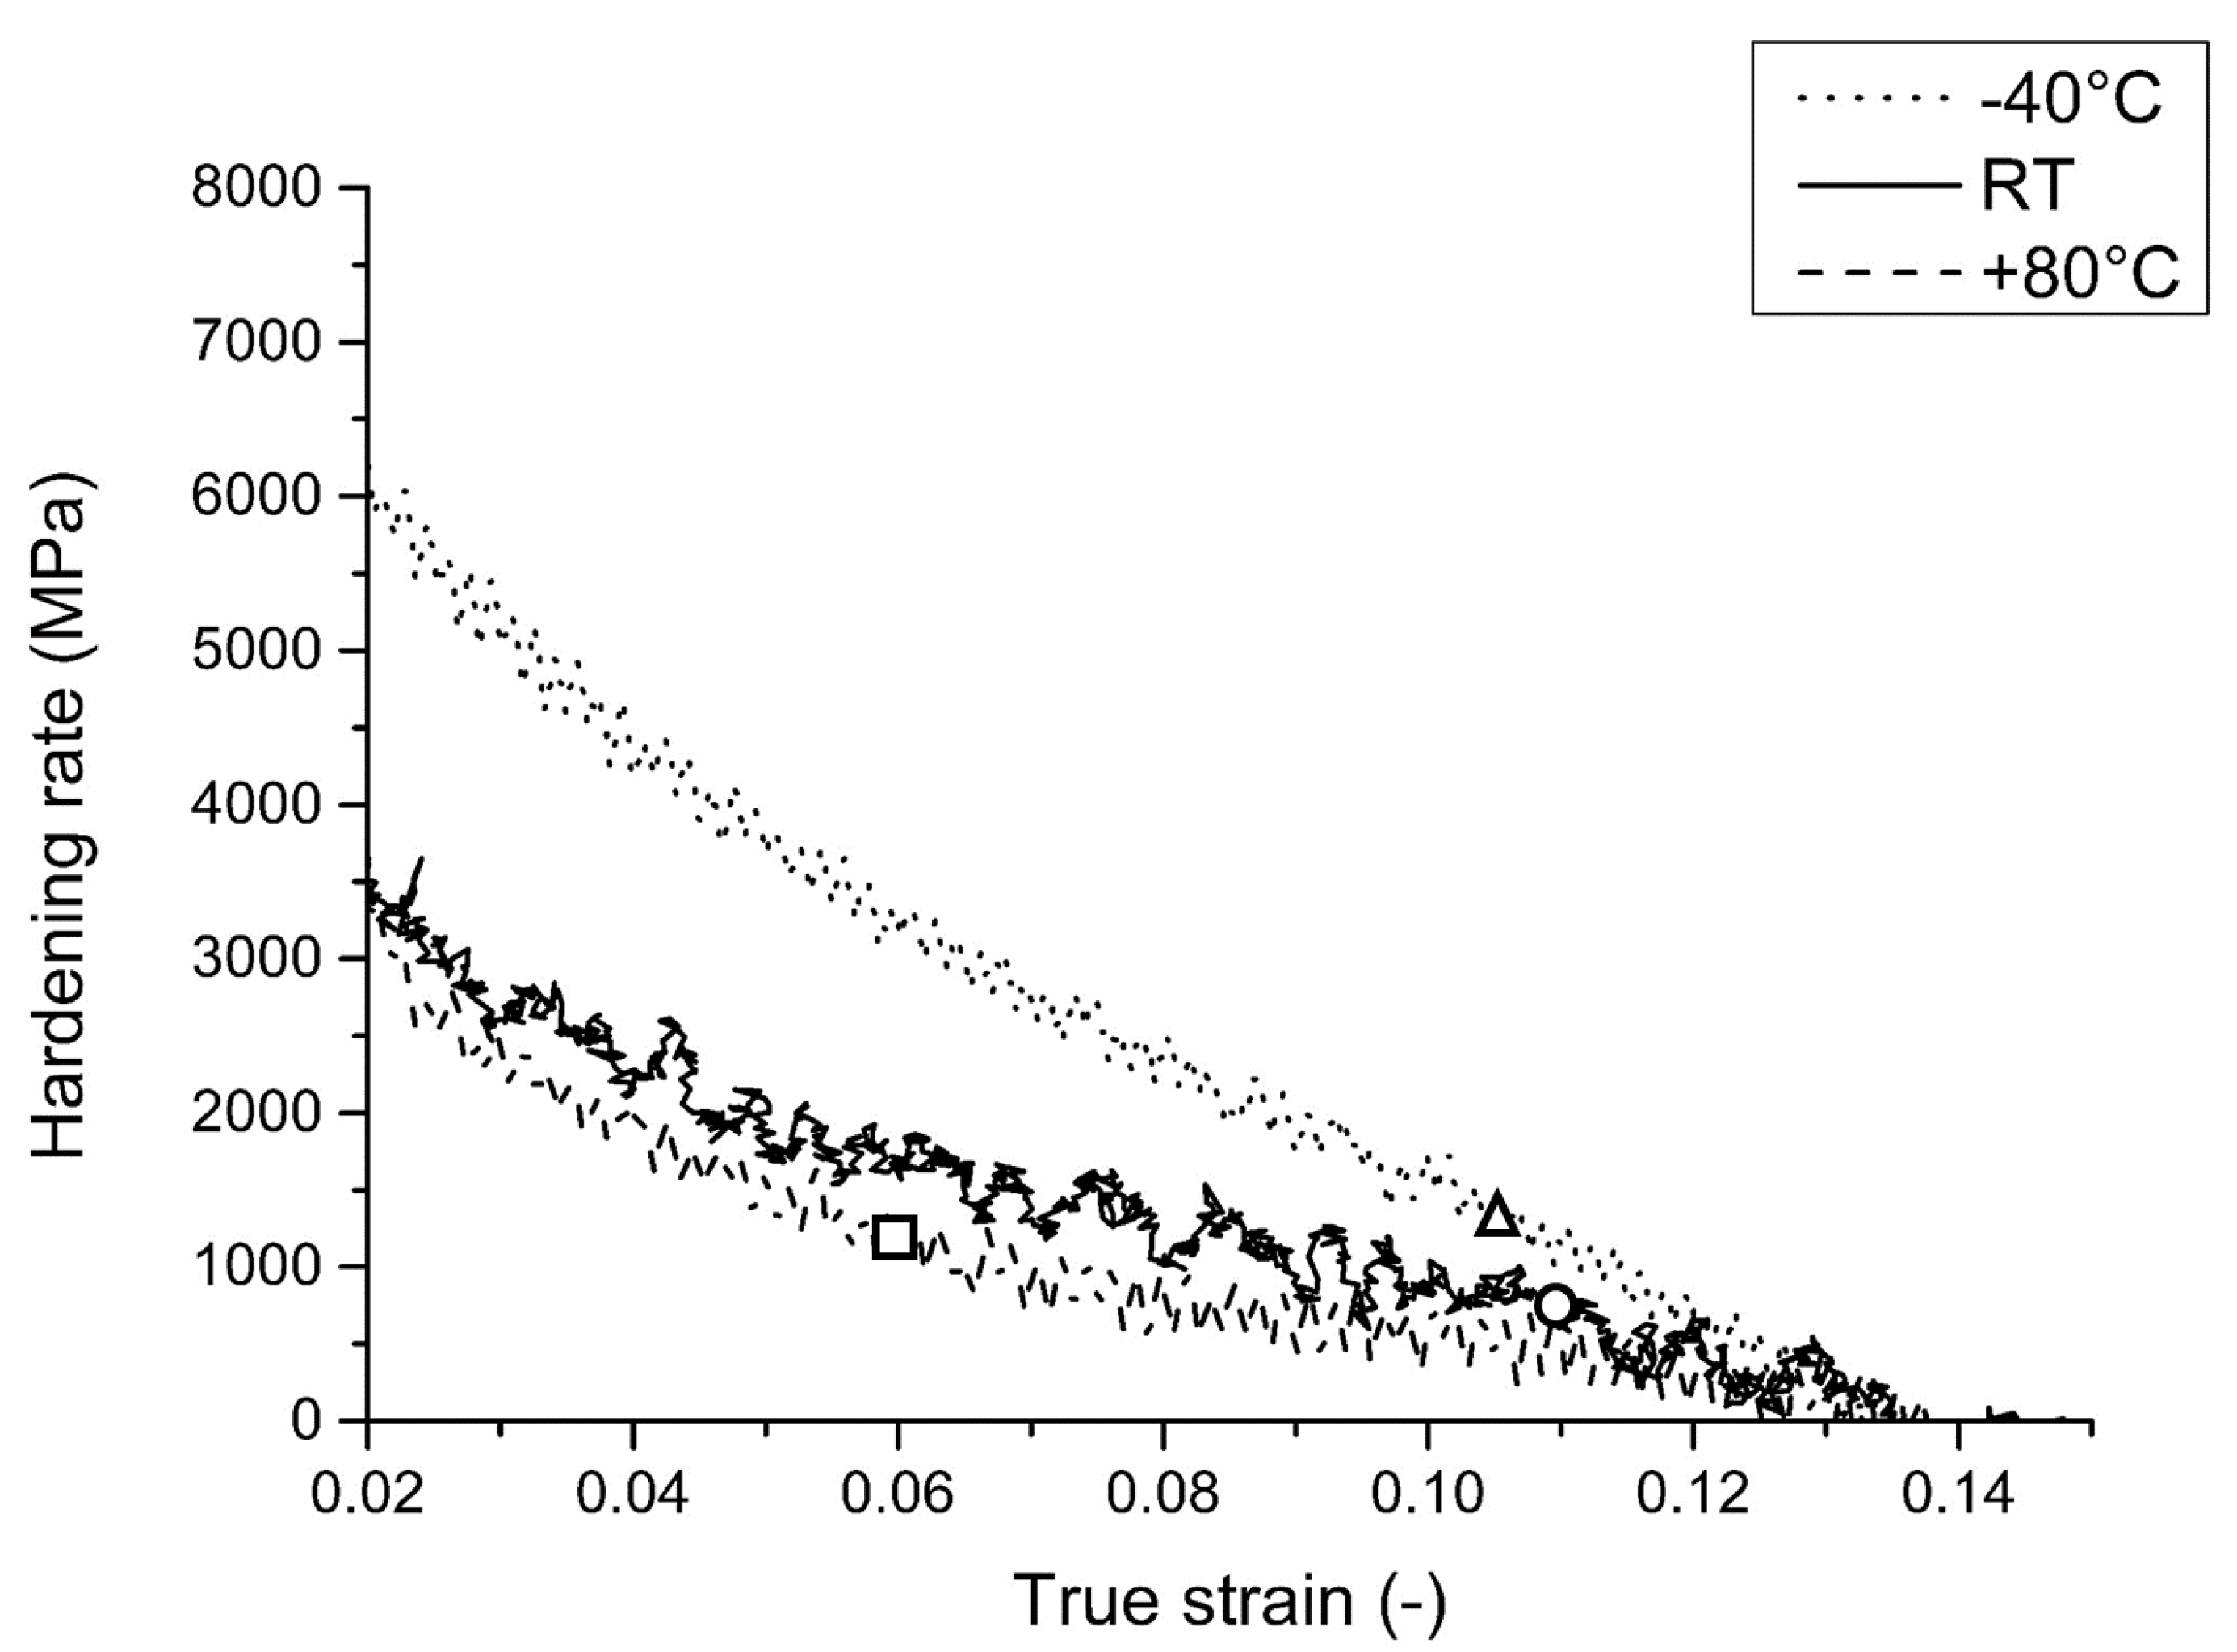
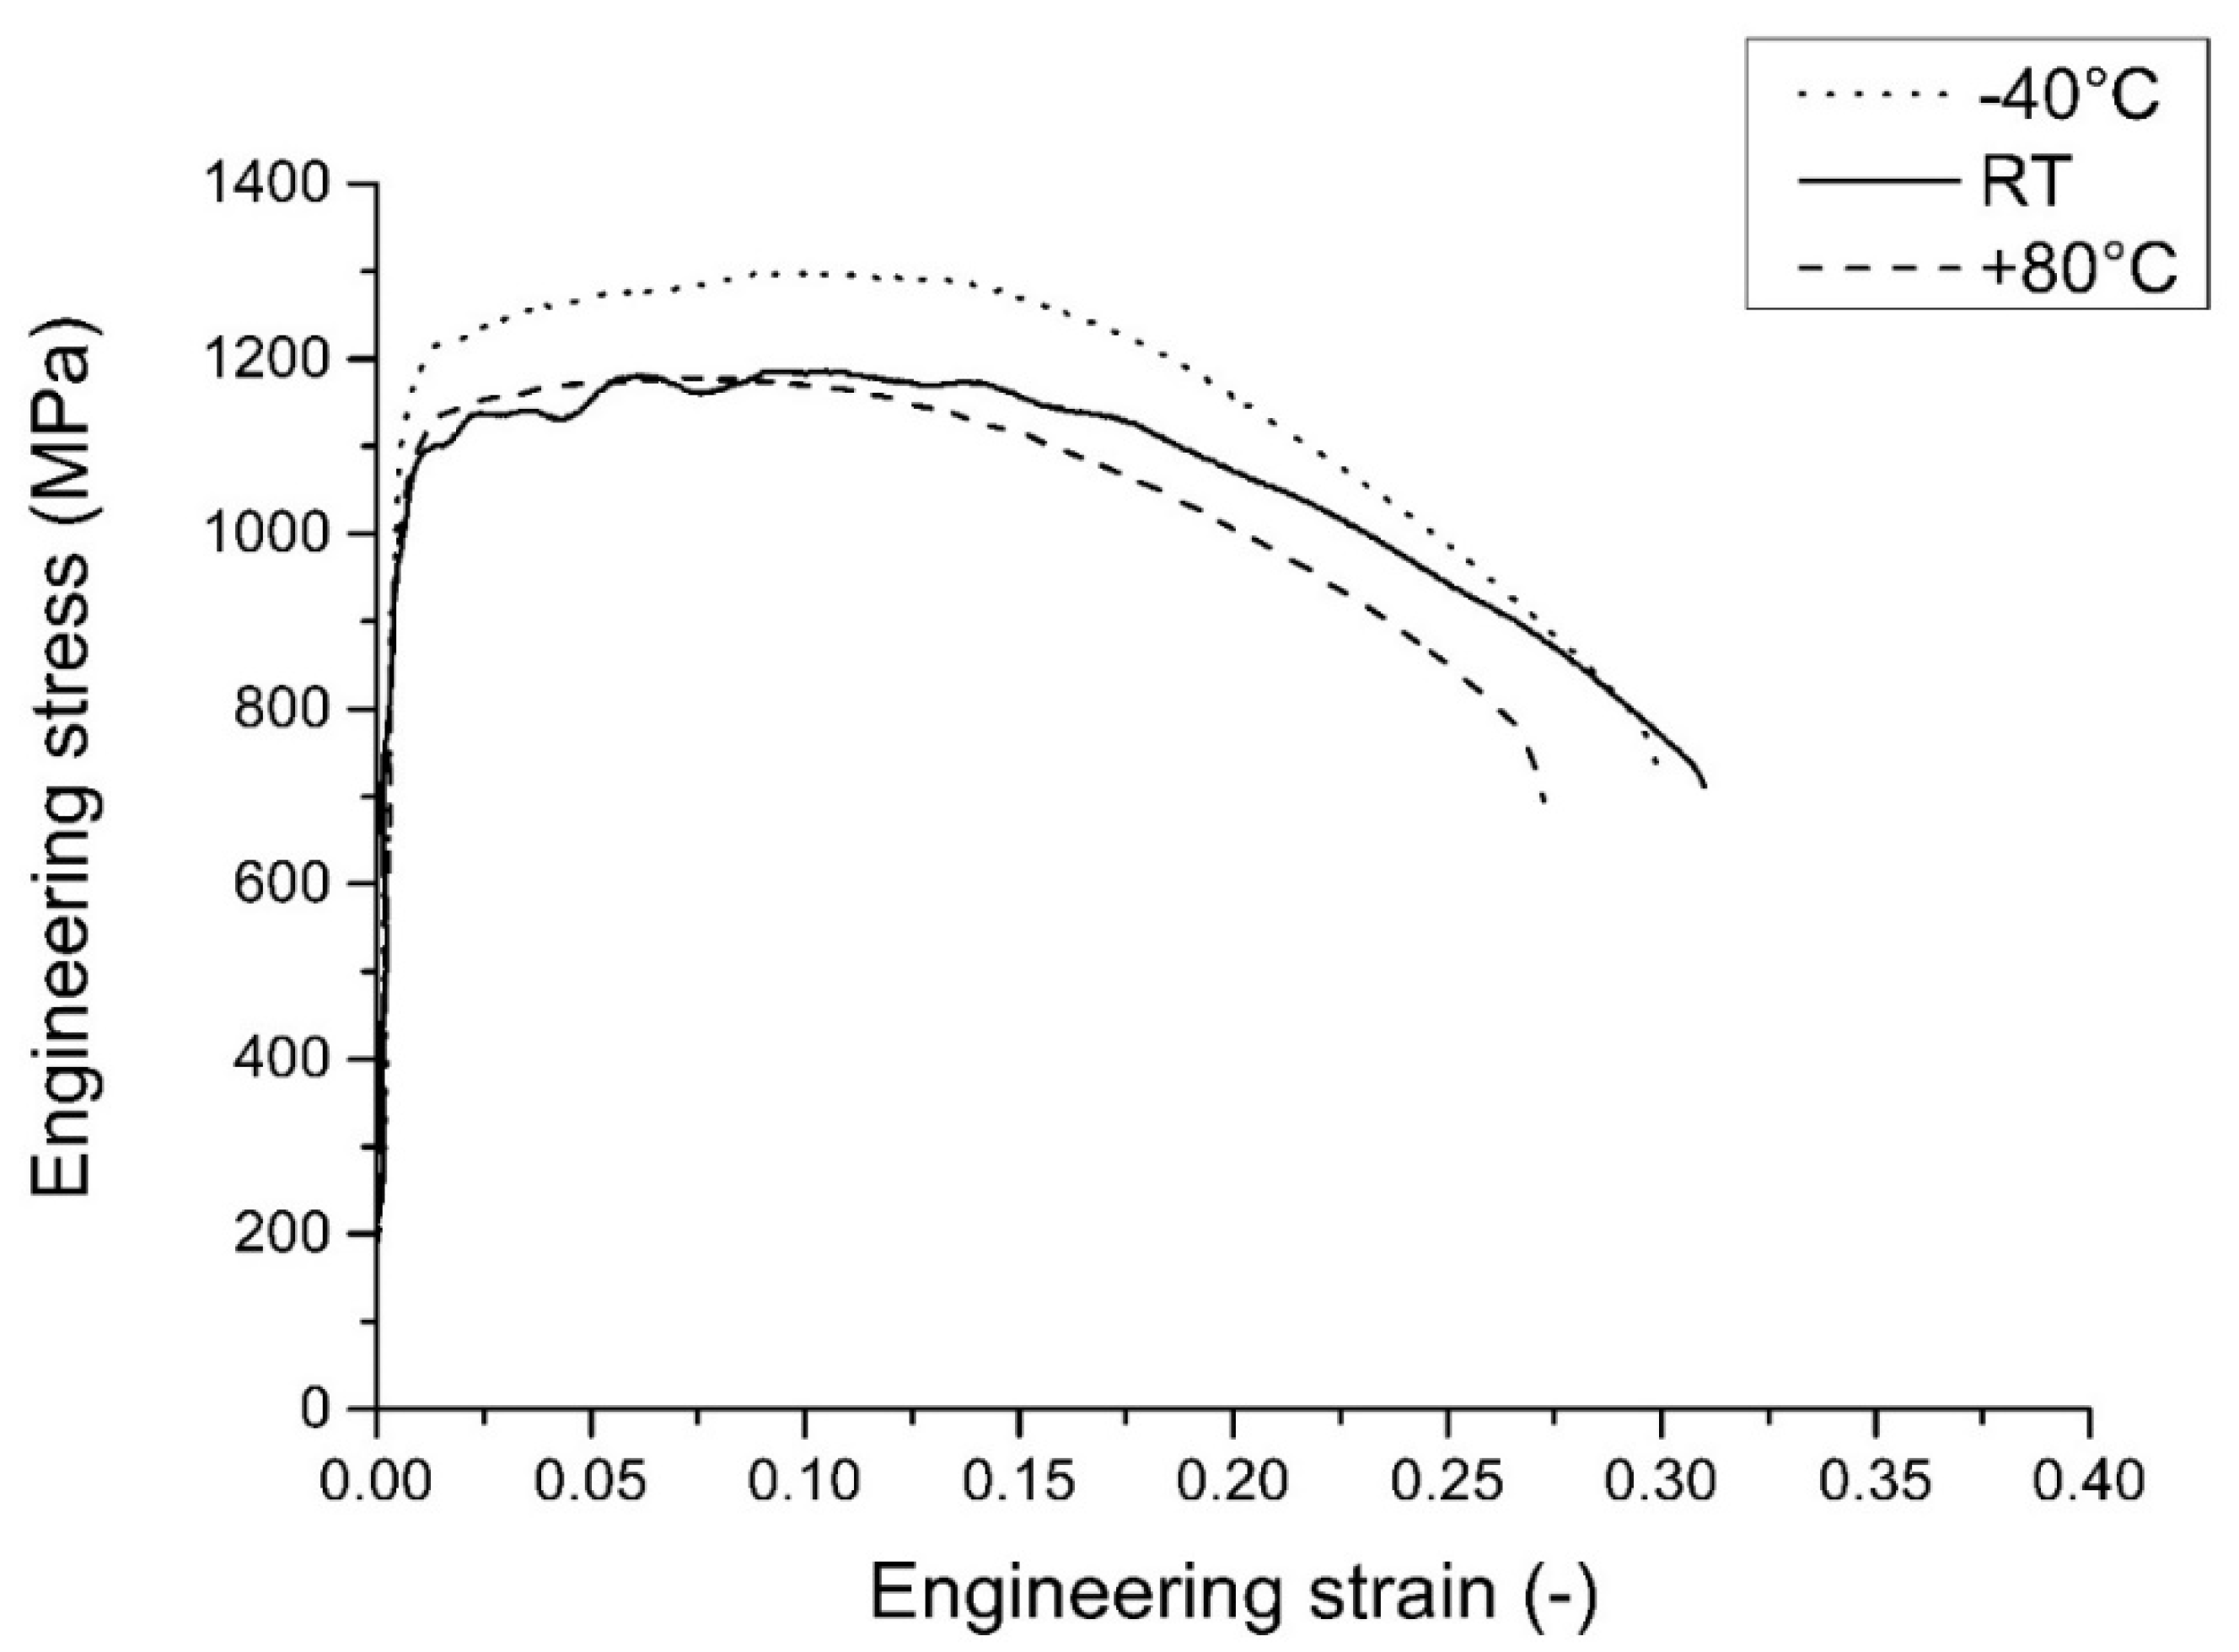
4.2. Static and Dynamic Tensile Properties

Samples with the geometry and dimensions presented in Figure 1 were tested in tension at static and dynamic strain rates at different testing temperatures and along different directions. An overview of the obtained YS, UTS, US and FS under static as well as dynamic conditions is presented in Table 3. As oscillations appear in the dynamic tensile curves at the onset of plastic yielding, no reliable values for the YS could be extracted from the dynamic tests.
Figure 9 presents the static engineering stress-strain curves of the samples tested at room temperature for the three orientations considered, i.e., 0°, 45° and 90°, with respect to the rolling direction. As for the strength, only minor differences between the rolling and transverse (90°) direction are found: the yield strength (YS) and UTS of the 0° samples are, respectively, 10 MPa and 17 Mpa higher. The 45° sample shows the lowest strength levels: a YS of 1080 Mpa (compared to 1130 Mpa and 1140 Mpa for the 0° and 90° directions, respectively) and a UTS of 1204 Mpa (compared to 1238 Mpa and 1221 Mpa for the 0° and 90° directions, respectively). For the deformation capacity, however, similar values are found for the 0° and 45° samples. Indeed, a uniform strain (US) of 0.110 is found for the 0° direction versus 0.100 for the 45° direction for the fracture strain values of, respectively, 0.340 versus 0.315. The samples tested along the 90° direction show a slightly reduced US (lowered by 0.01–0.02), though a more significantly reduced FS (lowered by 0.05–0.08).
To further analyse the planar anisotropy of the Q & P sheet material, the Lankford coefficient R, Rav and ΔR were calculated using the following equations [59]:
R = ϵ w , p l ϵ z , p l = ϵ w , p l ( ϵ w , p l + ϵ l , p l )
R a v = R 0 ° + 2 R 45 ° + R 90 ° 4
Δ R = R 0 ° 2 R 45 ° + R 90 ° 2
with ϵl,pl, ϵz,pl and ϵw,pl the true plastic strain components in, respectively, the tensile, thickness and transverse direction as well as R, R45° and R90° as the R-value derived from tensile tests with an angle between the gauge section and the rolling direction of, respectively, 0°, 45° and 90°. ϵl,pl and ϵw,pl were obtained by the DIC measurements. From the DIC measurements, the true total strains in the axial, i.e., tensile, and the transverse directions, were obtained. Using a Young’s modulus of 207 GPa and a Poisson ratio of 0.3, from the total strains, the true plastic strains were calculated.
The Lankford coefficient for the 0°, 45° and 90° directions is presented in Table 2. At higher strain values, the Lankford coefficients calculated for the 0° and 90° directions are very similar. Slightly smaller values are found for the 45° direction, however, except at small strains, R-values well above one are obtained. The R-values calculated at US (≈0.1) is ≈1.6 for the samples oriented along the 0°and 90° direction, and ≈1.5 for the sample oriented along the 45° direction. This results in an average Rav of ≈1.55 and a planar isotropy, expressed as ΔR, of ≈0.08.
To evaluate the effect of testing temperature, tensile tests at −40 °C, 20 °C and 80 °C were performed. All samples were tested parallel to the rolling direction. The lowest temperature of −40 °C was selected based on the thermal stability of the retained austenite. Indeed, upon cooling, a fraction of retained austenite that is stable at room temperature transforms into martensite. However, as elaborated in Section 4.1 and shown in Figure 8, below −40 °C, no significant further transformation of austenite into martensite is observed. The temperature of 80 °C was selected in order to have the same temperature difference with the room temperature as for the lowest temperature. In Figure 10, the tensile curves obtained at the different temperatures are presented. The tensile curve of the sample tested at the lowest temperature shows an increase of the UTS of 42 MPa compared to the room temperature curve. The US of the samples tested at −40 °C is equal to the US at room temperature, while a small increase in FS is noticed.
Compared to the room temperature curve, the high-temperature tensile curve shows a decrease in UTS of 98 MPa. Similar to the low-temperature tests, the YS seems less affected. A decrease of UTS at the highest temperature was expected, however, this was not the case for the significant drop in ductility. Indeed, the FS of the sample tested at 80 °C is 0.225 compared to 0.340 at room temperature. The decrease in US is even more pronounced: from 0.110 at room temperature, it becomes 0.060 at 80 °C.
The effect of test temperature on the strain hardening rate, calculated as the derivative of the true stress with respect to the true strain, of the steel is presented in Figure 11. Significantly higher strain hardening values are obtained at low temperatures than at 80 °C. In the low strain region (2–5%), the strain hardening at the lowest temperature is almost double the value obtained at 80 °C. The end of uniform straining is also plotted, which clearly indicates the earlier reported high dependence on the temperature.
As the properties under dynamic loading conditions are important for the automotive industry, tensile tests along the rolling direction were performed at a strain rate of ≈500 s−1. The dynamic tensile curves for test temperatures of −40 °C, RT and 80 °C are presented in Figure 12. When comparing dynamic and static room temperature experiments, it is seen that at dynamic strain rates both the UTS and FS decrease, respectively, with 52 MPa and 0.085. As is the case for the samples tested under quasi-static conditions, Table 3 shows an increase in UTS at the lowest temperature; however, the increase for the dynamic tests is larger, i.e., 89 MPa instead of 42 MPa. Similarly, the UTS is lower for the samples tested at 80 °C, however, the difference between room temperature and 80 °C UTS values is smaller compared to the static value, i.e., 14 MPa versus 98 MPa.
While the effect of temperature on the UTS shows similar trends for the quasi-static and dynamic tests, this is not the case for the elongation. Indeed, both FS and US obtained at the highest temperature and strain rate are only slightly lower, i.e., 0.02, than the values at room temperature, where for the static tests drops of 0.110 for the FS and 0.05 for US are observed.
Comparing static and dynamic tests, at the highest temperature, the UTS is hardly affected by an increase in strain rate (increase of 32 MPa) and, remarkably, both uniform and fracture strain values increase by, respectively with 0.005 and 0.01.
As the transformation stability of retained austenite is temperature as well as strain rate dependent, the fraction of retained austenite after static and dynamic straining was evaluated for the samples tested at room temperature and 80 °C. The results, presented in Table 4, are based on EBSD analysis carried out on sample material strained up to US. The values indicate that only a small fraction, i.e., below 0.6%, of RA is present after testing under static conditions. When tested at high temperature under dynamic conditions; however, 2.5% of the initial 5% of RA is still untransformed upon reaching US.

5. Discussion

5.1. Microstructural Observations

The microstructure after hot rolling is characterised by a ferrite/pearlite banded structure, which remains in the microstructure after cold rolling. This microstructural banded structure is most likely caused by Mn and Si segregation, as reported elsewhere [60]. The large fraction of pearlite in some bands could result in local small austenite grains during the austenitisation stage of the following Q & P cycle, as the carbon diffusion distance needed for austenite formation is lowered. However, when evaluating the microstructure after the Q & P cycle, no visible effect of these micro-segregations was observed neither on phase fraction nor on grain sizes and it was concluded that the material is homogeneous.
In Q & P conditions the fraction of the fresh martensite was kept intentionally low. This low fraction was aimed at and acted as an indicator that the Q & P parameters were properly selected. The selected quenching temperature was sufficiently low to have a large enough fraction of martensite formed after the quench. This martensite fraction acts as a source of carbon to almost completely stabilise the austenite phase during the partitioning step. Fresh martensite has been proven to have a detrimental effect on the ductility of the material leading to early failure as the zones with fresh martensite act as crack initiation points [44]. As a consequence, the fresh martensite fraction has to be kept to a minimum which was achieved in the current experiments. The presence of retained austenite was highlighted by the use of EBSD measurement and a phase map as seen in Figure 3. After a standard clean-up procedure, it was concluded that 5% of retained austenite seen in these experiments are truly RA grains and not partially (fresh) martensite. The fraction derived via EBSD was low with respect to results of other Q & P steels published in the literature (although the ones reported in the literature usually contain higher Si fraction) [22,40]). After evaluation of the steel via TEM, it was derived and supported by literature that a large fraction of RA has a film-like morphology with a thickness of the less than 100 nm [61]. Mainly film-type retained austenite with a film thickness of 5–20 nm was observed, and this type of retained austenite is known as interlath austenite. These types of austenite cannot be correctly identified via EBSD due to resolution limitations. This resolution limitation was the reason for the low fraction of RA determined via EBSD. Bulky RA grains of diameters larger than 200–300 nm are correctly identified via EBSD while the smaller cannot be convincingly identified and quantified. In order to have a more correct determination of the RA fraction XRD measurements were conducted. Although the TEM could visualise all of the RA present in the investigated volume, the statistical values of these small zones would be questionable. XRD analysis helps to solve these statistical issues as in this method a large volume of the material is characterised. The XRD results show that the RA fraction in the Q & P steel is 10.4%. Comparing the differences between the EBSD data and the XRD data, it is correct to assume that roughly half of the RA grains remained undetected by the EBSD and that this undetected part of the RA is mainly from interlath type.
An average grain size diameter for RA calculated based on the EBSD data is 0.46 µm and the one of martensite is 3.7 µm. This means that only half of the existing RA grains can be detected by the EBSD. Therefore, the average grain size presented here is an overestimation but still is a good estimation of the bulky RA grains present in the material. Having in mind that the large RA grains are among the first to transform, their variations can be associated on a later stage with the variations in the mechanical properties [62].
Additionally, the thermal stability of the retained austenite was investigated. Samples were submerged in cooled ethanol for 5 min at the pre-defined temperature and characterised afterwards via EBSD and XRD measurements. It was observed that the fraction of RA decreases gradually with the decrease of the temperature. At −40 °C, 2.5% of the pre-existed RA has transformed to martensite. This newly formed martensite has a high carbon content and effectively increases the fraction of fresh martensite in the steel. Cooling down below −40 °C, however, seems to have a limited effect on the transformation of RA to martensite. Samples cooled to even −90 °C have the same fraction of RA as the samples cooled to −40 °C. Two types of RA grains were distinguished based on their thermal stability. Around 2.5% of the RA grains transforms between room temperature and −40 °C. A large fraction of RA (around ~8%) is remarkably more stable, remaining untransformed until at least −90 °C. It was noticed that a larger fraction of RA grains observed via EBSD than the one detected via XRD was transformed upon cooling. The thermal and mechanical stability of RA grains was reported to be affected by many factors: carbon content, grain size, morphology, orientation, surrounding grains, etc. [62,63,64,65]. The retained austenite grains that transform first (under small undercooling or small mechanical loads) are the largest ones, i.e., the ones measured by EBSD. The retained austenite of interlath (film)-type (see Figure 4b) is more stable and remains untransformed even at temperatures as low as −90 °C because it has on average a higher carbon content as its bulky counterpart [66]. The martensite is the source of carbon and this results in easy C-diffusion due to limited distances needed to reach the centre of these thin-film-type grains. Additionally, the martensitic crystals can impose volume restrictions on the film-type austenite when it starts transforming. Hence, the volume changes during the diffusionless martensitic transformation will be more difficult to accommodate in the film-type RA grains than in the blocky type. These two groups of RA and their thermal stability are expected to have an influence on the mechanical stability of the RA and the properties of the Q & P steels.
An analysis of the texture of this Q & P material showed that the crystallographic texture is very weak and contains elements of BCC transformation textures (ferrite Β-fibre texture) originating from both deformed and recrystallised austenite. This is confirmed by the direct texture measurements on the retained austenite. The texture analysis of the RA texture before and after the static room temperature tensile deformation until US shows that the Copper and Cube component austenite texture components disappear from the texture after the deformation at room temperature. The texture analysis after tensile testing at 80 °C indicates the disappearance of the Copper texture component but some remaining Cube, Brass and S texture components with an intensity of ~1.5 mrd are still present. Further, in both experiments (RT and 80 °C), it is observed that the Brass component is least affected by the straining. When taking into account that a larger fraction of austenite is transformed when tested at RT when compared to 80 °C (see Table 4), the texture components can be ranked with respect to their transformation stability. It was concluded, that the following components can be ranked from the least to the most stable as follows: Copper, Cube, S and Brass component. This ranking based upon their stability is in good agreement with the modelled results reported in [37].

5.2. Static and Dynamic Properties

The planar anisotropy of the material was investigated by evaluating the engineering stress/strain curves of samples extracted at angles of 0°, 45° and 90° with respect to the rolling direction (Figure 9). The observed differences in YS/UTS, as well as US/FS, are in line with expectations. Indeed, most steels tested under 90° are characterised by a reduced deformation capacity, which is also the case here. The highest strength values are also found in the 0° direction and the lowest are found in the 45° direction. However, although differences are observed between the tensile curves in Figure 9, the overall in-plane anisotropy in tensile behaviour is rather small. This is attributed to the weak texture observed in the material.
The tensile curves show that the Q & P steel has a good to very good deformation capacity for all test conditions considered. Moreover, Lankford coefficients significantly higher than 1, with peak values close to 1.6, are found at room temperature (Table 2). Since high Lankford coefficients combined with good deformation properties are prerequisites for obtaining a good forming capacity, the studied steel might be suitable to form complex geometries. The presence of retained austenite which locally hardens the material by the TRIP effect lies at the base of both excellent Lankford coefficients and good elongation values. Indeed, the local transformation of austenite to martensite postpones local necking and thinning in the material. At higher levels of deformation, only small differences in Lankford coefficient are observed between the 0°, 45° and 90° direction which is beneficial for most forming operations. At the end of the uniform strain, the difference is limited to 0.1, which is again linked with the weak texture.
The samples were tested at different temperatures (Figure 10). At the lowest temperature of −40 °C, it is observed that the Q & P material has a higher UTS and slight decrease in YS when compared to room temperature. The increase in strength is expected as most bcc steels show the same tendency [67]. The reduced mobility of dislocations at low temperatures is often proposed to explain the phenomenon [67]. The low-temperature behaviour of Q & P steels, however, is more complicated as a part of the RA transforms into martensite by cooling alone. The transformation of the low-stability austenite into harder martensite, together with the absence of this austenite to initiate yielding, could result in an increase in YS; however, this is not observed here [68]. It is, therefore, believed that yielding starts in RA grains of which the thermal stability is high enough to guarantee their presence at −40 °C. However, the stability of these grains is much lower than at the higher temperatures considered. So, upon plastic deformation, these RA grains transform much faster resulting in the significantly higher hardening values observed in the low deformation region.
The US of the material at low temperature is similar to the US obtained at room temperature, although a decrease in FS is observed. This indicates that the loss of a small portion of RA does not negatively affect the elongation properties until the end of uniform straining. This might be due to the fact that the small fraction of RA that is unstable at low temperatures does not significantly contribute to room temperature elongation. Additionally, because of the lower stability of the RA at −40 °C, a larger fraction of the interlath martensite is formed at lower deformation levels. At room temperature and 80 °C, some RA grains might be too stable to transform and, therefore, to contribute to the TRIP.
To evaluate the hypothesis of the high stability of the RA, tensile tests at 80 °C were conducted. A decrease in both YS and UTS is seen, in line with the Q & P steel results obtained at high temperature presented in [68]. The decrease is explained in the first instance by easier dislocation mobility due to its thermally activated nature [67]. Secondly, the lowered YS might also result from the shift in transformation behaviour of austenite from stress-assisted to strain-induced at higher temperatures [68]. Last but not least, at increased temperatures, a reduced fraction of RA grains transforms upon straining. The resulting lower fraction of martensite, compared to the samples tested at room temperature, also contributes to a lower UTS. The hypothesis of a lower fraction of RA that transforms, due to its too high stability, is further strengthened by the significantly reduced FS and US compared to RT tests. Indeed, the lower RA fraction that transforms, results in less TRIP effect. This effect is observed because of a lower driving force for austenite transformation at elevated temperatures. As a consequence, the necking occurs earlier in samples tested at elevated temperature and this results in low US measured at elevated temperatures.
The lowest hardening is observed in the samples tested at the highest temperature, which is again attributed to the lower fraction of austenite that transforms during straining. it can be concluded that at high temperature, the RA is becoming too stable to be as effective as at −40 °C and room temperature.
Tests conducted in the dynamic strain rate range show a clear difference between tests at room and −40 °C and tests at 80 °C (Figure 12). At the lowest test temperatures, increasing the strain rate from 0.001 s−1 to 500 s−1 resulted in slightly lower strength values, e.g., a slightly negative strain rate sensitivity, though a reduced deformation capacity. These observations are linked with the lower fraction of martensite formed during the dynamic tests. The lower fraction is attributed to the higher stability of the retained austenite, and so less effective TRIP effect, due to the higher temperature reached in the dynamically deformed samples due to adiabatic heating. The temperature increase in dynamically deformed samples is more significant in high strength steels compared to low strength steels [6]. The increase in temperature due to adiabatic heating is estimated assuming that the heat generated by plastic work in the sample is not dissipated to the environment. For steels, generally, a value of 0.9 is adopted for the fraction of the plastic work converted into heat, denominated as the Taylor–Quinney coefficient. However, as the transformation of austenite to martensite is exothermic, in the present study, a coefficient equal to one is used to, at least partially, account for the heat production due to the transformation [69]. In this way, for the Q & P steel, a temperature increase of approximately 80 °C is obtained at the onset of necking.
In addition, at the highest temperature, the strength levels are hardly affected by the strain rate. As such, the Q & P steel follows the trend that advanced high strength steels are less strain rate sensitive than its low strength counterparts [70]. However, as opposed to the lower temperature tests, both uniform and fracture strain values increase with increasing strain rate. At the same time, after dynamic testing, retained austenite fractions at least four times higher compared to the other samples are found. The combination of the increased test temperature coupled with the further increase in temperature due to adiabatic heating results in some of the RA grains to be too stable. The low transformed fraction of RA goes along with a low TRIP effect, and should result in lower elongation values, which is not the case here. A possible explanation for the improved elongation capacity might be that the temperature rise gives rise to an enhanced ductility of the carbon-depleted martensite phase. Therefore, at 80 °C and dynamic strain rates, the favourable effect of temperature on the formability of the material dominates over the suppressed TRIP effect.

6. Summary and Conclusions

The static and dynamic tensile properties of a Q & P steel with reduced Si content compared to other Q & P steels were investigated in a temperature range from −40 °C to 80 °C. The observations made during the tests were linked with the microstructure of the steel. Since the stability of the retained austenite is of major importance, this aspect was extensively studied and discussed. The major conclusions drawn from the study are summarised hereafter:
(1) Based on their thermal stability, two types of retained austenite (RA) are distinguished: low-stability (blocky) RA, which transforms easily, and very stable (film-type) RA which does not even transform when the steel was cooled down to −90 °C. The largest fraction of RA was of the latter type.
(2) The studied Q & P steel was characterised by average Lankford coefficients well above one and low planar isotropy due to the weak texture. Combined with the relatively large deformation capacity of the material, this might result in good formability.
(3) The investigated Q & P steel shows excellent low-temperature tensile properties. Because of the high thermal stability of the austenite, a large fraction of RA did not transform upon cooling to −40 °C and could, therefore, contribute to the TRIP effect during testing at low temperature.
(4) At the highest test temperature (80 °C), a significant reduction in uniform strain is found. Since, compared to the tests performed at −40 °C and room temperature, a lower fraction of RA transforms into martensite during straining at 80 °C. This reduction is attributed to a less effective use of the TRIP effect, which highlights the importance of the TRIP effect to design steels with increasing strength/ductility levels in a wide window of temperatures.
(5) At −40 °C and room temperature, increasing the strain rate results in slightly lower strength values and a significant reduction of the deformation capacity. This is due to the lower fraction of strain induced martensite formed as a result of the higher stability of the retained austenite at the higher temperature reached in the dynamically deformed samples due to adiabatic heating.
(6) At the highest temperature, however, the strength values are hardly affected by an increase in strain rate and, remarkably, both uniform and fracture strain values increase. The improved elongation capacity might be explained based on the temperature (and adiabatic heating) rise, which gives rise to an enhanced ductility of the carbon-depleted martensite phase. Therefore, at 80 °C and dynamic strain rates, the favourable effect of temperature on formability dominates over the suppressed TRIP effect.
(7) At room temperature and below, the stability of retained austenite is key to exploit the potential of Q & P steels. Indeed, RA that is too or insufficiently stable will suppress the TRIP effect which is crucial for the mechanical properties.

Author Contributions

Investigation, F.V., C.C.-C. and B.M.L.; writing—original draft, F.V.; writing—review and editing, P.V. and R.H.P. All authors have read and agreed to the published version of the manuscript.

Funding

The authors gratefully acknowledge the financial support received from the European Union’s RFCS programme via the project OptiQPap, No. 709755.

Conflicts of Interest

The authors declare no conflict of interest.

Appendix A

An X-ray diffraction pattern of the used steel measured at room temperature is presented in Figure A1. The peaks used to derive the volume fraction of retained austenite are indicated ((220)γ and (311)γ). It has to be noted that no indication of tetragonality of martensite is observed.
Figure A1. X-ray diffraction pattern of the Q & P steel with indication of the peaks used to derive the volume fraction of retained austenite.
Metals 10 00509 g0a1

References

  1. Galan, J.; Samek, L.; Verleysen, P.; Verbeken, K.; Houbaert, Y. Advanced high strength steels for automotive industry. Rev. Metal. 2012, 48, 118–131. [Google Scholar] [CrossRef]
  2. Bouaziz, O.; Zurob, H.; Huang, M. Driving Force and Logic of Development of Advanced High Strength Steels for Automotive Applications. Steel Res. Int. 2013, 84, 937–947. [Google Scholar] [CrossRef]
  3. Matlock, D.K.; Speer, J.G.; de Moor, E.; Gibbs, P.J. Recent developments in advanced high strength sheet steels for automotive applications: An overview. Eng. Sci. Technol. an Int. J. 2012, 15, 1–12. [Google Scholar]
  4. Waterschoot, T.; De Cooman, B.C.; De, A.K.; Vandeputte, S. Static Strain Aging Phenomena in Cold-Rolled Dual-Phase Steels. Metall. Mater. Trans. A 2003, 34, 781–791. [Google Scholar] [CrossRef]
  5. Zaefferer, S.; Ohlert, J.; Bleck, W. A study of microstructure, transformation mechanisms and correlation between microstructure and mechanical properties of a low alloyed TRIP steel. Acta Mater. 2004, 52, 2765–2778. [Google Scholar] [CrossRef]
  6. Van Slycken, J.; Verleysen, P.; Degrieck, J.; Samek, L.; De Cooman, B.C. High-strain-rate behavior of low-alloy multiphase aluminum- and silicon-based transformation-induced plasticity steels. Metall. Mater. Trans. A 2006, 37, 1527–1539. [Google Scholar] [CrossRef]
  7. Olsen, G.B.; Cohen, M. Kinetics of strain induced martensitic nucleation. Metall. Trans. A 1975, 6, 791–795. [Google Scholar] [CrossRef]
  8. Bouaziz, O.; Allain, S.Y.P.; Scott, C. Effect of grain and twin boundaries on the hardening mechanisms of twinning-induced plasticity steels. Scr. Mater. 2008, 58, 484–487. [Google Scholar] [CrossRef]
  9. Gutierrez-Urrutia, I.; Raabe, D. Grain size effect on strain hardening in twinning-induced plasticity steels. Scr. Mater. 2012, 66, 992–996. [Google Scholar] [CrossRef]
  10. Yen, H.-W.; Huang, M.; Scott, C.; Yang, J.-R. Interactions between deformation-induced defects and carbides in a vanadium-containing TWIP steel. Scr. Mater. 2012, 66, 1018–1023. [Google Scholar] [CrossRef]
  11. Bouaziz, O.; Allain, S.Y.P.; Scott, C.; Cugy, P.; Barbier, D. High manganese austenitic twinning induced plasticity steels: A review of the microstructure properties relationships. Curr. Opin. Solid State Mater. Sci. 2011, 15, 141–168. [Google Scholar] [CrossRef]
  12. Luo, H.; Shi, J.; Wang, C.; Cao, W.; Sun, X.; Dong, H. Experimental and numerical analysis on formation of stable austenite during the intercritical annealing of 5Mn steel. Acta Mater. 2011, 59, 4002–4014. [Google Scholar] [CrossRef]
  13. Arlazarov, A.; Gouné, M.; Bouaziz, O.; Hazotte, A.; Petitgand, G.; Barges, P. Evolution of microstructure and mechanical properties of medium Mn steels during double annealing. Mater. Sci. Eng. A 2012, 542, 31–39. [Google Scholar] [CrossRef]
  14. Eskandari, M.; Zarei-Hazanki, A.; Mohtadi-Bonab, M.; Odeshi, A.; Szpunar, J. Microstructure and texture evolution in 21Mn–2.5Si–1.6Al–Ti steel subjected to dynamic impact loading. Mater. Sci. Eng. A 2015, 622, 160–167. [Google Scholar] [CrossRef]
  15. Eskandari, M.; Mohtadi-Bonab, M.A.; Zarei-Hanzaki, A.; Odeshi, A.; Szpunar, J.A. High-Resolution EBSD Study of Adiabatic Shear Band and Neighboring Grains After Dynamic Impact Loading of Mn-Steel Used in Vehicle Structure. J. Mater. Eng. Perform. 2016, 25, 1611–1620. [Google Scholar] [CrossRef]
  16. Erice, B.; Roth, C.; Mohr, D. Stress-state and strain-rate dependent ductile fracture of dual and complex phase steel. Mech. Mater. 2018, 116, 11–32. [Google Scholar] [CrossRef]
  17. Pippan, R.; Wetscher, F.; Hafok, M.; Vorhauer, A.; Sabirov, I. The Limits of Refinement by Severe Plastic Deformation. Adv. Eng. Mater. 2006, 8, 1046–1056. [Google Scholar] [CrossRef]
  18. Petrov, R.; Farideh, H.; Jurij, S.; Jesus, M.; Sietsma, J.; Kestens, L. Ultra-Fast Annealing of High Strength Steel. Int. Virtual J. Mach. Technol. Mater. 2012, 8, 68–71. [Google Scholar]
  19. Lolla, T.; Cola, G.; Narayanan, B.; Alexandrov, B.; Babu, S.S. Development of rapid heating and cooling (flash processing) process to produce advanced high strength steel microstructures. Mater. Sci. Technol. 2011, 27, 863–875. [Google Scholar] [CrossRef]
  20. Cerda, F.M.C.; Vercruysse, F.; Minh, T.N.; Kestens, L.; Monsalve, A.; Petrov, R. The Effect of Heating Rate on the Recrystallization Behavior in Cold Rolled Ultra Low Carbon Steel. Steel Res. Int. 2016, 88, 1600351. [Google Scholar] [CrossRef] [Green Version]
  21. Vercruysse, F.; Cerda, F.M.C.; Verleysen, P.; Petrov, R.H. Behavior of ultrafast annealed advanced high strength steels under static and dynamic conditions. Mater. Sci. Eng. A 2020, 780, 139168. [Google Scholar] [CrossRef]
  22. De Moor, E. Assessment of Quenching and Partitioning as a Fundamentally New Way of Producing Advanced High Strength Martensitic Steel Grades with Improved Ductility. Ph.D. Thesis, Ghent University, Ghent, Belgium, 2009. [Google Scholar]
  23. Speer, J.; Matlock, D.K.; De Cooman, B.; Schroth, J. Carbon partitioning into austenite after martensite transformation. Acta Mater. 2003, 51, 2611–2622. [Google Scholar] [CrossRef]
  24. Koistinen, D.; Marburger, R. A general equation prescribing the extent of the austenite-martensite transformation in pure iron-carbon alloys and plain carbon steels. Acta Met. 1959, 7, 59–60. [Google Scholar] [CrossRef]
  25. Edmonds, D.; He, K.; Rizzo, F.; De Cooman, B.; Matlock, D.; Speer, J. Quenching and partitioning martensite—A novel steel heat treatment. Mater. Sci. Eng. A 2006, 438, 25–34. [Google Scholar] [CrossRef]
  26. Clarke, A.J.; Speer, J.; Miller, M.; Hackenberg, R.; Edmonds, D.; Matlock, D.K.; Rizzo, F.; Clarke, K.; De Moor, E. Carbon partitioning to austenite from martensite or bainite during the quench and partition (Q&P) process: A critical assessment. Acta Mater. 2008, 56, 16–22. [Google Scholar] [CrossRef]
  27. Grajcar, A.; Kuziak, R.; Zalecki, W. Third generation of AHSS with increased fraction of retained austenite for the automotive industry. Arch. Civ. Mech. Eng. 2012, 12, 334–341. [Google Scholar] [CrossRef]
  28. Bigg, T.D.; Edmonds, D.V.; Eardley, E.S. Real-time structural analysis of quenching and partitioning (Q&P) in an experimental martensitic steel. J. Alloy. Compd. 2013, 577, S695–S698. [Google Scholar] [CrossRef]
  29. De Diego-Calderon, I.; De Knijf, D.; Molina-Aldareguía, J.M.; Sabirov, I.; Föjer, C.; Petrov, R. Effect of Q&P parameters on microstructure development and mechanical behaviour of Q&P steels. Rev. Metal. 2015, 51, e035. [Google Scholar] [CrossRef] [Green Version]
  30. Santofimia, M.J.; Zhao, L.; Petrov, R.; Kwakernaak, C.; Sloof, W.G.; Sietsma, J. Microstructural development during the quenching and partitioning process in a newly designed low-carbon steel. Acta Mater. 2011, 59, 6059–6068. [Google Scholar] [CrossRef]
  31. Speer, J.G.; De Moor, E.; Clarke, A.J. Critical Assessment 7: Quenching and partitioning. Mater. Sci. Technol. 2014, 31, 3–9. [Google Scholar] [CrossRef]
  32. Celada-Casero, C.; Kwakernaak, C.; Sietsma, J.; Santofimia, M.J. The influence of the austenite grain size on the microstructural development during quenching and partitioning processing of a low-carbon steel. Mater. Des. 2019, 178, 107847. [Google Scholar] [CrossRef]
  33. Santofimia, M.J.; Nguyen-Minh, T.; Zhao, L.; Petrov, R.; Sabirov, I.; Sietsma, J. New low carbon Q&P steels containing film-like intercritical ferrite. Mater. Sci. Eng. A 2010, 527, 6429–6439. [Google Scholar] [CrossRef]
  34. Santofimia, M.; Zhao, L.; Sietsma, J. Microstructural Evolution of a Low-Carbon Steel during Application of Quenching and Partitioning Heat Treatments after Partial Austenitization. Metall. Mater. Trans. A 2008, 40, 46–57. [Google Scholar] [CrossRef] [Green Version]
  35. Zhang, J.; Ding, H.; Misra, R.; Wang, C. Microstructural evolution and consequent strengthening through niobium-microalloying in a low carbon quenched and partitioned steel. Mater. Sci. Eng. A 2015, 641, 242–248. [Google Scholar] [CrossRef]
  36. Wang, X.; Xu, W.; Guo, Z.; Wang, L.; Rong, Y. Carbide characterization in a Nb-microalloyed advanced ultrahigh strength steel after quenching–partitioning–tempering process. Mater. Sci. Eng. A 2010, 527, 3373–3378. [Google Scholar] [CrossRef]
  37. De Knijf, D.; Nguyen-Minh, T.; Petrov, R.; Kestens, L.A.I.; Jonas, J.J. Orientation dependence of the martensite transformation in a quenched and partitioned steel subjected to uniaxial tension. J. Appl. Crystallogr. 2014, 47, 1261–1266. [Google Scholar] [CrossRef]
  38. Wang, L.; Speer, J.G. Quenching and Partitioning Steel Heat Treatment. Met. Microstruct. Anal. 2013, 2, 268–281. [Google Scholar] [CrossRef] [Green Version]
  39. Hao, Q.; Qin, S.; Liu, Y.; Zuo, X.; Chen, N.; Huang, W.; Rong, Y. Effect of retained austenite on the dynamic tensile behavior of a novel quenching-partitioning-tempering martensitic steel. Mater. Sci. Eng. A 2016, 662, 16–25. [Google Scholar] [CrossRef]
  40. Xia, P.; Vercruysse, F.; Petrov, R.; Sabirov, I.; Castillo-Rodríguez, M.; Verleysen, P. High strain rate tensile behavior of a quenching and partitioning (Q & P) Fe-0.25C-1.5Si-3.0Mn steel. Mater. Sci. Eng. A 2019, 745, 53–62. [Google Scholar]
  41. Smith, A.; Vercruysse, F.; Petrov, R.; Verleysen, P. The effect of Niobium on Austenite Evolution during Hot Rolling of Advanced High Strength Steel. J. Physics: Conf. Ser. 2019, 1270, 012030. [Google Scholar] [CrossRef]
  42. Smith, A.; Vercruysse, F.; Petrov, R.; Verleysen, P.; Linke, B. Effect of Ti on the Microstructure and Mechanical Properties of a Hot Rolled Advanced High Strength Steel Strip. Mater. Sci. Forum 2018, 941, 106–111. [Google Scholar] [CrossRef]
  43. Traint, S.; Pichler, A.; Hauzenberger, K.; Stiaszny, P.; Werner, E. Influence of silicon, aluminium, phosphorus and copper on the phase transformations of low alloyed TRIP-steels. Steel Res. 2002, 73, 259–266. [Google Scholar] [CrossRef]
  44. De Knijf, D.; Petrov, R.; Föjer, C.; Kestens, L.A. Effect of fresh martensite on the stability of retained austenite in quenching and partitioning steel. Mater. Sci. Eng. A 2014, 615, 107–115. [Google Scholar] [CrossRef]
  45. Lu, Y.; Yu, H.; Sisson, R.D. The effect of carbon content on the c/a ratio of as-quenched martensite in Fe-C alloys. Mater. Sci. Eng. A 2017, 700, 592–597. [Google Scholar] [CrossRef]
  46. Petrov, R.; Kestens, L.A. Advanced High-Strength Steels: Electron Backscatter Diffraction (EBSD); Informa UK Limited: Colchester, UK, 2016; pp. 46–69. [Google Scholar]
  47. Santofimia, M.; Petrov, R.; Zhao, L.; Sietsma, J. Microstructural analysis of martensite constituents in quenching and partitioning steels. Mater. Charact. 2014, 92, 91–95. [Google Scholar] [CrossRef]
  48. Cullity, B.D. Elements of X-Ray Diffraction; Addison-Wesley Publishing, Inc.: Boston, MA, USA, 1956. [Google Scholar]
  49. Magner, S.H.; de Angelis, R.J.; Weins, W.N.; Makinson, J.D. A historical review of retained austenite and its measurement by x-ray diffraction. Adv. X-Ray Anal. 2002, 45, 92–97. [Google Scholar]
  50. Meyers, M.A. Dynamic Behavior of Materials; John Wiley & Sons, Inc.: Hoboken, NJ, USA, 1994. [Google Scholar]
  51. Verleysen, P.; Degrieck, J.; Verstraete, T.; Van Slycken, J. Influence of Specimen Geometry on Split Hopkinson Tensile Bar Tests on Sheet Materials. Exp. Mech. 2008, 48, 587–598. [Google Scholar] [CrossRef]
  52. Verleysen, P.; Benedict, V.; Verstraete, T.; Joris, D. Numerical study of the influence of the specimen geometry on split Hopkinson bar tensile test results. Lat. Am. J. Solids Struct. 2009, 6, 285–298. [Google Scholar]
  53. Zhao, Y.; Guo, Y.; Wei, Q.; Topping, T.; Dangelewicz, A.; Zhu, Y.; Langdon, T.; Lavernia, E. Influence of specimen dimensions and strain measurement methods on tensile stress–strain curves. Mater. Sci. Eng. A 2009, 525, 68–77. [Google Scholar] [CrossRef]
  54. A. Standard, E8/E8M-13a, Stand. Test methods Tens. Test. Met. Mater; ASTM Int.: West Conshohocken, PA, USA, 2013.
  55. Wang, C.; Shi, J.; Cao, W.; Dong, H. Characterization of microstructure obtained by quenching and partitioning process in low alloy martensitic steel. Mater. Sci. Eng. A 2010, 527, 3442–3449. [Google Scholar] [CrossRef]
  56. Petrov, R.H.; Sidor, J.; Kestens, L.A.I. Microstructure and Texture Evolution in Advanced High-Strength Steels, Encyclopedia of Iron and Their Alloys; CRC Press: Boca Raton, FL, USA, 2016; pp. 70–99. [Google Scholar]
  57. Petrov, R.; León-García, O.; Sharma, H.; Lee, K.Y.; Offerman, S.E.; Kestens, L.A. In-Situ Texture Measurements by Synchrotron Radiation of TRIP Steel during an Austempering Treatment. Mater. Sci. Forum 2011, 702–703, 511–514. [Google Scholar] [CrossRef]
  58. Houbaert, Y.; Ros-Yanez, T.; Rodriguez-Calvillo, P. On the Effect of Texture in Experimental Grades of High-Silicon Electrical Steel; Trans Tech Publications Ltd.: Bäch, Switzerland, 2007; Volume 529. [Google Scholar]
  59. Hosford, W.F.; Caddell, R.M. Metal Forming: Mechanics and Metallurgy; Cambridge University Press: Cambridge, UK, 2011. [Google Scholar]
  60. Akbary, F.H.; Sietsma, J.; Petrov, R.; Miyamoto, G.; Furuhara, T.; Santofimia, M.J. A quantitative investigation of the effect of Mn segregation on microstructural properties of quenching and partitioning steels. Scr. Mater. 2017, 137, 27–30. [Google Scholar] [CrossRef]
  61. Sun, J.; Yu, H. Microstructure development and mechanical properties of quenching and partitioning (Q&P) steel and an incorporation of hot-dipping galvanization during Q&P process. Mater. Sci. Eng. A 2013, 586, 100–107. [Google Scholar] [CrossRef]
  62. De Knijf, D.; Föjer, C.; Kestens, L.A.; Petrov, R. Factors influencing the austenite stability during tensile testing of Quenching and Partitioning steel determined via in-situ Electron Backscatter Diffraction. Mater. Sci. Eng. A 2015, 638, 219–227. [Google Scholar] [CrossRef]
  63. De Diego-Calderon, I.; De Knijf, D.; Monclus, M.A.; Molina-Aldareguía, J.M.; Sabirov, I.; Föjer, C.; Petrov, R. Global and local deformation behavior and mechanical properties of individual phases in a quenched and partitioned steel. Mater. Sci. Eng. A 2015, 630, 27–35. [Google Scholar] [CrossRef]
  64. Morito, S.; Huang, X.; Furuhara, T.; Maki, T.; Hansen, N. The morphology and crystallography of lath martensite in alloy steels. Acta Mater. 2006, 54, 5323–5331. [Google Scholar] [CrossRef]
  65. Xiong, X.; Chen, B.; Huang, M.; Wang, J.; Wang, L. The effect of morphology on the stability of retained austenite in a quenched and partitioned steel. Scr. Mater. 2013, 68, 321–324. [Google Scholar] [CrossRef]
  66. Choi, K.S.; Zhu, Z.; Sun, X.; De Moor, E.; Taylor, M.D.; Speer, J.G.; Matlock, D.K. Determination of carbon distributions in quenched and partitioned microstructures using nanoscale secondary ion mass spectroscopy. Scr. Mater. 2015, 104, 79–82. [Google Scholar] [CrossRef] [Green Version]
  67. Curtze, S.; Kuokkala, V.-T.; Hokka, M.; Peura, P. Deformation behavior of TRIP and DP steels in tension at different temperatures over a wide range of strain rates. Mater. Sci. Eng. A 2009, 507, 124–131. [Google Scholar] [CrossRef]
  68. De Moor, E.; Lacroix, S.; Clarke, A.; Penning, J.; Speer, J. Effect of Retained Austenite Stabilized via Quench and Partitioning on the Strain Hardening of Martensitic Steels. Metall. Mater. Trans. A 2008, 39, 2586–2595. [Google Scholar] [CrossRef]
  69. Zaera, R.; Rodríguez-Martínez, J.A.; Rittel, D. On the Taylor–Quinney coefficient in dynamically phase transforming materials. Application to 304 stainless steel. Int. J. Plast. 2013, 40, 185–201. [Google Scholar] [CrossRef] [Green Version]
  70. Shakerifard, B.; Lopez, J.G.; Legaza, M.C.T.; Verleysen, P.; Kestens, L.A. Strain rate dependent dynamic mechanical response of bainitic multiphase steels. Mater. Sci. Eng. A 2019, 745, 279–290. [Google Scholar] [CrossRef]
Figure 1. Schematic representation of the sample with “dogbone” geometry used for both the quasi-static and dynamic tensile tests. All dimensions are in mm.
Metals 10 00509 g001
Figure 2. Light optical microscopy image of the steel after hot rolling.
Metals 10 00509 g002
Figure 3. (a) Secondary electron SEM image and (b) combined image quality (IQ) and phase EBSD maps showing the BCC phase (martensite) in red and FCC phase (austenite) in green. Grain boundaries that fulfil K-S orientation relationship are in white.
Metals 10 00509 g003
Figure 4. (a) Bright-field TEM observation of the quenching and partitioned (Q & P) steel. The red circles show the aperture positions from where the selected area diffraction (SED) patterns were obtained to identify the BCC and the FCC phases. (b) Dark-field image based on the FCC diffraction spots, showing the interlath retained austenite (white). (c) Diffraction spots in which the peaks corresponding to FCC are indicated by the blue lines.
Metals 10 00509 g004
Figure 5. (a) Orientation distribution function (ODF) of the material of which the phi2 = 45° section is presented; (b) a schematic representation of the Phi2 = 45° section of the Euler space showing the main BCC texture components.
Metals 10 00509 g005
Figure 6. ODFs of retained austenite plotted at the phi2 = 45°, 65° and 90° of the Q & P steel prior to testing (a) and after being strained in a static tensile experiment till uniform strain (US) at room temperature (RT) (b) and at 80 °C (c).
Metals 10 00509 g006
Figure 7. A key for the main texture components in FCC metals. (a) Phi2 = 45°; (b) Phi2 = 65°; (c) Phi2 = 90° and (d) a table with the Miller indices of the main texture components.
Metals 10 00509 g007
Figure 8. The fraction of retained austenite as a function of the temperature.
Metals 10 00509 g008
Figure 9. Static engineering stress–strain tensile curves obtained for sample orientations of 0°, 45° and 90° with respect to the rolling direction of the steel sheet.
Metals 10 00509 g009
Figure 10. Static engineering stress-strain tensile curves obtained at −40 °C, RT and 80 °C. The tests were carried out with the gauge section parallel to the rolling direction.
Metals 10 00509 g010
Figure 11. Hardening behaviour for tests performed at −40 °C, RT and 80 °C. The end of uniform straining is indicated by a triangle, circle and square for, respectively, the experiments carried out at −40 °C, RT and 80 °C.
Metals 10 00509 g011
Figure 12. Engineering stress-strain curves of the material tested under dynamic conditions at −40 °C, 20 °C and 80 °C. The tests were carried out with the gauge section parallel to the rolling direction.
Metals 10 00509 g012
Table 1. Chemical composition of steel used (wt.%).
ElementCSiMnAlFe
Amount, wt.%0.21.252.40.02Bal.
Table 2. R-values of the Q & P steel with the gauge section under an angle of 0°, 45° and 90° with respect to the rolling direction.
Sample Orientation wrt RDLankford Coefficient (R)
1.57
45°1.50
90°1.58
Table 3. Mechanical properties obtained from the tests.
Test Conditions YS (MPa)UTS (MPa)US (-)FS (-)
StaticOrientation
1140 ± 91238 ± 40.110 ± 0.0050.340 ± 0.010
45°1080 ± 91204 ± 50.100 ± 0.0050.315 ± 0.010
90°1130 ± 81221 ± 40.090 ± 0.0050.260 ± 0.010
Temperature
−40 °C1100 ± 111280 ± 50.105 ± 0.0050.285 ± 0.010
RT1140 ± 91238 ± 50.110 ± 0.0050.340 ± 0.010
80 °C1080 ± 81140 ± 30.060 ± 0.0050.225 ± 0.010
DynamicTemperature
−40 °CX1275 ± 70.090 ± 0.0080.260 ± 0.010
RTX1186 ± 80.088 ± 0.0080.255 ± 0.010
80 °CX1172 ± 60.060 ± 0.0080.235 ± 0.010
Table 4. Fraction of retained austenite (RA, %) present in static and dynamic samples strained until US at room and high temperature.
Test TemperatureStaticDynamic
RT (20 °C)0.50%0.65%
80 °C0.60%2.50%

