Article

Strong Welfare States Do Not Intensify Public Support for Income Redistribution, but Even Reduce It among the Prosperous: A Multilevel Analysis of Public Opinion in 30 Countries

by
M. D. R. Evans
1,* and
Jonathan Kelley
2
1
Department of Sociology, Nevada Agricultural Experiment Station, Interdisciplinary Social Psychology Ph.D. Program, and Applied Statistics Program at the University of Nevada, University of Nevada, 1664 N. Virginia Street, Reno, NV 89557, USA
2
Department of Sociology and Interdisciplinary Social Psychology Ph.D. Program, University of Nevada, and International Survey Center, LLC, 18124 Wedge Parkway, Suite 1035, Reno, NV 89511, USA
*
Author to whom correspondence should be addressed.
Societies 2018, 8(4), 105; https://doi.org/10.3390/soc8040105
Submission received: 25 June 2018 / Revised: 14 October 2018 / Accepted: 15 October 2018 / Published: 26 October 2018
(This article belongs to the Special Issue Attitudes about Inequalities)

Abstract

:
How tightly linked are the strength of a country’s welfare state and its residents’ support for income redistribution? Multilevel model results (with appropriate controls) show that the publics of strong welfare states recognize their egalitarian income distributions, i.e., the stronger the welfare state, the less the actual and perceived inequality; but they do not differ from their peers in liberal welfare states/market-oriented societies in their preferences for equality. Thus, desire for redistribution bears little overall relationship to welfare state activity. However, further investigation shows a stronger relationship under the surface: Poor people’s support for redistribution is nearly constant across levels of welfarism. By contrast, the stronger the welfare state, the less the support for redistribution among the prosperous, perhaps signaling “harvest fatigue” due to paying high taxes and longstanding egalitarian policies. Our findings are not consistent with structuralist/materialist theory, nor with simple dominant ideology or system justification arguments, but are partially consistent with a legitimate framing hypothesis, with an atomistic self-interest hypothesis, with a reference group solidarity hypothesis, and with the “me-and-mine” hypothesis incorporating sociotropic and egotropic elements. Database: the World Inequality Study: 30 countries, 71 surveys, and over 88,0000 individuals.

1. Introduction: Welfare State Strength (Welfarism) and Redistribution Attitudes

How closely is a country’s intensity and style of welfare state aligned with its citizens’ perceptions of their society and their attitudes and values? Does a country’s level of social spending and degree of corporatism match well with public opinion? These questions lie at the heart of theories of feedback between individuals and institutions and are relevant to many sociological arguments about how strongly institutions influence culture.
The tremendous productivity of modern socio-economic arrangements and technological innovation spawns riches at a level undreamt of in past centuries. But who is entitled to what share of these riches, and on what basis, are questions that have fueled revolutions in the past and which continue to form a focus of democratic political struggle throughout the modern world. A key dispute is over whether a market-oriented economy generates largely fair pay or whether achieving income justice requires extensive redistribution by the government.
A note on nomenclature. We focus on “welfarism”, as we will, for brevity’s sake to refer to the degree of development and extensiveness of a country’s welfare state. We will also refer to this concept as welfare state strength. Welfarism is measured as a continuum (for reasons elaborated below). Nonetheless, to concretize the results, we will often refer to groups of societies at different locations on the continuum. At the low end of welfarism are societies where the governmental bureaucracy (“the state”) includes very rudimentary welfare institutions and apparatus; social spending tends to be low and corporatism of economic organization tends to be limited. Different sociological and political science subfields use different labels, but “market-oriented society” and “liberal welfare state” are commonly applied to these countries. At the opposite end of the continuum are the countries with large and strongly established welfare institutions; social spending tends to be high and corporatism extensive. Welfarism summarizes the degree to which a state taxes and spends on welfare and the degree to which the state and labor market are corporatist. Again, many labels are possible, but we will call these societies “strong welfare states”. The label “enveloping welfare state” and its derivatives have been proposed as alternative descriptions of this same concept [1], but we prefer “welfarism” as briefer and more tightly focused.
This paper considers the welfare state as a set of institutions which is widely relevant to the populace, as all members of a society potentially benefit from goods and services provided by the welfare state and most pay taxes that support it. Moreover, the welfare state not only provides social insurance and redistribution, but also acts as a labor market arbiter shaping the distribution of wages. That makes it doubly relevant for the working masses [2,3,4]. This paper focuses on “preferences in context” [5,6], specifically about how individuals’ attitudes towards redistribution are shaped by their own characteristics and by the characteristics of their country’s welfare system. Further, we explore the possibility that the social processes translating individual characteristics into attitudes are shaped by the institutional context, e.g., the link between one’s own income and one’s attitudes may be stronger or larger in some institutional contexts than in others.
Since the demise of Communism, the remaining disagreements in this domain are over the legitimate extent of inequality and the ideal degree of management and redistribution to implement that. At one extreme, market-oriented systems, mainly in Anglo-Celtic legacy lands, largely limit government action to providing “rules of the game”, a stable legal framework for dispute resolution within the market-oriented economy, and a limited safety net. Their institutions largely respond to inequality as a normal “side effect” of market processes, treating the outcomes as morally neutral or even morally just. At the other extreme are the Northern European welfare states whose government institutions practice—and champion—extensive intervention in the economy: corporatist arrangements in the labor market, government directed income distributions, and extensive social support for those outside the labor market. The situation in the developing world has not, as yet, been fully integrated into this literature.
Our central question is: Does a country’s welfarism influence its citizens’ desire for redistribution? In particular, does the lived experience of individuals in strong welfare states induce them to endorse equality as a generalized goal more warmly than do their peers in market-oriented societies? Or do they feel that no further redistribution is necessary as they have already achieved their goals? Do people in market- oriented societies yearn for more redistribution to compress income differences generated by the market, or do they feel that redistribution is unnecessary, even perhaps undesirable, or have they lost faith in redistribution as poverty remains despite what they may perceive to be substantial taxation of the middle and upper classes? Until very recently, research on this issue has lacked appropriate data to study a broad range of societies.
OUR CONTRIBUTIONS. (1) Enriching the models: Welfare-state research has emphasized the role of welfare institutions as sources of public attitudes about redistribution [2,7,8,9,10,11,12,13]. We extend this line of research theoretically by incorporating perceptions and goals into models in this tradition. This enables us systematically to assess theoretical claims about institutional legitimacy, path-dependent culture, self-interest, and dominant ideology. (2) Broadening the scope: Many analytic arguments about the impact of the welfare state should apply to all levels of welfarism and may hold at all levels of economic development [14], but most previous research has covered (at most) two dozen rich Western nations for which comparable data are readily available. We extend the range of welfarism and levels of socioeconomic development to cover newborn welfare systems in Turkey, South Africa, South America, South East Asia, China, and the Philippines. This not only expands the number and diversity of countries, but also enables us to view a broader spectrum of welfarism. (3) Powerful statistical techniques: Extending the range of countries enables us to establish a firmer foundation of evidence by using powerful multilevel modeling techniques. These allow us to focus on welfare-state effects holding constant the influences of individual-level characteristics and national socioeconomic development. The latter is particularly important both for theoretical reasons and because its omission would risk a serious confounding-variables bias inflating the apparent effects of welfarism.
We use data from the World Inequality Study including 112 surveys in 46 countries with over 65,000 respondents who answered the relevant questions (detailed below). Most are from the International Social Survey Program’s four Inequality modules, first conducted in 1987 and most recently in 2009 (Design [15] Data archive [16]).

1.1. Theory and Prior Research: Why Might the Strength of the Welfare State Affect Public Attitudes about Redistribution? Why Might the Impact Vary According to Social Position?

1.1.1. Theory

Diverse middle-range sociological theories suggest a wide range of possibilities. A straightforward materialist atomistic self-interest explanation suggests close correspondence between individual dispositions and societal organization: The classic Marxist hypothesis is that the system of ownership of the means of production determines the institutions of societal governance as well as determining individuals’ perceptions, attitudes, and values about inequality according to their location in the social structure [17,18]. More recently, the concept of materially based self-interest has been expanded to include many factors contributing to economic advantage/disadvantage, e.g., education, occupational status, income, and the like, sometimes called “pocketbook” or “hip pocket” effects (ably summarized in [19,20]. Research extending and revising this line of reasoning to incorporate insights from the group dynamics literature finds that social definitions of group boundaries modify the effects of short-term atomistic economic self- interest on welfare state attitudes [21].
A technological determinism explanation, a theory of dominant ideology [22,23,24,25], or system justification theory [26] and social behaviorism [27] also suggest strong links between welfarism on the one hand and, on the other, perceptions, attitudes, and values.
Institutional theory, sometimes called institutional feedback theory or policy feedback theory, also posits alignment, but perhaps only moderately strong, whether viewed as institutional actions, as constraints on the action of individuals, as the state’s pervasive framing and incentive-creating opportunities, or as moral leadership flowing from the welfare state’s situation as an entity whose legitimacy and integrity are usually warmly endorsed. [27,28,29,30,31] One could, for example, anticipate that the norm of reciprocity increasingly enhances the legitimacy of redistribution as the welfare state expands and strengthens. Consistency would also align with a theory of democratic institutions [32,33] or simply democracy: public perceptions should be veridical, and public opinion should gradually shape major institutional changes.
A more nuanced interpretation, following organic solidarity theory [34,35] posits that societal health requires a moderate alignment of duty and desire, suggests that public views are more malleable in some domains than others, especially that human drives towards altruism/compassion, justice, and self-interest must all somehow be accommodated in a stable cultural and institutional system; i.e., in organic solidarity. This suggests that a policy package embodying all those elements should elicit strong support. This suggests that both egotropic and sociotropic elements are likely to play a role in attitude formation.
A loose constellation theory would suggest the public and institutions of the state “rub along” together without much mutual influence unless there is some kind of crisis, an “equilibrium rupture”, that demands cultural integration [36]. Instead, people’s attitudes and values will reflect their cultural heritage and the ideologies of themselves and their reference groups rather than national institutional practices and ideologies, a situation that has been labeled the “Government–Citizen Disconnect” [37].
By contrast, the random attitudes theory would predict no alignment, because it claims that stable, important attitudes do not exist—people randomly report what they feel at the moment and these reports bear no relationship to each other, nor to the person’s lived experience [38].
From a different angle, another strong thread in the fabric of the institutional theory of social policy and public opinion is a kind of population ecology perspective positing that, intentionally or unintentionally, welfare state policies and institutions create social and economic niches which are differently accessible according to people’s location in the social structure, so that policies shape the cost and benefit of the welfare state differently by niche and that rational choice based on niche opportunities differentiates attitudes towards the welfare state [20,39,40,41,42,43]. Note that this shares with materialism the view that social position/niche may produce different levels of costs and benefits and these operate through rational choice processes to differentiate atomistic economically self-interested attitudes, but it differs from the materialist perspective in locating the niche-creating mechanisms in the institutions of the welfare state rather than in technology and the organization of work.
Somewhat broadening this line of reasoning to incorporate the potential influence of socioeconomic homogeneity of reference groups in a society—which is of demonstrated importance in the domain of attitudes towards inequality [44,45]—and the related social construction of group interests vis à vis the welfare state [21] suggests that one’s status as net beneficiary or net donor becomes increasingly important to attitudes and values about income redistribution as the welfare state strengthens [46]. For example, the effect of one’s own income on redistribution attitudes may reflect one’s atomistic economic self-interest plus normative support for one’s in group that, when intensely developed, may become class consciousness. This reference group/group dynamics effect can be described as “… altruism bounded by perceptions of common group membership or shared experience” [47].
Thus, there may be no blanket impact of welfarism on attitudes towards redistribution, but instead, ironically, the strengthening of the welfare state elicits atomistically self-interested responses amplified and given moral status by reference group and group dynamics processes such that those low in the hierarchy continue to demand more redistribution, but those higher in the hierarchy increasingly turn against further redistribution. For brevity, we may call this the “me-and-mine” hypothesis. Notice that this thesis shares the atomistic self-interest plus reference group mechanism with materialist theory, but differs in sharing with population ecology theory the claim that the foundation of these interests lies in the ecology of the welfare state—in social policy and its institutional instantiations rather than in technology, work, and the organization of production.
The causal issues in this paper are simpler than in many, but readers who do not accept our causal arguments, could view our results as reflecting the degree of alignment (with no causal baggage attached).

1.1.2. Prior Research

Shortly after publication of the landmark The Three Worlds of Welfare Capitalism [40], research failed to show that public attitudes aligned with his regime types [48], unless they analyzed only specific ideal-type cases [12], in part because the power of their tests was very low, because the sample sizes of countries were small [9]. This put them at great risks of Type II errors—failing to detect effects that were really there. However, subsequent research using more countries, more powerful methods and better attitudinal measurement reveals low-to-moderate alignment on at least some dimensions. Analysis of European Social Survey data shows moderate alignment of welfare state regime and individuals’ support for welfare [9,10]. Analysis using World Values Survey data and International Social Survey Program data demonstrates that deservingness criteria pattern moderately by welfare regime and that this pattern correlates highly with welfare-state attitudes [12] with deservingness criteria playing a more important role in the UK than in Germany, Demark, or Slovenia [49] which could imply either Anglo-Celtic cultural causality or the influence of the strength of the welfare state. The net progressivity of the nation’s tax-and-benefit policy package may also play a role [46]. Health care policy preferences are moderately linked to characteristics of a society’s health care institutions [11]. Attitudes to income redistribution are also shaped by social mobility—both individual mobility, which reduces support, and societal levels of mobility, which increase it [43]. Moreover, support for the welfare state may be increasing as a function of inequality in liberal welfare states, while it is not in social democratic and coordinated welfare states [50].
This mounting evidence supports the claim of public opinion and institutions being at least somewhat aligned in at least some domains, albeit not as strongly as technological determinist theory, materialist theory, or dominant ideology theory would predict. On the other hand, the accumulating evidence strongly undermines random attitudes theory: the attitudes have been shown to be coherent (it is only their linkage to institutional arrangements which remains problematic). So long as we take institutional theory as implying real, but loose to moderately loose alignment, institutional theory, moderate integration theory, loose constellation theory, organic solidarity theory, and me-and-mine theories are all consistent with the newer evidence.

1.1.3. Hypotheses

Background: Causality

Prior to presenting the hypotheses, we need to consider causality. Sorting out the causal linkages between national institutional arrangements and individuals’ attitudes is extraordinarily difficult. First, the observable consequences of governments shaping their citizens are much the same as the observable consequences of citizens shaping their government [51]. Moreover, the statistical degrees of freedom and assumptions of simultaneous causality pose major challenges [51]. Fortunately, to peek ahead, two of our findings only make substantive sense in one causal direction—the reverse leads to counterfactual absurdities [52]. Specifically, consider our finding that the stronger the welfarism, the less inequality people perceive. This negative statistical association only makes sense with welfarism being the causal influence and perceptions being the response. We do not live in a world where perceiving less inequality would cause the expansion of the welfare state. Similarly, our finding that the stronger the welfarism, the less do prosperous people support redistribution only makes sense with welfarism as the causal influence and support for redistribution as a response. The counterfactual—that prosperous people’s declining support for redistribution causes the welfare state to expand and strengthen—is absurd. Accordingly, in this domain, it is plausible to take welfarism as potentially causal and redistribution attitudes as responsive, so we will use that language in discussing our results.
Nonetheless, even for readers who may reject this argument, the issue of alignment between institutions and attitudes is key, and our results can, alternatively, be read as measures of the strength and magnitude of statistical relationships between welfarism and redistribution attitudes.
We focus on the relationship between welfarism and redistribution attitudes. There are many other aspects of welfare states that could be considered, for example the degree to which benefits are targeted [53,54]. We have chosen welfarism rather than the other dimensions for both theoretical and practical reasons. One practical reason is the frustrating statistical demonstration that we need at least 30 (and preferably 50) higher-level cases per higher-level variable to achieve stable, replicable estimates of effects using the method most appropriate to our theoretical questions—multilevel analysis [55,56], so that requires us to choose among the potential dimensions. Furthermore, we must stretch the envelope by developing hypotheses and analyses that are net of GDP per capita because that has long been known to be an important cause of welfare state expansion [57,58], so avoiding confounding variables bias requires its inclusion.
Given that we must choose among dimensions of the welfare state, another practical reason for choosing welfarism is that one of its components is measured outside the OECD (and the other is readily estimable for countries beyond the OECD): This importantly broadens the population of countries to which the results apply [14,59,60].
In terms of our estimates of the effects of welfarism, if the other dimensions omitted from the models are really different (i.e., uncorrelated with welfarism), their omission will not bias the estimated effect of welfarism [52]. But, if they are intrinsically linked to welfarism and, therefore, correlated with it, then welfarism will carry their “proxy votes” and its effects will be inflated to that extent. This primarily means that we should be slightly cautious in our interpretation of welfarism’s effects, considering it more as a latent variable that is measured by our two indicators rather than especially emphasizing the indicators. Thus, our hypotheses are about welfarism, rather than about the specific indicators of it.
In additional sensitivity tests, we will assess the degree to which various other measured aspects of welfare states have parallel effects on attitudes towards redistribution when each is entered as the only welfare state indicator. Specifically, we will consider democracy, corruption, the rule of law, effective government, union density, the Gini coefficient, governmental ownership of industry, good regulation, Anglo-Celtic legacy, and population size.

Hypotheses

All our hypotheses are ceteris paribus, net of socioeconomic development of the country at that time and net of the stratification-related and demographic characteristics of respondents.
Hypothesis 1 (H1).
Veridical perceptions: The stronger the welfarism, the less public perception of inequality in society.
Hypothesis 2 (H2).
Strong alignment: The stronger the welfarism, the greater public endorsement of equality as a goal, and the stronger the public support for state practices of redistribution.
Hypothesis 3 (H3).
No alignment: Individuals’ degree of endorsement of equality as a goal and degree of support for state practices of redistribution do not align with welfarism.
Our fourth hypothesis, the “me-and-mine” hypothesis concerns a cross-level interaction between individual-level income and welfarism (measured at the national level).
Hypothesis 4 (H4).
Me-and-mine: Little or no main effect of welfarism on attitudes towards redistribution, but a strong interaction effect such that as welfarism grows, attitudes differentiate: poor people maintain or even increase their support for further redistribution, but prosperous people increasingly turn against further redistribution, i.e., a strong negative interaction.

2. Methods and Materials

2.1. Measurement

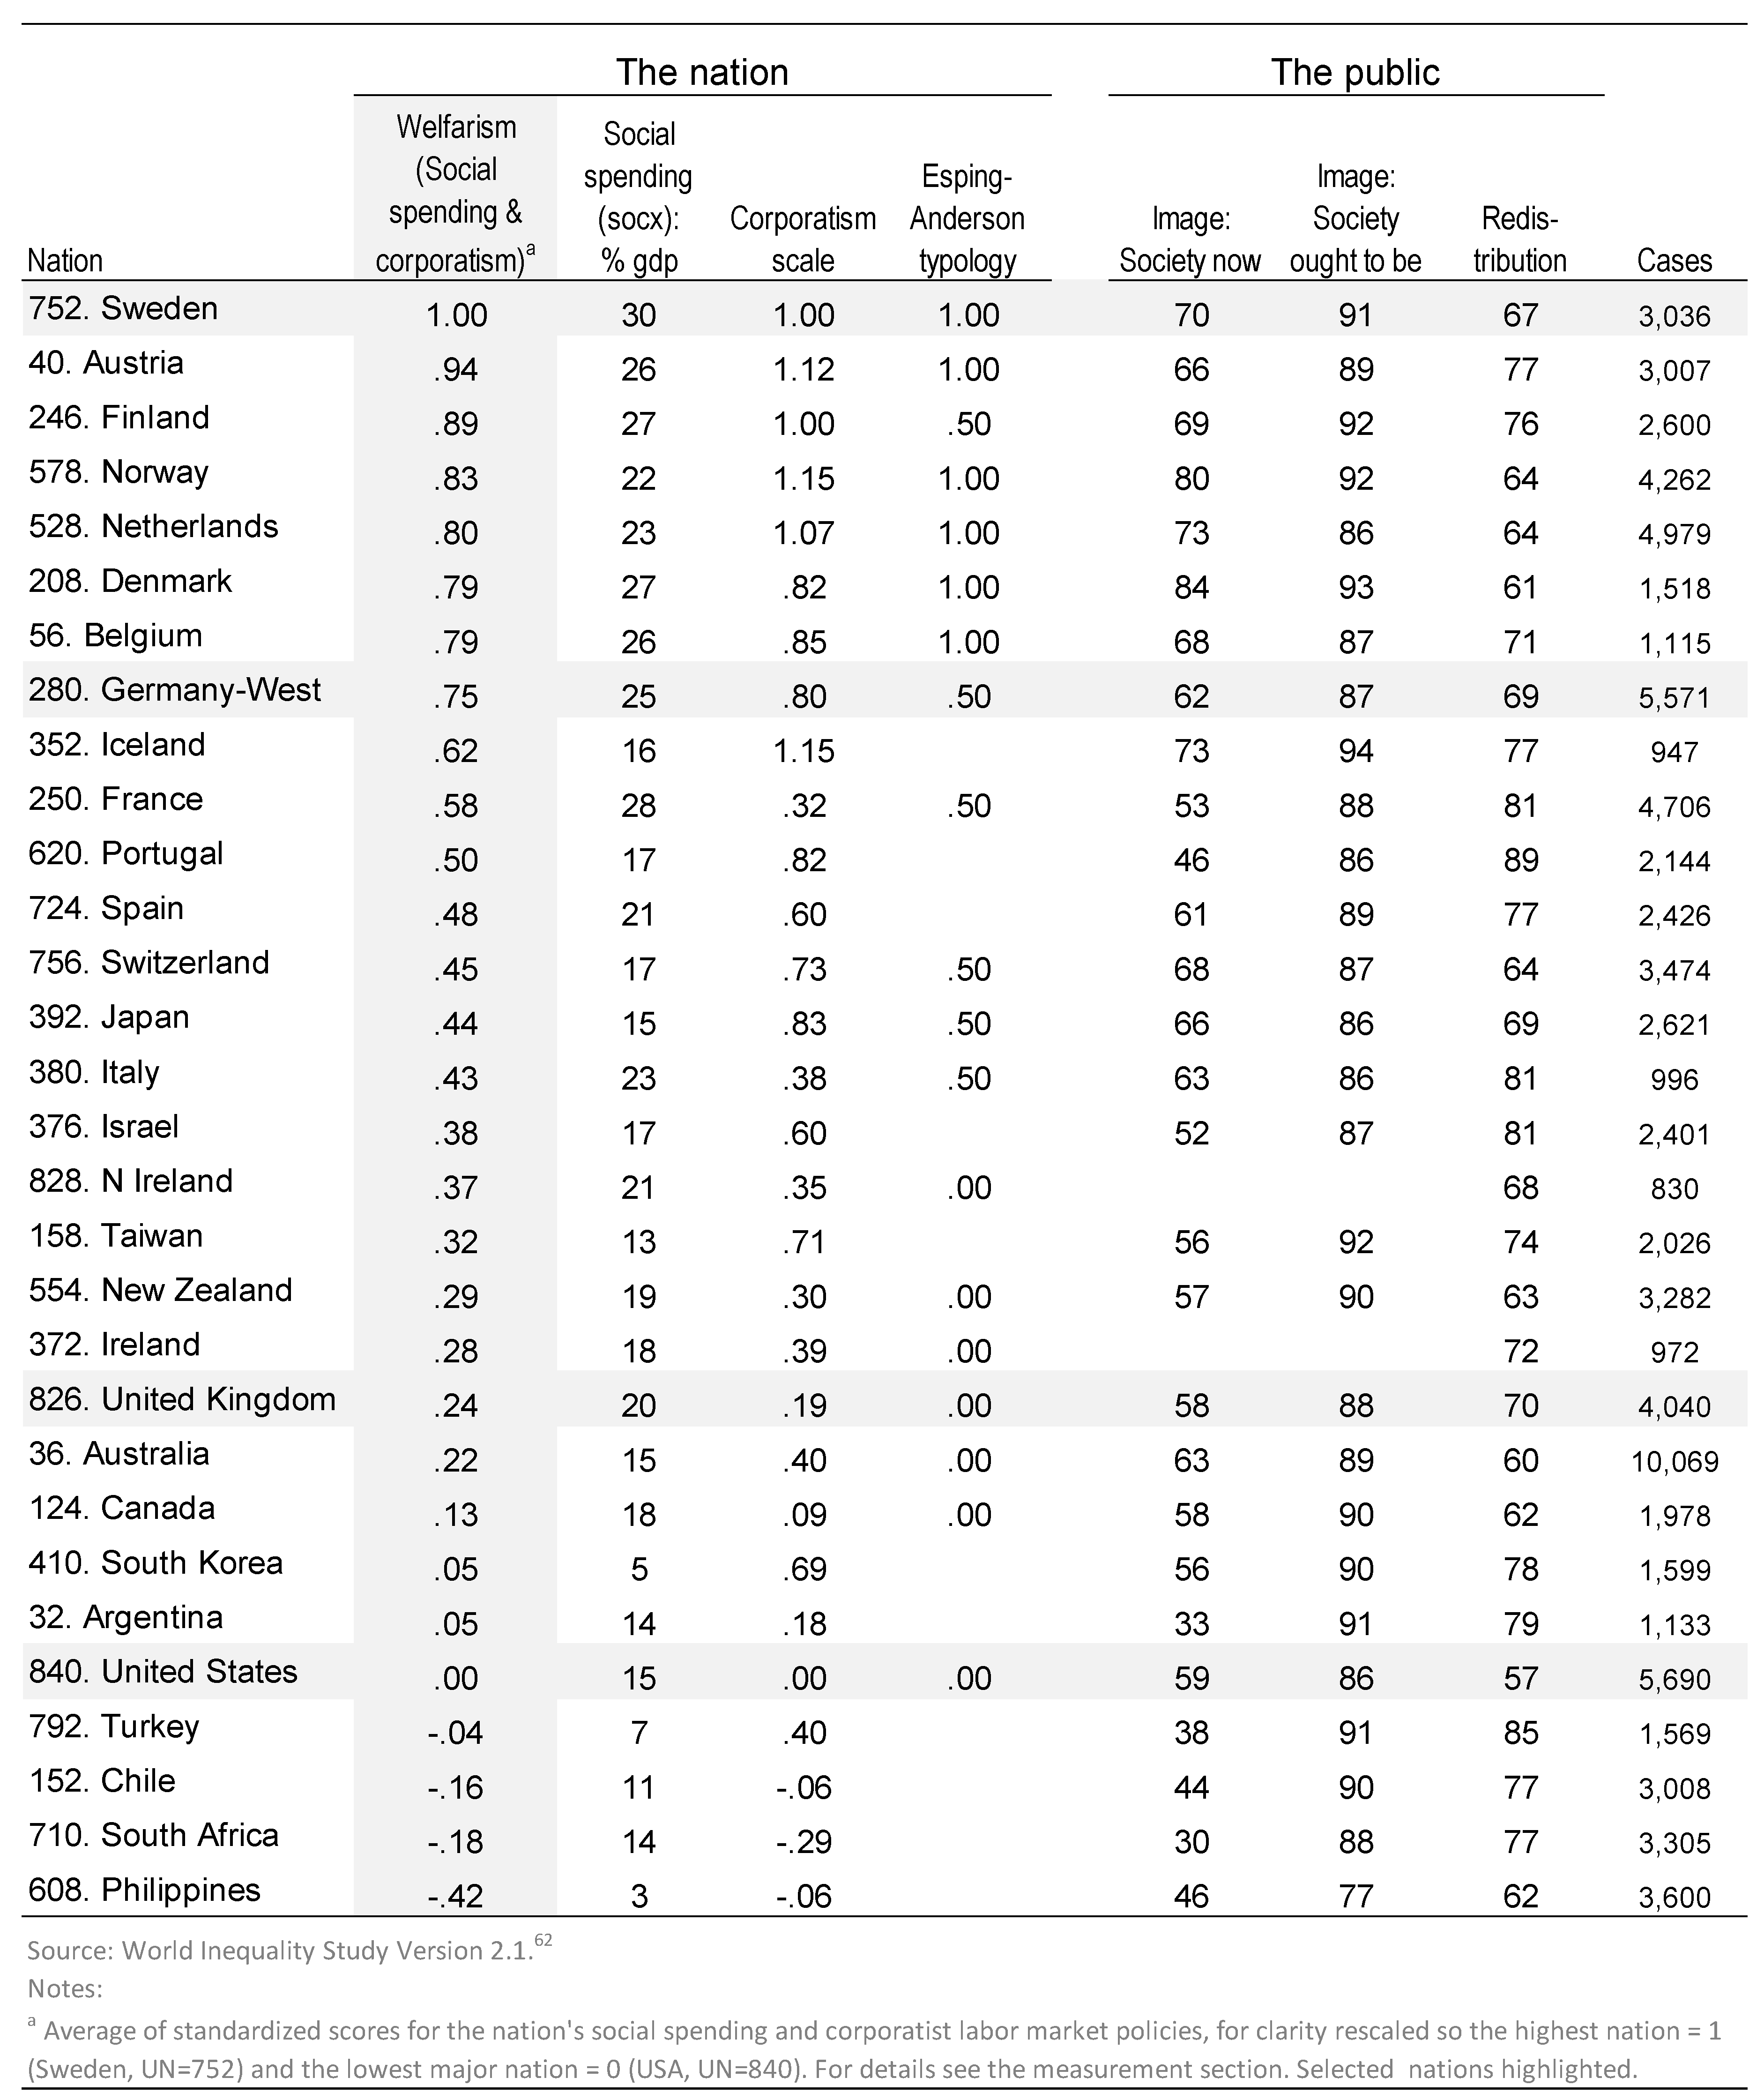
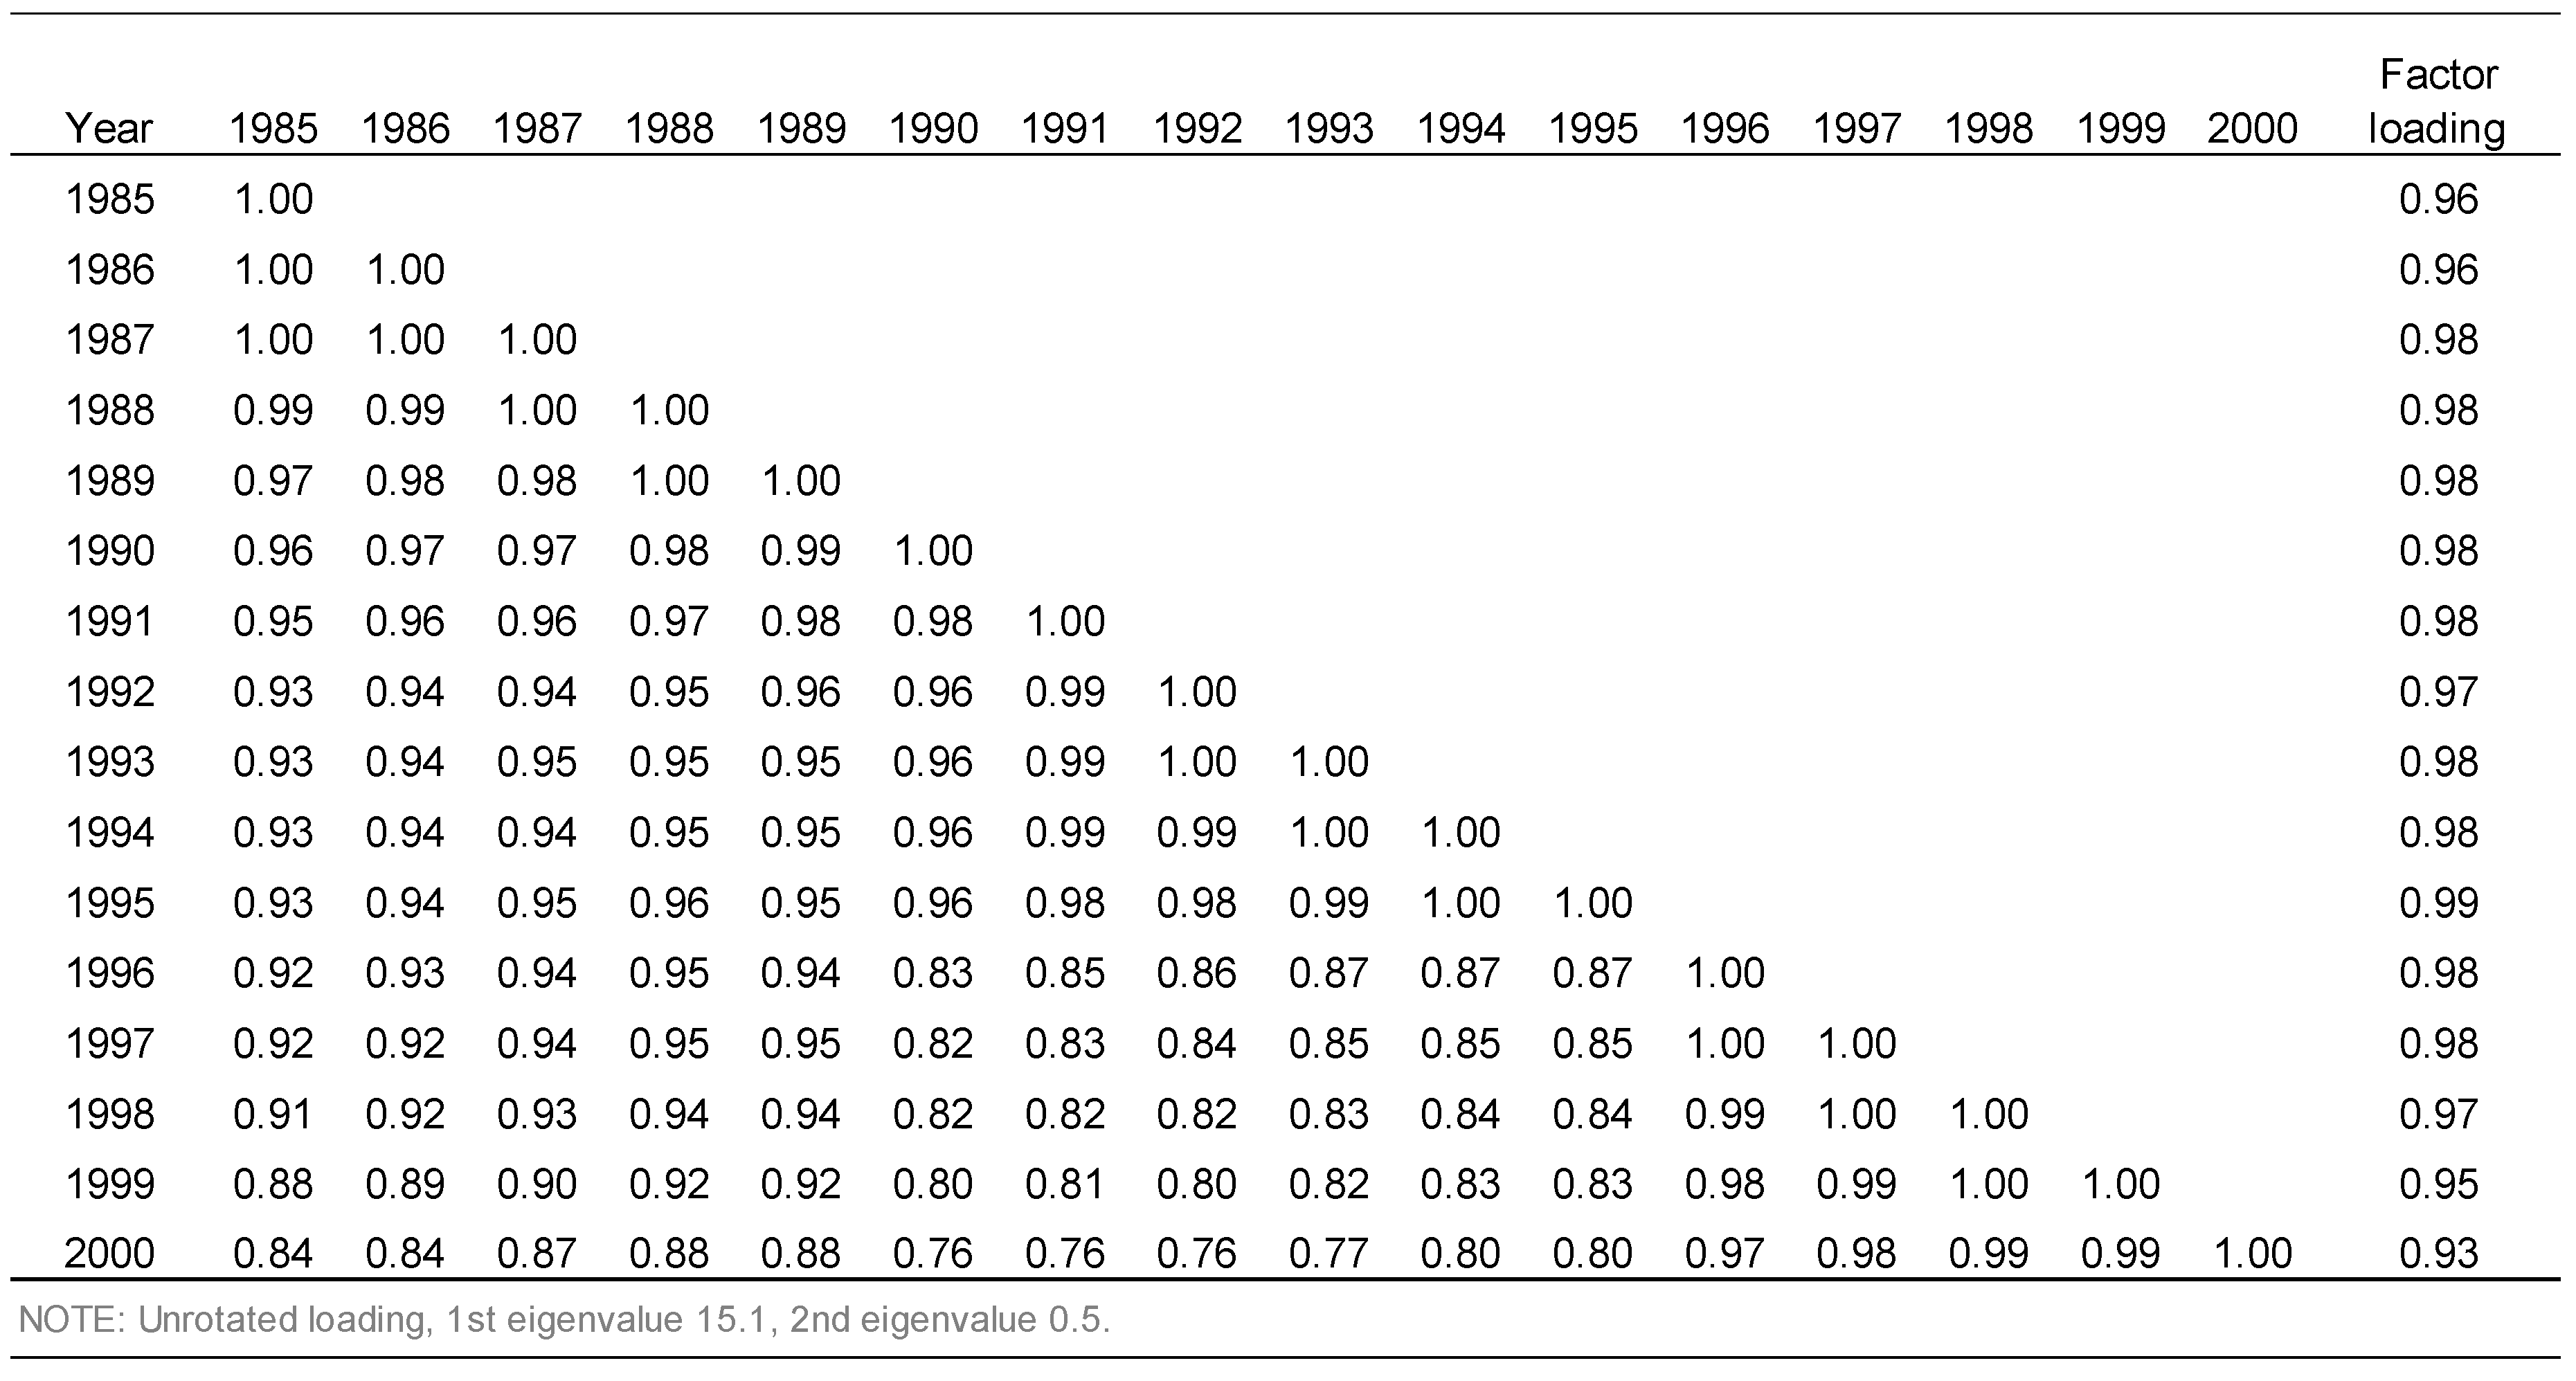
2.1.1. Welfare State Strength (Welfarism)

Consistent with the counter-Marxist claim that social institutions are not determined by the technological base and the relations of production [61], subsequent theory, and research has suggested many dimensions on which welfare state institutions differ [54,62,63], such as welfare spending, employment policy, family policy, corporatism, and other political dimensions; universalism of benefits provision, government provision of health, childcare and other welfare services; and the size of the government sector generally [10,40,54,63,64,65,66,67,68,69,70].
Social spending policies that redistribute and corporatist wage policies that distribute may appear to constitute separate spheres; however, they develop hand-in-hand [57,58,61]. The evidence to date supports the view that the rise of these two spheres is coterminous. As summarized by two experts: “More critically from our point of view, institutions that promoted equality in the distribution of wages coevolved with institutions that promoted redistribution, thus producing the pattern we observe today” [71]. The history of corporatist labor market policy and welfare provision are strongly intertwined: They are the two halves of the modern political market economy where the state participates (to varying degrees) alongside private interests.
This paper focuses on the joint and mutually reinforcing impact of these two key aspects of welfarism: the magnitude of welfare provision (social spending as a percent of GDP, see details in Appendix A, Figure A2) and the amount of corporatism as state-backed industrial and market coordination, and collective bargaining (Appendix A, Figure A2). We can view welfare state orientation and development as a continuum with strongly market-oriented societies at one end and, at the other end, strongly welfare-oriented societies with a commitment to universal provision. Corporatist societies more oriented towards status and familial welfare states fall in between (evidence supporting the view that the two indicators measure one dimension is given below). At the low end of this dimension, countries have small, rudimentary institutions of welfare and corporatism: They are “market-oriented” countries that have “liberal” welfare states. At the opposite, high end of this dimension are the “strong” welfare states of countries where institutions of welfare and corporatism are extensive and highly developed.
Our conceptualization of welfare state institutions in terms of strength leads us to adopt the term welfarism for brevity’s sake. Our welfarism measure is a scale incorporating these two halves of the welfare state: social spending and corporatism. Our main analyses use a two-item index combining both as a measure of welfarism, the degree of development of the welfare state. However, we also provide sensitivity tests showing that the same conclusions would emerge using spending, corporatism, and Esping-Andersen’s typology separately.
To concretize the measure, Figure 1 provides the welfarism scores for each country in our study, together with means of the alternative measures of welfarism (spending and corporatism separately and the Esping Andersen measure), perceived inequality, desired inequality, and support for redistribution.

2.1.2. Social Spending
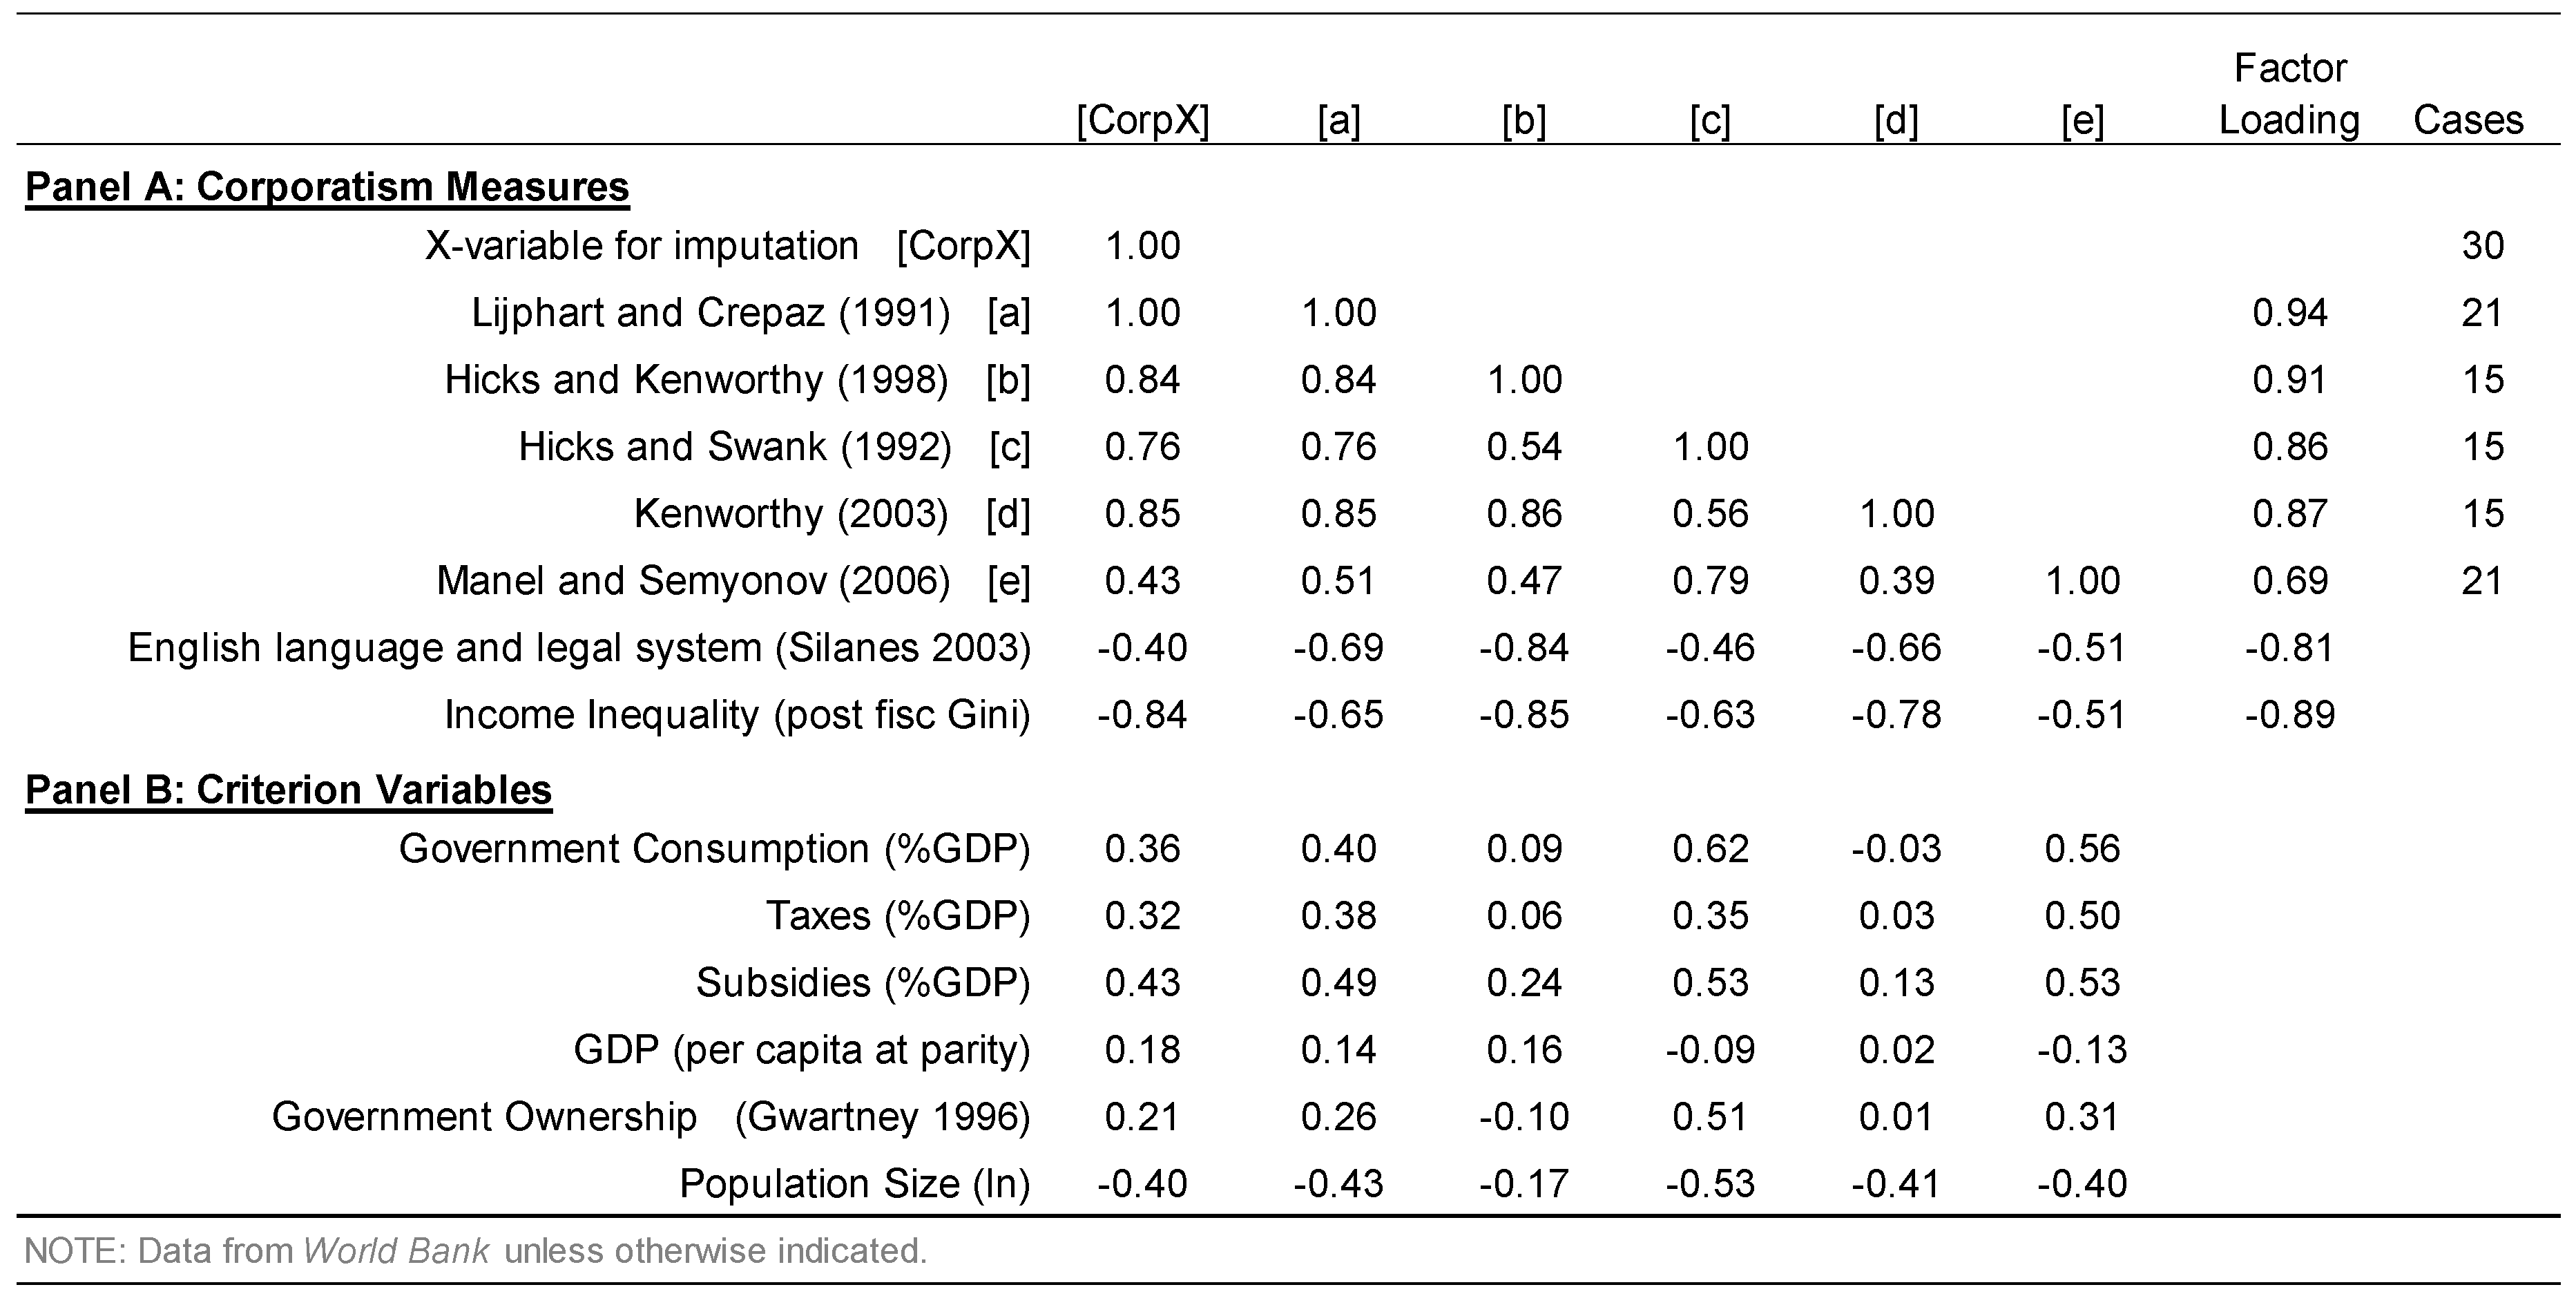
We characterize countries’ social spending by the proportion of GDP they devote to spending on health, old age support, and other social causes using the OECD’s familiar social expenditures as a percentage of GDP variable, “SOCX” (OECD 2018). Most social spending goes into old age income (pensions) and health care—around 80% of most countries’ social welfare budgets—followed by (un)employment, family policies, housing, and some other bits. These different aspects of spending, and the taxes to pay for them, are highly correlated: Nations that spend more on one tend very strongly to spend more on the others and to tax more to pay for them (Figure 2, Panel A1) [67,69,72,73].
Turning to scale reliability, the Cronbach’s alpha, a measure of internal consistency, is 0.80 for the social spending subscale (Figure 2, Panel A1), well above the conventional standard of at least 0.70 for a reliable scale. All five items have similar correlations with various other variables (Figure 2, Panels A2 and B), as they should on the classical measurement model [74,75].
Moreover, countries that spend generously on welfare are also generally more corporatist, higher on Esping-Andersen’s welfare state typology, experience higher GDP per capita (Panel A2), and their citizens are more satisfied with social service provision (Panel B).
The social spending measure is inevitably narrow because it says only a little about the quality of welfare provision [76,77]. However, different aspects of spending and other features of the state also have similar correlations with total social spending and other variables (Panel B). Combined with the high correlations among the spending indicators, this is evidence that the various aspects of social spending measure a single dimension, according to classic measurement methods [74,75]. Note also that countries’ spending trajectories are rather rigid with very high correlations over time (Appendix A, Figure A1).
Therefore, we conclude that social expenditures provide a consistent measure of the strength of welfare states. The amount of spending links to commitments to social justice and equality [7], reductions in poverty [78], rates of decommodification [40], the type of wage coordination that takes place [71], and loosely reflects the institutional design of welfare state replacement rates [68,79]. These linkages are important, as we are using spending as one indicator of the strength of the welfare state.
Since spending fluctuates little from year-to-year within countries (Appendix A, Figure A1), for our spending measure, we take the average spending from 1985–2000 to increase reliability. Five of our societies are not in the OECD database (Argentina, Taiwan, the Philippines, South Africa, and Northern Ireland) and we impute for them using analogous World Bank data. We use a linear prediction by fitting an OLS regression of a pooled measure of the analogous World Bank expenditure variable on social spending (“SOCX”). This essentially transforms the World Bank measure into the OECD measure for these countries.

2.1.3. Corporatism

Different corporatism scorings have somewhat different rationales but are highly correlated (Figure 2, Panel A2). These include the Hicks and Kenworthy composite focusing on social institutions [73], the politically focused Hicks and Swank index [67], the Kenworthy wage coordination measure [69], and the OECD measure that extends the Kenworthy wage coordination measure [72].
The correlations involving corporatism variables (Figure 2, Panels A2 and B) are based on fewer countries, so we exercise caution. That said, all the measures seemingly tap a single latent phenomenon: Correlations among them are high (average r = 0.68) and correlations with criterion variables are consistent across the corporatism items. The Cronbach’s alpha for this subscale is a solid 0.82. To make a summary corporatism measure, we first standardized the four corporatism scales in Figure 2 and then averaged these using a routine that, for each country, anchored the scores to the average for countries with all four, then averaged all the available standardized scores.
The quantitative corporatism literature focuses on rich Western nations, mainly the same much-studied OECD nations for which statistics are readily available. This leaves almost half-a-dozen societies in our World Inequality Study dataset unmeasured. Omitting them would be a real loss to this study, as corporatism has been common, not just in rich nations but also in many poor ones. It was, for example, widespread in sub-Saharan Africa in the first few decades after independence and more recently in China and South Africa [80,81,82,83]. To avoid dropping these countries we imputed corporatism using other sources including an expert survey (see Appendix A, Figure A2) [84]. A large literature describes welfare states in general and, in particular, provides criteria to measure different types of corporatism [7,62,85,86]. An expert survey measuring corporatism in 21 countries [84] provides an ‘exogenous’ source for making an imputation. However, the survey did not cover some of our countries. To develop corporatism imputations for them, we take a different tack. Since strong corporatism is rare in English-speaking cultures, or in other nations influenced by English culture and law [87], we can use information on language and law to impute corporatism. To measure language, we score predominantly English-speaking nations 1 and all others 0. Anglo-Saxon law is even more widespread than the language. We measure it following the standard source [88], with additional information [89,90]. The scores are 1 = Common law; 0.5 = Mixed; and 0 = other. For the analysis, we average these two. Our measured variables are highly correlated with the Lijphart and Crepaz index (Appendix A, Figure A2, Panel A) and have similar correlations with other important characteristics of societies. Therefore, we have good reason to use all available information from Panel A to impute corporatism for the six societies that lack all of our four measurements.
The English language and law measure is highly correlated (negatively) with measures of corporatism and the welfare state (Appendix A, Figure A2). So too is the Gini coefficient. Moreover, both have very similar correlations with other national characteristics. Factor analysis suggests that English language and law and Gini are similar to a variety of measures of corporatism and the welfare state. Despite only 13 cases with data on all, the factor loadings are very strong, and all of the focal variables have similar correlations with each of the criterion variables, in particular with welfare state and size of government measures. The result justifies creating an extension of the Lijphart and Crepaz scale using English language and law as predictors, and then to using this extension as an independent variable to predict corporatism and fill in our missing six countries.
Looking across nations, social spending and corporatism are well correlated (r = 0.49, 30 societies, t = 2.94, p < 0.01, see also Figure 2), with a few exceptions. Iceland and perhaps Norway are much more corporatist than usual for nations at their level of social spending. The USA and Canada may be fractionally less corporatist than usual for nations at their middle levels of social spending. South Africa and France are less corporatist than nations at their level of spending. Nonetheless, the alignment is clear.

2.1.4. Social Spending and Corporatism = “Welfarism”

Finally, we standardize the corporatism index and the social spending measure and then average them to create our welfarism scale summarizing the degrees of activity of the welfare state in distribution and redistribution. For clarity and without loss of generality, these scores were re-scaled by a linear transformation to range between two familiar anchor points where Sweden = 1 and the USA = 0 (Figure 1, column 1). Any other linear transformation would produce equivalent results, different only by a scale factor. Sweden is in fact the most welfarist of the nations in our data, but the USA is not the most extreme market-oriented nation—the Philippines, South Africa, Chile, and Turkey are more extreme and, therefore, garner negative scores on the re-scaled measure.

2.1.5. Esping-Andersen’s Three Worlds

We also deploy Esping-Andersen’s typology of regimes into social democratic, conservative/coordinated, and liberal, converting it back into a continuous variable for straightforward comparability with other welfarism measures. For clarity (and without loss of generality as it has no consequences save changing the units, like giving prices in Euros instead of dollars) we score social democratic = 1 and liberal = 0. Any other scoring would lead to mathematically equivalent results differing only by a simple linear transformation. Even if our linearization of the typology could cause differences of opinion among welfare state scholars, it provides a logical check of our work [91]. Our sensitivity analyses only include those countries categorized by Esping-Andersen, so they have only 19 societies (column 4, “Esping Andersen Typology” in Figure 1). That provides a robustness check on our analyses and may be more familiar to scholars focusing on European welfare states. The results of our analyses (below) show that the Esping-Andersen measure closely follows the welfarism scale and produces nearly identical associations.
The only important assumption needed is the score for the middle group, conservative/coordinated. Any typology with two categories is mathematically equivalent (up to a linear transformation) to a single dummy variable. Linearizing a typology with three categories requires one substantive assumption, viz. the score for the third category. Linearizing a typology with four categories requires two such assumptions, and so on. Following Ockham’s razor, we make the simple assumption that it is halfway between social democratic and liberal and so give it a score of 0.50 (the conventional equal interval assumption). Alternatively it might be closer to liberal (say with a score of 0.25) or closer to social democratic (say with a score of 0.75). These alternatives do make a mathematical difference, albeit in practice a trivially small one (each is correlated r = 0.97 with the equal-interval scoring).
However, a dummy variable specification (Liberal nations/Conservative/Social Democratic) has some advantages for analyzing attitudes to redistribution. Conservative nations may (p < 0.05) favor it slightly more (6 to 9 points out of 100) than liberal or social democratic nations net of other things (Appendix A, Figure A3).
Those countries not examined by Esping-Andersen are dropped from this measure, leaving models with only 19 societies instead of the full 30 (see column 4, “Esping-Andersen Typology” in Figure 1). As will become obvious shortly, the Esping-Andersen measure closely parallels welfarism and produces nearly identical associations.

2.1.6. Control Variables

Where possible, we use continuous and quasi-continuous measures for the control variables because they provide more information, and hence better estimation, than collapsing such measures into categories, as has long been known [92,93,94,95].

Country-Level Controls

The key country-level control variable is GDP per capita at parity purchasing power [96], averaged for the three years preceding each survey (to enhance reliability). For clarity and without loss of generality, we score it as an index with USA = 1. Other potential causal country-level variables that have been used in the literature, such as the Gini, union density, social trust, and the like are causally posterior to GDP per capita or welfarism (or both) and so do not belong in our main models which focus on the total effects of welfarism and its interaction with individual income.
The danger of estimating a model that omits potentially confounding variables is that it may artificially inflate the coefficient estimates for the variable which is included (and, hence, acts as proxy for its determinants and correlates). However, candidate control variables that are causally prior to socioeconomic development (GDP per capita) and to welfarism have not been posited in the literature, except possibly for Anglo-Celtic heritage as an inhibitor of welfarism [85,87]. That turns out not to be a serious worry here, because the null main effect of welfarism that we will observe (see the Results section below) is obviously not inflated. Moreover, we suffer from a small-N problem (although our sample of countries is larger than most in the literature) and cannot adjudicate correlated effects at the higher level [55,56,97]. Although there is often a tension in selection of higher-level variables for multi-level research between parsimony (to address the small-N problem) and specification adequacy (to address the omitted variables/confounding variables possibility), parsimony has much the stronger claim here because there is no sign of an inflated effect in the parsimonious model and because no compelling rationale has been provided for a prior determinant, with one exception. For brevity throughout the results section we will refer to welfarism as having a substantive link to redistribution attitudes, and will only return to the possible conflation with Anglo-Celtic heritage [87] (see also Figure 1 in [46]) in the Discussion.
Nonetheless, for readers who take a more favorable view of extensive country-level controls, we provide evidence on a wide variety of them—Anglo-Celtic heritage, population size, democracy, stable government, effective government, regulatory climate, rule of law, governmental corruption, Gini inequality, government ownership and union density [62,87,98,99,100]—in Appendix F, Figure A10 and Figure A11. The latter 6 are conceptually posterior to welfarism, so in theory there would be the possibility that that welfarism’s effects would be transmitted through them, but, in the event, adding them makes little or no difference to our total effect results.

Individual-Level Controls

Prior research finds effects of some demographic variables, notably age and gender [19], as well as stratification-related variables that indicate self-interest and potentially reference-group interest.
Birth cohort is measured in single years, in line with Ryder’s influential argument for the centrality of cohort as an enduring determinant of attitudes [101]. Our gender variable is Male, scored with female as the reference category and male as the deviation category (male = 1, female = 0).
Education is measured in years completed. These are trimmed to a maximum of 20 following the International Social Survey Programme’s specifications, with interpolations from categorical codes for the few surveys in which exact year was not available.
Occupation is measured in Worldwide Status Scores (WSS) [102,103]. Details are in Appendix B, Figure A4.
Income is expressed as a ratio to the average earnings of unskilled full-time male workers [104]. Thus, income is relative to incomes in that country and at that time period, not in internationally comparable units like dollars or Euros. For simplicity we call this base “unskilled wages” or “minimum incomes”.
Perceived and desired inequality [44,105]. These additional predictors are described in detail in the Results section where they are used. They are graphic questions, so including them near the results will facilitate interpretation.

2.1.7. Atomistic Economic Self-Interest and Welfarism: Interaction

Addressing the possibility that welfarism does not shape the redistribution attitudes of all citizens alike, but rather differentiates their attitudes in line with their atomistic economic self-interest and the perceived interests of others in their socioeconomically homogeneous reference groups, we also include an interaction term that allows the effect of income on redistribution attitudes to differ according to the degree of welfarism in the society.
Such an analysis is only justified if the interaction does not produce out-of-range predicted values. The range of the redistribution attitudes index is potentially from 0 to 100 and the range of actual mean values by country ranges from the mid-50s to the high 80s (Figure 1). To foreshadow, the predicted values from our model including the cross-level interaction range from the mid-50s to the upper-70s. Hence, use of the cross-level interaction is justified.

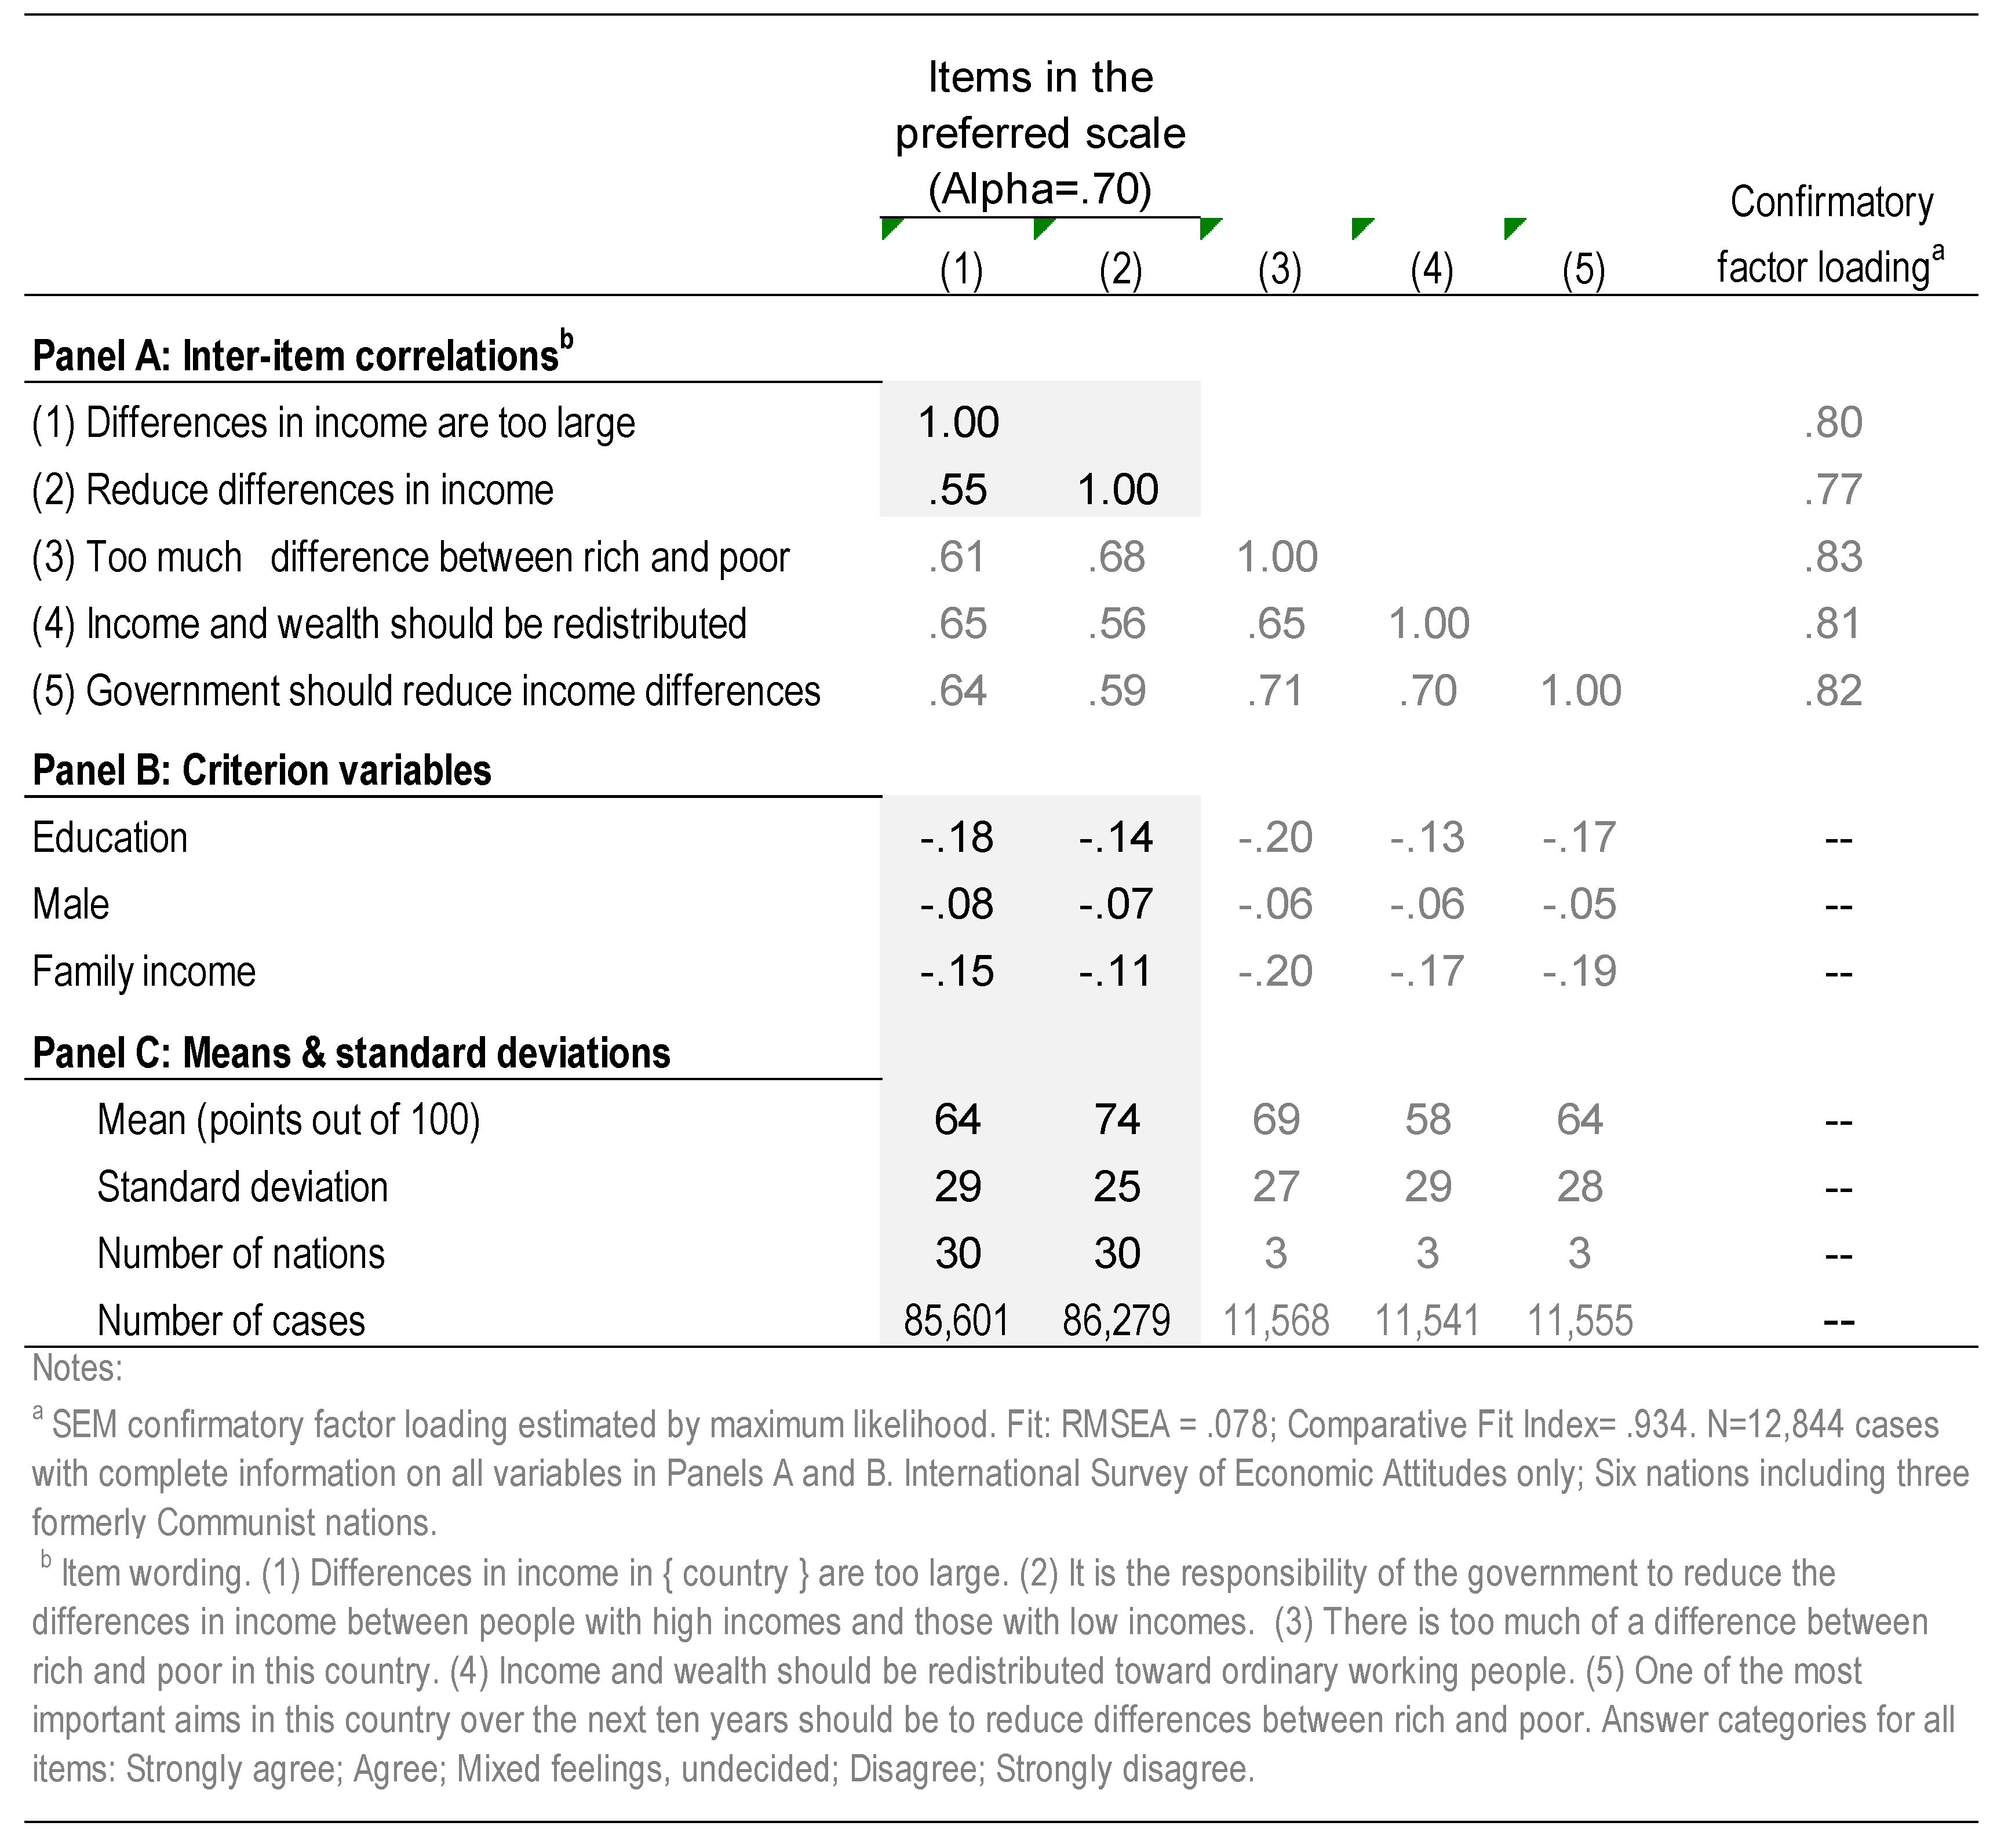
2.1.8. Support for Redistribution: Dependent Variable

Attitudes toward redistribution are measured with a two-item scale designed in the original 1987 ISSP Social Inequality module, regularly replicated since [15], and used successfully in prior research [45,70,106].
The original items:
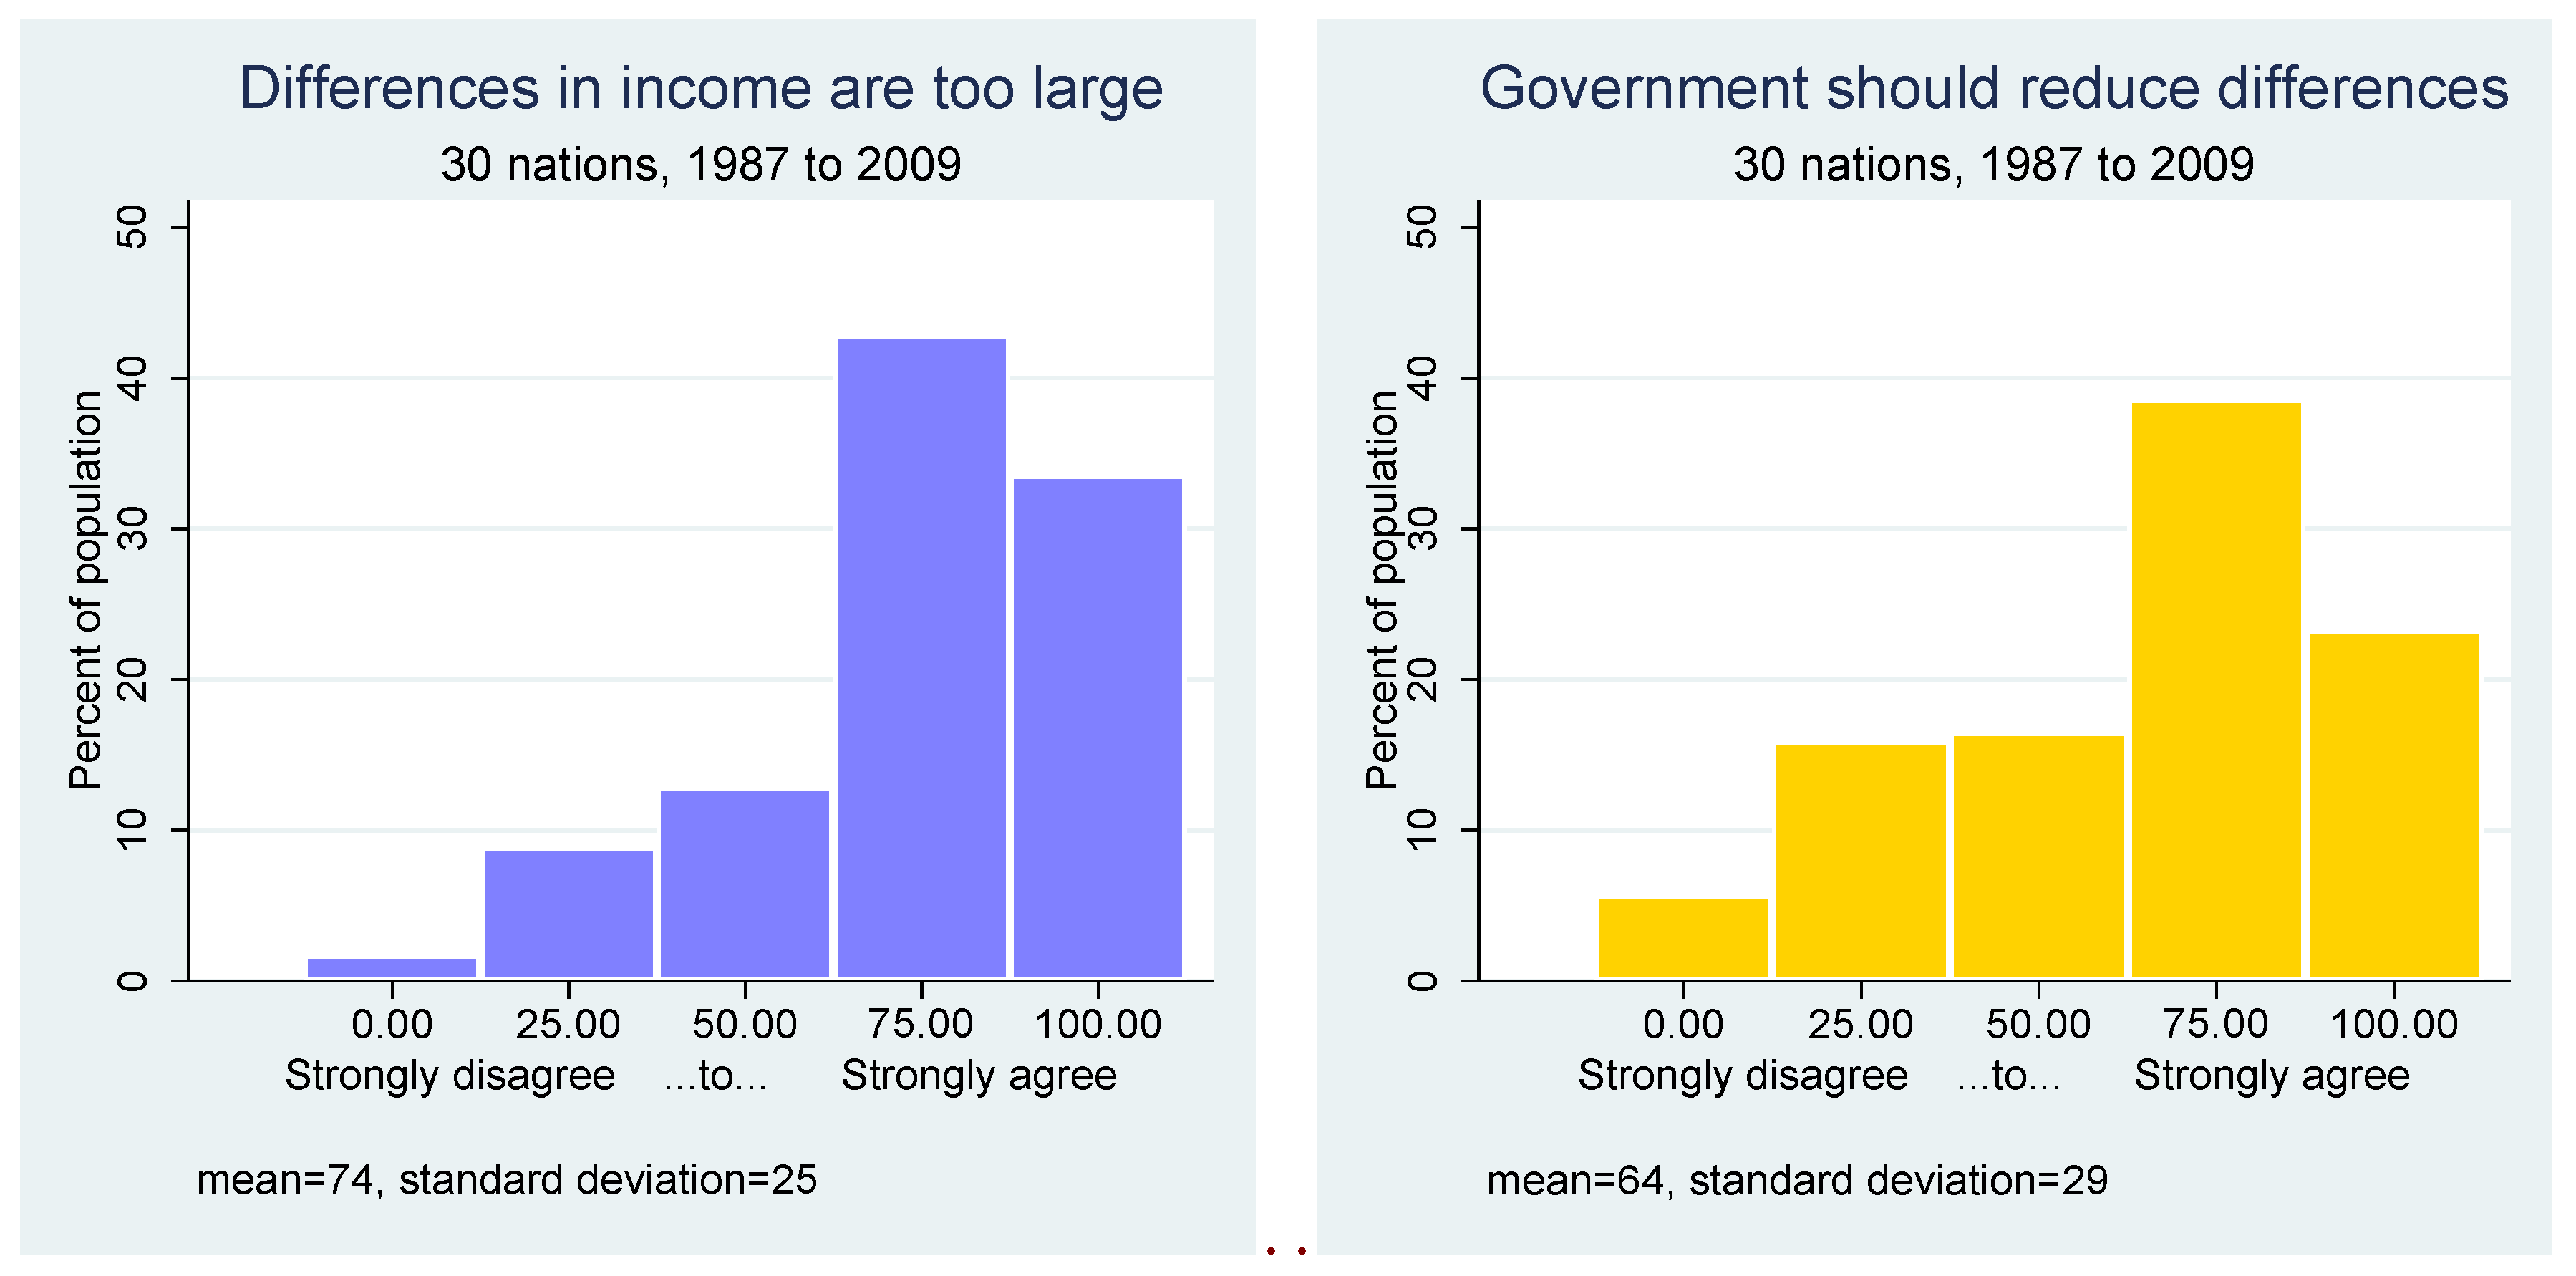
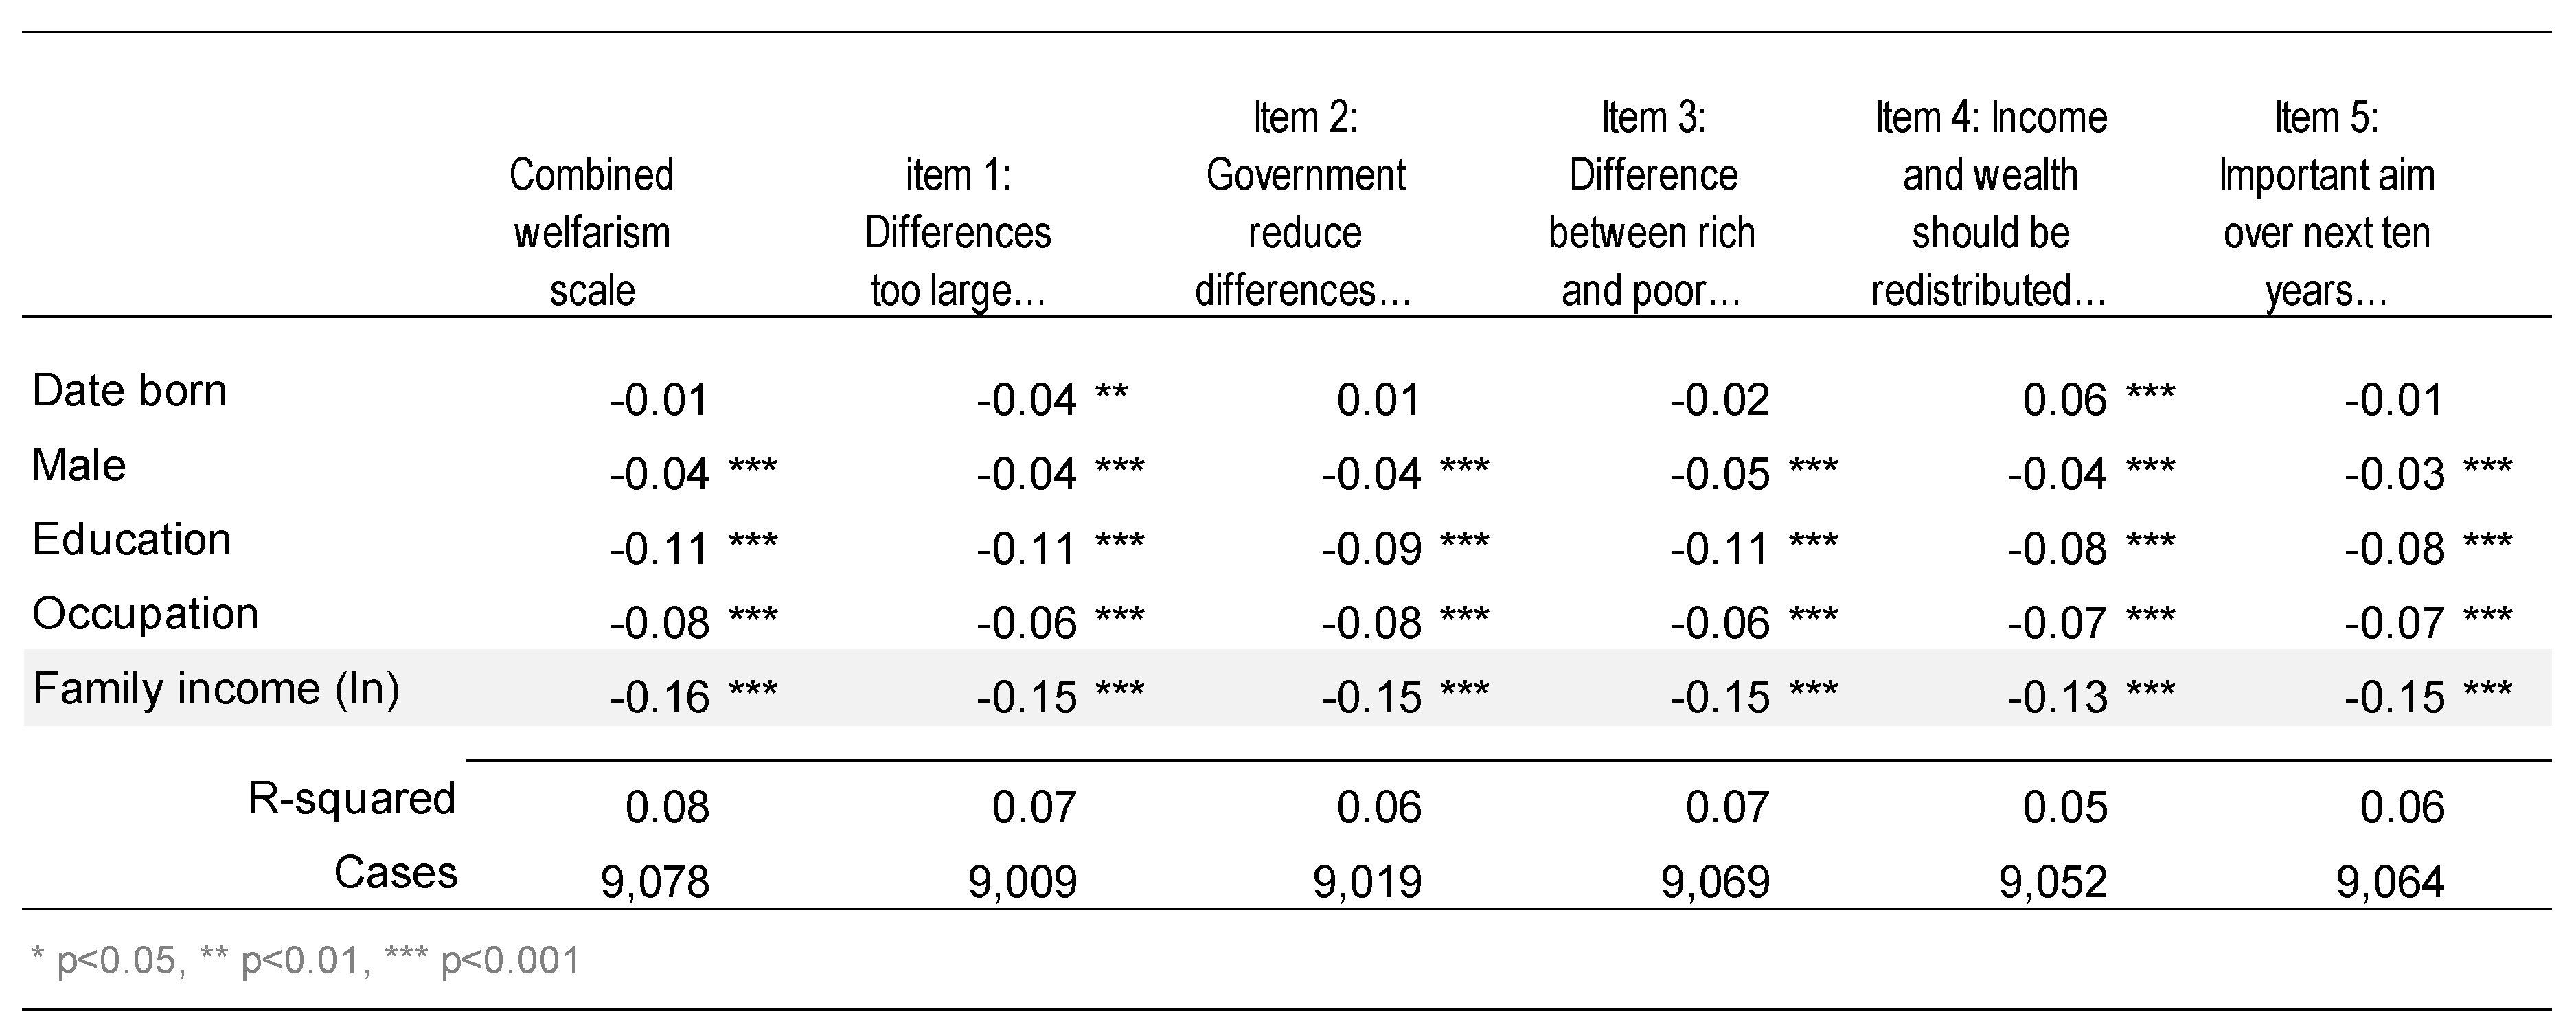
Differences in income in <country> are too large.
It is the responsibility of the government to reduce the differences in income between people with high incomes and those with low incomes.
These are standard questions from international comparative surveys, used in many surveys and dozens of nations since the 1980s. These include the International Social Survey Programme’s Inequality and Role of Government modules, the US General Social Survey, the German Internet Panel [107], the British Social Attitudes Survey, and the European Social Survey, among many others.
Over the years, the scale has been extended a number of times, the most comprehensive version including three additional items as used in, among other places, the International Survey of Economic Attitudes [45,106,108,109,110,111] and the International Social Science Survey Round 20 (USA 2016–2017) and earlier. The items:
There is too much of a difference between rich and poor in this country.
Income and wealth should be redistributed toward ordinary working people.
One of the most important aims in this country over the next ten years should be to reduce differences in income between people with high incomes and those with low incomes.
All the answer sets are in 5-point agree-disagree format. Answer categories were “Strongly agree” (scored 100), “Agree” (scored 75), “Neither agree nor disagree” (50), “Disagree” (25), “Strongly disagree” (0), and “Can’t choose” (scored as missing). Other equal interval scoring choices (for example, 1 to 5 in Likert-style) would be mathematically identical, leading to exactly the same results except for a change of scale.
The motivation for using a multiple-item index is the theoretical view that attitudes are latent or “true” variables of which our measured questionnaire items are imperfect indicators. The idea is that no single measured item fully captures the latent variable, but that by incorporating multiple items into an index we draw on the parts they have in common thereby better representing the true attitude. By analogy, suppose we are in a cave facing a wall, there is an object behind us, throwing shadows onto the wall before us as a torchlight parade passes behind the object. Bringing together a composite picture of the object from the different shadow images enables us better to discern the shape of the original object. In more technical terms, using multiple items enhances the reliability of measurement. That makes for parameter estimates which better approximate the ideal of consistency and unbiasedness. [75,112,113,114]
The general public quite clearly has well defined attitudes towards income redistribution (Figure 3). The two questions in our data form a strong scale, confirmed in 45 nations (columns 1 and 2), as does the larger five-item set which is available in five nations (columns 1 to 5). All five items show strong inter-item correlations (Panel A, columns 1 to 5), very similar correlations with criterion variables (Panel B), and high loadings on a SEM confirmatory factor analysis (last column), as they should according to the classical measurement model [74,75]. Note that the education and income correlations are similar to those found in previous research on the EU-15 and all OECD countries using a different 3-item scale of attitudes towards redistribution which was also used in [115].
Our main analysis is based on the two-item scale (first two items in Figure 3, both widely used in dozens of international surveys). Alpha reliability is 0.70 (N = 62,180 respondents in 30 nations), which meets the standard for internal consistency for a scale. The full five-item scale has an exemplary reliability of 0.89 (N = 11,953 in three nations).
Despite the well documented superiority of multiple-item scales compared to single-item measures [74,75,112,114], some readers will find a face validity issue here. Despite their close kinship of topic and common focus on the problem of income inequality, the second item mentions a specific remedy, but the first does not. Accordingly, we also present results for the two items separately. Appendix C provides these for the two items in the main multi-level model (Figure A5); the two items in the cross-level interaction (Figure A6); and for all five items at the individual level (Figure A7). All produce results virtually identical to our preferred estimates using the two-item scale.
Thus, redistributive attitudes are well and reliably measured using these long-established and widely used items.

2.2. Data: World Inequality Study, ISSP “Social Inequality”, ISEA, ANSSS, “Social Inequality in The Netherlands”

We analyze Version 2.1 of the World Inequality Study [116]. It includes data on a broad range of rich democratic welfare states and a smaller representation of middle to lower-income countries. Thirty societies and over 89 thousand individuals have all requisite variables for this analysis, and most of the dependent variables, with some variation by country.
Most of the surveys originate in the ISSP “Social Inequality, Rounds I, II, III, and IV” surveys, conducted in 1987–1988, 1992–1993, 1999–2000, and 2009–2010 by a consortium of mostly academic survey organizations (Design [15]: Archive [16]. Other surveys include the International Survey of Economic Attitudes conducted in the mid-1990s [117]; Dutch “Social Inequality in The Netherlands” surveys [118]; and the Australian National Social Science Surveys from 1984–2002.
All the surveys are large, representative national samples. Many began with interviews of a stratified random sample followed by a leave-behind self-completion questionnaire. Several surveys were conducted entirely by mail and many entirely by interview. Australia’s surveys were a simple random sample, but the other surveys involved various forms of clustering; we make no correction in the estimates in this paper for the consequent loss in efficiency. Completion rates (defined as completions divided by the sum of completions plus refusals) averaged around 60% (counting losses at the interview and the drop-off stages; most reports approximate RR6 [119]. Further details on the samples are available elsewhere [16].
Comparisons with national census data, where available, suggest the surveys are approximately representative of the populations sampled [120,121]. Most of the samples are very similar to their census in age, education, occupation, and industry, but several samples slightly underrepresent young adults, less educated persons, and persons low on the occupational ladder. Women are over-represented in several surveys. Because age, education, occupation, and gender are included in our models, the deviations from representativeness in those respects are unlikely to bias our findings [122].
Most of the surveys were conducted only in the dominant language of the country. We will, for convenience, speak of “Americans” etc., on the understanding that the precise meaning is “Americans who speak English well enough to participate in a mixed-mode interview and self-completion survey”. In a few nations, only citizens were included, a restriction that is unlikely to be important for the issues at hand [123].
Our sample of countries is necessarily an opportunistic one depending on which countries took part in these projects, rather than a randomly drawn sample of countries. Selectivity analysis using established methods [124] shows that prosperous nations are over-represented. Since we include GDP per capita as a control variable, our results should not be biased by this over-representation.
We use all countries with available data except for the formerly Communist ones. There is a massive institutional difference in the trajectories of these societies in their transitions away from Communist command economies (to a wide variety of destinations), so the consensus in the field is that they should be considered outside of the scope of our institutional theory for the present [85].

2.3. Methods

We describe the degree of alignment of welfarism with our response/outcomes variables through correlations and scatterplots of dependent variable means by country with our welfarism scores. We show significance tests on these aggregate data, but it should be remembered that aggregate relationships in social science data tend to be inflated as a result of the omission of confounding variables. We present results with welfarism measured both by our preferred combined scale and, alternatively, by the separate social spending scale, by the separate corporatism scale, and by Esping-Andersen’s typology [40]. These national-level results are estimated by OLS from simple bivariate equations of the form:
DependentVariable = WelfarismScale + e
where the welfarism scale can be any one of our four alternatives.
Analytically, we investigate the net relationships controlling for variables at the individual level using multilevel variance-components regression models with random intercepts and fixed effects estimated by GLS (since our individual level data are nested within countries). These are estimated from equations of the form:
DependentVariable = WelfarismScale + GDP + Age + Male + Education + FamilyIncome + e1 + e2
where the welfarism scale can be any one of our four alternatives, the second-level case is nation (GDP per capita and Welfarism are measured at this level), the individual-level variables are those shown, and there are separate error terms for the individual level and for the national level.
In preliminary analyses, we also controlled occupational status in Equation (2). In most of our models, it either has no effect or has the expected effect (same direction as education and family income, but usually lower in magnitude; results not shown). Including it or excluding it made no noticeable difference to the effects of other variables in the analysis. Unfortunately, occupational information is only available in most of the surveys for people currently in the labor force, so including it appreciably reduces the number of cases available for analysis. For that reason, we have usually omitted it from the final analyses except where preliminary analysis indicated we must include it.
In some analyses, we cater to the possibility that welfarism works differently for some people (for example, people on low incomes) than for others (for example, their peers on middle or high incomes). This we do by adding a multiplicative interaction term to Equation (2). In our example this is a new variable, welfarism times income (say: Welf_X_Inc = WelfarismScaleFamilyIncome). This allows (but does not require) welfarism’s effect to differ by income. A significance test for the possibility that welfarism works differently for the poor than it does for the rich is given simply by the usual statistical test on the new interaction variable.
All our predictor variables are logically and substantively prior to our outcome/response/dependent variables, so it makes sense to interpret them causally. Nonetheless, readers who would prefer to bracket causal issues are welcome to ignore the causal interpretations and to treat the results purely as estimates of the strength and magnitude of the relationship.

3. Results

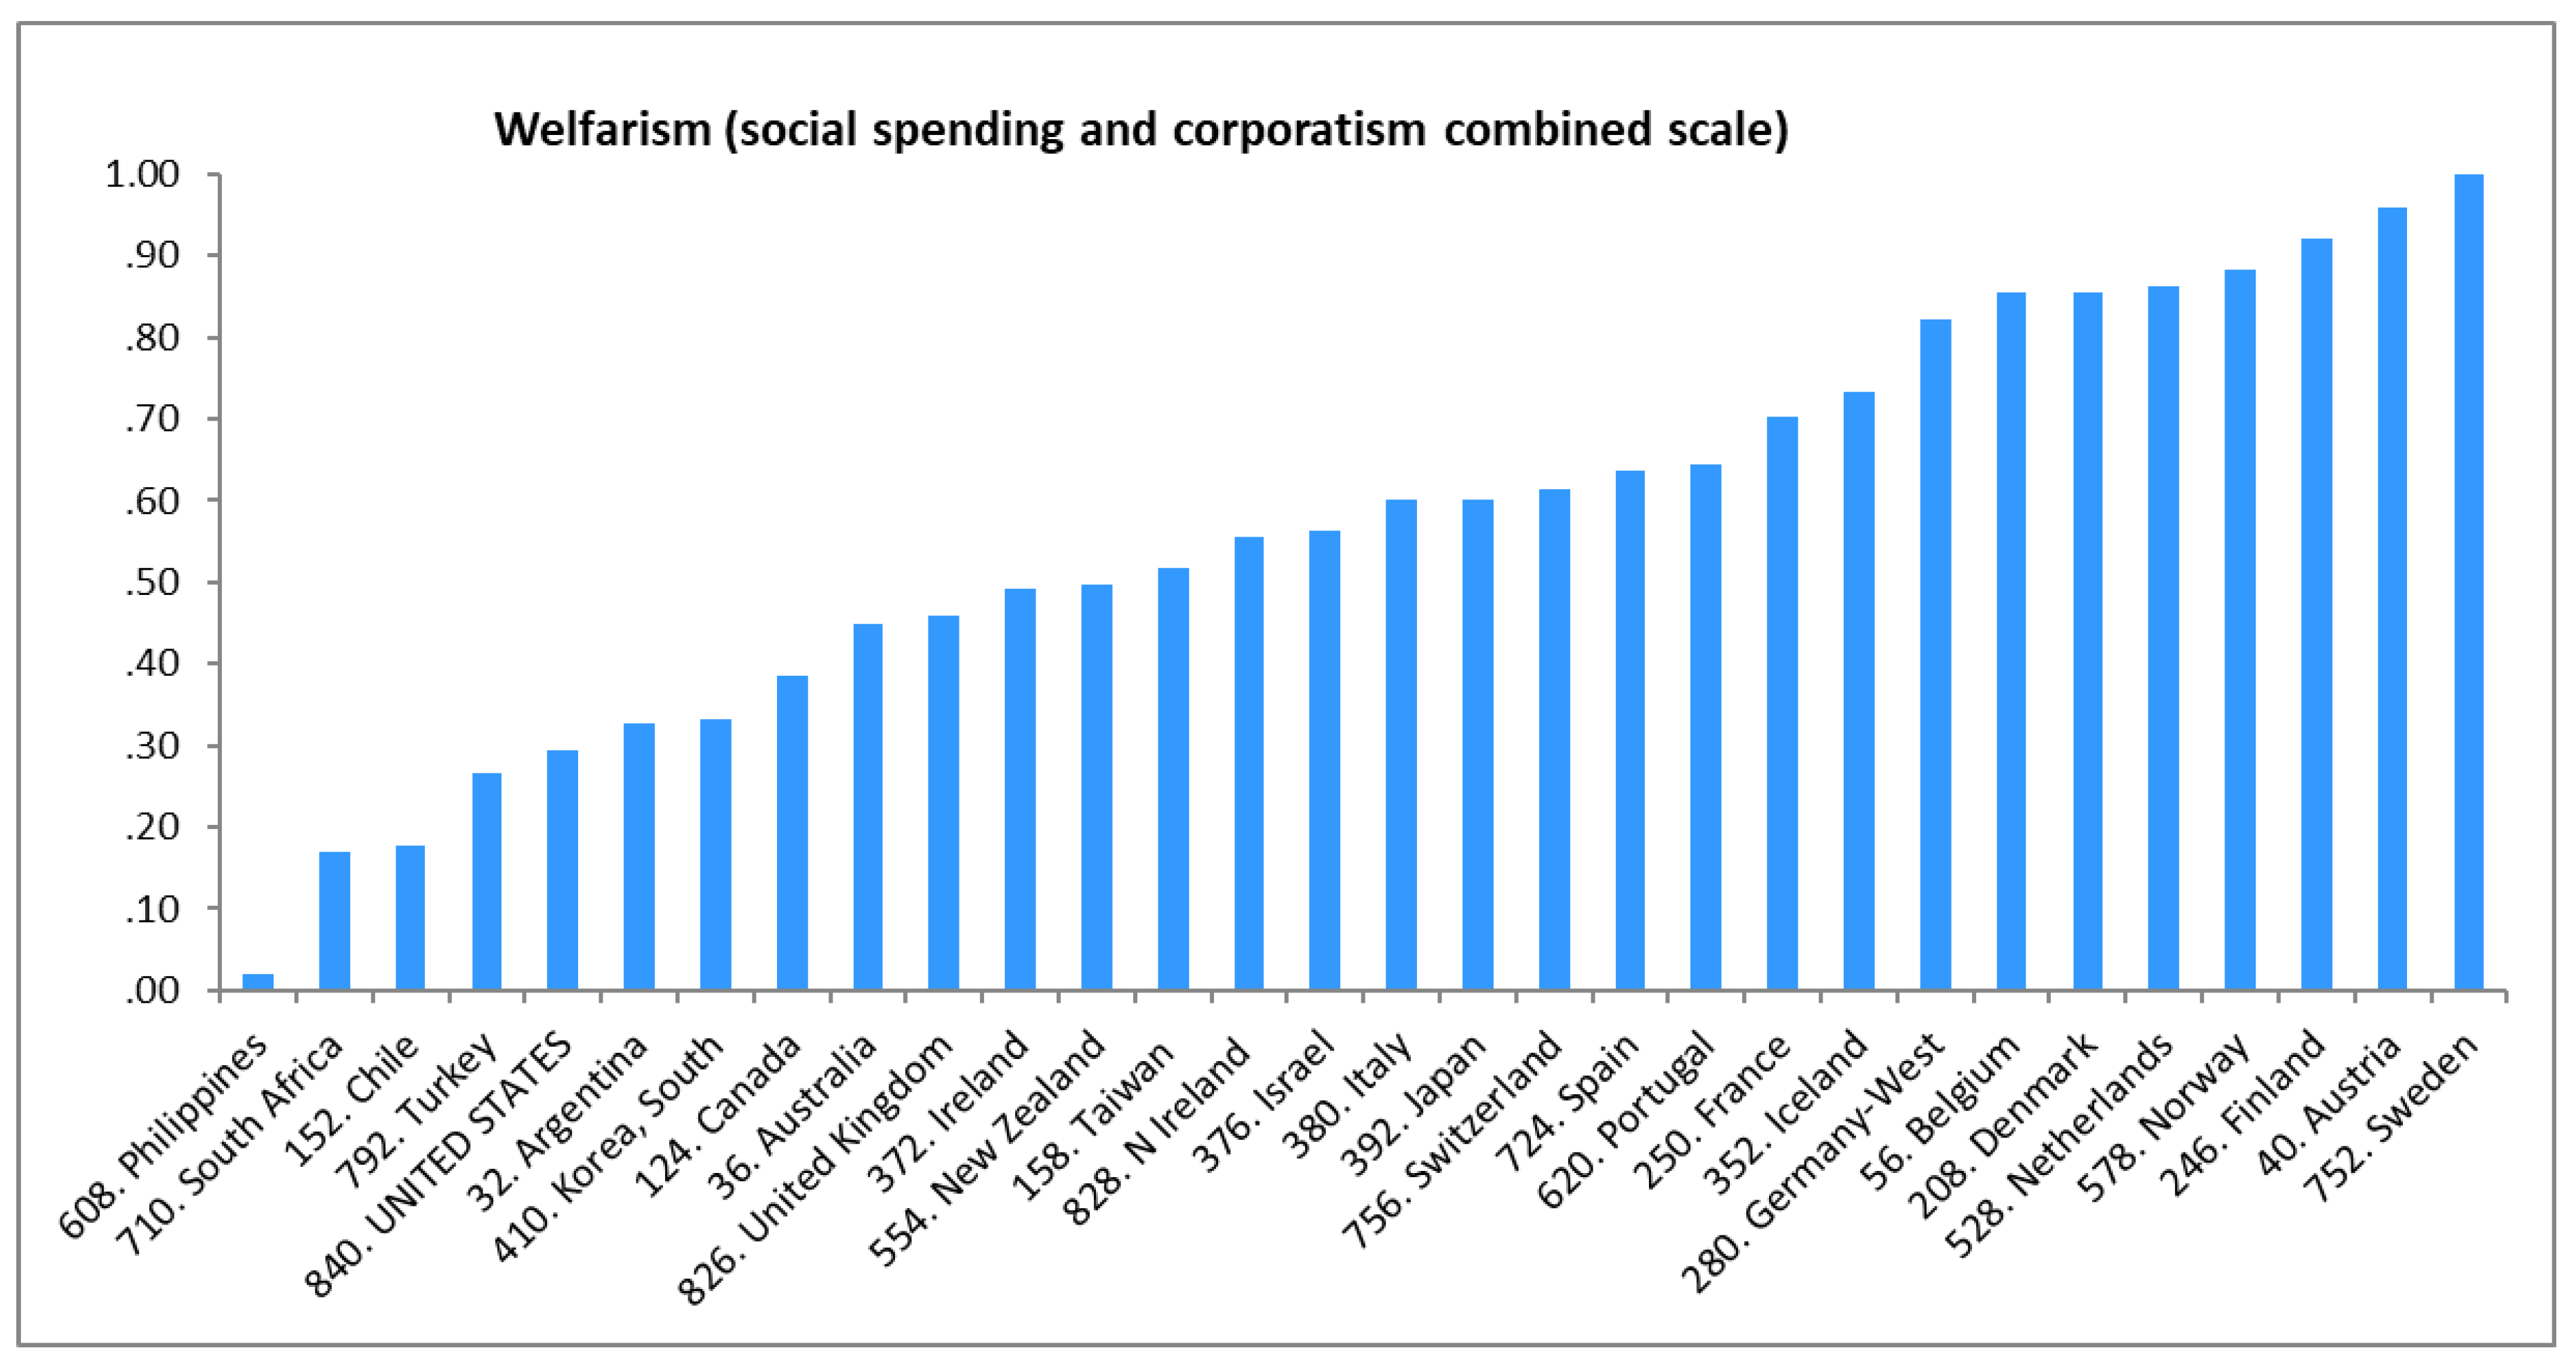
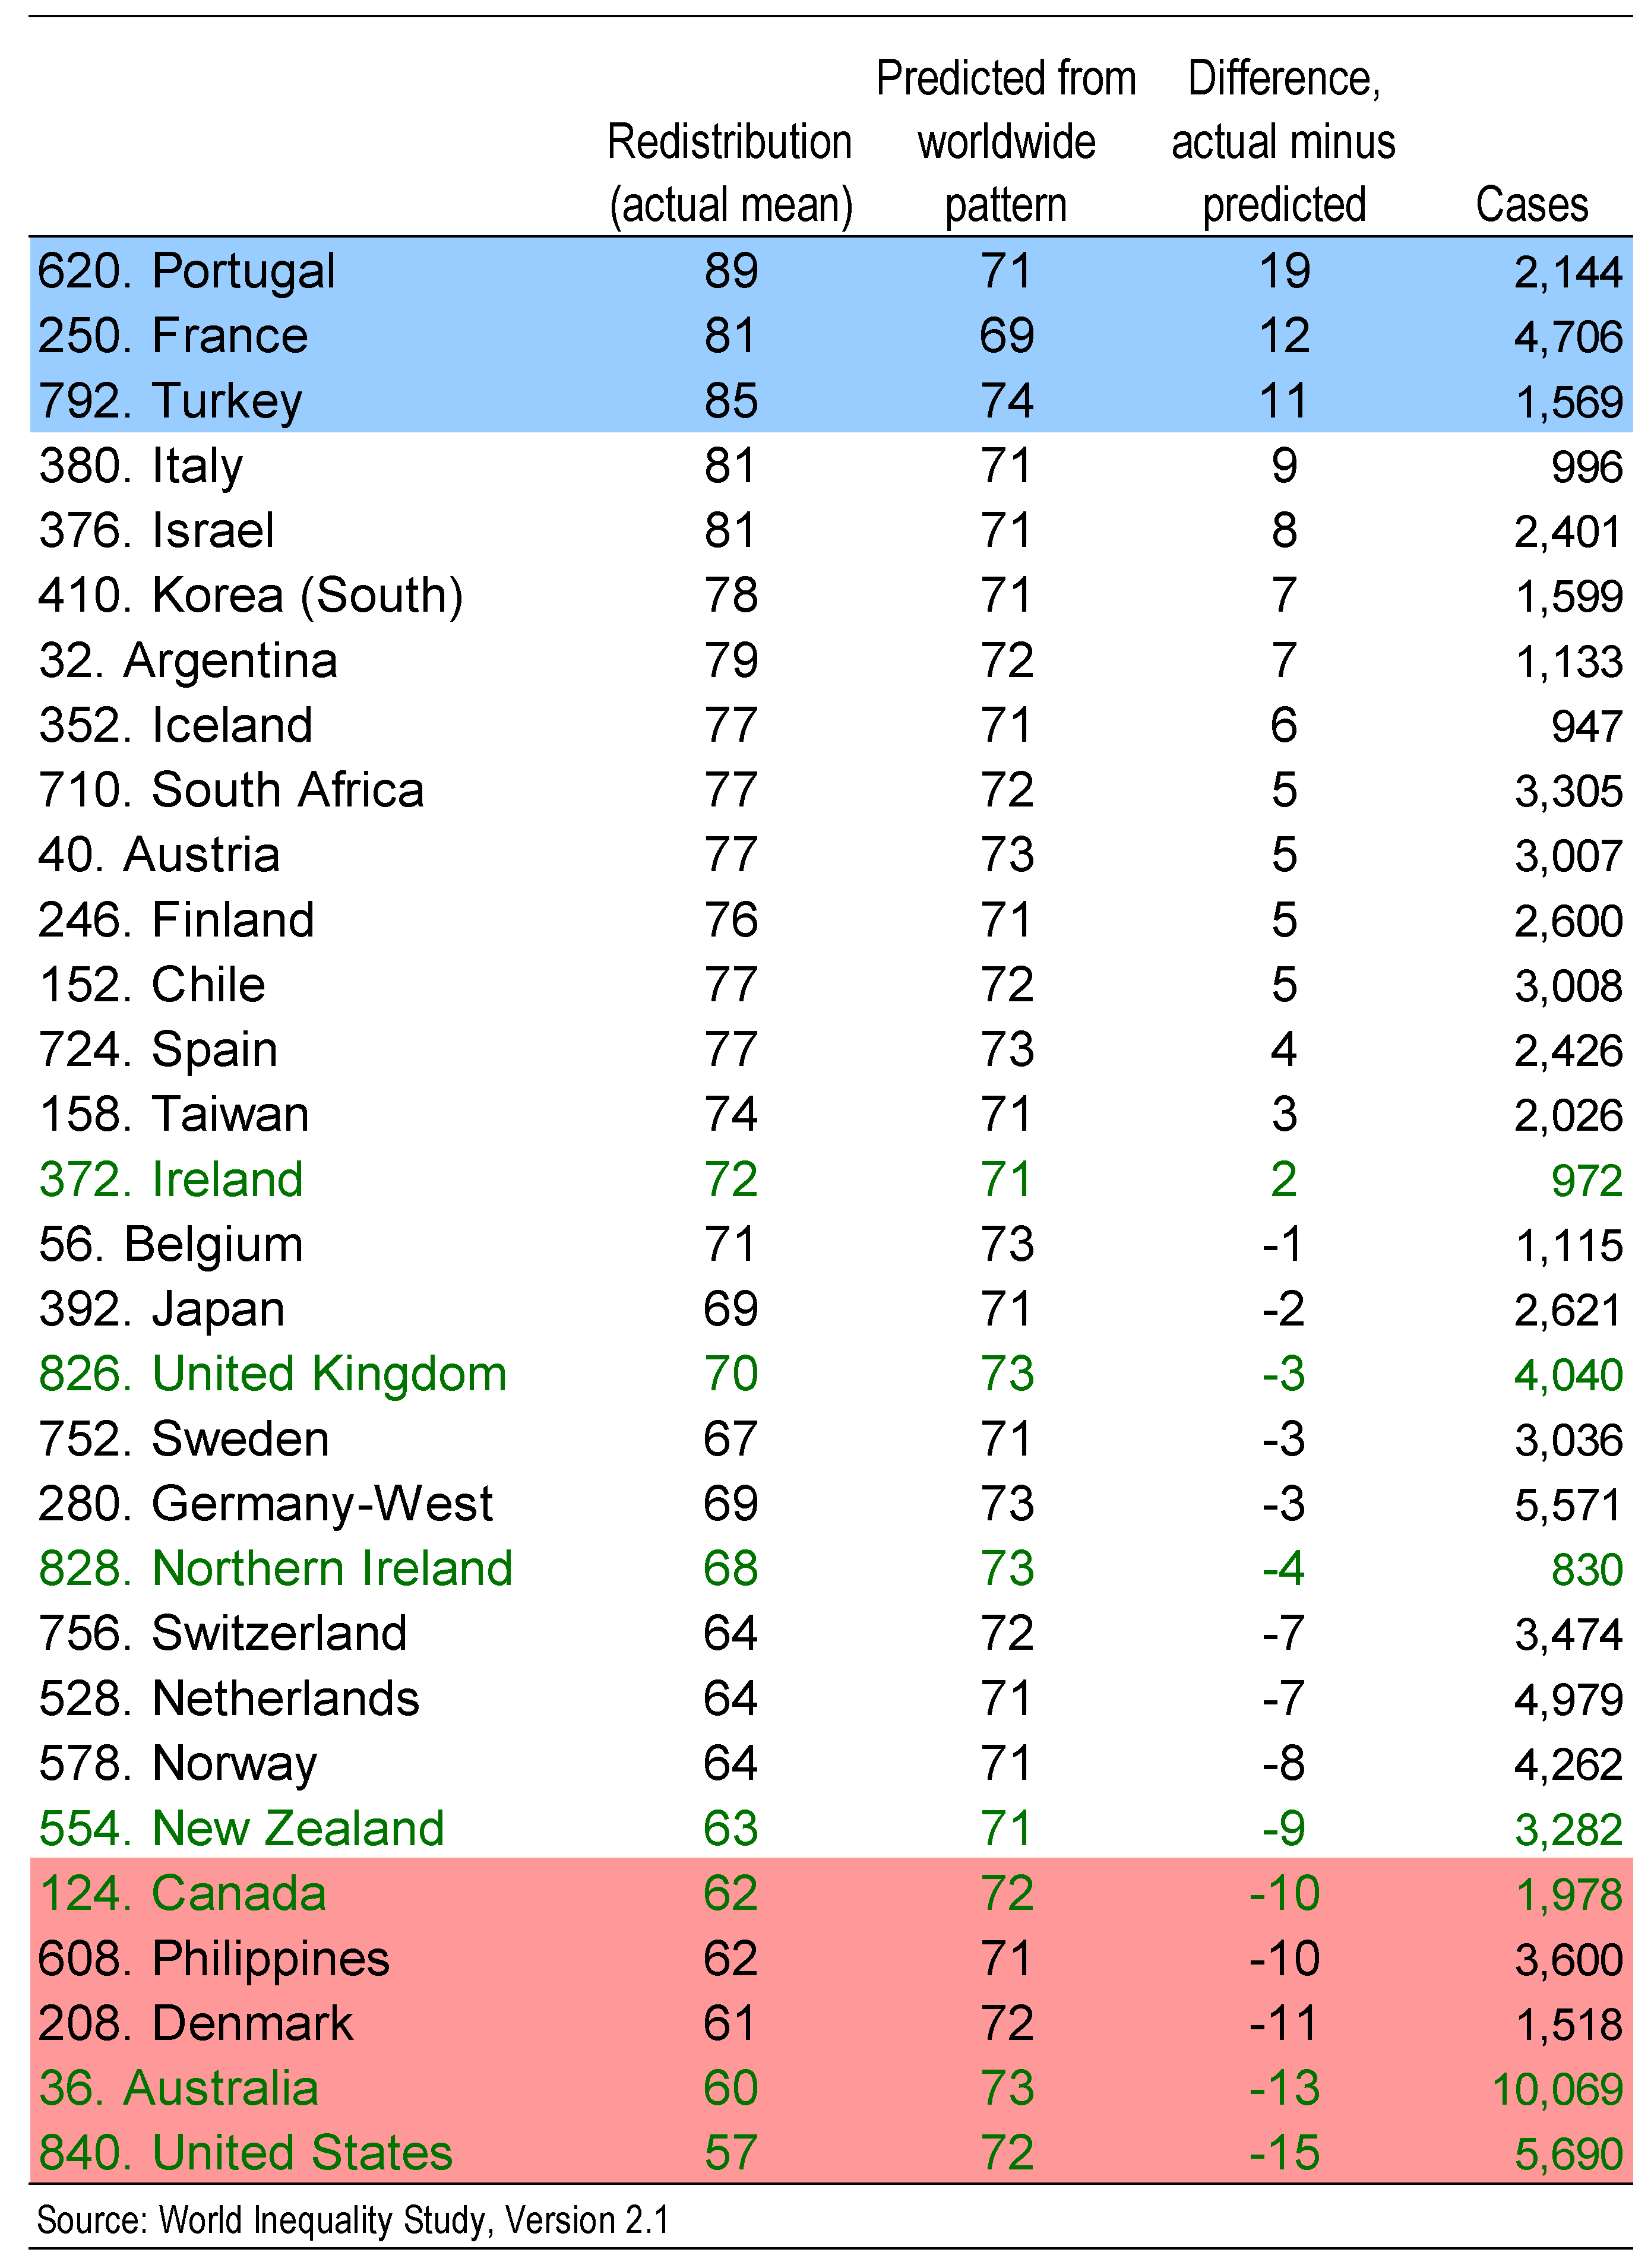
3.1. Welfare State Strength: Description: Levels of Welfarism

The strength of the welfare state varies greatly around the world, as is well known. Where prior research is available, the welfarism scale results align with it. Welfarism ranges from −0.02 for the Philippines through 0 for the US to 1.0 for Sweden (Figure 4; country-by-country details in Figure 1 above). Sweden and the other Scandinavian nations and Germanic language-group countries have the strongest welfare states. France and Spain are not far behind. The United States and other English-speaking nations are among the least welfarist, consistent with prior research on the OECD countries [85,87,125,126].
Poor countries tend to be less welfarist, particularly on the social spending aspect of welfarism as opposed to corporatism and labor market regulation (Figure 2 above, Panel B).

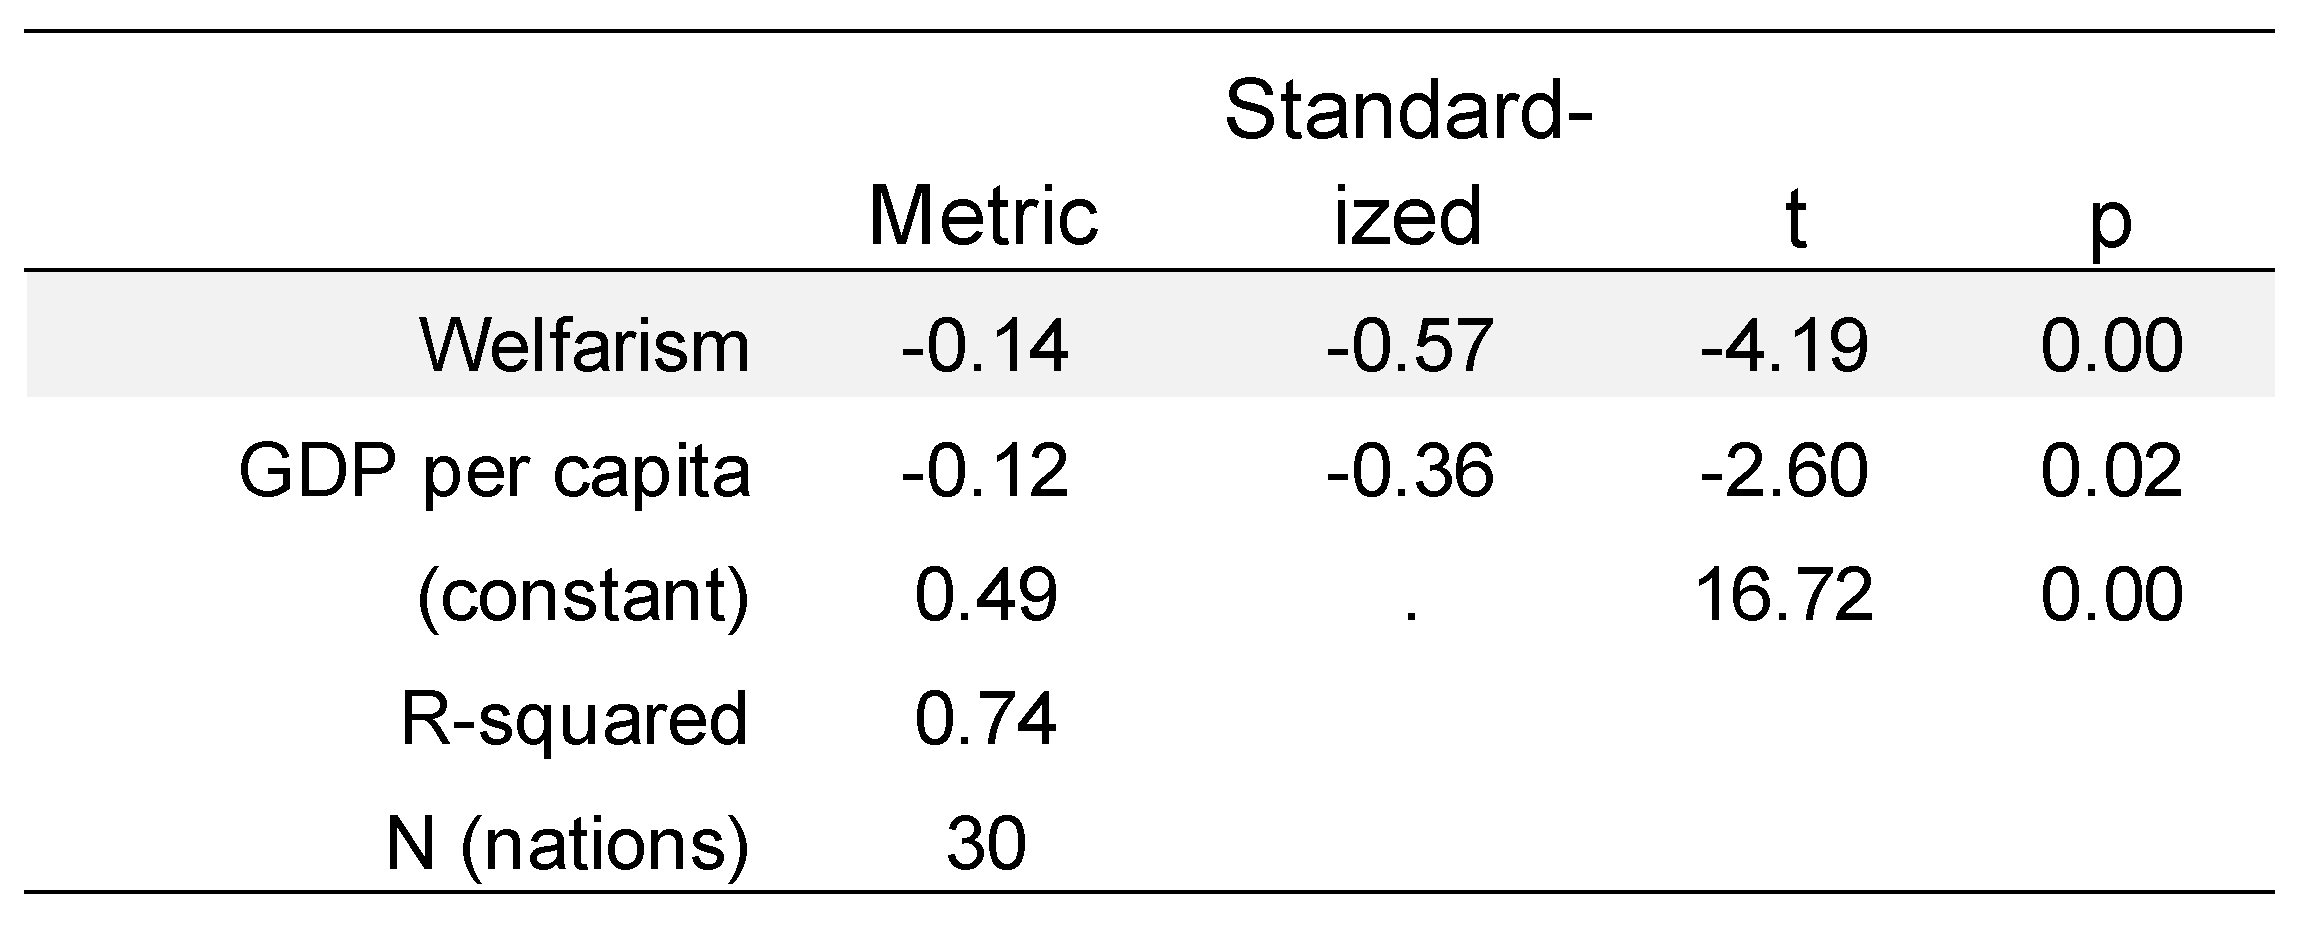
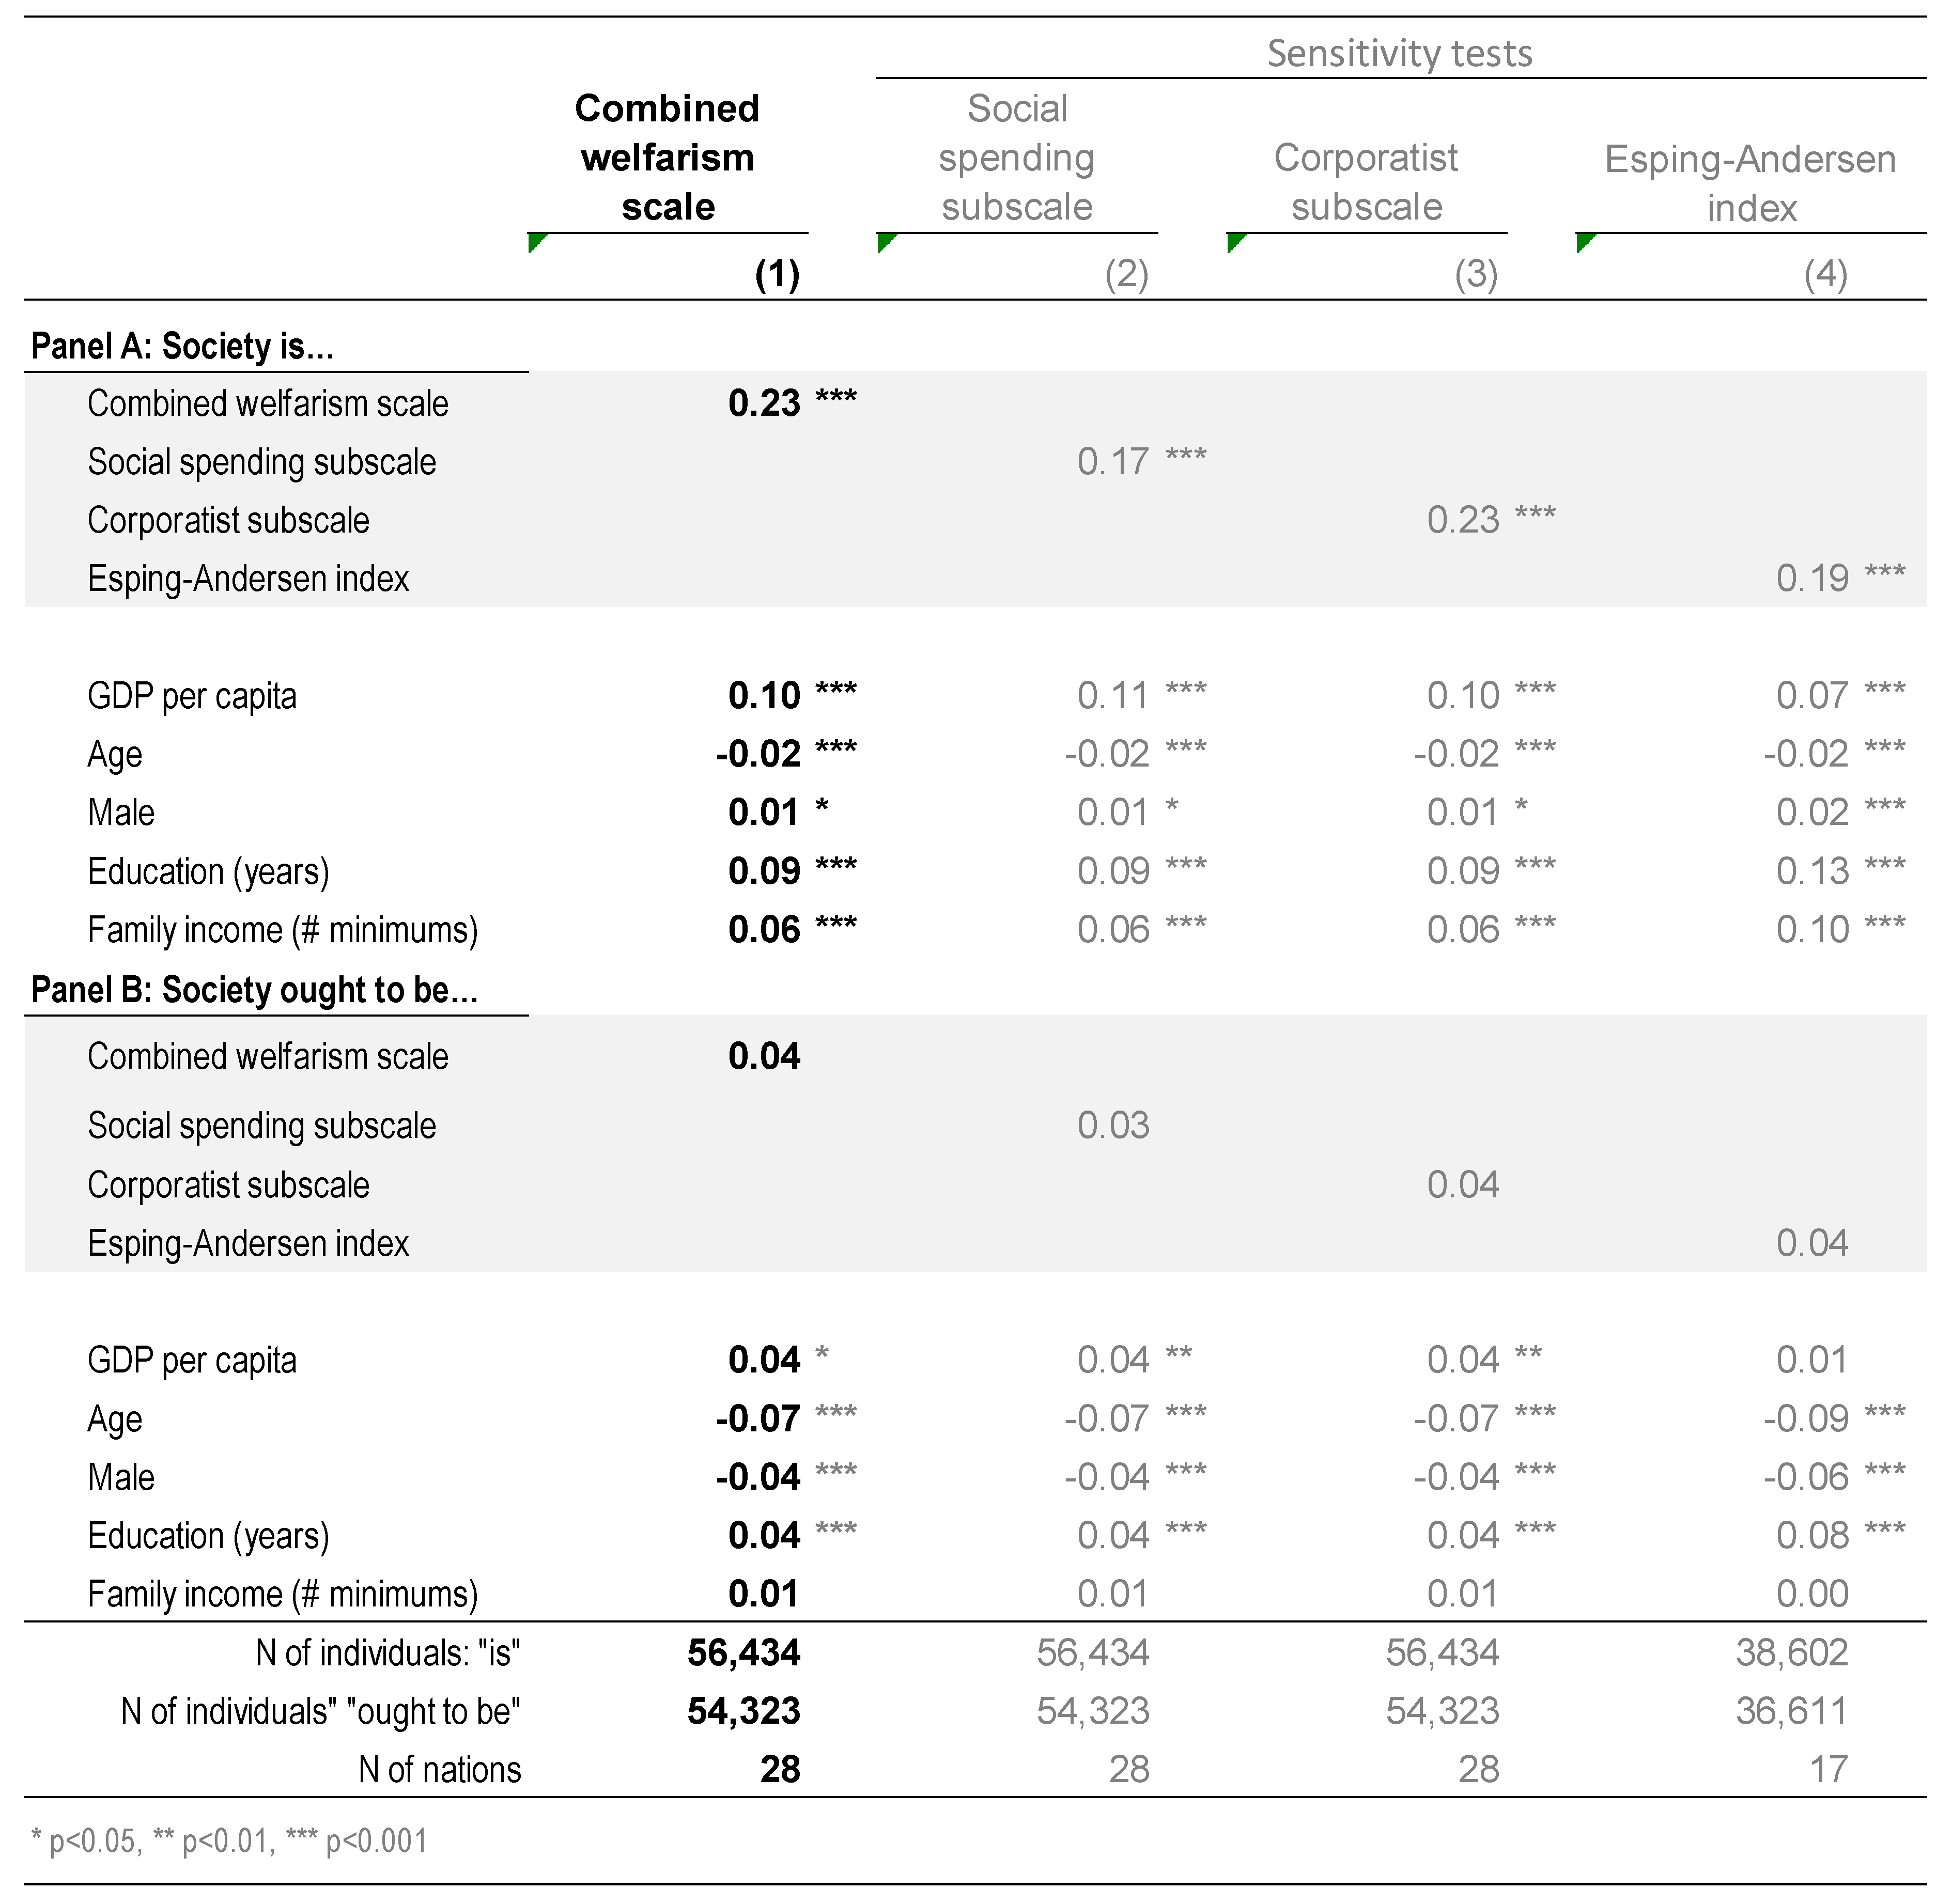
3.2. Inequality and Welfare State Strength (Welfarism)

To put our focal analysis of the relationship between welfarism and attitudes towards redistribution in context, we turn first to issues of how much inequality people perceive and how much they want: Redistribution (our focus) should be a mechanism for bringing the reality closer to the ideal. The perception is important, because in interpreting the degree of support for redistribution that people express, it is useful to know how veridical is the baseline from which they may desire redistribution. Similarly, comparing their inequality targets or desired outcomes and the baseline should help explain how strongly people endorse redistribution.
First, let us take a “reality check” considering the linkage between welfarism and actual income inequality as measured by the Gini index. Figure 5 reveals a substantial, statistically significant effect of welfarism on income inequality, even net of the well-known impact of GDP per capita, and even in this broad array of countries (Figure 5). Indeed, the standardized regression coefficients suggest that the net relationship of welfarism and Gini is tight and, of course, negative (−0.57). That is about 1.6 times as strong as the well-known net relationship of GDP per capita with the Gini [127,128,129].
This substantiates the claims in the Measurement section that welfarism is an effective measure of the strength of social-welfare and corporatist institutions.

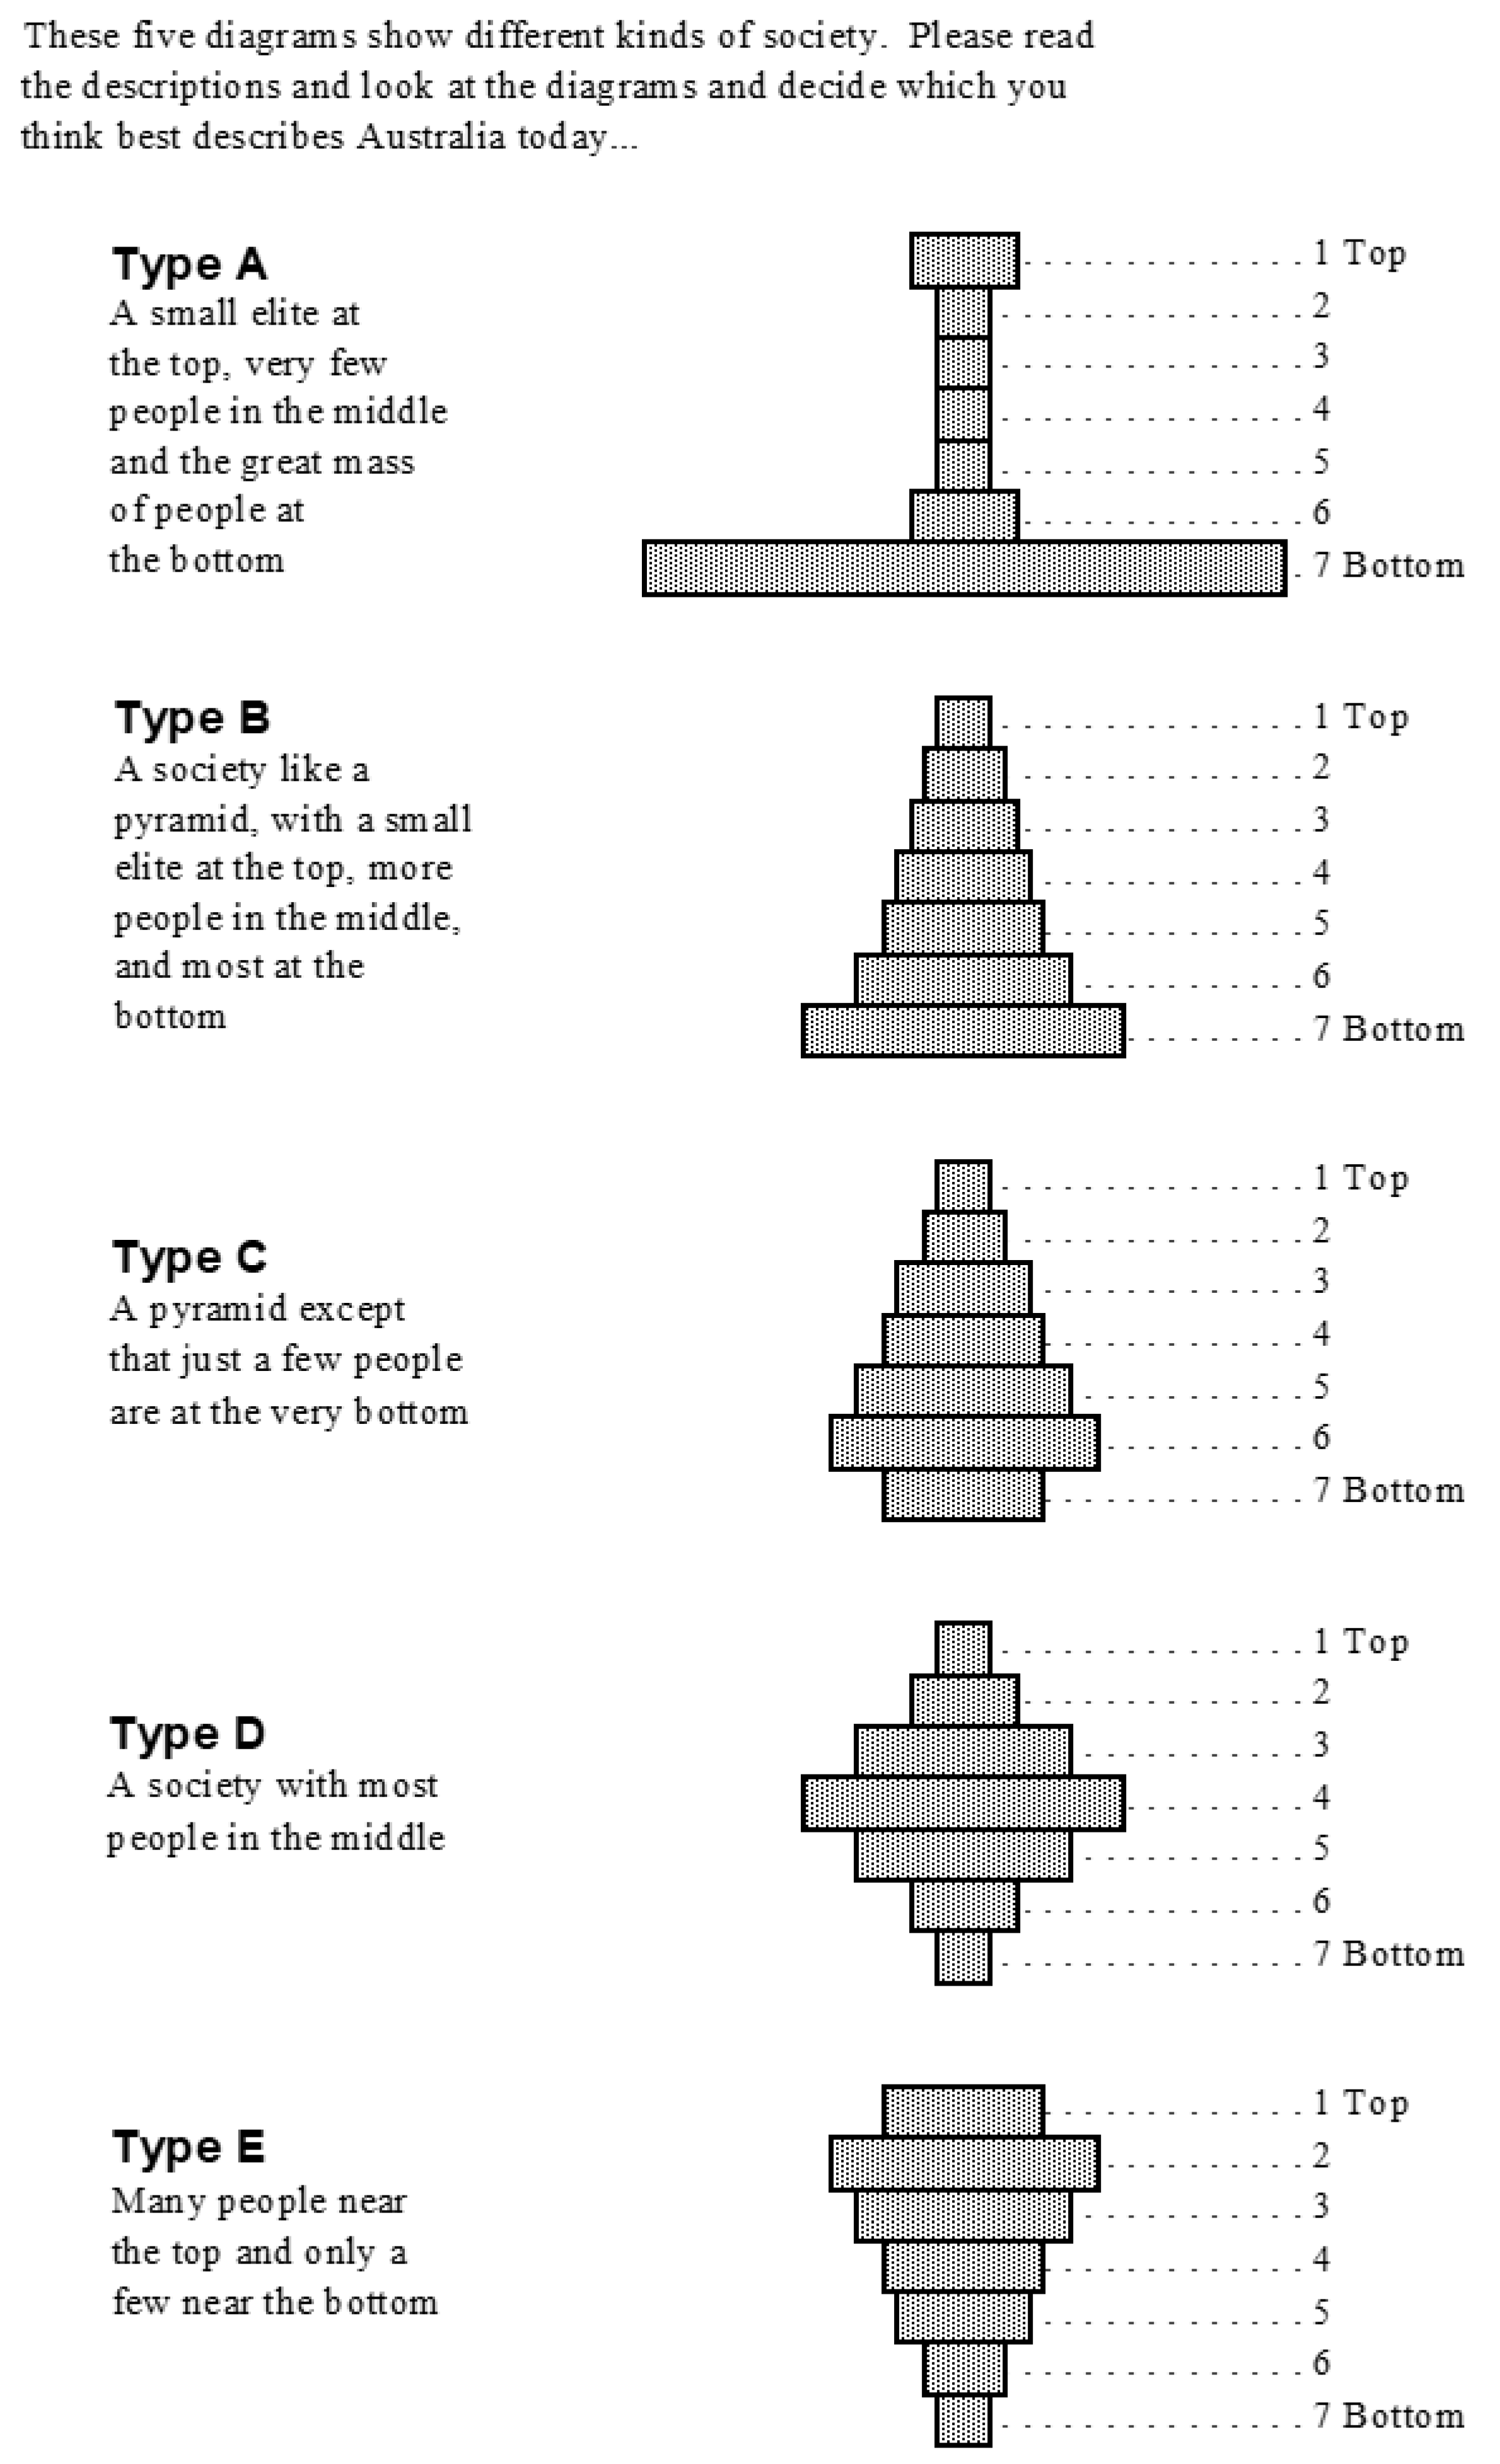
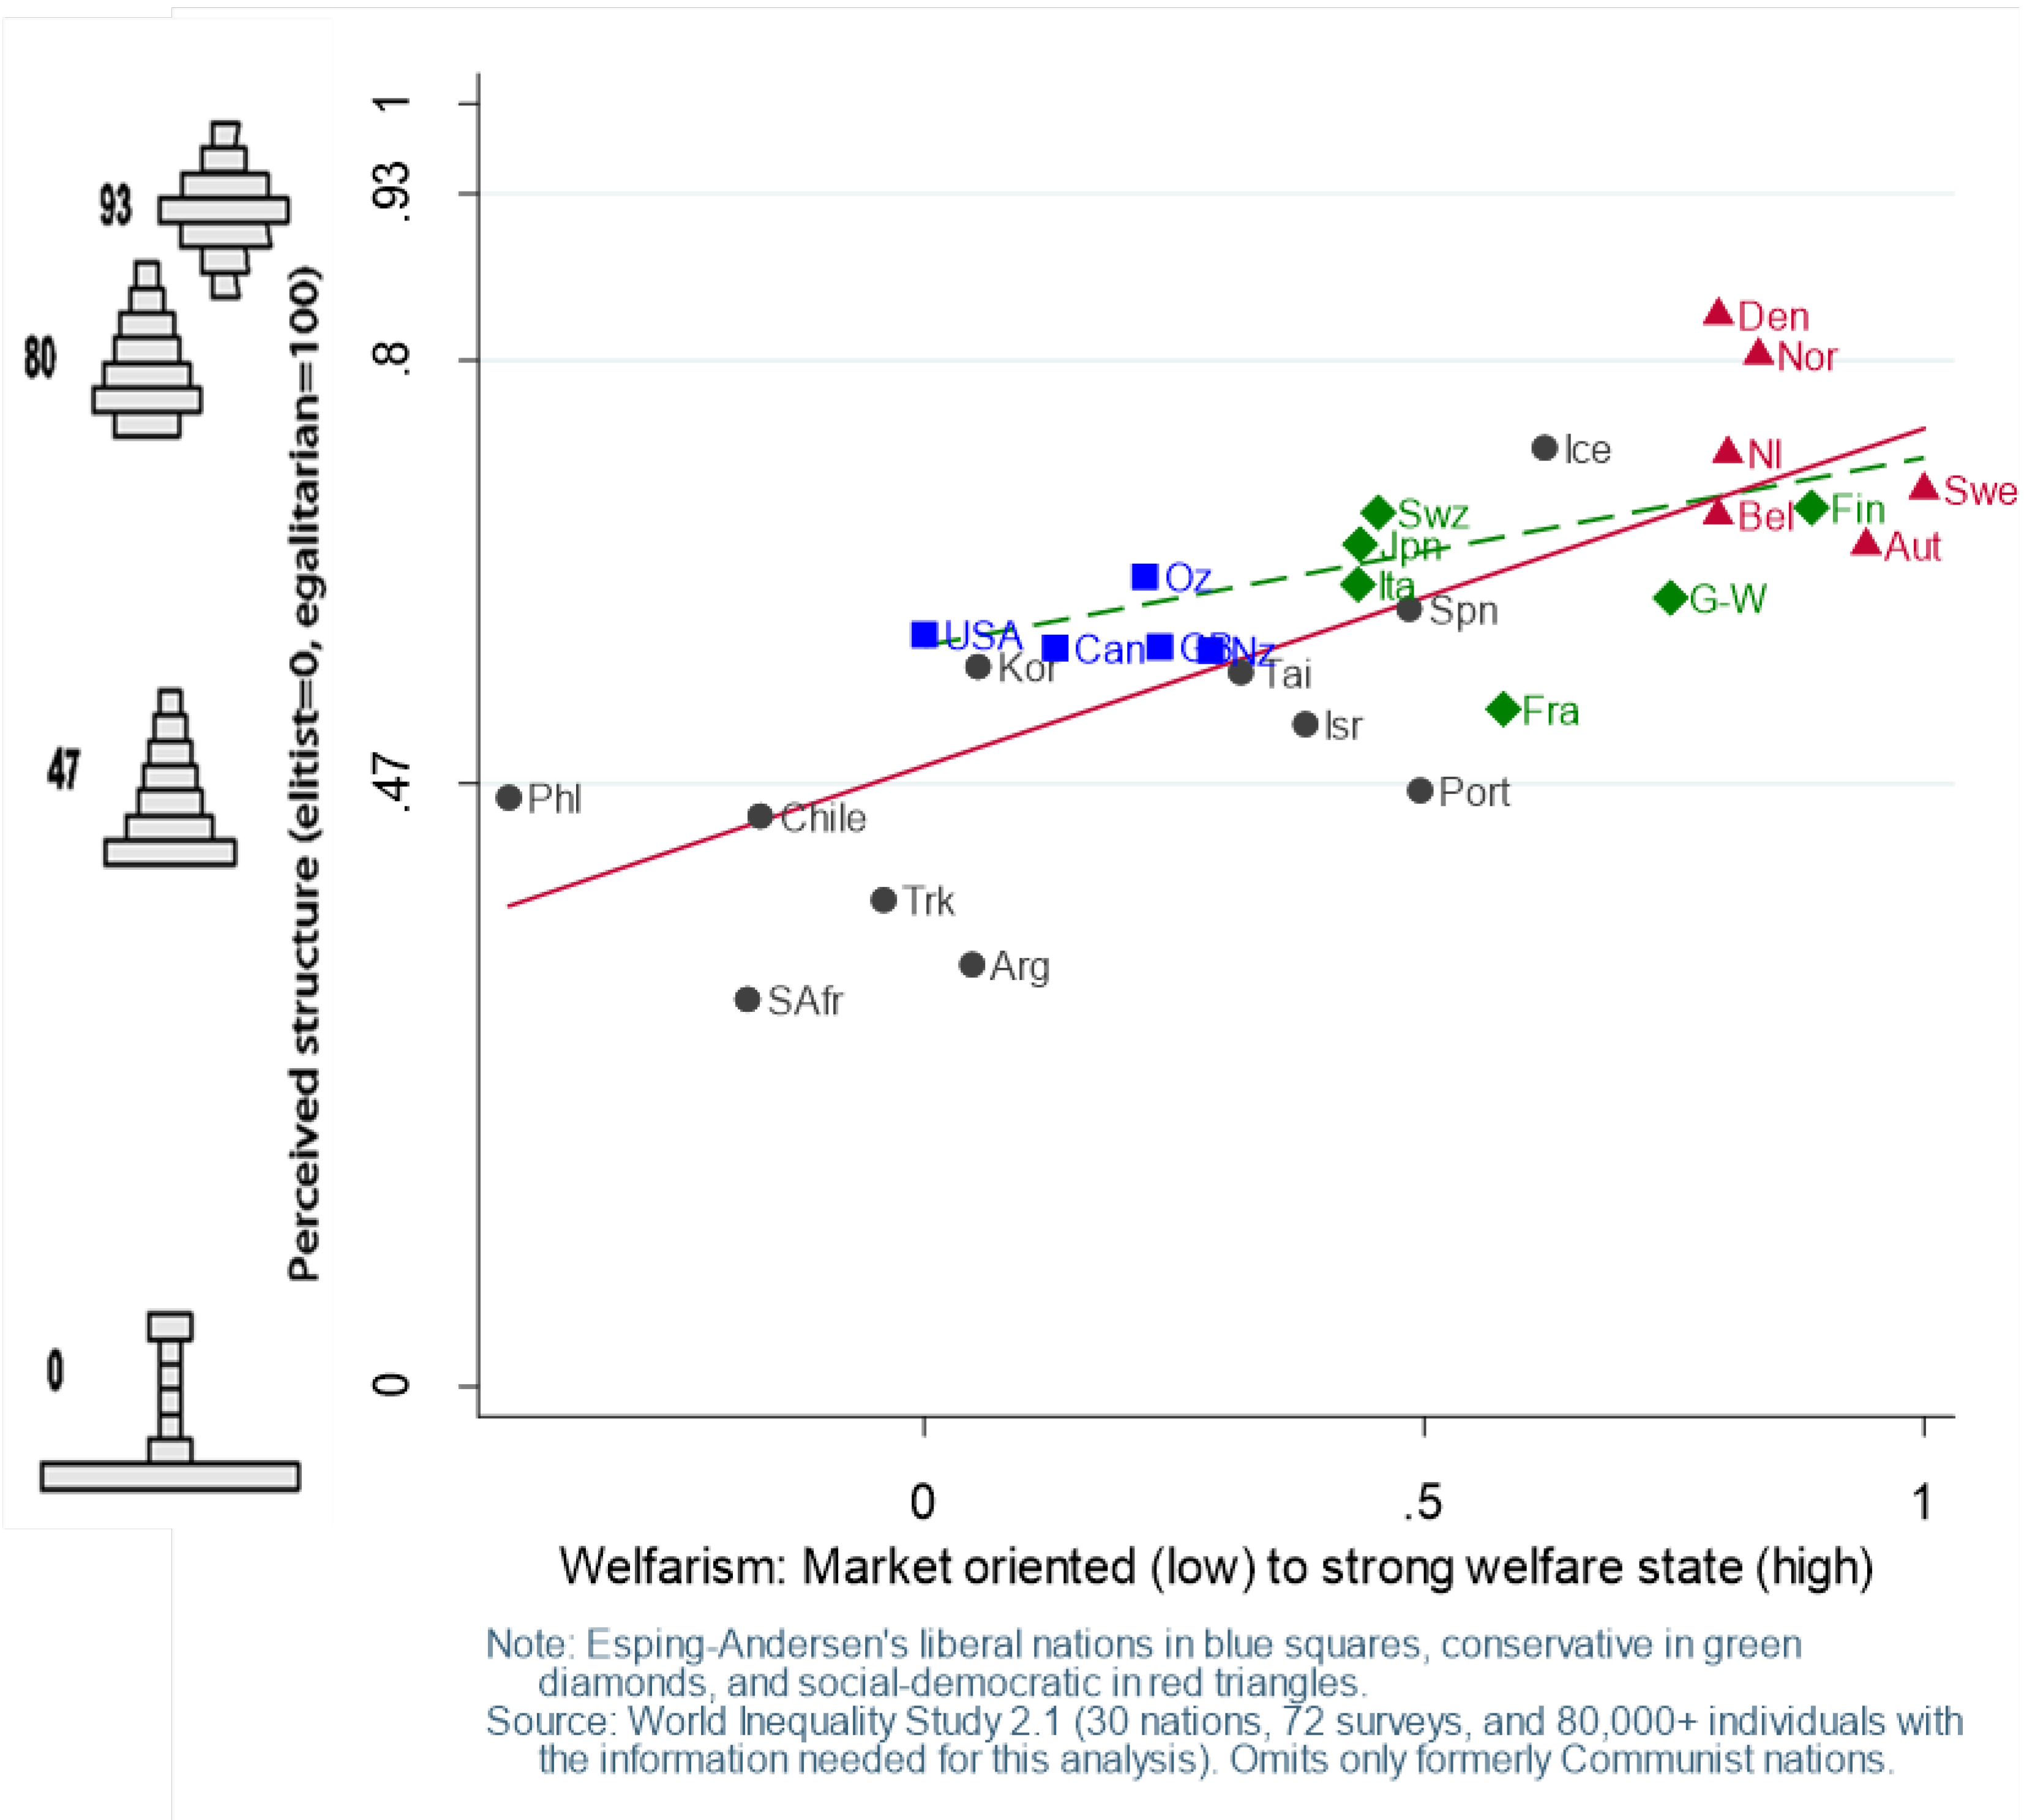
Inequality: Perceptions

To assess perceptions of inequality in society, we use a long established diagrammatic question which is scored according to the degree of inequality in each image [44,45]. The scores are anchored at the ends (Type A and Type E) with others in between in proportion to their coefficient of variation. Respondents are shown a set of diagrams representing inequality with all possibilities presented simultaneously (Figure 6). They are first asked which diagram best represents their society (perception) and then which diagram shows what society ought to be like (moral standard/goal).
These images reflect two fundamental features of society: how prosperous they are and how equal or unequal their income distribution is. Aggregated to the national level, these perceptions are highly (negatively) correlated with income inequality as measured by the nation’s Gini coefficient (r = −0.83, N = 28 nations). They are also highly correlated with socioeconomic development as measured by GDP per capita at parity purchasing power (r = −0.82, N = 28 nations). All this is also true of post-Communist nations, as well as long-established market economies [45]. Prior research on four countries also finds a close alignment of inequality perceptions (differently measured) and actual income inequality [50]. Of course, income inequality and GDP per capita are themselves highly (negatively) correlated (r = −0.75, N = 30 nations): Income inequality is typical of poor nations, equality common in prosperous ones. This probably reflects the educational and occupational upgrading that accompanies (and perhaps causes) economic development [128,130].
At the aggregate level, welfarism strongly aligns with perceived type of society (Figure 7). Residents of the least welfarist nations (e.g., Philippines, South Africa, Chile) on average see their nations with perceived structure scores around 47, near Type B. Nations highest on welfarism (e.g., Scandinavia, Austria) correctly see theirs as quite different, with scores around 80, near Type C.
The correlation between a society’s actual levels of welfarism and its residents’ perception of the type of society they live in is strong, r = 0.76. In countries with strong welfare states, people mostly (and correctly) see their society as egalitarian and prosperous. By contrast, people in the countries lowest on welfarism mostly (and correctly) see theirs as rather less egalitarian and less prosperous. This means that ordinary people have a good idea of the shape of inequality in their society, even if their numerical estimates might be off. Hence, in interpreting the later results about demand for redistribution, we can assume that people’s baselines are largely veridical.
Thus, strong welfare states have more egalitarian income distributions and their citizenries recognize that clearly. This same result holds when we use other measures of welfarism (Appendix D, Figure A8, Panel A).

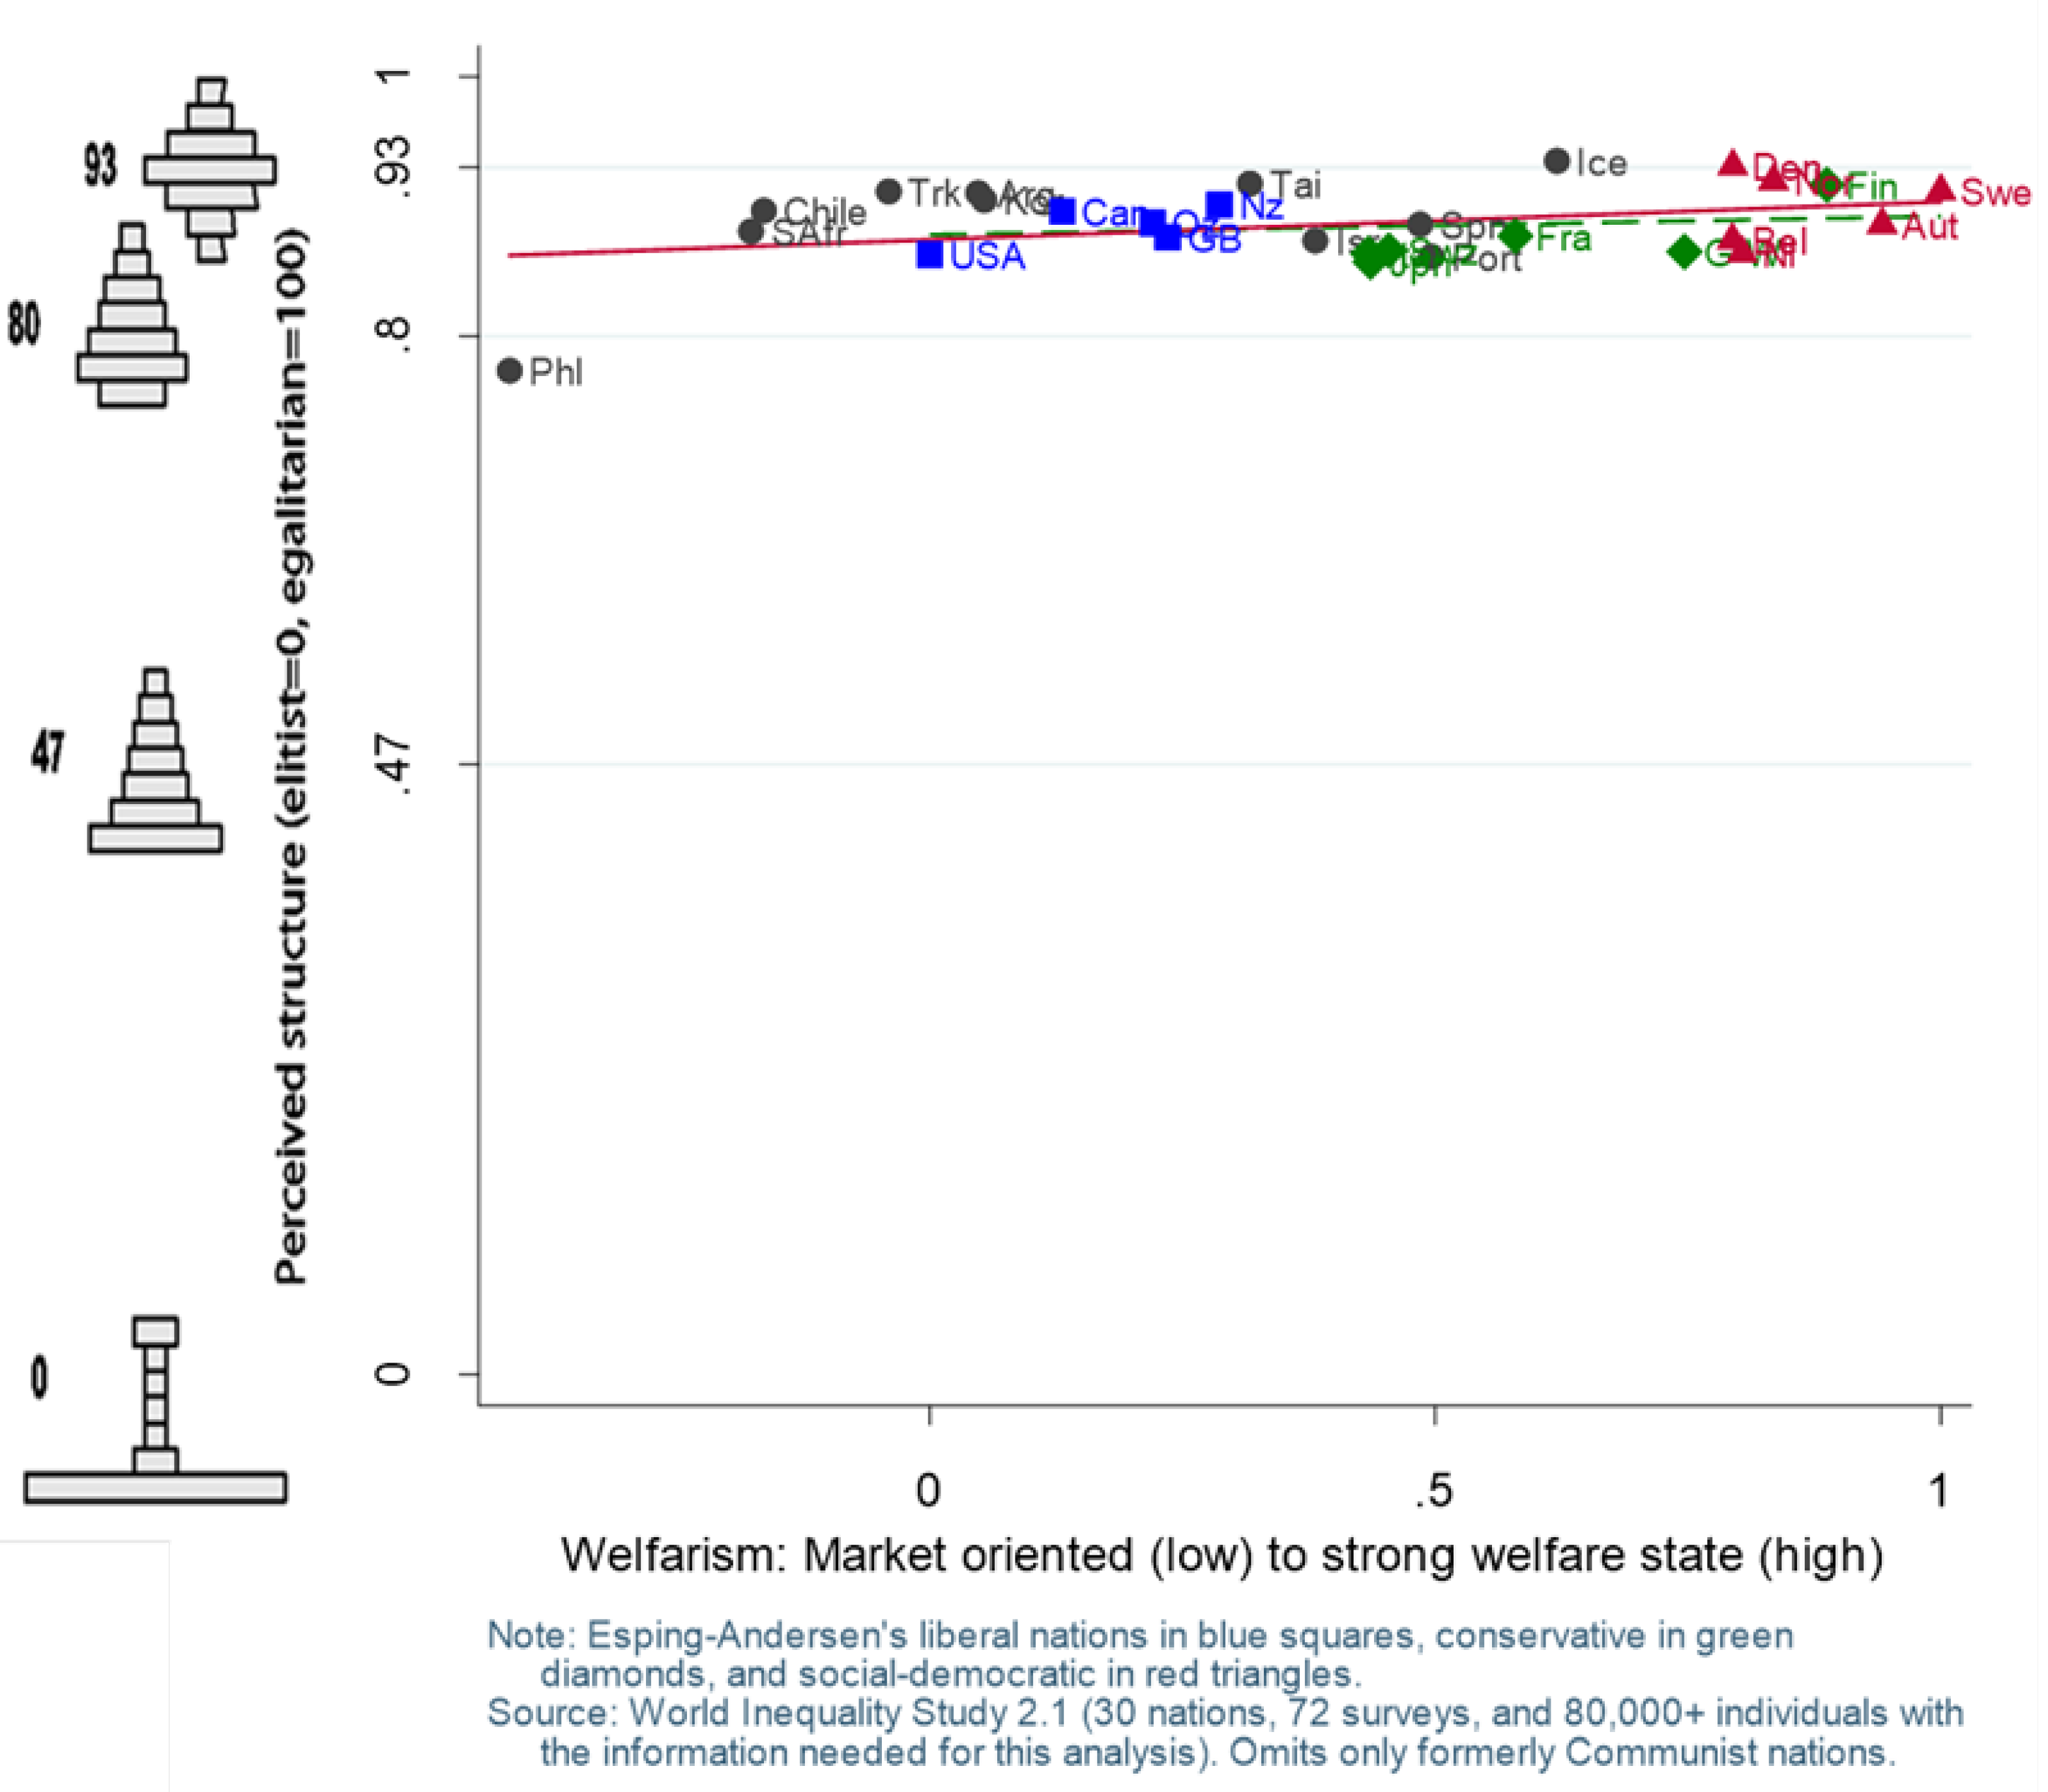
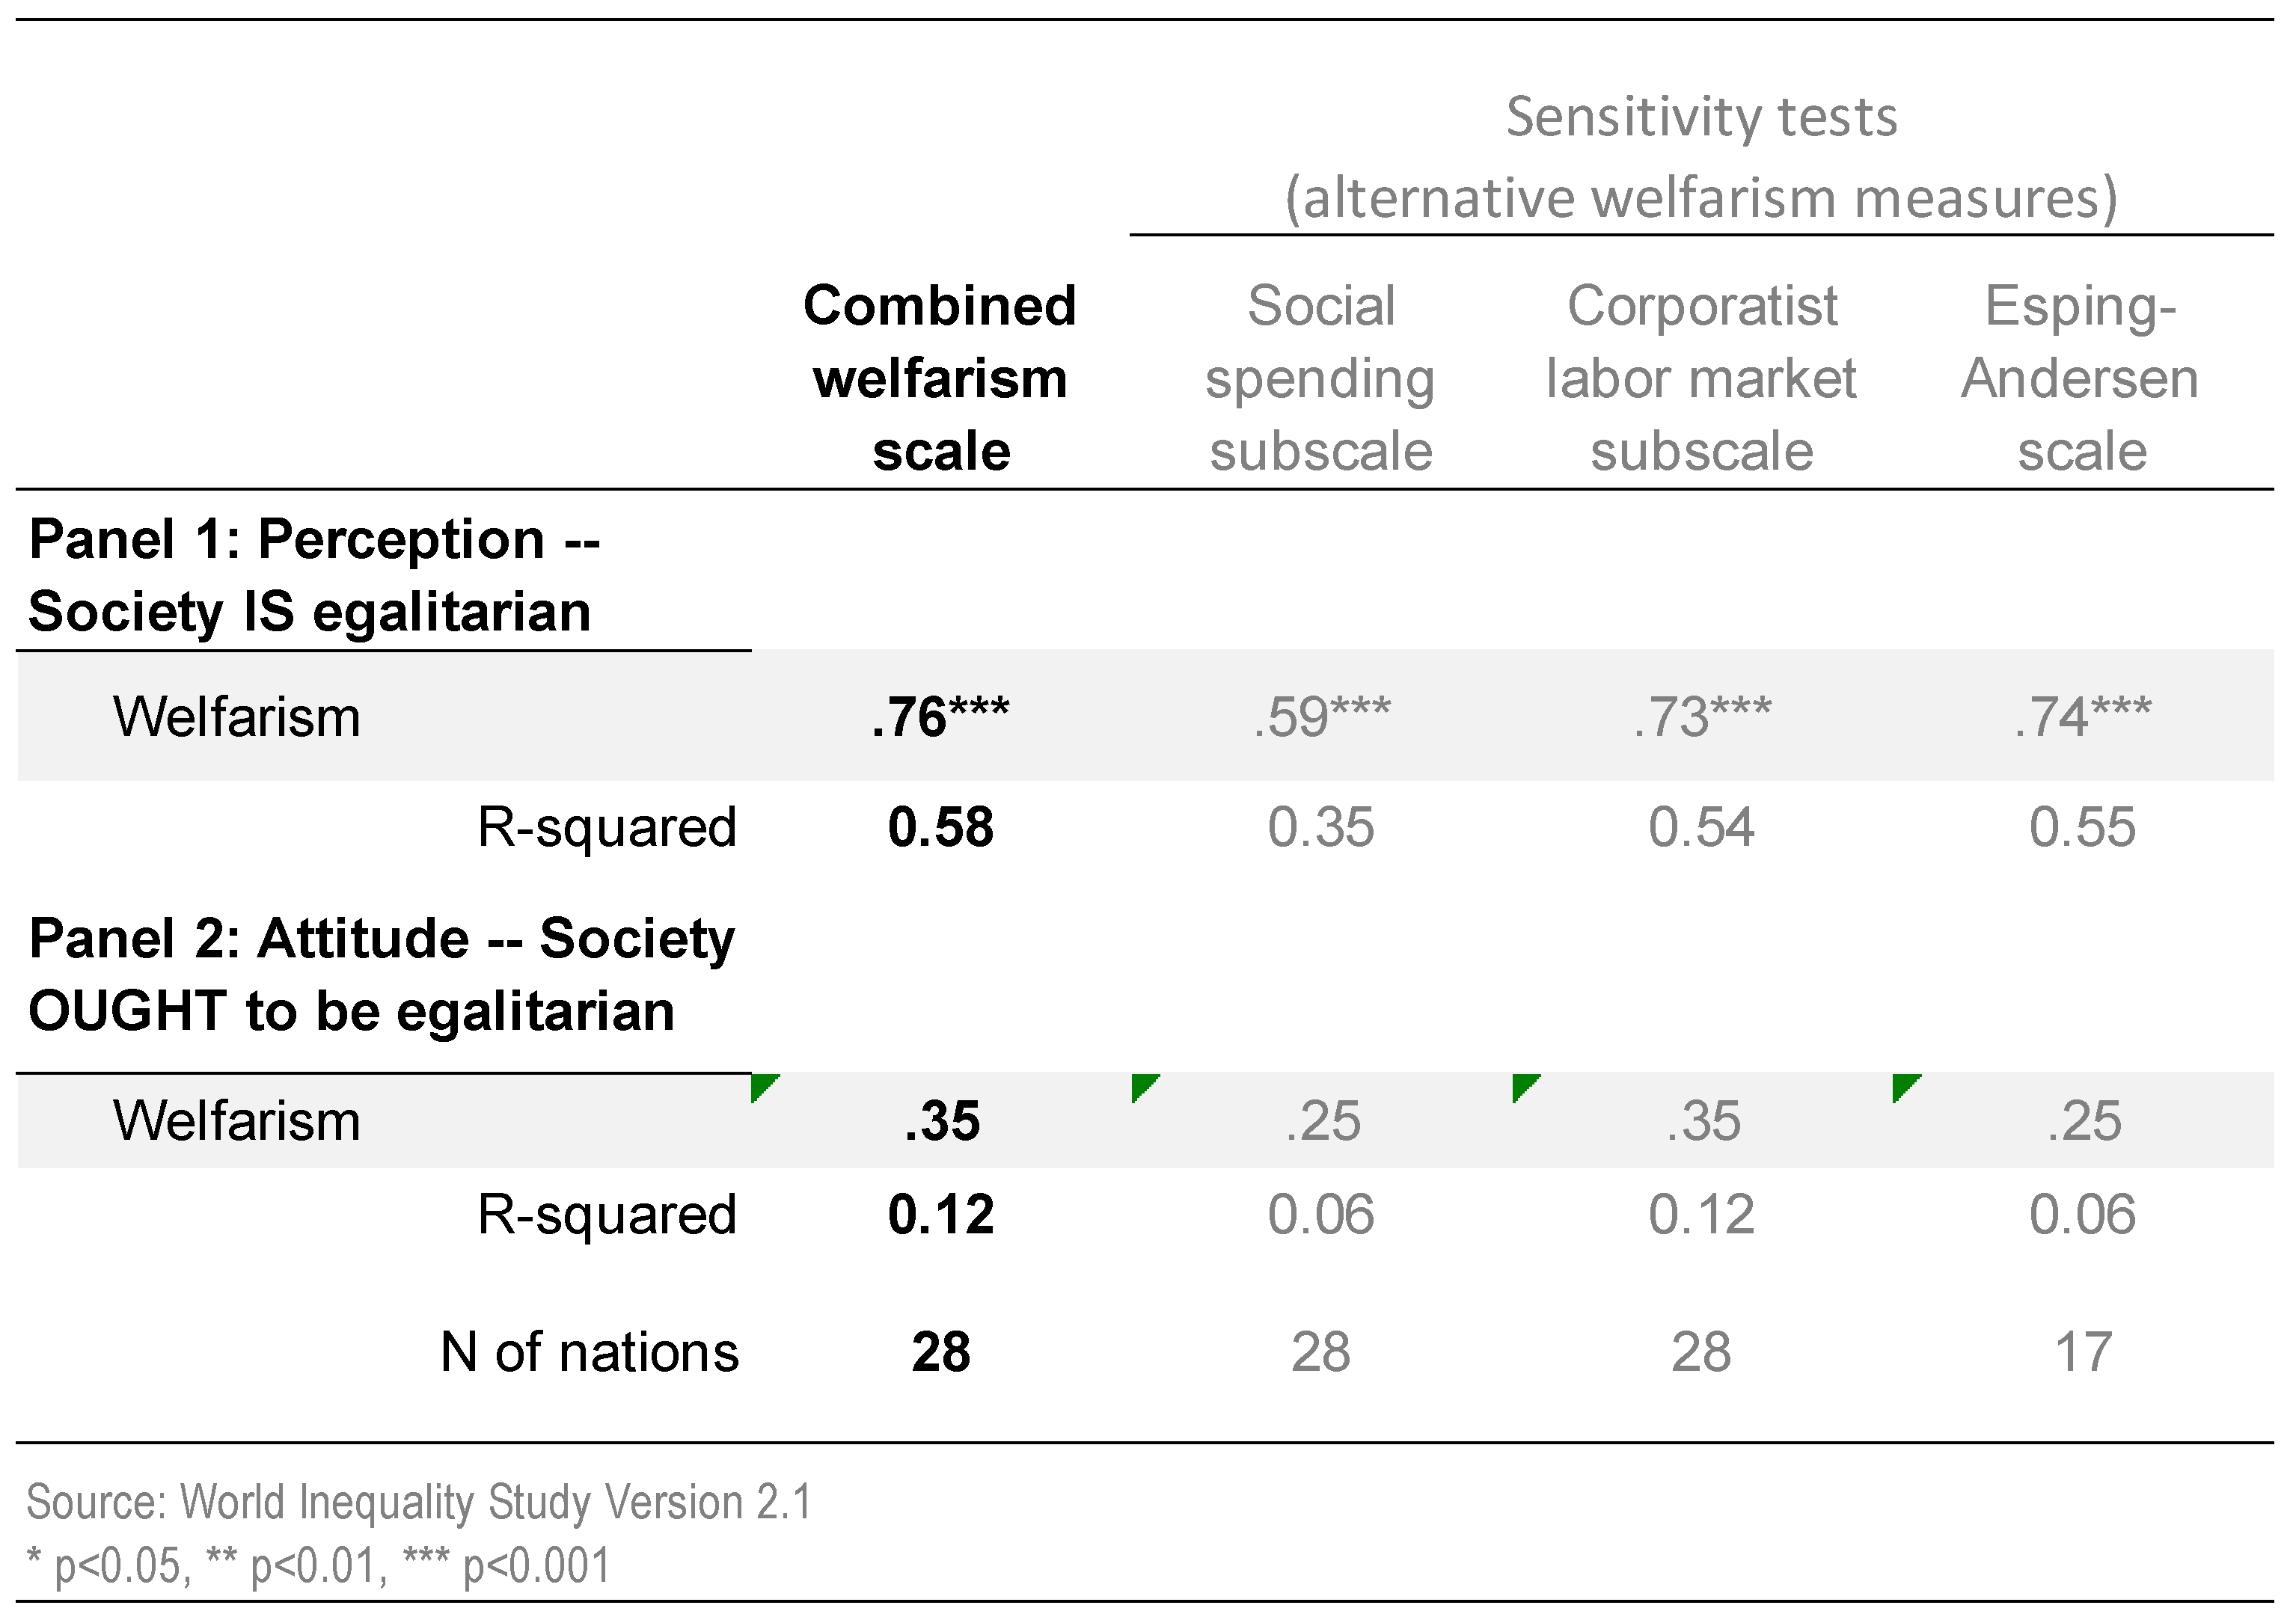
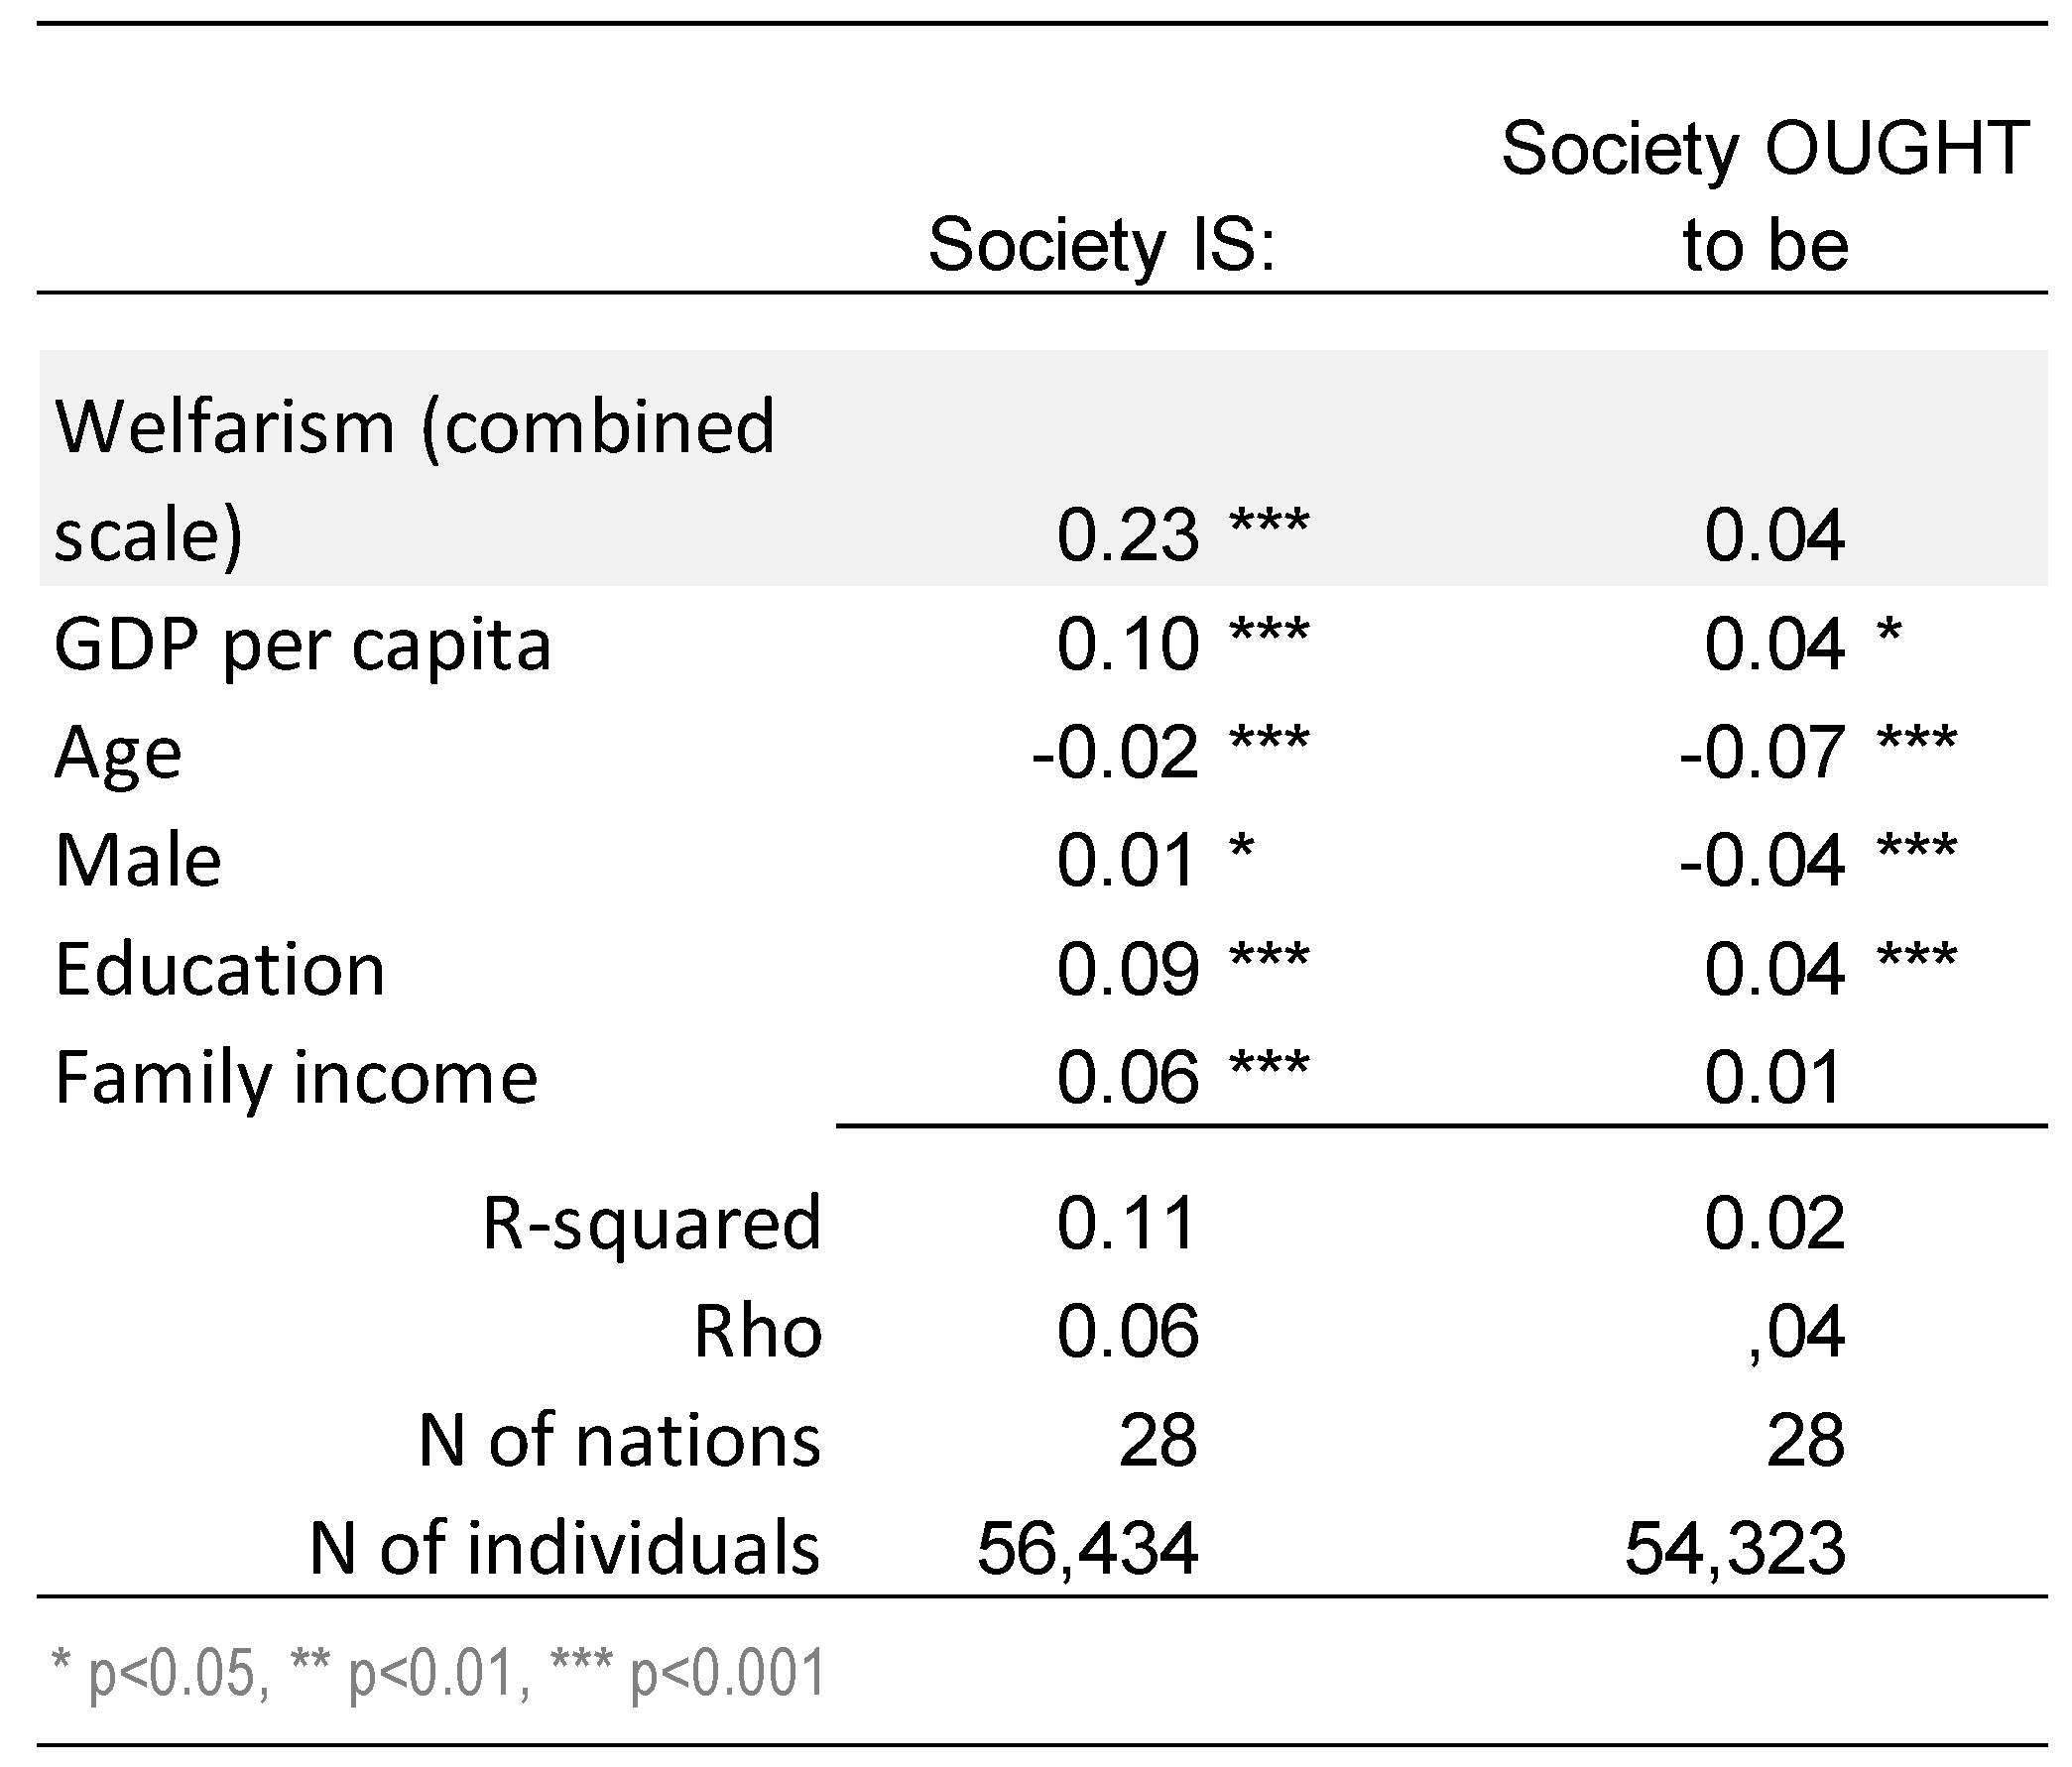
3.3. Goals: What Society Ought to Be

Somewhat surprisingly, residents of the strongest welfare states are no more (and no less) in favor of prosperous egalitarian forms of society than are residents of low spending, market-oriented English-speaking nations and other nations at the low extreme of welfarism (Figure 8). In other words, nations’ actual welfarism is not aligned with their residents’ normative views about which type of society they ought to have.
Instead, there is very little variation among countries: Nearly everyone prefers a high-status egalitarian society. The country means are all close to 0.85 or 0.90, near the rich and egalitarian Types C and D with their large and prosperous middle classes. Only the Philippines is a fraction lower.
In the aggregate bivariate relationship shown in the graph, there is a minuscule, but statistically significant, effect suggesting that egalitarian ideals are fractionally more prevalent among the more welfarist societies. However, that disappears in a multilevel analysis with appropriate control variables (Figure 9, below). The same result holds for the other measures of the strength of the welfare state (Appendix D, Figure A8, Panel B).
In sum, “is” does not shape “ought” in this domain: Whatever type of society people actually live in (and correctly perceive), they endorse a prosperous, egalitarian ideal. The middle-class egalitarian ideal is dominant everywhere from the most economically liberal, market-oriented nations to the strongest welfare states with their generous social spending and extensive government control of the labor market. This result holds, not only for our welfarism scale, but also for Spending and Corporatism separately and for the Esping-Andersen measure.
Note that these results imply that the denizens of the stronger welfare states experience a closer alignment between their reality and their ideal type of society than do denizens of less welfarist nations.

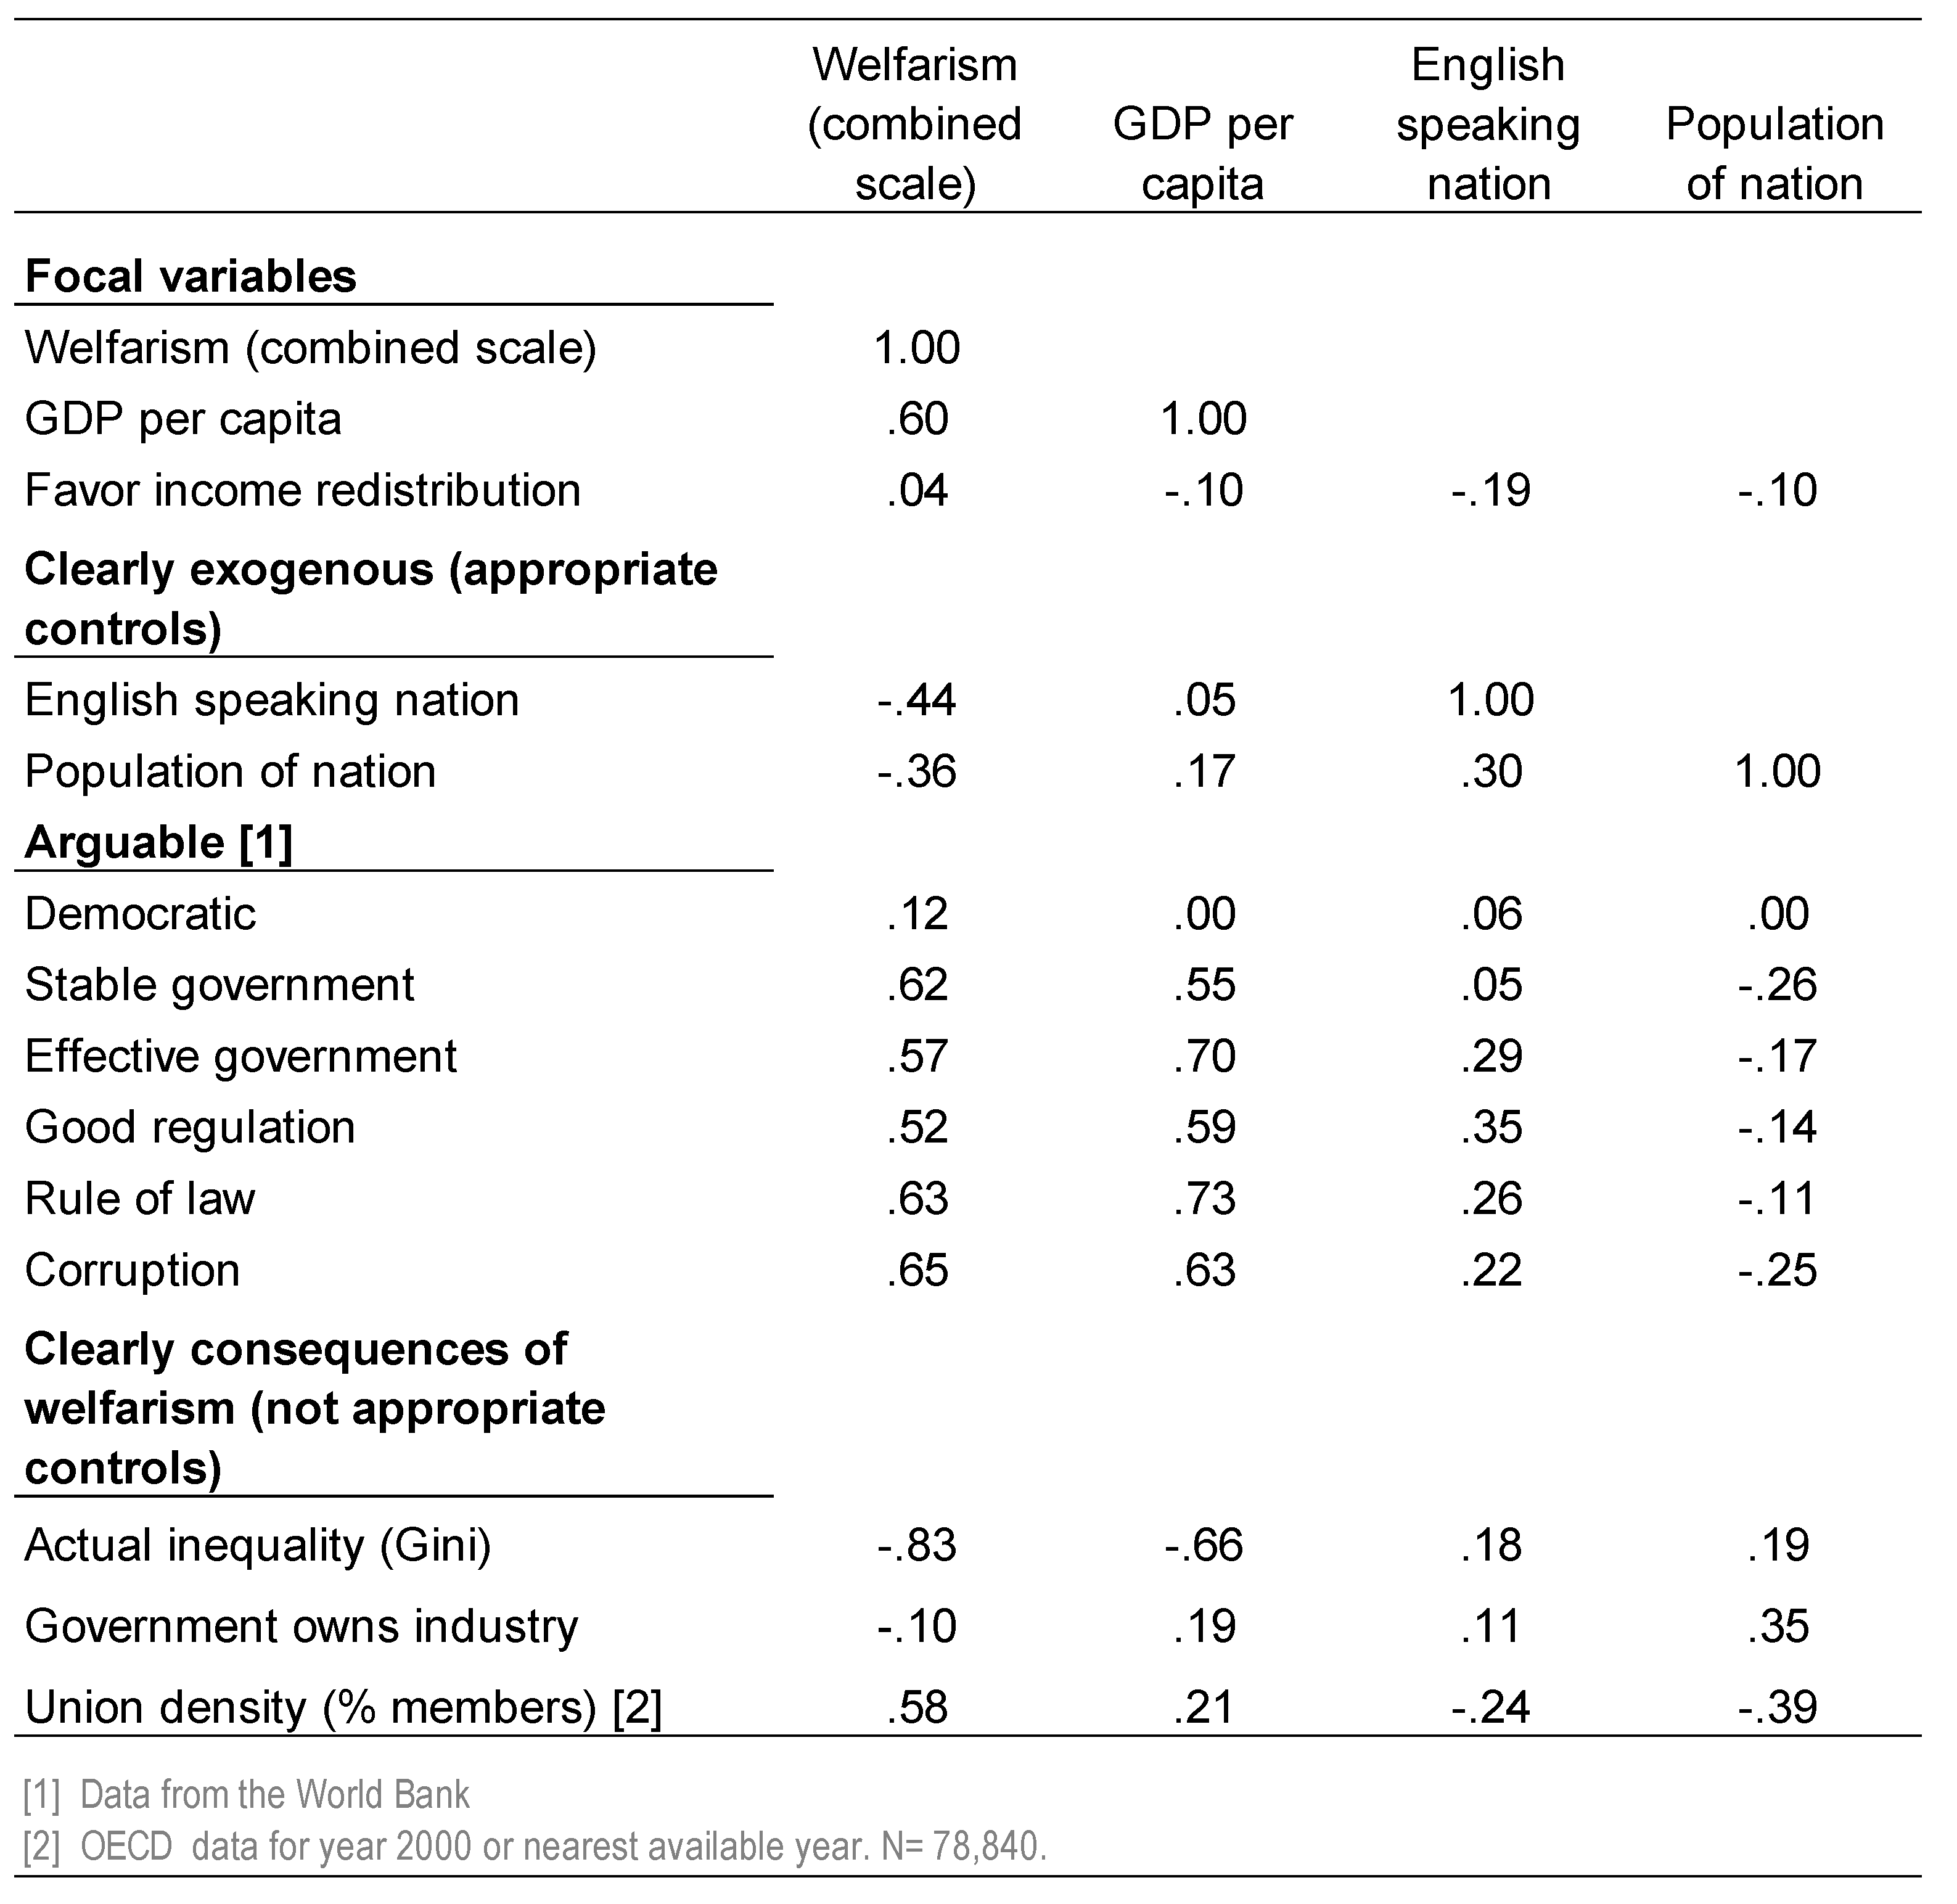
3.4. Controlling for Other Things

All of this remains true when demographic and SES differences, as well as GDP per capita, are taken into account in multilevel analyses (Figure 10). Demographic and SES differences are small, although mostly statistically significant. Net of them, welfarism has a strong impact on perceptions of society type (a standardized effect of 0.23), but no effect on ideals (standardized effect of 0.04, n.s.). Indeed, welfarism is the single strongest effect in the model of perceptions, GDP per capita and education are about half that strong with standardized coefficients around 0.10 at the top of the weak range/bottom of the moderate range, with family income not far behind at 0.06. Age and gender have effects that are statistically significant, but too weak to matter. Thus, people’s perceptions have a strong veridical component.
All this holds equally for alternative definitions of welfarism (Appendix D, Figure A8).

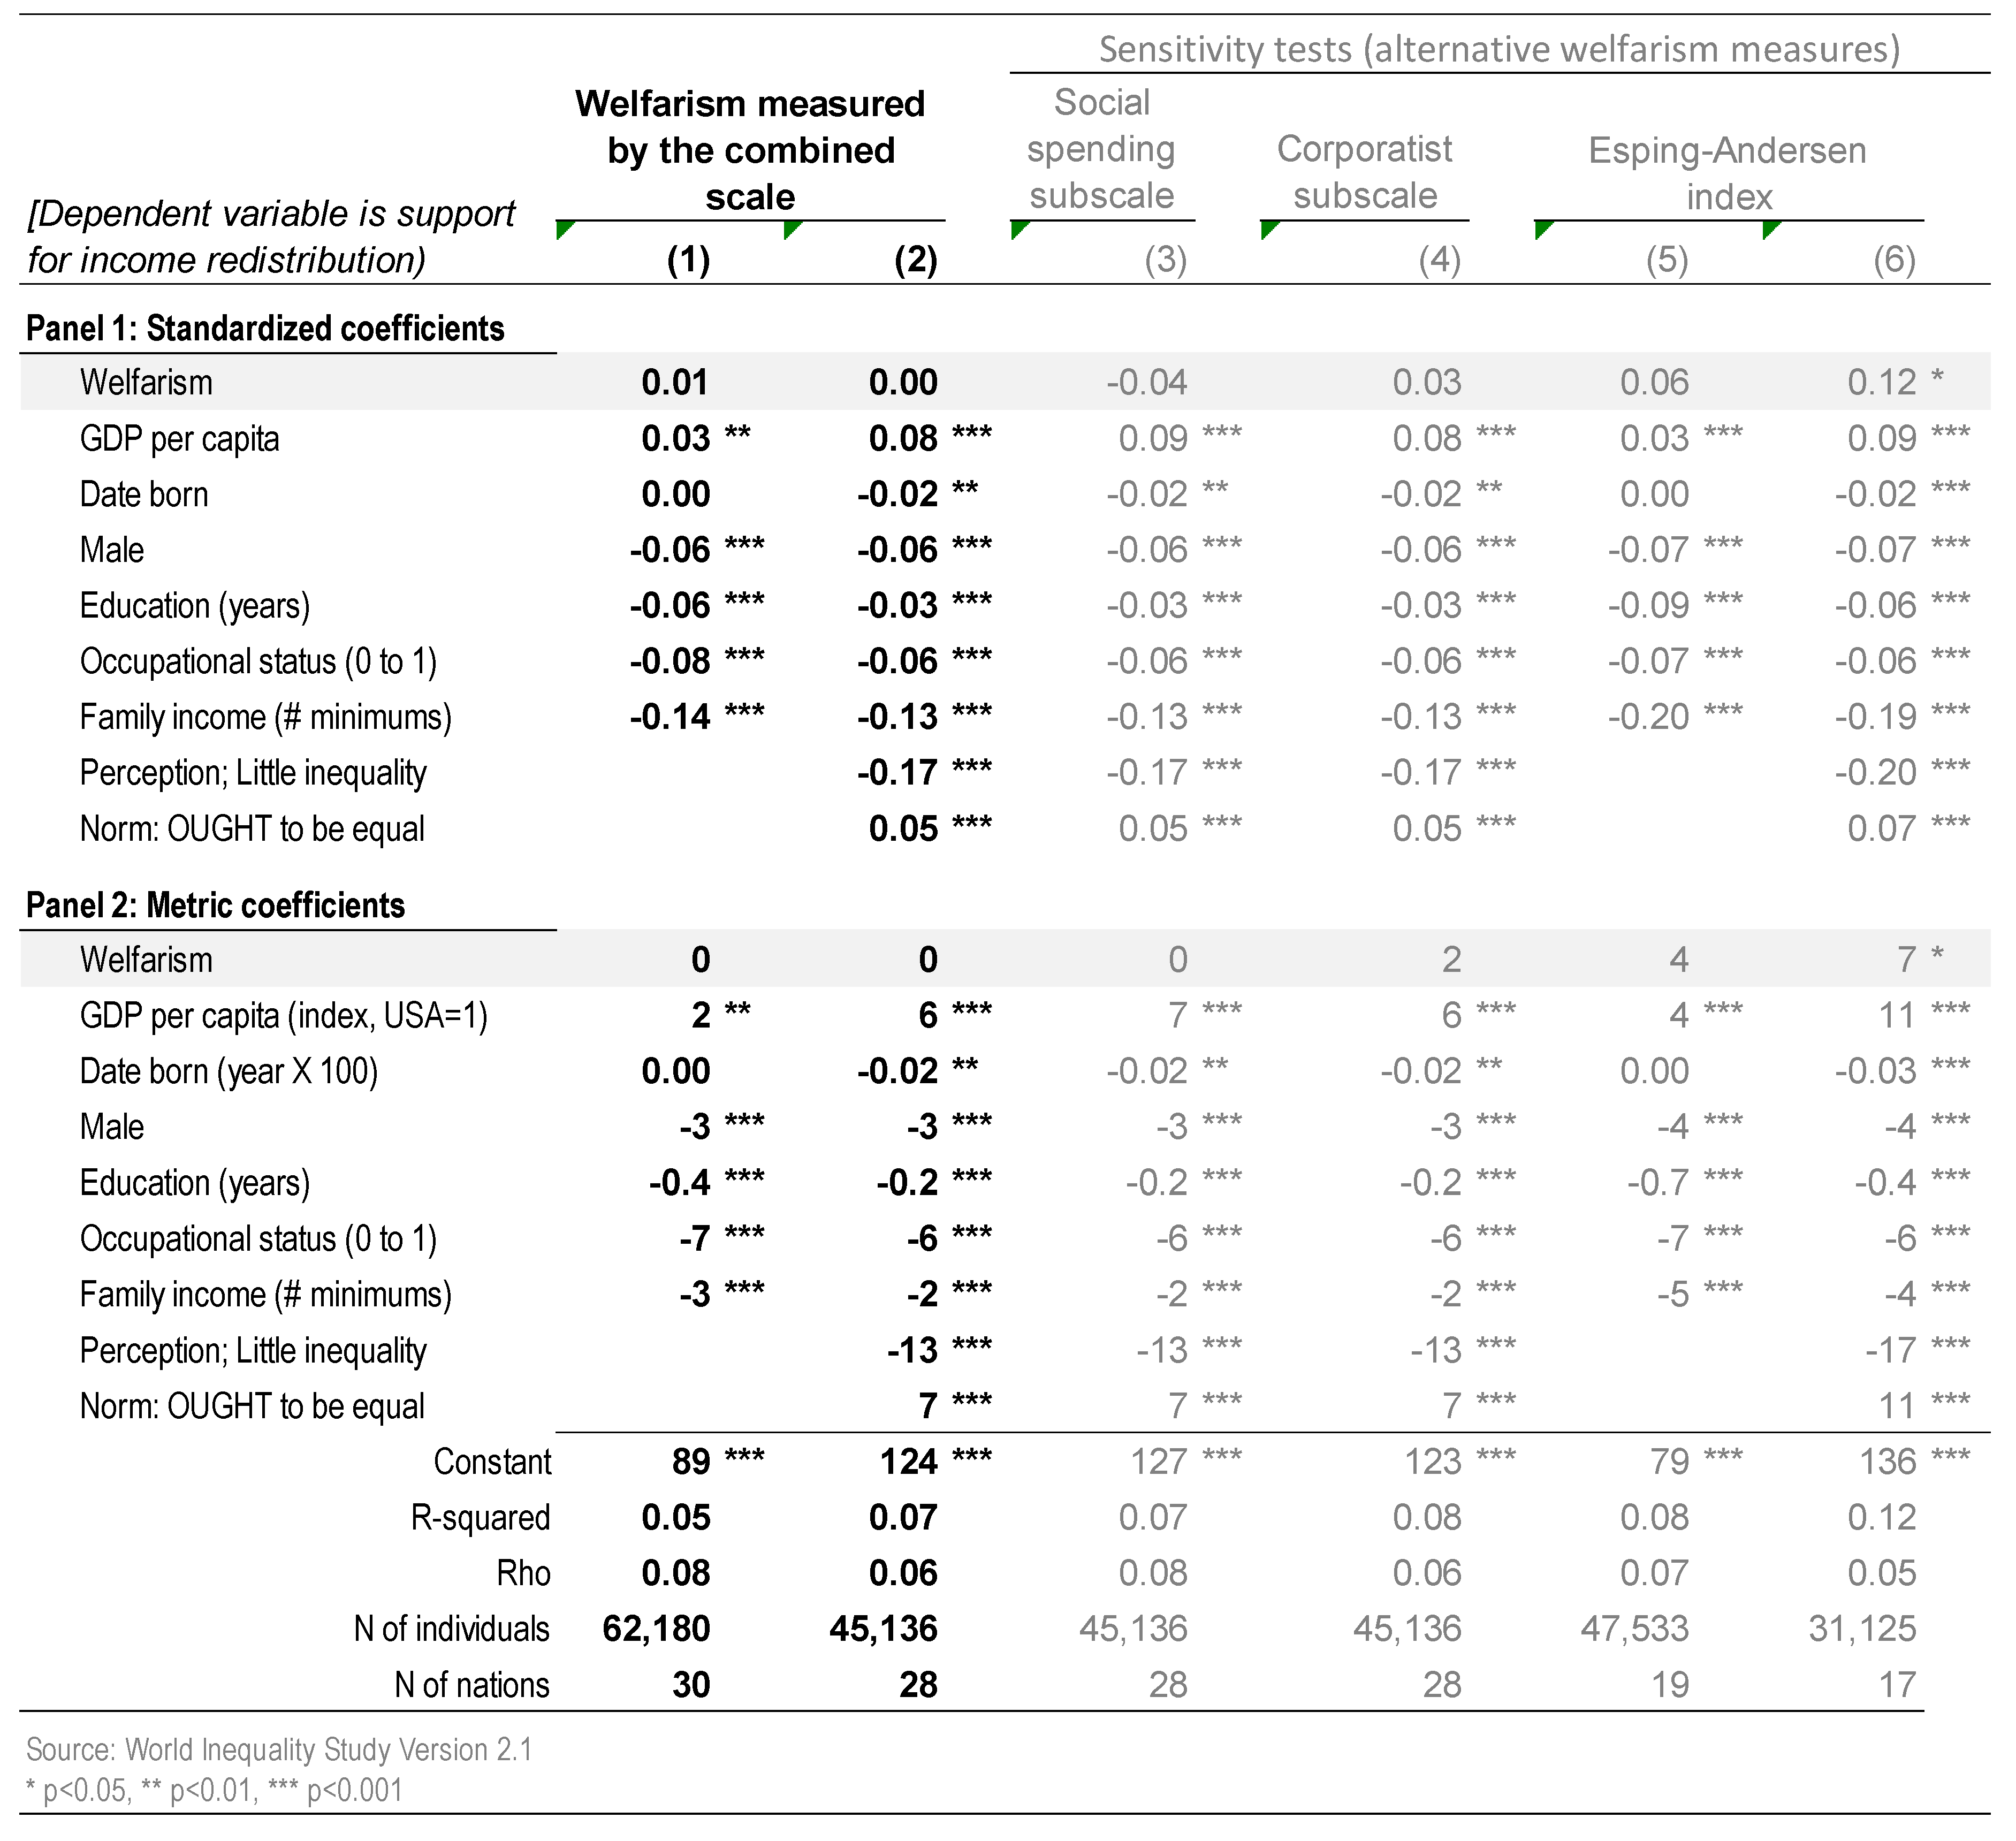
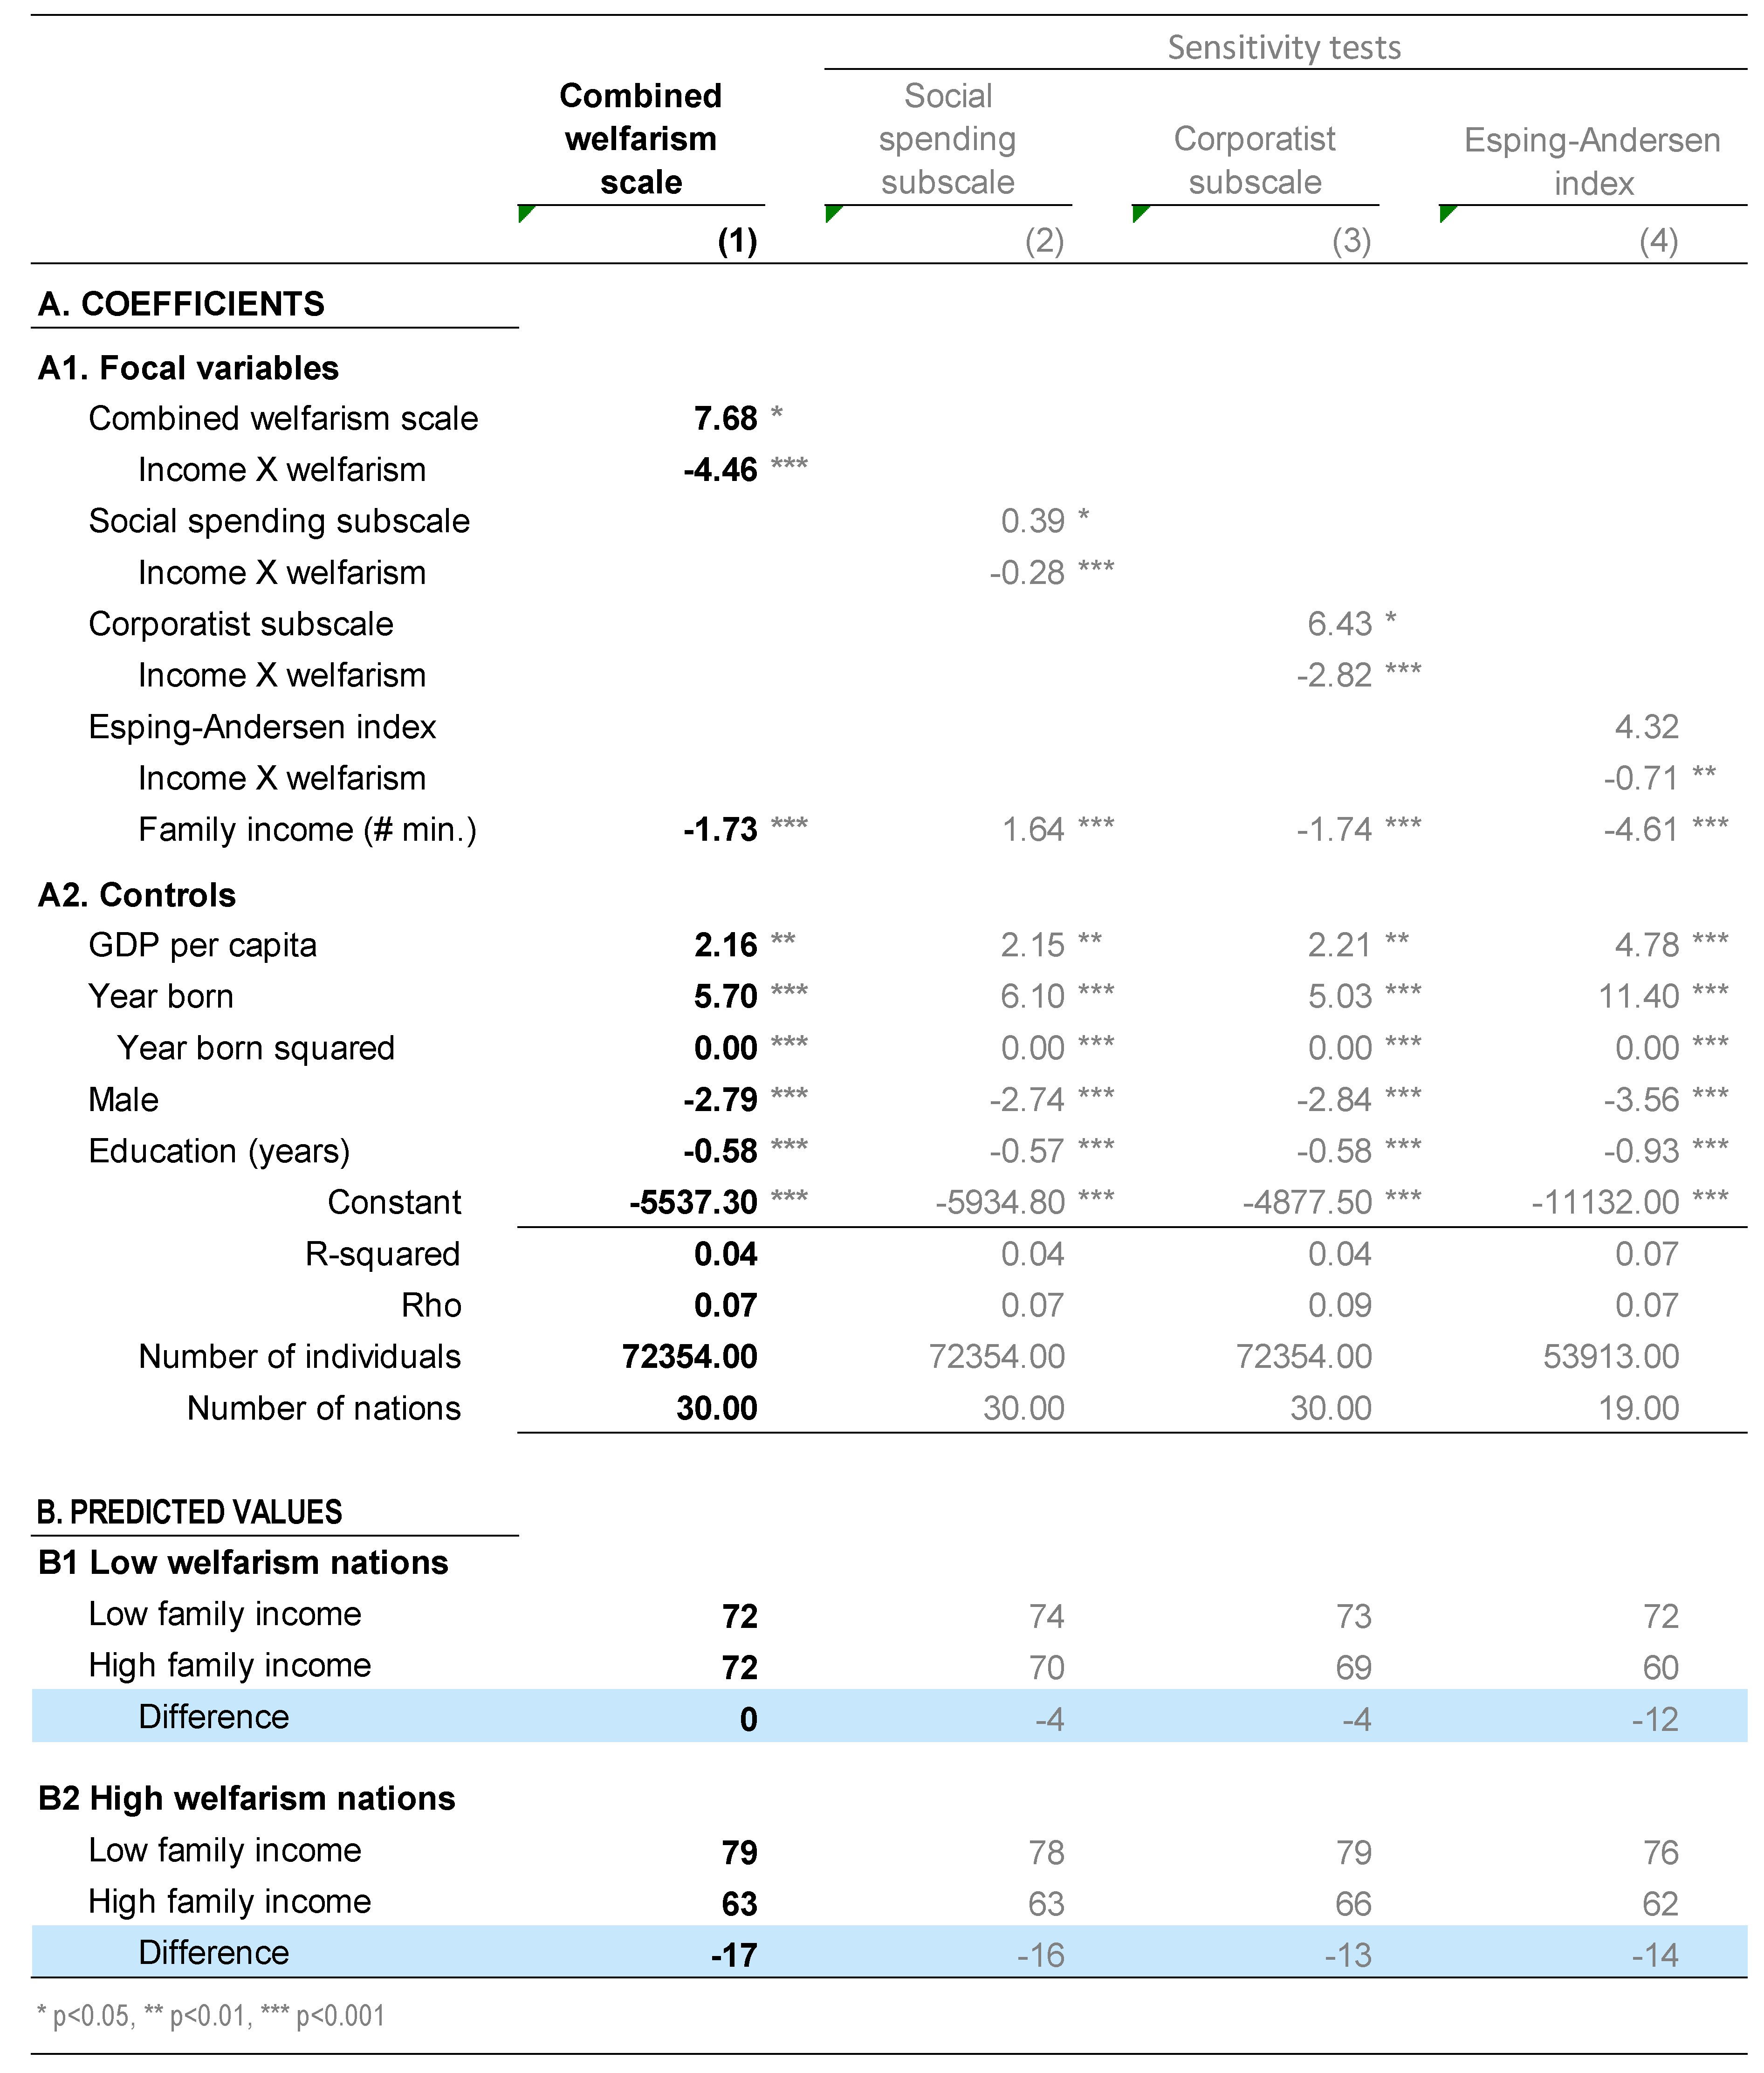
3.5. Welfare State Strength (Welfarism) and Redistribution

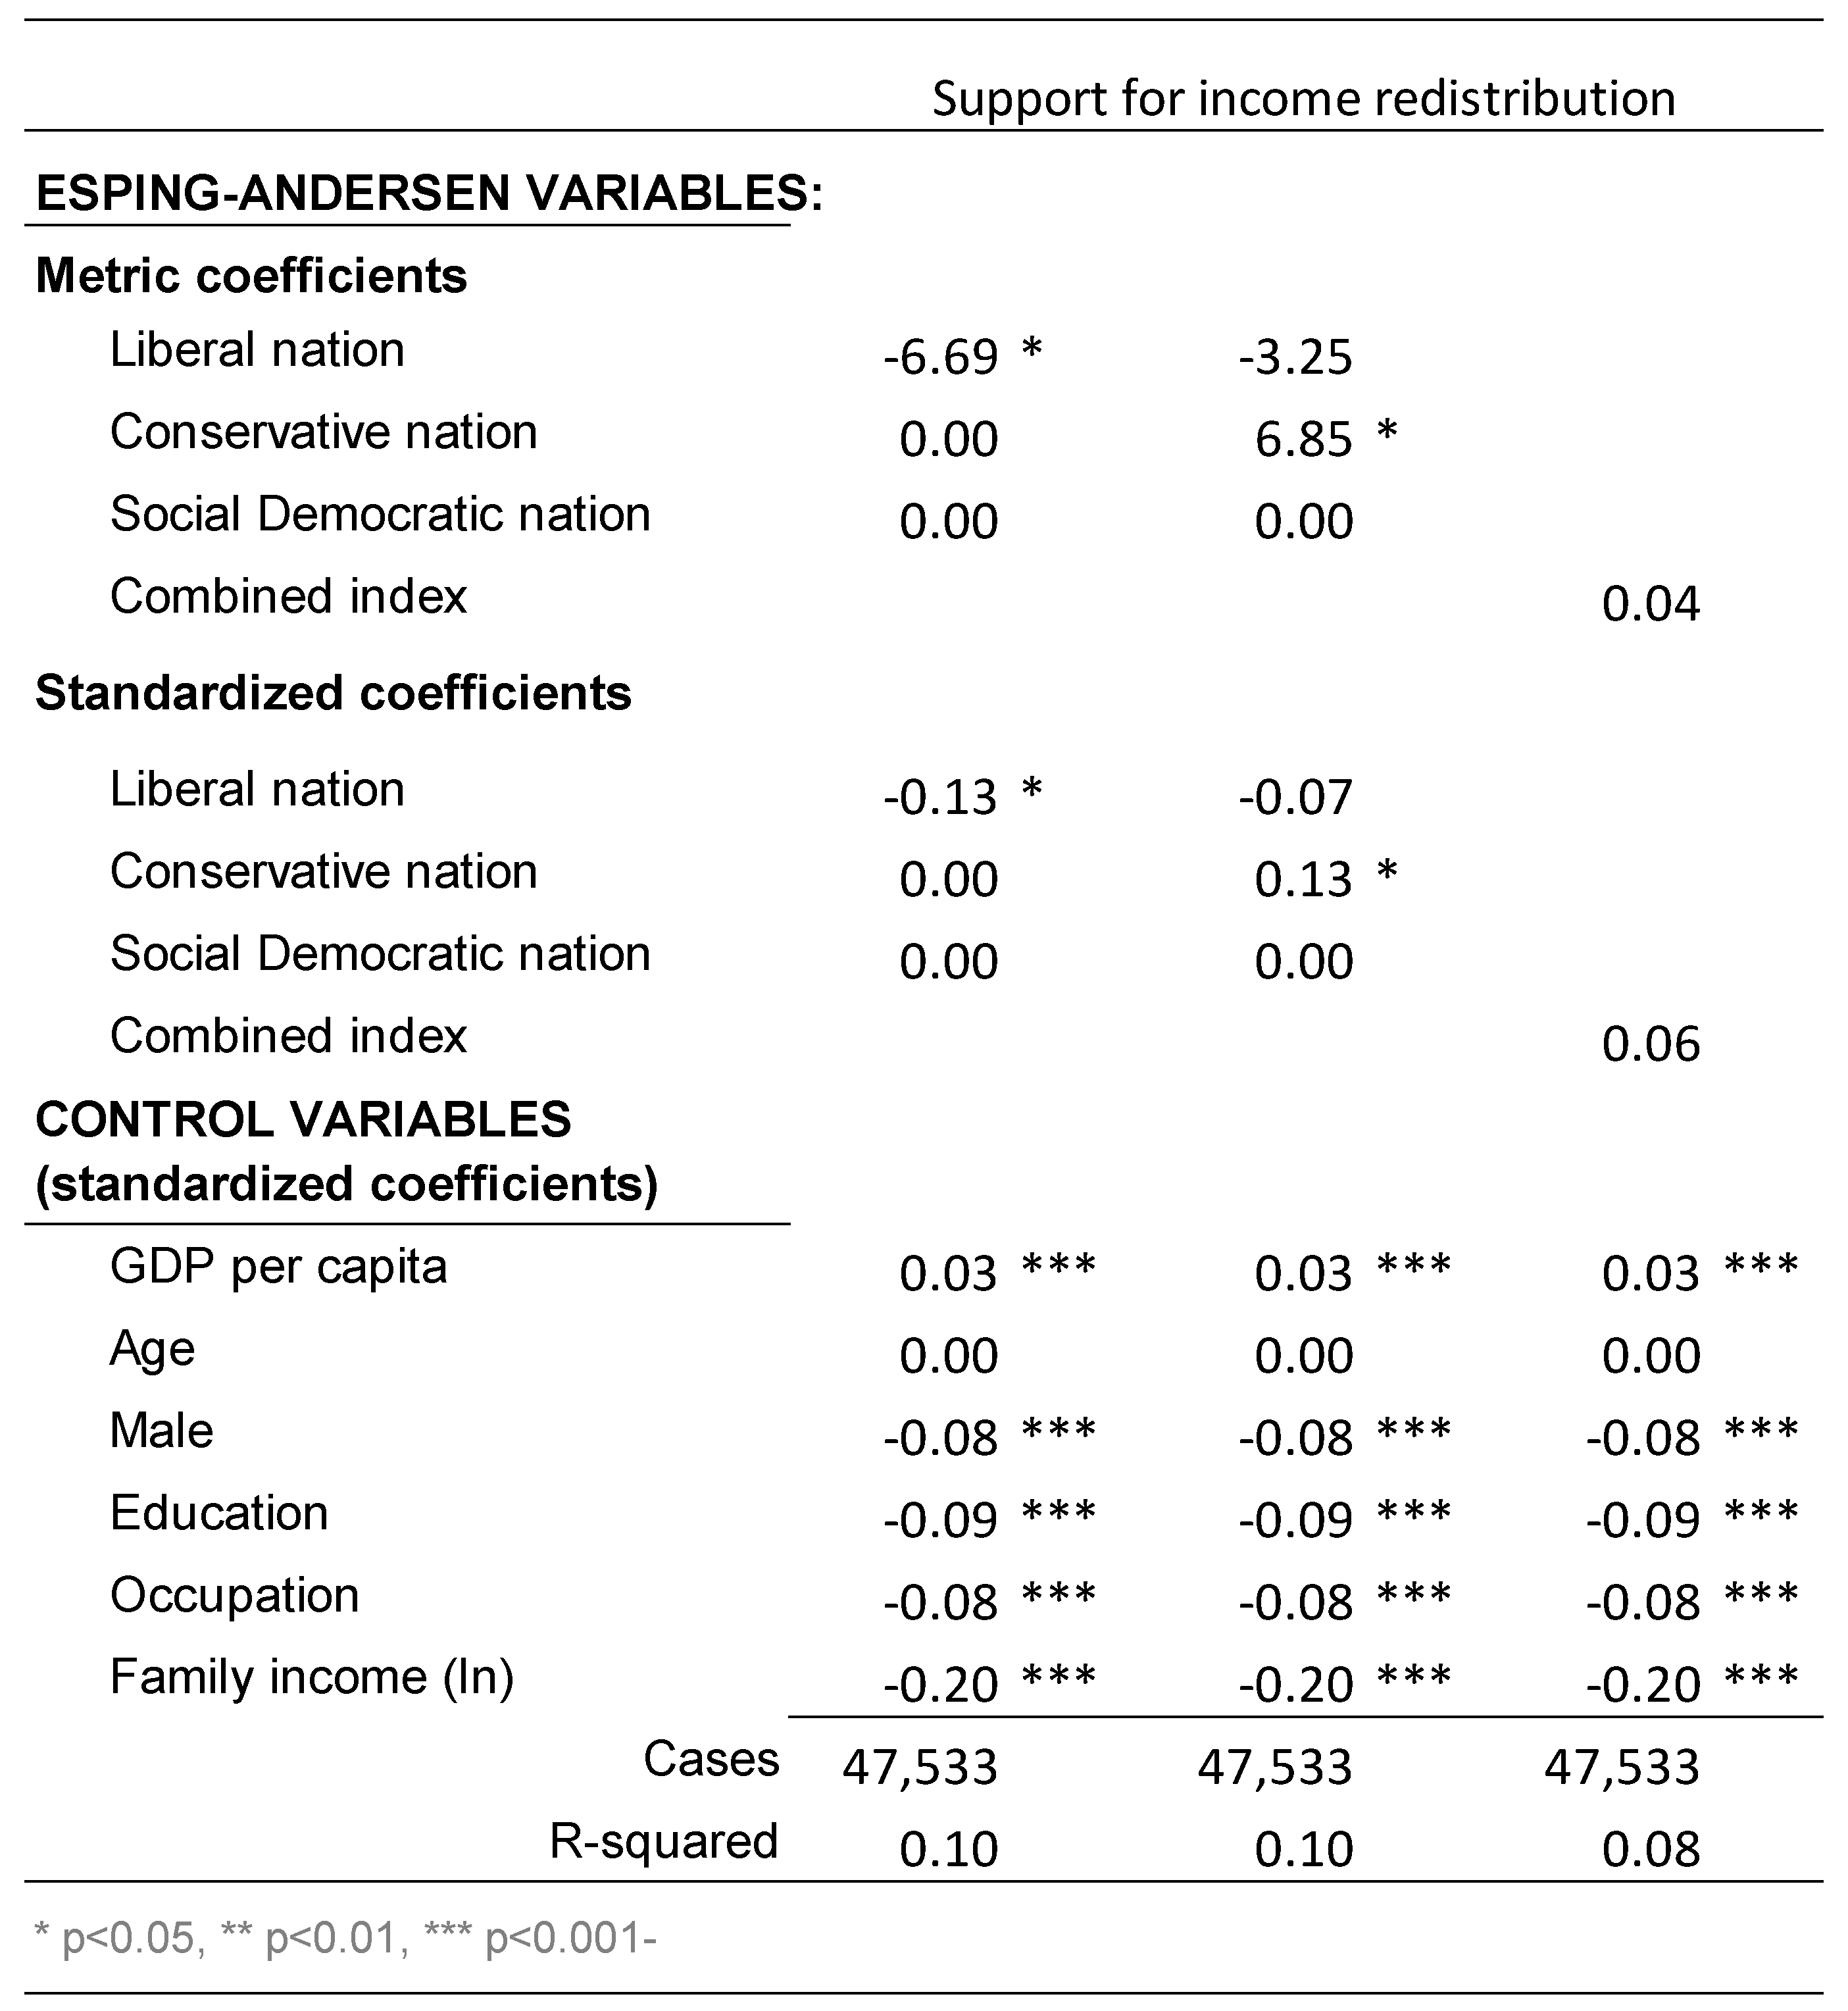
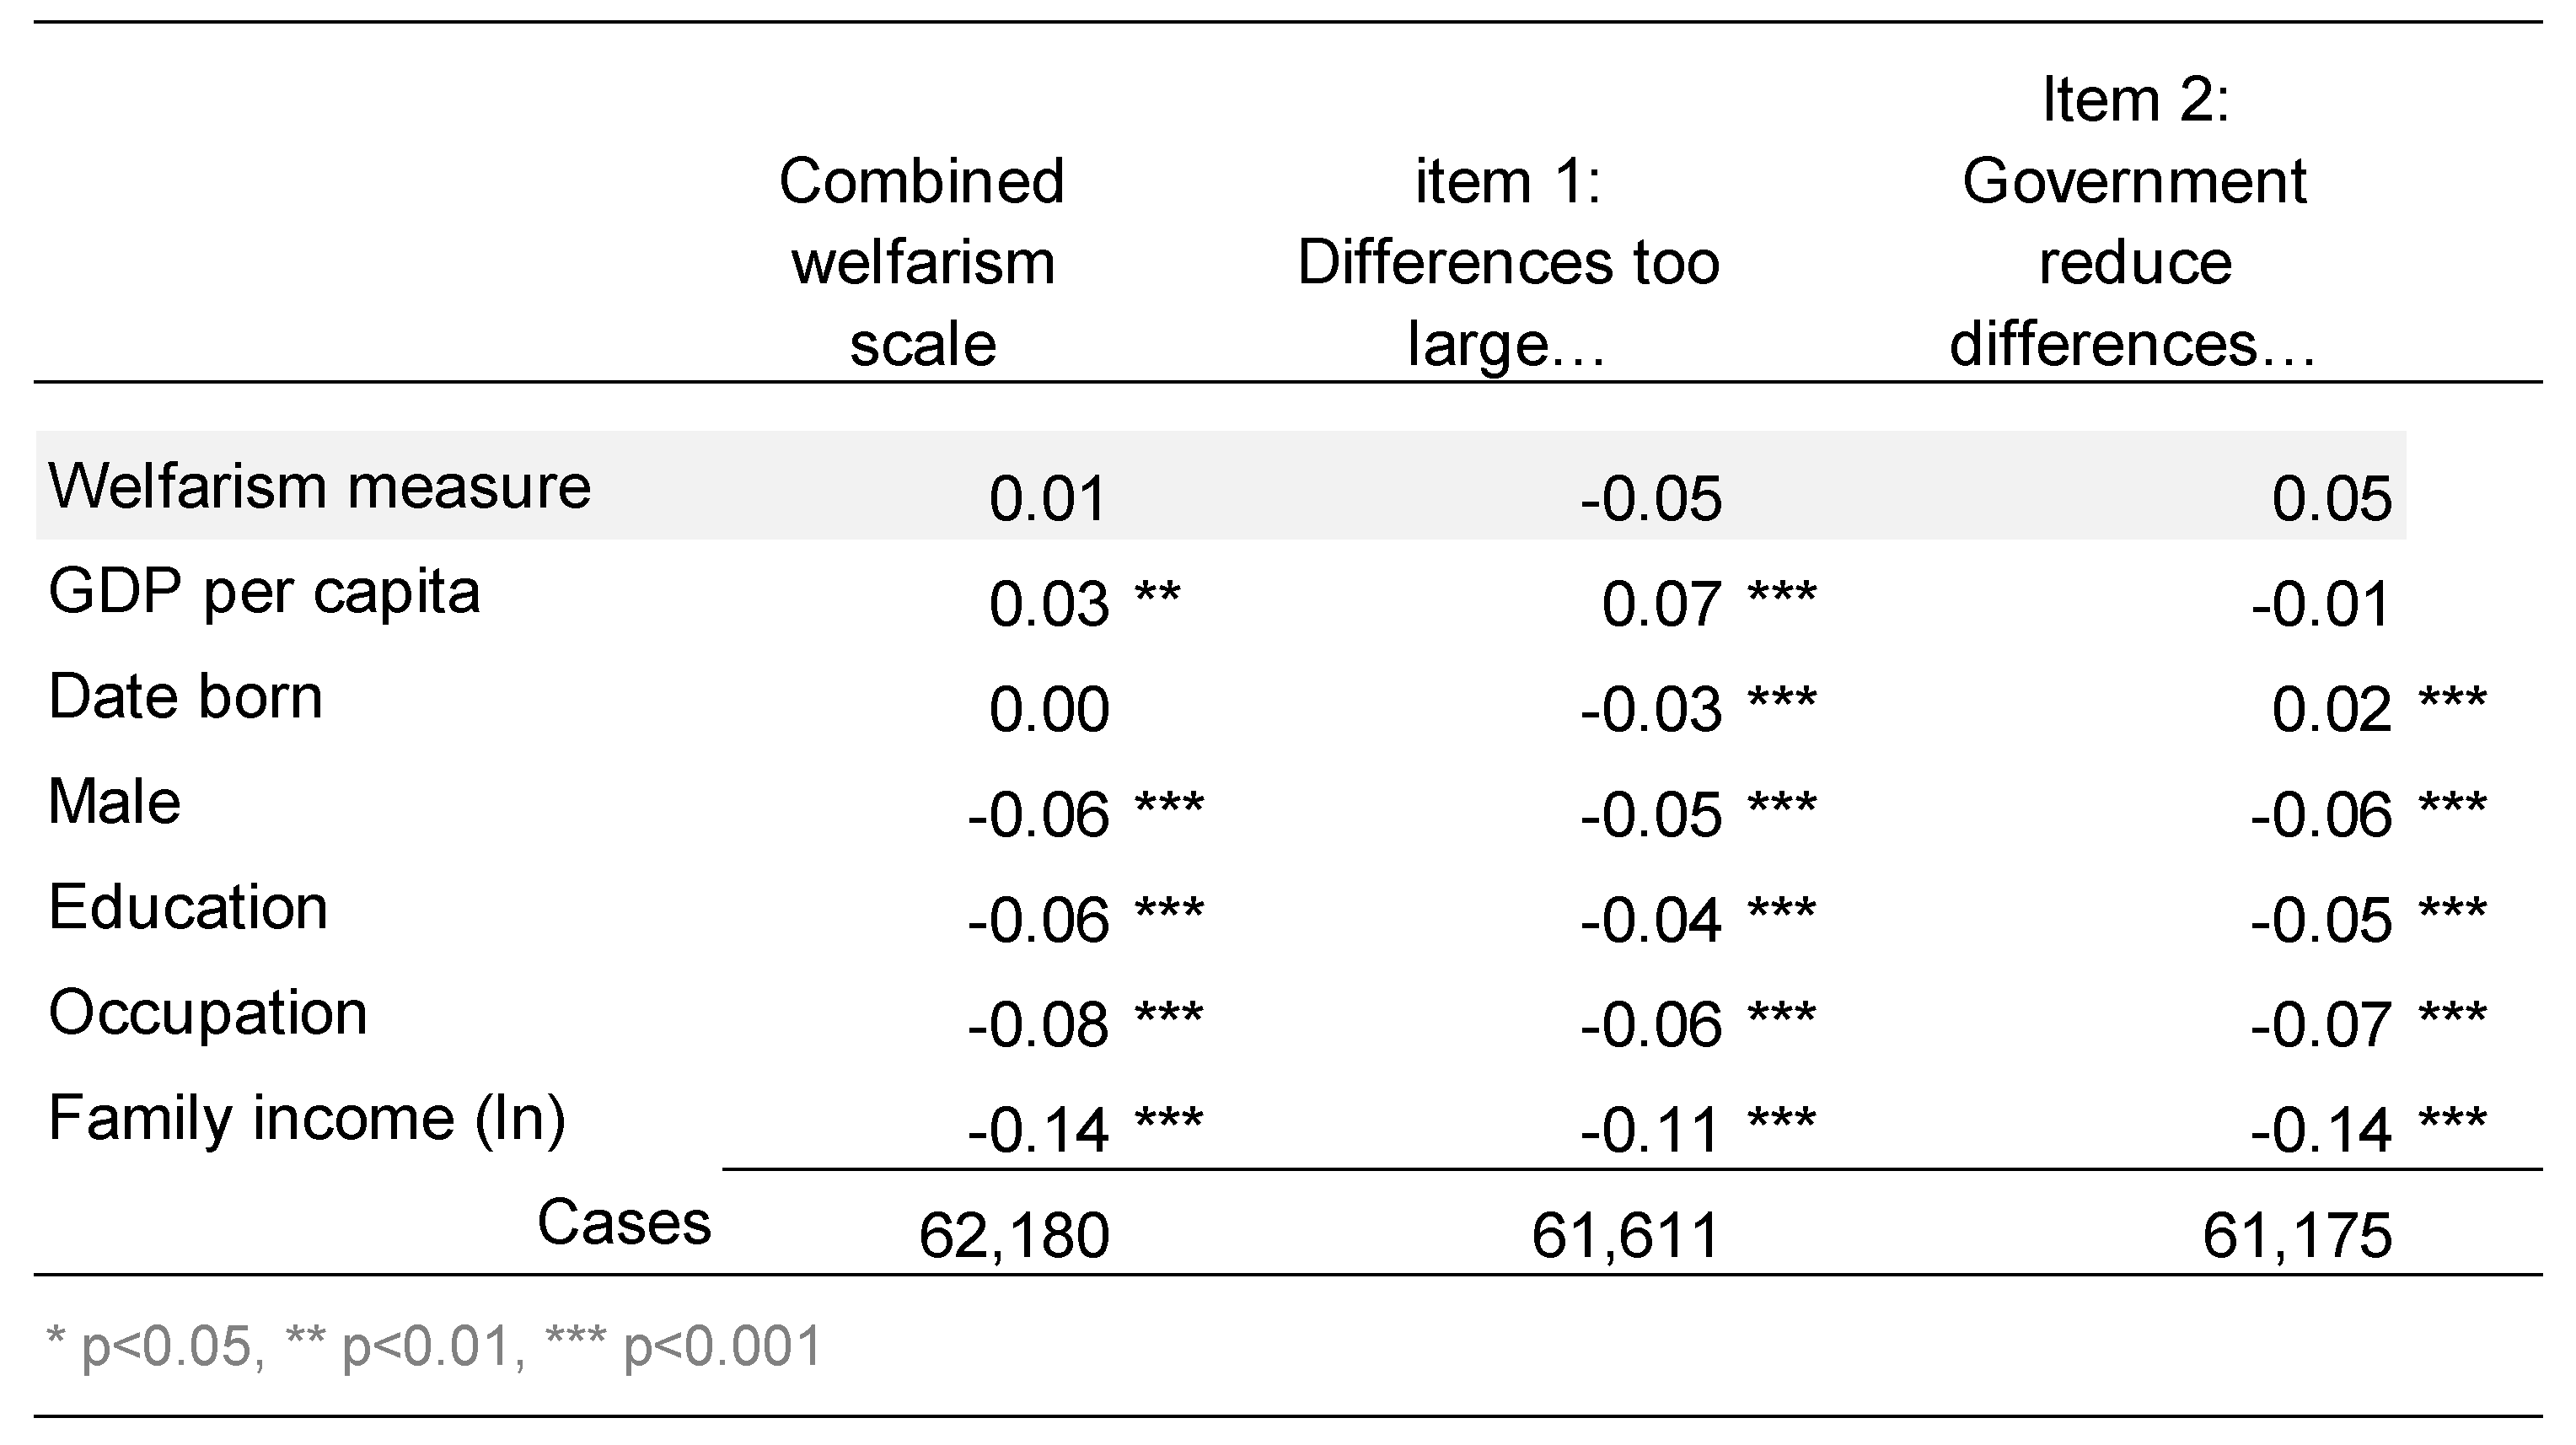
3.5.1. Support for Income Redistribution

Worldwide, the general public mildly favors income redistribution (Figure 11). The great majority think income differences in their nation are too large (mean 74 points out of 100). Fewer, although still a majority, think the government should reduce those differences (mean 64 points).
Our scale of support for income redistribution averages these two items (mean = 68 points out of 100; for details on the scale and its rationale see subsection “Support for redistribution: Dependent variable” in the Measurement section). The mean is well above the neutral point (50 for “mixed feelings, undecided” on the redistribution items), but clearly below “agree” (75 points) and far below “strongly agree” (100 points).
The average varies substantially by country (Figure 1, next to last column, above), from something around 60 (USA) to near 90 (Portugal, Ukraine).

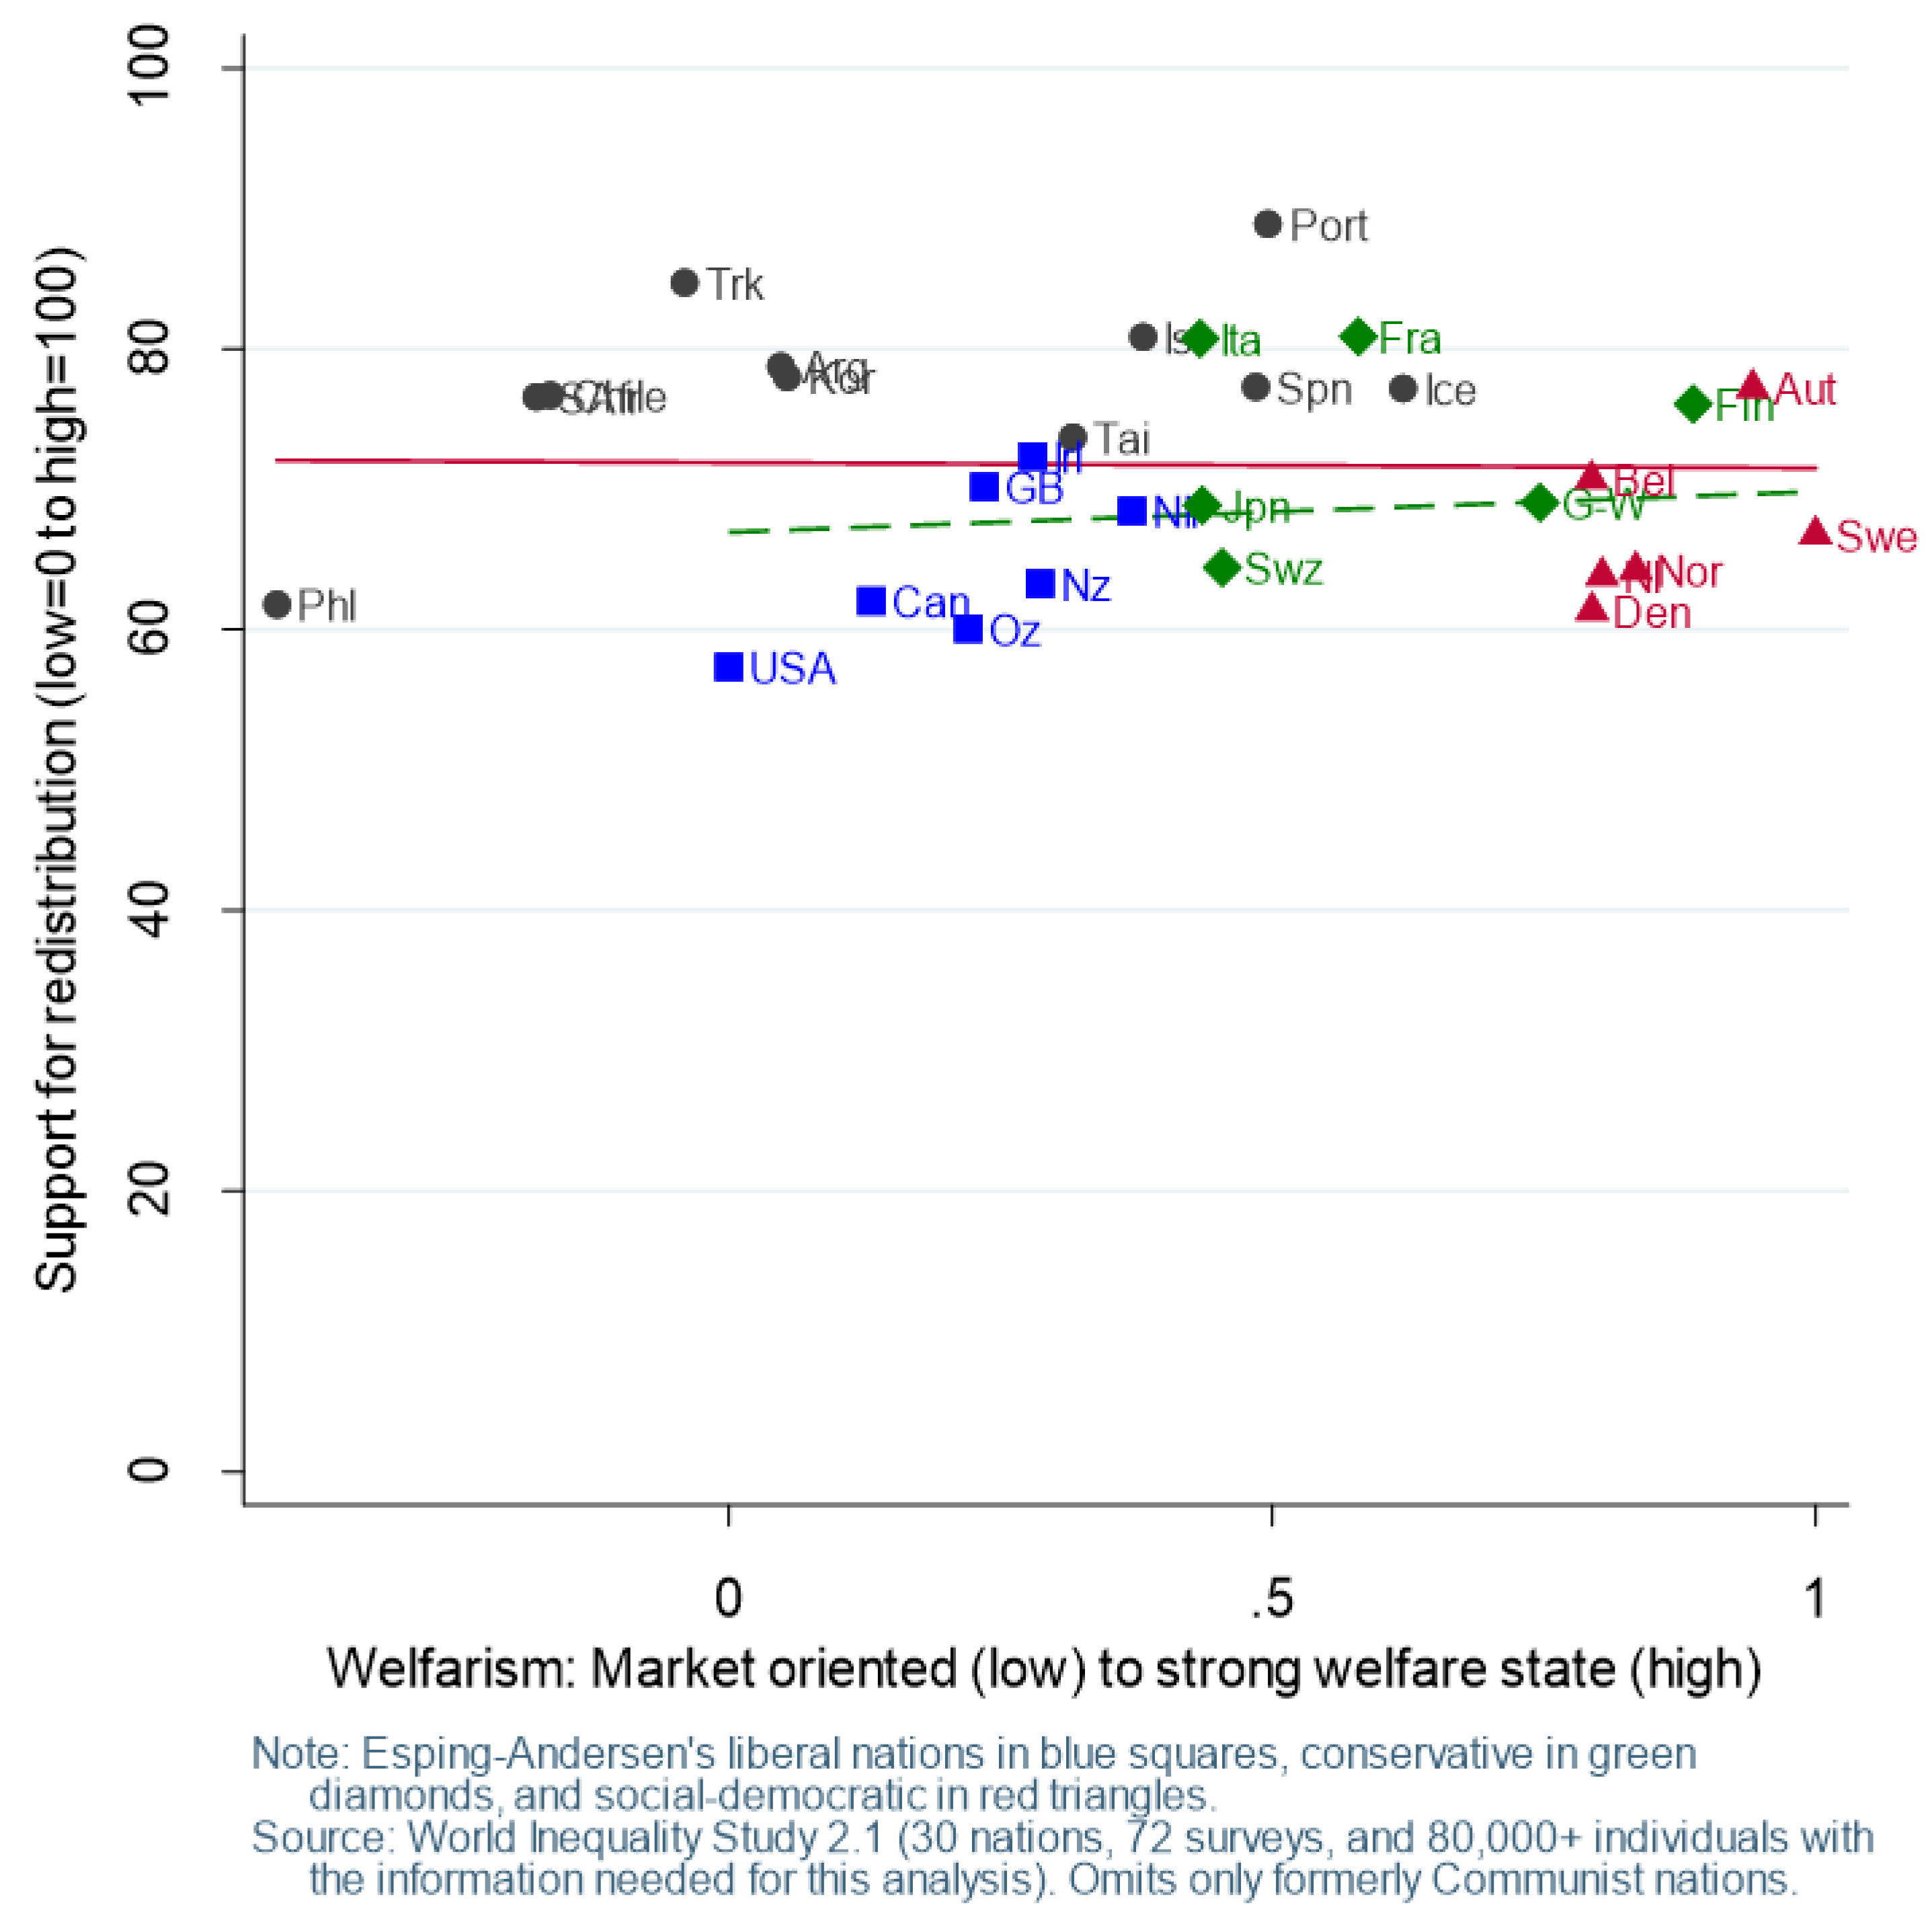
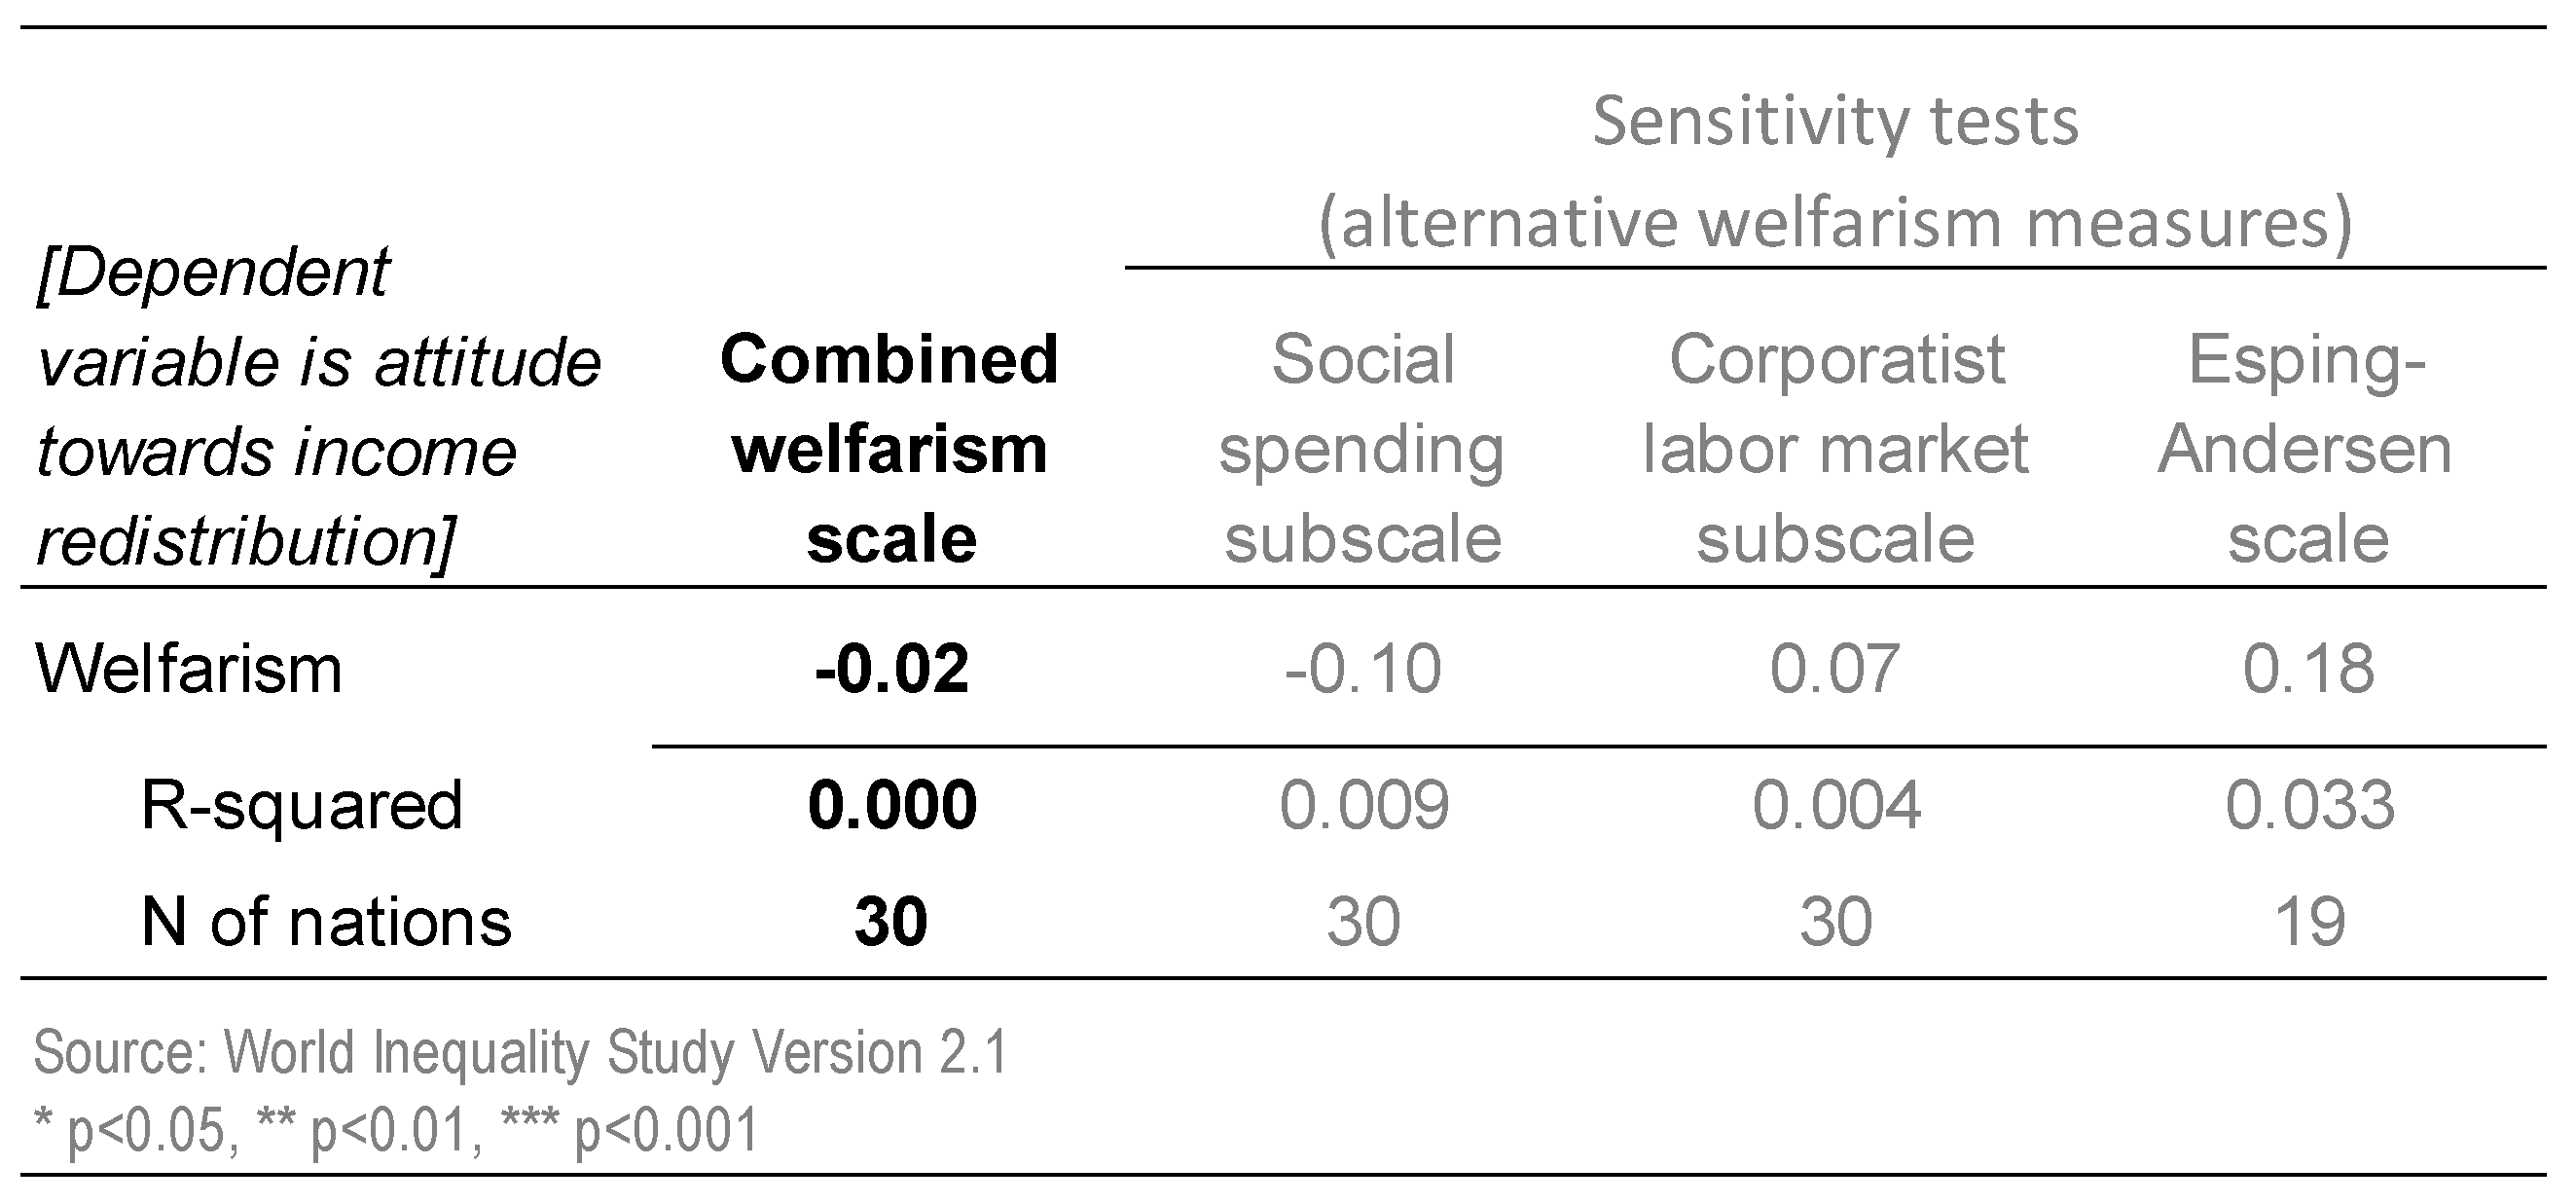
3.5.2. Redistribution Attitudes Do Not Align with Welfarism (No Main Effect)

What then is the link between the welfare state, with its past history and present concern with redistribution, and its citizens’ own opinions about the matter? The results show that attitudes to income redistribution do not align with the nation’s level of welfarism one way or the other (Figure 12): The nation’s welfarism neither enhances nor detracts from the appeal of redistribution to its residents.
Moreover, the lack of relationship of welfarism and support for redistribution holds true at the national level for all four of our welfarism measures—none has a statistically significant effect (Figure 13).

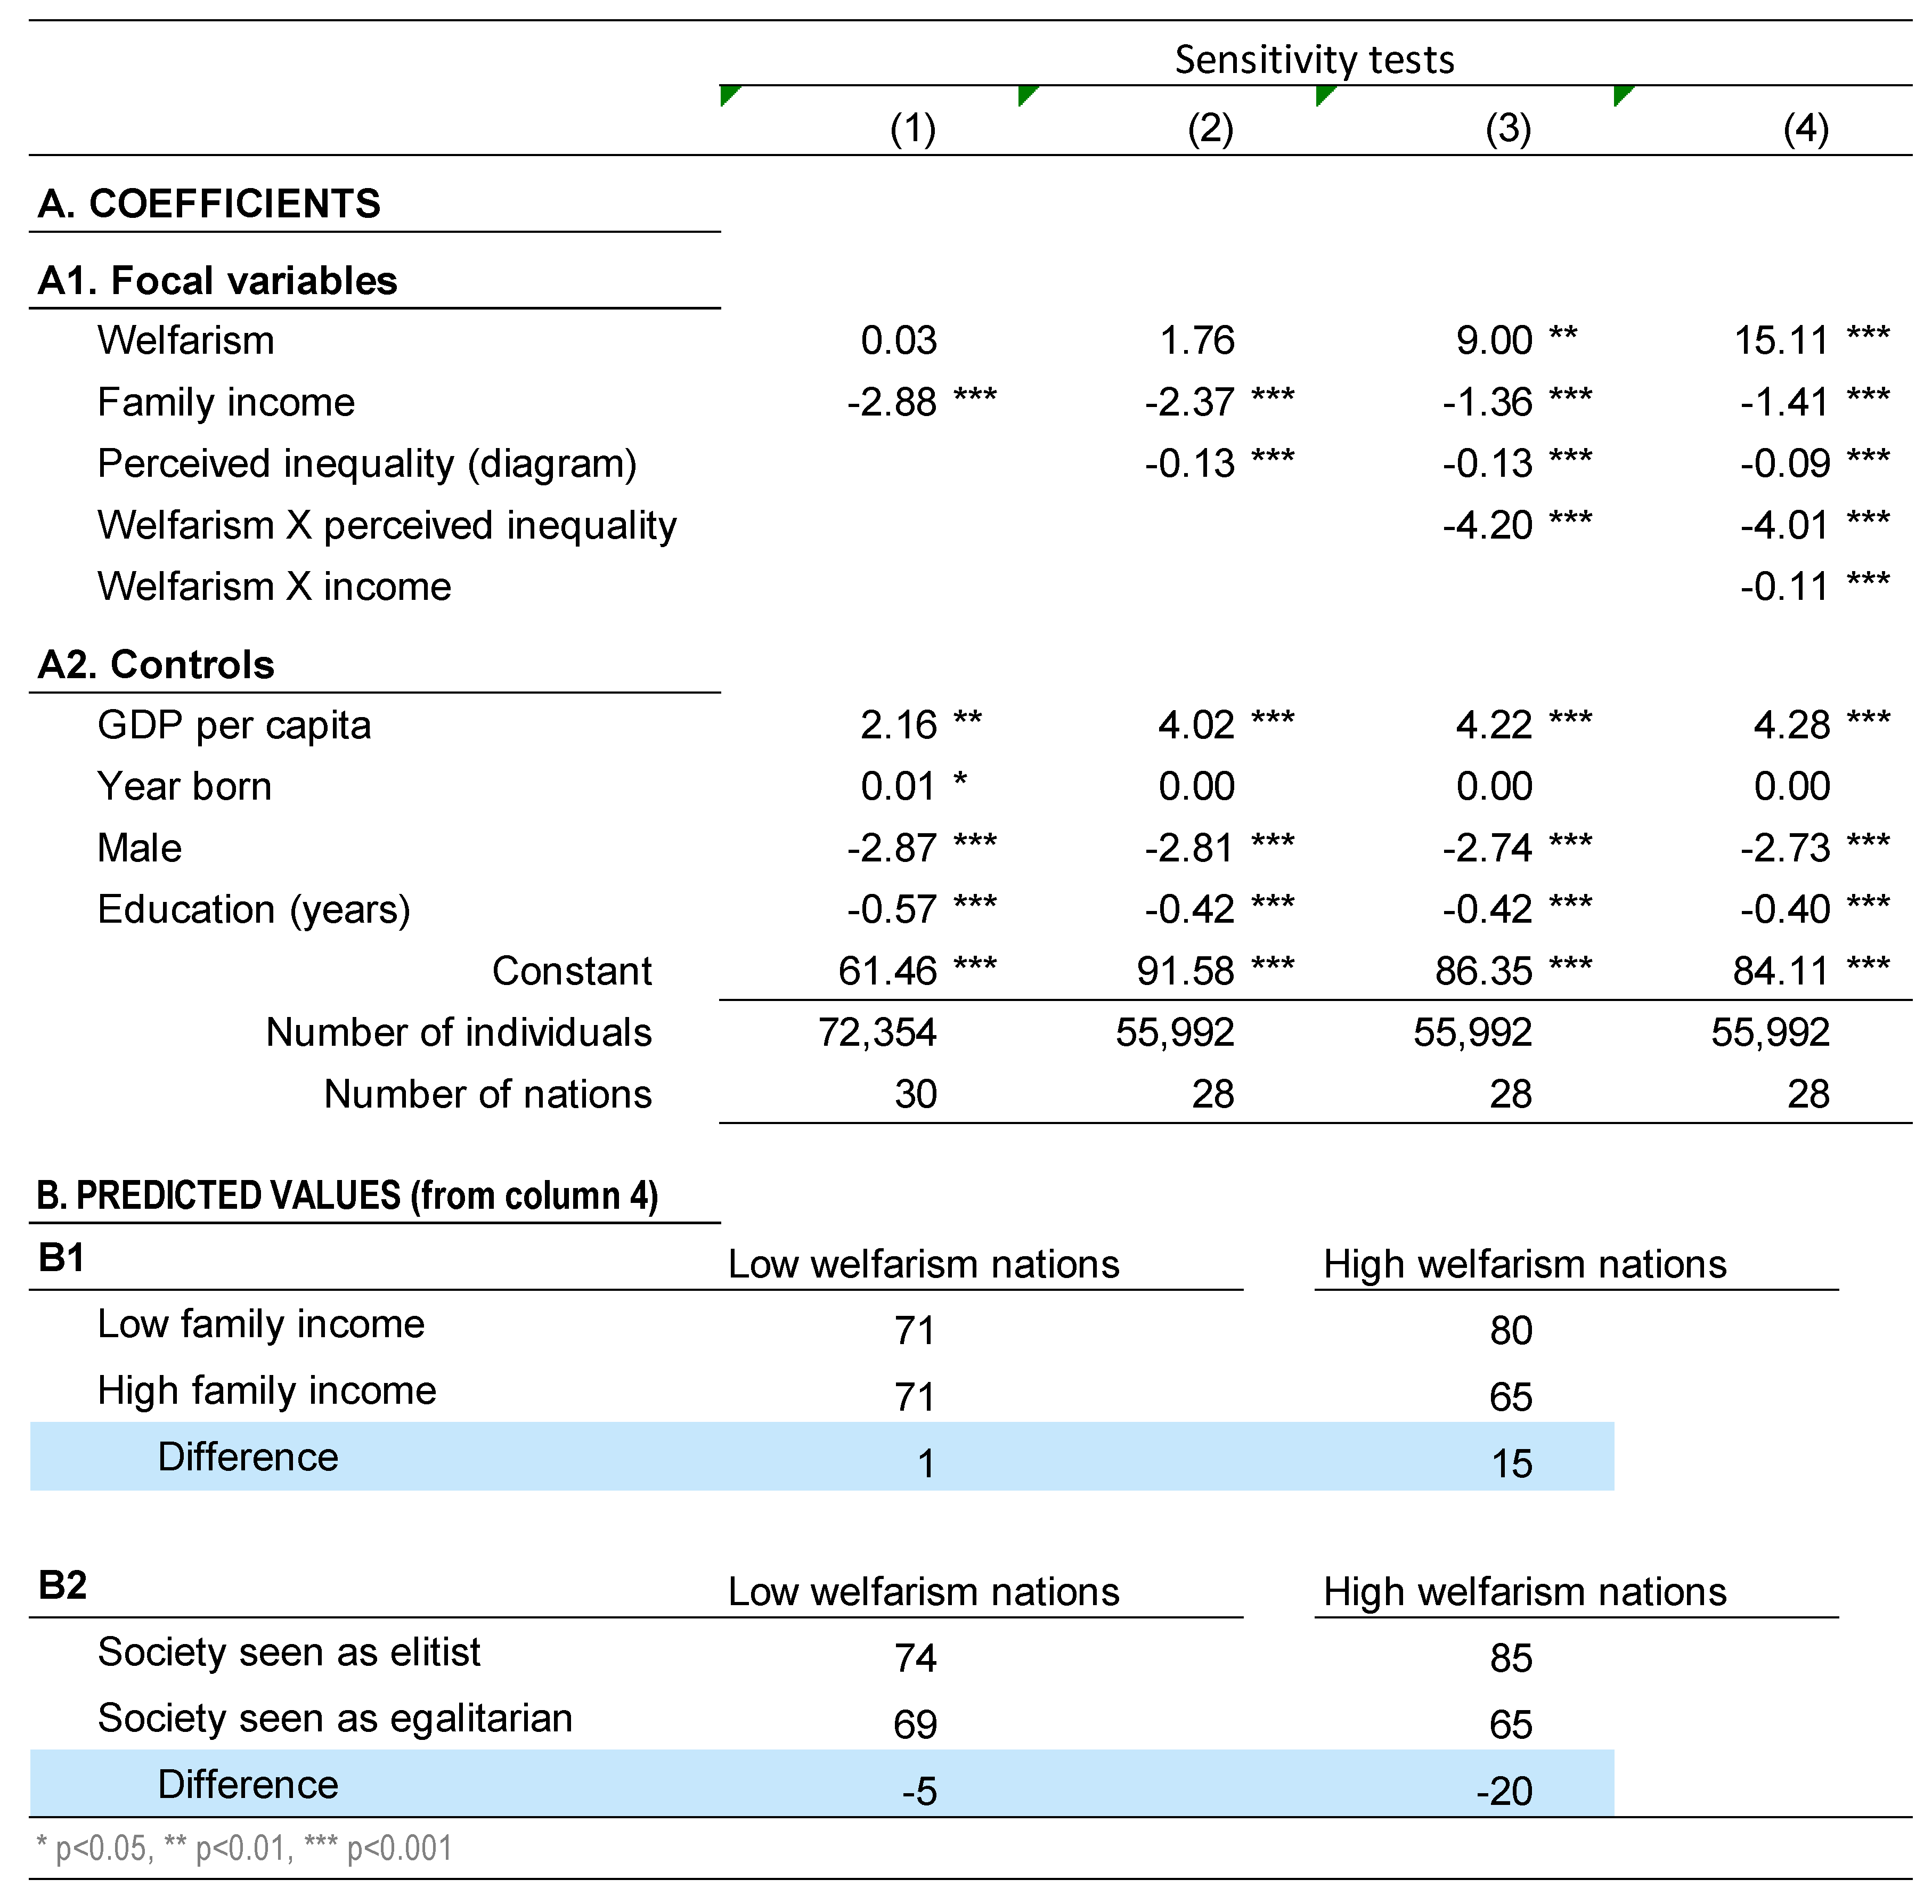
3.5.3. Redistribution: Effects of Individual SES and Perceptions of Inequality

Nor does controlling for individual-level variables make any difference to the welfarism story. Welfarism’s effect is not even close to statistical significance (z = −0.01, p = 0.98) in the multilevel model, not only for the welfarism scale as a predictor variable, but also for all the alternative single-item welfarism measures, except the Esping Andersen measure when not only the SES and demographic variables, but also perceptions of inequality and goals for it are entered into the equation (Figure 14). The balance of the evidence is that the strength of the country’s welfare state and the degree of support for redistribution among the nation’s residents are unrelated.
Notice that the augmented multilevel model (Figure 14, column 2) reveals significant effects of perceived and ideal/normative inequality not only for the core model using the welfarism scale as a predictor, but also for the sensitivity analyses using the other welfarism-related measures. People who perceive there to be little inequality are less supportive of redistribution: Those who see the most inequality are fully 13 points out of 100 more supportive of redistribution than are their peers who see the least inequality (Figure 14, Panel 2). This is a moderately tight relationship with a standardized regression coefficient of −0.17. There is also a smaller and weaker, but statistically significant, impact of goals/ideals: The (many) people who see the highly prosperous egalitarian society as ideal are a little more strongly attracted to redistribution compared to their (few) peers who prefer less egalitarian societies.
Atomistic economic self-interest and/or adherence to economically homogeneous reference groups also raise their heads in the form of significant, albeit small, impacts of education, occupation, and income on support for redistribution. Perhaps not surprisingly, support for redistribution is substantially more tightly linked to income, ceteris paribus, than to education or occupation (moderately important standardized regression coefficient of −0.13 vs. half that for education and occupation).
The analysis done separately for each country is shown in Figure 15.
Figure 15 provides summary country-by-country differences, with the countries substantially more supportive of redistribution than expected from the worldwide pattern shaded blue and the countries substantially less supportive than expected shaded red. We estimate the model separately by country, so, of course, it does not include welfarism or GDP. Not surprisingly, given the prior evidence of diversity, countries vary widely. Some are much what one would expect based on the regression line, e.g., Taiwan, Ireland, Belgium, Japan, the UK, Sweden, and West Germany are all within three points of the regression line. At the other extreme, Portugal, France, and Turkey are more than 10 points more supportive of redistribution than would be expected whereas Canada, the Philippines, Denmark, Canada, and the USA are at least 10 points less supportive that would be expected. On average, the mean attitudes in the English-speaking countries are 10 points less supportive than would be expected.
The income results demand closer scrutiny.

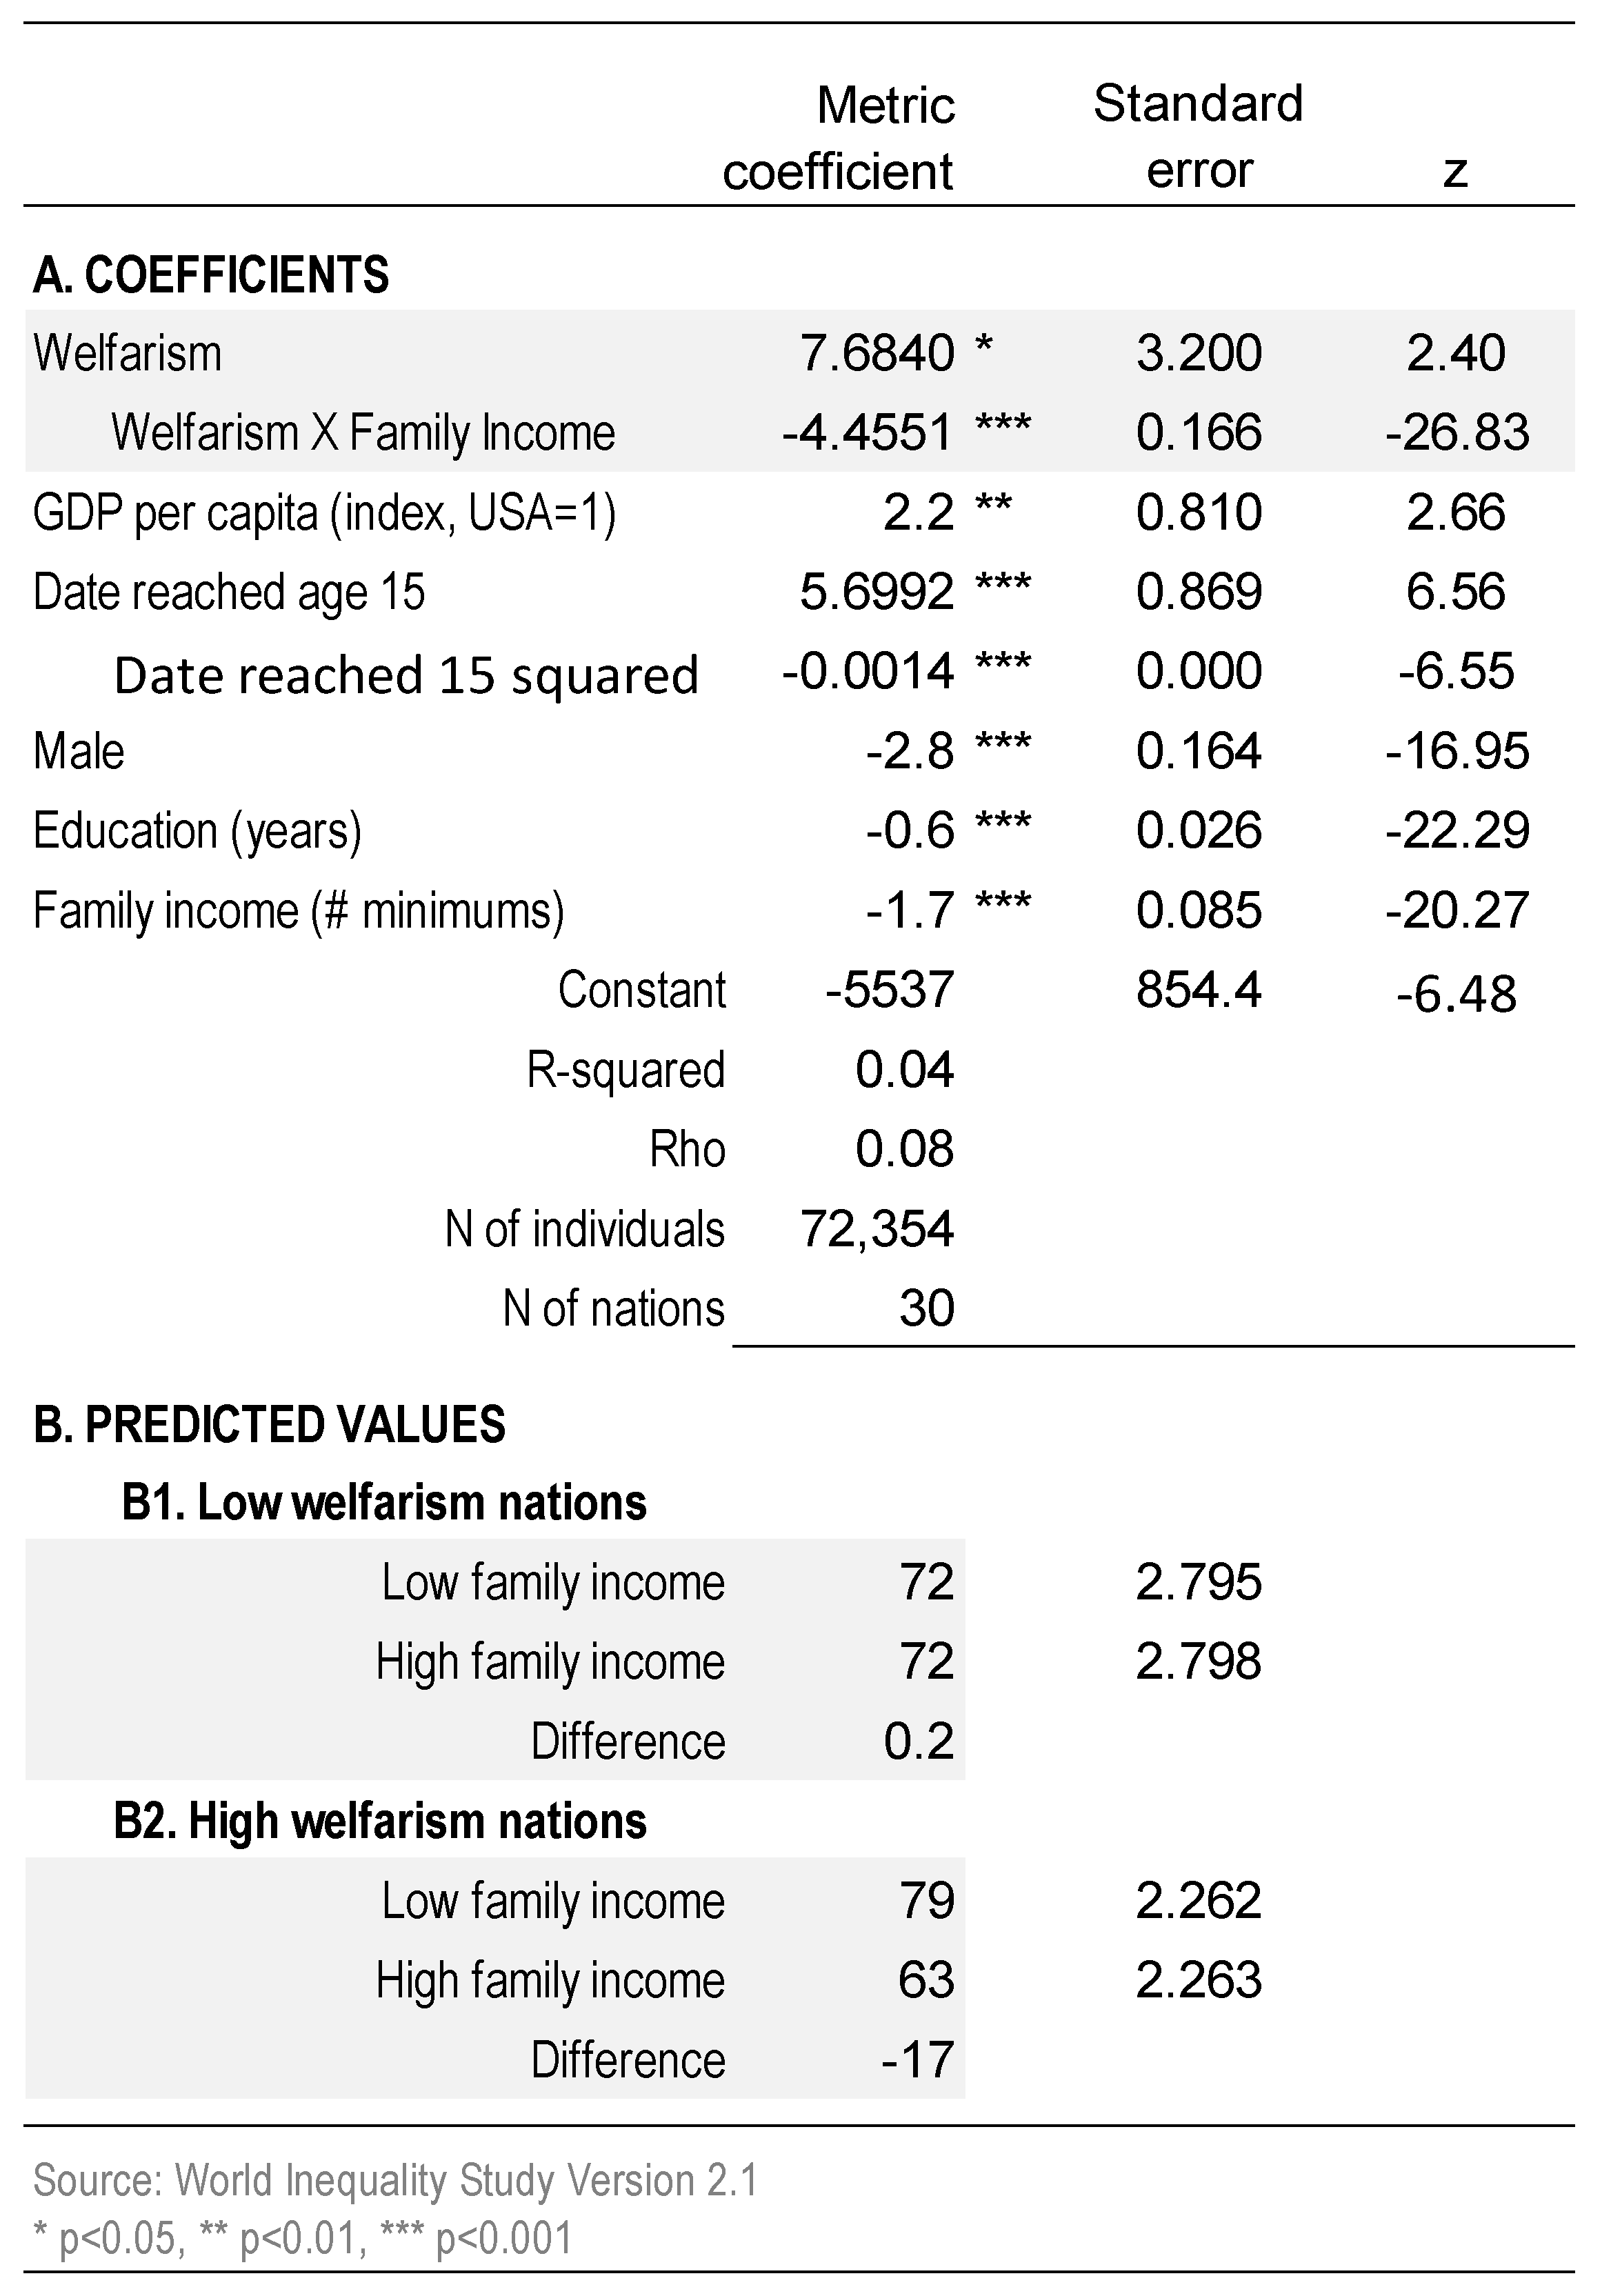
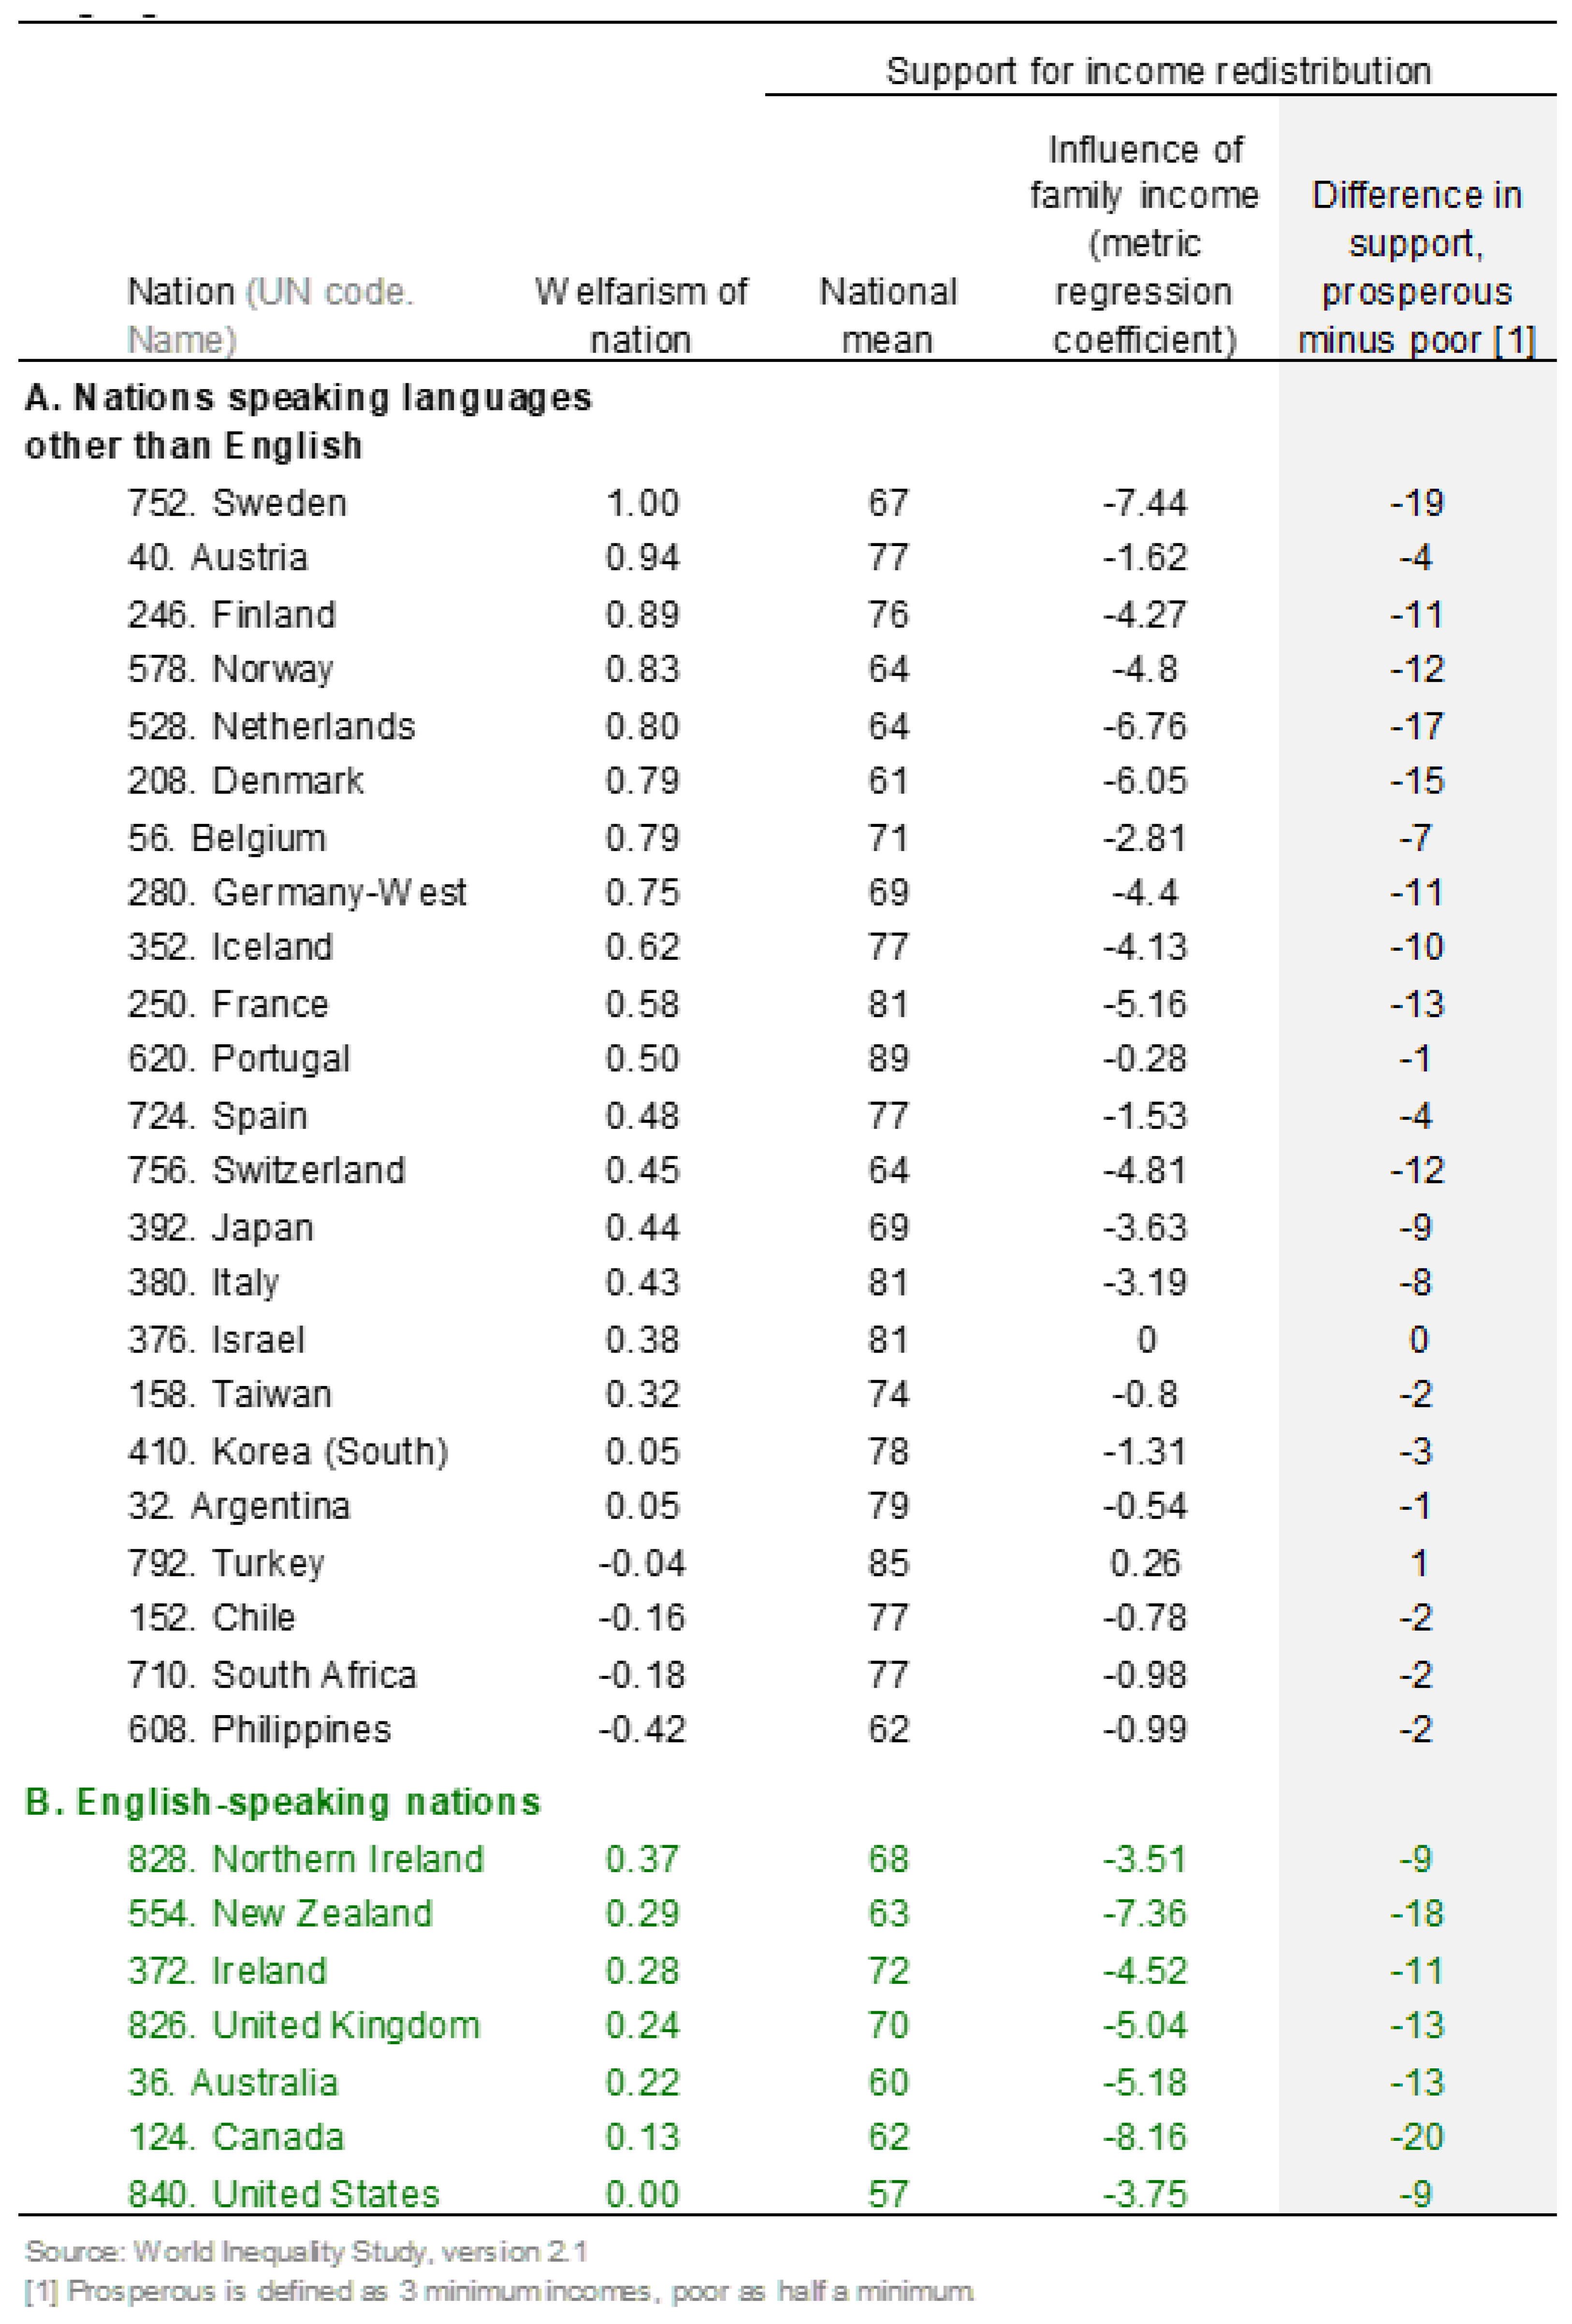
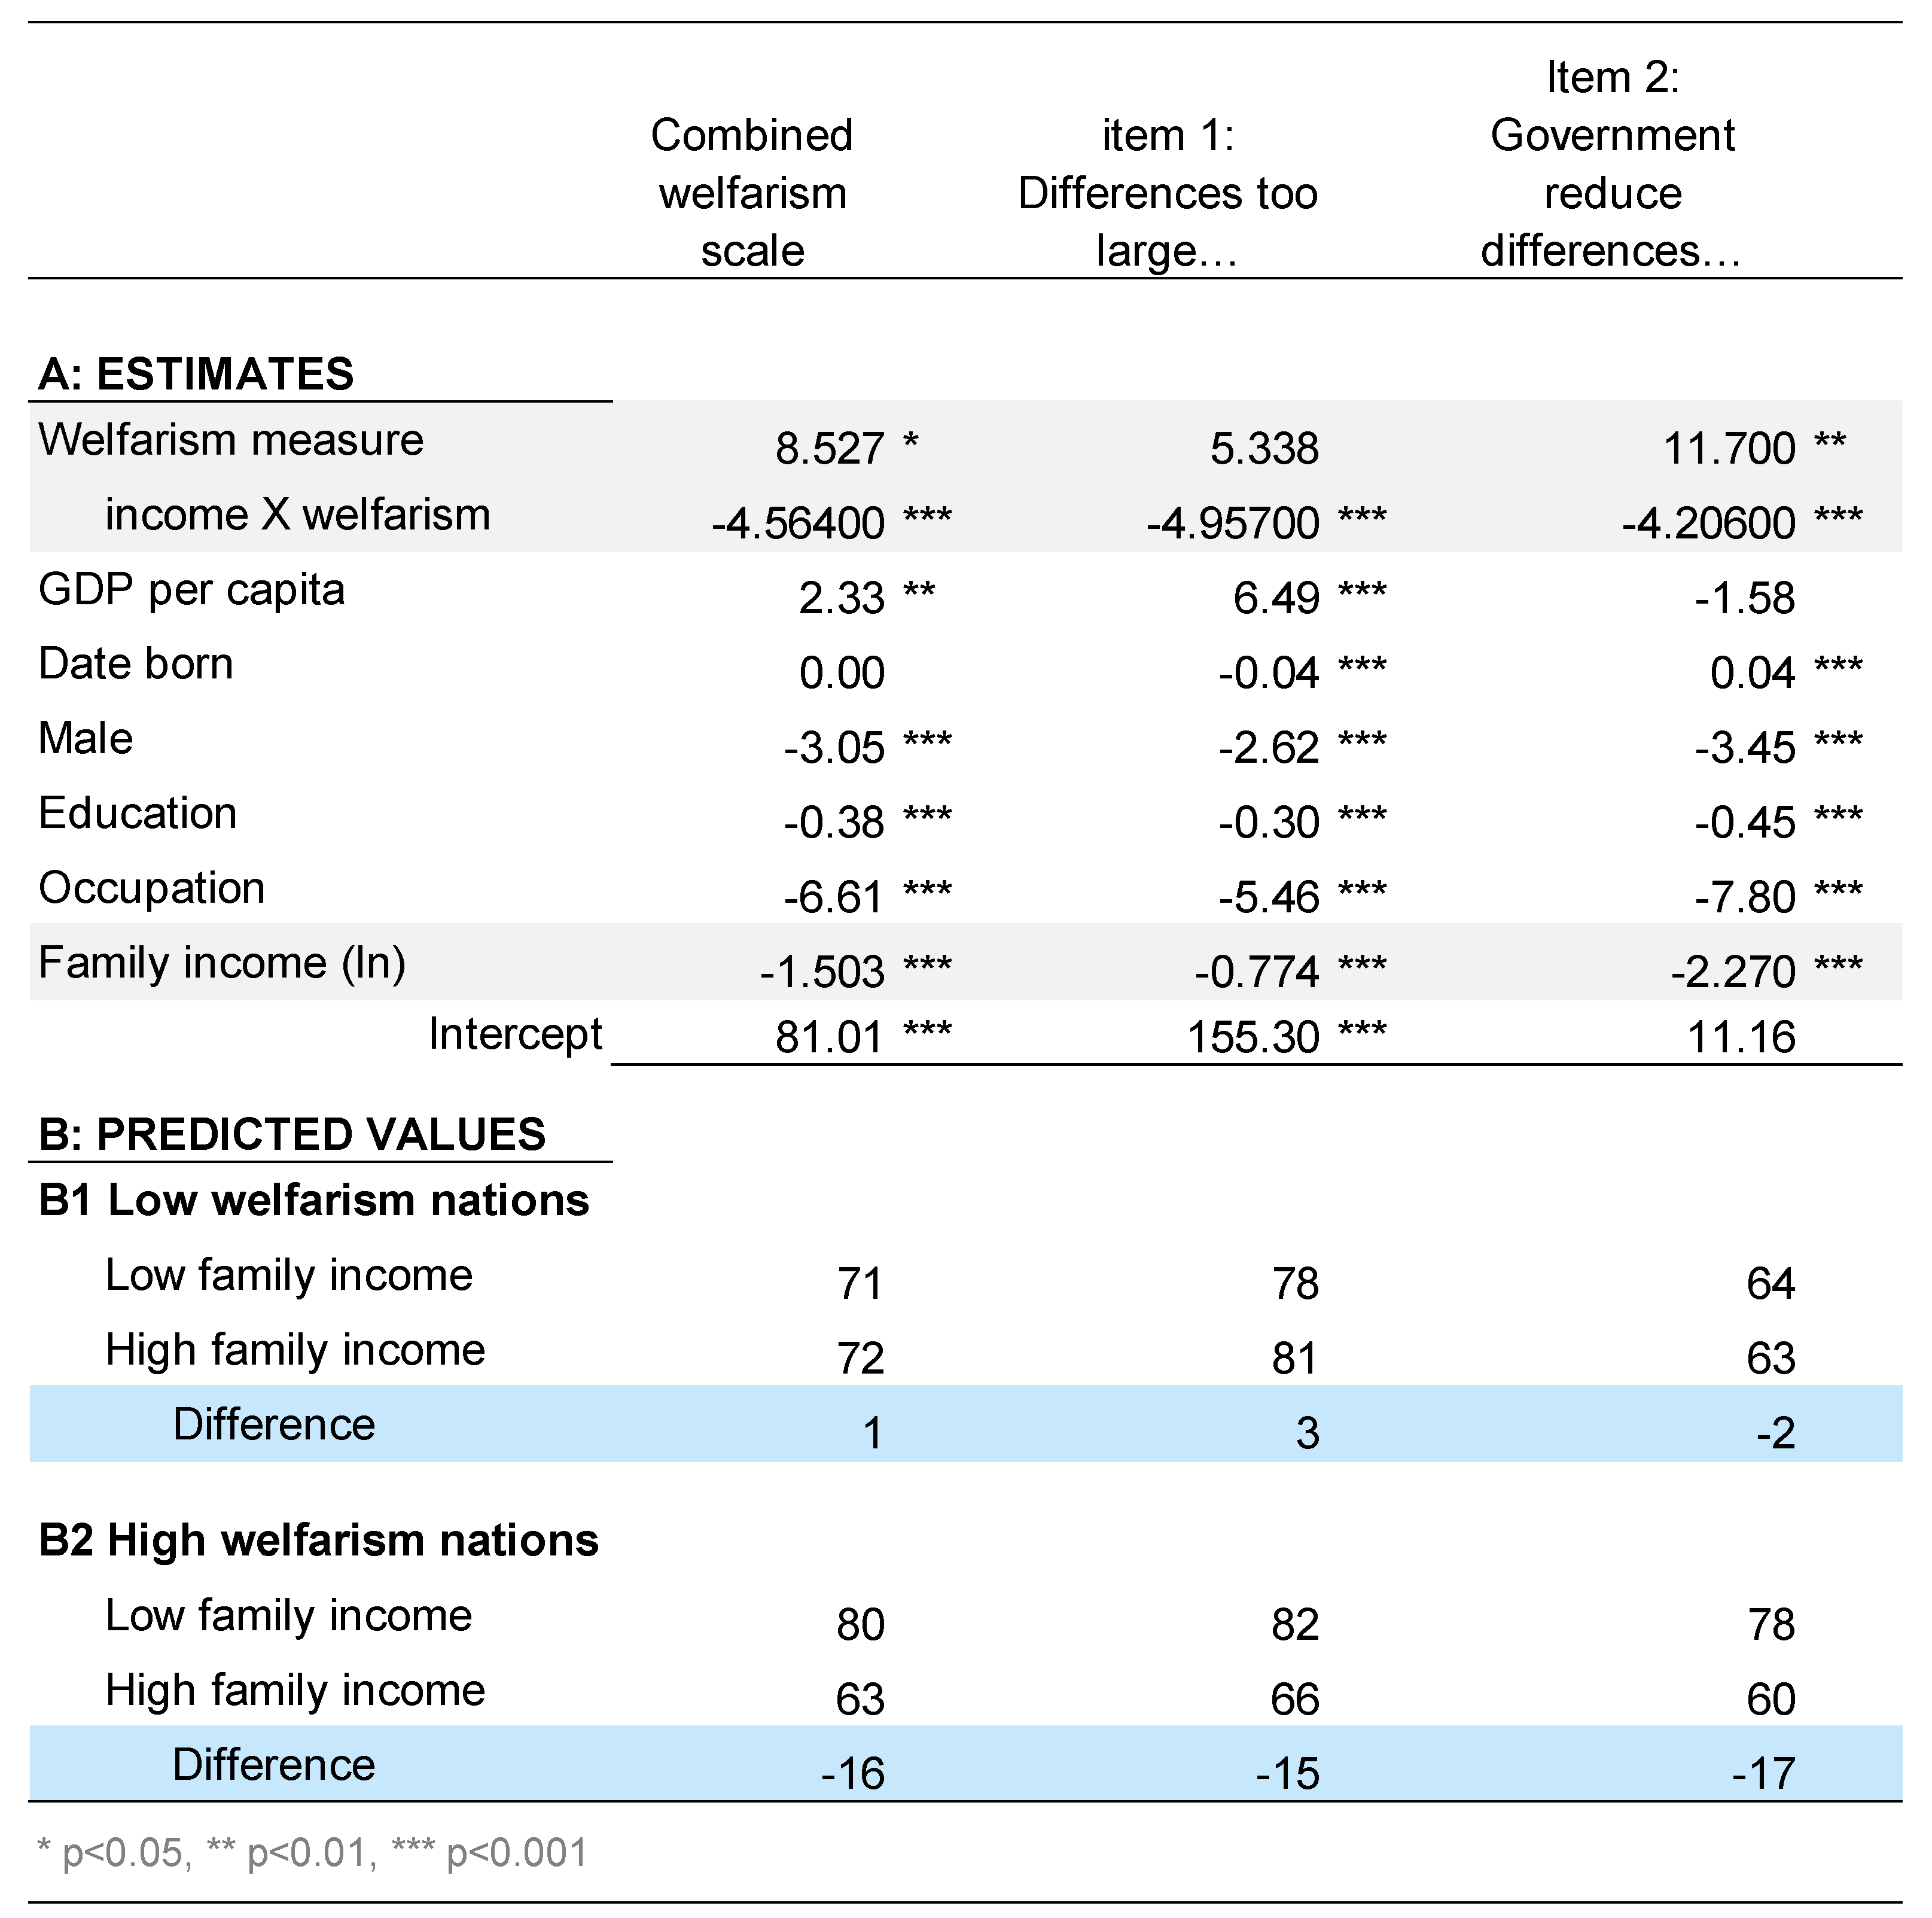
3.5.4. Harvest Fatigue among the Prosperous?

Digging little deeper, we find that the overall results mask an important interaction of affluence with welfarism in predicting support for redistribution. The analysis is shown in Figure 16, but its implications are more easily seen graphically in Figure 17. In the least welfarist countries, the prosperous and the poor support redistribution to the same degree, at around 72 points out of 100. That is near the mild “agree” answer, with a 95% confidence interval of 66–77. However, as welfarism increases, the attitudes of the prosperous and the poor diverge. For the most welfarist societies, the poor are even slightly more supportive of redistribution than are their peers in the most market-oriented societies (76 to 79 versus 72), but support in the strong welfare states declines rapidly with affluence to a nadir of 58 points for very prosperous people on four minimum incomes. In the most welfarist countries, there is a 21 point (out of 100) gap between the poor on half a minimum income and the affluent on four or more minimum incomes.
The implications of the interaction of welfarism and income are much clearer when we graph their predicted values (from the multilevel regression including all the controls). Figure 17 gives these results.
The same pattern appears when, instead of our preferred combined welfarism scale, alternative measures of welfarism (social spending, corporatism, the Esping-Andersen index) are used instead (Appendix E, Figure A9).
All in all, this is an impressively clear interaction: The views of the poor differ little across the whole span of welfarism, but the matter is very different for the prosperous. For the very well-to-do on 4 minimum incomes, support for redistribution is 17 points out of 100 lower in the very strong welfare states compared to the most market-oriented societies (Figure 17). In other words, the experience of living in a strong welfare state has little impact, if any, on the redistribution attitudes of poor people: They are moderately supportive of further redistribution whether they live in a country with a meager welfare state, a country with a strong welfare state, or somewhere in between (albeit with a possible small gain in appetite for redistribution as welfarism strengthens).
However, the experience of their more prosperous peers is very different.
Very affluent people in market-oriented societies are mildly supportive of income redistribution, with predicted values near 72, very near their peers who are just getting by financially (dashed bar in Figure 17). By contrast, higher income earners in strong welfare states are much cooler towards further redistribution than are the poor in their country (63 vs. 79). Indeed, they are cooler towards further redistribution than are high income earners in market-oriented societies (63 vs. 72). Otherwise put, as welfarism increases, the higher one’s income, the less one supports additional redistribution.
This means that the disagreement over redistribution increases as the welfare state strengthens (remember that as welfarism increases, inequality decreases, as we reviewed earlier). In other words, there is consensus among people across the spectrum of income in the market-oriented societies that income redistribution would be a mildly good thing, but, as welfarism grows, the income gradient of support begins to emerge, morphing into a strong downwards tilt in the strong welfare states.
Thus, atomistic egocentric self-interest and/or reference group interest emerge among the prosperous in the welfare state. In addition to this interaction between welfarism and income, there is an analogous cross-level interaction between welfarism and perceptions of how egalitarian society actually is (Appendix F: Figure A12). As with the income interaction, inequality perceptions matter a good deal in strong welfare states but hardly at all in market-oriented nations. Thus, perceiving society as unequal is an important stimulant to support for further income redistribution in countries with strong welfare states, but is unrelated to redistribution attitudes in low welfarism countries. Comfortingly, estimating both interactions simultaneously does not change the picture. In particular the welfarism-family income interaction in that pooled model (column 4) leads to much the same predicted values as those we have just seen in the figure above.
From a slightly different angle, let us explore the income gradient of attitudes towards redistribution for each of our countries separately (Figure 18). Not surprisingly, given the prior evidence of diversity in redistribution attitudes, countries vary widely. Considering first the countries speaking non-English languages, these differences between the affluent and the poor range from 0 in Israel to 19 in Sweden (Figure 18, column 4). Countries’ attitudes form a gradient roughly paralleling their welfarism scores, with differences between the affluent and the poor, being generally small in countries low in welfarism (e.g., S. Korea, Turkey, the Philippines) and growing as welfarism rises, albeit with considerable variation. The English-speaking countries have middling to steep income gradients (consistent with the view that class matters more in Anglophone countries [104,131], but the size of the differences within this group appears to be unrelated to welfarism.

3.6. Exploratory Case Study: Separating Individual-Level Effects into Egotropic and Sociotropic Influences

The great strength of comparative cross-national analysis for this kind of investigation is the broad spectrum of welfarism that it allows us to investigate. But this has a real cost in the richness of the explanatory mechanisms we can explore. Some progress toward richness can be made by focusing in on a dataset that is rich in explanatory variables: the International Social Science Survey Round 20, USA 2016–2017 (details in Appendix G). There are 2477 cases. The redistribution-attitudes scale is the same as in the international data, the full five-item version.

3.6.1. Family Background and Demographic Characteristics’ Total Effects

To begin, we examine the effects of the individual’s family background and enduring characteristics, what we might call deep background (Figure 19, Panel A). Here, the assumption of causal direction is justified, although the possibility of upward biased coefficients because of omitted variables bias needs to be kept in mind [44,105].
The dominant deep background effect is of parents’ political party affiliation: There is a strong link, net of other background variables: People raised in Democrat homes are more favorable to income redistribution. The standardized regression coefficient is in the strong range at 0.21 and is highly significant.
Age (or cohort—they are indistinguishable in a single cross-section) has a moderately strong relationship with redistribution attitudes, as shown by its statistically significant standardized regression coefficient of −0.11: Older people are less supportive of further redistribution, all else equal. Gender has a statistically significant but weak effect (standardized regression coefficient of −0.06) such that men have a weak tendency to be less favorable to the welfare state than are otherwise similar women, a result not surprising in light of prior research indicating null or weak effects of gender on welfare-related issues where, if an effect exists, women are a little more favorable.
Parents’ stratification position as indicated by their education and occupation fails to significantly impact redistribution attitudes.

3.6.2. Socioeconomic Status, Class

Taking respondent’s current socioeconomic situation into account boosts the R2 from 0.06 to 0.10, without much change to the effects of deep background. Net of other influences, education has a weak, but statistically significant, effect. Attitudes towards redistribution are fairly widely dispersed at all educational levels, but through that dispersion we can nonetheless discern a positive relationship: The more educated you are, the more you tend to support redistribution. Net of the other SES variables, job quality/occupational status has no effect on attitudes towards redistribution (for brevity, this is not a fully staged path model). Subjective social location/class has by far the strongest effect thus far, as shown by its standardized regression coefficient of −0.17: The higher you see yourself in the social structure, the less supportive you are of income redistribution; the lower you see yourself in the social hierarchy the more supportive you are of income redistribution.
In addition, income somewhat reduces support for redistribution, having an effect towards the top of the weak range (statistically significant standardized regression coefficient of −0.09). Prosperous people are less supportive of redistributive policies; poor people are more pro-redistribution, but the effect is not strong.
Both of these would seem to reflect self-interest (egotropic considerations) and have often been so interpreted in past research. But that is an error, as we shall see shortly. Later in the analysis (columns 4 to 6) these effects disappear, revealing that income and subjective class have only indirect effects through their link to perceptions of society and social processes (sociotropic concerns, rather than raw self-interest).
Next, we add in a clear measure of perceived short-term self-interest in redistribution: This is from a single (novel) question:
“If America BECAME MORE EQUAL than it is now, how would that affect your position?”
Raise me MUCH HIGHER UP with far fewer people above me and many more below
Raise me a LITTLE HIGHER UP, not quite so many people above me and a few more below
NO CHANGE for me
Leave me a LITTLE LOWER
Leave me MUCH LOWER
The great majority believe they would personally gain from income redistribution (65%), or at worst break even (29%); only a handful think they would lose (6%). This item adds substantially to the explained variance, raising it by about half from 0.10 to 0.15. The effect is in the strong range, as shown by the significant standardized regression coefficient of 0.23. It is now the dominant influence in the model.
The causally prior influences have mostly dropped slightly, with the main change being that the influence of subjective self-placement has declined by between a third and a half. That suggests that a big part of the influence of subjective social class is where it places you in a potential conflict over resources from the welfare state, whether you think you stand to gain or lose if the welfare state expands.
At this point there is evidence for both self-interest (via the explicit question) and for reference group interest (via the significant remaining effects of income and subjective social class after the egocentric influence is filtered out of them by its separate inclusion).

3.6.3. Ideology: Perceptions of Society

Consider next the influence of perceptions of the societal processes of income determination and income distribution—views about how the socioeconomic world works, especially functionalism, perceptions of meritocracy, and perceptions of corruption (Figure 19, Panel D, in blue). Measurement details are in Appendix G.
Including these perceptions provides a massive boost to R-squared up to 0.473, roughly triple what it was in the previous model. Thus, attitudes to income redistribution have mainly to do with general perceptions of how society works and what is perceived as in the common good—in short societal schemas and political ideology more than family background, socioeconomic status, or simple self-interest.
Folk functionalism. First, there is a very strong effect of perceptions of the role of income and income inequality as an incentive in human motivation and the smooth operation of society, a sort of folk version of traditional sociological functionalism [132] and the vast and disputed literature that flows from that, and its elaboration in neoclassical economics. We measure functionalism with a three item scale with a good Alpha reliability of 0.79; item wording is in Appendix G.
Attitudes towards redistribution are tightly linked to these folk functionalist perceptions, with a standardized regression coefficient of −0.38 (Figure 19, first line of Panel D). That is well up in the important range and makes it by far the dominant variable in the model.
Meritocracy. Perceptions of meritocracy matter, too—the idea that the poor have the capacity to do well and that the economy rewards merit and hard work (second line of Panel D). This is measured by a six-item scale with an excellent Alpha reliability of 0.91. It is a moderately strong influence on redistribution attitudes, with a standardized regression coefficient of 0.18. Conversely, perceiving that the poor face barriers or that they lack the capabilities or capacities to avail themselves of opportunity tends to enhance support for redistribution: If the attainment game is not fair or some players cannot avail themselves of it, then there is a legitimate claim on others’ resources [133].
Corruption. The perception that the rich succeeded by corrupt means (a three-item scale, Alpha reliability 0.87) is also a moderately strong influence on redistribution attitudes, with a standardized regression coefficient of 0.18. Perceiving that the processes through which people get rich involve corruption encourages one to take a moderately more supportive stance toward redistribution: Why, indeed, should people get to keep what they have taken by unjust means [134]?
Including this and the other perceptual variables absorbs all the effects of SES. And it seems that about half of the influence of parents’ party affiliation and half the influence of age/cohort flow through the schemas through which they enable/constrain us to view the social world.
In particular the apparent self-interest reflected in income and subjective social class (Panel B, last two lines, in red) are shown to matter only because they are linked to perceptions of society and the general good: sociotropic, not egocentric, despite how they are usually interpreted.
Finally, perception of how equal the income distribution is (using the diagrammatic question discussed earlier) also matters a little: The more equal the perceived distribution, the less the support for redistribution. This effect is significant (probably real), but weak, 0.07.

3.6.4. Inequality Preferences

Redistribution, of course, is a means to an end, not an end in itself, so it makes sense that people’s goals/preferences/ideals should shape their attitudes towards redistribution: If one seeks a more equal society, one is more likely to endorse redistribution, because redistribution is a mechanism for achieving that goal. The theory of the importance of these goals for society is sometimes referred to as “values” theory (ably summarized in [19]). This survey includes a number of social goals and including them lifts the R2 from 0.47 to 0.52 (Panel E, in green).
One angle on egalitarianism focuses on earnings, specifically the amount of earnings respondents sees as legitimate for high and low status occupations (prior research has long established that these are separate dimensions [104,135]. Seeing as legitimate relatively higher earnings for low status occupations has a significant weak positive effect (0.07) increasing support for income redistribution: If low status workers have a legitimate claim to higher earnings, then support for redistribution rises. There is also a separate weak effect of ideal earnings for high status occupations: the higher the legitimate pay for the occupations, the less the support for redistribution.
One’s ideal income distribution also has a weak, but probably real influence at 0.06: The more egalitarian one’s goal, the more one tends to favor redistribution, although redistribution attitudes are fairly widely dispersed at each point on the spectrum of egalitarianism. That makes sense, but it is not a foregone conclusion, because in theory you might prefer other mechanisms to achieve that goal.
It is striking that attitudes to income redistribution do not much reflect preferences for income inequality (Panel E, in green). Instead they largely reflect ideology and perceptions of what is in the general good (Panel D, in blue).

3.6.5. Party Politics

Finally, we augment the model by adding in current political party affiliation. This boosts the R-squared to 0.55 and reveals a strong party affiliation effect of 0.23. Including this variable induces slight reductions in the importance of some of the variables significant in prior models, but leaves all of them significant except parents’ political party which becomes near-zero and not statistically significant: Parents’ party shapes the schemas through which you interpret inequality and politics and attracts you to their party, but does not have an effect above and beyond that.
Importantly, net of deep background, net of current SES, net of perceived self-interest, net of perceptions of inequality, net of the status attainment process, and net of goals for society, political party affiliation has a significant impact on redistribution attitudes, with Democrats, of course, favoring redistribution.
Future research will, we hope, be able to assess where these same results hold and where they differ. We have seen that in this one English-speaking market-oriented nation, people’s evaluations of income inequality are strongly driven by the perceived good of the nation as a whole—sociotropic concerns—predominate, especially perceptions of meritocracy in the labor market, images of corruption, and belief in the functionalist necessity of inequality. By comparison, egocentric concerns matter little in evaluating income inequality. Most people believe they would gain from redistribution and some for that reason favor it. It would be especially interesting to compare and contrast these results with strong welfare states where tax, spending, and redistribution are more extensive and more transparent with one pressing question being whether prosperous residents in strong welfare states are turning against the idea of further redistribution because they perceive themselves to be substantial net donors, or because they perceive that further redistribution would be detrimental to their reference group, or because of the stance they take on sociotropic concerns, especially meritocracy, corruption, and folk functionalism.

4. Discussion

4.1. Summary

  • The real world performance and ideology of strong welfare states does NOT persuade their citizens to support income redistribution any more than is common for citizens of countries with weaker welfare states.
  • Income is unrelated to support for redistribution in market-oriented societies: All across the income spectrum, mild support for redistribution is the dominant attitude.
  • By contrast, where welfarism is stronger, income differences emerge. Affluent citizens of strong welfare states are less supportive of income redistribution than are the poor in their societies. They are even less supportive than are equally affluent citizens in liberal, economically conservative nations.
  • Case study results suggest that sociotropic concerns tend to be dominant in the formation of attitudes towards income redistribution.
We make four contributions to this flourishing area of investigation. (1) First, we establish the veridicality of the general public’s perceptions of the shape of inequality in their society and discern their inequality ideals. (2) We widen the scope of analysis of welfare- state-related attitudes to include a broader range of countries, demonstrating that the same attitude structures and patterns of relationships hold more widely than has previously been known. (3) We strengthen prior analyses of redistribution attitudes by providing supplementary evidence of their reliability and coherence from a survey including additional relevant items. These analyses demonstrate excellent measurement properties of even a short redistribution attitudes scale. Attitudes typically mildly support redistribution. There is markedly less diversity among countries in mean attitudes towards redistribution than there is in the strength of their welfare states. (4) Our multilevel models controlling for potentially confounding individual-level characteristics and for socioeconomic development reveal little or no alignment overall between welfarism and redistribution attitudes. That lack of alignment is probably real because the power of the test is strong and the quality of the measurement is good. Nonetheless, this masks important differences which are likely to be important in future research: (5) In strong welfare states, people on high incomes are markedly less supportive of redistribution than are their less prosperous fellow citizens and are markedly less supportive than are their equally prosperous peers in more market-oriented societies/liberal welfare states. We suggest that further research into socially differentiated influences of welfare state strength on attitudes may yield stronger findings than the search for generalized impacts. This points to the importance of institutions as inadvertently creating niches that help to form social groups with identities and distinctive interests.

4.2. Implications

Welfarism differs widely around the world. Bringing a broader range of countries into this research tradition importantly not only reveals that the disconnect between welfarism and general public opinion on income redistribution holds far beyond the bounds of Europe, but that this overall lack of relationship conceals that individuals’ incomes have a strong effect contingent upon the institutional environment, specifically upon the country’s degree of welfarism: Income has no effect in the market-oriented societies, but the effect emerges and grows as welfarism increases until it has quite a substantial effect in the countries with strong welfare states. Our sensitivity analyses show that results for Europe closely parallel results for societies across the world and across the spectrum of levels of welfarism.

4.2.1. Inequality

As background to assessing redistribution attitudes, analysis of inequality images reveals that people have veridical perceptions of the shape of inequality: Compared to residents of market-oriented countries, the general publics of strong welfare states accurately perceive their countries as having little inequality. Note that the demonstrated veridicality of perceptions of inequality imagery is in contrast to prior research suggesting that people underestimate the numerical magnitude of income inequalities [136,137], but consistent with prior research on 4 northern European countries suggesting that broad inequality perceptions are closely aligned with actual income inequality [49]. It seems likely that people correctly perceive the shape of the income distribution, but underestimate the magnitude of high incomes. Finding veridicality of inequality images supports our original H1 that perceptions of the shape of inequality are veridical.
In contrast to these perceptions, however, is an ideal income distribution indicative of a prosperous egalitarian society. Indeed, people in all the countries in the study have a preference for a society shaped like a traditional spinning top. This ideal society would have an income distribution with broad shoulders and only vestigial lower limbs. Thus, ordinary people correctly perceive very different degrees of inequality according to the strength of welfarism in their societies, but there is near unanimity in embracing as ideal a kind of egalitarian upper middle class society. We began with no specific hypothesis about people’s ideal income distributions, but the general hypothesis of no alignment (H3) is supported in this domain: welfarism is not aligned with income distribution ideals.
Note also that the broad consensus on the egalitarian ideal is contrary to dominant ideology and system justification theories [22,25,26].
The gap between the (correctly perceived) degree of inequality in their society and their ideal declines strongly with welfarism: There is a yawning gulf between the two in the market-oriented countries and a much more bridgeable gap in nations with strong welfare states.
The fact that the ideal social class composition/income distributional profile of society is an egalitarian middle or upper middle class society nearly across the board for our wide range of societies is consistent with some theories of earnings justice positing an underlying preference among humans for limiting inequality [138,139,140]. This can be reconciled to evidence that the public substantially supports unequal ideal pay for high and low status occupations [104,135,141,142,143,144,145] by noticing the finding that the egalitarian middle to upper middle class societies are seen as ideal: There would be rather little actual occupational earnings dispersion in such a society, because the occupational composition would be concentrated in a high narrow range.
Since it is substantively plausible that welfarism shapes perceptions of inequality (this is a total effect), since it actually reduces inequality and people’s perceptions of the shape of inequality are veridical, and because the reverse causal direction is substantively absurd (e.g., because people just happen to imaginatively perceive decreasing inequality, they create increasingly strong welfare states), we are justified in proposing a unidirectional causal hypothesis (with no reciprocal causation) for future research:
Images of inequality hypothesis:
The stronger the country’s welfarism, the less inequality will its people perceive.
Scope limitation: Perceived inequality here is defined here as imagery of the shape of inequality. Results could differ with other measures.
Ideal social structure hypothesis:
There will be strong consensus across cultures and across social classes that an egalitarian upper middle class society is ideal.
Scope limitation: Restricted to societies at the GDPPC level of the Philippines in the 1990s or higher.

4.2.2. Redistribution

This background would lead one to expect much warmer support for redistribution in the market-oriented societies. A straightforward means-ends rationality hypothesis would hold that the further one has to go to reach a goal, the more strongly will one embrace the means to get one there. However, this expectation is defeated by the data, at least if we consider redistribution to be the means for achieving the goal.
Income redistribution appears to be equally popular across this diverse set of countries, regardless of the degree of welfarism (bivariate analyses at the country × time level). Further, taking individual-level SES and demographic influences into account does not change the story: The effect in the multilevel model is not statistically significant and, even if it were, the point estimate is too small to be substantively important. This appears to be evidence against H2 (strong alignment) and in favor of H3 (no alignment).
However, a closer look reveals a striking interaction: In the least welfarist countries, there is no income differentiation in support for redistribution: The prosperous and the poor alike mildly favor income redistribution, as also do people with intermediate incomes. But as welfarism strengthens, redistribution attitudes are increasingly sharply differentiated by income, because support for further redistribution holds nearly constant, or rises slightly among the poor, but falls sharply among the rich. In the most welfarist countries, the affluent on four or more minimum incomes are 22 points (out of 100) less supportive of income redistribution than are the poor on half a minimum income. Indeed, the affluent in the most welfarist countries are 14 points out of 100 less supportive of further income redistribution than are their peers in the highly market-oriented societies. Note that this evidence is not contrary to prior research indicating continuing widespread support for the welfare state model in the EU [146,147,148]. Instead, it most obviously implies that the prosperous do not favor further redistribution (not necessarily retrenchment). It is possible that this will herald emerging class-based conflict over further expansion [50], a matter that requires exploration in future research, as will the possibility that increasing welfarism leads higher income people to perceive other drawbacks of the welfare state in addition to high taxation. It is also possible that those higher in status and income have a clearer perception of the magnitude of inequality, so where that is smaller, they are less supportive or further reduction.
This result is clearly contrary to elite capture theories [149] which would predict especially intense opposition to redistribution in the least welfarist, most market-oriented societies [150,151].
On the other hand, the result that the lower strata’s demand for redistribution does NOT decline as welfarism (and actual redistribution) increases suggest an entitlement treadmill or increasing returns. The former argument is that individuals have “set points” for happiness that tracks their conditions, so they return to a fixed level of happiness even when their material circumstances improve markedly [152,153], although the evidence for this is decidedly mixed. By analogy, one could posit an “entitlement treadmill” in which the poor constantly ask for and receive more redistribution without ever achieving a feeling of justice, rather like Zeno’s paradox of Achilles and the tortoise. In this view, as welfare institutions grow and strengthen, poor people’s feelings of justice shift with the benefits they receive such that there is no norm for what is “enough” welfare. Demand never slackens, regardless of the strength of the welfare state. This is essentially a specific application of the theory of normlessness/anomie [34,35,154]—that institutional and structural changes can inadvertently induce visions of limitless possibilities. In this view, modernization could produce endless economic dissatisfaction because the normative “lid” on just incomes would dissolve [34,35]. An alternative view of this process is that individuals like what they get from the state: Individuals have a pre-existing taste or appetite for the benefits that the state provides and state provision stimulates the appetite for more state provision [155]. This predicts an ongoing positive feedback between state institutions and the lower socioeconomic strata’s demand for redistribution: the more they get, the more they want.
The result is consistent with the me-and-mine hypothesis that increasing welfarism stimulates “first dimension politics” where location in the social structure via self-interest and reference group processes dominates attitudes (a parallel argument has been made about a different dimension of social policy and its institutions [46]). More tentatively, the results in the exploratory case study suggest that reference group processes may be less important than in other domains: when we include a strictly self-focused measure of whether respondent personally would gain or lose from income equalization, it renders all the socioeconomic location effects statistically nonsignificant. However, perceptions of how society works remain both strong and statistically significant above and beyond this strict atomistic self-interest measure. Thus, attitudes towards redistribution are substantially driven by sociotropic concerns, but these appear to be defined in terms of the nation as a whole rather than in terms of reference groups. Prior research on the US also suggests a combination of influences of “sociotropic” (society-wide) and egocentric (or “first dimension”) economic perceptions and attitudes on political preferences, albeit with a different dependent variable [156]. Possibly the role of the reference group here is people generalizing from it to society as a whole: imagining that their social world is a microcosm of the larger society.
Alternatively, redistribution framing may play a role [11,28,157]: The legitimacy that welfare institutions enjoy encourages poor people to frame their experience in terms of redistribution and income entitlement for people in their group. As welfarism increases, poor people may increasingly feel that redistribution has benefited their group and may express this satisfaction as support for further redistribution. Basically this satisfaction keeps the apparent demand for further redistribution at the same level as (or even higher than) in less welfarist societies where support for (further) redistribution is actual support for more.
The causal direction seems clear. It is plausible that the stronger the welfare state, the more it frustrates resource acquisition by the affluent, both through limiting rewards to elite occupations and by heavily taxing earnings from these occupations, and the more deeply this undermines their support for further redistribution. On the other hand, the reverse causality is substantively absurd: Since rich people in some countries just happen to be opposed to redistribution, they build very strong welfare states. This reasoning enables us to propose a unidirectional causal hypothesis:
Harvest fatigue hypothesis:
The stronger the country’s welfarism, the less will its prosperous residents support income redistribution as a policy.
Scope limitation: Prosperity and poverty are defined here as relative to a country-specific minimum-income base. Results could differ with other measures. It may only hold where the welfare state institutions have been in place for some years.
Note that this does not necessarily imply that prosperous people in strong welfare states are dissatisfied with the current balance of costs and benefits of their welfare institutions, but rather that they do not seek further redistribution [158]. This atomistic economic self-interest may, through rational choice processes, lead them to welcome a neoliberal turn in their country’s politics [50,159]. Recent research has raised the issue of net progressivity, or net gain/loss (including all taxes and all benefits) which is an intriguing matter for future research, especially when the necessary data become available beyond the 15 to 18 countries that have provided them thus far. This is likely to become an increasingly pressing issue as the normal processes of socioeconomic development shift increasing fractions of the population into higher education and middle to upper middle class jobs: Traditional Power Resources theory [54,160,161,162] posits a strong link between social class/group size and political success. Ongoing broadening upward trajectories in education and occupation will change class composition and, hence, increasingly shift the income distribution away from the bottom, locating the bulk of the population in the upper income brackets which, if present relationships hold, will mean at least increasingly stiff resistance to further income redistribution and, possibly, pressure to redesign social policy and its institutions
In addition to the focal results, results for some of the control variables are of interest. Net of other influences, low socioeconomic status enhances support for further redistribution, whereas high status reduces such support. These effects are highly significant statistically, so they are probably real, but the magnitude and the effect sizes are mostly very small indeed. With a standardized regression coefficient of 0.03, the relationship of education to support for redistribution falls into the too-weak-to-matter range (standardized effect < 0.05); occupation’s 0.06 puts it in the weak range (standardized effects 0.05 to 0.10), and income’s effect squeaks into the somewhat important range (standardized effects in the range 0.10 to 0.20). These effects, of course, are not necessarily strictly atomistic economic self-interest, but rather could also reflect micro-environments of opinion formed around homogeneous reference groups sharing these characteristics. In a recipe, you might describe this as a “pinch” of self-interest, in the main dish of redistribution attitudes.
All of this is cold comfort for many familiar theories. Our general findings are not consistent with structuralist/materialist theory, nor with simple dominant ideology arguments, nor with system justification arguments, nor with theories positing the moral/normative leadership of social policy and the welfare institutions that implement it. The findings are, however, at least somewhat consistent with a legitimate framing hypothesis, with a loose constellation hypothesis, with an individual interest hypothesis, and with a reference group solidarity hypothesis (or with their combination in the “me-and-mine” hypothesis). The consequences of welfare state policies are diverse and complex: They demand further investigation, especially of the potentially differential effects of welfarism for individuals differently placed in the social structure [43] and despite the strong parallelism of their effects shown in figures throughout this paper, future research may like to compare and contrast their effects on perceptions and evaluations of other aspects of social policy.

Author Contributions

Conceptualization: M.D.R.E. and J.K.; methodology: M.D.R.E. and J.K.; software: STATA.; validation: M.D.R.E. and J.K.; formal analysis: M.D.R.E. and J.K.; investigation: M.D.R.E. and J.K.; resources: M.D.R.E. and J.K.; data curation: M.D.R.E. and J.K.; writing—original draft preparation: M.D.R.E. and J.K.; writing—review and editing: M.D.R.E. and J.K.; visualization: M.D.R.E. and J.K.; supervision: M.D.R.E. and J.K.; project administration: none; funding acquisition: none.

Acknowledgments

This research did not receive external grants. The authors had the benefit of extensive discussions with Nate Breznau during working visits to the University of Bremen and to the University of Mannheim which were supported by those institutions. No funds were received to cover publication costs.

Conflicts of Interest

The authors declare no conflict of interest. There were no funding sponsors, so they had no role in the design of the study; in the collection, analyses, or interpretation of data; in the writing of the manuscript, and in the decision to publish the results.

Appendix A. Measurement of Welfarism

Figure A1. Government social spending as a % of GDP, 1985–2000. Correlations and unrotated factor loadings for 34 societies.
Societies 08 00105 g0a1
Figure A2. Measuring and creating a variable to impute corporatism. Inter-item correlations, correlations with criterion variables, and unrotated factor loadings.
Societies 08 00105 g0a2
Figure A3. Effects of Esping-Andersen’s classification on attitudes toward income redistribution with Esping-Andersen’s typology (Liberal nations/ Conservative/ Social Democratic) expressed alternatively as dummy variables (columns 1 and 2) or an index scored 0/.5/1 (column 3). Multilevel regression estimates for 19 nations, 1987–2009.
Societies 08 00105 g0a3

Appendix B. Individual-Level Controls

This appendix gives further details on individual-level control variables.

Appendix B.1. Age and Date Born

Age is measured in years, from a direct question.
In some analyses where cohort effects may be present it is replaced by date born (specifically date reached age 15). Since age and date born are only empirically distinct when there are two or more surveys in a single country, for simplicity and comparability between countries, we do not use both in the same analyses.

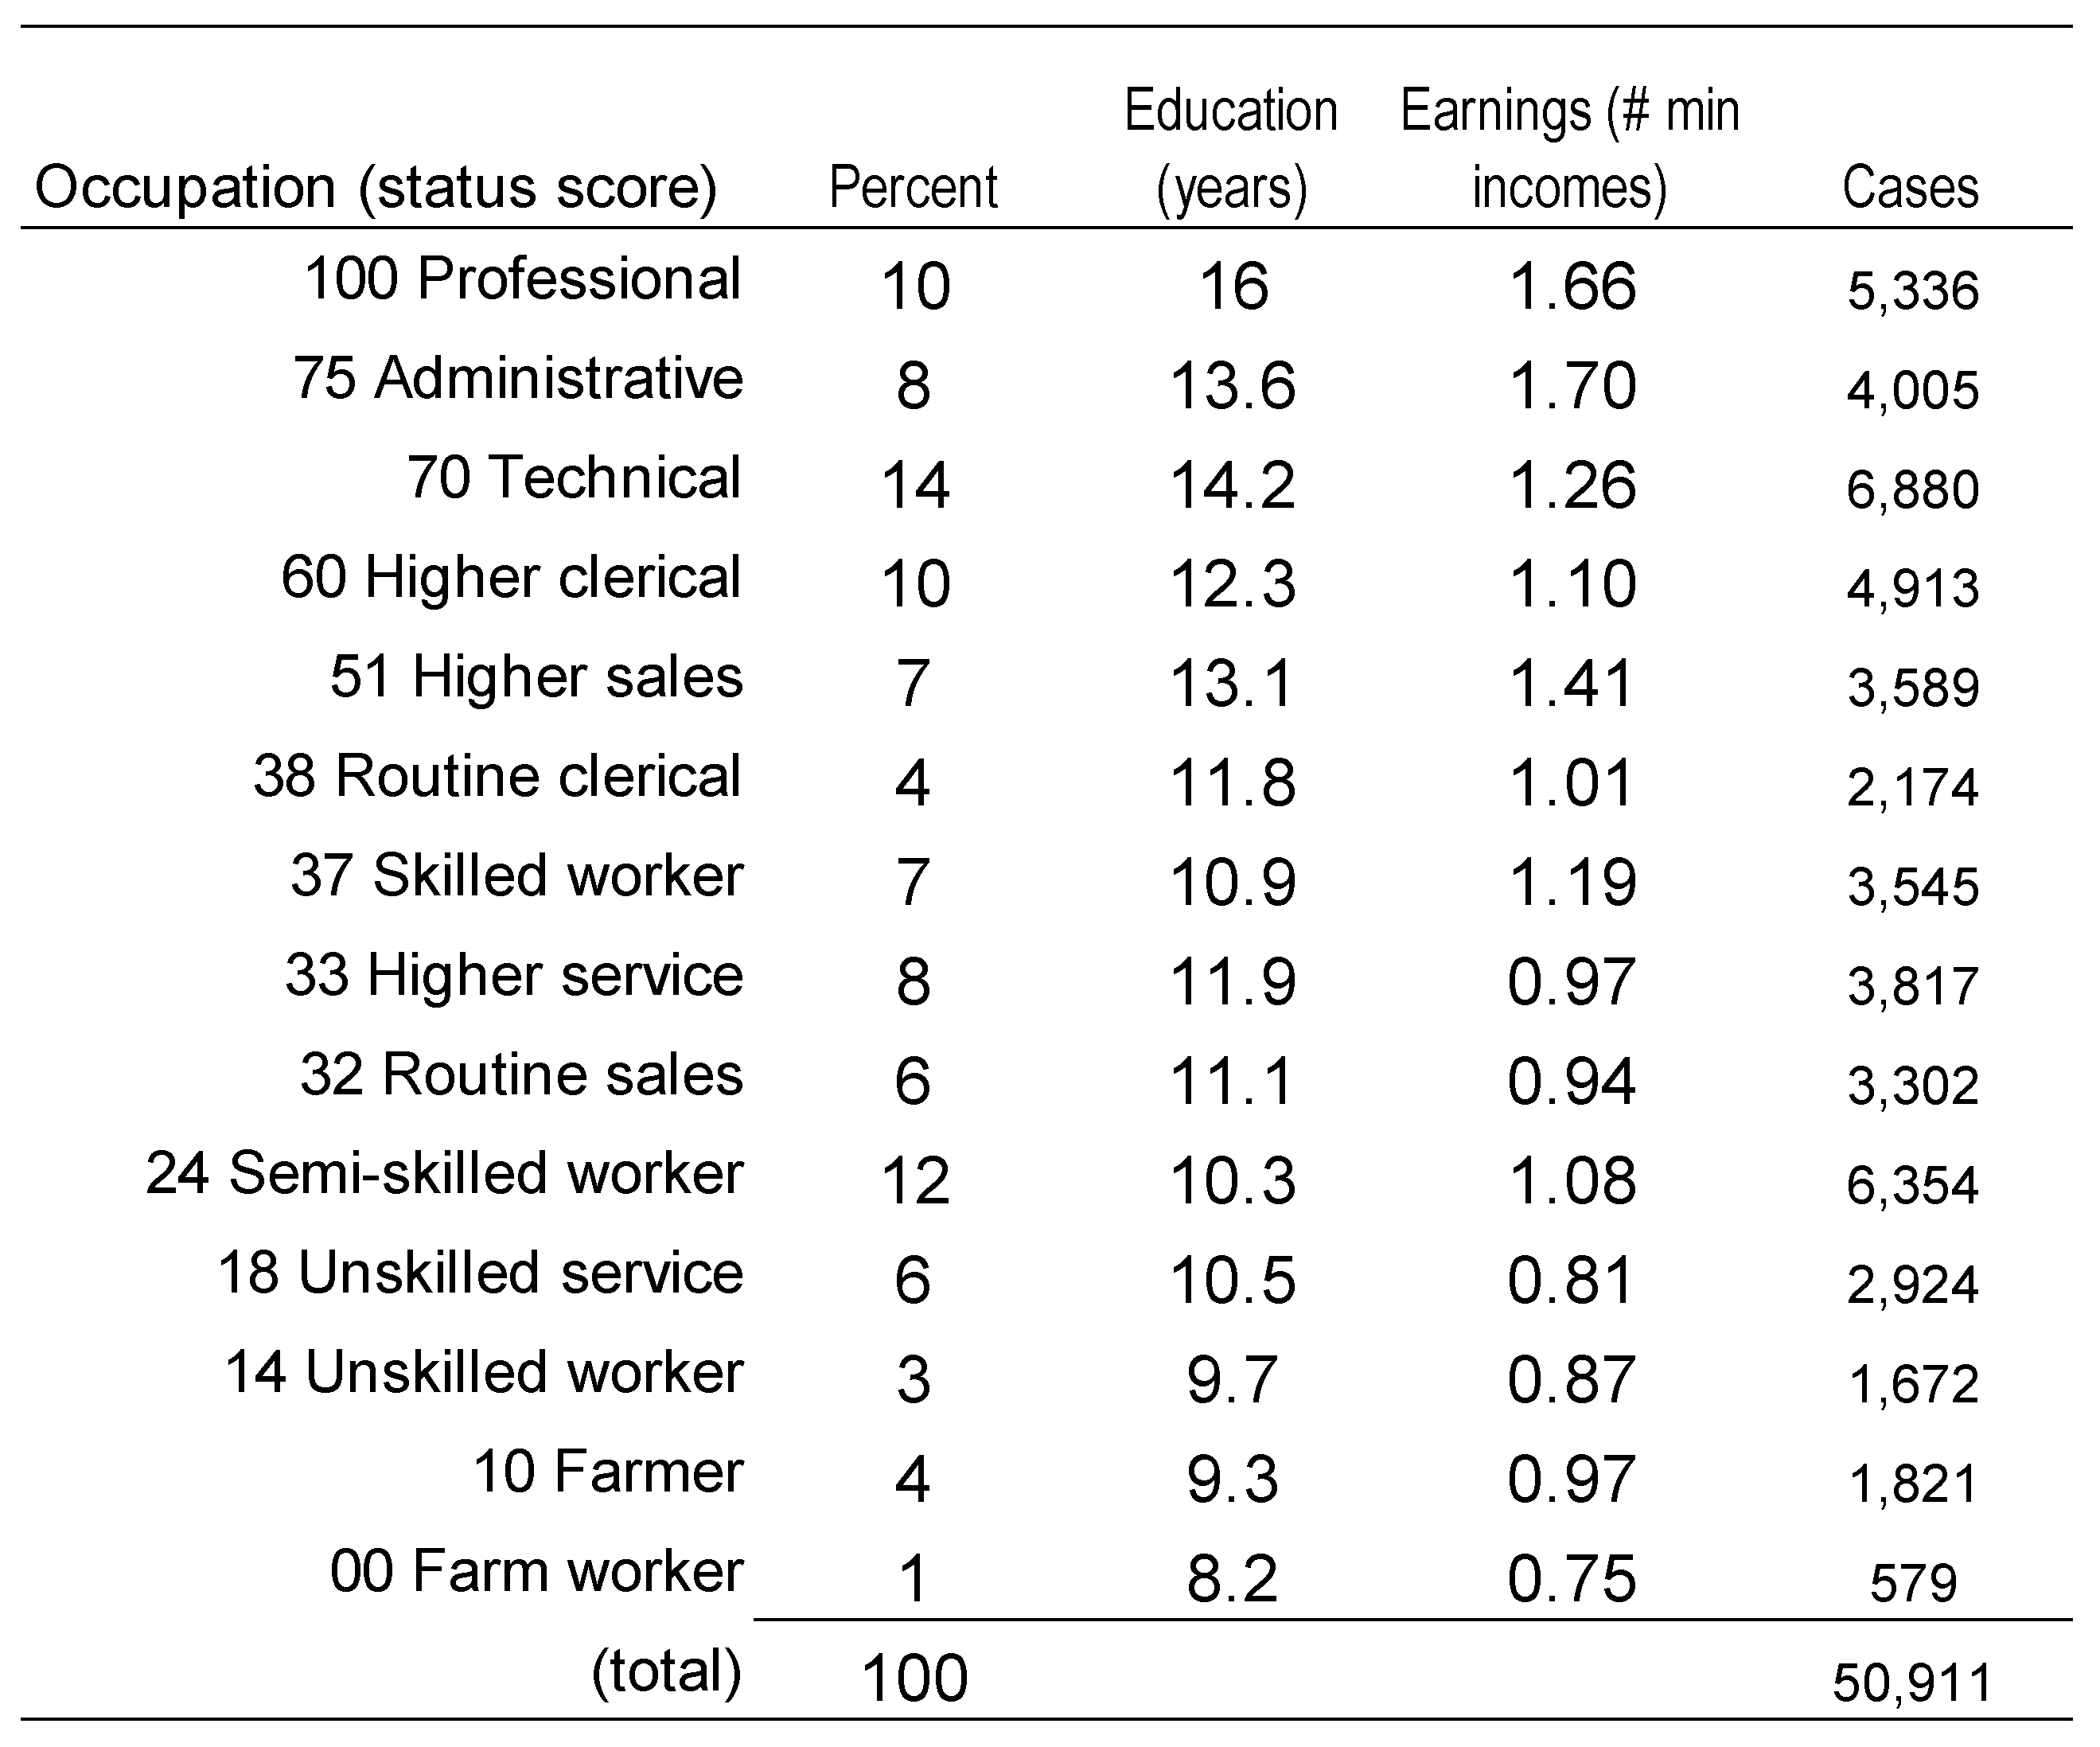
Appendix B.2. Occupational Status

Occupation was first coded into the 4-digit International Standard Classification of Occupations (mostly the 1968 and 1988 versions) and then recoded into the 14 categories of Treiman’s International Standard Classification of Occupations [163]. For those in the labor force (Figure 5, column 3):
Those categories were then assigned Worldwide Status Scores. These are virtually equivalent to the ISEI [164] scores or, for the USA, to SEI [165,166,167,168,169] scores. They are defined by a canonical correlation procedure; and closely reflect differences in education and earnings.
Figure A4. Description: Occupational distribution and mean education (in years) and earnings (number of minimum incomes) by occupation. World Inequality Study version 2.1; 30 nations, 1987–2009.
Societies 08 00105 g0a4

Appendix C. Measurement of Redistributive Attitudes

This appendix provides further details on the measurement of redistributive attitudes.
Figure A5. Effects on attitudes toward income redistribution. Main model using the two-item welfarism scale and estimates using each component item separately give equivalent results. Standaized corfficients from multilevel regression estimates for 30 nations, 1987–2009.
Societies 08 00105 g0a5
Figure A6. Effects on attitudes toward income redistribution: Cross-level interaction between welfarism and income when using alternative measures of welfarism. Using our preferred two item welfarism scale and separate estimates using each item separately give equivalent results and very similar predicted values. Metric coefficients and predicted values from multilevel regression. 30 nations, 1987–2009. Over 61,000 cases for each analysis.
Societies 08 00105 g0a6
Figure A7. Individual level model predicting each of the five redistribution items separately. All five are available for three nations in the International Survey of Economic Attitudes Round 2 (Australia, Finland, The Netherlands).
Societies 08 00105 g0a7

Appendix D. Inequality Images and Preferences (Different Welfarism Measures)

Figure A8. Demographic and SES differences in images of how egalitarian society is (Panel A) and how egalitarian it ought to be (Panel B) are small regardless of which definition of welfarism is used. Multilevel regression results, standardized coefficients.
Societies 08 00105 g0a8

Appendix E. Sensitivity Tests for the Cross-Level Interaction (Different Welfarism Measures)

Figure A9. Alternative measures of welfarism and attitudes toward income redistribution: Cross-level interaction between family income and the nation’s level of welfarism. Panel A: Multilevel regression estimated by GLS. Panel B: Predicted values of support for redistribution implied by these regressions evaluated for those with low family income (bottom 10%) and those with high (top 10%), separately for low welfarism nations (approximately bottom 10%) and high welfarism nations (top 10%).
Societies 08 00105 g0a9

Appendix F. Additional Country Level Controls for the Cross-Level Interaction

This appendix shows that a wide variety of country-level controls (in addition to GDP) make no appreciable difference to the interaction of welfarism with income.

Appendix F.1. A Note on Gini Inequality

It might seem natural to control for actual inequality as measured by the Gini coefficient, but that is not conceptually logical because differences in inequality are a consequence of welfarism—indeed one of the major goals of the welfare state. Indeed it is quite possible that the welfare state’s impact on redistributive attitudes is in part, or even wholly, indirect through its impact on Gini inequality—Gini is an intervening variable here shaped by corporatist influences on wage determination and by taxation/spending systems. The long-established logic of direct and indirect effects shows that welfarism’s all-inclusive effect (its “total” effect ) is to be estimated by an equation that does not control for Gini or any other intervening variable. That is what we have estimated in the main text (Figure 18 and Figure 19). Nonetheless, we also present an estimate controlling Gini inequality (Figure A11, column 10) and also two others controlling possible equality-inducing consequences of welfarism, government ownership and union density (columns 11 and 12).
In practice, neither controlling for the amount of Gini inequality, nor for the level of government ownership, nor for union density makes an appreciable difference to the welfarism × income interaction. Nor does a further cross-level interaction with subjectively perceived inequality change the picture (Figure A12). Indeed even controlling jointly for actual inequality (Gini) and perceived inequality makes no real difference (column 4). It produces predicted values much like our preferred model (Figure A12, Panel B).
Figure A10. Correlations involving control variables. 30 Nations, 84,344 individual respondents.
Societies 08 00105 g0a10
Figure A11. Additional national level controls make little difference to the key results. Influences on attitudes toward redistribution. Multilevel estimates, metric coefficients. 30 European nations. (Table continues below).
Societies 08 00105 g0a11
Figure A12. Sensitivity with a second interaction (perceived inequality). Additional national-level controls involving a second cross-level interaction make little difference to the key results. Influences on attitudes toward redistribution with cross-level interactions involving welfarism and income and involving welfarism and perceptions of societal inequality (diagram question). Multilevel estimates, metric coefficients (Panel A) and predicted values (Panel B).
Societies 08 00105 g0a12

Appendix G. Exploratory Case Study, USA 2016–2017

Appendix G.1. Data

Data are from the International Social Science Survey, Round 20, As the final sample is not yet ready, these results are from preliminary sample #1 (2016; N = 1492) and preliminary sample #2 (2017, N = 1419). Both preliminary samples contained the great majority of the final questionnaire and were used for fine-tuning and multiple item scale development for novel measurements (most of the questionnaire and most multiple item scales were long established ones from earlier rounds of the ISSS).
Both preliminary samples are based on Amazon.com’s ‘Mechanical Turk’ Internet based sample, which is convenient and cost effective. Surprisingly—especially to the present authors who ran the first 18 ISSS surveys on simple random samples drawn from the compulsory Australian electoral rolls with completion rates (after numerous follow-ups and great expense) over 60%—the simple Amazon sample proves to be surprisingly accurate, especially for multivariate analyses [170,171,172].

Appendix G.2. Measurement of Functionalism (Three Items, Alpha Reliability = 0.79)

Large differences in income are necessary for America’s prosperity.
Allowing businesses to make good profits is the best way to improve people’s standard of living.
Inequality in income is necessary for economic progress.
Answers were “Strongly agree/Agree/Neither Agree nor Disagree/Disagree/Strongly Disagree.

Appendix G.3. Measurement of Meritocracy (6 Items, Alpha Reliability = 0.90)

In America today…
People get rewarded for their effort.
People get rewarded for their intelligence and skills.
Almost anyone who works hard and skilfully will eventually get ahead.
Anyone can raise their standard of living if they work at it.
Most people have a good deal of freedom in deciding how to live.
Poor people could improve their lot if they tried.
Answers were “Strongly agree/Agree/Neither Agree nor Disagree/Disagree/Strongly Disagree.

Appendix G.4. Measuring Perceptions of Corruption

Thinking about getting ahead in life...
To go from rags to riches, you have to be corrupt.
Behind the scenes in nearly every successful business, there’s a link to organized crime.
To get all the way to the top in America today, you have to be corrupt.
Answers were “Strongly agree/Agree/Neither Agree nor Disagree/Disagree/Strongly Disagree.

References

  1. Marsland, D. Welfare or Welfare State? Contradictions and Dilemmas in Social Policy; Springer: New York, NY, USA, 1996. [Google Scholar]
  2. Bean, C.S.; Papadakis, E. A Comparison of Mass Attitudes towards the Welfare State in Different Institutional Regimes, 1985–1990. Int. J. Public Opin. Res. 1998, 10, 211–236. [Google Scholar] [CrossRef]
  3. Papadakis, E.; Bean, C.S. Popular Support for the Welfare State. J. Public Policy 1993, 13, 227–254. [Google Scholar] [CrossRef]
  4. Manza, J.; Brooks, C. How Sociology Lost Public Opinion. Sociol. Theory 2012, 30, 89–113. [Google Scholar] [CrossRef]
  5. Gingrich, J.R.; Ansell, B.W. Preferences in context: Micro preferences, macro-contexts and the demand for social policy. Comp. Polit. Stud. 2012, 45, 1624–1654. [Google Scholar] [CrossRef]
  6. Kulin, J.; Svallfors, S. Class, Values, and Attitudes towards Redistribution. Eur. Sociol. Rev. 2013, 29, 155–167. [Google Scholar] [CrossRef]
  7. Arts, W.; Gelissen, J. Welfare States, Solidarity and Justice Principles: Does the Type Really Matter? Acta Sociol. 2001, 44, 283–299. [Google Scholar] [CrossRef] [Green Version]
  8. Gelissen, J. Popular Support for Institutionalised Solidarity: A Comparison between European Welfare States. Int. J. Soc. Welf. 2000, 9, 285–300. [Google Scholar] [CrossRef]
  9. Jæger, M.M. Welfare regimes and attitudes towards redistribution. Eur. Sociol. Rev. 2006, 22, 157–170. [Google Scholar] [CrossRef]
  10. Jaeger, M.M. United but divided: Welfare regimes and the level and variance in public support for redistribution. Eur. Sociol. Rev. 2009, 25, 723–737. [Google Scholar] [CrossRef]
  11. Jordan, J. Institutional Feedback and Support for the Welfare State: The Case of National Health Care. Comp. Polit. Stud. 2010, 20, 1–24. [Google Scholar] [CrossRef]
  12. Larsen, C.A. The institutional logic of welfare attitudes: How welfare regimes influence public support. Comp. Polit. Stud. 2008, 41, 145–168. [Google Scholar] [CrossRef] [Green Version]
  13. Rothstein, R. Growth with inequality: Is there another way? New Perspect. Q. 1997, 14, 36–40. [Google Scholar]
  14. Brady, D.; Bostic, A. Paradoxes of social policy: Welfare transfers, relative poverty, and redistribution preferences. Am. Sociol. Rev. 2015, 80, 268–298. [Google Scholar] [CrossRef]
  15. Kelley, J.; Evans, M.D.R.; Mateju, P.; Knudsen, K.; Skjak, K.; Cichomski, B.; Morawski, P.; Malnar, B. Analytic Guide to the ISSP 1999 Inequality Questionnaire; International Survey Center, 1998. Available online: http://www.international-survey.org/ (accessed on 13 October 2008).
  16. ISSP Research Group (Zentralarchiv fuer Empirische Sozialforschung). International Social Survey Programme: Social Inequality I-IV ADD ON—ISSP 1987-1992-1999-2009. GESIS Data Archive, Cologne. ZA5891 Data file Version 1.1.0. 2014. Available online: https://dbk.gesis.org/dbksearch/sdesc2.asp?no=5891 (accessed on 27 September 2018).
  17. Marx, K. Economic and Philosophic Manuscripts of 1844: Selections. In The Marx-Engels Reader; Tucker, R.C., Ed.; W.W. Norton: New York, NY, USA, 1972; pp. 53–103. [Google Scholar]
  18. Marx, K.; Engels, F.C. Manifesto of the Communist Party. In The Marx-Engels Reader; Tucker, R.C., Ed.; W.W. Norton: New York, NY, USA, 1972; pp. 335–362. [Google Scholar]
  19. Owens, L.A.; Pedulla, D.S. Material Welfare and Changing Political Preferences. Soc. Forces 2014, 92, 1087–1113. [Google Scholar] [CrossRef]
  20. Fernandez, J.; Jaime-Castillo, A.M. The Institutional Foundation of Social Class Differences in Pro-redistribution Attitudes: A Cross-National Analysis, 1985–2010. Soc. Forces 2018, 96, 1009–1038. [Google Scholar] [CrossRef]
  21. Breznau, N.; Eger, M.A. Immigrant presence, group boundaries, and support for the Welfare State in Western European societies. Acta Sociol. 2016, 59, 195–214. [Google Scholar] [CrossRef]
  22. Abercrombie, N.; Turner, B.S. The Dominant Ideology Thesis. Br. J. Sociol. 1978, 29, 149–170. [Google Scholar] [CrossRef]
  23. Form, W.H.; Rytina, J.H. Ideological Beliefs on the Distribution of Power in the United States. Am. Sociol. Rev. 1969, 34, 19–30. [Google Scholar] [CrossRef]
  24. Gramsci, A. Selections from Cultural Writings; Forgas, D., Nowell-Smith, G., Eds.; Boelhower, W., Translator; Haymarket Books: Chicago, IL, USA, 2012. [Google Scholar]
  25. Rytina, J.H.; Form, W.H.; Pease, J. Income and Stratification Ideology: Beliefs about the American Opportunity Structure. Am. J. Sociol. 1970, 75, 703–716. [Google Scholar] [CrossRef]
  26. Jost, J.T.; Banaji, M.R.; Nosek, B.A. A Decade of System Justification Theory: Accumulated Evidence of Conscious and Unconscious Bolstering of the Status Quo. Polit. Psychol. 2004, 25, 881–919. [Google Scholar] [CrossRef] [Green Version]
  27. Homans, G.C. Social Behavior: Its Elementary Forms, Revised ed.; Harcourt, Brace, Jovanovich: New York, NY, USA, 1974. [Google Scholar]
  28. Campbell, A.L. Policy Makes Mass Politics. Ann. Rev. Polit. Sci. 2012, 15, 333–351. [Google Scholar] [CrossRef]
  29. Mettler, S.; Sorelle, M. Policy Feedback Theory. In Theories of the Policy Process; Weible, C.M., Sabatier, P.A., Eds.; Westview: Boulder, CO, USA, 2014; pp. 151–182. [Google Scholar]
  30. Meyer, J.W.; Rowan, B. Institutionalized Organizations: Formal Structure as Myth and Ceremony. Am. J. Sociol. 1977, 83, 340–363. [Google Scholar] [CrossRef]
  31. Meyer, J.W.; Jepperson, R.L. The “Actors” of Modern Society: The Cultural Construction of Social Agency. Sociol. Theory 2000, 18, 100–120. [Google Scholar] [CrossRef]
  32. Key, V.O. Public opinion and the decay of democracy. Va. Q. Rev. 1961, 37, 481. [Google Scholar]
  33. Nisbet, R.A. Voting Practices versus Democratic Theory. Commentary 1961, 31, 60–67. [Google Scholar]
  34. Durkheim, E. Le Suicide: Étude de Sociologie; Alcan: Paris, France, 1897. [Google Scholar]
  35. Durkheim, E. The Division of Labour in Society, 2nd ed.; Lukes, S., Ed.; Halls, W.D., Translator; Free Press: New York, NY, USA, 1902. [Google Scholar]
  36. Esping-Andersen, G.; Nedoluzhko, L. Inequality equilibria and individual well-being. Soc. Sci. Res. 2017, 62, 24–28. [Google Scholar] [CrossRef] [PubMed]
  37. Mettler, S. The Government-Citizen Disconnect; Russell Sage: New York, NY, USA, 2018. [Google Scholar]
  38. Converse, P.E. Ideology and Discontent. In The Nature of Belief Systems in Mass Publics; Apter, D.E., Ed.; Free Press: New York, NY, USA, 1964; pp. 206–261. [Google Scholar]
  39. Edlund, J.; Lindh, A. The Democratic Class Struggle Revisited: The Welfare State, Social Cohesion and Political Conflict. Acta Sociol. 2015, 58, 311–328. [Google Scholar] [CrossRef]
  40. Esping-Andersen, G. The Three Worlds of Welfare Capitalism; Princeton University Press: Princeton, NJ, USA, 1990. [Google Scholar]
  41. Pierson, P. Dismantling the Welfare State? Reagan, Thatcher, and the Politics of Retrenchment; Cambridge University Press: Cambridge, UK, 1994. [Google Scholar]
  42. Skocpol, T. Protecting Soldiers and Mothers; Harvard University Press: Cambridge, MA, USA, 1992. [Google Scholar]
  43. Steele, L.G. Income Inequality, Equal Opportunity, and Attitudes about Redistribution. Soc. Sci. Q. 2015, 96, 444–464. [Google Scholar] [CrossRef]
  44. Evans, M.D.R.; Kelley, J.; Kolosi, T. Images of Class: Public Perceptions in Hungary and Australia. Am. Sociol. Rev. 1992, 57, 461–482. [Google Scholar] [CrossRef]
  45. Evans, M.D.R.; Kelley, J. Communism, Capitalism, and Images of Class: Effects of Reference Groups, Reality, and Regime in 43 Nations and 110,000 Individuals, 1987–2009. Cross-Cult. Res. 2017, 51, 315–359. [Google Scholar] [CrossRef]
  46. Beramendi, P.; Rehm, P. Who Gives, Who Gains? Progressivity and Preferences. Comp. Polit. Stud. 2016, 49, 529–563. [Google Scholar] [CrossRef]
  47. Lupu, N.; Pontusson, J. The Structure of Inequality and the Politics of Redistribution. Am. Polit. Sci. Rev. 2011, 105, 316–336. [Google Scholar] [CrossRef]
  48. Svallfors, S. Worlds of welfare and attitudes to redistribution: A comparison of eight western nations. Eur. Sociol. Rev. 1997, 13, 283–304. [Google Scholar] [CrossRef]
  49. Heuer, J.-O.; Mau, S.; Zimmermann, K. Attitudes to Inequalities: Citizen Deliberation About the (Re-)Distribution of Income and Wealth in Four Welfare State Regimes. In Attitudes, Aspirations and Welfare; Taylor-Gooby, P., Leruth, B., Eds.; Palgrave Macmillan: Cham, Switzerland, 2018. [Google Scholar]
  50. Breznau, N.; Hommerich, C. The Limits of Income Inequality: Public Support for Social Policy across Rich Democracies. arXiv 2018. [Google Scholar] [CrossRef]
  51. Breznau, N. Positive Returns and Equilibrium: Simultaneous Feedback between Public Opinion and Social Policy. Policy Stud. J. 2017, 45, 583–612. [Google Scholar] [CrossRef]
  52. Morgan, S.L.; Winship, C. Counterfacuals and Causal Inference, 2nd ed.; Cambridge University Press: Cambridge, UK, 2014. [Google Scholar]
  53. Jacques, O.; Noel, A. The case for welfare state universalism, or the lasting relevance of the paradox of redistribution. J. Eur. Soc. Policy 2018, 28, 70–85. [Google Scholar] [CrossRef]
  54. Korpi, W.; Palme, J. The Paradox of Redistribution and Strategies of Equality: Welfare State Institutions, Inequality, and Poverty in the Western Countries. Am. Sociol. Rev. 1998, 63, 661–687. [Google Scholar] [CrossRef]
  55. Maas, C.; Hox, J. Sample sizes for multi-level modelling. Am. J. Public Health 1999, 89, 1181–1186. [Google Scholar]
  56. Maas, C.J.M.; Hox, J.J. Sufficient Sample Sizes for Multilevel Modeling. Methodology 2005, 1, 86–92. [Google Scholar] [CrossRef]
  57. Cutright, P. Political Structure, Economic Development, and National Social Security Programs. Am. J. Sociol. 1965, 70, 537–550. [Google Scholar] [CrossRef]
  58. Wilensky, H.W. The Welfare State and Equality: Structural and Ideological Roots of Public Expenditure; University of California Press: Berkeley, CA, USA, 1975. [Google Scholar]
  59. Brady, D.; Beckfield, J.; Seeleib-Kaiser, M. Economic Globalization and the Welfare State in Affluent Democracies, 1975–2001. Am. Sociol. Rev. 2005, 70, 921–948. [Google Scholar] [CrossRef]
  60. Brady, D. Rich Democracies, Poor People; Oxford University Press: Oxford, UK, 2009. [Google Scholar]
  61. Polanyi, K. The Great Transformation; Farrar & Rinehart: New York, NY, USA, 1944. [Google Scholar]
  62. Castles, F.G. Comparative Public Policy: Patterns of Post-War Transformation; Edward Elgar: Northampton, MA, USA, 1998. [Google Scholar]
  63. Stier, H.; Lewin-Epstein, N.; Braun, M. Welfare regimes, family-supportive policies, and women’s employment along the life-course. Am. J. Sociol. 2001, 106, 1731–1760. [Google Scholar] [CrossRef]
  64. Crepaz, M.M.L. Corporatism in Decline? An Empirical Analysis of the Impact of Corporatism on Macroeconomic Performance and Industrial Disputes in 18 Industrialized Nations. Comp. Polit. Stud. 1992, 25, 139–168. [Google Scholar] [CrossRef]
  65. Crepaz, M.M.L.; Lijphart, A. Linking and Integrating Corporatism and Consensus Democracy. Br. J. Polit. Sci. 1995, 25, 281–288. [Google Scholar] [CrossRef]
  66. Hicks, A.; Misra, J. Political Resources and the Growth of Welfare in Affluent Capitalist Democracies, 1960–1982. Am. J. Sociol. 1993, 99, 668–710. [Google Scholar] [CrossRef]
  67. Hicks, A.M.; Swank, D.H. Politics, Institutions, and Welfare Spending in Industrialized Democracies, 1960–1982. Am. Polit. Sci. Rev. 1992, 86, 658–674. [Google Scholar] [CrossRef]
  68. Kenworthy, L. Corporatism and unemployment in the 1980s and 1990s. Am. Sociol. Rev. 2002, 67, 367–388. [Google Scholar] [CrossRef]
  69. Kenworthy, L. Quantitative Indicators of Corporatism. Int. J. Sociol. 2003, 33, 10–44. [Google Scholar] [CrossRef]
  70. Kenworthy, L.; McCall, L. Inequality, public opinion and redistribution. Socio-Econ. Rev. 2008, 6, 35–68. [Google Scholar] [CrossRef]
  71. Iversen, T.; Soskice, D. Distribution and Redistribution: The Shadow of the Nineteenth Century. World Polit. 2009, 61, 438–486. [Google Scholar] [CrossRef]
  72. OECD. OECD Employment Outlook; OECD: Paris, France, 2004; ISBN 92-64-10812-2. [Google Scholar]
  73. Hicks, A.; Kenworthy, L. Cooperation and Political Economic Performance in Affluent Democratic Capitalism. Am. J. Sociol. 1998, 103, 1631–1672. [Google Scholar] [CrossRef] [Green Version]
  74. Bollen, K.A. Confirmatory Factor Analysis. In Structural Equations with Latent Variables; Wiley-Interscience: Hoboken, CA, USA, 1989; pp. 226–318. [Google Scholar]
  75. Treiman, D.J. Scale Construction. In Quantitative Data Analysis; Jossey-Bass: San Francisco, CA, USA, 2009; pp. 241–262. [Google Scholar]
  76. Castles, F.G. What Welfare States Do: A Disaggregated Expenditure Approach. J. Soc. Policy 2009, 38, 45–62. [Google Scholar] [CrossRef]
  77. Green-Pedersen, C. The Dependent Variable Problem within the Study of Welfare State Retrenchment: Defining the Problem and Looking for Solutions. J. Comp. Policy Anal. Res. Pract. 2007, 6, 3–14. [Google Scholar] [CrossRef]
  78. Kenworthy, L. Do social-welfare policies reduce poverty? A cross-national assessment. Soc. Forces 1999, 77, 1119–1139. [Google Scholar] [CrossRef]
  79. Palme, J. Welfare states and inequality: Institutional designs and distributive outcome. Res. Soc. Stratif. Mobil. 2006, 24, 387–403. [Google Scholar] [CrossRef]
  80. Brett, E.A. From Corporatism to Liberalization in Zimbabwe: Economic Policy Regimes and Political Crisis, 1980–1997. Int. Polit. Sci. Rev. 2005, 26, 91–106. [Google Scholar] [CrossRef]
  81. Desai, A.; Habib, A. Labour Relations in Transition: The Rise of Corporatism in South Africa’s Automobile Industry. J. Mod. Afr. Stud. 1997, 35, 495–518. [Google Scholar] [CrossRef]
  82. Dickson, B.J. Cooptation and Corporatism in China: The Logic of Party Adaptation. Polit. Sci. Q. 2001, 115, 517–540. [Google Scholar] [CrossRef]
  83. Makoba, J. Rethinking Development Strategies in Africa; Peter Lang: New York, NY, USA, 2011. [Google Scholar]
  84. Lijphart, A.; Crepaz, M.M.L. Corporatism and Consensus Democracy in Eighteen Countries: Conceptual and Empirical Linkages. Br. J. Polit. Sci. 1991, 21, 235–246. [Google Scholar] [CrossRef]
  85. Castles, F.G.; Obinger, H. Worlds, Families, Regimes: Country Clusters in European and OECD Area Public Policy. West Eur. Polit. 2008, 31, 321–344. [Google Scholar] [CrossRef]
  86. Breznau, N. The Missing Main Effect of Welfare State Regimes. Sociol. Sci. 2015, 2, 420–441. [Google Scholar] [CrossRef]
  87. Castles, F.G. The English-Speaking Countries. In The Oxford Handbook of the Welfare State; Castles, F.G., Leibfried, S., Lewis, J., Obinger, H., Pierson, C., Eds.; Oxford Handbooks Online: Oxford, UK, 2010. [Google Scholar]
  88. Porta, R.L.; López-de-Silanes, F.; Pop-Eleches, C.; Shleifer, A. The Guarantees of Freedom. Harv. Inst. Econ. Res. 2002. [Google Scholar] [CrossRef]
  89. Faculty of Law—Civil Law Section World Legal Systems. Available online: http://www.droitcivil.uottawa.ca/world-legal-systems/eng-commonwealthmembers.html (accessed on 1 June 2016).
  90. David, R.; Brierley, J.E.C. Major Legal Systems in the World Today; Free Press: New York, NY, USA, 1978. [Google Scholar]
  91. Arts, W.; Gelissen, J. Three worlds of welfare capitalism or more? J. Eur. Soc. Policy 2002, 12, 137–158. [Google Scholar] [CrossRef]
  92. Andrews, F.M. Construct Validity and Error Components of Survey Measures: A Structural Modeling Approach. Public Opin. Q. 1984, 48, 409–442. [Google Scholar] [CrossRef]
  93. Gjeddebaek, N.F. Grouped observations. In International Encyclopedia of the Social Sciences; Sills, D.S., Ed.; Macmillan Co., Free Press: New York, NY, USA, 1968. [Google Scholar]
  94. Haitovsky, Y. Grouped data. In International Encyclopedia of the Social and Behavioral Sciences; Baltes, P.B., Smelser, N.J., Eds.; Elsevier: New York, NY, USA, 2001; pp. 14995–15002. [Google Scholar]
  95. Heitjan, D. Inference from Grouped Continuous Data. Stat. Sci. 1989, 4, 164–179. [Google Scholar] [CrossRef]
  96. World Bank. Per Capita GDP at Parity Purchasing Power; World Bank: New York, NY, USA, 2012. [Google Scholar]
  97. Breznau, N. Secondary observer effects: Idiosyncratic errors in small-N secondary data analysis. Int. J. Soc. Res. Methodol. 2016, 19, 301–318. [Google Scholar] [CrossRef]
  98. Kaufmann, D.; Kraay, A.; Mastruzzi, M. Governance Matters, VII: Aggregate and Individual Governance Indicators, 1996–2007; World Bank: New York, NY, USA, 2008. [Google Scholar]
  99. OECD. OECD Employment Outlook; OECD: Paris, France, 2005. [Google Scholar]
  100. OECD. Divided We Stand: Why Inequality Keeps Rising; OECD: Paris, France, 2011; p. 400. [Google Scholar]
  101. Ryder, N.B. The Cohort as a Concept in the Study of Social Change. Am. Sociol. Rev. 1965, 30, 843–861. [Google Scholar] [CrossRef] [PubMed]
  102. Kelley, J. The Failure of a Paradigm: Log-Linear Models of Social Mobility. In John Goldthorpe: Consensus and Controversy; Clark, J., Modgil, S., Modgil, C., Eds.; Falmer Press: London, UK, 1990; pp. 319–346. [Google Scholar]
  103. Kelley, J. Goldthorpe’s Class Typology Revisited: Kelley Replies to Mueller. In John Goldthorpe: Consensus and Controversy; Clark, J., Modgil, S., Modgil, C., Eds.; Falmer Press: London, UK, 1990; pp. 349–357. [Google Scholar]
  104. Kelley, J.; Evans, M.D.R. The Legitimation of Inequality: Occupational Earnings in Nine Nations. Am. J. Sociol. 1993, 99, 75–125. [Google Scholar] [CrossRef]
  105. Breznau, N. Economic Equality and Social Welfare: Policy Preferences in Five Nations. Int. J. Public Opin. Res. 2010, 22, 458–484. [Google Scholar] [CrossRef] [Green Version]
  106. Sikora, J. Perceptions of economic efficiency of government versus private enterprises, and attitudes to government ownership in the economy. Res. Soc. Stratif. Mobil. 2005, 23, 227–274. [Google Scholar] [CrossRef]
  107. Naumann, E.; Buss, C.; Bähr, J. How Unemployment Experience Affects Support for the Welfare State: A Real Panel Approach. Eur. Sociol. Rev. 2016, 32, 81–92. [Google Scholar] [CrossRef]
  108. Kelley, J.; Evans, M.D.R.; Sikora, J. World Inequality Study, 1967–2004: Codebook and Machine Readable Data File. International Survey Center: Point Marka, Australia, 2007. [Google Scholar]
  109. Zlatkov, T.; Zagorski, K.; Kelley, J. Bulgaria: International Survey of Economic Attitudes. Codebook and Machine-Readable Data File; Sofia University: Sofia, Bulgaria, 1998. [Google Scholar]
  110. Kelley, J.; Zagorski, K.; Evans, M.D.R.; Ervasti, H.; Ganzeboom, H.B.G.; Gijsberts, M.; Kangas, O.; Robert, P.; Zlatkov, T. ISEA, Rounds 1 and 2 (International Survey of Economic Attitudes). Codebook and MRDF; International Survey Center: Point Marka, Australia, 1998. [Google Scholar]
  111. Kelley, J.; Evans, M.D.R.; Zagorski, K. Australia: International Survey of Economic Attitudes, Round 3. Codebook and MRDF; International Social Science Survey and Melbourne Institute of Applied Economic and Social Research, University of Melbourne: Melbourne, Australia, 1998. [Google Scholar]
  112. Bollen, K.A. Reliability. In Structural Equations with Latent Variables; John Wiley: New York, NY, USA, 1989; pp. 206–221. [Google Scholar]
  113. Bollen, K.A. The Consequences of Measurement Error. In Structural Equations with Latent Variables; John Wiley: New York, NY, USA, 1989; pp. 151–169. [Google Scholar]
  114. Evans, M.D.R.; Kelley, J. Data, Measurement, and Methods. In Australian Economy and Society 2002: Religion, Morality, and Public Policy in International Perspective, 1984–2002; Evans, M.D.R., Kelley, J., Eds.; Federation Press: Sydney, Australia, 2004; pp. 317–336. [Google Scholar]
  115. Linos, K.; West, M. Self-interest, social beliefs, and attitudes towards redistribution. Eur. Sociol. Rev. 2003, 19, 393–409. [Google Scholar] [CrossRef]
  116. Kelley, J.; Evans, M.D.R.; Sikora, J.; Breznau, N. World Inequality Study; Survey, I.S.S., Ed.; International Survey Center: Point Marka, Australia, 2015. [Google Scholar]
  117. Kelley, J.; Evans, M.D.R. International Survey of Economic Attitudes: Australia. Codebook and MRDF; Melbourne Institute of Applied Economic and Social Research, University of Melbourne: Melbourne, Australia, 1998. [Google Scholar]
  118. Nieuwbeerta, P.; Gijsberts, M.; Ganzeboom, H.B.G. Sociaal-Economische Ontwikkelingen in Nederland 1998 (Social and Economic Attitudes in The Netherlands 1998); Codebook and MRDF; ICS Codebook 38; ICS (Interuniversity Center for Social Science Theory and Methodology): Utrecht, The Netherlands, 1998. [Google Scholar]
  119. AAPOR (American Association for Public Opinion Research). Standard Definitions: Final Dispositions of Case Codes and Outcome Rates for Surveys; AAPOR: Oakbrook Terrace, IL, USA, 2016. Available online: https://www.aapor.org/Standards-Ethics/Standard-Definitions-(1).aspx (accessed on 16 October 2018).
  120. Evans, M.D.R.; Kelley, J. Data, measurement, and methods. In Australian Economy and Society 2001: Education, Work, and Welfare; Evans, M.D.R., Kelley, J., Eds.; Federation Press: Sydney, Australia, 2002; Chapter 28; pp. 296–310. [Google Scholar]
  121. Sikora, J. International Survey of Economic Attitudes in Australia, Finland and Poland: Comparison with the Census. WwA Worldwide. Attitudes 1997, 1–8. Available online: http://www.international-survey.org/wwa_pub/articles/joanna2.htm (accessed on 13 October 2008).
  122. Berk, R.A. An Introduction to Sample Selection Bias in Sociological Data. Am. Sociol. Rev. 1983, 48, 386–398. [Google Scholar] [CrossRef]
  123. Evans, M.D.R. Choosing to Be a Citizen: The Time-Path of Citizenship in Australia. Int. Migr. Rev. 1988, 22, 243–264. [Google Scholar] [CrossRef]
  124. Breznau, N.; Lykes, V.; Kelley, J.; Evans, M.D.R. A Clash of Civilizations? Preferences for Religious Political Leaders in 81 Nations. J. Sci. Stud. Relig. 2011, 50, 671–691. [Google Scholar] [CrossRef]
  125. Kuhn, A. Comment on Levy’s Review of The Logic of Social Systems. Am. J. Sociol. 1977, 82, 1346–1347. [Google Scholar] [CrossRef]
  126. Kuhn, A. The Individual Perception of Wage Inequality: A Measurement Framework and Some Empirical Evidence; IZA Discussion Paper No. 9579; University of Zurich, IZA Institute of Labor Economics: Zurich, Switzerland, 2015. [Google Scholar]
  127. Evans, M.D.R.; Kelley, J.; Kelley, S.M.C.; Kelley, C.G.E. Rising Income Inequality during the Great Recession Had No Impact on Subjective Wellbeing in Europe, 2003–2012. J. Happiness Stud. 2017. [Google Scholar] [CrossRef]
  128. Kelley, J.; Evans, M. The new income inequality and well-being paradigm. Soc. Sci. Res. 2017, 62, 39–74. [Google Scholar] [CrossRef] [PubMed]
  129. Kelley, J.; Evans, M.D.R. Societal Income Inequality and Individual Subjective Well-Being: Results from 68 Societies and over 200,000 Individuals, 1981–2008. Soc. Sci. Res. 2017, 62, 1–23. [Google Scholar] [CrossRef] [PubMed]
  130. Nielsen, F. Inequality and inequity. Soc. Sci. Res. 2017, 62, 29–35. [Google Scholar] [CrossRef] [PubMed]
  131. Kelley, J.; Evans, M.D.R. Class and Class Conflict in Six Western Nations. Am. Sociol. Rev. 1995, 60, 157–178. [Google Scholar] [CrossRef]
  132. Davis, K.; Moore, W. Some Principles of Stratification. Am. Sociol. Rev. 1945, 10, 242–249. [Google Scholar] [CrossRef]
  133. Schneider, S.; Castillo, J.C. Poverty Attributions and the Perceived Justice of Income Inequality. Soc. Psychol. Q. 2015, 78, 263–282. [Google Scholar] [CrossRef]
  134. Sanchez, A.; Goda, T. Corruption and the ‘Paradox of Redistribution’. Soc. Indic. Res. 2017. [Google Scholar] [CrossRef]
  135. Gijsberts, M. The legitimation of income inequality in state-socialist and market societies. Acta Sociol. 2002, 45, 269–285. [Google Scholar] [CrossRef]
  136. Fatke, M. Inequality and Political Behavior: Objective Levels versus Subjective Perceptions. SSRN 2018, 2018. [Google Scholar] [CrossRef]
  137. Knell, M.; Stix, H. Inequality, Perception Biases and Trust. OeNB WorkingPapers 2016, 2016, 1–56. [Google Scholar]
  138. Jasso, G. A New Theory of Distributive Justice. Am. Sociol. Rev. 1980, 45, 3–32. [Google Scholar] [CrossRef]
  139. Jasso, G. Thinking, Saying, Doing in the World of Distributive Justice. Soc. Justice Res. 2015, 28, 435–478. [Google Scholar] [CrossRef]
  140. Robinson, R.V.; Bell, W. Equality, Success, and Social Justice in England and the United States. Am. Sociol. Rev. 1978, 43, 125–143. [Google Scholar] [CrossRef]
  141. Evans, M.D.R.; Kelley, J. Population Size, Economic Development, and Attitudes towards Inequality: Evidence from 30 Nations. Popul. Rev. 2007, 46, 1–23. [Google Scholar] [CrossRef]
  142. Evans, M.D.R.; Kelley, J. Economic Development and Inequality Attitudes: The Long Shadow of the Past; Annual Meeting of the American Sociological Association, Section on Political Sociolog: Montreal, QC, Canada, 2006. [Google Scholar]
  143. Hadler, M. Why Do People Accept Different Income Ratios? A Multi-level Comparison of Thirty Countries. Acta Sociol. 2005, 48, 131–154. [Google Scholar] [CrossRef]
  144. Kelley, J.; Evans, M.D.R. Economic Development Reduces Tolerance for Inequality: A Comparative Analysis of 30 Nations. In Charting the Globe: The International Social Survey Programme 1984–2009; Haller, M., Jowell, R., Smith, T., Eds.; Routledge: London, UK, 2009; pp. 49–72. [Google Scholar]
  145. Osberg, L.; Smeeding, T. “Fair” inequality? Attitudes toward pay differentials. Am. Sociol. Rev. 2006, 71, 450–473. [Google Scholar] [CrossRef]
  146. Mau, S.; Burkhardt, C. Migration and welfare state solidarity in Western Europe. J. Eur. Soc. Policy 2009, 19, 213–222. [Google Scholar] [CrossRef]
  147. Taylor-Gooby, P.; Leruth, B.; Chung, H. (Eds.) The context: How European welfare states have responded to post-industrialism, ageing populations, and populist nationalism. In After Austerity; Oxford University Press: Oxford, UK, 2017; pp. 1–26. [Google Scholar]
  148. Crepaz, M.M.L.; Jazayeri, K.B.; Polk, J. What’s Trust Got to Do with It? Soc. Sci. Q. 2016, 98, 261–281. [Google Scholar] [CrossRef]
  149. Wilkinson, R.G.; Pickett, K.E. Income Inequality and Social Dysfunction. Ann. Rev. Sociol. 2009, 35, 493–511. [Google Scholar] [CrossRef]
  150. Scruggs, L.; Allan, J. Welfare-state decommodification in 18 OECD countries. J. Eur. Soc. Policy 2006, 16, 55–72. [Google Scholar] [CrossRef]
  151. Scruggs, L.; Hayes, T.J. The Influence of Inequality on Welfare Generosity. Polit. Soc. 2017, 45, 35–66. [Google Scholar] [CrossRef]
  152. Brickman, P.; Campbell, D.T. Hedonic relativism and planning the good society. In Adaptation Level Theory: A Symposium; Appley, M.H., Ed.; Academic Press: New York, NY, USA, 1971. [Google Scholar]
  153. Headey, B. Life Goals Matter to Happiness: A Revision of Set-Point Theory. Soc. Indic. Res. 2008, 86, 213–231. [Google Scholar] [CrossRef]
  154. Merton, R.K. Social Structure and Anomie. Am. Sociol. Rev. 1938, 3, 672–682. [Google Scholar] [CrossRef]
  155. Pierson, P. Increasing Returns, Path Dependence, and the Study of Politics. Am. Polit. Sci. Rev. 2000, 94, 251–267. [Google Scholar] [CrossRef]
  156. Lockerbie, B. Economics and Politics: Egocentric or Sociotropic? Am. Rev. Polit. 2006, 27, 191–208. [Google Scholar] [CrossRef]
  157. Larsen, C.A. How three narratives of modernity justify economic inequality. Acta Sociol. 2016, 59, 93–111. [Google Scholar] [CrossRef] [Green Version]
  158. Crepaz, M.M.L. Rumors that Diversity is the Death of the Welfare State Are Greatly Exaggerated. In Handbook on Migration and Social Policy; Freeman, G.P., Mirilovic, N., Eds.; Edward Elgar: Cheltenham, UK, 2016; pp. 293–329. [Google Scholar]
  159. Brint, S.; Cunningham, W.L.; Rebecca, S.K.L. The Politics of Professionals in Five Advanced Industrial Societies. In Citizen Politics in Post-Industrial Societies; Clark, T.N., Ed.; Routledge: New York, NY, USA, 1997. [Google Scholar]
  160. Esping-Andersen, G. Welfare states and the economy. In The Handbook of Economic Sociology; Smelser, N.J., Swedberg, R., Eds.; Princeton University Press: Princeton, NJ, USA, 1994; pp. 711–732. [Google Scholar]
  161. Korpi, W. The Working Class in Welfare Capitalism; Routledge & Kegan Paul: London, UK, 1978. [Google Scholar]
  162. Stephens, J.D. Class Formation and Class Consciousness. Br. J. Sociol. 1979, 30, 389–414. [Google Scholar] [CrossRef]
  163. Treiman, D.J. Occupational Prestige in Comparative Perspective; Academic Press: New York, NY, USA, 1977. [Google Scholar]
  164. Ganzeboom, H.B.G.; Treiman, D.J. Internationally Comparable Measures of Occupational Status for the 1988 International Standard Classification of Occupations. Soc. Sci. Res. 1996, 25, 201–239. [Google Scholar] [CrossRef]
  165. Featherman, D.L.; Hauser, R.M. On the Measurement of Occupation in Social Surveys. Sociol. Methods Res. 1973, 2, 239–251. [Google Scholar] [CrossRef]
  166. Hodge, R.W.; Siegel, P.M.; Rossi, P.H. Occupational Prestige in the United States, 1925–1963. Am. J. Sociol. 1964, 70, 286–302. [Google Scholar] [CrossRef]
  167. Siegel, P.M.; Hodge, R.W. A causal approach to measurement error. In Methodology in Social Research; Blalock, H.M., Blalock, A., Eds.; McGraw-Hill: New York, NY, USA, 1968; pp. 28–59. [Google Scholar]
  168. Duncan, O.D. A Socioeconomic Index for all Occupations. In Occupations and Social Status; Reiss, A.J., Ed.; Free Press: New York, NY, USA, 1961; pp. 109–138. [Google Scholar]
  169. Hodge, R.W. The measurement of occupational status. Soc. Sci. Res. 1981, 10, 396–415. [Google Scholar] [CrossRef]
  170. Clifford, S.; Jewell, R.M.; Waggoner, P.D. Are samples drawn from Mechanical Turk valid for research on political ideology. Res. Polit. 2015, 2. [Google Scholar] [CrossRef]
  171. Weinberg, J.D.; Freese, J.; McElhattan, D. Comparing Data Characteristics and Results of an Online Factorial Survey between a Population-Based and a Crowdsource-Recruited Sample. Sociol. Sci. 2014, 1, 292–310. [Google Scholar] [CrossRef] [Green Version]
  172. Springer, V.A.; Vezich, I.S.; Lindsey, S.C.; Martini, P.J. Practice-based considerations for using multi-stage survey design to reach special populations on Amazon’s Mechanical Turk. Surv. Pract. 2016, 9, 2800. [Google Scholar] [CrossRef]
Figure 1. The welfare state and its public. Description. 30 never-Communist societies, 71 surveys, 1987–2009, with 88,904 individual respondents.
Societies 08 00105 g001
Figure 2. Measurement of welfarism: Scale combining government social spending and corporatist labor market policies. Correlations (pairwise-present). 30 never-Communist societies, 1987–2009.
Societies 08 00105 g002
Figure 3. Measurement of redistributive attitudes: Correlations, confirmatory factor loadings, and other statistics. Entries in plain text are based on data for all 30 nations; those in grey text are available only for the 3 never-Communist countries also in the International Survey of Economic Attitudes.
Societies 08 00105 g003
Figure 4. International patterns of welfarism. Welfarism is measured by the scale combining social spending and corporatism. Nations are identified by UN code and common English name.
Societies 08 00105 g004
Figure 5. Inequality (measured by the Gini coefficient) as a function of welfarism and GDP. OLS regression coefficients. 30 nations, 1987–2009.
Societies 08 00105 g005
Figure 6. The inequality perception question as shown to respondents.
Societies 08 00105 g006
Figure 7. Perceptions of societal inequality. Country means and OLS fit lines (welfarism scale: solid red. Esping-Andersen: dashed green).
Societies 08 00105 g007
Figure 8. How much inequality OUGHT we have? County means and OLS fit lines (welfarism scale: solid red. Esping-Andersen: dashed green).
Societies 08 00105 g008
Figure 9. Image of society: How egalitarian is is now? How egalitarian OUGHT it be? Effects of welfarism: Standardized OLS regression coefficients. Aggregate data for 28 nations, 1987–2009.
Societies 08 00105 g009
Figure 10. Demographic and SES differences in images of how egalitarian society is, and how egalitarian it ought to be, are small. Multilevel regression results; standardized coefficients. Sensitivity tests using alternative definitions of welfarism show the same pattern (Appendix D).
Societies 08 00105 g010
Figure 11. Percent distributions for the 2 items in the redistribution attitudes scale.
Societies 08 00105 g011
Figure 12. How much redistribution ought we have? Country means and OLS fit lines (welfarism: solid red; Esping-Andersen: dashed green).
Societies 08 00105 g012
Figure 13. Welfarism and attitudes toward income redistribution. Standardized OLS regression coefficients. Aggregate data for 30 nations, 1987–2009.
Societies 08 00105 g013
Figure 14. Welfarism and attitudes toward income redistribution. Welfarism measured in four alternative ways. Multilevel regression estimated by GLS. Individual level data for 30 nations, 1987–2009.
Societies 08 00105 g014
Figure 15. Differences between individual countries in attitudes toward income redistribution: Divergence from the worldwide pattern. Most supportive countries highlighted in blue, least supportive in red. English speaking countries (green type) average about 10 points less supportive of redistribution net of everything else (t = −3.55, p < 0.001).
Societies 08 00105 g015
Figure 16. Welfarism and attitudes toward income redistribution. Multilevel regression with a cross-level interaction between welfarism and income, estimated by GLS. Metric coefficients (Panel A) and predicted values (Panel B). Individual level data for 30 nations, 1987–2009. Sensitivity tests using alternative welfarism definitions show the same pattern (Appendix E).
Societies 08 00105 g016
Figure 17. Differences between rich and poor in attitudes towards income redistribution. 95% confidence intervals from multilevel regression controlling for age, gender, education, and GDP.
Societies 08 00105 g017
Figure 18. Effect of family income on support for income redistribution (points out of 100). OLS regression estimates separately for each nation, controlling for gender, date of birth, and education. Number of cases shown in the previous figure. Nations ordered by language and welfarism.
Societies 08 00105 g018
Figure 19. Influences on attitudes toward income redistribution in the United States, 2016–2017: Background, socioeconomic status, self-interest, perceptions of society, goals for society, and political party (assumed to be in that causal order). Standardized partial regression coefficients. Self-interest (egotropic) considerations in red; matters related to the general good (sociotropic influences) in blue; and personal preferences about inequality in green. Coefficients which are not statistically significant at p < 0.05 are in grey. Total effects in dashed blue outline, assuming the causal order shown; direct effects in Column 6; indirect effects are the difference between them.
Societies 08 00105 g019

