Article

The Effects of Perceived Neighborhood Diversity on Preferences for Redistribution: A Pilot Study

by
Liza G. Steele
1,* and
Krystal M. Perkins
2,*
1
Sociology, John Jay College of Criminal Justice, City University of New York, New York, NY 10019, USA
2
Psychology, Purchase College, State University of New York, Purchase, NY 10577, USA
*
Authors to whom correspondence should be addressed.
Societies 2018, 8(3), 82; https://doi.org/10.3390/soc8030082
Submission received: 15 June 2018 / Revised: 10 August 2018 / Accepted: 3 September 2018 / Published: 10 September 2018
(This article belongs to the Special Issue Attitudes about Inequalities)

Abstract

:
A substantial literature exists within sociology and political science positing a negative link between racial/ethnic heterogeneity and a host of social goods issues. Recent large-scale meta-analyses, however, have established that the effect of racial/ethnic heterogeneity on social policy attitudes may be more salient at the local or even neighborhood level. In extending this work, we examined how racial/ethnic heterogeneity affects attitudes about redistribution within one of the most diverse and ethnically heterogeneous cities in the world, New York City. Specifically, we assessed the effects of perceived neighborhood racial/ethnic heterogeneity on preferences for redistribution and social policies among members of majority and minority groups. A diverse sample of New York City residents recruited through Amazon Mechanical Turk (mTurk) responded to a series of questions regarding their perceptions of the diversity of their neighborhood before indicating their social policy preferences. We found that neighborhood racial/ethnic heterogeneity was associated with greater support for redistribution and social policies. The only evidence of a negative association with support for redistribution or social policies was for black and white respondents living in majority white neighborhoods. Together, these data suggest that perceptions of racial/ethnic heterogeneity on redistributive and social policy attitudes may be a function of one’s group status. Implications for the existing research are discussed. In particular, we believe this work offers new insights into the relationship between racial/ethnic heterogeneity and social policy preferences.

1. Introduction

Ethnically diverse and heterogeneous communities are the cornerstones of multicultural societies. International migration and global mobility have created an ethnically diverse world where more people live outside of their countries of birth than ever before [1]. Racial/ethnic heterogeneity has the potential to enrich communities by providing opportunities for diverse sets of people to interact with one another, allowing for the sharing and blending of new ideas and perspectives. Indeed, prior research has shown that multicultural and diversifying experiences are associated with increased flexible thinking and creativity [2,3]. Despite the potential benefits of diversity and racial/ethnic heterogeneity, the effect of diversity and racial/ethnic heterogeneity on communities has been a highly debated topic within the academic research literature. In particular, a large body of evidence suggests a negative relationship between racial/ethnic heterogeneity and a host of social policy preferences and related phenomena, including social cohesion, trust, social spending, and attitudes about redistribution. Scholars, politicians, and public figures from both the left and right wing of the political spectrum have thus concluded that greater diversity will inevitably lead to demands for the retrenchment of welfare state benefits, a conundrum for those on the left known as the “progressive’s dilemma” [4,5,6,7]. The common underlying theme of this work and the related claims of public figures is that racial/ethnic heterogeneity may be deleterious to community life.
The purpose of our paper is twofold. First, we aim to examine the question of how racial/ethnic heterogeneity affects attitudes about redistribution and social policies at the neighborhood level within one of the most diverse and ethnically heterogeneous cities in the world, New York City. Many of the studies of the effects of immigration and diversity on attitudes have focused on countries or regions that are rapidly becoming more diverse, while the context we analyze, New York City, has been defined by its diversity and openness to newcomers for decades, if not centuries. Second, previous research suggests that the effect of racial/ethnic heterogeneity on attitudes about redistribution and social policies may be more context-dependent than country-level studies would suggest [8,9]. Following this logic, there is reason to believe that the relationship between racial/ethnic heterogeneity and attitudes about redistribution and social policies may mean different things for different racial and ethnic groups. As such, we assess the effects of perceived neighborhood racial/ethnic heterogeneity on preferences for redistribution and social policies among members of majority and minority groups in the highly diverse context of New York City. To begin, we provide a brief overview of the existing evidence that investigates this link. We then describe our specific hypotheses and current study.

The Diversity Paradox

A number of studies have examined how the racial and ethnic composition of a community is related to a medley of public goods provisions and attitudes about them, including social cohesion, redistribution, and public spending. In one of the most cited pieces of work on the topic of social cohesion, Robert Putman presented the findings from his research program that investigated the relationship between ethnic diversity and social cohesion [6]. The major contribution of this work was the assertion that social connections, intergroup trust, and cohesion (operationalized as the interconnectedness between individuals, using the Social Capital Community Benchmark Survey), are all lower in ethnically diverse populations. In such communities, according to Putnam, ethnic diversity seems to cause people to “hunker down and retreat from social life” (p. 147). This assertion has come to be known as the constrict proposition. The constrict proposition has its origins in a related set of conflict theories that all purport that diverse social environments induce feelings of threat between groups, arising out of the perceived (real or imagined) competition for scarce resources. Consequently, racial/ethnic diversity and heterogeneity give rise to this perceived threat, resulting in stereotyping, discriminatory treatment, and diminished social cohesion.
Following Putnam’s controversial 2007 study, a wealth of empirical studies and meta-analyses have been produced evaluating the proposed relationship in different contexts and using different indicators of social cohesion [10]. Some studies have established that diversity undermines social cohesion, and other studies have found no such link or have established a positive relationship between ethnic diversity and social cohesion [11,12,13]. More recently, scholars have started to investigate the conditions under which the negative relationship between ethnic diversity and social cohesion are more likely to appear [9,14]. For example, Van der Meer and Tolsma’s large-scale review concluded that there is no fundamental association between racial/ethnic heterogeneity and various indicators of social cohesion, but that racial/ethnic heterogeneity may be deleterious to social cohesion at the neighborhood level and most consistently within the context of the United States [9].
In a related set of scholarship, empirical studies also suggest that racial/ethnic diversity and heterogeneity matter for actual public spending. These studies have investigated the association between racial/ethnic diversity and public spending across various countries and within cities and states in the United States [15,16,17,18,19]. In an early study by Mueller and Murell, the authors found that among a subset of Organization of Economic Development (OECD) countries, public spending was negatively related to a country’s ethnic diversity [20]. Other more recent work has also shown that ethnic diversity, as measured by the number, size, or geographical location of ethnic and racial groups, is negatively related to health, education, and welfare spending. Similar findings have also been noted in other countries, including Sweden and Germany, where individuals are less supportive of welfare spending in regions where the proportion of foreign-born residents is larger [21,22]. Within the context of the United States, previous studies have also indicated that as the proportion of racial diversity increases, taxes for education, trash disposal, and welfare decrease [15,23]. Cross-national studies on the topic have also concluded that ethnic fractionalization is negatively correlated with social spending [16,18,19]. Although this work has been criticized for relying heavily on the context of the United States and failing to address general issues of measurement and comparability across countries, the overall conclusion suggests that racial/ethnic heterogeneity may erode actual social spending and redistribution.
Empirical work has also extended the question to the relationship between racial/ethnic diversity and attitudes about social spending, often called “preferences for redistribution”. The most consistent evidence for a negative relationship between diversity and support for redistribution comes from the United States. In interpreting this relationship, several bodies of scholarship argue that redistribution attitudes are highly racialized within the United States [24,25]. For example, scholars have found that welfare opposition is associated with negative attitudes toward blacks, the threat posed by the number of blacks in relation to whites, and both [24,26,27].
Outside of the United States, cross-national studies have yielded more mixed results with some large-scale studies demonstrating little to no association between racial/ethnic diversity and support for social spending [28,29,30,31]. For example, through a study of individual-level attitudes in 91 countries, Steele found that racial/ethnic diversity was not negatively related to redistribution attitudes, and may actually be positively related to support for redistribution [28]. Likewise, experimental studies have not consistently established a causal link between racial/ethnic diversity and related phenomenon like support for public goods [13].
Taken together, the reviewed research suggests that a more nuanced relationship exists between racial/ethnic diversity and the different indicators of social goods. Within the social cohesion and attitudes about spending literatures, the clearest evidence of a negative relationship exists within the context of the United States. These findings are consistent with the racialized political environment of the United States. Outside of the United States, the negative relationship appears more spurious, yielding little evidence of a negative association. Regarding actual spending, the overall conclusion within the United States and cross-nationally seems to be that racial/ethnic diversity is negatively associated with actual social spending, such that as the proportion of racial/ethnic diversity increases, social spending decreases. Despite these patterns, it is unclear whether they reflect people’s everyday experiences with racial/ethnic diversity. In particular, this body of research has largely utilized national or cross-national measures, and occasionally regional measures, to draw conclusions about racial/ethnic diversity and social goods. However, the national or cross-national context—and even the regional context—may be too large to be relevant in people’s everyday localized contexts [29].
Indeed, there is some evidence to suggest that national and cross-national measures are not ideal indicators of racial/ethnic diversity, and that smaller geographic units are better able to capture people’s experiences of diversity [32,33,34]. Some scholars have also suggested that it is actually neighborhood diversity that is most salient for inter-group relations because it is more relevant to people’s actual everyday experiences [9,10,32,33]. Thus, the extent to which the relationship between racial/ethnic heterogeneity and social goods is positive or negative may be contingent on whether people have the opportunity to have inter-group interactions.
Using New York City as a case study, we examine these related questions of how racial/ethnic heterogeneity is related to attitudes about redistribution at the neighborhood level. New York City is one of the most diverse and ethnically heterogeneous cities in the world. According to recent U.S. Census data, 40 percent of the New York City population was born outside of the United States. Immigrants make up the majority of some neighborhoods, and the borough of Queens alone is the most linguistically and ethnically diverse county in the United States. [35]. New York City is also a unique case to examine because it is a city that has consistently been diverse. Unlike other cities and countries that are experiencing recent surges in racial/ethnic or immigrant groups, New York City’s has a long history of being the home to people of many different racial, ethnic, and immigrant backgrounds, and stands as a source of pride for people that live in the city. At the same time, however, it is a city that is highly segregated residentially and in the realm of public education. Hence, the social context of New York City provides an important test of the diversity/social policy link.
In addition to the general effects of racial/ethnic diversity, there is reason to believe that heterogeneity may mean different things for different ethnic and racial groups. Within the context of the United States, a racial hierarchical system exists that has privileged whites and disadvantaged people of color. Undoubtedly, because of the racial dimensions of American society, members of majority and minority groups will likely be affected differently by racial/ethnic heterogeneity or homogeneity [36,37]. For members of majority groups (e.g., whites), racial/ethnic heterogeneity may be threatening because of the perceived challenge that racial diversity represents to members of majority groups’ power in society [38]. Indeed, a substantial body of evidence suggests that the perceived size of diverse groups has a direct bearing on members of majority groups’ attitudes and feelings toward those groups. Early studies, for example, have established that anti-minority attitudes increased in white respondents as the proportion of minorities in the population increased [27,39,40,41,42]. Similarly, subjective perceptions of larger immigrant groups were also associated with anti-immigrant attitudes [43]. Some research has also confirmed that whites feel less trust in their neighborhoods as the concentration of blacks and Hispanics increases [36]. Other research has also examined more directly how racial/ethnic demographics affect social policy attitudes of members of majority groups [44,45,46,47,48,49]. For example, Wetts and Willer found that presenting data to respondents indicating that the racial income gap was declining led to greater anti-welfare attitudes among whites, but only when those programs were portrayed as benefiting minorities [49]. Together, these findings suggest that racial/ethnic diversity may be associated with whites’ opposition to social policies. In line with this reasoning, we hypothesize that:
Hypothesis 1.
Among members of majority groups, living in a racially/ethnically heterogeneous neighborhood decreases support for redistribution.
However, the contact hypothesis also proposes that increasing population diversity can provide opportunities for groups to interact with one another, which in turn may reduce prejudices and promote positive feelings and trust [50,51]. In the widely cited 2007 experimental study using public goods games in Uganda, Habyarimana et al. demonstrated that frequent social interactions between ethnic groups enhanced support for public goods provision [52]. Studies in the United States have also shown that whites who had had a black person as a guest in their home were more supportive of social welfare spending [53,54]. Other related studies have found that interactions with Latinos reduced stereotypes about Latinos and decreased opposition to immigration [55,56]. Based on the contact hypothesis, we hypothesize a competing hypothesis for living in ethnically heterogeneous neighborhoods for members of majority and minority groups:
Hypothesis 2.
Among members of majority and minority groups, living in a racially/ethnically heterogeneous neighborhood increases support for redistribution.
What are the implications for redistribution attitudes of living in racially/ethnically homogeneous communities for a member of a majority or minority group? In line with the contact hypothesis, in racially/ethnically homogeneous communities, there are fewer regular personal interactions with diverse groups. The lack of contact with individuals of diverse racial and ethnic backgrounds may reinforce prejudices and be associated with less support for redistribution policies, at least for members of majority groups. This idea is underscored by Simpson and Yinger’s early observation that “prejudice is sometimes explained by a lack of contact with members of minority groups…” [57] (p. 117). On the basis of this logic, we hypothesize that:
Hypothesis 3.
Among members of majority groups, living in a racially/ethnically homogeneous neighborhood (e.g., predominantly white) decreases support for redistribution.
For members of minority groups, we believe that living in a racially/ethnically homogeneous neighborhood may actually be associated with more support for redistribution. In a racially/ethnically homogeneous neighborhood, ethnic minorities are the numerically dominant group, but often not in the larger surrounding community. In this context, minorities may develop a sense of identity and pride, but also understand the limits of their power, more broadly. This amalgamation of identity, pride, and knowledge about the limits of their power may be expressed by more support for redistribution. To our knowledge, very few research studies have examined these ideas empirically. One exception is the early study of Massey et al. on ethnic intolerance and population arrangements in the former Yugoslavia [58]. They found that minorities living in neighborhoods where they were the numerically dominant group (e.g., ethnic enclaves) were more intolerant of the status quo and the dominant majority group than those living outside ethnic enclaves. Thus, in line with this reasoning, we hypothesize that:
Hypothesis 4.
Among members of minority groups, living in racially/ethnic homogeneous neighborhoods (predominantly black and Latinx) increases support for redistribution.
To summarize, there is considerable nuance in the findings about the effects of racial/ethnic diversity and heterogeneity on a variety of social goods issues. While some scholars conclude that racial status threat may shape majority groups’ (whites’) opposition to social policies, others have presented evidence suggesting that the increased intergroup contact in diverse locales reduces intergroup prejudice and promotes positive feelings and trust. Numerous scholars have proposed that diversity’s effects on social goods issues should be most salient at the neighborhood level, although empirical scholarship in this area remains limited. Moreover, previous studies have largely failed to account for the different effects of living in diverse areas on members of majority versus minority groups.
In extending this work, our research makes a number of important contributions. First, our paper addresses an important dimension of the diversity literature. In particular, our research is one of a few studies to examine how racial/ethnic diversity at the neighborhood level affects people’s attitudes about redistribution and social policies. We believe neighborhood-level data allow for better examination of the effects of diversity because it is more relevant to people’s experiences. Secondly, we evaluate these ideas among members of majority and minority groups, separately [36,37]. Because of the racial dynamics of the United States, members of majority and minority groups will likely be affected differently by residing in a racially/ethnically heterogeneous or homogeneous neighborhood. To date, only a handful of studies have examined how the effects of diversity and heterogeneity operate for different racial and ethnic groups. Finally, our data come from residents living in New York City, arguably one of the most diverse cities in the world. New York City is a unique case for examining these issues because it has been a major destination point for all of the country’s ethnic and racial groups, as well as for immigrants of many nationalities. Together, we believe this work offers new insights into the relationship between racial/ethnic heterogeneity and social policy preferences. To explore these ideas, we designed a survey to assess the relationship between the effects of perceived neighborhood diversity on preferences for redistribution, and how this relationship might vary for members of different racial and ethnic groups.

2. Data and Methods

In May 2015, we conducted an original online survey that asked participants to respond to questions about their neighborhoods and their social policy and redistributive preferences. Informed consent was obtained from all participants before they took the online survey. The study was conducted in accordance with the protocol approved by the Institutional Review Board of the State University of New York, Purchase College (IRB Protocol Number 141561). Participants (N = 346) were recruited and paid through Amazon Mechanical Turk (mTurk). They were required to live in New York City1 and have a good mTurk performance rating.2 Data were not analyzed from participants who submitted an incorrect completion code, did not pass the screening questions, or did not complete the study. Applying these exclusion criteria left data from 320 participants for analysis. The sample was 37.5 percent female and 62 percent white with a median age of 29 (see Table 1 for a comparison of sample demographics with those of the populations of New York City and the United States). Despite demographic differences from the general population, which are typical of mTurk samples,3 recent research suggests that mTurk is a valid tool for evaluating political attitudes [60,61].

2.1. Outcome Measures

Questions about policy preferences were modeled on those from the 2009 and 2016 modules of the International Social Survey Programme (ISSP) [62,63].6 Respondents to the 2009 (“Social Inequality IV”) were asked to what extent they agreed or disagreed with the following statements where ‘1’ represented “strongly agree” and ‘5’ represented “strongly disagree”: “Differences in income in our country are too large” (henceforward, “income differences”); “It is the responsibility of the government to reduce the differences in income between people with high incomes and those with low incomes” (henceforward, “income equality”); “The government should provide a decent standard of living for the unemployed” (henceforward, “unemployment”); and “The government should spend less on benefits for the poor” (henceforward, “benefits poor”). In the latter statement, we changed “less” to “more.” For ease of interpretation, we reversed the ISSP coding of these items so that ‘1’ represents “strongly disagree” and ‘5’ represents “strongly agree.” On the basis of factor analyses, we constructed an index of the income equality, unemployment, and benefits poor items (“Index 1: Redistribution”; Cronbach’s alpha = 0.85).
Respondents to the 2016 (“Role of Government V”) module were asked: “On the whole, do you think it should or should not be the government’s responsibility to…” where the ISSP asks about several social policies. For each, respondents chose among ordinal categories for definitely should be, probably should be, probably should not be, and definitely should not be. For the purposes of this study, we included five of the most relevant items that were unique from the 2009 questions: “provide a job for everyone who wants one” (henceforward, “jobs”); “provide health care for the sick” (henceforward, “health”); “provide a decent standard of living for the old” (henceforward, “old age”); “give financial help to university students from low-income families” (henceforward, “student aid”); and “provide decent housing for those who can’t afford it” (henceforward, “housing”). For ease of interpretation, we reversed the ISSP coding of these items so that ‘1’ represents “definitely should not be” and ‘4’ represents “definitely should be”. On the basis of factor analyses, we constructed an index of the health, old age, student aid, and housing items (“Index 2: Social Policies”; Cronbach’s alpha = 0.89).
Mean responses to the policy attitudes questions are presented in Table 2. For comparison, mean responses to the ISSP U.S. surveys are also presented. Although the publicly available ISSP data do not allow for city-specific analyses, to best approximate the New York City (NYC) population, we also present estimates from ISSP respondents from large mid-Atlantic cities.

2.2. Key Explanatory Measures

Ethnic diversity is most often measured using an index of fractionalization, which measures the probability of two randomly selected individuals in society belonging to different ethno-linguistic groups [64,65]. However, many objections have been raised about the validity of this measure [18,66].
In this paper, we focus on perceived rather than actual diversity, since scholarship in psychology posits it to be more relevant for lived experiences [67]. To measure perceptions of neighborhood diversity, we asked respondents to estimate the proportion of people of different racial/ethnic backgrounds in their neighborhoods. Although survey respondents’ perceptions of group size may not be accurate, the perceptions themselves have been shown to be meaningful. For example, survey research, such as the 2000 General Social Survey (GSS) and Gallup data from 1990 and 2001, has demonstrated that whites overestimate the size of minority populations. Possible explanations for these distorted perceptions include exposure to media, residential segregation, racial stereotypes, and perceptions of group threat [68]. The distortions also have important consequences in that members of the majority group who have the most distorted perceptions of the sizes of minority groups also have the most negative attitudes toward them [39].
In our study, the questions about perceived community racial and ethnic composition are based on measures from the Project on Race and Ethnicity in Latin America (PERLA) surveys [69]. Respondents were asked to estimate the proportion of their neighbors who were of various races or ethnicities (white, black, Hispanic/Latinx, or other) using the following prompt: “In the present, in the neighborhood or community where you live, how many of your neighbors are …?” (answer choices included none, almost none, very few, less than half, close to half, and more than half). For the distribution of responses to these questions, see Figure 1 below.
For ease of interpretation, and to ensure a large enough number of observations per category of analysis, we recoded this measure into a three-category variable (“3-category” white, black, etc.) coded as ‘1’ low (none, almost none, very few), ‘2’ medium (less than half, close to half), and ‘3’ high (more than half) perceived levels of a group. In some cases, to explore differences between the perception of living around the most privileged group and the most stigmatized group, we focus on contrasting the effects of the perceived proportion of whites to those of the perceived proportion of blacks. In the Appendix A, we also present some results using a binary measure of perception of the size of racial/ethnic groups in which ‘0’ represents none, almost none, very few, and less than half; and ‘1’ represents close to or more than half.
We also construct a measure of neighborhood racial/ethnic diversity through creating an additive index of the four measures of the perceptions of the size of different racial/ethnic groups. The total is than divided by four so that values range from 1 to 5 where ‘1’ would represent relative homogeneity and ‘5’ would represent greater heterogeneity (large proportions of multiple groups). Figure 2 below shows how the index scores are distributed. Because of the small number of observations in some of these categories, we also construct a 3-category measure of low perceived diversity (index scores in the bottom quartile, or below 2.75), mid-level perceived diversity (index scores in the middle two quartiles, or between 2.75 and 3.25), and high perceived diversity (index scores in the top quartile, or above 3.25).
We also expect that the effects of the race/ethnicity of the respondents themselves on support for redistribution will vary depending on the ethnic composition of their neighborhoods. To measure race/ethnicity, we asked the standard question “What is your race/ethnicity? (Please choose all that apply).” As shown in Table 1, the ethnic and racial composition of our sample is remarkably consistent with the composition of the U.S. population, although it is not fully reflective of the diversity of New York City. Although we received a sizable enough number of responses from black (n = 44), Latinx (n = 33), and Asian (n = 42) respondents to perform some quantitative analyses limited to specific minority groups7, for more advanced quantitative analyses we compare white respondents (n = 220) to all minority respondents (n = 100).

2.3. Analytical Strategy

We offer an exploratory analysis of the relationship between perceived neighborhood ethnic composition and support for redistribution using the results of our mTurk study. Because this is a pilot study, we primarily present summary statistics. However, in some cases, we also conduct independent t-tests and model ordinary least squares (OLS) regressions. When necessary to facilitate cross-model comparisons, missing data are handled through list-wise deletion8.

3. Results

As a group, mTurk respondents are generally more liberal than respondents in more-representative samples [59,70]. Comparing responses to our support for redistribution questions to those of the U.S. samples and the samples of residents of large cities in the mid-Atlantic in the 2009 and 2016 waves of the ISSP (Table 2), we observe that our respondents may be more liberal than their counterparts in terms of attitudes about jobs, income differences, income equality, and unemployment. However, our respondents may be more conservative than the urban mid-Atlantic and even the U.S. samples with regard to attitudes about health, old age, student aid, and housing. Their responses about support for benefits for the poor were very similar to the results from the ISSP samples.
When we examine support for redistribution among our respondents by race (Figure 3 and Figure 4), we see that white people are generally the least supportive of redistribution, followed by Asians, then Latinxs, who are more supportive, and blacks, who are the most supportive.

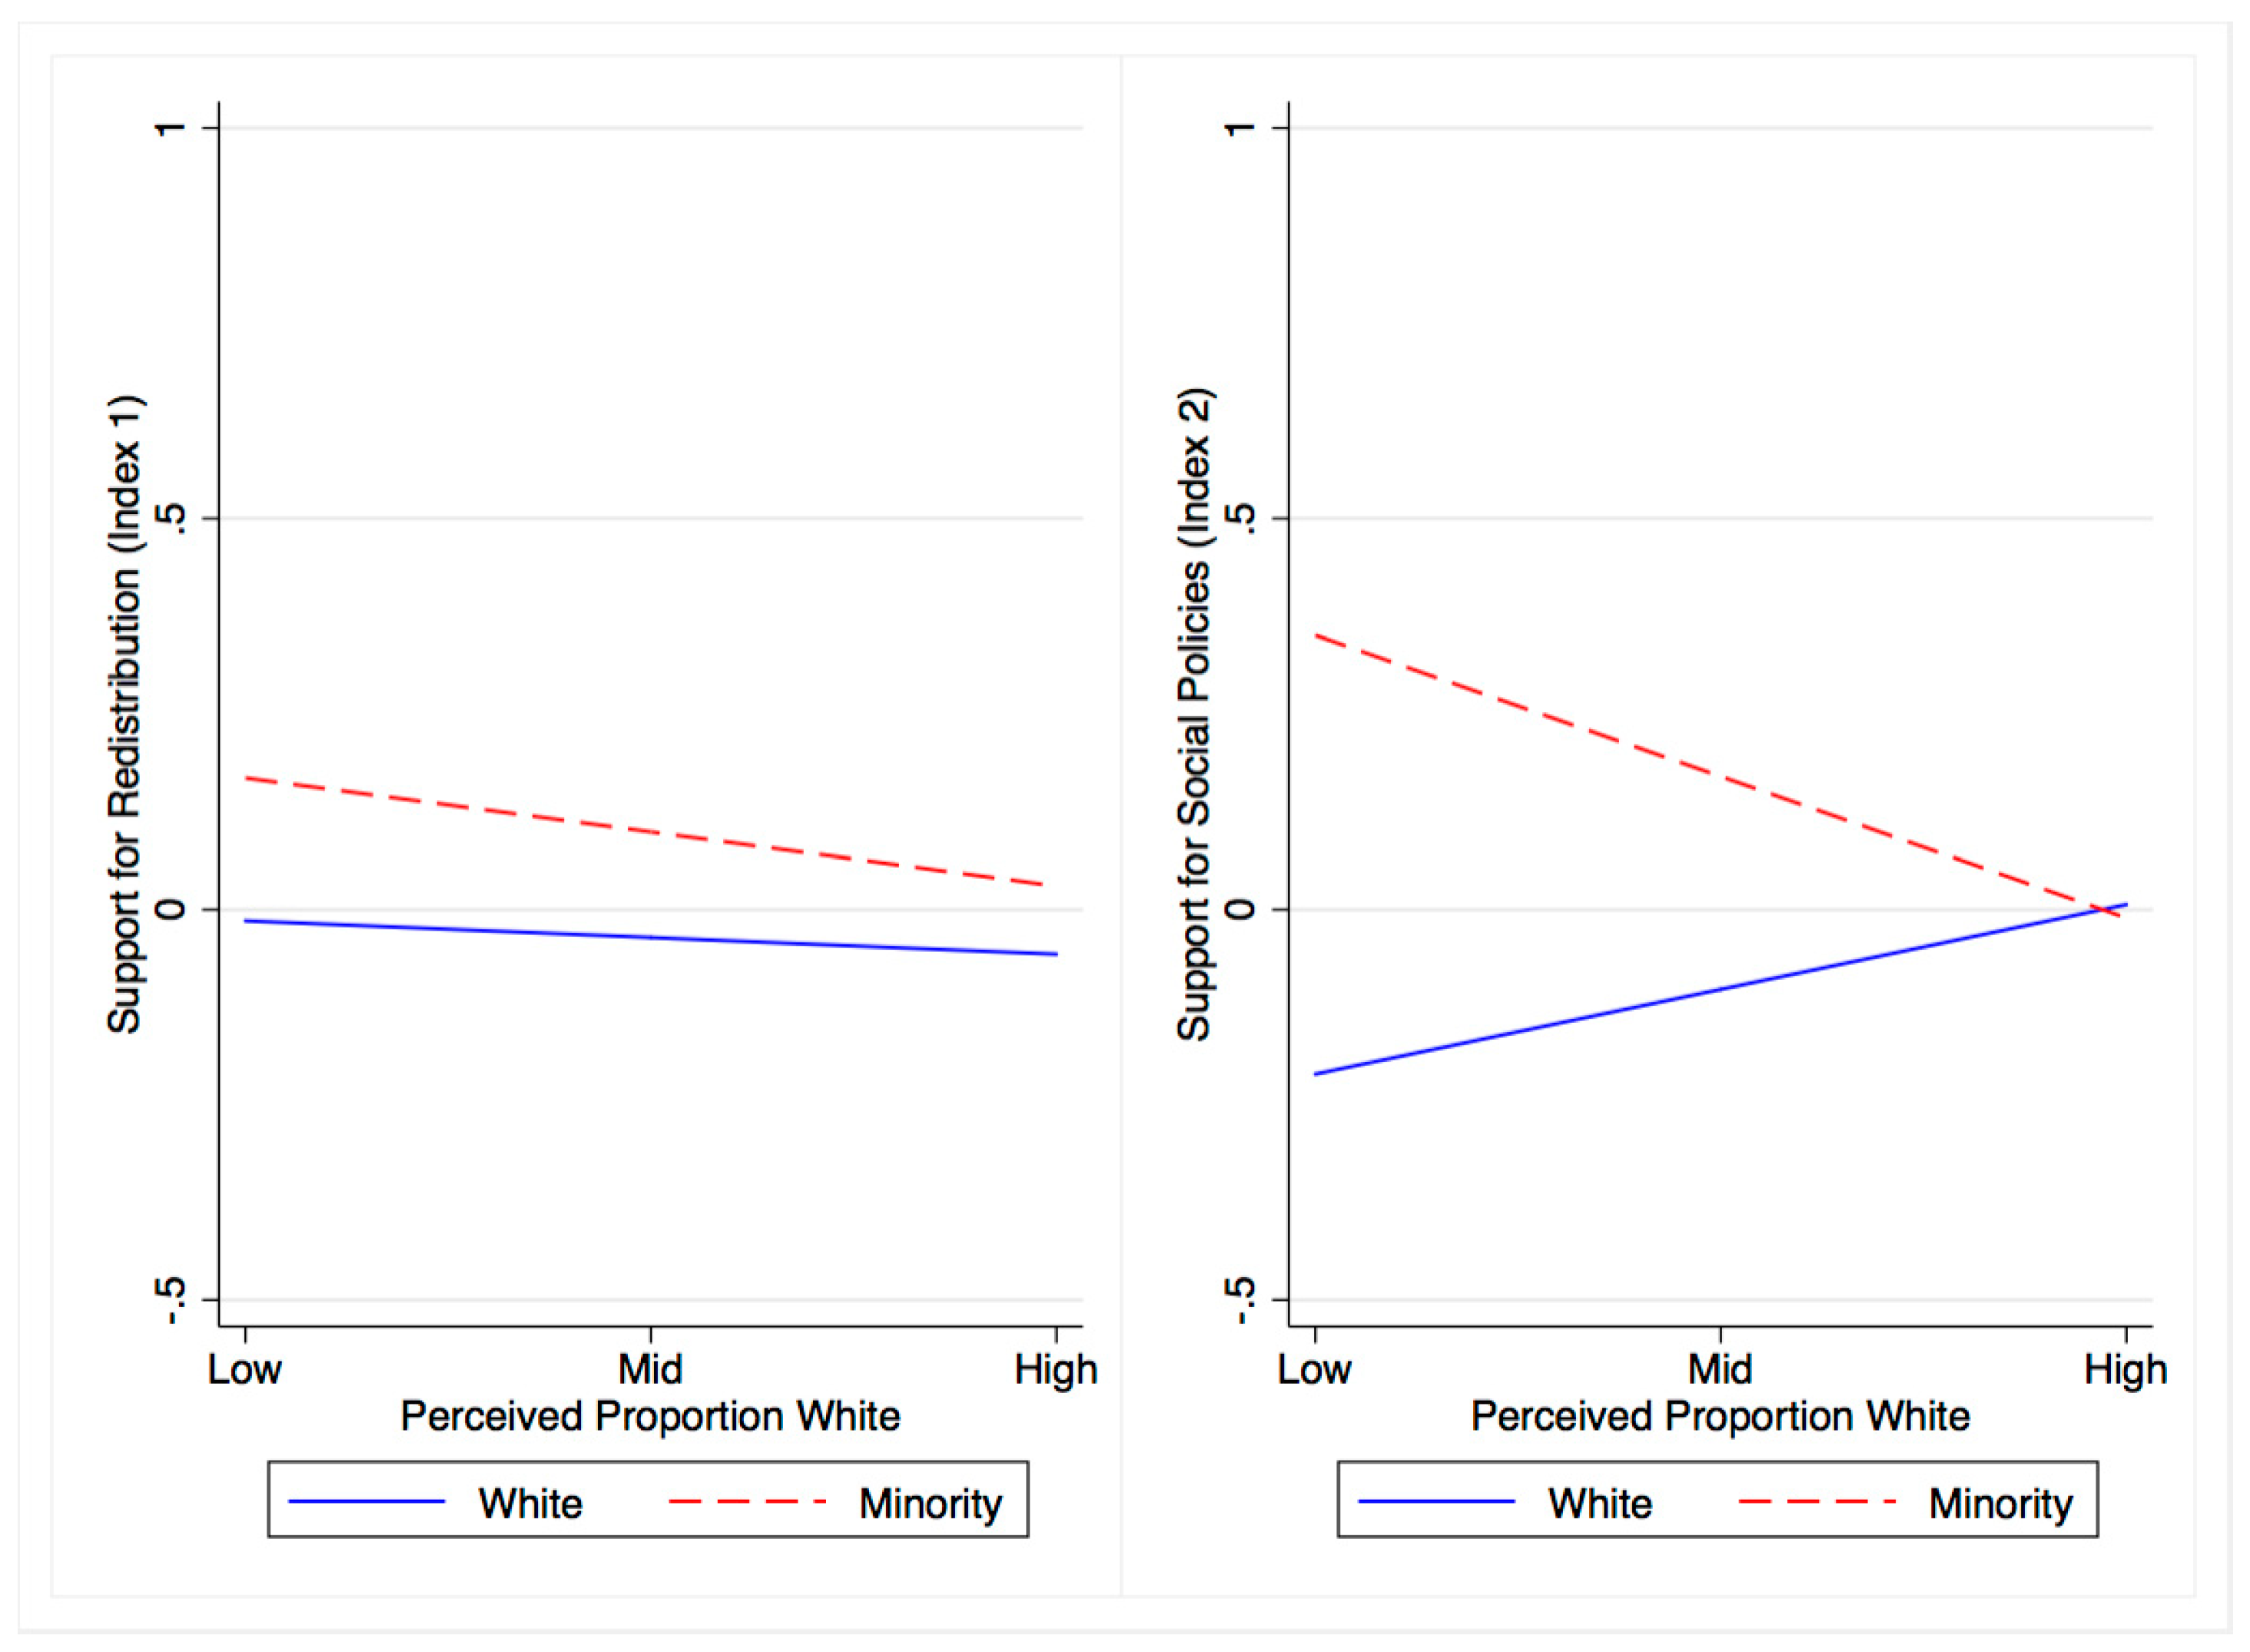
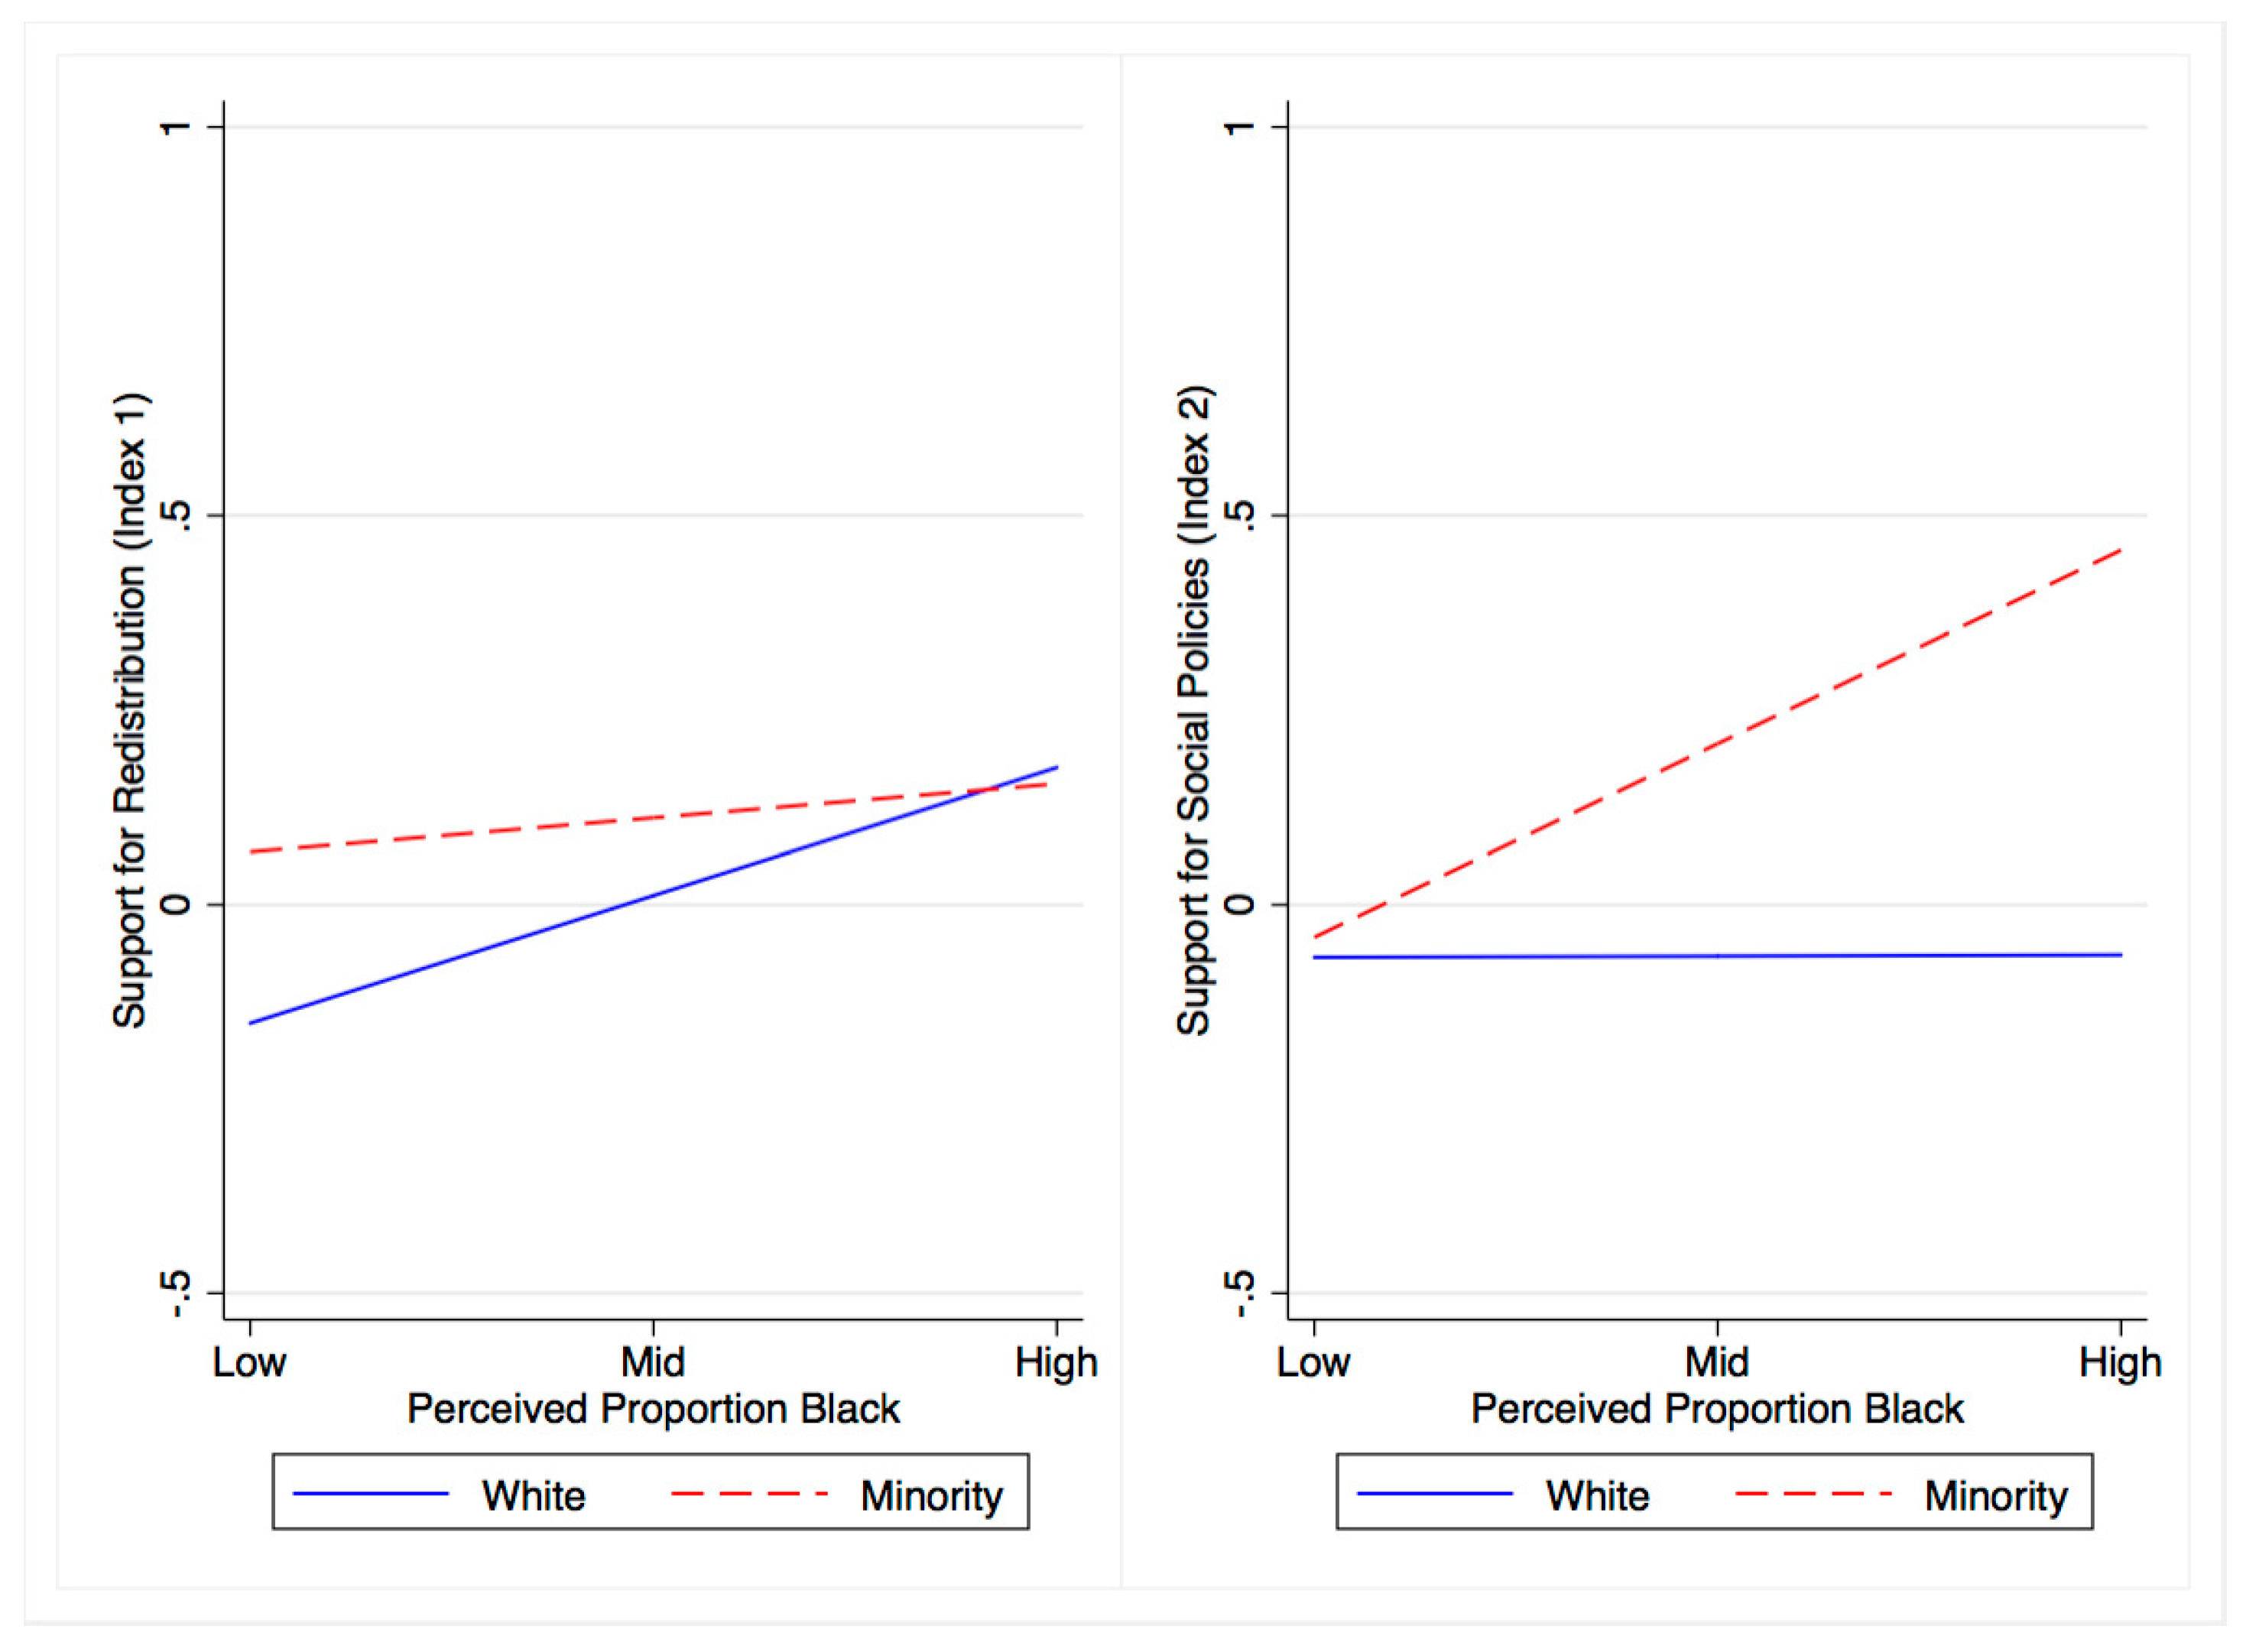
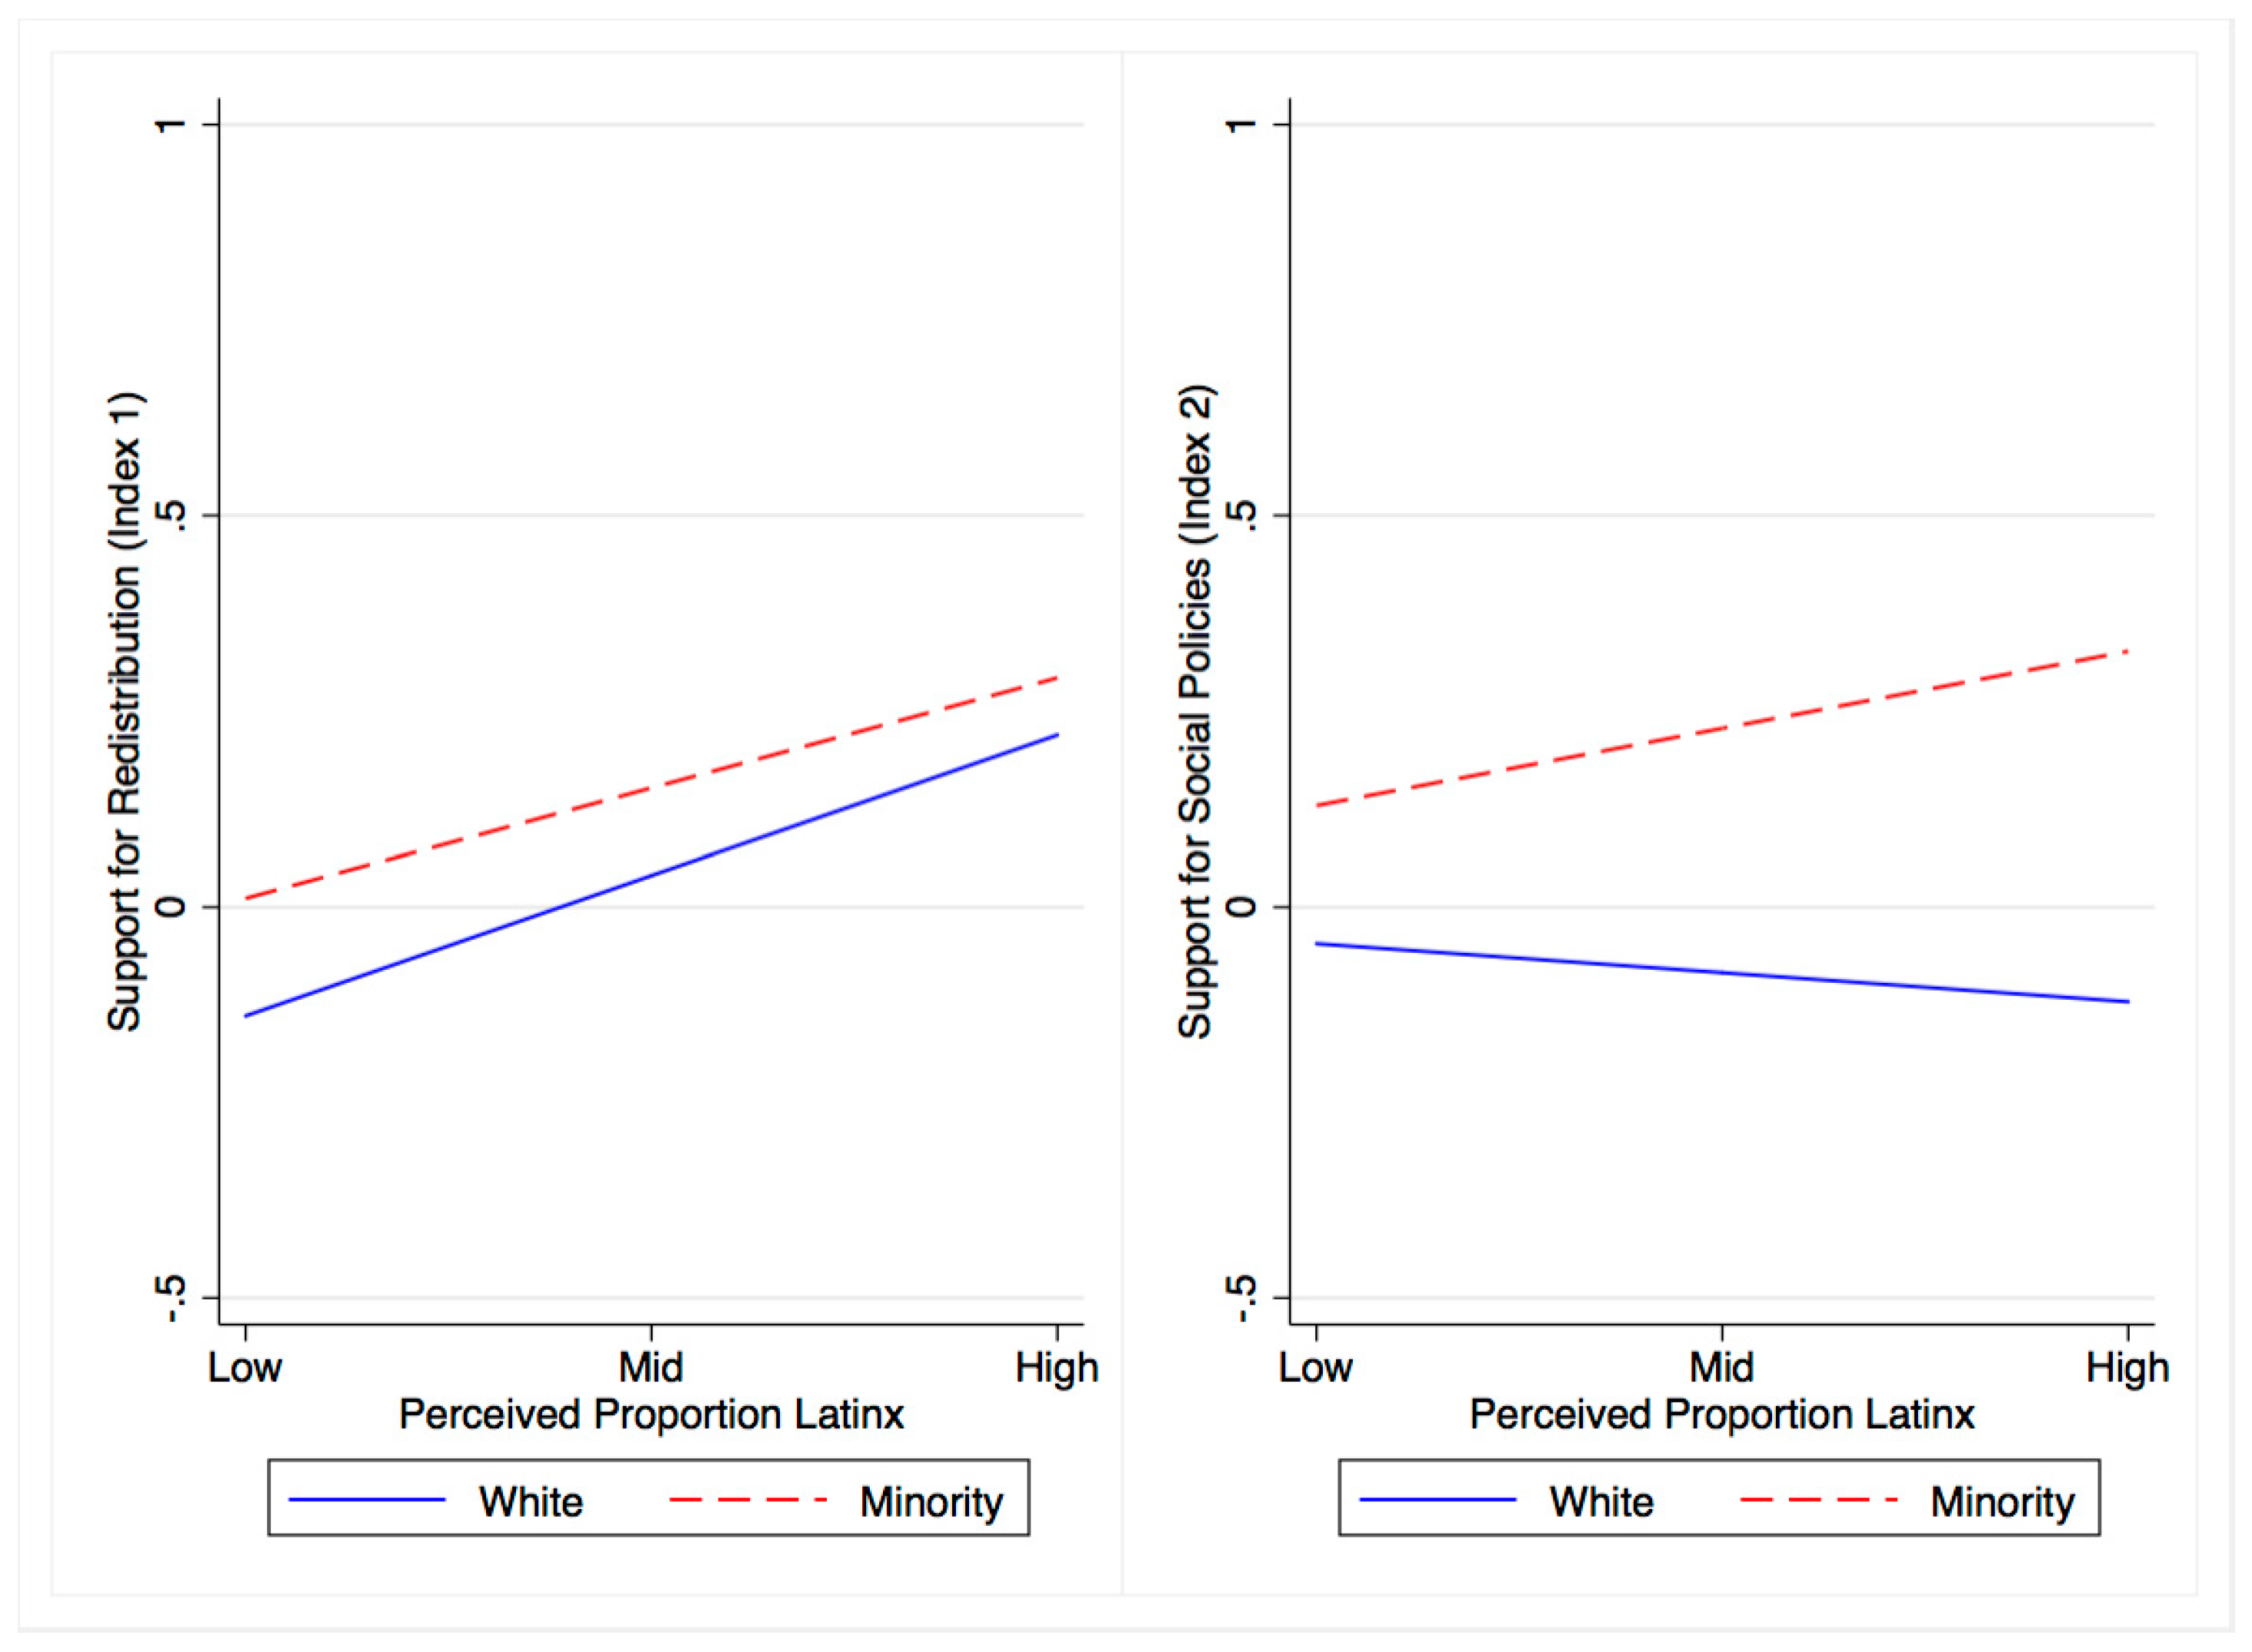
3.1. The Effect of Neighborhood Diversity

To examine whether our evidence supports the constrict or contact hypothesis, we first present standardized mean support for redistribution by level of perceived neighborhood diversity using the three-category measure, as shown in Figure 5 below. We observe that mean support for redistribution appears to increase as perceived level of diversity increases across both indices. Although we hesitate to draw strong conclusions from these descriptive results, the patterns are suggestive of greater perceived diversity being associated with greater support for redistribution.
Next, to test Hypotheses 1 and 2, independent t-tests were performed on white and minority members of the analytic sample to determine if there were differences in the means of either the index of support for redistribution or the index of support for social policies on the basis of whether the respondent perceived their neighborhood as being more diverse. The minority group consisted of 99 respondents, 31 of whom perceived their neighborhoods as highly diverse (31.1%). The white group consisted of 202 respondents, 63 of whom perceived their neighborhoods as highly diverse (31.2%). Interestingly, the percentages are almost identical of white and minority respondents who perceived their neighborhoods to be highly diverse. The results showed that support for redistribution (Index 1) was higher at near statistically significant levels (p = 0.083) among white people who perceived themselves as living in more diverse neighborhoods (3.70 ± 0.12) than white respondents who perceived themselves as living in less diverse neighborhoods (3.48 ± 0.09). There were no statistically significant or near-significant differences among minority respondents for support for redistribution (Index 1), nor for white respondents for support for social policies (Index 2). However, the results showed that support for social policies was higher at near-significant levels (p = 0.056) among minority respondents who perceived themselves as living in more diverse neighborhoods (3.38 ± 0.12) than minority respondents who perceived themselves as living in less diverse neighborhoods (3.10 ± 0.10). Thus, we find some support for the contact hypothesis (Hypothesis 2) that both majority and minority group members living in more heterogeneous neighborhoods are more supportive of redistribution and social policies. We do not find any support for the constrict hypothesis (Hypothesis 1). The results of the independent t-tests are summarized in Table 3 below.

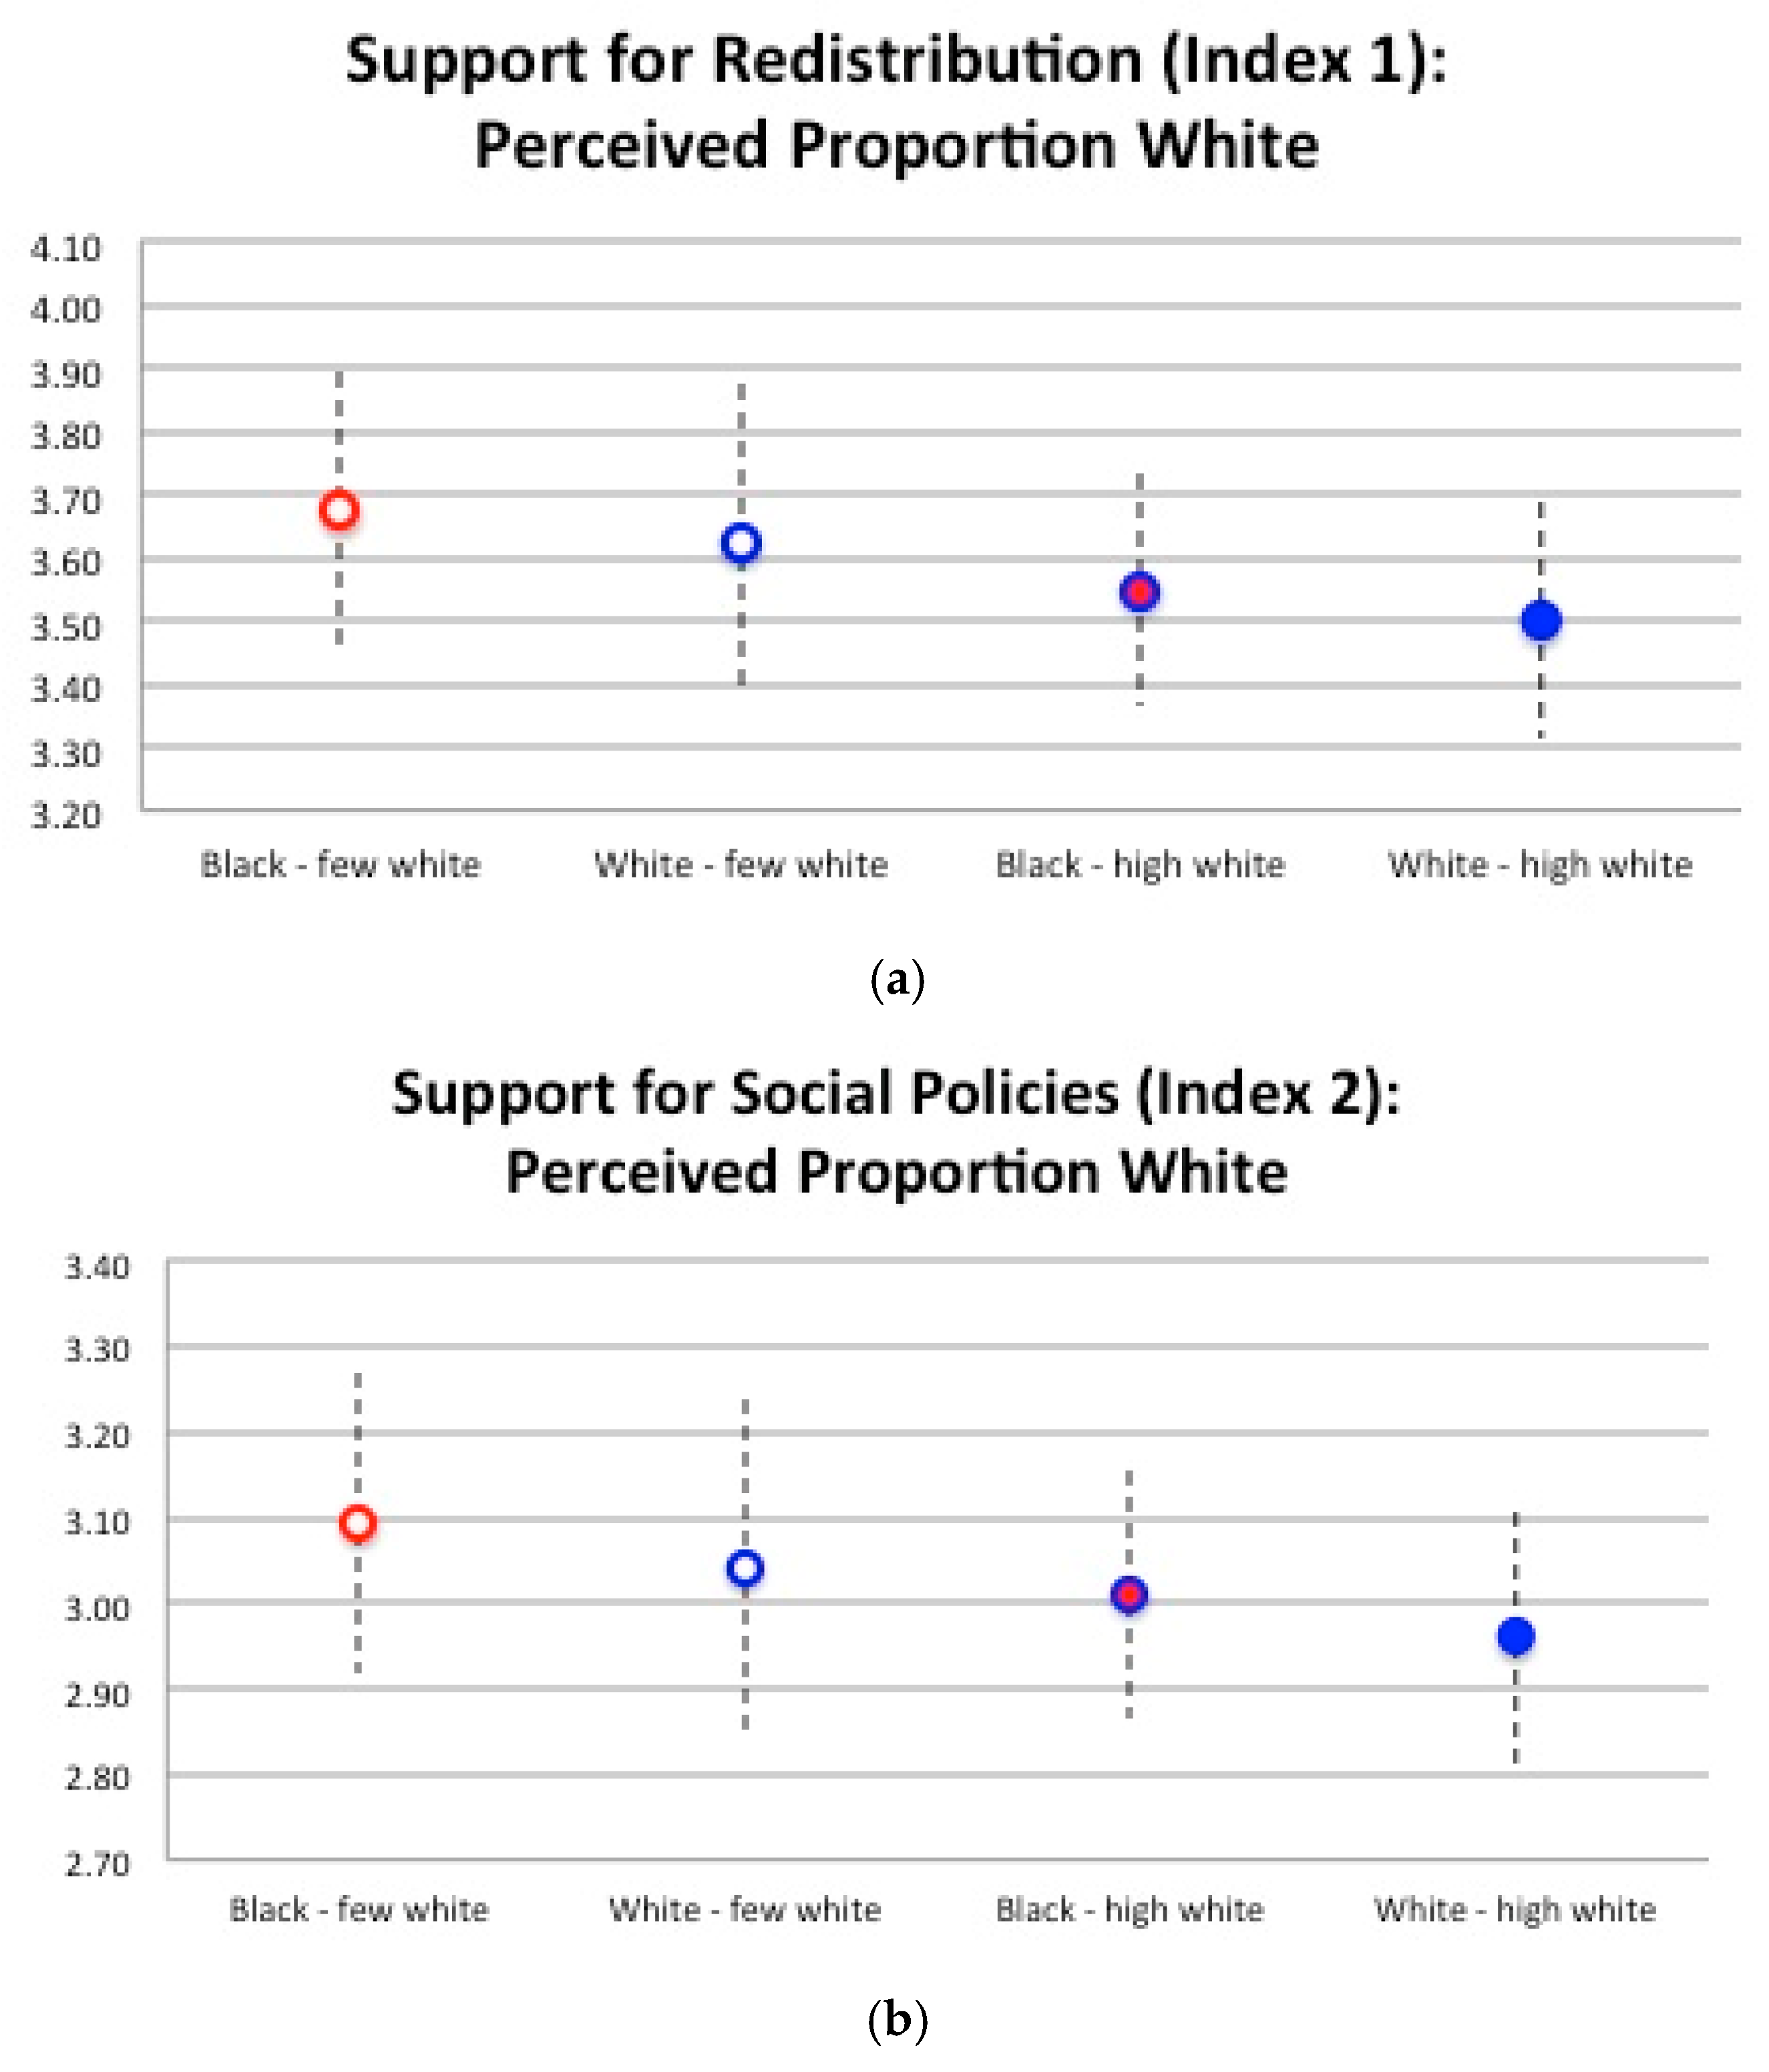
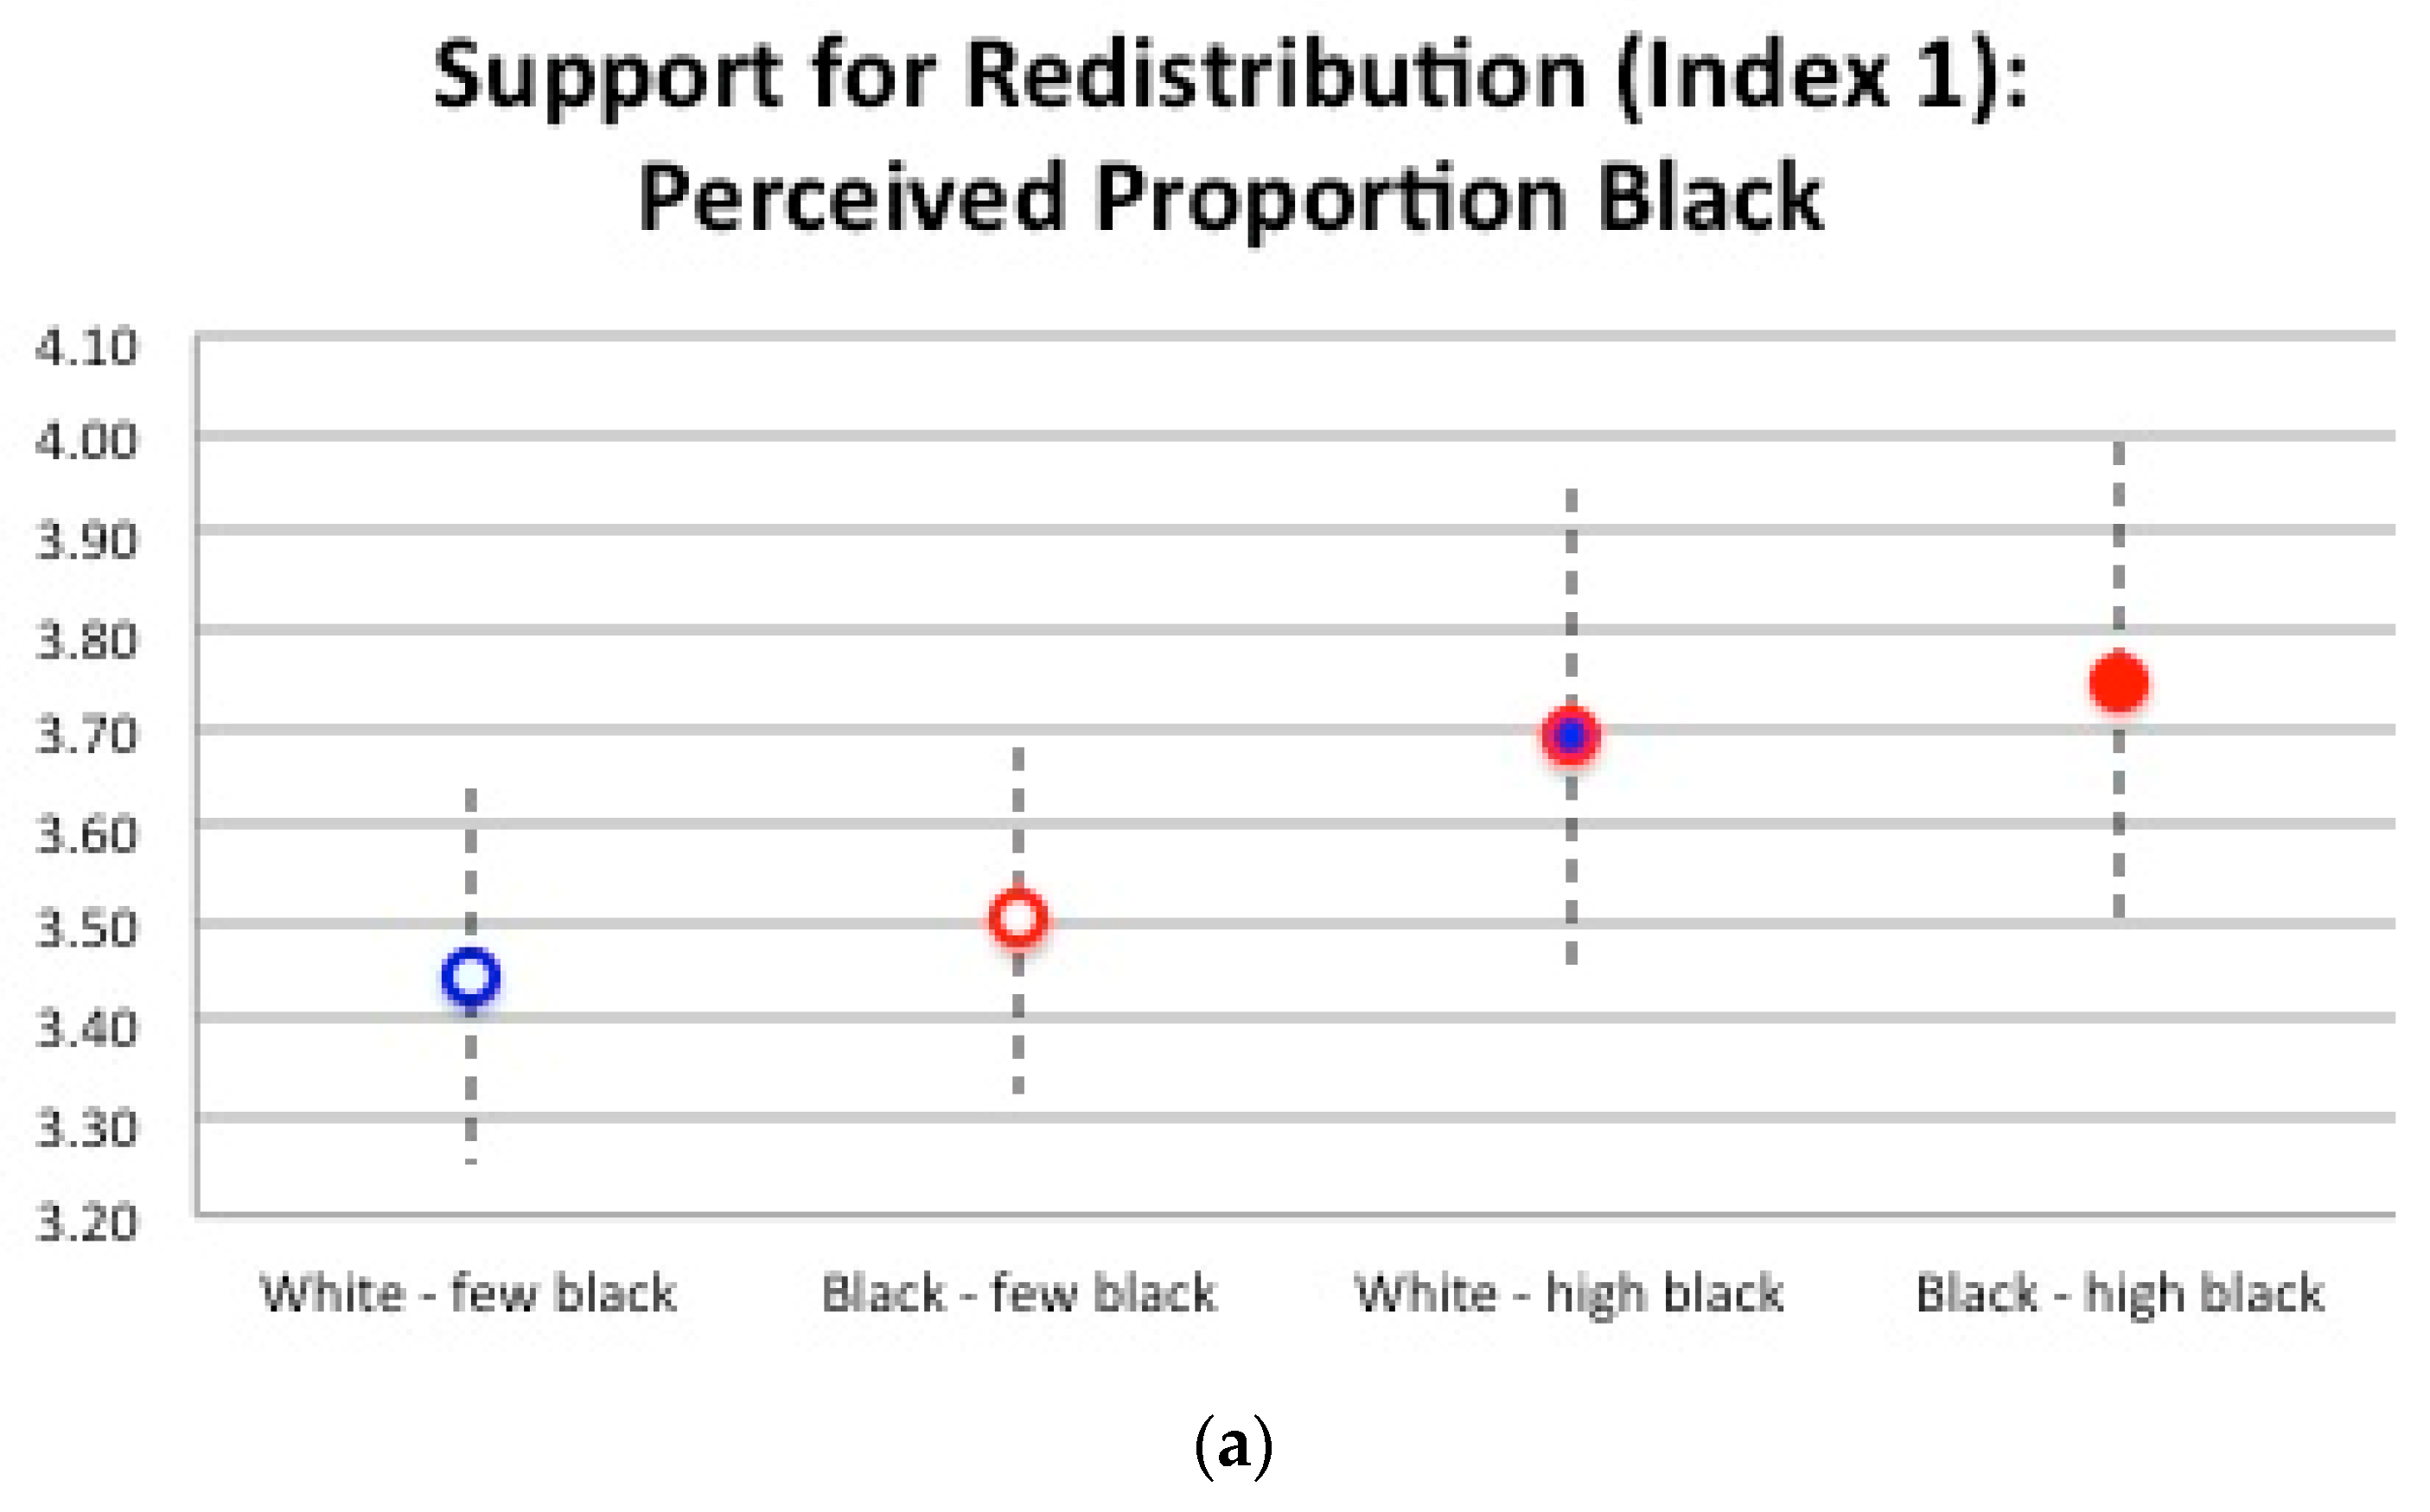
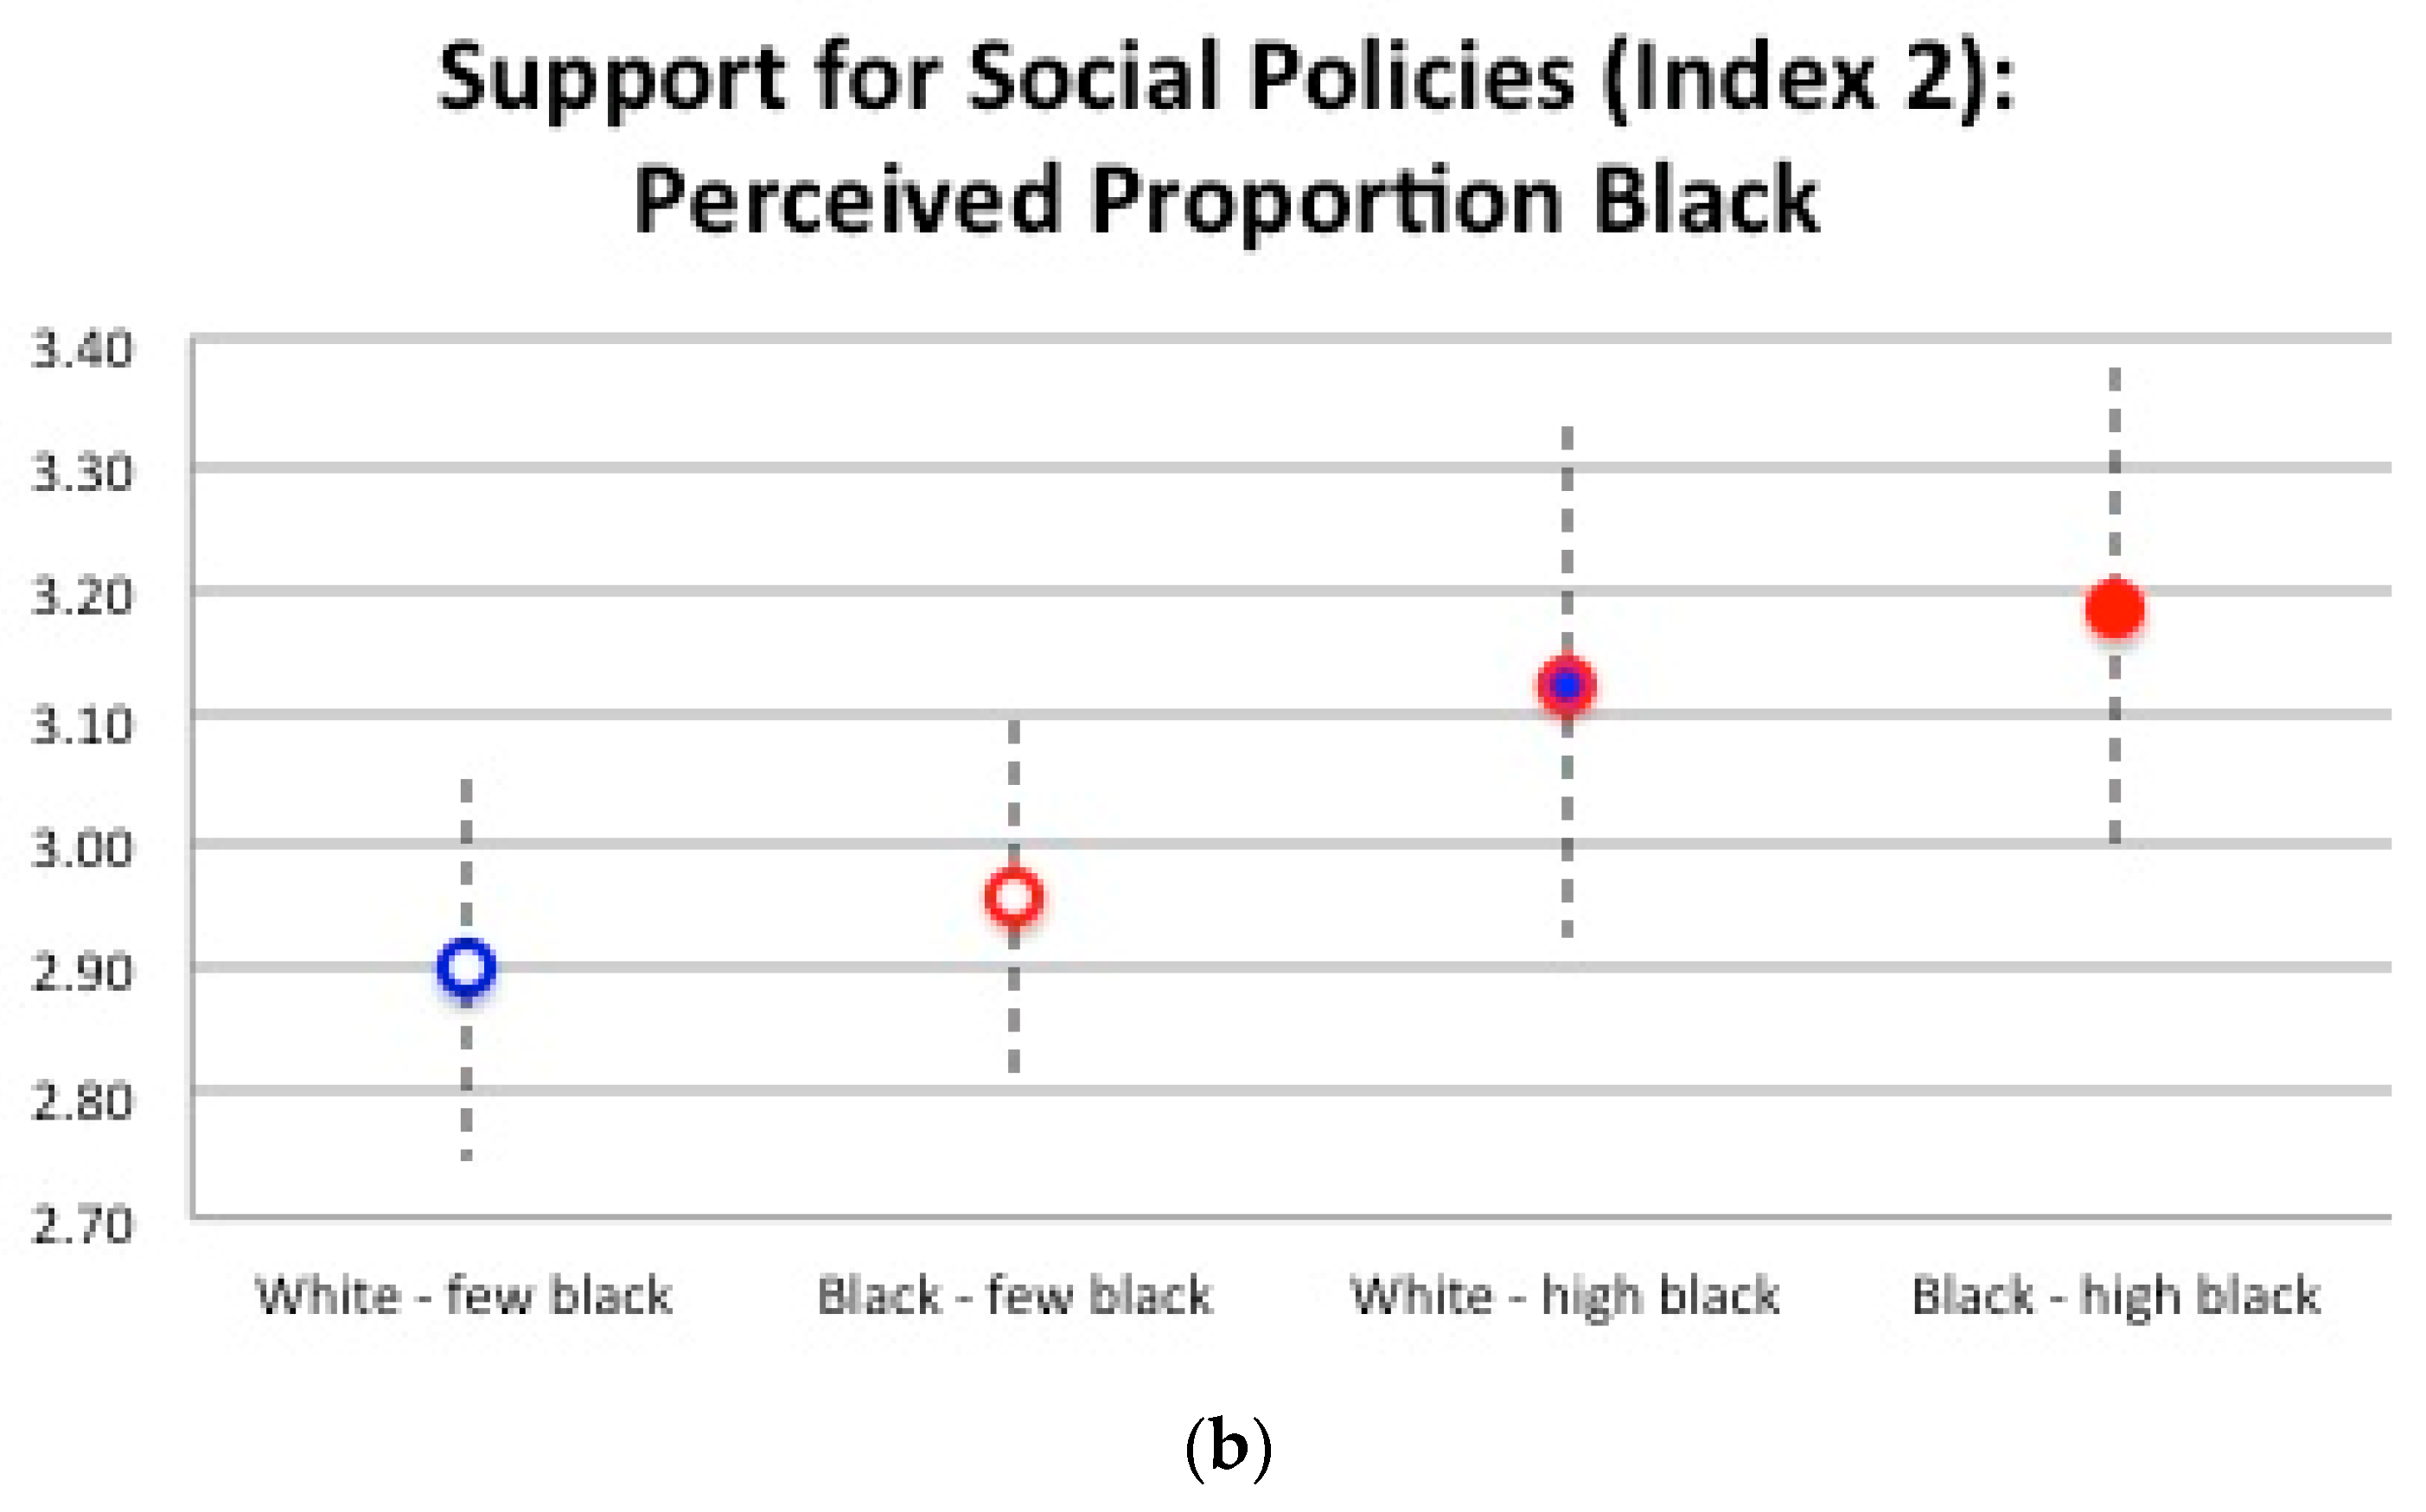
3.2. The Effects of Neighborhood Homogeneity and In-Group/Out-Group Status

In addition, we hypothesized (Hypothesis 3) that living in a racially/ethnically homogeneous neighborhood (e.g., predominantly white) would be associated with lower support for redistribution for members of the majority racial group. In Figure 6, Figure 7 and Figure 8, we plot bivariate regression models of the effects of perceived proportions of whites (Figure 6), blacks (Figure 7), and Latinxs (Figure 8) on support for redistribution and social policies for white versus minority respondents. These models use three-category perceived proportion of a racial/ethnic group as the explanatory variable to obtain estimates of how attitudes about redistribution and social policies change as a respondent moves from the perception of the lowest level of the size of that group to the highest. The coefficients in these figures are also presented in the Appendix A (Table A1).
In Figure 6, we see that white respondents’ support for redistribution decreases slightly for support for redistribution (Index 1), but increases for support for social policies (Index 2) as the perceived proportion of white neighbors increases. In Figure 7 and Figure 8, we see the patterns of the effects of the perceived proportion of black and Latinx neighbors on support for redistribution and social policies. White respondents’ support for redistribution (Index 1) increases as the perceived proportion of black or Latinx neighbors decreases; support for social policies (Index 2) stays about the same as the perceived proportion of black neighbors increases, and decreases slightly as the perceived proportion of Latinx neighbors increases. Thus, the results of bivariate regression models yield limited evidence to support Hypothesis 3, about the effects of whites’ perceived in-group or out-group status on support for redistribution and social policies.
We also hypothesized (Hypothesis 4) that among members of minority groups, living in racially/ethnically homogenous neighborhoods would increase support for redistribution and social policies. Bivariate regression results demonstrate that for minority respondents, support for redistribution and social policies decreases with a greater perceived presence of white people in the neighborhood (Figure 6). In Figure 7 and Figure 8, we observe that support increases among minority respondents across both indices as the perceived proportion of black or Latinx residents in the neighborhood increases. Thus, there is some evidence to support Hypothesis 4. In other words, based on the results of these bivariate regressions, the effects of living in predominantly white neighborhoods (in-group) or minority neighborhoods (out-group) on white respondents’ support for redistribution and social policies are unclear. However, minority respondents’ support for redistribution and social policies may decrease with the perceived proportion of white residents (out-group), but increase with the perceived proportion of black or Latinx neighbors across both indices (in-group). An important limitation of these findings is that only one of the regression coefficients is statistically significant (see Table A1); among minority respondents, the perceived proportion of black neighbors is positive and statistically significant in predicting support for social policies (Model 10). See the Appendix A (Table A2 and Table A3) for ANOVA results yielding similar findings.
To further explore Hypotheses 3 and 4, we examine predicted probabilities of white and black respondents perceiving different levels of their own group (in-group) and the other group (out-group). These results are presented in Figure 9a,b and Figure 10a,b where we see that, across both indices, white people who perceive that they live around high proportions of other white people and low numbers of black people have the lowest predicted levels of support for redistribution and social policies; the only group that scores similarly low is black people perceiving that they live around a high concentration of white people. Thus, perceived proximity to higher concentrations of white people appears to be associated with lower support for redistribution and social policies among both white and black respondents. In contrast, across both indices, perceiving oneself as living around high proportions of black people predicts higher levels of support for redistribution and social policies for black and white respondents alike, as does perceiving oneself as living around low proportions of white people. Although the confidence intervals for the predicted probabilities overlap substantially with each other, the general patterns are consistent in suggesting that the perceived presence of white neighbors decreases support for redistribution and social policies while the perceived presence of black neighbors increases support.
Taken together, these results offer mixed support for Hypothesis 3, but more compelling evidence to support Hypothesis 4. Thus, the effects of homogeneity may vary depending on group status; white respondents appear to be more supportive of redistribution and social policies when they are the minority group in their own neighborhood (e.g., ethnic/racial heterogeneity), while minority respondents appear to be more supportive when they are in the majority group (e.g., ethnic/racial homogeneity) in their places of residence.

4. Discussion

There is a substantial, yet inconsistent literature within sociology and political science that suggests that ethnic and racial heterogeneity is harmful to community life and related social policy preferences. In this paper, we examined how racial/ethnic heterogeneity affects attitudes about redistribution and social policies within the large diverse metropolitan city of New York. More importantly, we assessed these effects among members of majority and minority groups because previous empirical and theoretical work proposes that perceptions of racial/ethnic heterogeneity may mean different things for different ethnic and racial groups. A diverse sample of New York City residents responded to a series of questions regarding the neighborhood that they live in and a number of social policy preferences indicators.
In contrast to what we hypothesized, we did not replicate the constrict proposition for majority groups (H1). That is, we found few differences in support for redistribution and social policies among white respondents in more versus less heterogeneous neighborhoods; if there was a pattern, in most cases, support for social spending appeared to be higher among white respondents who lived in more diverse neighborhoods compared to white respondents living in less diverse neighborhoods.
Our preliminary findings are more consistent with the contact hypothesis (H2). In particular, our findings suggest that both majority and minority group members living in more heterogeneous neighborhoods were more supportive of redistribution and social policies, although, as above, these results were seldom statistically significant. This positive relationship between diversity and support for social spending is consistent with previous studies conducted in another hyper-diverse city, London, and cross-nationally [28,71], and contributes to a growing body of research that calls into question the existence of the so-called “progressive’s dilemma” [28,52,72]—the idea that social democrats must choose between sustaining their traditional agenda of economic redistribution and embracing greater ethnic diversity.
Our results also suggested some interesting differences between members of majority and minority groups who live in racially/ethnically homogeneous neighborhoods. Somewhat consistent with our hypothesis (H3), our results suggest that white people living with higher concentrations of white people (e.g., ethnic/racial homogeneity) are less supportive of redistribution, although these effects are not statistically significant. This is in line with previous work in Canada and the United States that reported that greater ethnic segregation in communities was associated with lower levels of social cohesion [73]. Additionally and as predicted (H4), black people perceiving themselves as living around high proportions of black people reported higher levels of support for redistribution and social policies. Interestingly, perceived proximity to higher concentrations of white people was associated with lower support for redistribution and social policies among both white and minority respondents. In contrast, perceiving oneself as living around high proportions of black people followed the opposite pattern.
Taken together, our findings are highly relevant and offer critical, novel insights into existing theory and research. In particular, our research provides encouraging evidence that racial/ethnic heterogeneity is not associated with less support for redistributive or social policies. Consistent with theories of contact, our findings suggest the opposite: racial/ethnic heterogeneity is associated with greater support. Second, to our knowledge, our study is the first to examine and illustrate that perceptions of racial/ethnic heterogeneity on redistributive and social policy attitudes may be a function of one’s group status. Finally, our findings suggest that among both majority and minority group members, proximity to whites was associated with lower support for redistributive polices and with lower support for social policies among minorities, while proximity to blacks was associated with more support for redistributive and social policies. The finding about proximity to whites, the effects of which were modest and not statistically significant, was the only consistent evidence of a negative association with support for redistribution or social policies, and thus requires further research to be substantiated. There could be a conservatizing effect for minority group members of living in majority group-dominated neighborhoods, or there could be something unique about minority New Yorkers who reside in majority white neighborhoods.

4.1. Implications

Our preliminary results consistently suggested that racial/ethnic heterogeneity may be associated with greater support for redistribution and social policies. That is, our results implied that living in a racially and ethnically heterogeneous neighborhood could be good for social policy attitudes. But why? One explanation may have to do with the site where the data were collected. New York City has unofficially advocated a diverse and multicultural ideology; some examples of official policies include a wide range of city holidays and the sanctioning of frequent parades and other festivals celebrating the city’s many ethnic enclaves; the recent introduction of IDNYC, a program to provide government ID cards to all city residents regardless of citizenship status; and the city’s designation as a “sanctuary city” that limits its cooperation with federal immigration enforcement to protect residents. It is possible that emphasizing the value of different groups in and of themselves allows for more tolerant social policy attitudes. In addition, many of the studies of the effects of immigration and diversity on attitudes have focused on countries or regions that are rapidly becoming more diverse, while New York City has been defined by its diversity and openness to newcomers for decades, if not centuries.
However, we hesitate to conclude that New York City is an exceptional case, distinct from other metropolitan cities. We want to argue instead, that it has the social conditions that may give rise to more positive redistribution and social policy attitudes. There are inevitably more opportunities for contact within highly diverse locales, where the positive effects of intergroup contact can truly gain momentum. The findings from our study may be typical for diverse or highly diverse metropolitan areas.
Another possibility is that there is a curvilinear relationship between diversity and social spending attitudes. It could be that during the period of time when diversity is increasing—particularly when it happens rapidly—enough native residents “hunker down” to give an overall impression of “welfare chauvinism”—the tendency to prefer that redistribution be limited to one’s own ethnic, racial, or national group [74]. In other words, the effects of diversity on social cohesion may only be negative in the context of previously homogenous locales transitioning toward heterogeneity. During the hunkering-down period, diversity may appear to negatively affect social cohesion. Beyond a certain level of diversity, the effects of intergroup contact may counteract the negative effects that emerged during the transition, such that social cohesion rebounds or even increases.
A final explanation for our finding about the positive effects of diversity has to do with our measure of heterogeneity. We focused on the context where people reside—their neighborhoods—where opportunities for inter-group contact may be more meaningful and perceptual, and where the relationship between diversity and attitudes may vary from larger-scale environments like cities, regions, or countries. Another key distinction is that we measured diversity as perceptions about the racial/ethnic composition of the neighborhoods of respondents, rather than using objective measures. Because of this, we may have been able to tap into people’s real everyday experiences living with diversity [39,68]. Some of the distinctions highlighted above may help explain why previous results have been mixed.

4.2. Limitations

In considering the results of this study, it is important to note some limitations, some of which present opportunities for future research. First, our correlational design does not allow us to make any claims about causation or directionality. It should be also noted that because of our design, we were unable to control for selection effects associated with where respondents live. The neighborhood in which the research participant lives might reflect broader values and ideologies. In this regard, it might be residents’ values that drive the associations observed. The only way to truly examine whether neighborhood diversity has causal effects is through random assignment of neighborhoods of residence, a rarely available and ethically fraught option. Thus, almost all current research on neighborhood diversity must focus on observing associations.
Moreover, the selection of neighborhoods of residence in New York City, as in many cities, is often closely tied to social class. Recent research from South Africa suggests that the intersectionality of race and class may be related to social cohesion [75]. Because we did not ask respondents about their perceptions of social classes in their neighborhoods, we were not able to assess to what extent their perceptions of racial or ethnic composition were intertwined with their perceptions of the economic circumstances of people of different racial and ethnic backgrounds.
However, recent evidence increasingly confirms that race, specifically blackness, and class are inextricably linked in the United States [76,77]. For example, in NYC, median rent varies greatly between the city’s neighborhoods, and this variation is often correlated with racial or ethnic composition. Median monthly rent for a two-bedroom apartment in 2017 in the Lincoln Square neighborhood of Manhattan, which is predominantly white, was US $5217 per month versus US$1750 per month in the West Concourse neighborhood of the Bronx, which is predominantly Latinx and black [78,79]. Thus, race/ethnicity, social class and neighborhood of residence are often intertwined in NYC. In a future iteration of this study, we would incorporate measures of perceived social class of neighbors. In addition, we plan to follow up on the findings presented herein through analyzing the results of a dictator game incorporated into the original study; in the game, race and class of partners were varied to determine whether one of these factors affected generosity more than another.
Another issue concerns the generalizability of the findings. New York City, where the data was collected has been called a “majority-minority” city, in which non-white groups represent a numerical majority of the population [80]. These issues may be different in less diverse contexts in which non-whites and immigrants are smaller in proportion. However, as mentioned above, studying diversity in a highly diverse city may also be one of our key contributions. Further, the participants in this study came from a small sample of mTurk participants. Studies suggest that the political attitudes of mTurk workers is similar to that of the general population and therefore is a suitable means for conducting research on social policy issues, though mTurk workers are slightly more liberal than the U.S. as a whole [60].
Finally, our study did not measure contact or quality of contact among diverse neighbors [81]. Because of this, the opportunity for actual contact is unknown. It is possible that some participants live in neighborhoods with many racial and ethnic groups, but have never had meaningful contact with those individuals. Tropp et al. are examining this question through a project that compares contact with members of different groups in neighborhoods, public spaces, and workplaces [82]. The few studies that have included measures of social contact and diversity have shown an enhanced sense of trust between residents of all ethnic groups with increased contact [71,83]. For example, following Sturgis et al.’s argument, the extent to which diversity will have a positive or negative impact on communities and related social policy preferences may be related to the degree of meaningful social contact and interactions between diverse residents [71].
Other opportunities for future research include an examination of the important differences in the effects of perceived versus actual racial/ethnic heterogeneity. Neighborhood-level data can allow us to compare measures of perceptions with actual neighborhood composition to examine whether there is an effect of having an inaccurate perception of one’s neighborhood. Previous research on population innumeracy has found that respondent misperceptions about immigrants were associated with perceiving cultural threats from immigrants [84].
While we cannot draw strong conclusions from a small mTurk pilot study, the patterns we observe from these data consistently suggest that neighborhood diversity is associated with greater support for redistribution and social policies. The only evidence of a negative association with support for redistribution or social policies is for minority respondents living in a majority white neighborhood, which suggests that the diversity is experienced differently for members of majority versus minority groups. We hope that future research will further examine the neighborhood diversity findings suggested by this paper, particularly the importance of disaggregating minority and majority group members’ experiences.

Author Contributions

Conceptualization, L.G.S. and K.M.P.; Data curation, L.G.S.; Formal analysis, L.G.S.; Funding acquisition, L.G.S.; Investigation, L.G.S. and K.M.P.; Methodology, L.G.S.; Visualization, L.G.S.; Writing—Original Draft, L.G.S. and K.M.P.; Writing—Review and Editing, L.G.S. and K.M.P.

Funding

This research was funded by a Faculty Support Award from Purchase College, State University of New York.

Acknowledgments

The authors would like to thank Mark A. Schneider and Calvert Wallace Jones for providing invaluable feedback during the early stages of this project’s development.

Conflicts of Interest

The authors declare no conflict of interest. The funder had no role in the design of the study; in the collection, analyses, or interpretation of data; in the writing of the manuscript; and in the decision to publish the results.

Appendix A

Table A1. Bivariate ordinary least squares (OLS) regression models of support for redistribution and social policies.
White Respondents(1)(2)(3)(4)(5)(6)
Index 1: RedistIndex 2: Soc PolIndex 1: RedistIndex 2: Soc PolIndex 1: RedistIndex 2: Soc Pol
Perceived proportion: White−0.020.11
(0.11)(0.11)
Perceived proportion: Black 0.160.00
(0.12)(0.12)
Perceived proportion: Latinx 0.18−0.04
(0.13)(0.13)
Constant0.01−0.32−0.32−0.07−0.32−0.01
(0.27)(0.27)(0.21)(0.21)(0.21)(0.21)
Observations199199199199199199
R squared0.000.000.010.000.010.00
(7)(8)(9)(10)(11)(12)
Minority RespondentsIndex 1: RedistIndex 2: Soc PolIndex 1: RedistIndex 2: Soc PolIndex 1: RedistIndex 2: Soc Pol
Perceived proportion: White−0.07−0.18
(0.13)(0.13)
Perceived proportion: Black 0.040.25 *
(0.13)(0.12)
Perceived proportion: Latinx 0.140.10
(0.15)(0.15)
Constant0.240.53 *0.02−0.29−0.130.03
(0.26)(0.25)(0.27)(0.26)(0.27)(0.27)
Observations949494949494
R-squared0.000.020.000.040.010.00
Standard errors in parentheses. * p < 0.05.
Table A2. Support for redistribution (Index 1) by perceived neighborhood ethnic composition and respondent race/ethnicity.
Respondent Race/Ethnicity
Perceived Proportion
Neighbors’ Races/Ethnicities
White Minority Own Group
White
WhiteMeanSDnMeanSDnMeanSDn
None—less than half3.550.93733.280.76583.550.9373
About half—more than half3.541.121263.070.85363.541.12126
ANOVAF(1,197) = 0.00, p = 0.948F(1,92) = 0.65, p = 0.422F(1,197) = 0.00, p = 0.948
White Minority Black
BlackMeanSDnMeanSDnMeanSDn
None—less than half3.441.071513.721.09483.800.9310
About half—more than half3.870.93483.690.98463.861.0533
ANOVAF(1,197) = 6.08, p = 0.015F(1,92) = 0.02, p = 0.875F(1,41) = 0.03, p = 0.875
White Minority Latinx
LatinxMeanSDnMeanSDnMeanSDn
None—less than half3.521.091623.611.07643.411.5418
About half—more than half3.670.89373.900.93303.900.6313
ANOVAF(1,197) = 0.60, p = 0.441F(1,92) = 1.57, p = 0.213F(1,29) = 1.17, p = 0.288
Table A3. Support for social policies (Index 2) by perceived neighborhood ethnic composition and respondent race/ethnicity.
Respondent Race/Ethnicity
Perceived Proportion
Neighbors’ Races/Ethnicities
White Minority Own Group
White
WhiteMeanSDnMeanSDnMeanSDn
None—less than half2.920.81733.280.76582.920.8173
About half—more than half3.010.841263.070.85363.010.84126
ANOVAF(1,197) = 0.48, p = 0.487F(1,92) = 1.56, p = 0.216F(1,197) = 0.48, p = 0.487
White Minority Black
BlackMeanSDnMeanSDnMeanSDn
None—less than half3.010.801513.090.863.093.151.0410
About half—more than half2.880.92483.320.723.323.400.7233
ANOVAF(1,197) = 0.98, p = 0.323F(1,92) = 1.91, p = 0.170F(1,41) = 0.76, p = 0.389
White Minority Latinx
LatinxMeanSDnMeanSDnMeanSDn
None—less than half2.990.831623.140.84643.170.9618
About half—more than half2.930.85373.330.70303.290.5313
ANOVAF(1,197) = 0.14, p = 0.709F(1,92) = 1.24, p = 0.268F(1,29) = 0.17, p = 0.683

References

  1. International Migration Report 2017: Highlights; United Nations, Department of Economic and Social Affairs, Population Division: New York, NY, USA, 2017.
  2. Chang, J.-H.; Hsu, C.-C.; Shih, N.-H.; Chen, H.-C. Multicultural Families and Creative Children. J. Cross-Cult. Psychol. 2014, 45, 1288–1296. [Google Scholar] [CrossRef]
  3. Gocłowska, M.A.; Damian, R.I.; Mor, S. The Diversifying Experience Model: Taking a Broader Conceptual View of the Multiculturalism–Creativity Link. J. Cross-Cult. Psychol. 2018, 49, 303–322. [Google Scholar] [CrossRef]
  4. Collier, P. Exodus: How Migration is Changing Our World; Oxford University Press: New York, NY, USA, 2013. [Google Scholar]
  5. Glazer, N. The American welfare state: Exceptional no longer? In Challenges to the Welfare State: Internal and External Dynamics for Change; Cavanna, H., Ed.; Edward Elgar: Cheltenham, UK, 1998; pp. 7–20. [Google Scholar]
  6. Goodhart, D. Too Diverse? Prospect 2004, 95, 30–37. [Google Scholar]
  7. Pearce, N. Diversity versus solidarity: A new progressive dilemma. Renew. J. Labour Polit. 2004, 12, 79–87. [Google Scholar]
  8. Schaeffer, M. Ethnic Diversity and Social Cohesion: Immigration, Ethnic Fractionalization and Potentials for Civic Action; Routledge: Abingdon, UK, 2016; ISBN 978-1-317-14095-5. [Google Scholar]
  9. Van der Meer, T.; Tolsma, J. Ethnic Diversity and Its Effects on Social Cohesion. Annu. Rev. Sociol. 2014, 40, 459–478. [Google Scholar] [CrossRef]
  10. Putnam, R.D. E Pluribus Unum: Diversity and Community in the Twenty-first Century. Scand. Polit. Stud. 2007, 30, 137–174. [Google Scholar] [CrossRef]
  11. Finseraas, H.; Kotsadam, A. Does personal contact with ethnic minorities affect anti-immigrant sentiments? Evidence from a field experiment. Eur. J. Polit. Res. 2017, 56, 703–722. [Google Scholar] [CrossRef] [Green Version]
  12. Portes, A.; Vickstrom, E. Diversity, Social Capital, and Cohesion. Annu. Rev. Sociol. 2011, 37, 461–479. [Google Scholar] [CrossRef]
  13. Stichnoth, H.; Van der Straeten, K. Ethnic Diversity, Public Spending, and Individual Support for the Welfare State: A Review of the Empirical Literature. J. Econ. Surv. 2013, 27, 364–389. [Google Scholar] [CrossRef]
  14. Schaeffer, M. Ethnic Diversity, Public Goods Provision and Social Cohesion: Lessons from an Inconclusive Literature. WZB Discussion Paper. 2013. Available online: https://www.econstor.eu/bitstream/10419/86148/1/770694160.pdf (accessed on 15 May 2018).
  15. Alesina, A.; Baqir, R.; Easterly, W. Public Goods and Ethnic Divisions. Q. J. Econ. 1999, 114, 1243–1284. [Google Scholar] [CrossRef] [Green Version]
  16. Alesina, A.; Glaeser, E.L. Fighting Poverty in the US and Europe: A World of Difference; Oxford University Press: Oxford, UK, 2004. [Google Scholar]
  17. Banting, K.; Kymlicka, W. (Eds.) Multiculturalism and the Welfare State; Oxford University Press: Oxford, UK, 2006. [Google Scholar]
  18. Desmet, K.; Ortuño-Ortin, I.; Weber, S. Linguistic Diversity and Redistribution. J. Eur. Econ. Assoc. 2009, 7, 1291–1318. [Google Scholar] [CrossRef] [Green Version]
  19. Salter, F.K. (Ed.) Welfare, Ethnicity and Altruism: New Findings and Evolutionary Theory; Frank Cass: London, UK, 2004. [Google Scholar]
  20. Mueller, D.C.; Murrell, P. Interest groups and the size of government. Public Choice 1986, 48, 125–145. [Google Scholar] [CrossRef]
  21. Eger, M.A. Even in Sweden: The Effect of Immigration on Support for Welfare State Spending. Eur. Sociol. Rev. 2010, 26, 203–217. [Google Scholar] [CrossRef]
  22. Stichnoth, H. Does immigration weaken natives’ support for the unemployed? Evidence from Germany. Public Choice 2011, 151, 631–654. [Google Scholar] [CrossRef]
  23. Stephens, J.D. The Transition from Capitalism to Socialism; University of Illinois Press: Urbana, IL, USA, 1979. [Google Scholar]
  24. Fullerton, A.S.; Dixon, J.C. Racialization, Asymmetry, and the Context of Welfare Attitudes in the American States. J. Polit. Mil. Sociol. 2009, 37, 95–120. [Google Scholar]
  25. Gilens, M. Preference Gaps and Inequality in Representation. PS Polit. Sci. Polit. 2009, 42, 335–341. [Google Scholar] [CrossRef]
  26. Gilens, M. Why Americans Hate Welfare: Race, Media, and the Politics of Antipoverty Policy, 1st ed.; University of Chicago Press: Chicago, IL, USA, 1999; ISBN 978-0-226-29365-3. [Google Scholar]
  27. Blalock, H.M. Toward a Theory of Minority-Group Relations; John Wiley & Sons: New York, NY, USA, 1967. [Google Scholar]
  28. Steele, L.G. Ethnic Diversity and Support for Redistributive Social Policies. Soc. Forces 2016, 94, 1439–1481. [Google Scholar] [CrossRef]
  29. Eger, M.A.; Breznau, N. Immigration and the welfare state: A cross-regional analysis of European welfare attitudes. Int. J. Comp. Sociol. 2017, 58, 440–463. [Google Scholar] [CrossRef]
  30. Soroka, S.N.; Banting, K.; Johnston, R. Immigration and Redistribution in the Global Era. In Globalization and Social Redistribution; Wallerstein, M., Bowles, S., Eds.; Princeton University Press: Princeton, NJ, USA; Russell Sage Foundation: New York, NY, USA, 2006. [Google Scholar]
  31. Brady, D.; Finnigan, R. Does Immigration Undermine Public Support for Social Policy? Am. Sociol. Rev. 2014, 79, 17–42. [Google Scholar] [CrossRef]
  32. Herda, D. How Many Immigrants? Foreign-Born Population Innumeracy in Europe. Public Opin. Q. 2010, 74, 674–695. [Google Scholar] [CrossRef]
  33. Dinesen, P.T.; Sønderskov, K.M. Ethnic Diversity and Social Trust: Evidence from the Micro-Context. Am. Sociol. Rev. 2015, 80, 550–573. [Google Scholar] [CrossRef]
  34. Koopmans, R.; Schaeffer, M. Statistical and Perceived Diversity and Their Impacts on Neighborhood Social Cohesion in Germany, France and the Netherlands. Soc. Indic. Res. 2016, 125, 853–883. [Google Scholar] [CrossRef]
  35. Solnit, R.; Jelly-Schapiro, J. Nonstop Metropolis: A New York City Atlas; University of California Press: Berkeley, CA, USA, 2016; ISBN 978-0-520-28594-1. [Google Scholar]
  36. Abascal, M.; Baldassarri, D. Love Thy Neighbor? Ethnoracial Diversity and Trust Reexamined. Am. J. Sociol. 2015, 121, 722–782. [Google Scholar] [CrossRef] [PubMed]
  37. Tolsma, J.; van der Meer, T.W.G. Trust and contact in diverse neighbourhoods: An interplay of four ethnicity effects. Soc. Sci. Res. 2018, 73, 92–106. [Google Scholar] [CrossRef] [PubMed]
  38. Bobo, L. Whites’ opposition to busing: Symbolic racism or realistic group conflict? J. Pers. Soc. Psychol. 1983, 45, 1196–1210. [Google Scholar] [CrossRef]
  39. Alba, R.; Rumbaut, R.G.; Marotz, K. A Distorted Nation: Perceptions of Racial/Ethnic Group Sizes and Attitudes Toward Immigrants and Other Minorities. Soc. Forces 2005, 84, 901–919. [Google Scholar] [CrossRef]
  40. Fossett, M.A.; Kiecolt, K.J. The Relative Size of Minority Populations and White Racial Attitudes. Soc. Sci. Q. 1989, 70, 820–835. [Google Scholar]
  41. Pettigrew, T.F. Demographic Correlates of Border-State Desegregation. Am. Sociol. Rev. 1957, 22, 683–689. [Google Scholar] [CrossRef]
  42. Quillian, L. Prejudice as a Response to Perceived Group Threat: Population Composition and Anti-Immigrant and Racial Prejudice in Europe. Am. Sociol. Rev. 1995, 60, 586–611. [Google Scholar] [CrossRef]
  43. Schlueter, E.; Scheepers, P. The relationship between outgroup size and anti-outgroup attitudes: A theoretical synthesis and empirical test of group threat- and intergroup contact theory. Soc. Sci. Res. 2010, 39, 285–295. [Google Scholar] [CrossRef] [Green Version]
  44. Craig, M.A.; Richeson, J.A. More Diverse Yet Less Tolerant? How the Increasingly Diverse Racial Landscape Affects White Americans’ Racial Attitudes. Pers. Soc. Psychol. Bull. 2014, 40, 750–761. [Google Scholar] [CrossRef] [PubMed]
  45. Craig, M.A.; Richeson, J.A. On the Precipice of a “Majority-Minority” America: Perceived Status Threat From the Racial Demographic Shift Affects White Americans’ Political Ideology. Psychol. Sci. 2014, 25, 1189–1197. [Google Scholar] [CrossRef] [PubMed]
  46. Danbold, F.; Huo, Y.J. No Longer “All-American”? Whites’ Defensive Reactions to Their Numerical Decline. Soc. Psychol. Personal. Sci. 2015, 6, 210–218. [Google Scholar] [CrossRef]
  47. Major, B.; Blodorn, A.; Major Blascovich, G. The threat of increasing diversity: Why many White Americans support Trump in the 2016 presidential election. Group Process. Intergroup Relat. 2016, 21, 931–940. [Google Scholar] [CrossRef]
  48. Outten, H.R.; Schmitt, M.T.; Miller, D.A.; Garcia, A.L. Feeling Threatened About the Future: Whites’ Emotional Reactions to Anticipated Ethnic Demographic Changes. Pers. Soc. Psychol. Bull. 2012, 38, 14–25. [Google Scholar] [CrossRef] [PubMed]
  49. Wetts, R.; Willer, R. Privilege on the Precipice: Perceived Racial Status Threats Lead White Americans to Oppose Welfare Programs. Soc. Forces 2018. [Google Scholar] [CrossRef]
  50. Allport, G.W. The Nature of Prejudice; Addison-Wesley Pub. Co.: Cambridge, MA, USA, 1954. [Google Scholar]
  51. Gaertner, S.L.; Dovidio, J. Reducing Intergroup Bias: The Common Group Identity Model; Psychology Press: Philadelphia, PA, USA, 2000. [Google Scholar]
  52. Habyarimana, J.; Humphreys, M.; Posner, D.N.; Weinstein, J.M. Why Does Ethnic Diversity Undermine Public Goods Provision? Am. Polit. Sci. Rev. 2007, 101, 709–725. [Google Scholar] [CrossRef] [Green Version]
  53. Alesina, A.; Glaeser, E.L.; Sacerdote, B. Why doesn’t the U.S. have a European-style welfare system? Brook. Pap. Econ. Act. 2001, 2, 187–254. [Google Scholar] [CrossRef] [Green Version]
  54. Lind, J.T. Fractionalization and the size of government. J. Public Econ. 2007, 91, 51–76. [Google Scholar] [CrossRef] [Green Version]
  55. Ellison, C.G.; Shin, H.; Leal, D.L. The Contact Hypothesis and Attitudes Toward Latinos in the United States. Soc. Sci. Q. 2011, 92, 938–958. [Google Scholar] [CrossRef]
  56. Fox, C. The Changing Color of Welfare? How Whites’ Attitudes toward Latinos Influence Support for Welfare. Am. J. Sociol. 2004, 110, 580–625. [Google Scholar] [CrossRef] [Green Version]
  57. Simpson, G.E.; Yinger, J.M. Techniques for Reducing Prejudice: Changing the Situation. In Psychology and Race; Watson, P., Ed.; AldineTransaction, A Division of Transaction Publishers, Rutgers—The State University: New Brunswick, NJ, USA, 1973. [Google Scholar]
  58. Massey, G.; Hodson, R.; Sekulić, D. Ethnic Enclaves and Intolerance: The Case of Yugoslavia. Soc. Forces 1999, 78, 669–693. [Google Scholar] [CrossRef]
  59. Berinsky, A.J.; Huber, G.A.; Lenz, G.S. Evaluating Online Labor Markets for Experimental Research: Amazon.com’s Mechanical Turk. Polit. Anal. 2012, 20, 351–368. [Google Scholar] [CrossRef]
  60. Clifford, S.; Jewell, R.M.; Waggoner, P.D. Are samples drawn from Mechanical Turk valid for research on political ideology? Res. Polit. 2015, 2, 2053168015622072. [Google Scholar] [CrossRef]
  61. Thibodeau, P.H.; Flusberg, S.J. Metaphorical Accounting: How Framing the Federal Budget Like a Household’s Affects Voting Intentions. Cogn. Sci. 2017, 41, 1168–1182. [Google Scholar] [CrossRef] [PubMed]
  62. ISSP Research Group. International Social Survey Programme (ISSP): Social Inequality IV, 2009, ZA5400 (v4.0.0); GESIS: Cologne, Germany, 2017. [Google Scholar]
  63. ISSP Research Group. International Social Survey Programme: Role of Government V-ISSP 2016; ZA6900 Data file Version 1.0.0.; GESIS Data Archive: Cologne, Germany, 2018. [Google Scholar]
  64. Alesina, A.; Devleeschauwer, A.; Easterly, W.; Kurlat, S.; Wacziarg, R. Fractionalization. J. Econ. Growth 2003, 8, 155–194. [Google Scholar] [CrossRef] [Green Version]
  65. Fearon, J.D. Ethnic and Cultural Diversity by Country. J. Econ. Growth 2003, 8, 195–222. [Google Scholar] [CrossRef]
  66. Banting, K.; Johnston, R.; Kymlicka, W.; Soroka, S.N. Do multiculturalism policies erode the welfare state? An empirical analysis. In Multiculturalism and The Welfare State; Banting, K., Kymlicka, W., Eds.; Oxford University Press: Oxford, UK, 2006; pp. 49–91. [Google Scholar]
  67. James, W. The perception of reality. In The Principles of Psychology, Vol II; Henry Holt and Company: New York, NY, USA, 1890; pp. 283–324. [Google Scholar]
  68. Gallagher, C.A. Miscounting Race: Explaining Whites’ Misperceptions of Racial Group Size. Sociol. Perspect. 2003, 46, 381–396. [Google Scholar] [CrossRef]
  69. Telles, E.E. Project on Ethnicity and Race in Latin America (PERLA). 2013. Available online: https://perla.princeton.edu/ (accessed on 10 March 2015).
  70. Huff, C.; Tingley, D. “Who are these people?” Evaluating the demographic characteristics and political preferences of MTurk survey respondents. Res. Polit. 2015, 2, 2053168015604648. [Google Scholar] [CrossRef]
  71. Sturgis, P.; Brunton-Smith, I.; Kuha, J.; Jackson, J. Ethnic diversity, segregation and the social cohesion of neighbourhoods in London. Ethn. Racial Stud. 2014, 37, 1286–1309. [Google Scholar] [CrossRef] [Green Version]
  72. Crepaz, M. “If you are my brother, I may give you a dime!” Public opinion on multiculturalism, trust, and the welfare state. In Multiculturalism and the Welfare State; Banting, K., Kymlicka, W., Eds.; Oxford University Press: Oxford, UK, 2006; pp. 92–120. [Google Scholar]
  73. Rothwell, J.T. The Effects of Racial Segregation on Trust and Volunteering in US Cities. Urban Stud. 2012, 41, 2109–2136. [Google Scholar] [CrossRef]
  74. Reeskens, T.; Van Oorschot, W. Disentangling the “New Liberal Dilemma”: On the relation between general welfare redistribution preferences and welfare chauvinism. Int. J. Comp. Sociol. 2012, 53, 120–139. [Google Scholar] [CrossRef]
  75. Haile, D.; Sadrieh, A.; Verbon, H.A.A. Cross-racial envy and underinvestment in South African partnerships. Camb. J. Econ. 2008, 32, 703–724. [Google Scholar] [CrossRef]
  76. Gans, H.J. Race as Class. Contexts 2005, 4, 17–21. [Google Scholar] [CrossRef]
  77. Chetty, R.; Hendren, N.; Jones, M.R.; Porter, S.R. Race and Economic Opportunity in the United States: An Intergenerational Perspective; National Bureau of Economic Research, 2018. Available online: http://www.nber.org/papers/w24441 (accessed on 15 May 2018).
  78. Rosenberg, Z. New York’s Most and Least Affordable Neighborhoods. Available online: https://ny.curbed.com/2017/8/4/16099252/new-york-neighborhood-affordability (accessed on 3 August 2018).
  79. U.S. Census Bureau Population Division-New York City Department of City Planning. U.S. Census 2010; U.S. Census Bureau New York Regional Office: New York, NY, USA, 2011.
  80. Kasinitz, P.; Mollenkopf, J.; Waters, M.C. Becoming American/Becoming New Yorkers: Immigrant Incorporation in a Majority Minority City. Int. Migr. Rev. 2002, 36, 1020–1036. [Google Scholar] [CrossRef] [Green Version]
  81. Hewstone, M. Living Apart, Living Together? The Role of Intergroup Contact in Social Integration. In Proceedings of the British Academy; Johnston, R., Ed.; 2006 Joint British Academy/British Psychological Society Lecture; British Academy: London, UK, 2009; Volume 162, ISBN 978-0-19-173406-9. [Google Scholar]
  82. Tropp, L.; Okamoto, D.G.; Marrow, H.; Jones-Correa, M. Intergroup Contact and Social Inclusion: Relations among Immigrant and U.S.-Born Communities in the United States. Presented at the Immigration Seminar Series, The Graduate Center, The City University of New York, NY, USA, 10 April 2018. [Google Scholar]
  83. Stolle, D.; Soroka, S.; Johnston, R. When Does Diversity Erode Trust? Neighborhood Diversity, Interpersonal Trust and the Mediating Effect of Social Interactions. Polit. Stud. 2008, 56, 57–75. [Google Scholar] [CrossRef] [Green Version]
  84. Herda, D. Innumeracy in Turkey: Misperceptions of an Emerging Immigrant Population. Insight Turk. 2015, 17, 187–205. [Google Scholar]
1
Location limited to “US-NY (state)” using mTurk parameters; NYC residence was subsequently confirmed via screening questions (borough name, zip code, and neighborhood name).
2
Human Intelligence Task (HIT) approval rate greater than or equal to 95%; number of HITs completed greater than or equal to 1000.
3
MTurk samples tend to be disproportionately male, younger, more politically liberal, less religious, and less racially diverse than the U.S. population [59].
4
Source: NYC Planning Population FactFinder using 2012–2016 American Community Survey data (note: these data include those under age 18, who are excluded from our study).
5
Source: 2015 American Community Survey data (note: these data include those under age 18, who are excluded from our study).
6
Orthogonally rotated factor loadings indicated that the questions from these two surveys should be treated as separate constructs.
7
Twenty-four respondents (7.5%) selected more than one ethnic or racial identity.
8
Figure 1. Perceptions of the size of racial/ethnic groups in a respondent’s neighborhood.
Societies 08 00082 g001
Figure 2. Distribution of perceived neighborhood diversity index responses.
Societies 08 00082 g002
Figure 3. Support for redistribution by race/ethnicity (Index 1 questions).
Societies 08 00082 g003
Figure 4. Support for social policies by race/ethnicity (Index 2 questions).
Societies 08 00082 g004
Figure 5. Mean support for redistribution and social policies by perceived neighborhood diversity.
Societies 08 00082 g005
Figure 6. Bivariate fitted linear regression lines of support for redistribution and social policies indices (standardized) and perceived neighborhood proportion of whites by respondent race.
Societies 08 00082 g006
Figure 7. Bivariate fitted linear regression lines of support for redistribution and social policies indices (standardized) and perceived neighborhood proportion of blacks by respondent race.
Societies 08 00082 g007
Figure 8. Bivariate fitted linear regression lines of support for redistribution and social policies indices (standardized) and perceived neighborhood proportion of Latinxs by respondent race.
Societies 08 00082 g008
Figure 9. Predicted probabilities of support for redistribution (a) and social policies (b) by perceived proportion of whites for white and black respondents.
Societies 08 00082 g009
Figure 10. Predicted probabilities of support for redistribution (a) and social policies (b) by perceived proportion of blacks for white and black respondents.
Societies 08 00082 g010aSocieties 08 00082 g010b
Table 1. Demographics of analytic sample versus New York City (NYC) and U.S. populations.
VariableSample Median or %NYC Median or %4U.S. Median or %5
Female37.5%52.3%50.8%
Age29.135.937.8
Race/Ethnicity 1
White (not Hispanic/Latinx)62.2%32.3%61.5%
Black13.1%22.2%13.1%
Latinx10.3%29.1%17.6%
Asian (East or South)12.8%13.6%5.5%
Other1.6%1.0%5.9%
Multiracial7.5%1.8%3.1%
Citizenship Status
U.S. citizen (U.S.-born)92.5%62.8%86.5%
U.S. citizen (born abroad)5.0%20.2%6.4%
Legal permanent resident2.2%
Other0.3%
American Community Survey (ACS) Categories
Not a U.S. citizen2.5%17.0%7.0%
Foreign-born7.5%37.2%13.5%
NYC Borough of Residence
Bronx10.9%17.0%
Brooklyn36.9%30.8%
Manhattan23.4%19.3%
Queens23.1%27.3%
Staten Island5.3%5.6%
N3208,461,989321,418,821
1 Mutually exclusive race (categories exclude those who selected more than one race, who are included in the “multiracial” category).
Table 2. Mean support for social policies.
VariableSample Mean (S.D.)U.S. Mean (S.D.)Large City Mid-Atlantic U.S. Mean (S.D.)Range
Index 1: Redistribution 1
Income equality3.55
(1.23)
2.66
(1.26)
3.05
(1.26)
[1, 5]
Unemployment3.71
(1.10)
3.10
(1.18)
3.63
(1.00)
[1, 5]
Benefits for the poor3.53
(1.21)
3.53
(1.04)
3.59
(1.10)
[1, 5]
Income difference too large*
(*excluded from Index 1)
4.06
(1.02)
3.71
(1.12)
3.97
(0.94)
[1, 5]
Number of observations320140591
Index 2: Social Policies 2
Health3.11
(0.99)
3.33
(0.79)
3.71
(0.56)
[1, 4]
Old age3.12
(0.94)
3.34
(0.74)
3.54
(0.55)
[1, 4]
Student aid3.00
(0.95)
3.32
(0.75)
3.70
(0.56)
[1, 4]
Housing2.87
(0.94)
2.99
(0.81)
3.38
(0.74)
[1, 4]
Jobs*
(*excluded from Index 2)
2.57
(1.01)
2.20
(0.98)
2.48
(1.03)
[1, 4]
Number of observations320131540
1 U.S. national and regional data from the 2009 International Social Survey Programme (ISSP) [62]; ISSP-provided analytic weights applied; 2 U.S. national and regional data from 2016 ISSP [63]; ISSP-provided analytic weights applied.
Table 3. Results of independent t-tests of support for redistribution and social policies by perceived neighborhood diversity.
Mean
(SE)
Index 1: Redistribution
Mean
(SE)
Index 2: Social Policies
MinorityLow diversity
n = 68
3.67
(0.13)
3.10
(0.10)
High diversity
n = 31
3.76
(0.18)
3.38 ^
(0.12)
WhiteLow diversity
n = 143
3.48
(0.09)
2.98
(0.07)
High diversity
n = 63
3.70 ^
(0.12)
2.95
(0.12)
^ Pr(T > t) < 0.10.

