Estimation of the Normal Contact Stiffness for Frictional Interface in Sticking and Sliding Conditions
by
 , ,
, ,
Davide Tonazzi
1 ,
,
Francesco Massi
1,
Mario Salipante
1,
Laurent Baillet
2 and
Yves Berthier
3 1
DIMA, Department of Mechanical and Aerospace Engineering, “La Sapienza” University of Rome, via Eudossiana 18, 00184 Rome, Italy
2
Grenoble Alpes University, CNRS, IRD, IFSTTAR, ISTerre, 38000 Grenoble, France
3
LaMCoS, Contacts and Structural Mechanics Laboratory, University of Lyon, CNRS, INSA Lyon, UMR 5259, 20 rue des Sciences, F-69621 Villeurbanne, France
Lubricants 2019, 7(7), 56; https://doi.org/10.3390/lubricants7070056
Submission received: 12 June 2019
/
Revised: 21 June 2019
/
Accepted: 23 June 2019
/
Published: 2 July 2019
(This article belongs to the Special Issue Tribology and Contact Dynamics)
Abstract
:Modeling of frictional contact systems with high accuracy needs the knowledge of several contact parameters, which are mainly related to the local phenomena at the contact interfaces and affect the complex dynamics of mechanical systems in a prominent way. This work presents a newer approach for identifying reliable values of the normal contact stiffness between surfaces in contact, in both sliding and sticking conditions. The combination of experimental tests, on a dedicated set-up, with finite element modeling, allowed for an indirect determination of the normal contact stiffness. The stiffness was found to increase with increasing contact pressure and decreasing roughness, while the evolution of surface topography and third-body rheology affected the contact stiffness when sliding.
1. Introduction
The correct modeling of contact interfaces is a key factor in many engineering applications that inherently include contacts between components, e.g., friction joints [1,2,3], clamping devices, robotic contacts, rolling bearings [4,5], brake systems [6], etc. Contact mechanics between component surfaces also play a key role for understanding many tribological processes, such as friction-induced vibrations [7,8,9,10,11], stick-slip phenomena [12,13,14], frictional instability [7,15], adhesion, and wear [16,17]. An accurate contact modeling of such systems requires knowledge of interface contact parameters [18] such as contact stiffness, which are not easily measurable and completely understood.
In the last decades, numerical simulation became one of the most powerful tools for both the design of complex mechanical systems and the investigation of dynamic or tribological issues in dry contacts [16,19]. On one hand, industries use common numerical finite element models for the estimation of stress and strain distributions by static analysis [4,5], eigenvalues, and eigenmodes by modal analyses [6,20,21], or dynamic response of full systems through transient simulations. On the other hand, researchers have drastically improved the capability of numerical codes for understanding and solving any kind of issue related to contact interfaces and systems under frictional contacts. For example, transient and modal numerical analyses are nowadays used for predicting and simulating contact-induced instabilities, such as brake squeal [6,22,23], creep groan noise [24], or stick–slip instabilities [15,25,26].
The development of more and more sophisticated and refined numerical models [27,28] of systems with contact interfaces, requires us to define more reliable contact parameters that could largely affect both the tribological and dynamic response of the system [29]. With regards to this, this work was focused on the estimation of normal contact stiffness at a frictional interface.
The first studies dealing with contact stiffness used analytical approaches through simple elastic models, such as Hertzian spherical contact. In the GW (Greenwood and Williamson) model [30], the contact interface is considered nominally flat with a single scale roughness, where the contact stiffness is obtained by a statistical model. Starting with the pioneering work of Greenwood and Williamson, various analytical and multiscale models [31] of contact interfaces have been developed, which focus on the effect of roughness on the normal and tangential contact behavior [32,33]. The effect of roughness on the normal and tangential contact stiffness and energy dissipation in frictional contacts has been recently investigated in [34,35], while a comparison between various statistical and fractal models is presented in [36,37].
Some experimental approaches to measure contact stiffness are based on ultrasonic methods, where high frequency waves are used to derive the stiffness from the interface [38]. Another method to measure contact stiffness and damping at the nano-scale has been presented by Asif et al. [39]. A few works [40,41] in the literature are also based on combined experimental and analytical/numerical approaches for indirect identification of the contact stiffness [42].
In this context, the objective of the present work was to estimate contact stiffness by combining experimental dynamic tests and a continuous numerical approach, for an indirect measurement of the stiffness at the contact interface.
A specific tribometer has been developed for identifying the contact stiffness in both sticking and sliding conditions, for different surface topographies, materials, geometries, and average contact pressures. On one hand, the frequency analysis of the system response allowed for identifying its dynamics, which was related to both the system and the interface contribution. On the other hand, a finite element model of the experimental set-up was developed by considering the contact interface contribution. A comparison between the numerical and experimental results allowed for the estimation of contact stiffness as a function of the investigated parameters. With respect to other approaches in literature, the following improvements could be underlined:
The developed test bench enabled to perform tests both in the sliding and sticking conditions, allowing for investigating the actual surface response during sliding. The lumped 3D finite element model [43], allowed to account for the geometry of the contact surface and the tri-dimensional deformations of the bodies in contact.
First, the methodology was validated and the results were compared with the ranges present in the literature. Then, a parametrical experimental campaign, combined with the results of the numerical model, allowed for identifying contact stiffness as a function of different average contact pressures and different surface topographies in the sticking conditions. The results were compared with the stiffness values in classical finite element models. Lastly, the contact stiffness was estimated in the sliding conditions and compared with the one obtained in the sticking condition.
2. Method and Materials
2.1. Description of the Approach
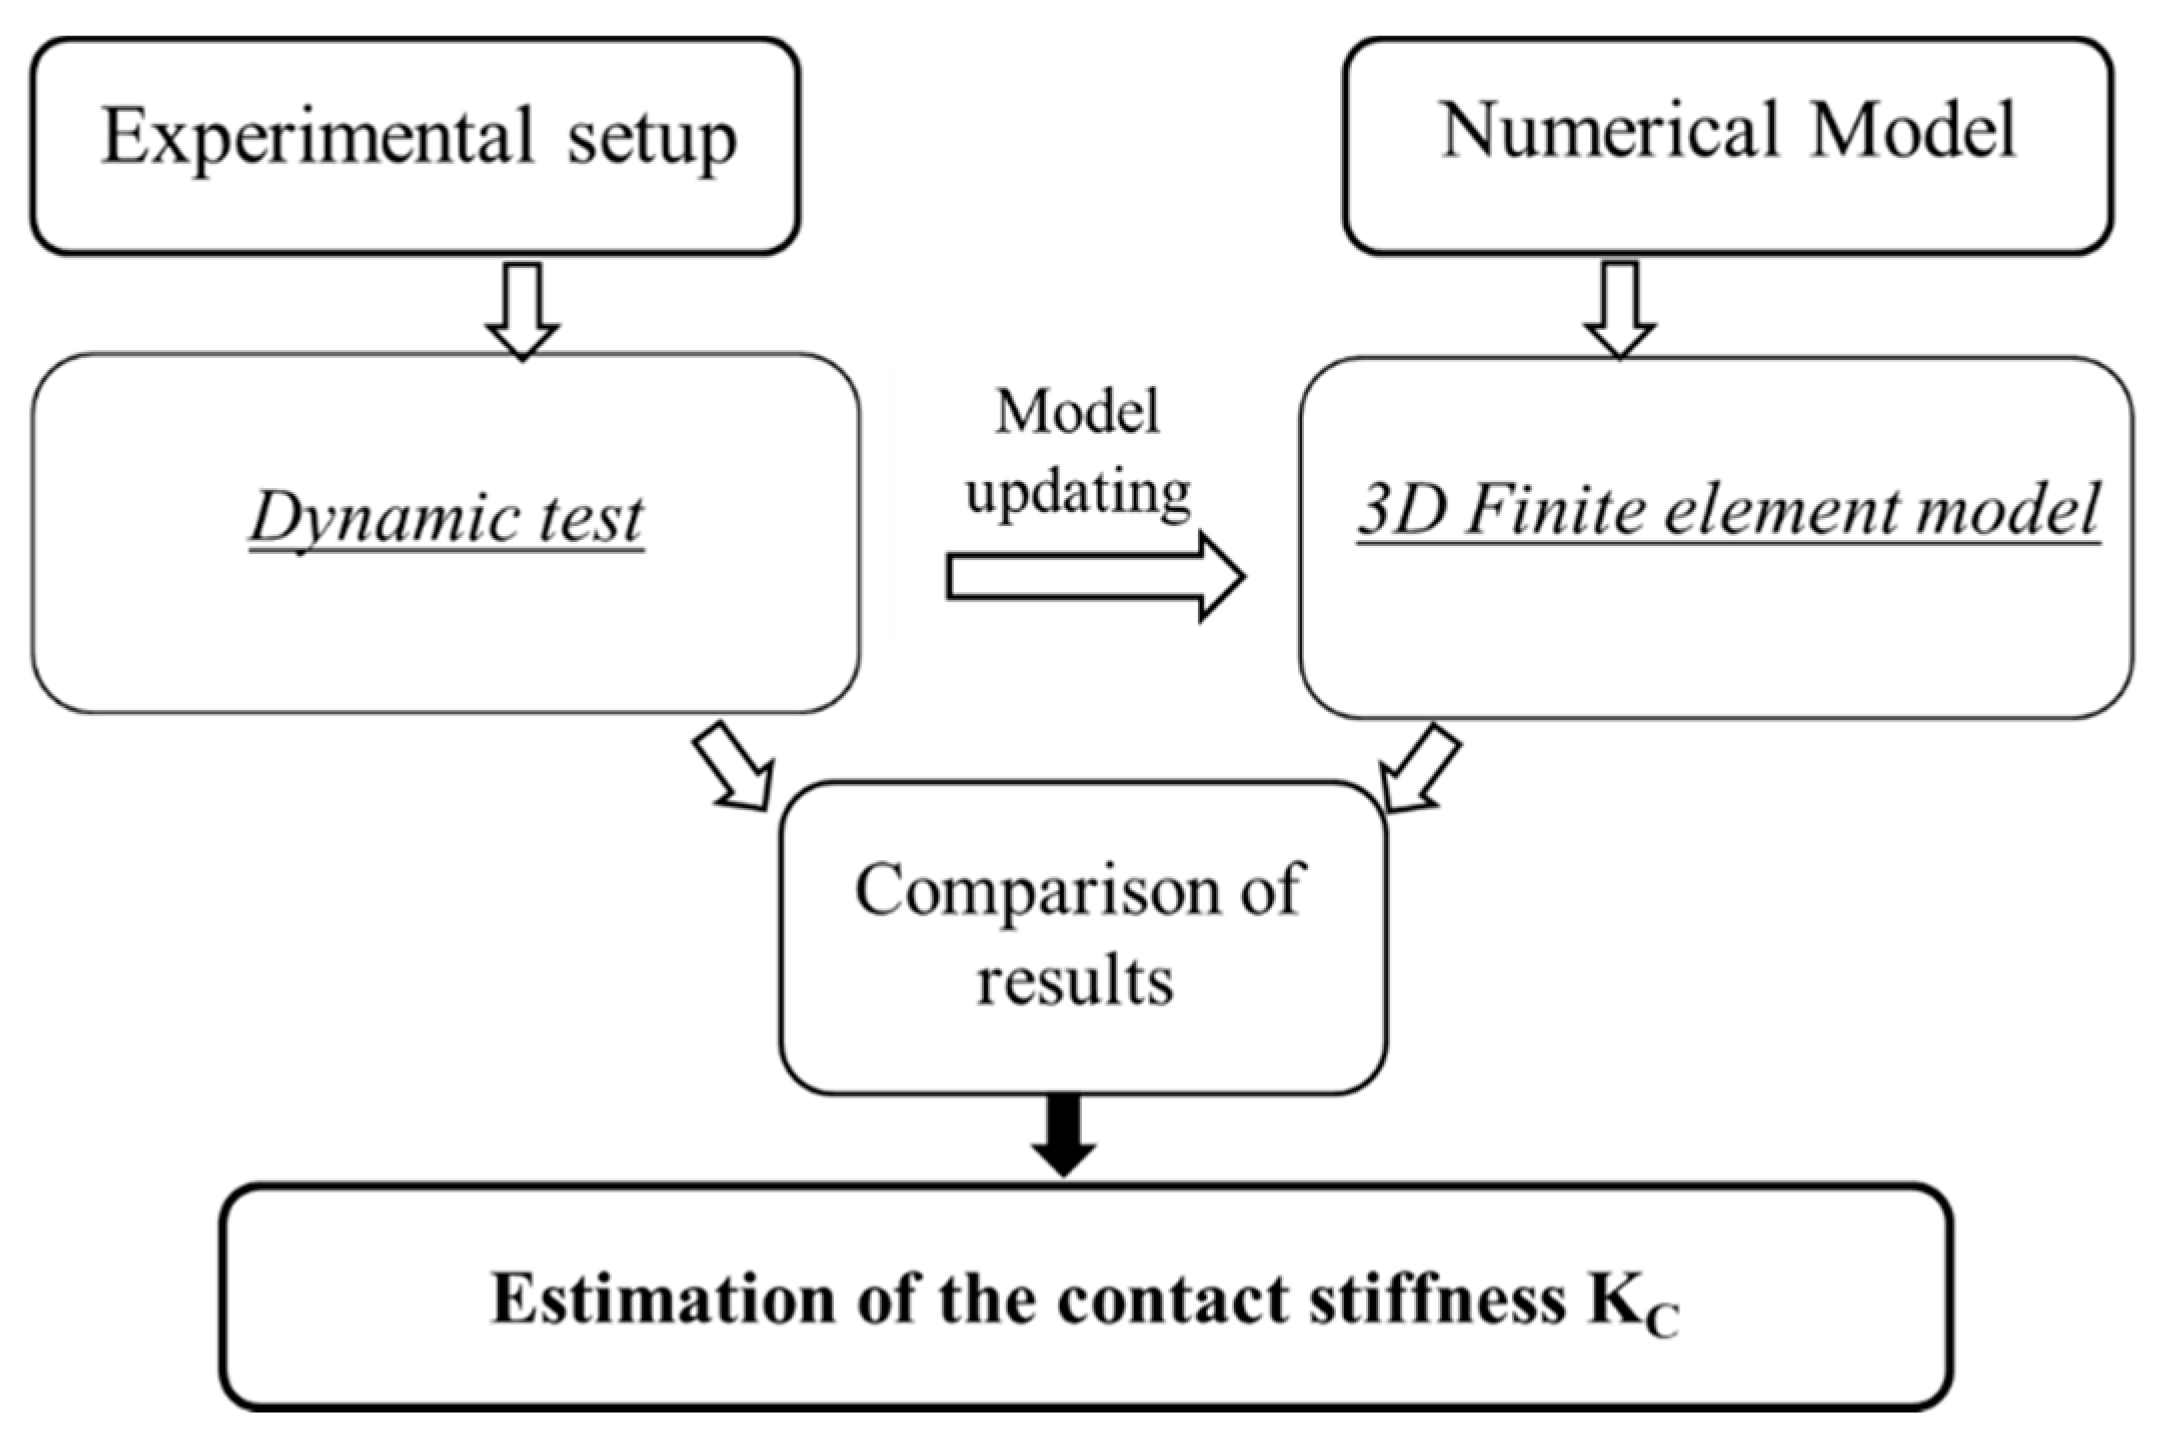
The proposed methodology for the estimation of the normal contact stiffness was based on the dynamic contribution of the interface to the dynamic response of the mechanical system. A combined numerical and experimental approach (Figure 1) was proposed for an indirect identification of the contact stiffness parameter. From an experimental point of view, a setup was designed and used to perform dynamic tests (Figure 2). Afterwards, a 3D finite element model—updated and representative of the experimental setup—was utilized to compare the numerical and experimental results for estimating the normal contact system between the considered contact surfaces.
The comparison between the results from the numerical model and the frequency response function obtained from the experiments allowed for retrieving the value of the normal contact stiffness.
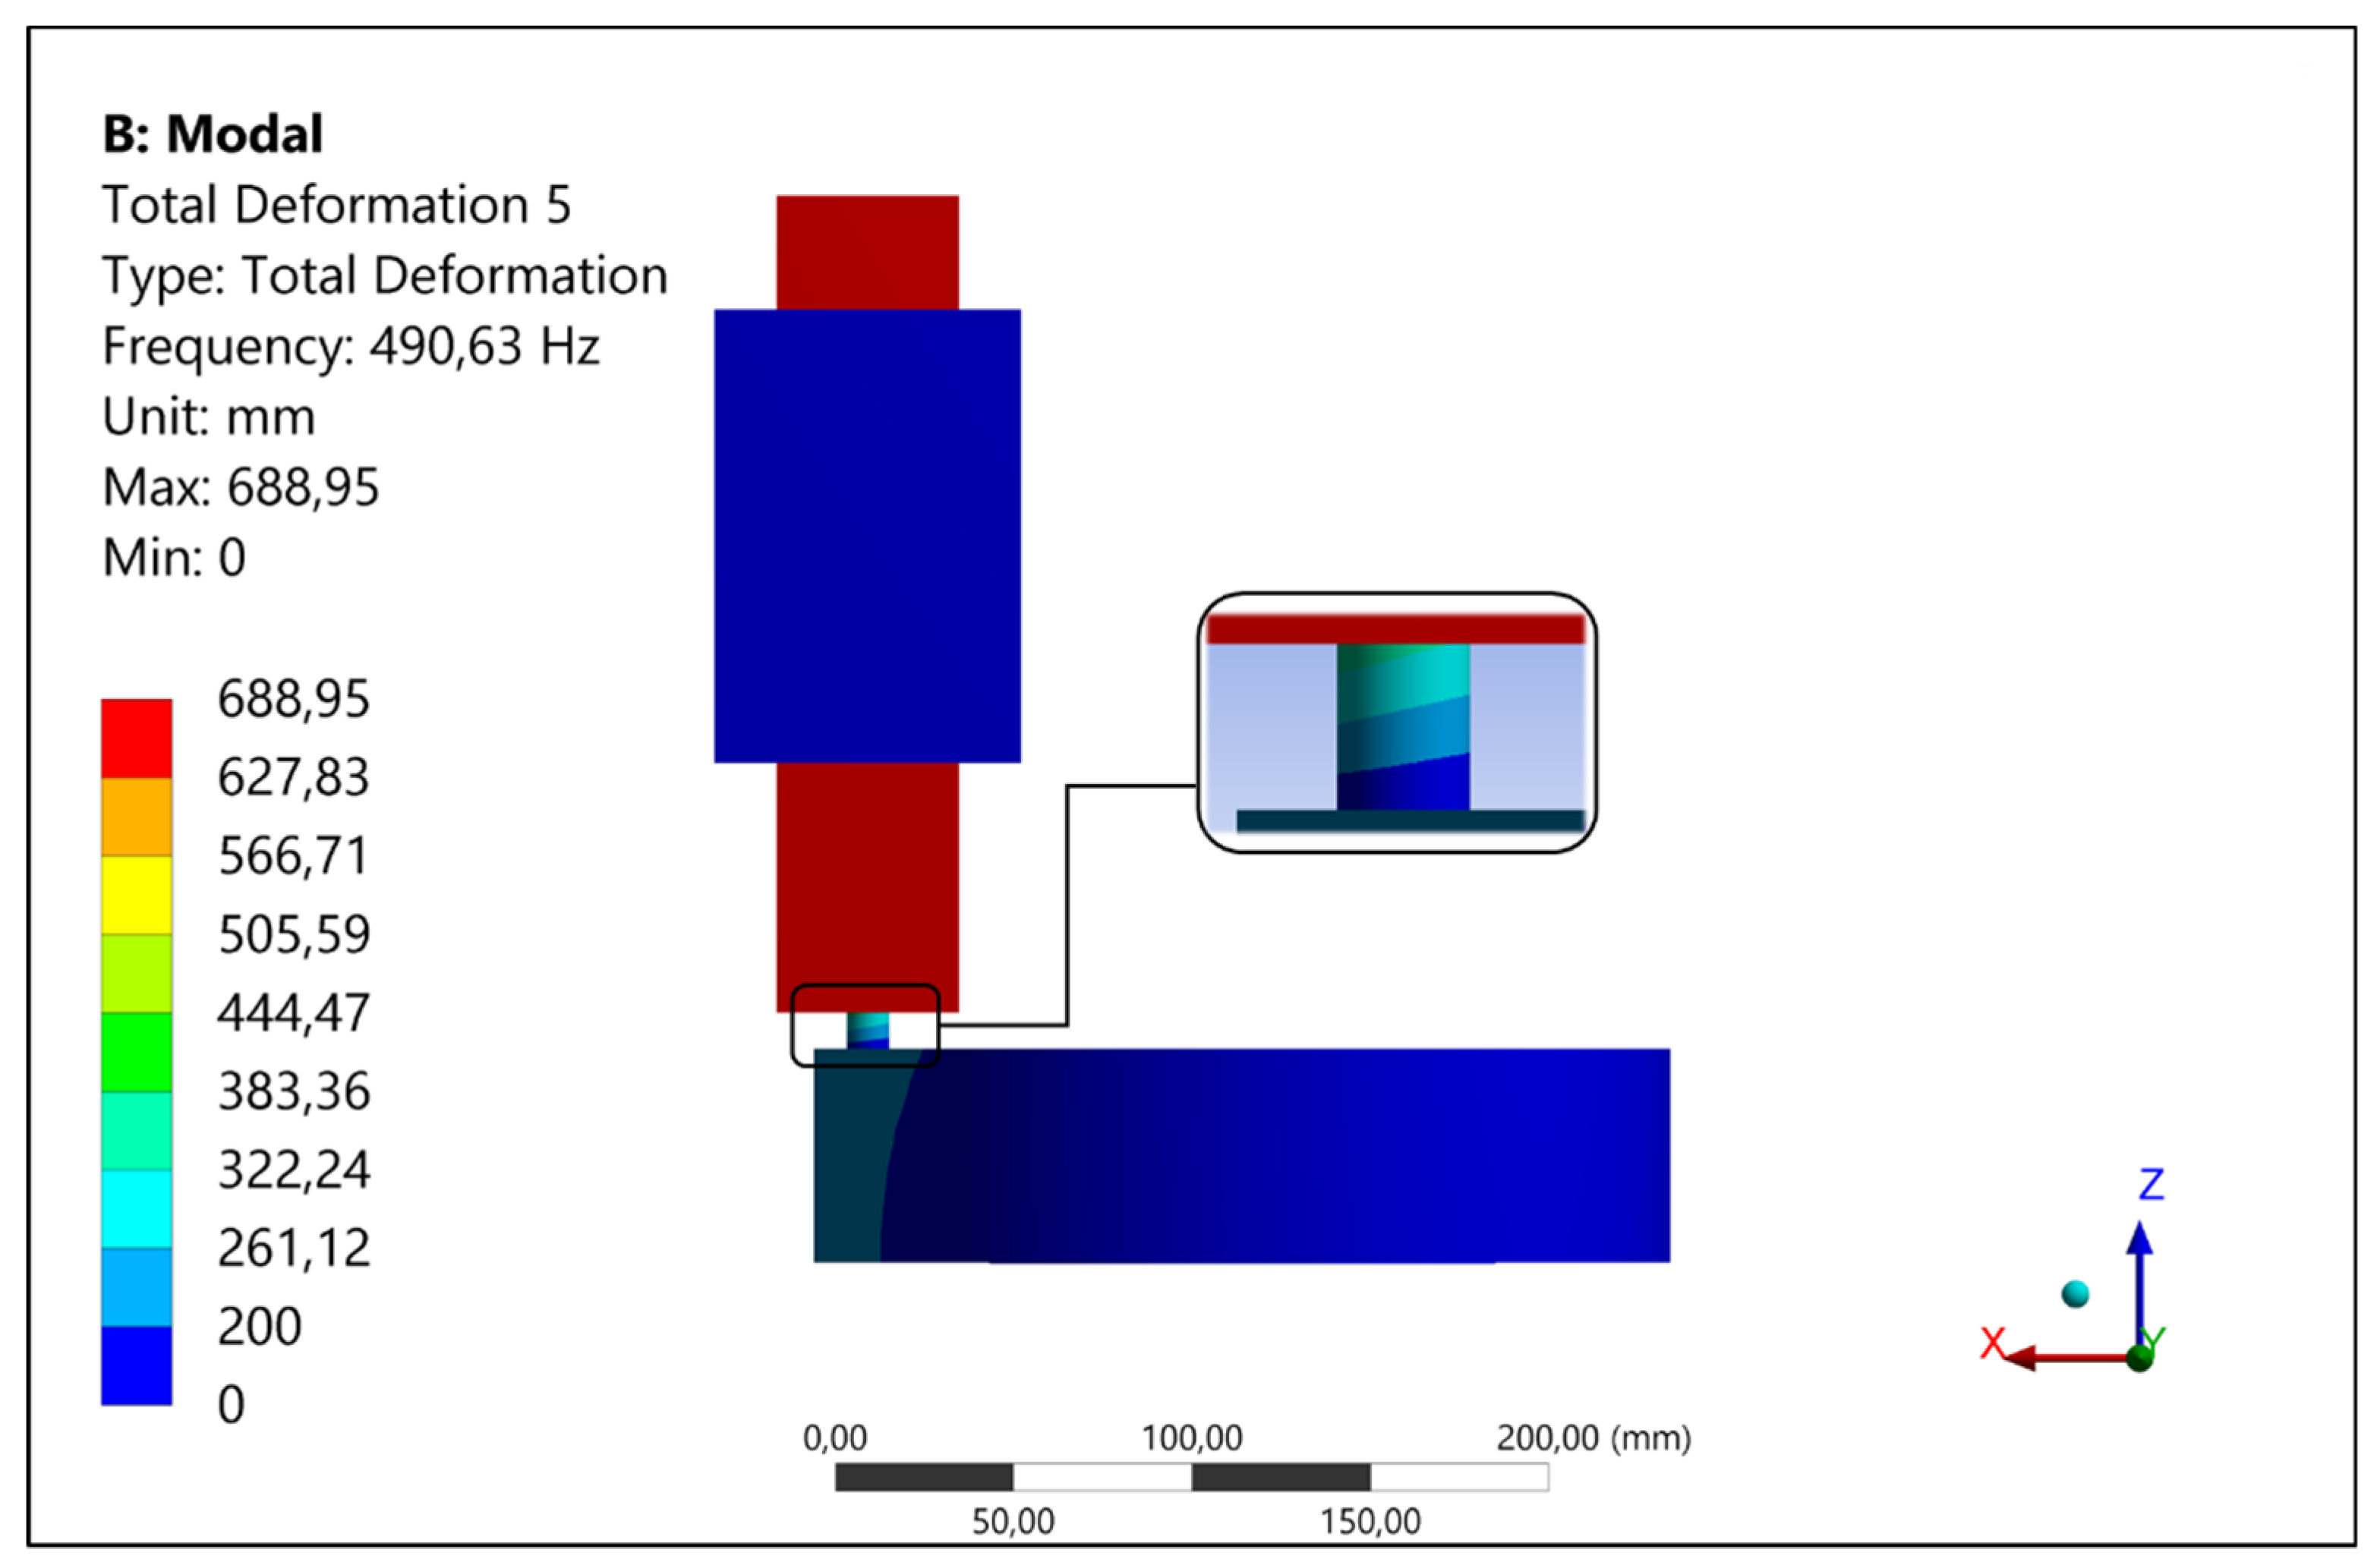
To elaborate, the finite element model of the set-up (Figure 3) was first developed and validated to simulate the same dynamic response (natural frequencies) measured on the tribometer when the tested sample was not in contact with the disc. Once the finite element model was validated, the contact was established and the only unknown was the contact stiffness. The frequency of the investigated mode (Figure 4) was then the output of the model used that was for the identification of the contact stiffness by comparing it with the experiments.
In fact, a parametrical numerical modal analysis was performed as a function of contact stiffness, in order to meet the natural frequency of the investigated mode with the one measured experimentally. The numerical value of the contact stiffness that allowed for a matching between experimental and numerical natural frequencies was retained as the estimated value of the interface stiffness.
Moreover, to verify that the contact stiffness parameter was decoupled from the stiffness of the bulk, the test was repeated for different sample length, by changing the stiffness of the bulk and leaving the same contact stiffness at the interface.
This procedure was repeated for each investigated parameter—average contact pressure and roughness.
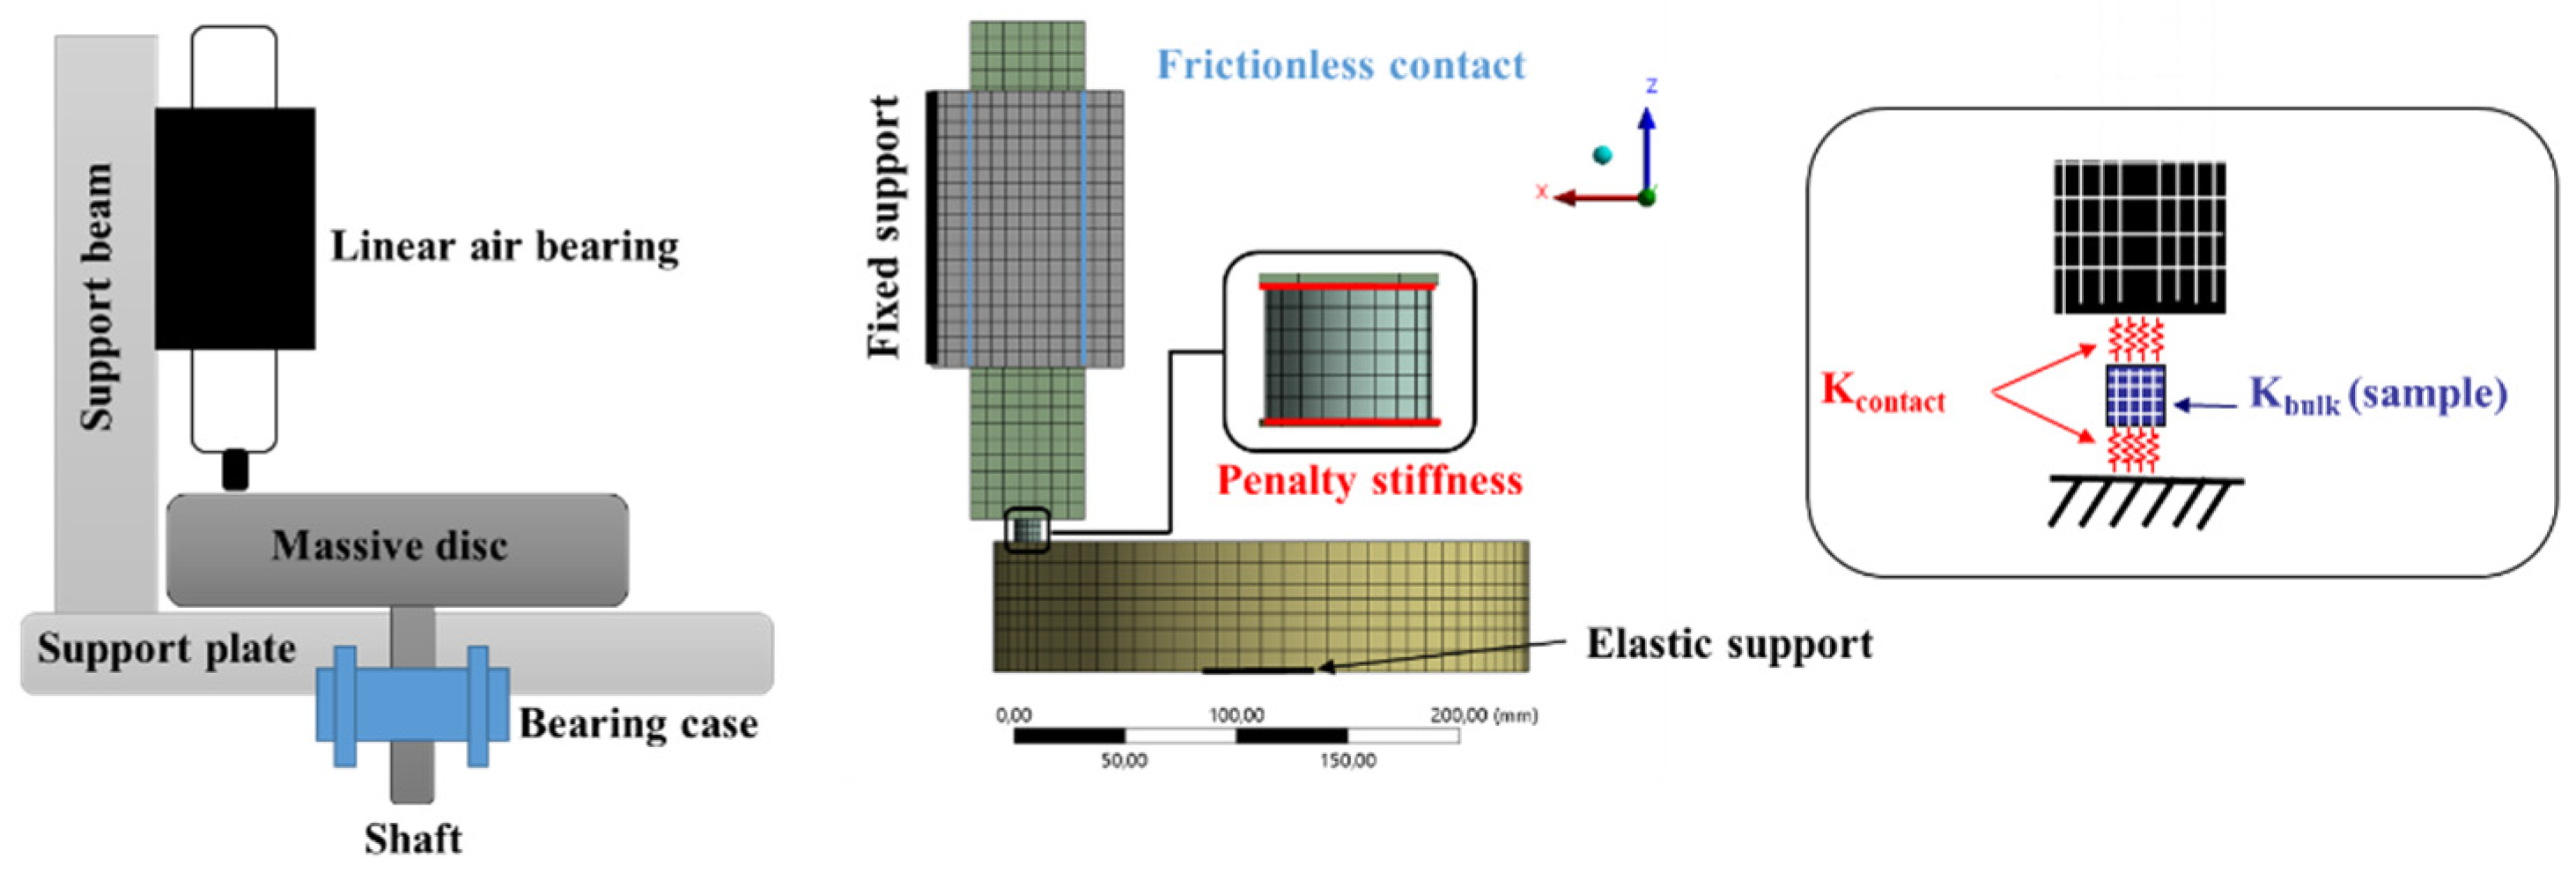
The contact stiffness was introduced in the finite element model (Figure 3) through a classical penalty method implemented on ANSYS (ANSYS, Inc. Canonsburg, PA, USA), which introduced a stiffness between the nodes of the contact and target surfaces. The introduction of the contact stiffness allowed for a penetration gap between the two surfaces and the corresponding contact force, which was the product between the contact stiffness and the gap.
It is worth pointing out that the introduction of a distributed surface stiffness through the penalty method was validated, by comparing the results with the ones obtained when introducing an interface layer with the corresponding stiffness, which led to the same dynamic stiffness contribution.
2.2. Experimental Test Bench
The experimental tribometer, designed to perform the experiments for the contact stiffness estimation, is presented in Figure 2. The setup was designed to perform tests with different materials (samples) in contact, different lengths of the samples, and for a range of the average contact pressure up to 1 MPa. The system was mainly characterized by a material sample, which was in contact with a thick steel disc and loaded by the weight of a massive support (guide bar). The surface of the disc in contact with the material sample was polished to obtain a value of Ra = 0.1 µm in terms of roughness, as for the surface in contact with the guide bar. In comparison to the tested material (polymethyl methacrylate (PMMA) properties, such lower values of the roughness, together with the higher value of the component bulk stiffness (Alloy Aluminum and Stainless Steel), allowed for neglecting the contact stiffness contribution of the disc and the guide bar roughness. In order to minimize the friction between the massive support and the frame, along the normal direction to the contact surface, an air guide (NEWWAY Air-Bearings S40-03125, Aston, PA, USA)—based on the air bearings technology—was used. In this way, the massive support was free to move in the normal direction. The experimental setup was equipped with a DC motor and a digital motion controller, making it possible to perform measurements, in both the sticking and sliding conditions, at a controlled rotational speed. In order to perform the dynamic tests, the setup was equipped with the following instruments:
- 1
- instrumented impact hammer (Brüel & Kjær type 8202, Naerum, Denmark);
- 2
- piezoelectric charge accelerometer (Brüel & Kjær type 4393);
- 3
- system acquisition for noise and vibration measurements (PROSIG type P5600, Fareham, UK);
- 4
- charge amplifiers (Brüel & Kjær type 2635).
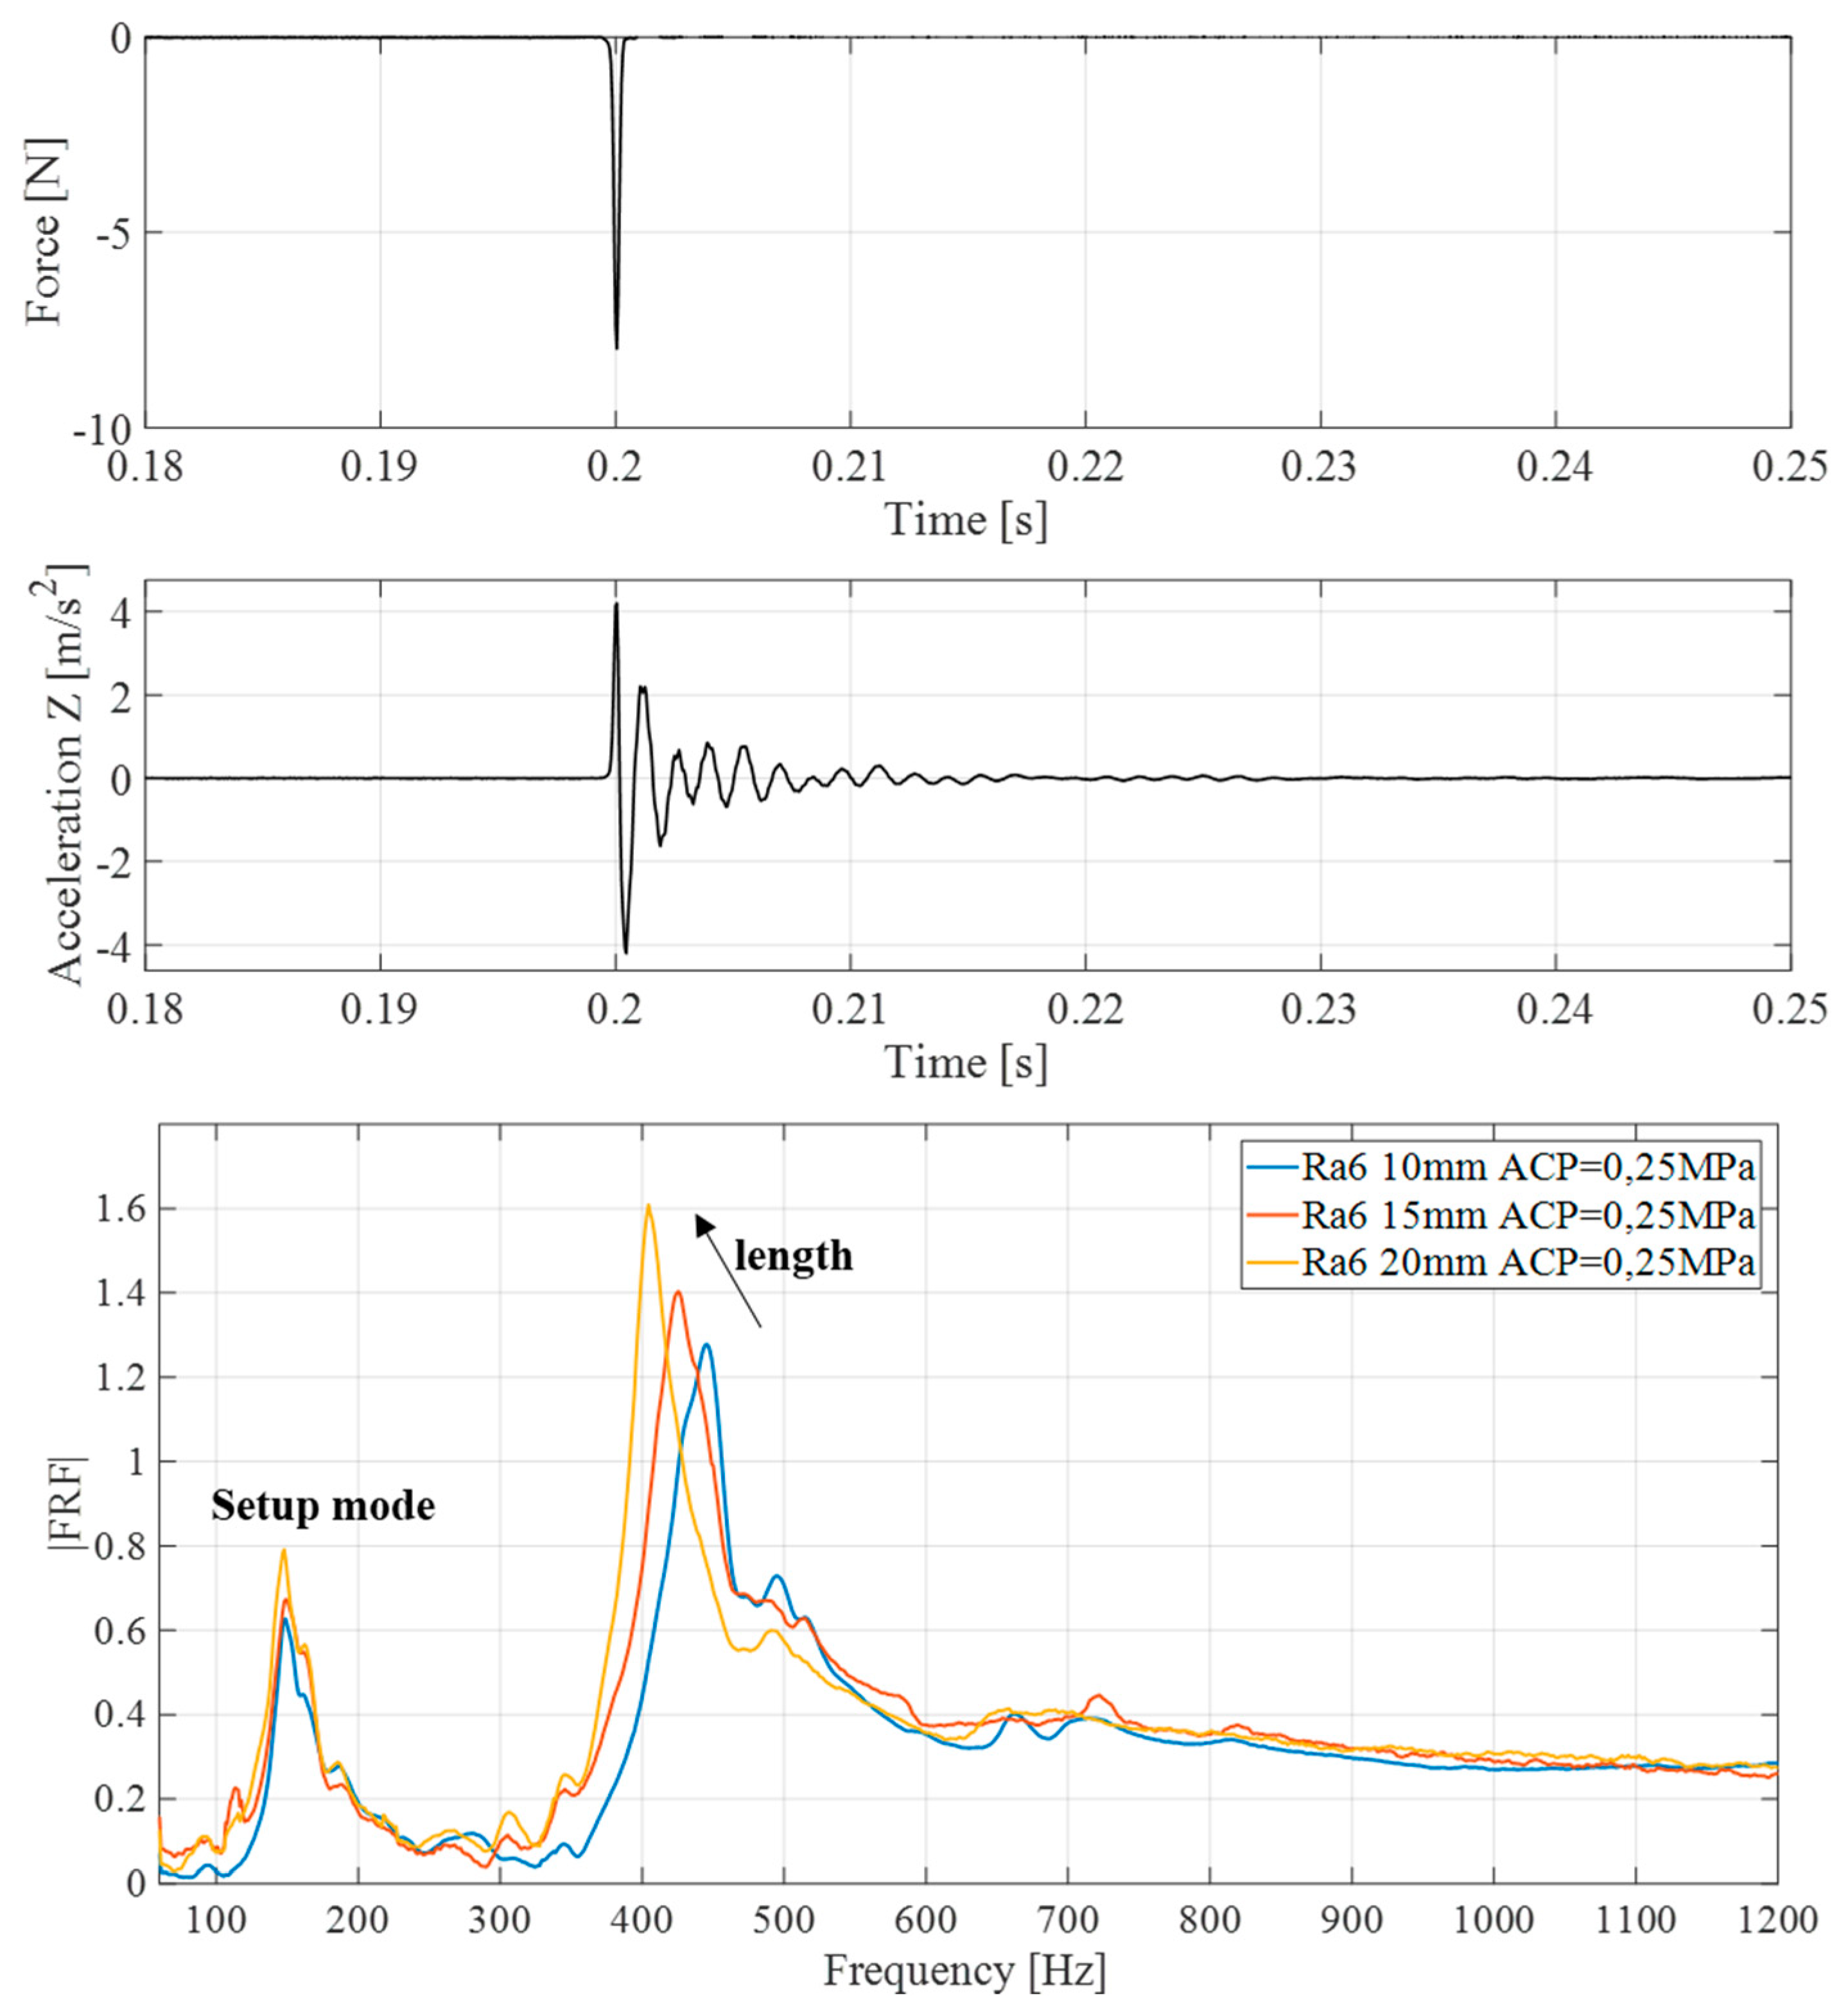
In order to apply this methodology, the experimental setup was designed by considering that the resonance frequency of interest was easily distinguished from the other resonance frequencies of the experimental setup (Figure 5). The dynamic response of the system to an impulsive excitation (hammer impact) was recorded by an accelerometer placed at the top of the guide bar (Figure 2). The signal of the impulsive force and the system acceleration were recorded by a signal acquisition system with a sampling frequency of 10 kHz.
An extensive measurement campaign was conducted for the measurement in the sticking condition. Three specimens for each length and surface roughness were used, considering the following protocol:
Once the specimen was placed between the disc and the guide bar, the system was excited by the instrumented hammer with a single impact on the guide bar and the system response was recovered by the accelerometer (Figure 5);
The recorded signals were used to compute the frequency response function (FRF), in order to identify the natural frequency of the investigated mode (Figure 5).
These steps were repeated, maintaining the same material sample in place, for each of the following average contact pressure:
- 0.14 MPa;
- 0.25 MPa;
- 0.35 MPa;
- 0.57 MPa;
- 1 MPa.
Finally, the test for an average contact pressure of 0.14 MPa was repeated, in order to ensure the repeatability of the whole set of measurements.
2.3. Test Sample Definition
Cylindrical shaped specimens were machined for the tests. Samples of polymethyl methacrylate (PMMA) were used for the validation of the methodology. To achieve consistent results, it was necessary to define a protocol for the specimen preparation.
For each cylindrical bar, the geometrical and material properties were measured in order to guarantee a strict control on the mechanical and geometrical characteristics of the material. After the characterization of the material geometry and mechanical properties (Young Modulus and density), the cylindrical bars (12 mm in diameter) were cut into three pieces of different lengths—10, 15, and 20 mm.
After the preliminary cutting process, in order to obtain the defined roughness at the contact surface, a face milling process was performed on both contact surfaces; using the right combination of cutting head (diameter and cutters shape) and rotational and feeding speed, it was possible to obtain a repeatable surface roughness that met the following requirements:
Ra (μm) = Ratarget ± 0.2;
Slope tolerance (both faces) (‰) = 1;
Flatness tolerance (both faces) (‰) = 1.
After the milling process, each specimen was cleaned in an ultrasound cleaning machine and then left to dry. At this time, every single cylinder was visually inspected and tested with a profilometer, in order to evaluate the surface topography. Only the specimens that met the roughness and planarity requirements were used for the contact stiffness evaluation campaign.
2.4. D Finite Element Model
The finite element model (Figure 3) of the experimental setup was developed using the ANSYS software. In order to reduce the model size and the complexity of the system, the numerical model only included the disc assembly and the air bearing support with its guide bar. The presence of the shaft and bearings with the related global dynamic contributions were taken into account by adding an elastic support on the base of the disc assembly, with a stiffness value calculated by updating the model according to the preliminary dynamic tests.
A hexahedral-dominant mesh was used in the numerical model. Each 3D solid element had 16 nodes, for a total of 48 degrees of freedom. The model was composed of four main bodies—the disc, the guide bar, the air bearing, and the specimen. For each body, a linear elastic material law had taken into account with the following parameters:
Steel Disc: Young Modulus E = 201 GPa, Poisson coefficient ν = 0.3, and mass density ρ = 7930 kg/m3;
Linear air bearing (support and guide bar): Young Modulus E = 70 GPa, Poisson coefficient ν = 0.3, and mass density ρ = 2700 kg/m3;
PMMA specimen: Young Modulus E = 4.5 GPa, Poisson coefficient ν = 0.4, and mass density ρ = 1190 kg/m3.
A finer mesh was used for the specimen meshing, while a coarser mesh turned out to be sufficient for an accurate description of the other bodies in the frequency range of interest, for a total of 13,884 elements in the model.
The contact region between the guide bar and the air bearing was modeled as frictionless and a pure penalty method was used to describe the contact between the specimen surfaces, the disc, and the guide bar (Figure 3). The value of the normal contact stiffness Kcontact (parameter to be estimated) was set to be equal for both contact interfaces of the sample, with the disc and the supporting bar having the same roughness (Figure 3). A fixed support on one side of the air bearing frame was defined, in order to reproduce the experimental mounting. A point mass on top of the guide bar was used to account for the dynamic effect of the dead mass on the top of the guide bar in the experimental setup.
An elastic support per unit area on the joint between disc and shaft was placed where the disc physically joined the shaft, with a magnitude of 20 N/mm3, to model the stiffness of the shaft bearings assembly.
The numerical update process of each components and then of the whole system was carried out in a preliminary phase. The numerical model was updated in order to meet the experimental natural frequencies of the experimental set-up. Afterwards, the focus was placed on the mode of vibration involving the rigid vertical oscillation of the mass (air guide and added mass) and the stiffness provided by the sum of the bulk stiffness and interface stiffness of the tested sample (Figure 4). The developed 3D finite element model allowed to account for the real deformation of the sample and the elastic deformation of the disc as well (Figure 4).
3. Contact Stiffness Estimation in the Sticking Condition
3.1. Experimental Dynamic Tests
A parametrical modal analysis was performed as a function of the different sample lengths and of the different average contact pressures (added masses) that were experimentally imposed. The results of the numerical modal analysis (frequency of the investigated mode) were compared with the experiments (frequency response function). An extensive measurement campaign was conducted for the estimation of the contact stiffness in the sticking condition, using the PMMA material samples.
Three specimens for each length (L = 10 mm, L = 15 mm, L = 20 mm), for two values of the roughness parameter (Ra = 1 µm and Ra = 6 µm), were tested according to the testing protocol (see Section 2.2), for recovering the FRFs (Figure 5).
The tests were repeated for each of the following average contact pressure values—0.14 MPa, 0.25, 0.35, 0.57, and 1 MPa. After performing the test with the highest pressure, a last measurement was performed with the lowest value of the average contact pressure, in order to verify the eventual modifications of the interface (e.g., roughness plastic deformation) that could modify the natural frequency of the investigated mode.
Figure 5 shows the frequency response functions computed for each tested height of the samples, highlighting how the natural frequency of the investigated mode (at about 400–450 Hz) shifted at the lower frequencies, with the increase of the sample height. Such a trend was due to the decrease of the sample bulk stiffness, when its length increased. The frequency peak at about 150 Hz was related to a structural mode of the set-up and, as expected, it did not change as a function of the heights of the tested sample.
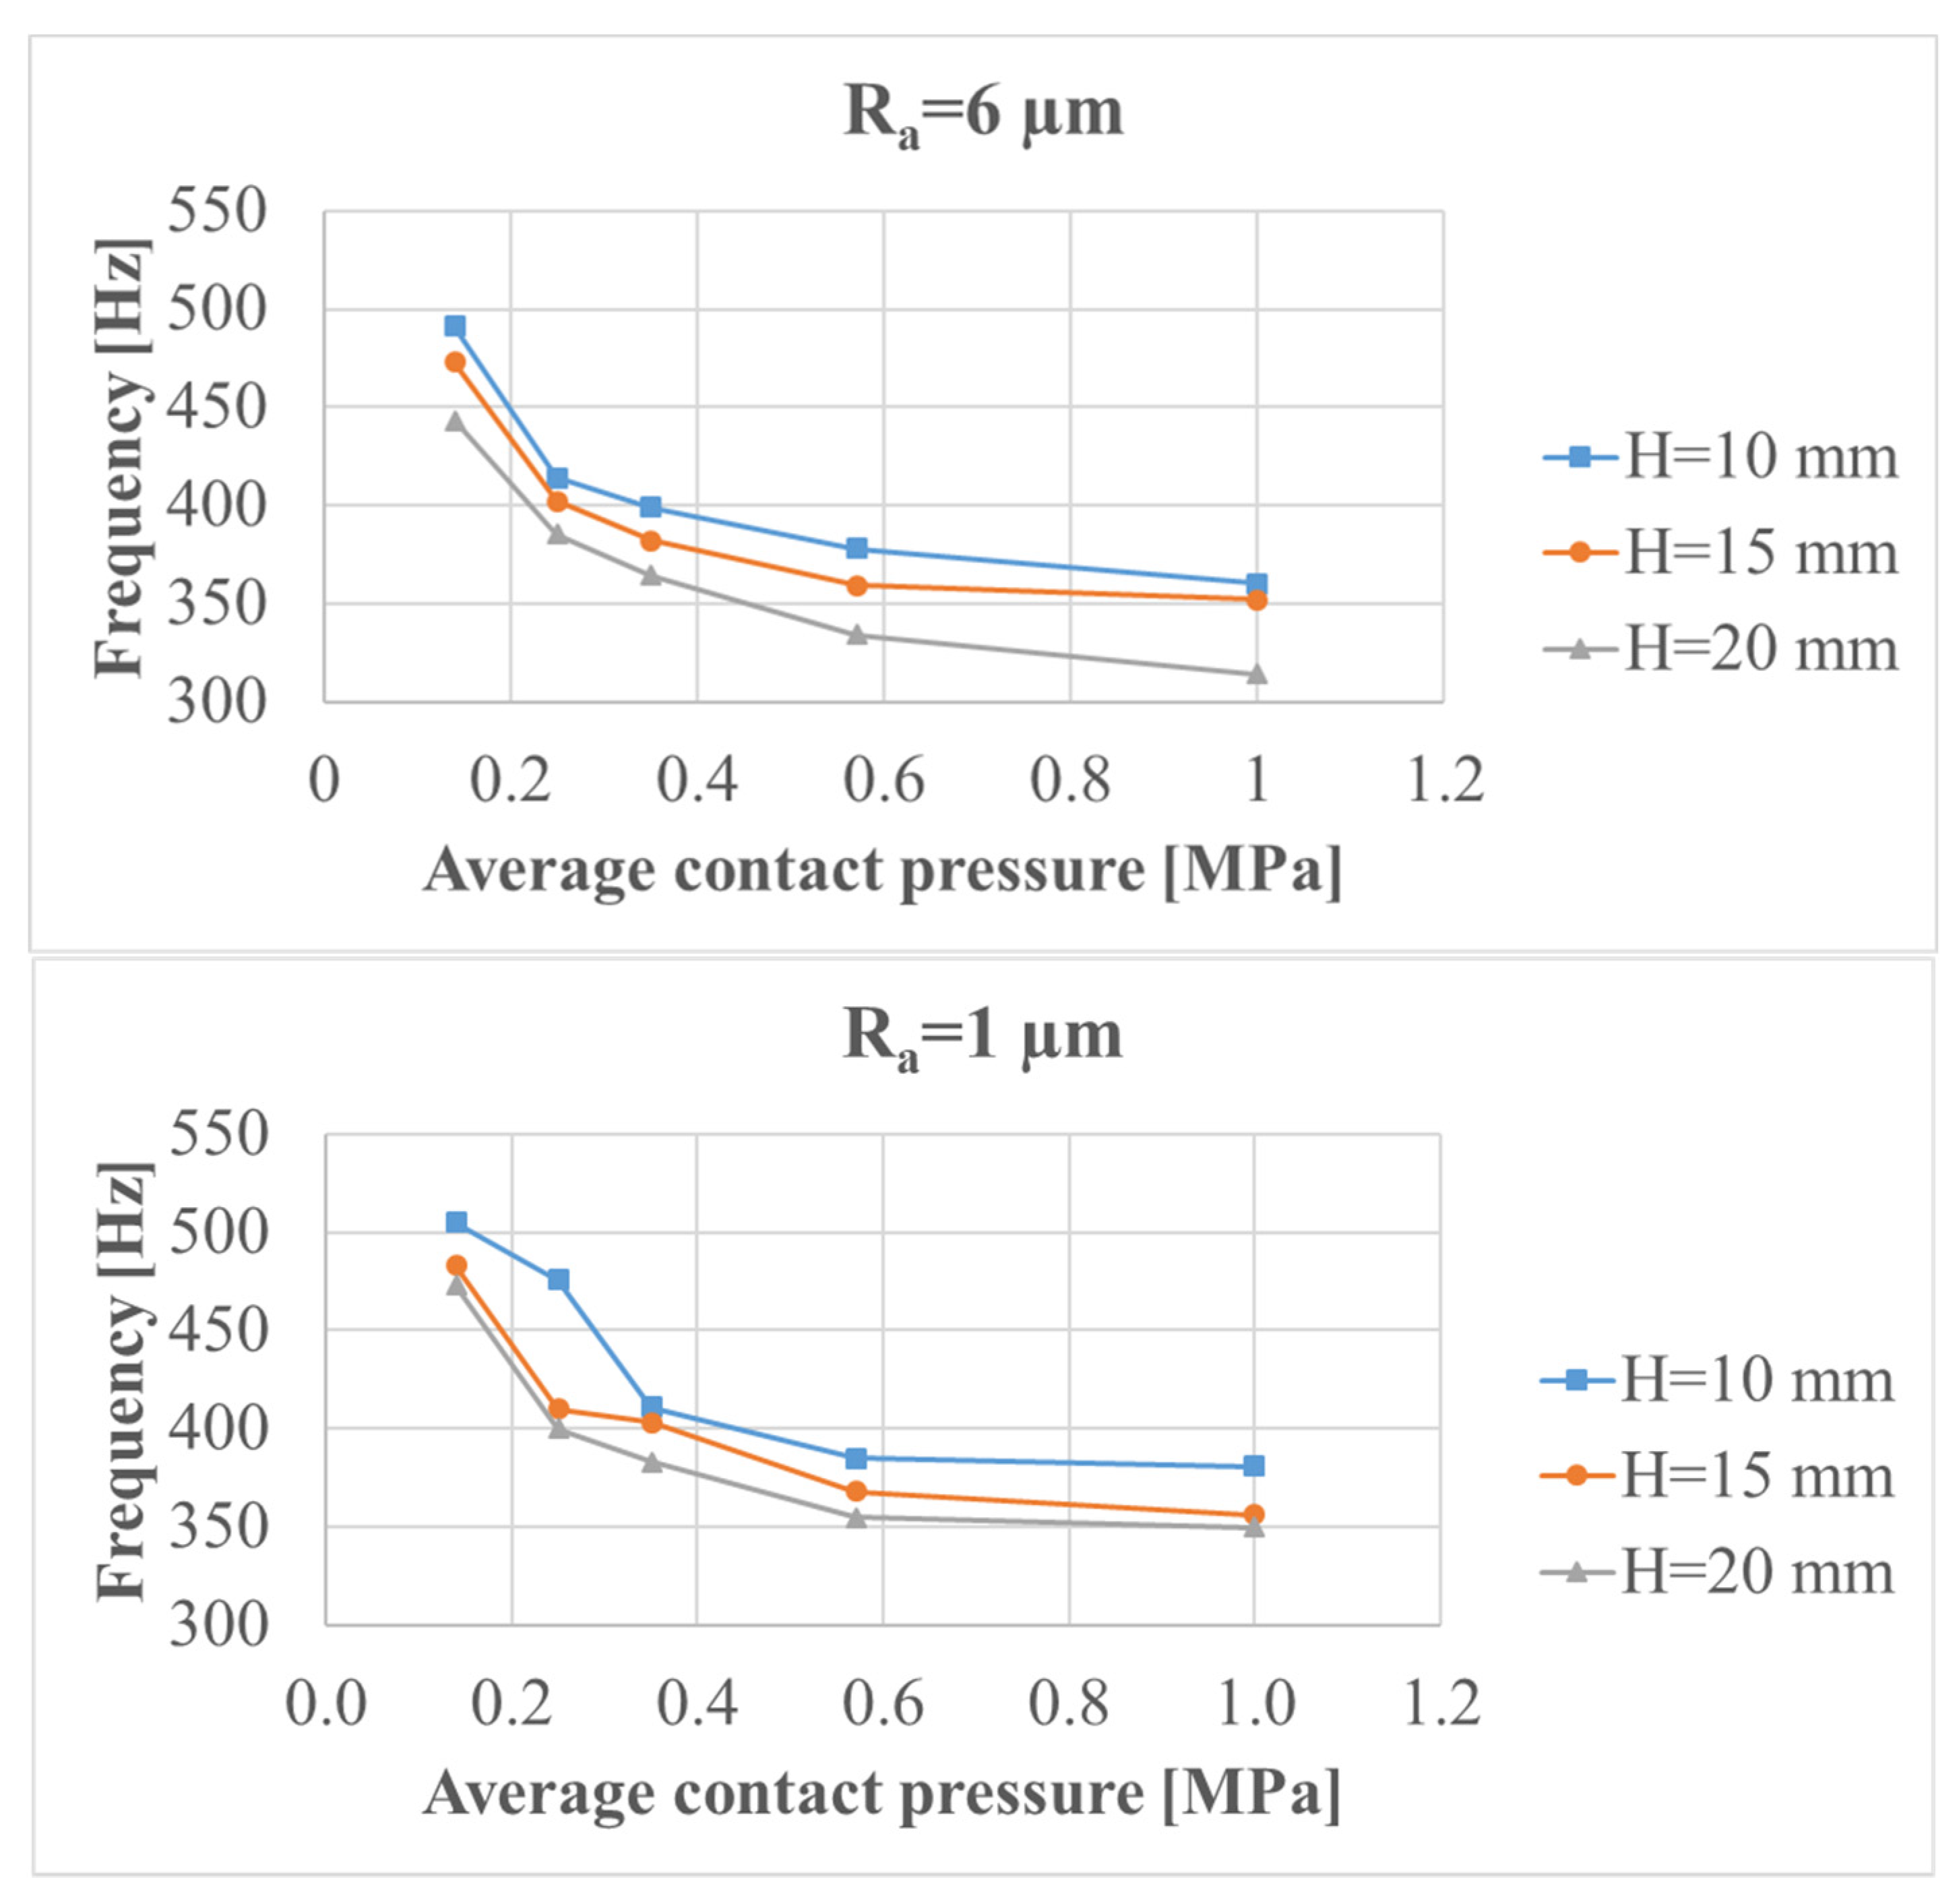
After computing the FRFs as a function of the average contact pressure, sample length and sample roughness (as in Figure 5), the frequency evolution of the investigated mode is plotted in Figure 6. A decrease in the natural frequency as a function of the contact pressure was observed for both Ra = 1 µm and Ra = 6 µm. The decrease in frequency was due to the increase of the added mass weight needed for varying the contact pressure in the experiments.
3.2. Contact Stiffness Identification
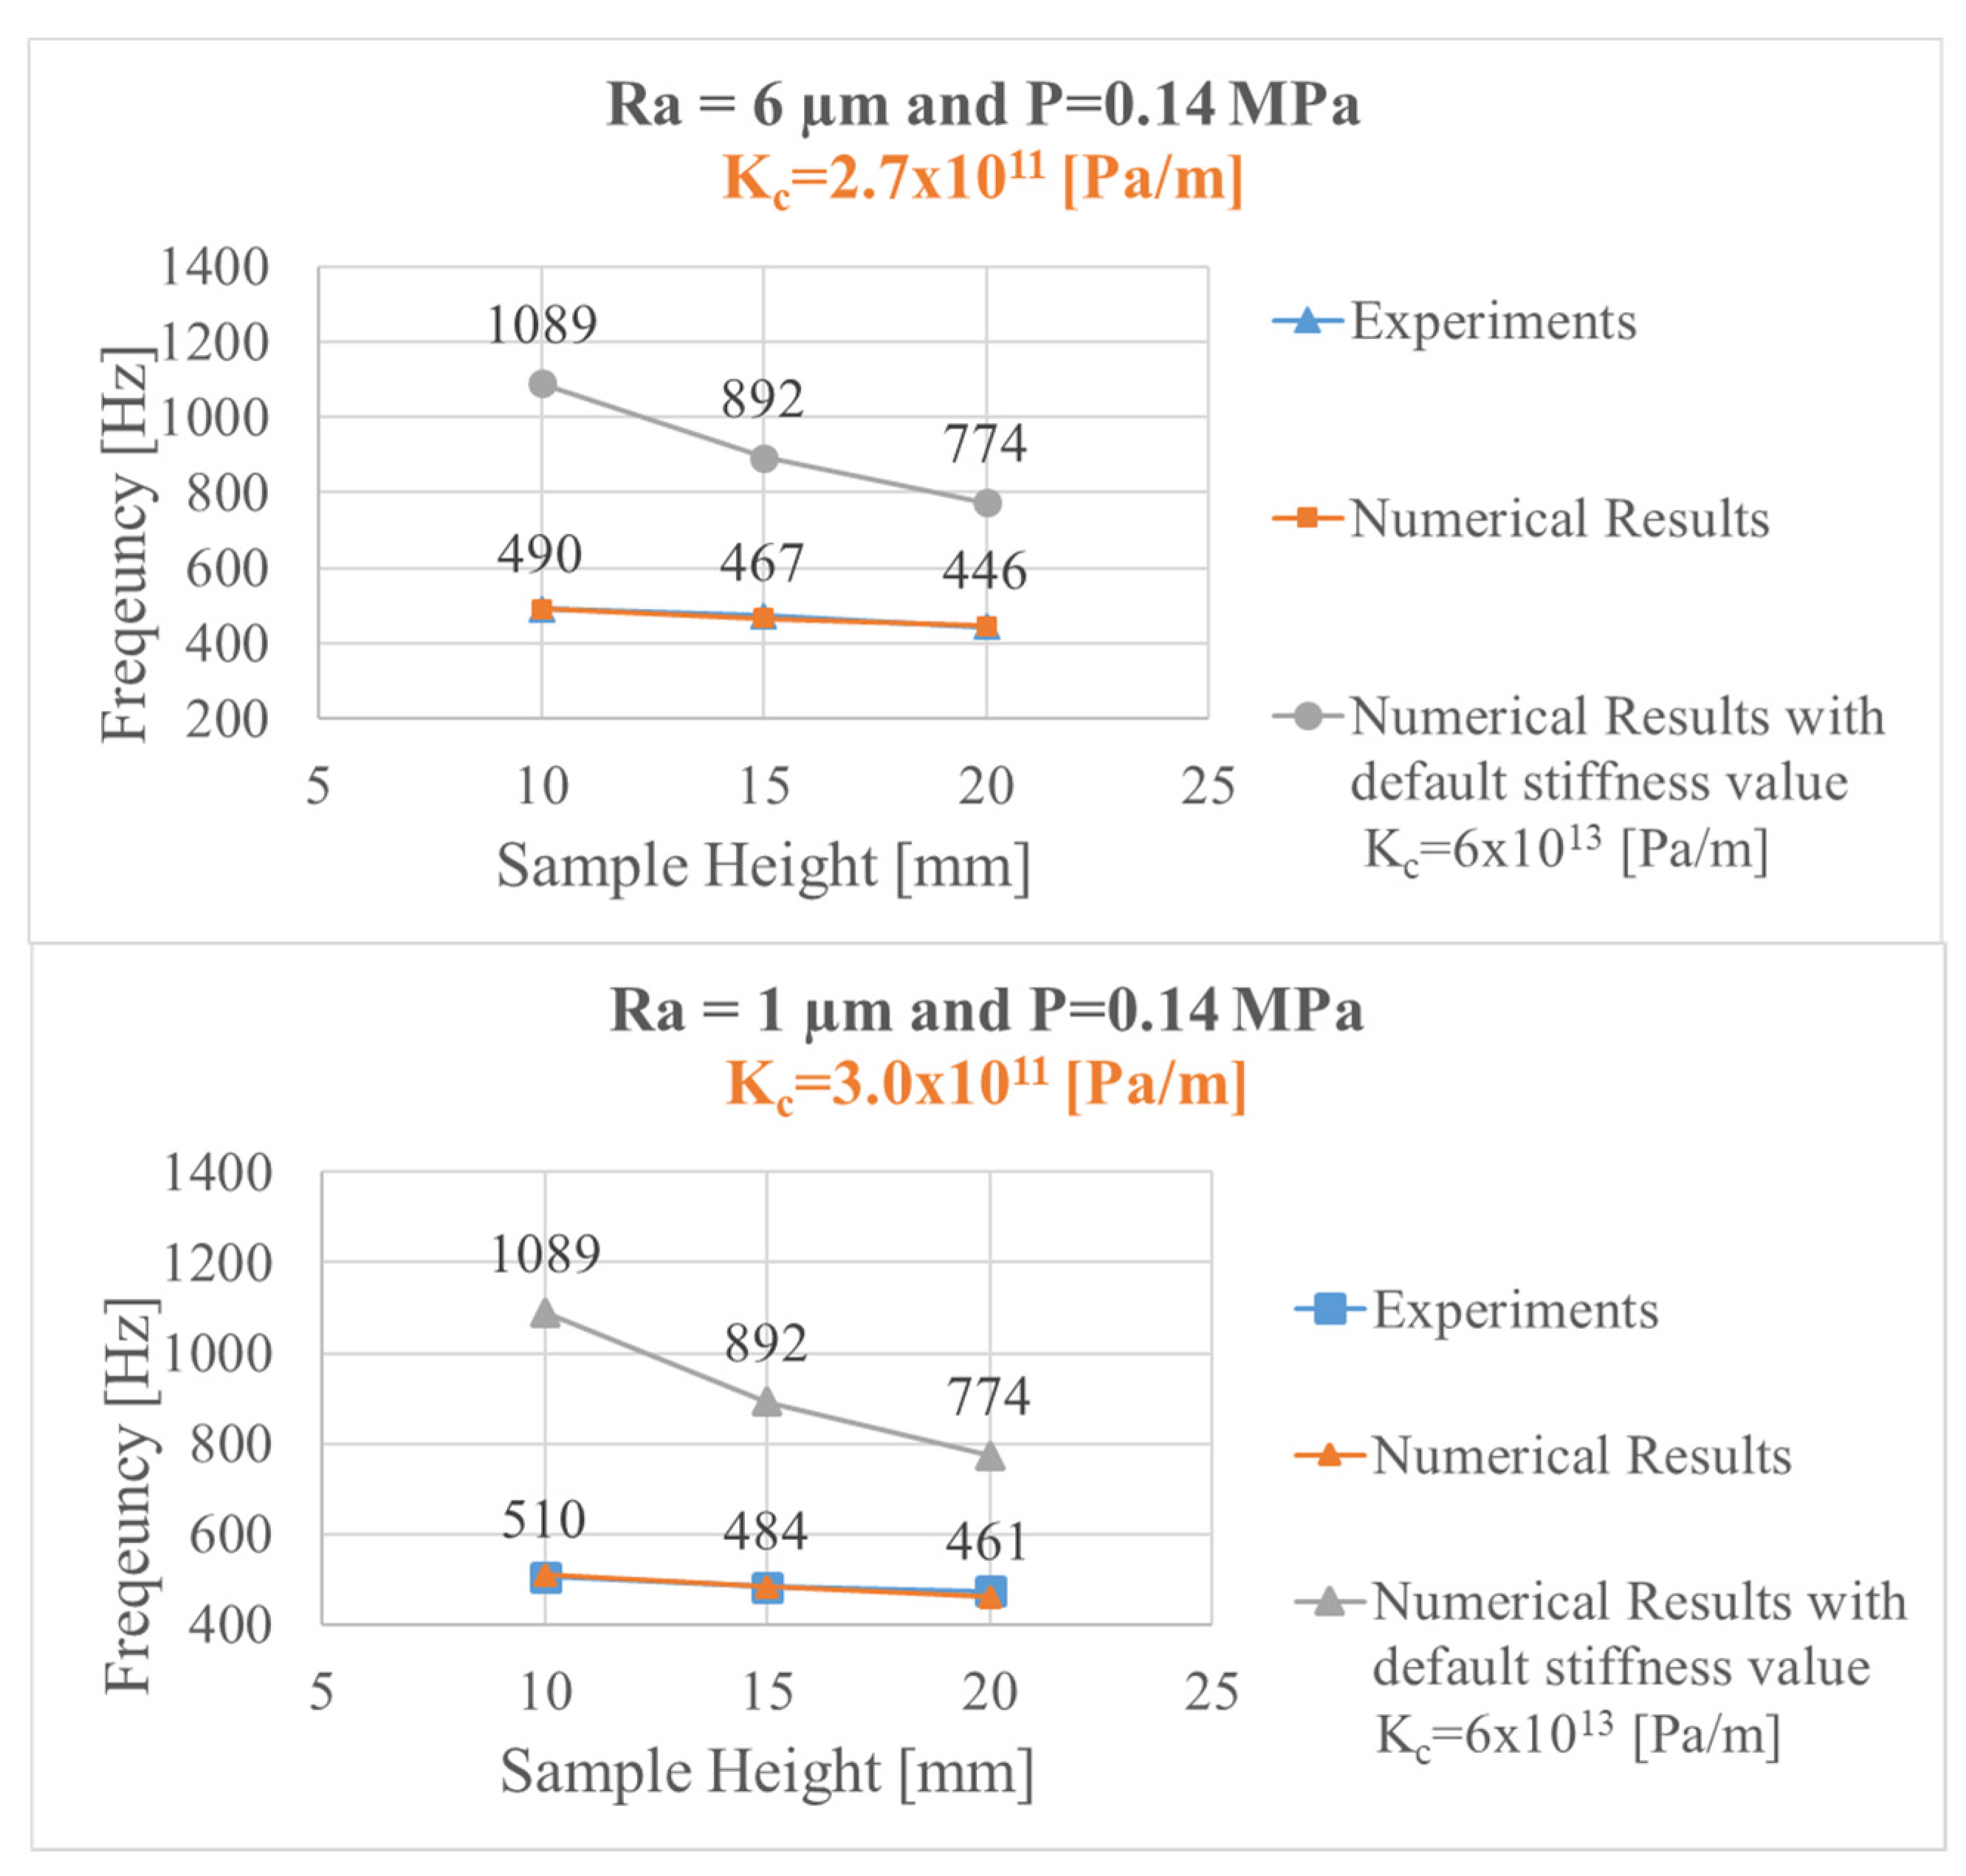
Figure 7 shows a comparison of the results related to the numerical and experimental tests in terms of the natural frequency of the investigated system mode. The numerical value of the normal contact stiffness, introduced in the contact model by penalty formulation, allowed for obtaining a quantitative agreement between the experiments and the numerical results, in the case of an average contact pressure of 0.14 MPa. The identified contact stiffness was Kc = 2.7 × 10¹¹ (Pa/m) and Kc = 3 × 10¹¹ (Pa/m) for a surface roughness of Ra = 1 µm and Ra = 6 µm, respectively.
The use of samples of different lengths was adopted to verify the decoupling between the respective contributions of the bulk and the interface stiffness, in the overall stiffness of the investigation mode of vibration. In fact, when the length of the sample increased, only the stiffness of the bulk decreased. The fact that the numerical values of the natural frequencies in Figure 7 agreed the experimental values, both in magnitude and in direction (with respect to the sample length), meant that the contribution from the bulk and interface stiffness were correctly decoupled. While this result could be considered trivial, as the bulk material properties of the PMMA were known, it could be useful to provide such validation when dealing with brake lining materials [29], for which the material properties are affected by large incertitude.
The results were also compared with the ones obtained numerically when using the contact stiffness calculated by the numerical software as default, i.e., Kc = 6 × 10¹³ (Pa/m). The comparison with the experiment highlighted a crucial difference in terms of the natural frequency of the considered system mode, confirming the unrealistic values of the contact stiffness in the commercial codes, which was overestimated and therefore led to an overestimation of the mode frequency (Figure 7). In fact, the contact stiffness calculated by the software did not account for the interface features, such as roughness or presence of a third body.
Then, the contact stiffness was identified, through comparison with the experiments for both Ra = 1 µm and Ra = 6 µm, as a function of the average contact pressure. In Figure 8 the trend of the contact stiffness as a function of the average contact pressure for both the surface roughness, Ra = 1 µm and Ra = 6 µm is presented. The respective error bars were calculated on three different samples for each test condition. The increase in contact stiffness as a function of the contact pressure was also confirmed from the results obtained by Xi Shi and Polycarpou in [43], for a dry contact system.
The results highlighted how the contact stiffness increased with the increase in the average contact pressure, for both roughness parameters, as found in the literature by analytical and simplified numerical models [30,40] and by ultrasonic experiments [44,45]. The estimated stiffness ranged between 2.7 × 10¹¹ (Pa/m) and 6.1 × 10¹¹ (Pa/m), when increasing the contact pressure between 0.1 MPa and 1 MPa. The increase in contact stiffness as a function of the contact pressure was in agreement with the theoretical and numerical results presented in [46], in which contact stiffness was studied by using an elastic contact model between a smooth plane and a rough surface.
A difference in terms of the contact stiffness was highlighted (Figure 8) as a function of the different surface roughness. A lower value of the surface roughness resulted in a higher value of the contact stiffness (black curve in Figure 8), within the whole range of the tested contact pressures. The trend in Figure 8 was in agreement with the power–law relation between the normal contact stiffness and pressure, theoretically derived in [47,48]. Moreover, the effect of roughness on contact stiffness followed the same behavior as found by the analytical and numerical contact model presented in [47].
4. Contact Stiffness Estimation in the Sliding Condition
In several applications, the numerical simulations were aimed to reproduce contact in the sliding conditions. Consequently, the estimation of the contact stiffness between bodies in relative motion represents a significant improvement in numerical and analytical modeling [49] of contact frictional systems. To achieve such a result, it was necessary to define an experimental procedure that allowed for obtaining consistent and reproducible results.
To this purpose, the experimental tests were conducted according to the flow chart in Figure 9; the procedure is described below:
First (at time 1 s in Figure 9), the system was excited in the sticking condition (no rotation imposed on the disc), using the instrumented hammer with a single impact on the guide bar, while recording the acceleration of the system; this preliminary sticking condition measurement allowed to get a reference test for comparing the subsequent tests performed in the sticking and sliding conditions. Then (at time 5 s in Figure 9), the motor was activated, rotating the disc at a speed of 1.5 revolutions per second (940 mm/s of average sliding velocity), while the sample stayed fixed thanks to an edge on the support. Impact excitations were provided during the sliding, in order to perform the identification of the contact stiffness in the sliding condition. The average friction coefficient between the PMMA specimen and the disc, measured at the tested sliding velocity, was 0.37. After 80 s, the motor was deactivated, arresting the motion of the disc. The system was then excited again by the instrumented hammer, performing a new measurement in the sticking condition without modifying the contact (without removing the sample). The previous steps were repeated to reach at least 240 m of the global sliding distance, with successive measurements in the sliding and sticking conditions, in order to follow the evolution of the contact stiffness, due to the evolution of the interface with the sliding distance.
At the beginning and at the end of each campaign, the specimen surfaces were observed (Figure 10) and measured with a profilometer (Figure 11), in order to evaluate the modifications in the roughness profile and surface topography, between the beginning (initial contact surface) and the end of the sliding test (used contact surface).
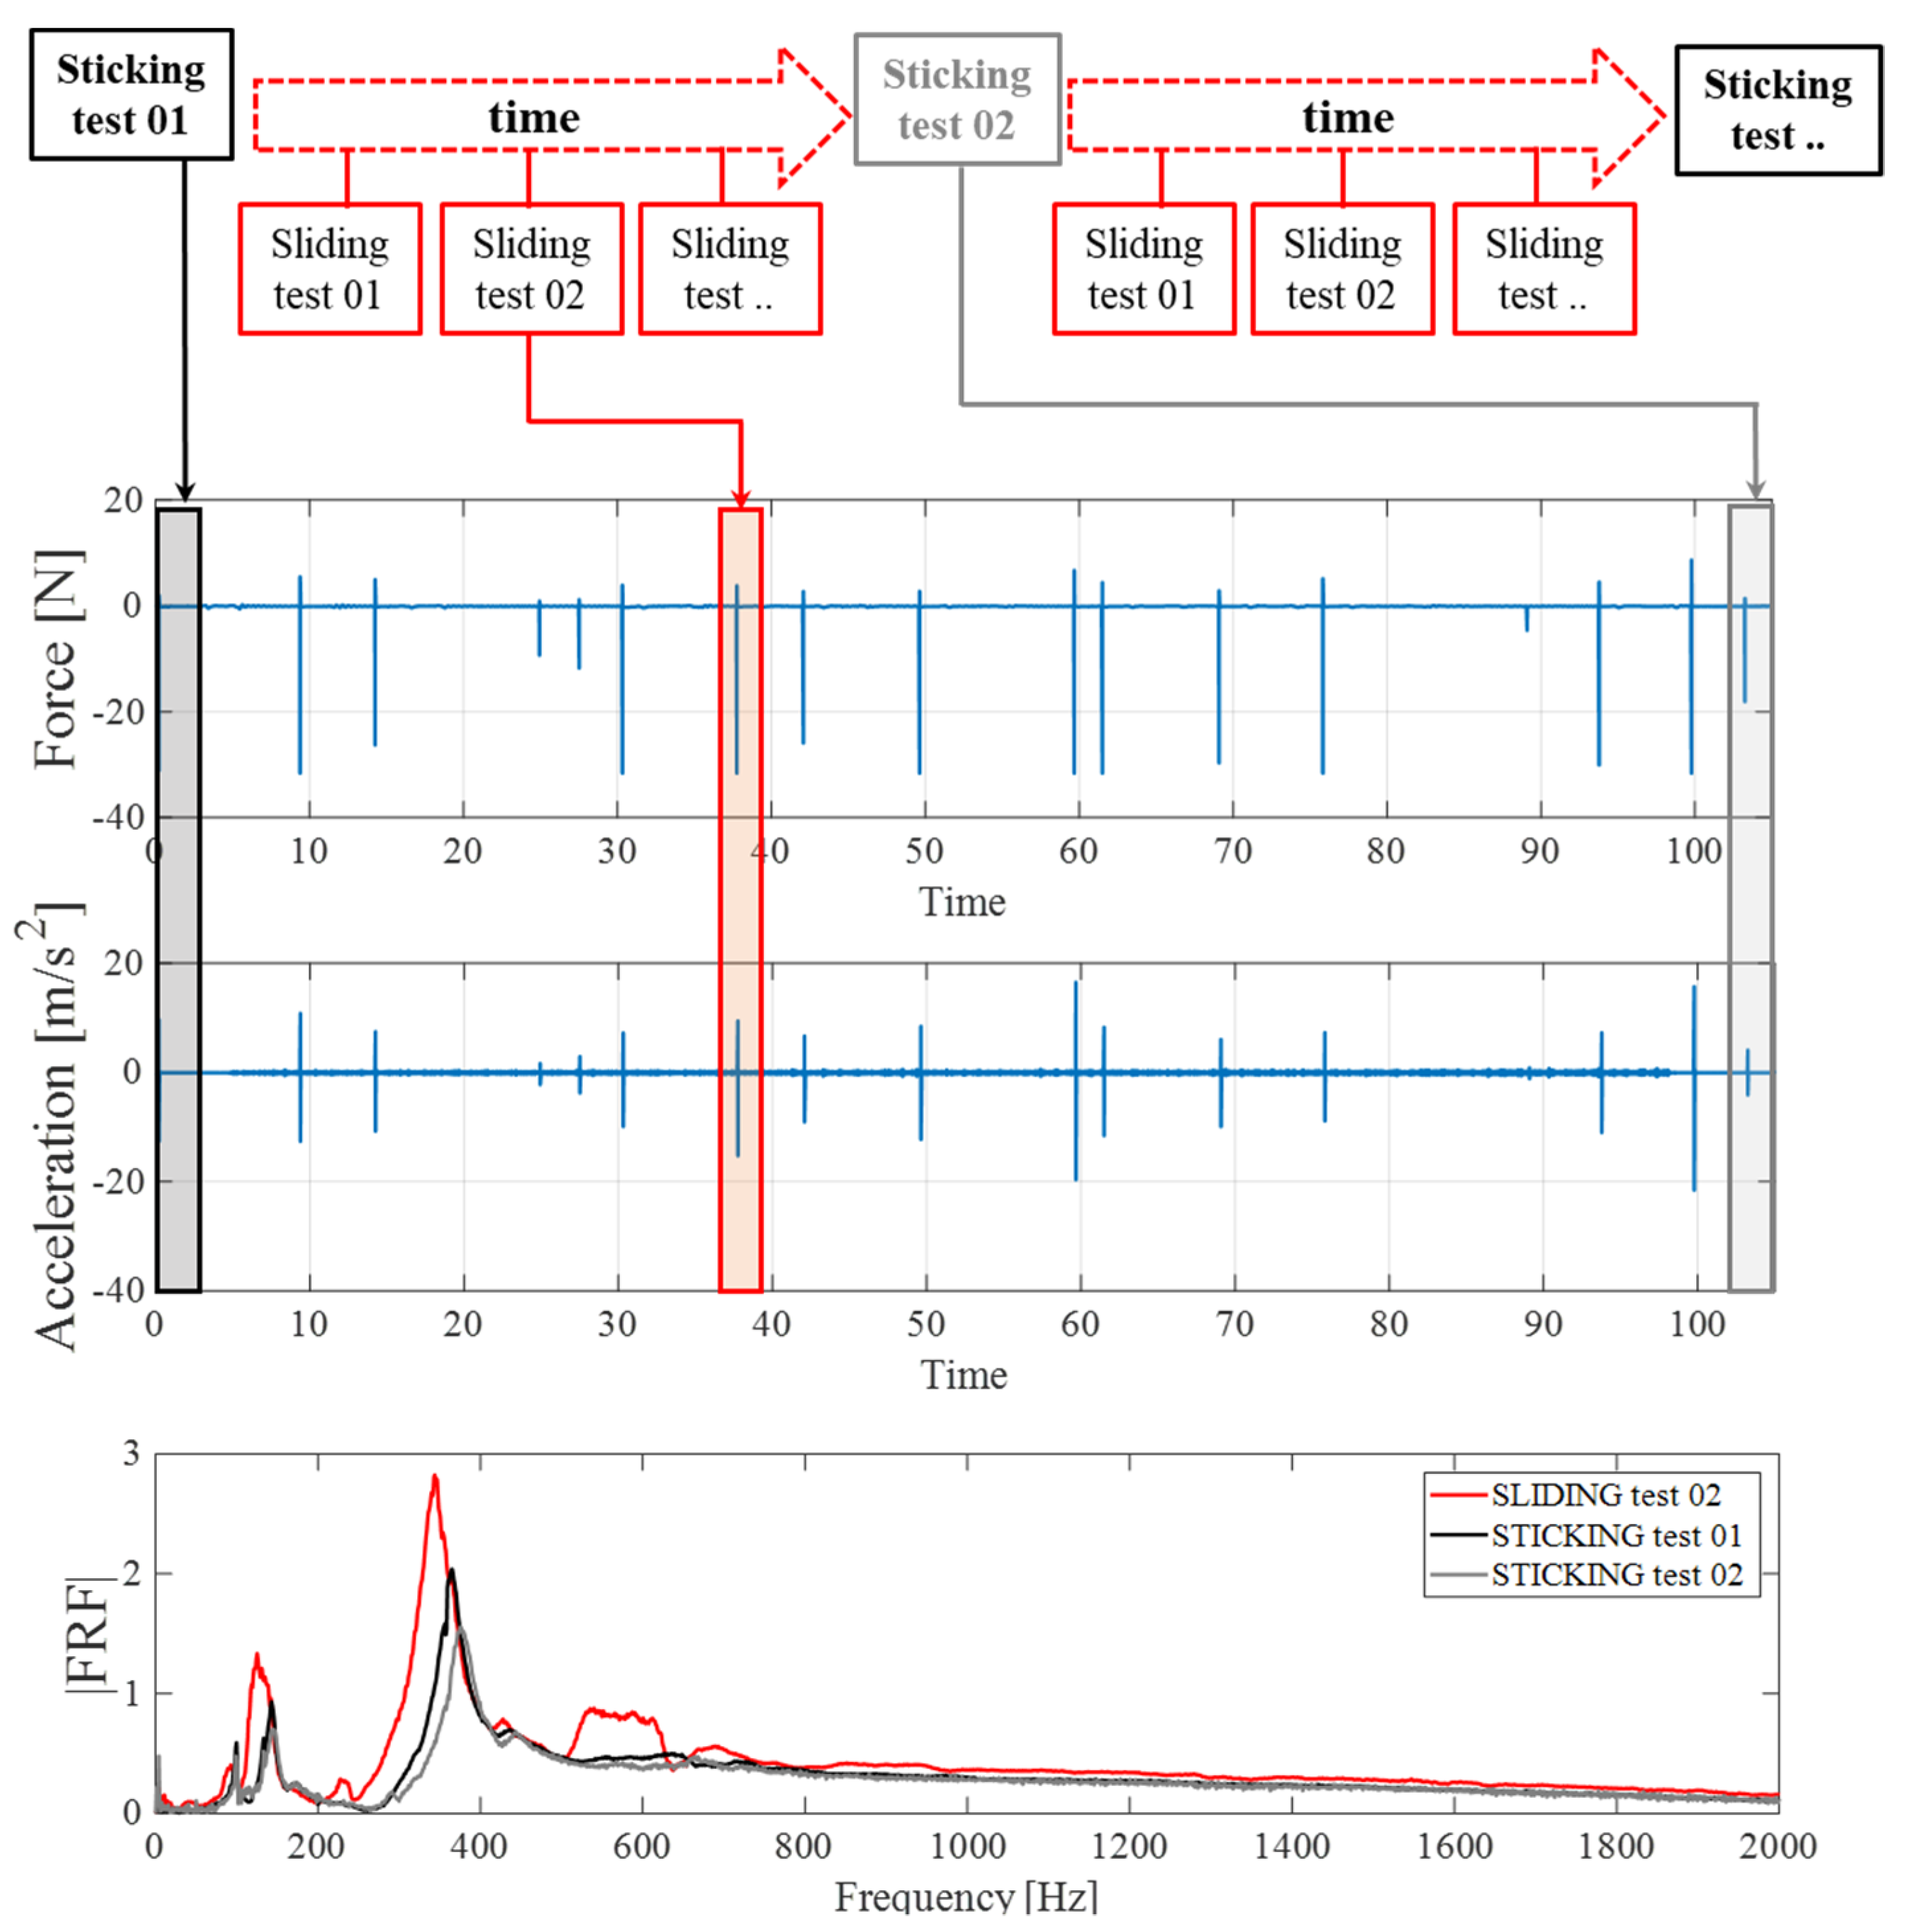
The results from a test, performed with a PMMA material sample with length L = 10 mm, an imposed average contact pressure of 0.35 MPa, and a surface roughness Ra = 6 µm, is shown in Figure 9. The figure reports the signal of the force due to the hammer excitation, the time acceleration response, and the spectra computed at different phases of the test.
The black curve was the response spectrum related to the first impulsive excitation of the system for a sticking condition measurement (no rotation imposed to the disc). On the other hand, the red curve was the spectrum of the system response for an impulsive excitation given during the rotation of the disc, i.e., in the sliding condition, at about 38 s after the beginning of the test. The comparison of the two spectrum curves highlighted a slight decrease in the investigated mode frequency and, therefore, a decrease in the related contact stiffness, in the sliding condition. Moreover, the response spectrum computed at t = 103 s (grey curve in Figure 9), when the disc was stopped, highlighted a slight increase in the investigated system frequency, resulting in a moderate increase in the contact stiffness, with respect to the one measured at the beginning of the test. Such a behavior could be associated to the variation of the topography of the contact interface, in term of roughness and a third-body layer, which could have produced an evolution in stiffness throughout the entire test, both in the sticking and sliding conditions. In order to estimate the contact stiffness during the sliding condition tests, when considering the numerical model presented in Section 2.4, the contact stiffness of the surface in relative motion was varied to meet the recovered experimental frequencies. On the other hand, the contact stiffness of the fixed surface (contact between sample and guide bar) was set to the value estimated previously in the static condition.
Figure 10 shows the evolution of the contact stiffness (between sample and disc), as a function of the sliding distance, both in the sticking and sliding conditions, for a PMMA sample with H = 10 mm, Ra = 1 µm, and a contact pressure of P = 0.35 MPa. During the whole test, the results highlighted as the contact stiffness estimated in the sliding condition (orange curve in Figure 10) were always found to be lower than the one in the sticking condition (blue curve in Figure 10). This difference could be attributed to the lower local stiffness at the interface between the two materials when the asperities were not in the static adhesion, but rather slid on each other, bringing to a softening of the interface.
Moreover, in both cases, the contact stiffness did not show a constant and stable behavior during the entire sliding test and its evolution was characterized by slow oscillations. This variation of the contact stiffness was a consequence of the evolution and rheology of the contact interface (see images in Figure 10). In fact, the continuous evolution of the surface topography and the third-body flows could bring to the accumulation and expulsion of third-body particles, which consequently affected the macroscopic stiffness of the interface. The effect of the third body on the contact stiffness was initially investigated in [43] and it was found that wear debris could significantly decrease the contact stiffness.
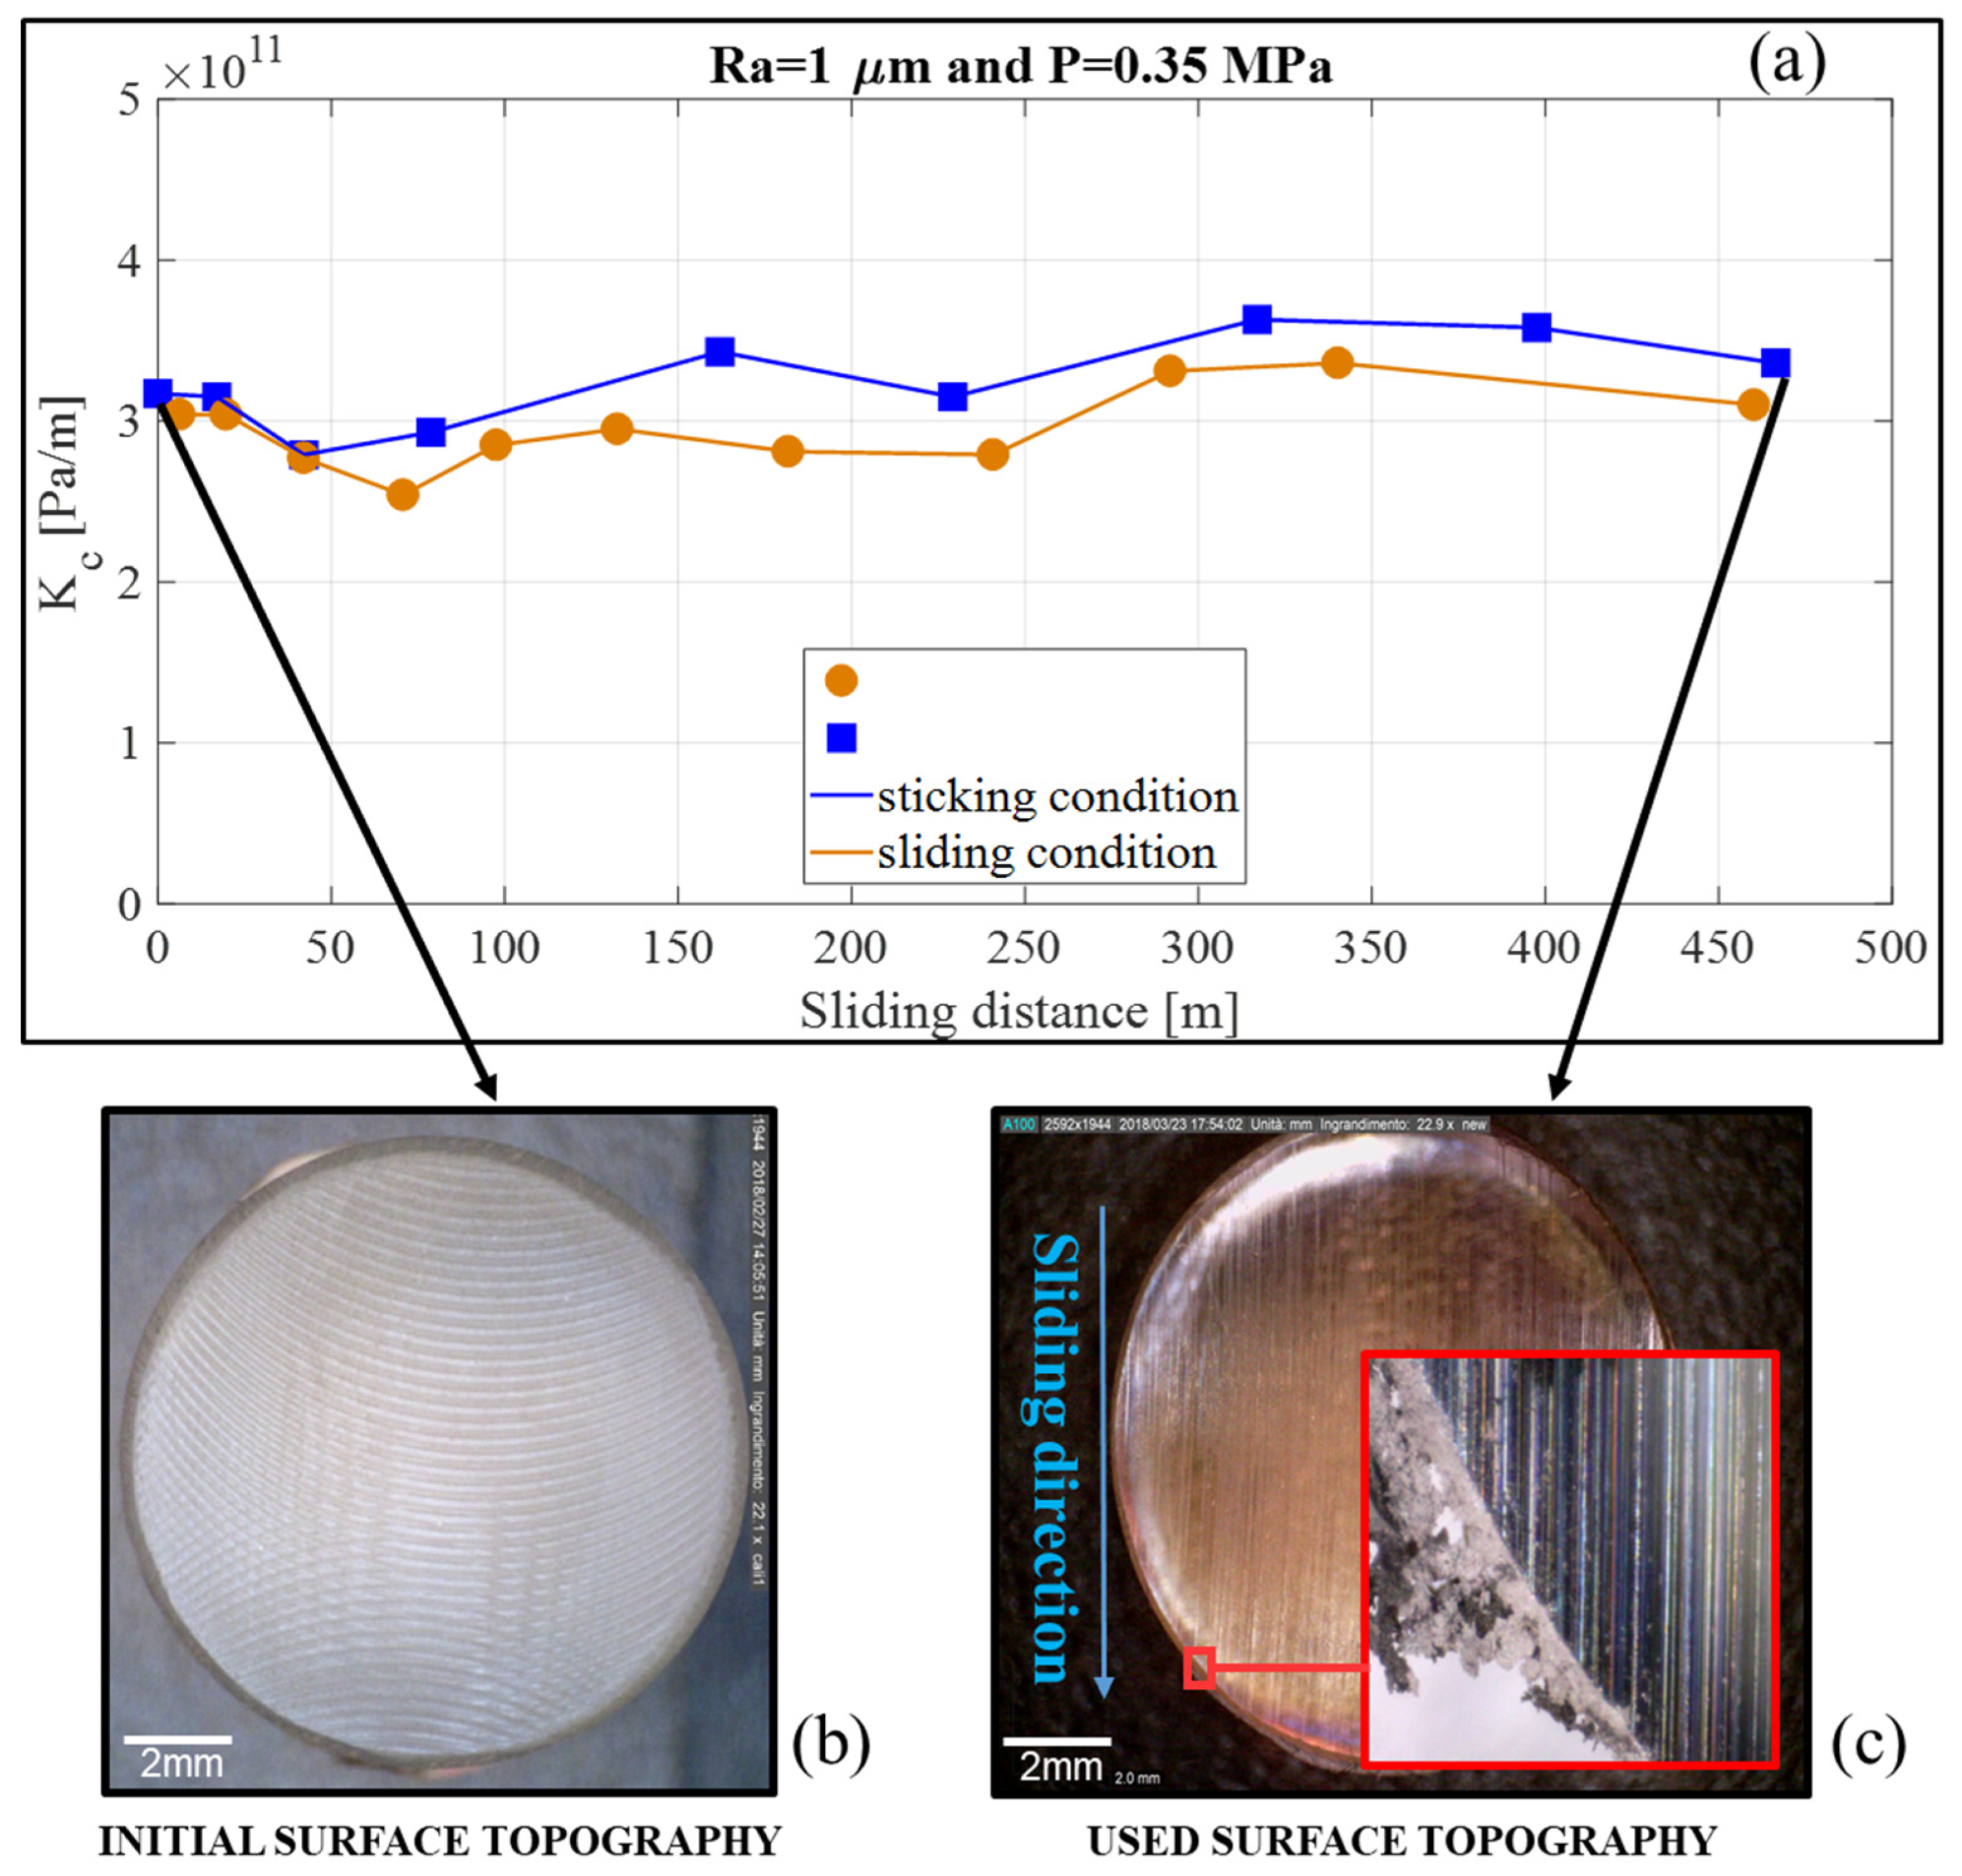
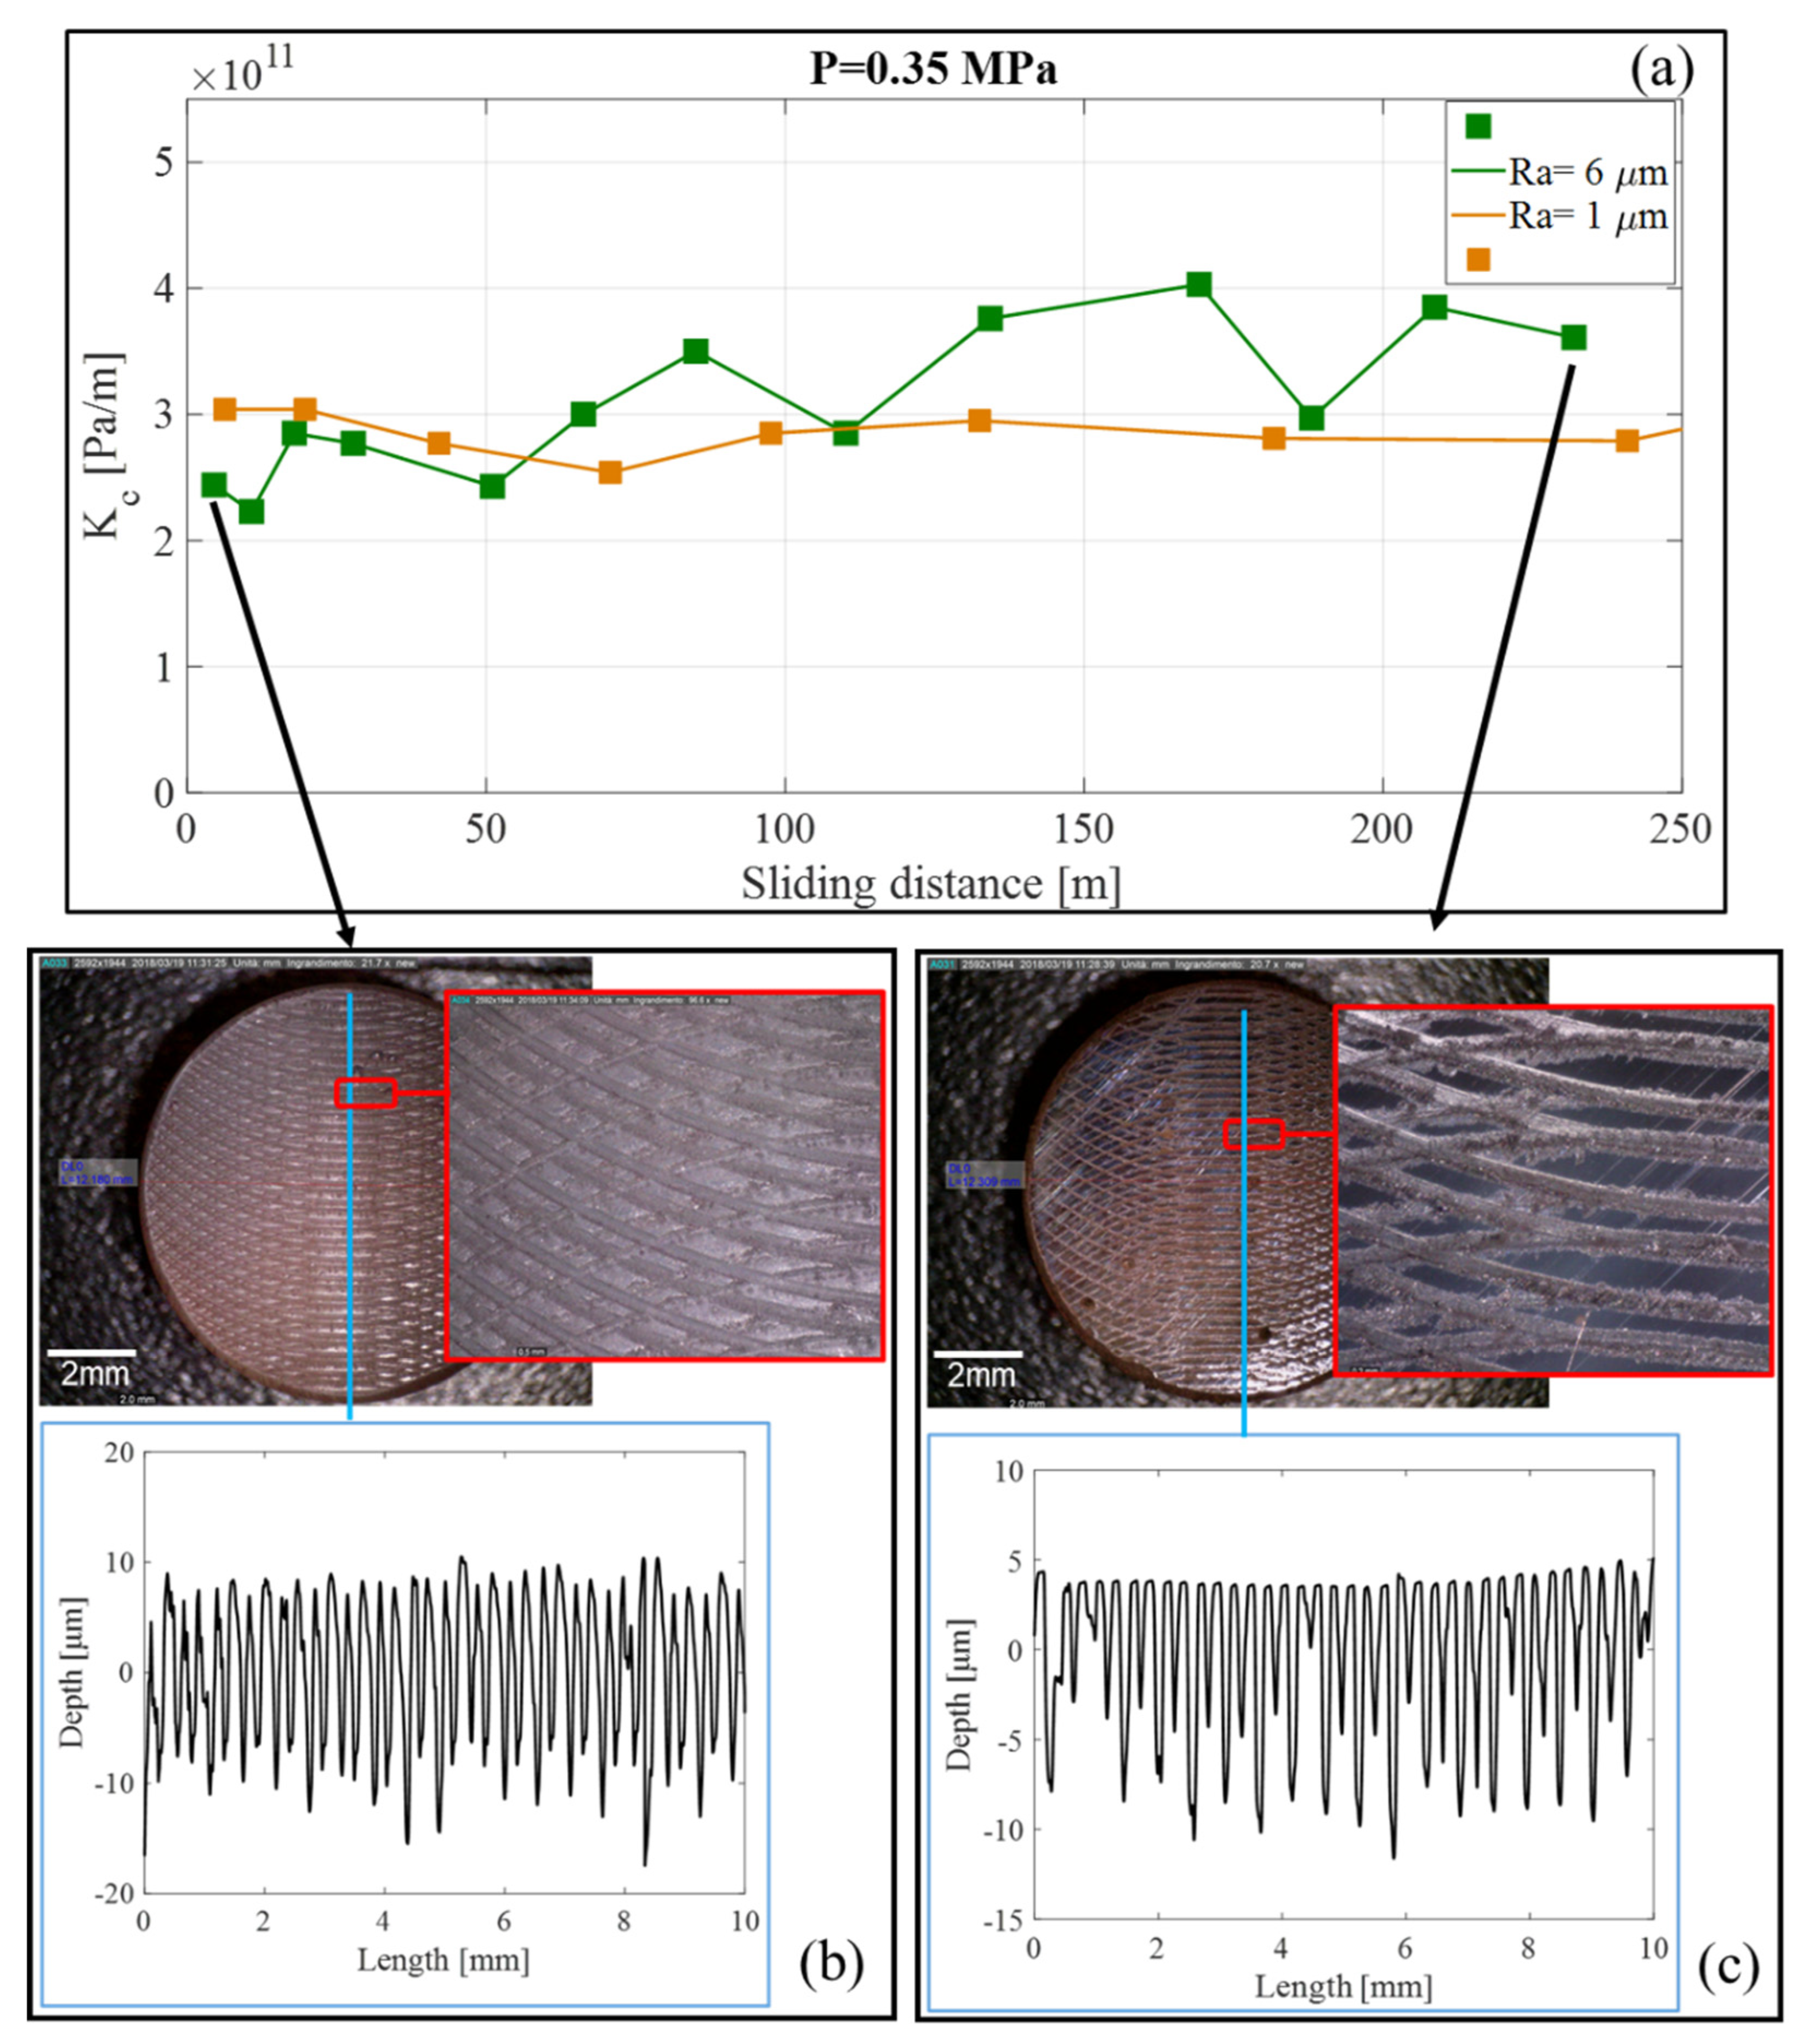
Figure 11a shows a comparison of the contact stiffness evolution in the sliding conditions for two values of the initial roughness, Ra = 6 µm and Ra = 1 µm, for a sample of H = 10 mm and an average contact pressure of P = 0.35 MPa. The results confirmed the trend of the contact stiffness recovered in the sliding condition, for both roughness values. It could be noted that, while the contact stiffness for Ra = 6 µm was lower at the beginning of the sliding, it became larger than that of the surface with Ra = 1 µm, after a run-in of the surfaces. In fact, at the beginning of the test, the lower stiffness was obviously a consequence of the higher roughness; afterwards, the smoothening of the asperities and filling of the roughness by the third-body (Figure 11c), made the interface more compact, bringing to a higher contact stiffness.
This conclusion was supported by the comparison between Figure 11b and Figure 11c, which showed a smoother profile with the accumulation of third body, within the roughness grooves, for the surface sample at the end of the test. On the contrary, the lower roughness of the sample with Ra = 1 µm, did not allow for a consistent accumulation of the third body, which was mainly expulsed at the border of the contact (Figure 10c).
5. Conclusions
In mechanical systems including contact interfaces, the interface parameters play a key role on the static and dynamic response of the system. Such parameters could deeply affect the local contact behavior and the global response of the system. To elaborate, in real frictional interfaces, the effective contact stiffness is a function of several operational parameters (roughness, contact pressure, third body rheology, surface topography) and it can affect both the local contact behavior (stress and strain at the contact interface) and the system global dynamics.
In this study, a newer approach that combines numerical and experimental analysis was developed, in order to estimate the contact stiffness, both in sticking and sliding conditions, accounting for the evolution of the contact surface (topography, third body, etc.). An experimental setup was developed to perform experimental campaigns dedicated at the contact stiffness estimation. On the other hand, a numerical finite element model, accounting for both the dynamics of the setup and the interface stiffness, was developed and then updated by preliminary dynamic tests.
The methodology for the estimation of more suitable values of the contact stiffness was validated here on the PMMA material samples. The quantitative estimation of contact stiffness, as a function of the average contact pressure and surface roughness was performed, showing how higher contact pressure and finer surface roughness led to an increase in the interface stiffness.
The retrieved stiffness was found to be much lower than the one calculated as a default value, through the numerical commercial software, which did not account for the local topography and rheology of the contact. This overestimation of the numerical stiffness could lead to large errors in the respective numerical simulations, which could be reduced by the proposed identification of the effective stiffness.
For the same reason, contact stiffness in the sliding conditions was estimated to account for its reduction when the interfaces were in the sliding conditions. The effect of the contact interface evolution (profile evolution and third body flows) on the contact stiffness was highlighted for both the sticking and the sliding conditions for the two values of the initial roughness. The presented results were in good agreement with the results recovered by the analytical/numerical models presented in [43,46,47,48].
These results could provide significant improvement in the numerical modeling of frictional systems. In particular, finite element models, for both static and dynamic contact simulations, could be improved by introducing the effect of the interface stiffness, when performing analyses such as CEA and nonlinear transient analysis for brake squeal prediction.
Author Contributions
All authors conceived the experimental setup and the numerical model. All authors contributed to the interpretation of the results and provided critical feedback and helped shape the research, analysis and manuscript.
Conflicts of Interest
The authors declare no conflict of interest.
References
- Claeys, M.; Sinou, J.-J.; Lambelin, J.P.; Todeschini, R. Experiments and numerical simulations of nonlinear vibration responses of an assembly with friction joints-Application on a test structure named "harmony". Mech. Syst. Signal Process. 2016, 70–71, 1097–1116. [Google Scholar] [CrossRef]
- Gaul, L.; Nitsche, R. The Role of Friction in Mechanical Joints. Appl. Mech. Rev. 2001, 54, 93–106. [Google Scholar] [CrossRef]
- Ouenzerfi, G.; Massi, F.; Renault, E.; Berthier, Y. Squeaking friction phenomena in ceramic hip endoprosthesis: Modeling and experimental validation. Mech. Syst. Signal Process. 2015. 58, 87–100. [CrossRef]
- Tonazzi, D.; Komba, E.H.; Massi, F.; Jeune, G.L.; Coudert, J.B.; Maheo, Y.; Berthier, Y. Numerical analysis of contact stress and strain distributions for greased and ungreased high loaded oscillating bearings. Wear 2017, 376–377, 1164–1175. [Google Scholar] [CrossRef]
- Ghezzi, I.; Komba, E.W.H.; Tonazzi, D.; Bouscharain, N.; Le Jeune, G.; Coudert, J.B.; Massi, F. Damage evolution and contact surfaces analysis of high-loaded oscillating hybrid bearings. Wear 2018, 406–407, 1–12. [Google Scholar] [CrossRef]
- Brunetti, J.; Massi, F.; Berthier, Y. A new instability index for unstable mode selection in squeal prediction by complex eigenvalue analysis. J. Sound Vib. 2016. 377, 106–122. [CrossRef]
- Tonazzi, D.; Massi, F.; Baillet, L.; Culla, A.; Fregolent, A.; Regis, E.; Lambert, M. Experimental and numerical characterization of system response under dry frictional contact. In Proceedings of the ISMA-International Conference on Noise and Vibration Engineering, Leuven, Belgium, 15–17 September 2014. [Google Scholar]
- Di Bartolomeo, M.; Morelli, F.; Tonazzi, D.; Massi, F.; Berthier, Y. Investigation of the role of contact-induced vibrations in tactile discrimination of textures. Mech. Ind. 2017, 18, 404. [Google Scholar] [CrossRef]
- Brunetti, J.; Massi, F.; D’Ambrogio, W.; Baillet, L. Steady state of modal coupling instabilities as a dynamic energy equilibrium. In Proceedings of the ISMA 2014 International Conference on Noise and Vibration Engineering-USD 2014 International Conference on Uncertainty in Structural Dynamics, Leuven, Belgium, 15–17 September 2014. [Google Scholar]
- Di Bartolomeo, M.; Morelli, F.; Tonazzi, D.; Massi, F.; Berthier, Y. On the role of friction induced vibrations in tactile perception. In Proceedings of the ISMA 2016 International Conference on Noise and Vibration Engineering-USD 2016 International Conference on Uncertainty in Structural Dynamics, Leuven, Belgium, 19–21 September 2016. [Google Scholar]
- Fagiani, R.; Massi, F.; Chatelet, E.; Berthier, Y.; Sestieri, A. Experimental analysis of friction-induced vibrations at the finger contact surface. Proc. Inst. Mech. Eng. J 2010, 224, 1027–1035. [Google Scholar] [CrossRef]
- Lee, S.; Jang, H. Effect of plateau distribution on friction instability of brake friction materials. Wear 2018, 400–401, 1–9. [Google Scholar] [CrossRef]
- Tonazzi, D.; Massi, F.; Baillet, L.; Culla, A.; Di Bartolomeo, M.; Berthier, Y. Experimental and numerical analysis of frictional contact scenarios: from macro stick–slip to continuous sliding. Meccanica 2015, 50, 649–664. [Google Scholar] [CrossRef]
- Lazzari, A.; Tonazzi, D.; Conidi, G.; Malmassari, C.; Cerutti, A.; Massi, F. Experimental evaluation of brake pad material propensity to stick-slip and groan noise emission. Lubricants 2018, 6, 107. [Google Scholar] [CrossRef]
- Tonazzi, D.; Massi, F.; Culla, A.; Fregolent, A.; Berthier, Y. Role of damping on contact instability scenarios. In Proceedings of the 5th World Tribology Congress, WTC 2013, Torino, Italy, 8–13 September 2013. [Google Scholar]
- Renouf, M.; Massi, F.; Fillot, N.; Saulot, A. Numerical tribology of a dry contact. Tribol. Int. 2011, 44, 834–844. [Google Scholar] [CrossRef] [Green Version]
- Wang, D.W.; Mo, J.L.; Ouyang, H.; Zhou, Z.R. Improving dynamic and tribological behaviours by means of a Mn–Cu damping alloy with grooved surface features. Tribol. Lett. 2018, 66, 1–16. [Google Scholar] [CrossRef]
- Li, Z.; Wang, X.; Zhang, Q.; Guan, Z.; Mo, J.; Ouyang, H. Model reduction for friction-induced vibration of multi-degree-of-freedom systems and experimental validation. Int. J. Mech. Sci. 2018, 145, 106–119. [Google Scholar] [CrossRef]
- Brunetti, J.; Massi, F.; D’Ambrogio, W.; Berthier, Y. Dynamic and energy analysis of frictional contact instabilities on a lumped system. Meccanica 2014, 50, 633–647. [Google Scholar] [CrossRef]
- Besset, S.; Sinou, J.J. Modal reduction of brake squeal systems using complex interface modes. Mech. Sys. Signal Process. 2017, 85, 896–911. [Google Scholar] [CrossRef]
- Sinou, J.J. Transient non-linear dynamic analysis of automotive disc brake squeal-On the need to consider both stability and non-linear analysis. Mech. Res. Commun. 2010, 37, 96–105. [Google Scholar] [CrossRef]
- Ouyang, H.; Nack, W.; Yuan, Y.; Chen, F. Numerical analysis of automotive disc brake squeal: a review. Int. J. Veh. Noise Vib. 2005, 1, 207–231. [Google Scholar] [CrossRef]
- Lazzari, A.; Tonazzi, D.; Massi, F. Squeal propensity characterization of brake lining materials through friction noise measurements. Mech. Sys. Signal Process. 2019, 128, 216–228. [Google Scholar] [CrossRef]
- Bettella, M.; Harrison, M.F.; Sharp, R.S. Investigation of automotive creep groan noise with a distributed-source excitation technique. J. Sound and Vib. 2002, 255, 531–547. [Google Scholar] [CrossRef]
- Nielsen, S.; Taddeucci, J.; Vinciguerra, S. Experimental observation of stick-slip instability fronts. Geophys. J. Int. 2010, 180, 697–702. [Google Scholar] [CrossRef] [Green Version]
- Tonazzi, D.; Massi, F.; Baillet, L.; Brunetti, J.; Berthier, Y. Interaction between contact behaviour and vibrational response for dry contact system. Mech. Sys. Signal Process. 2018, 110, 110–121. [Google Scholar] [CrossRef]
- Gräbner, N.; Tiedemann, M.; Von Wagner, U.; Hoffmann, N. Nonlinearities in Friction Brake NVH-Experimental and Numerical Studies. SAE Tech. Pap. 2014. No. 2014-01-2511. [Google Scholar]
- Papangelo, A.; Ciavarella, M.; Hoffmann, N. Subcritical bifurcation in a self-excited single-degree-of-freedom system with velocity weakening-strengthening friction law: analytical results and comparison with experiments. Nonlinear Dyn. 2017, 90, 2037–2046. [Google Scholar] [CrossRef]
- Lee, S.M.; Shin, M.W.; Lee, W.K.; Jang, H. The correlation between contact stiffness and stick–slip of brake friction materials. Wear 2013, 302, 1414–1420. [Google Scholar] [CrossRef]
- Greenwood, J.A.; Williamson, J.P. Contact of nominally flat surfaces. Proc. R. Soc London. Series A. Math. Phys. Sci. 1966, 295, 300–319. [Google Scholar]
- Barber, J.R.; Davies, M.; Hills, D.A. Frictional elastic contact with periodic loading. Inter. J. Solids Struct. 2011, 48, 2041–2047. [Google Scholar] [CrossRef]
- Borri-Brunetto, M.; Chiaia, B.; Ciavarella, M. Incipient sliding of rough surfaces in contact: a multiscale numerical analysis. Comput. Methods in Appl. Mech. Eng. 2001, 190, 6053–6073. [Google Scholar] [CrossRef] [Green Version]
- Borri-Brunetto, M.; Carpinteri, A.; Invernizzi, S.; Paggi, M. Micro-slip of rough surfaces under cyclic tangential loading, in Analysis and Simulation of Contact Problems. In Lecture Notes in Applied and Computational Mechanics; Wriggers, P., Nackenhorst, U., Eds.; Springer: Heidelberg, Berlin, 2006; Volume 27, pp. 333–340. [Google Scholar]
- Paggi, M.; Pohrt, R.; Popov, V.L. Partial-slip frictional response of rough surfaces. Sci. Rep. 2014, 4, 5178. [Google Scholar] [Green Version]
- Raffa, M.L.; Lebon, F.; Vairo, G. Normal and tangential stiffnesses of rough surfaces in contact via an imperfect interface model. Int. J. Solids Struct. 2016, 87, 245–253. [Google Scholar]
- Jackson, R.L.; Green, I. A statistical model of elasto-plastic asperity contact between rough surfaces. Tribol. Int. 2006, 39, 906–914. [Google Scholar] [CrossRef]
- Kogut, L.; Jackson, R.L. A Comparison of Contact Modeling Utilizing Statistical and Fractal Approaches. J. Tribol. 2005, 128, 213–217. [Google Scholar] [CrossRef]
- Dwyer-Joyce, R.S.; Drinkwater, B.W.; Quinn, A.M. The use of ultrasound in the investigation of rough surface interfaces. J. Tribol. 2000, 123, 8–16. [Google Scholar] [CrossRef]
- Syed Asif, S.A.; Wahl, K.J.; Colton, R.J.; Warren, O.L. Quantitative imaging of nanoscale mechanical properties using hybrid nanoindentation and force modulation. J. Appl. Phys. 2001, 90, 1192–1200. [Google Scholar] [CrossRef]
- Hess, D.P.; Wagh, N.J. Evaluating surface roughness from contact vibrations. J. Tribol. 1995, 117, 60–64. [Google Scholar] [CrossRef]
- Gonzalez-Valadez, M.; Baltazar, A.; Dwyer-Joyce, R.S. Study of interfacial stiffness ratio of a rough surface in contact using a spring model. Wear 2010, 268, 373–379. [Google Scholar] [CrossRef] [Green Version]
- Polycarpou, A.A.; Soom, A. Boundary and Mixed Friction in the Presence of Dynamic Normal Loads: Part I—System Model. J. Tribol. 1995, 117, 255–260. [Google Scholar] [CrossRef]
- Shi, X.; Polycarpou, A.A. Measurement and Modeling of Normal Contact Stiffness and Contact Damping at the Meso Scale. J. Vib. Acoust. 2005, 127, 52–60. [Google Scholar] [CrossRef]
- Mulvihill, D.M.; Brunskill, H.; Kartal, M.E.; Dwyer-Joyce, R.S.; Nowell, D.A. Comparison of contact stiffness measurements obtained by the digital image correlation and ultrasound techniques. Exp. Mech. 2013, 53, 1245–1263. [Google Scholar] [CrossRef]
- Du, F.; Hong, J.; Xu, Y. An acoustic model for stiffness measurement of tribological interface using ultrasound. Tribol. Int. 2014, 73, 70–77. [Google Scholar] [CrossRef]
- Zahouani, H.; Mezghani, S.; Pailler-Mattei, C.; Elmansori, M. Effect of roughness scale on contact stiffness between solids. Wear 2009, 266, 589–591. [Google Scholar] [CrossRef]
- Paggi, M.; Barber, J.R. Contact conductance of rough surfaces composed of modified RMD patches. Int. J. Heat Mass Transf. 2011, 54, 4664–4672. [Google Scholar] [CrossRef] [Green Version]
- Pohrt, R.; Popov, V.L. Contact stiffness of randomly rough surfaces. Sci. Rep. 2013, 3, 3293. [Google Scholar] [CrossRef] [PubMed] [Green Version]
- Vakis, A.I.; Yastrebov, V.A.; Scheibert, J.; Nicola, L.; Dini, D.; Minfray, C.; Almqvist, A.; Paggi, M.; Lee, S.; Limbert, G. Modeling and simulation in tribology across scales: An overview. Tribol. Int. 2018, 125, 169–199. [Google Scholar] [CrossRef]
Figure 1.
Overview of the proposed approach for the estimation of the contact stiffness. The dynamic responses of the numerical model and the experimental system were compared to retrieve the stiffness contribution of the contact interface.
Figure 1.
Overview of the proposed approach for the estimation of the contact stiffness. The dynamic responses of the numerical model and the experimental system were compared to retrieve the stiffness contribution of the contact interface.

Figure 2.
Scheme (left) and photograph (right) of the developed setup for the contact stiffness experiments. Frequency Response Functions were measured to identify the natural frequencies of the system, which were directly affected by the contact stiffness.
Figure 2.
Scheme (left) and photograph (right) of the developed setup for the contact stiffness experiments. Frequency Response Functions were measured to identify the natural frequencies of the system, which were directly affected by the contact stiffness.

Figure 3.
Finite element model (left) of the developed experimental setup and zoomed-in view of the sample in contact (right). The contact stiffness parameter was introduced at the contact interfaces of the tested sample.
Figure 3.
Finite element model (left) of the developed experimental setup and zoomed-in view of the sample in contact (right). The contact stiffness parameter was introduced at the contact interfaces of the tested sample.

Figure 4.
Deformed shape of the investigated mode (490 Hz) for sample height H = 10 mm and for an average contact pressure P = 0.14 MPa. The mode corresponded to a mass-spring deformation, where the spring was the combination of the bulk stiffness of the sample in series, with the contact stiffness at the interfaces.

Figure 5.
(Top) Acceleration and force signals over time, due to the impact excitation for a single measurement. (Bottom) FRFs of the system for different lengths (10, 15, 20 mm) of the tested samples. Tests were performed with average contact pressure (ACP) of 0.25 MPa and surface roughness of Ra = 6 µm.

Figure 6.
Natural frequency of the investigated mode as a function of the average contact pressure for three different lengths of the sample and for Ra = 1 µm (lower) and Ra = 6 µm (upper).
Figure 6.
Natural frequency of the investigated mode as a function of the average contact pressure for three different lengths of the sample and for Ra = 1 µm (lower) and Ra = 6 µm (upper).

Figure 7.
Comparison between numerical and experimental results for surface roughness of Ra = 6 µm (upper) and Ra = 1 µm (lower)—average contact pressure of P = 0.14 MPa. Grey points in the plots represent the numerical results in terms of the natural frequency obtained with default contact stiffness of Kc = 6 × 10¹³ (Pa/m).

Figure 8.
Normal contact stiffness and respective error bars, as a function of the average contact pressure for surface roughness of Ra = 1 µm (red curve) and Ra = 6 µm (black curve) in the sticking condition.
Figure 8.
Normal contact stiffness and respective error bars, as a function of the average contact pressure for surface roughness of Ra = 1 µm (red curve) and Ra = 6 µm (black curve) in the sticking condition.

Figure 9.
From top to bottom—force signal and acceleration response; spectrum related to the sticking test 01 (black curve), sticking test 02 (grey curve), and sliding test at time t = 28 s (red curve). Sample length H = 10 mm, roughness parameter Ra = 6 µm, and imposed average contact pressure of P = 0.35 MPa. Hammer impacts and the corresponding FRFs were performed during the sliding evolution of the interface.

Figure 10.
(a) Evolution of the contact stiffness (disc/sample) for the sample with H = 10 mm, Ra = 1 µm, and average contact pressure of 0.35 MPa. Blue dots are associated to the contact stiffness values estimated in sticking condition while orange dots are associated to the contact stiffness values estimated in sliding condition; (b) Topography of the initial contact surface of the sample; (c) Topography of the contact surface of the sample at the end of the measurement campaign.

Figure 11.
(a) Evolution of the contact stiffness for the sample with H = 10 mm, average contact pressure of 0.35 MPa, and for both roughness values, Ra = 6 µm and Ra = 1 µm. Orange points are associated to the contact stiffness values estimated in the sliding condition for Ra = 1 µm. Green points are associated to the contact stiffness values estimated in the sliding condition for Ra = 6 µm; (b) Topography of the initial contact surface, with the associated profile, for Ra = 6 µm; (c) Topography of the contact surface, with the associated profile, at the end of the sliding test.

© 2019 by the authors. Licensee MDPI, Basel, Switzerland. This article is an open access article distributed under the terms and conditions of the Creative Commons Attribution (CC BY) license (http://creativecommons.org/licenses/by/4.0/).
Share and Cite
MDPI and ACS Style
Tonazzi, D.; Massi, F.; Salipante, M.; Baillet, L.; Berthier, Y. Estimation of the Normal Contact Stiffness for Frictional Interface in Sticking and Sliding Conditions. Lubricants 2019, 7, 56. https://doi.org/10.3390/lubricants7070056
AMA Style
Tonazzi D, Massi F, Salipante M, Baillet L, Berthier Y. Estimation of the Normal Contact Stiffness for Frictional Interface in Sticking and Sliding Conditions. Lubricants. 2019; 7(7):56. https://doi.org/10.3390/lubricants7070056
Chicago/Turabian StyleTonazzi, Davide, Francesco Massi, Mario Salipante, Laurent Baillet, and Yves Berthier. 2019. "Estimation of the Normal Contact Stiffness for Frictional Interface in Sticking and Sliding Conditions" Lubricants 7, no. 7: 56. https://doi.org/10.3390/lubricants7070056
Note that from the first issue of 2016, this journal uses article numbers instead of page numbers. See further details here.