
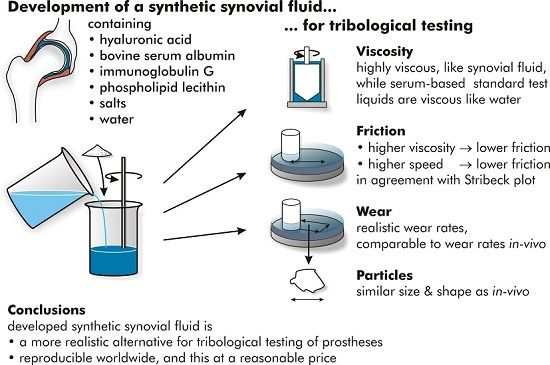
Development of a Synthetic Synovial Fluid for Tribological Testing


Abstract
:
1. Introduction
2. Materials and Methods
2.1. Test Liquids

| Test Liquid | Components (g/L) | ||||||
|---|---|---|---|---|---|---|---|
| HA | NCS | BSA | IgG | PL | Deionized | RS | |
| Hyaluronic Acid | Newborn Calf Serum | Bov. Serum Albumin | Immuno-Globulin G | Phospho-Lipid Lecithin | Water | Ringer Solution | |
| HiSi-mix | 30 | balance | |||||
| HA NCS | 3 | 30 | balance | ||||
| HA NCS RS | 3 | 30 | balance | ||||
| HA BSA RS | 3 | 30 | balance | ||||
| HA BSA/IgG RS | 3 | 19 | 11 | balance | |||
| HA BSA/IgG PL RS | 3 | 19 | 11 | 0.1 | balance | ||
2.2. Viscosity Measurements
2.3. Tribological Testing
2.4. Friction Measurements
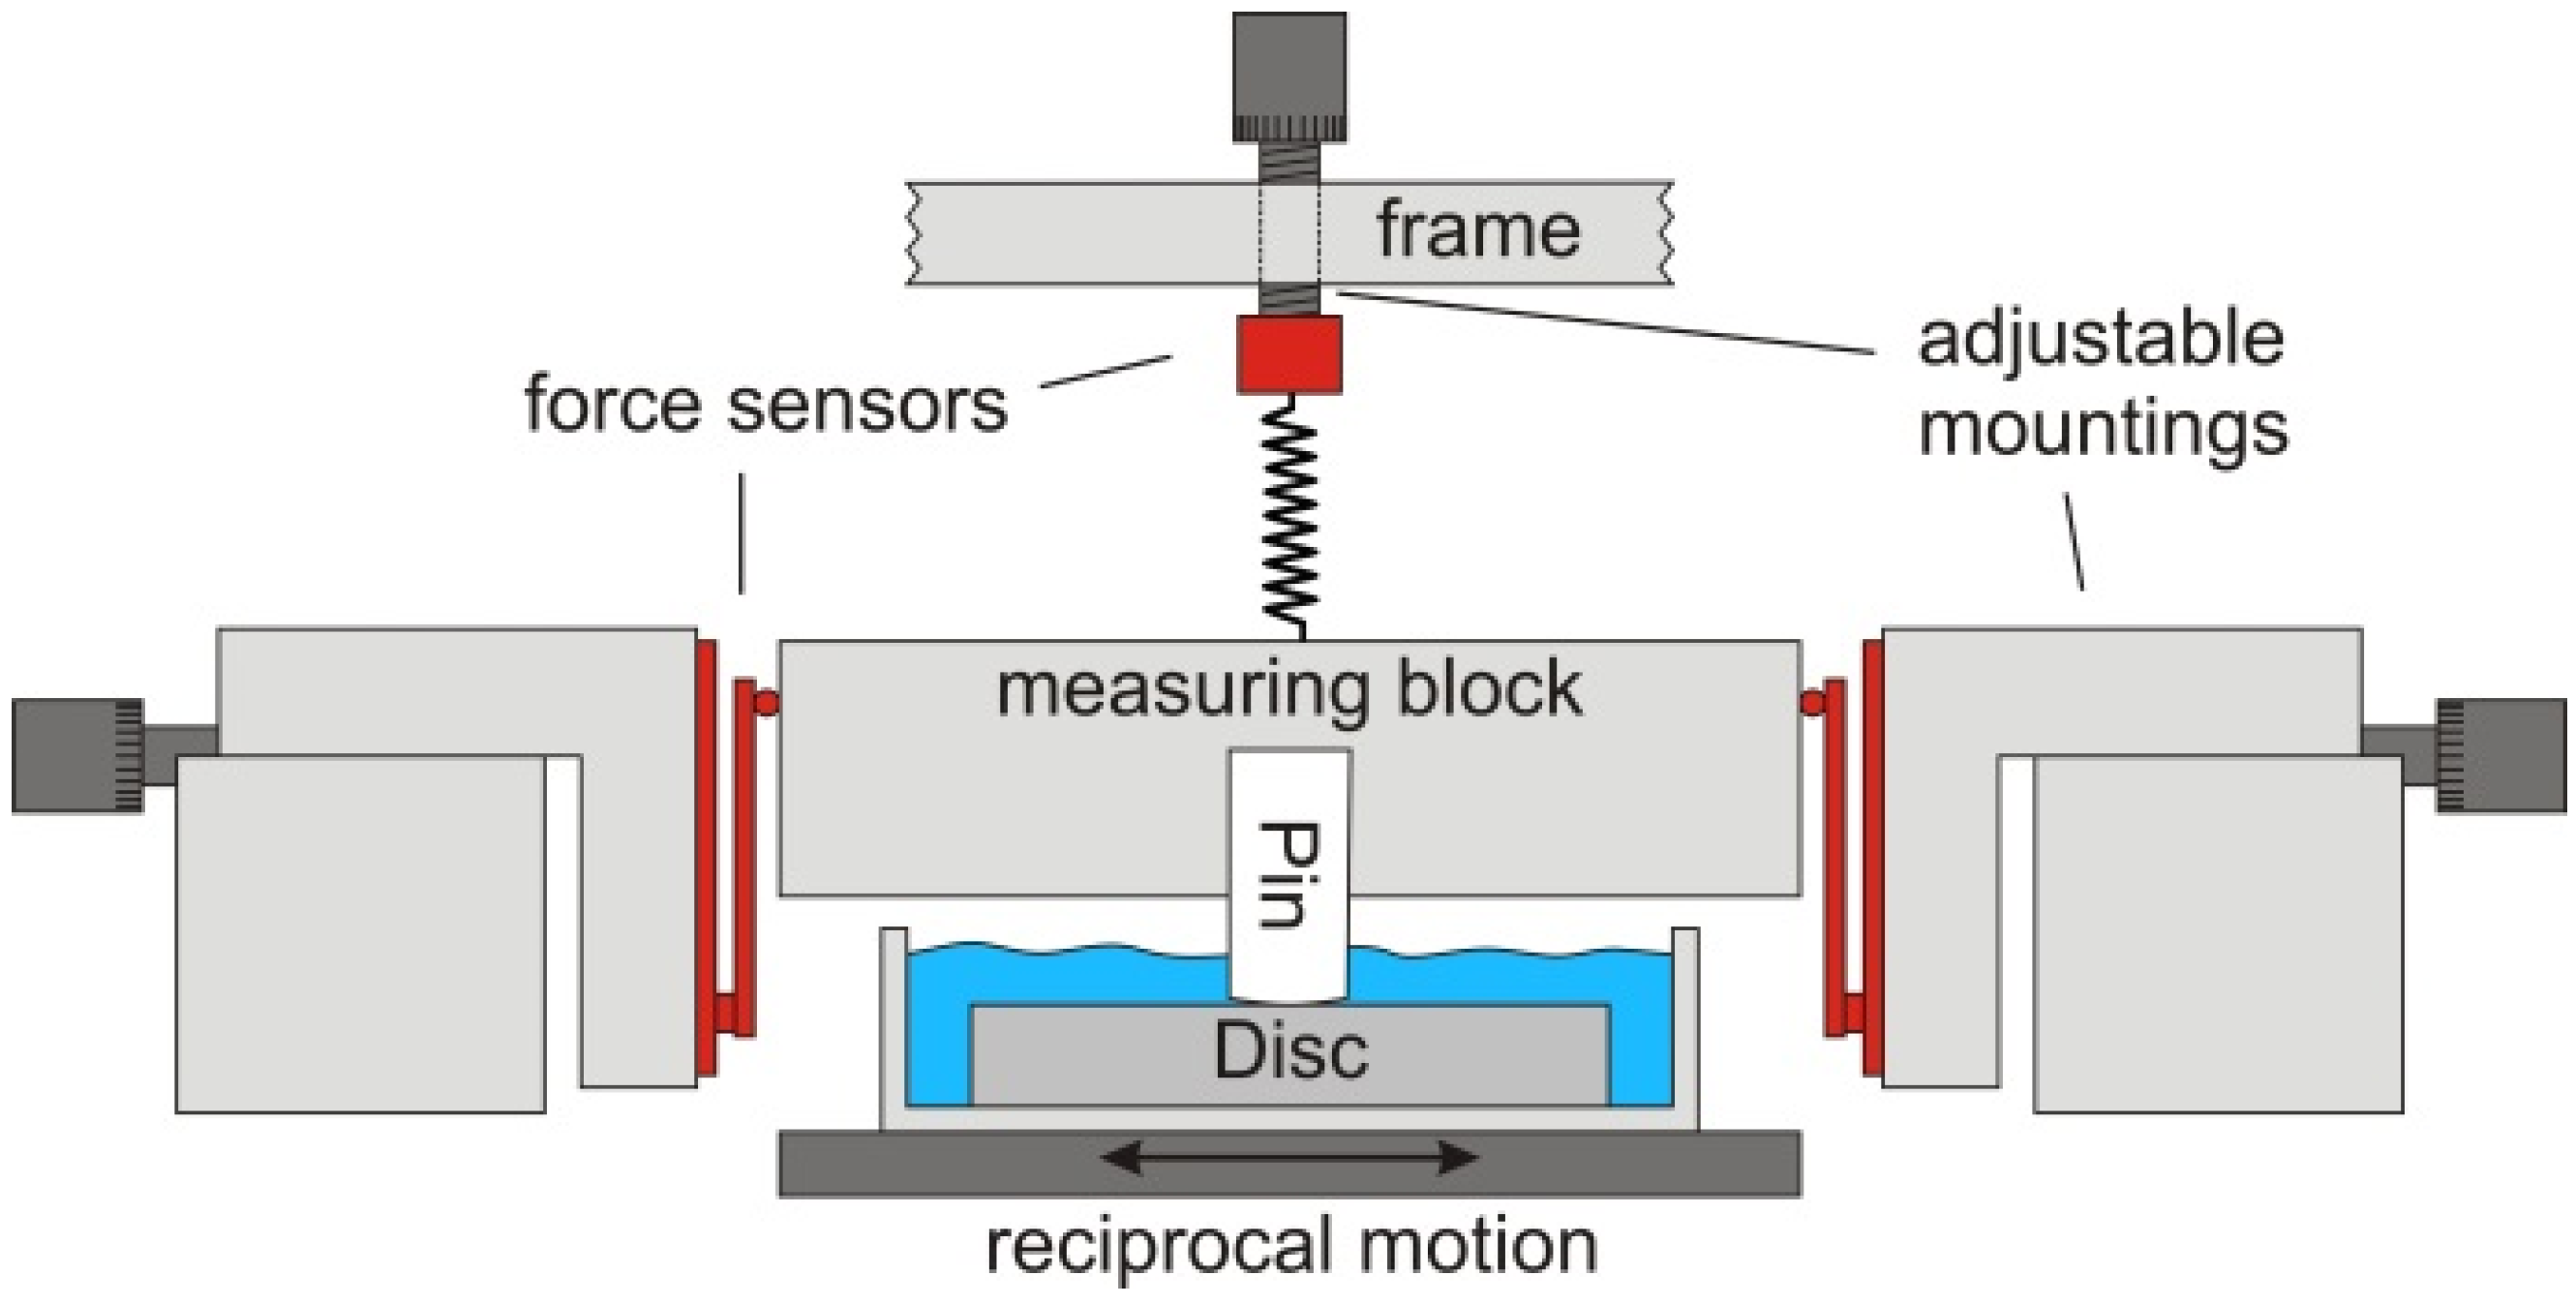
2.5. Wear Tests
2.6. Sample Characterisation
2.6.1. Proteins
2.6.2. Surface Characterisation
2.6.3. Particle Analysis
2.7. Statistics
3. Results
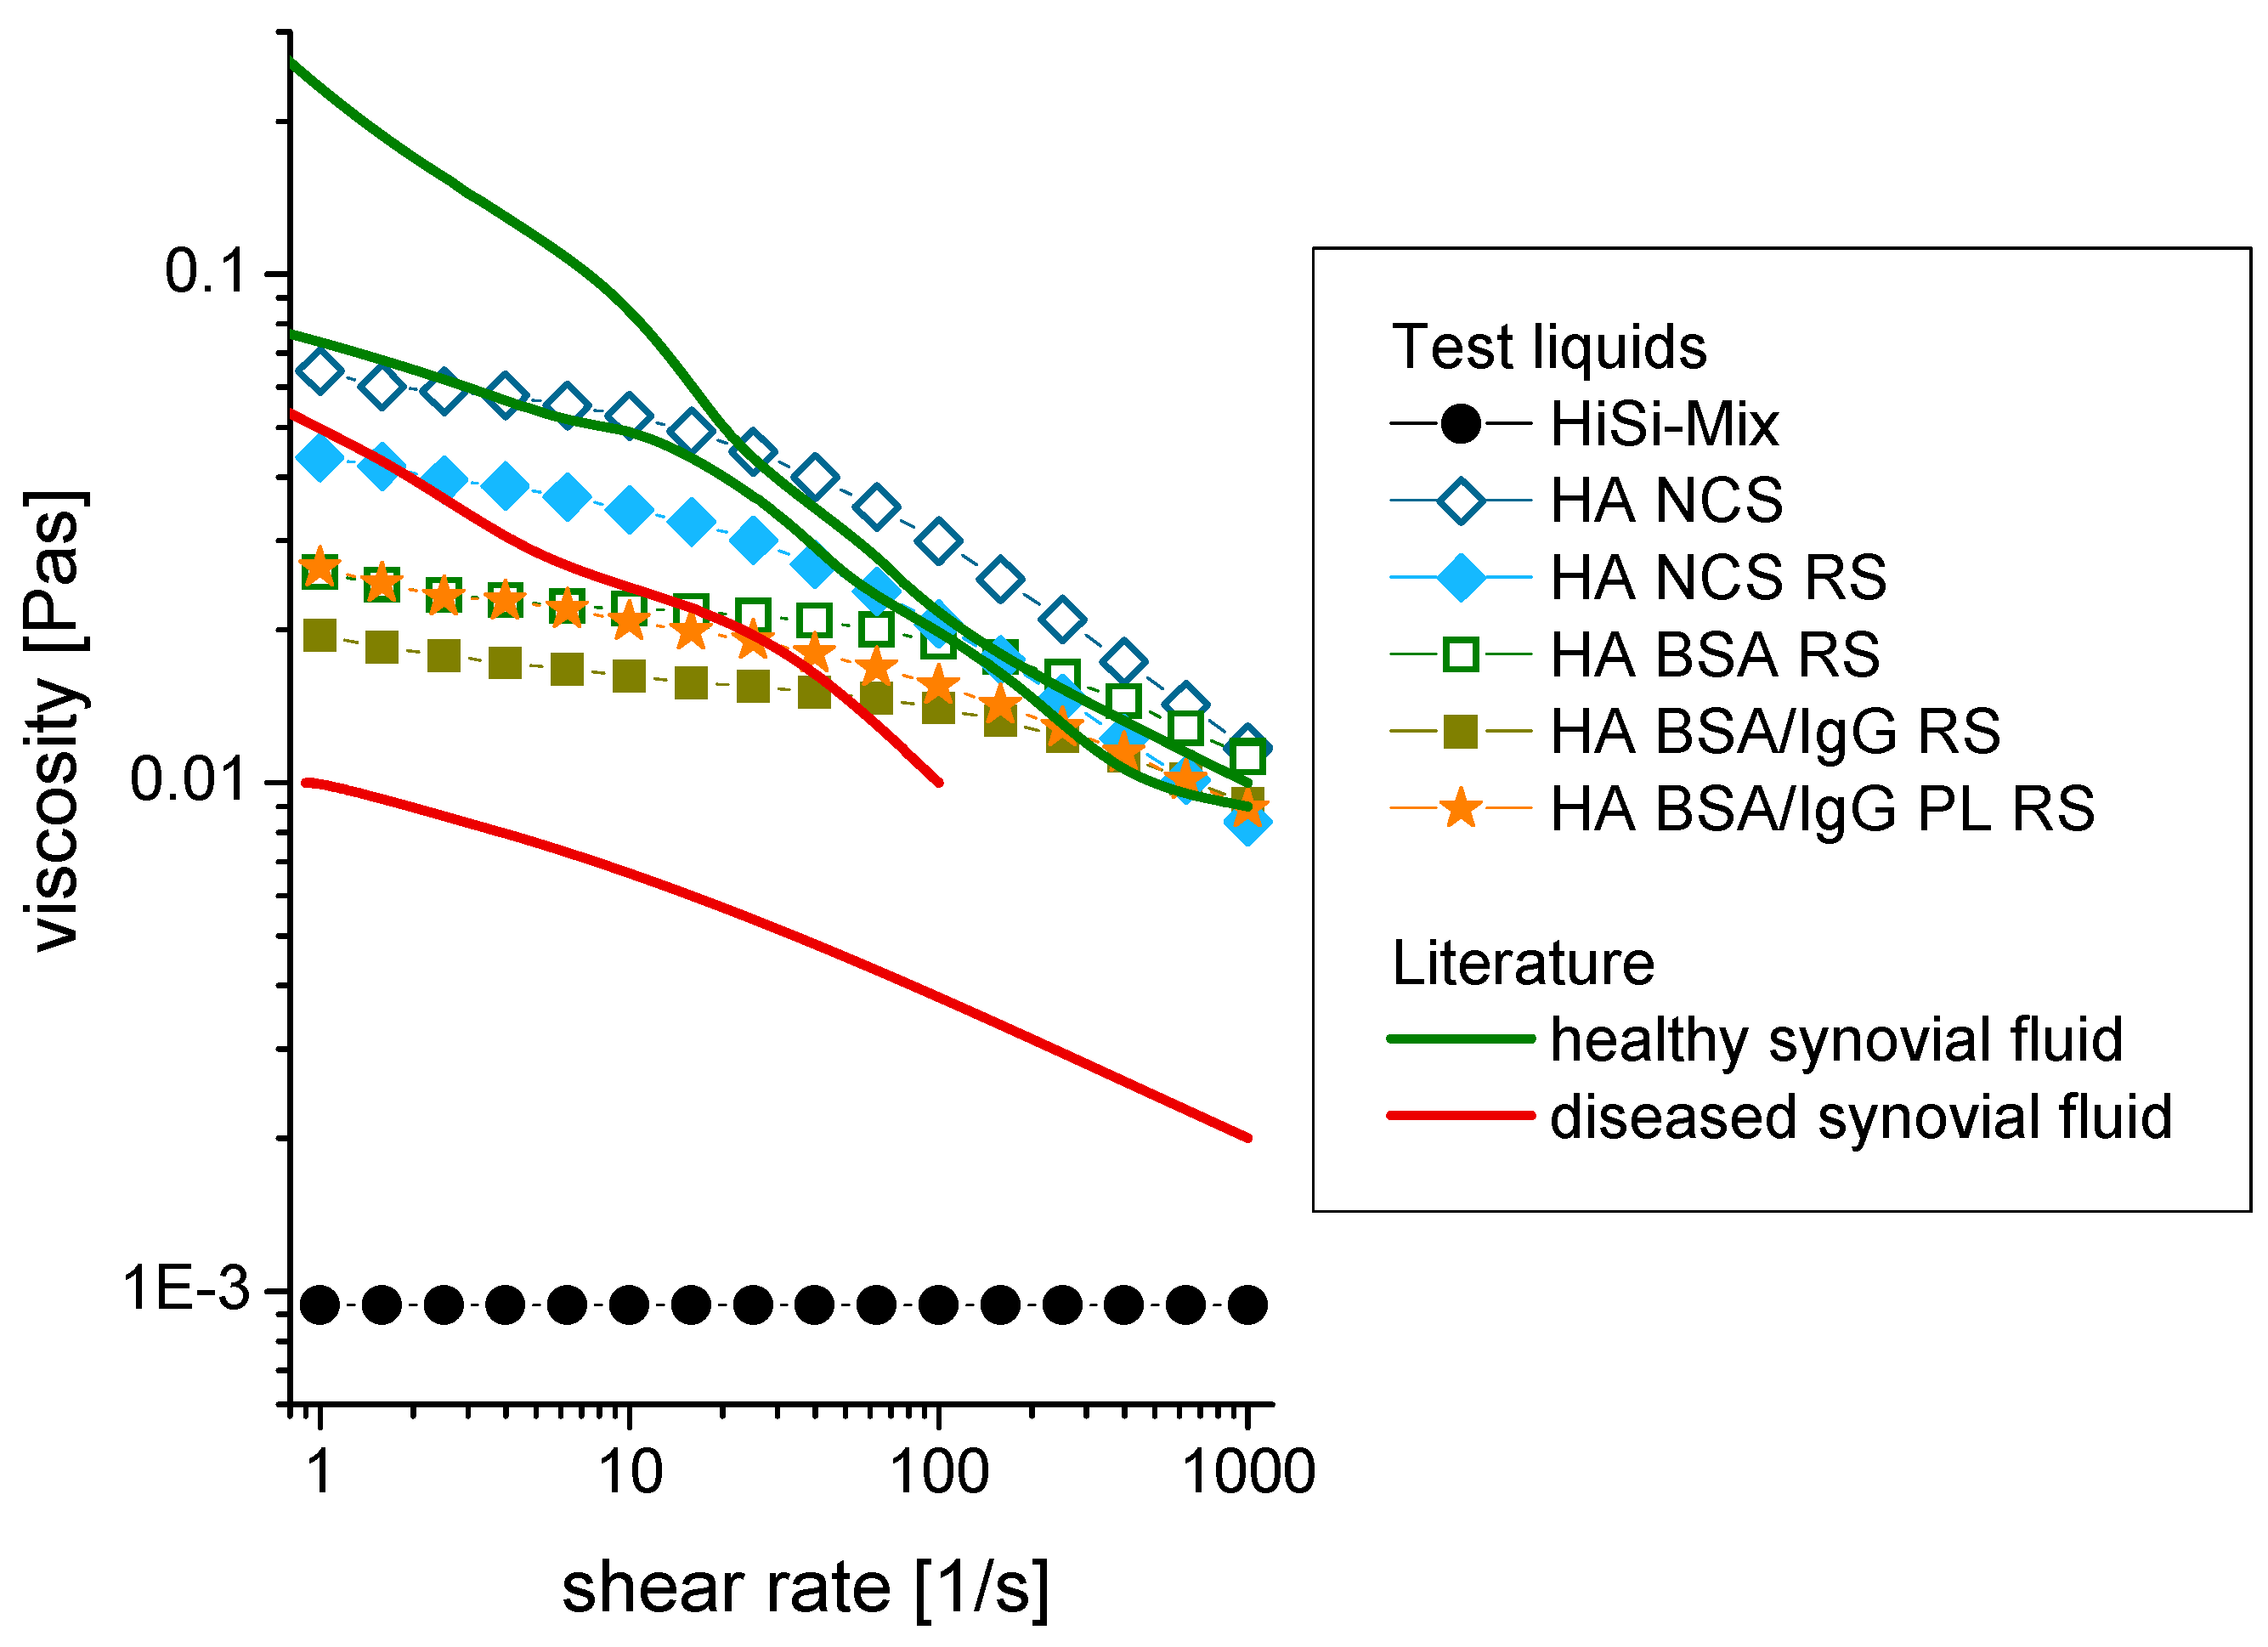
3.1. Viscosity

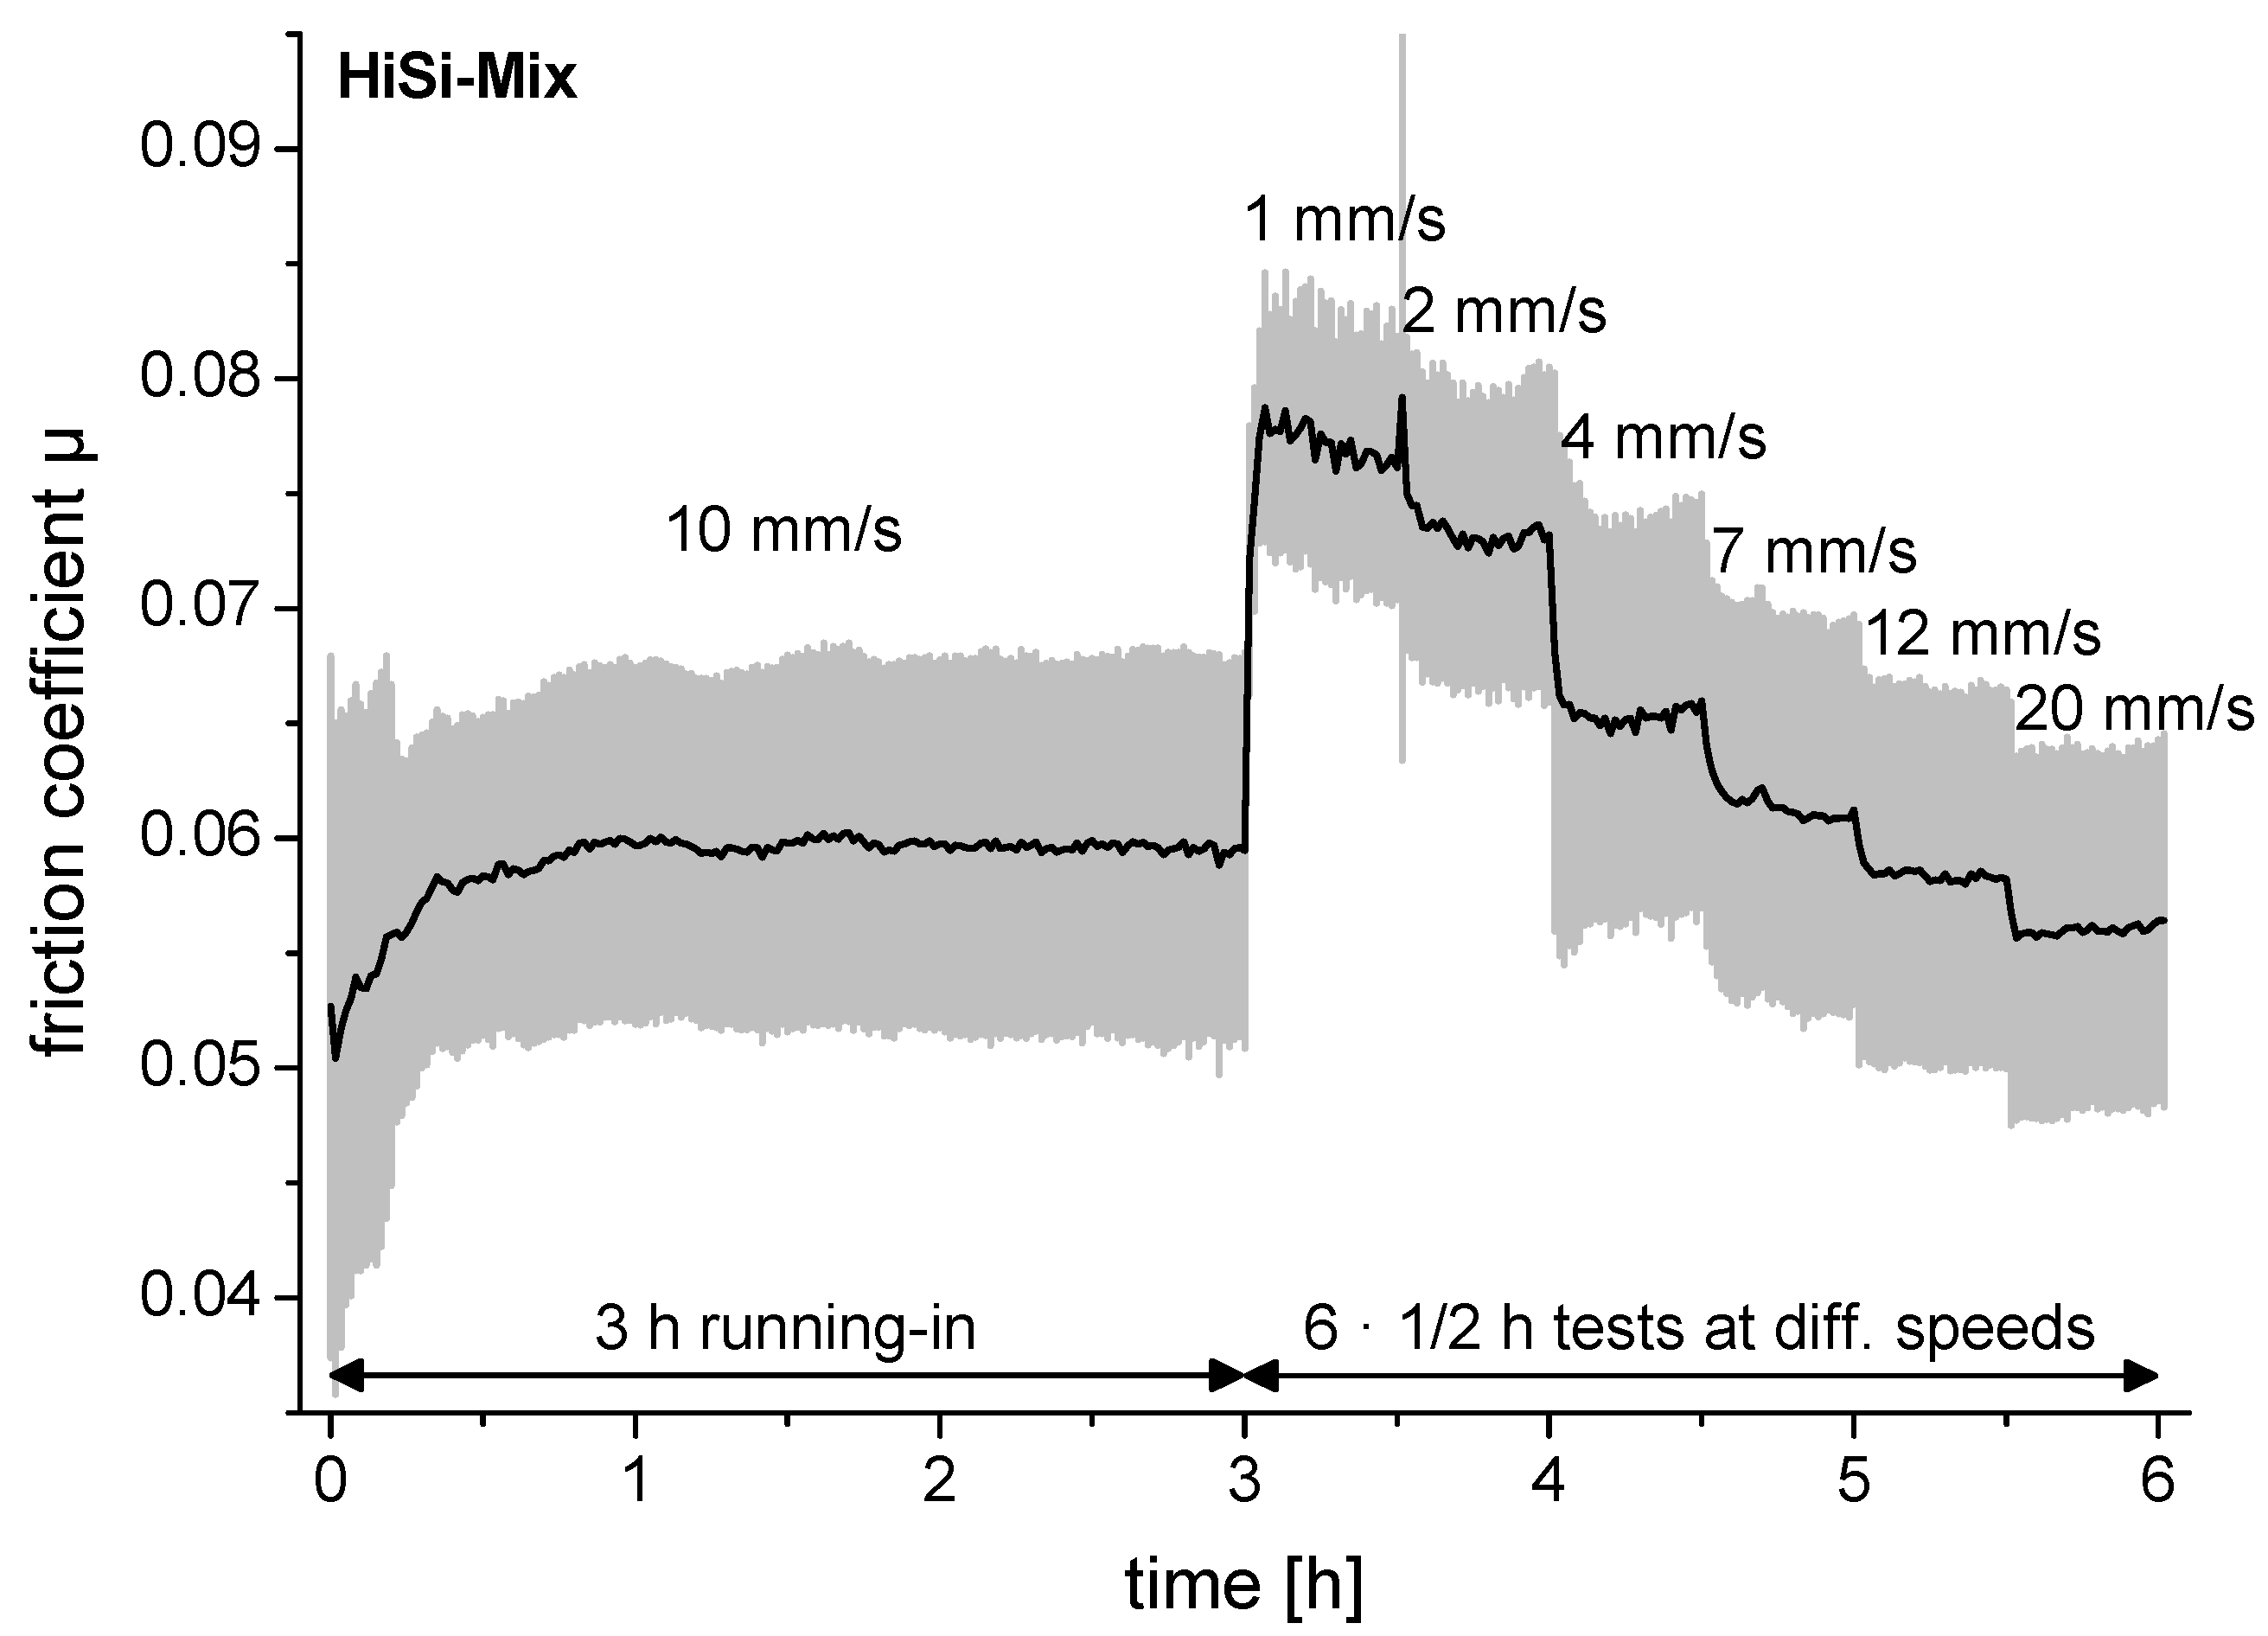
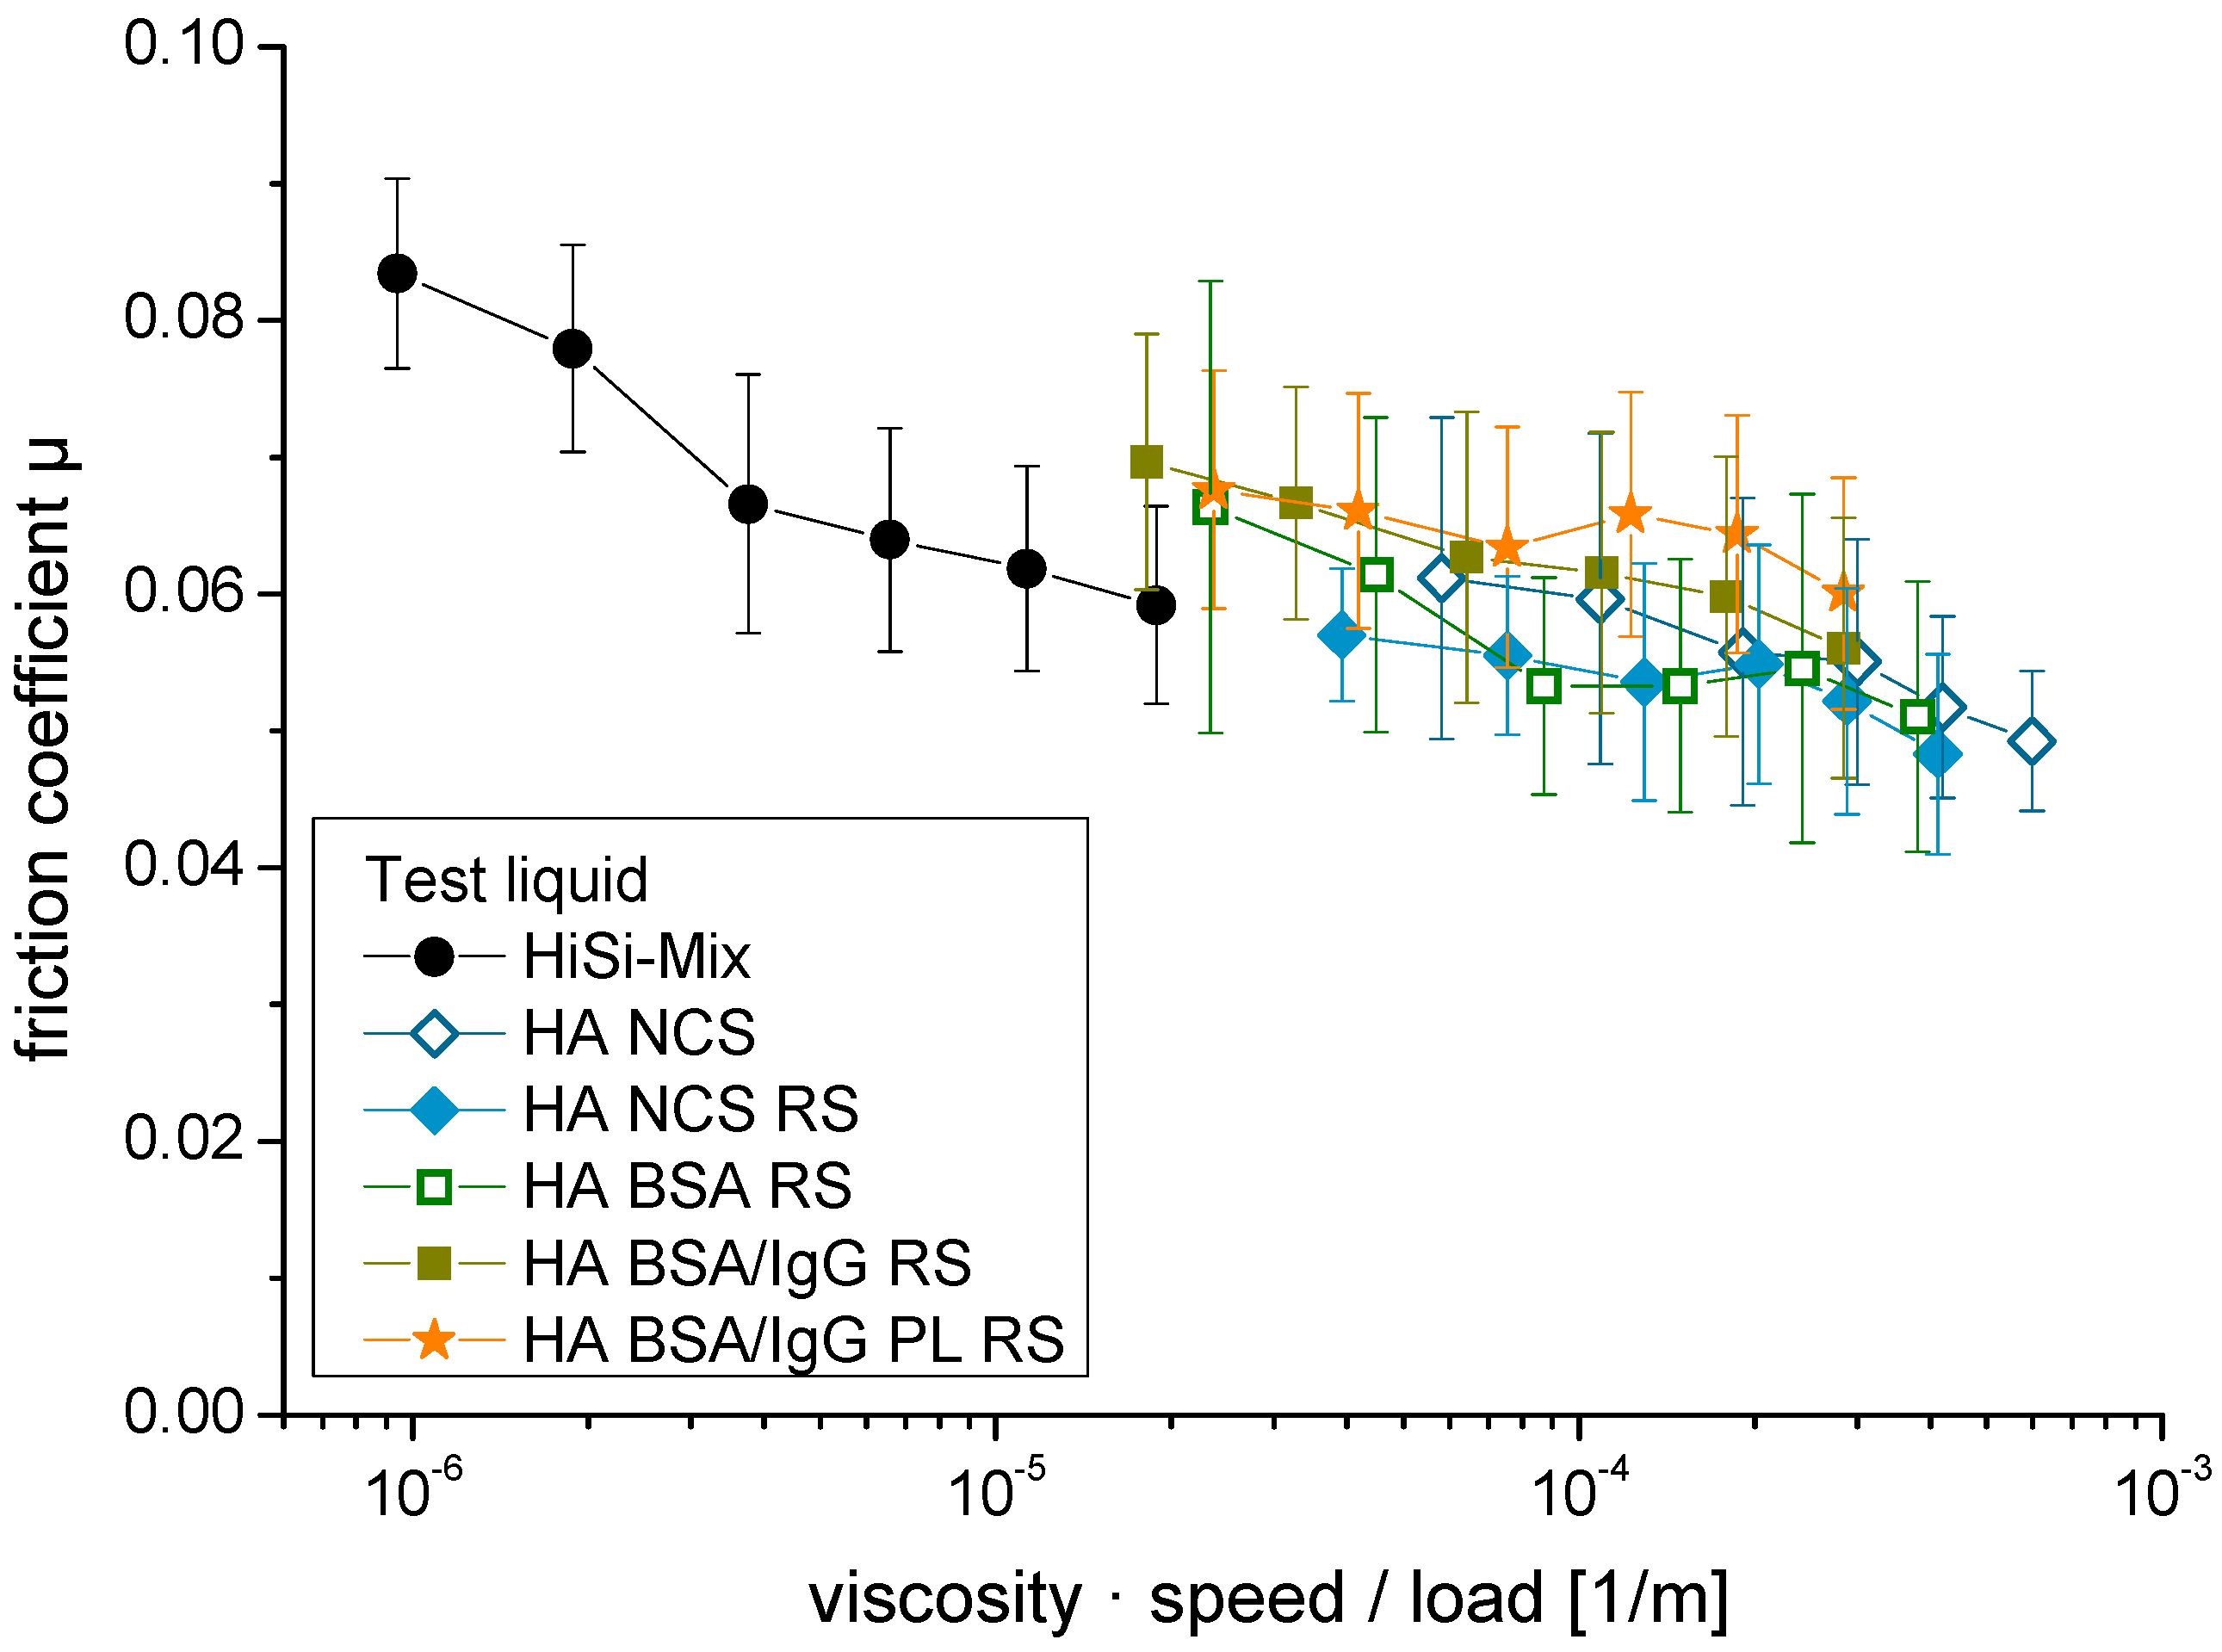
3.2. Friction
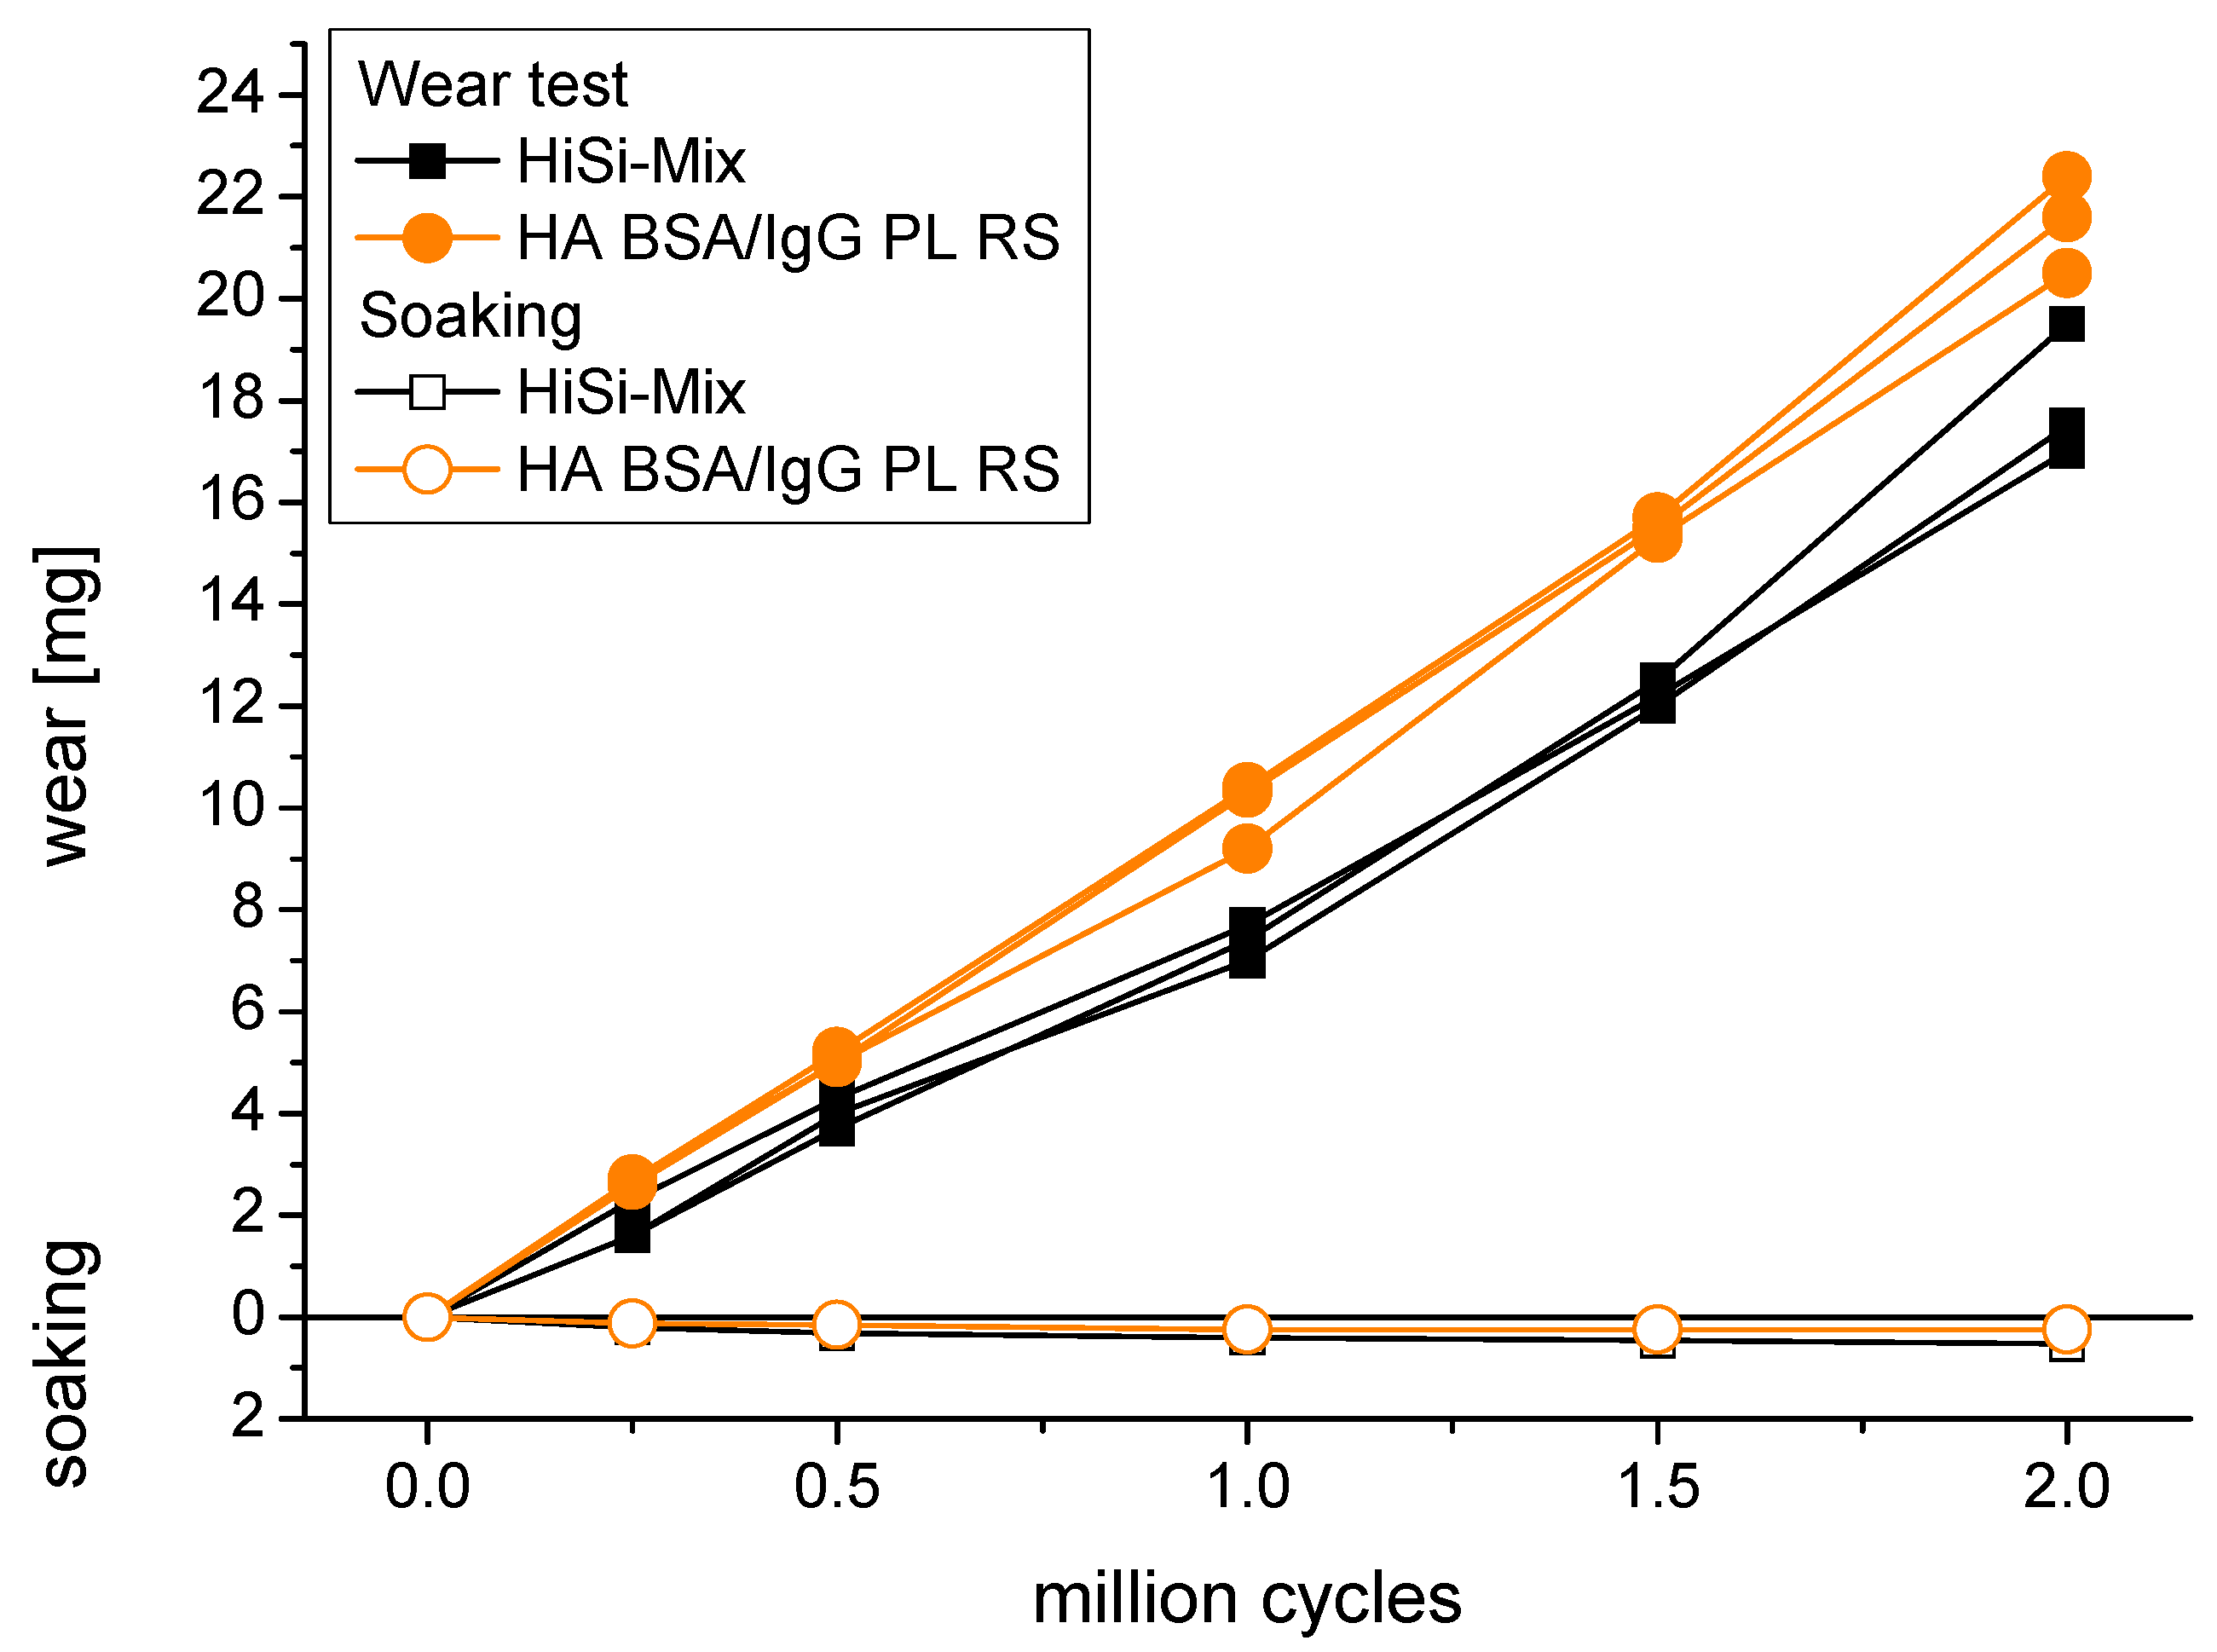
3.3. Gravimetric Wear
| Test Liquid | Wear Rate (mg/million Cycles) | Wear Coefficient (mm3/Nm) |
|---|---|---|
| HiSi-mix | 8.2 ± 0.9 | 3.0 ± 0.3 × 10⁻⁶ |
| HA NCS | 6.8 ± 0.1 | 2.4 ± 0.1 × 10⁻⁶ |
| HA NCS RS | 9.0 ± 0.7 | 3.3 ± 0.2 × 10⁻⁶ |
| HA BSA RS | 5.5 ± 0.6 | 2.0 ± 0.2 × 10⁻⁶ |
| HA BSA/IgG RS | 10.0 ± 0.6 | 3.6 ± 0.2 × 10⁻⁶ |
| HA BSA/IgG PL RS | 10.7 ± 0.4 | 3.9 ± 0.2 × 10⁻⁶ |

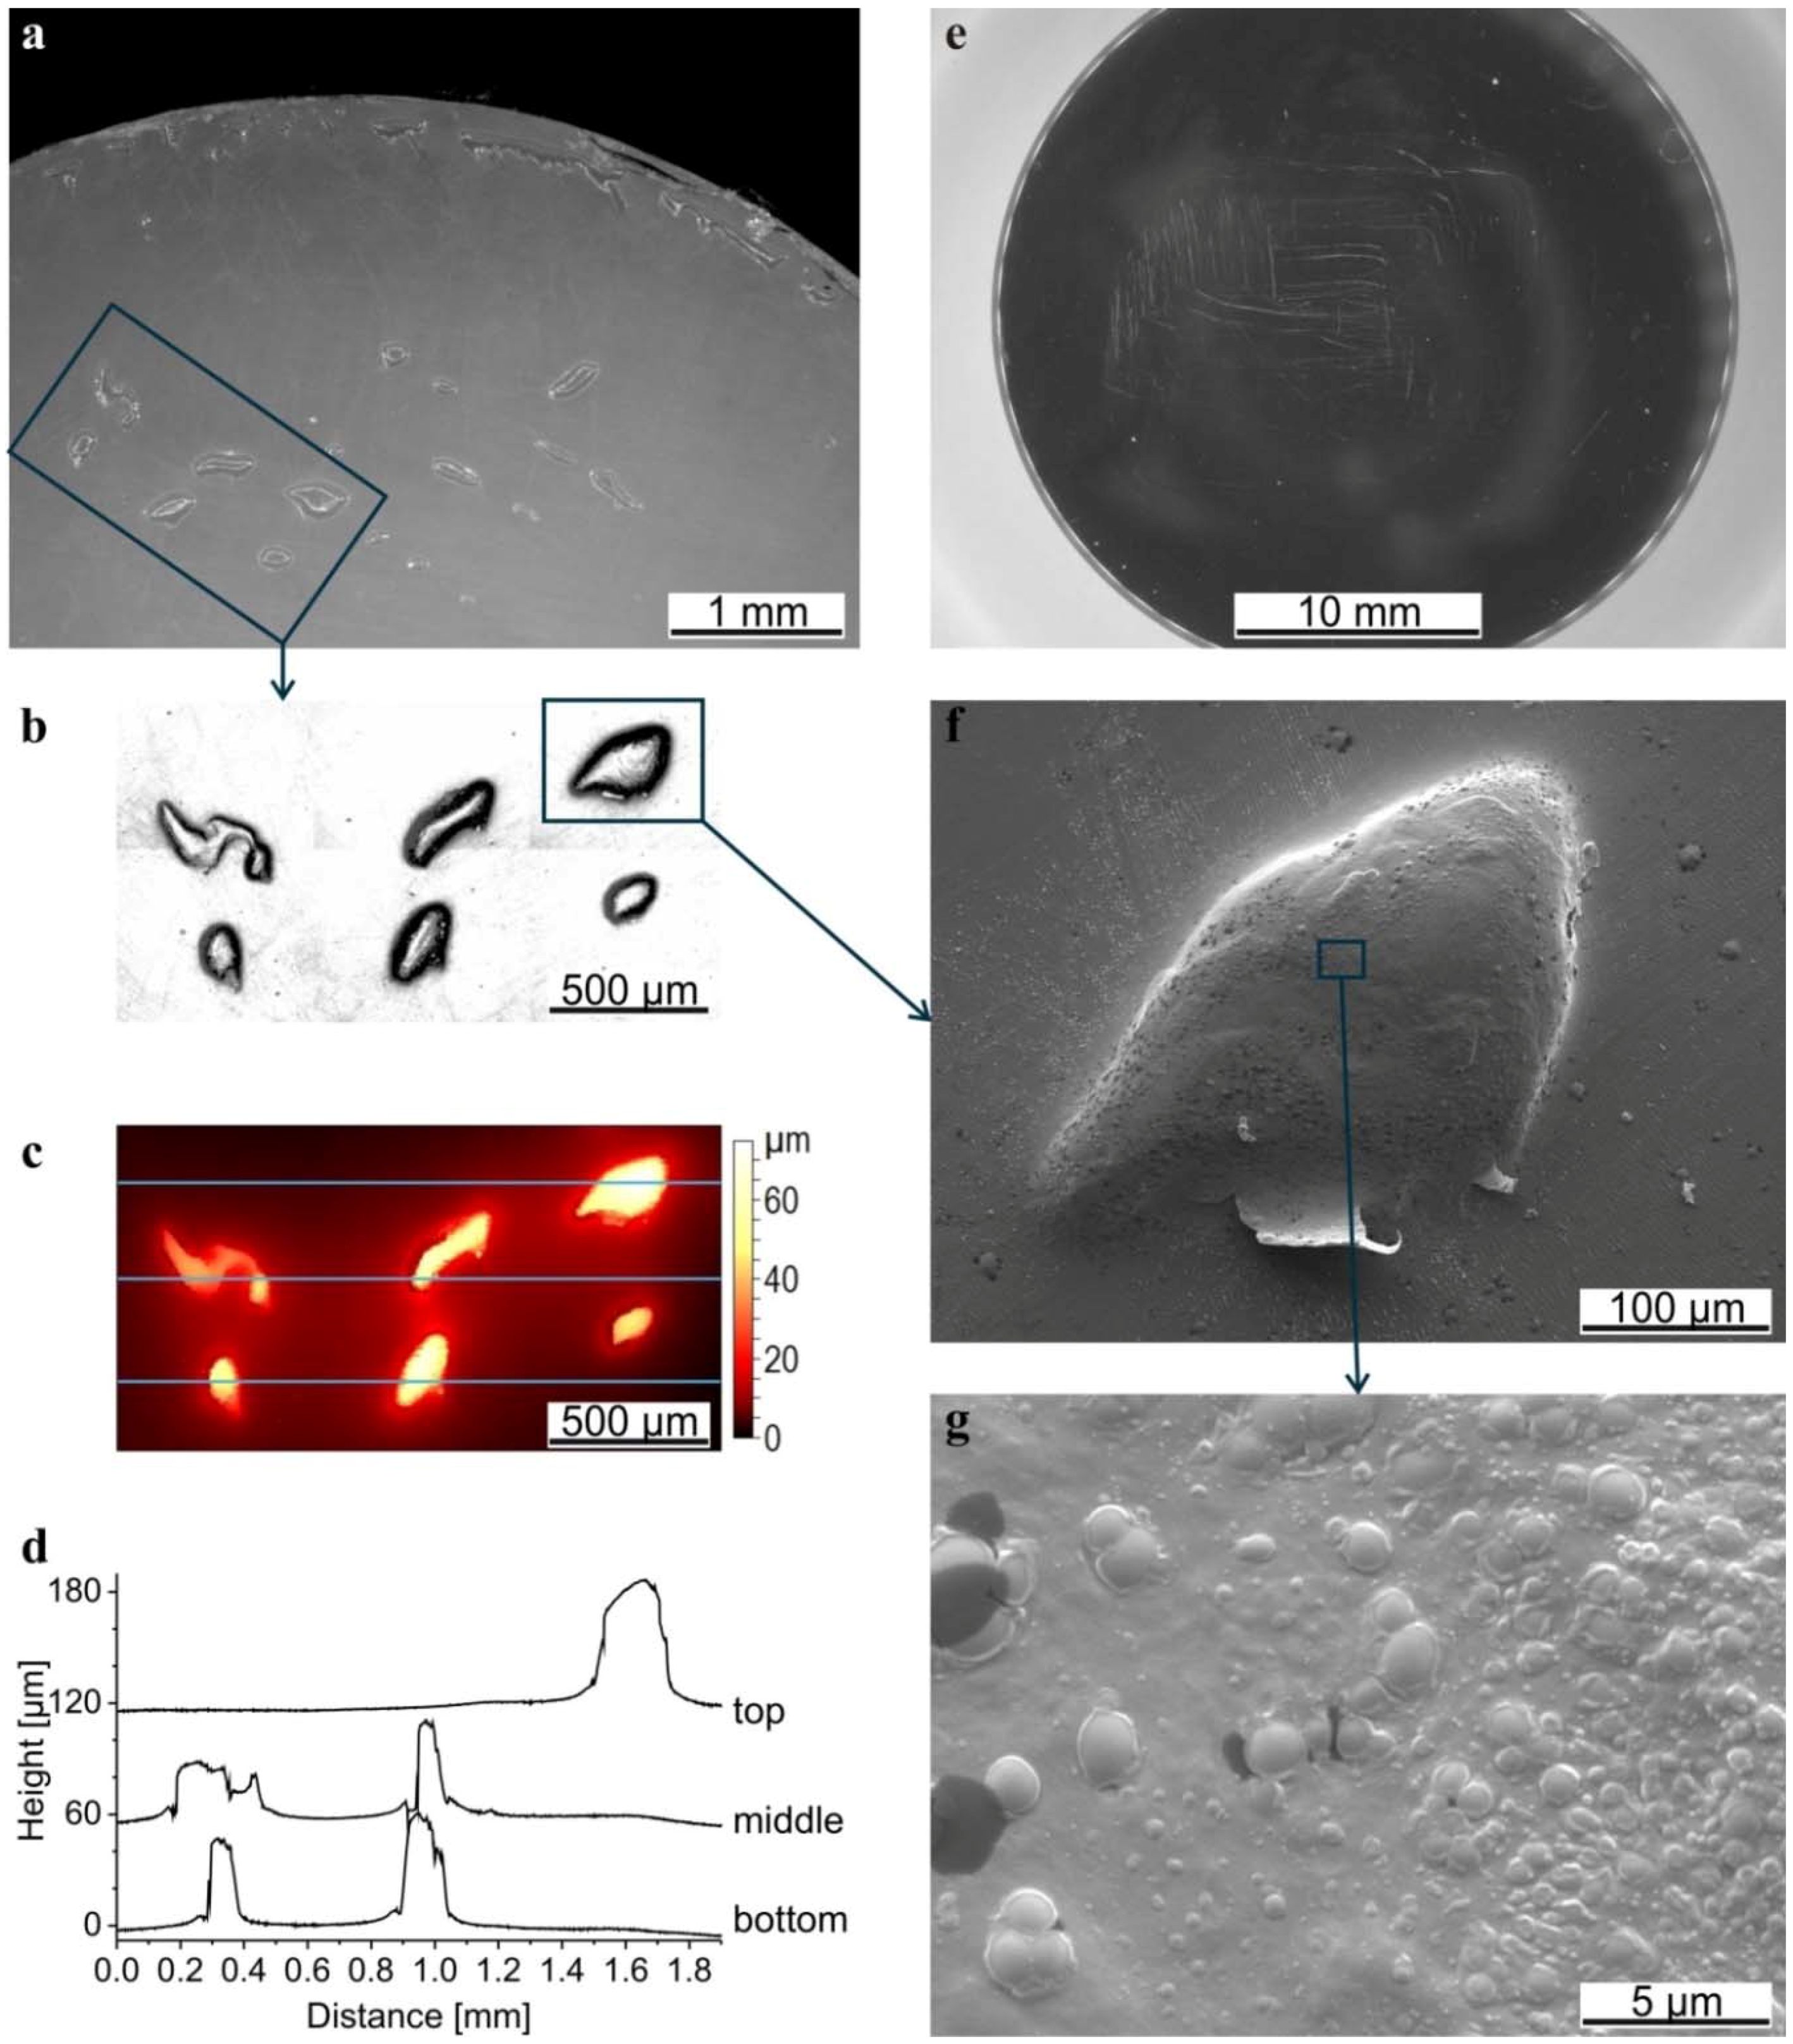
3.4. Surface Characterisation
3.5. Wear Debris

4. Discussion
4.1. Constituents and Their Concentrations
4.2. Viscosity
4.3. Friction and Wear
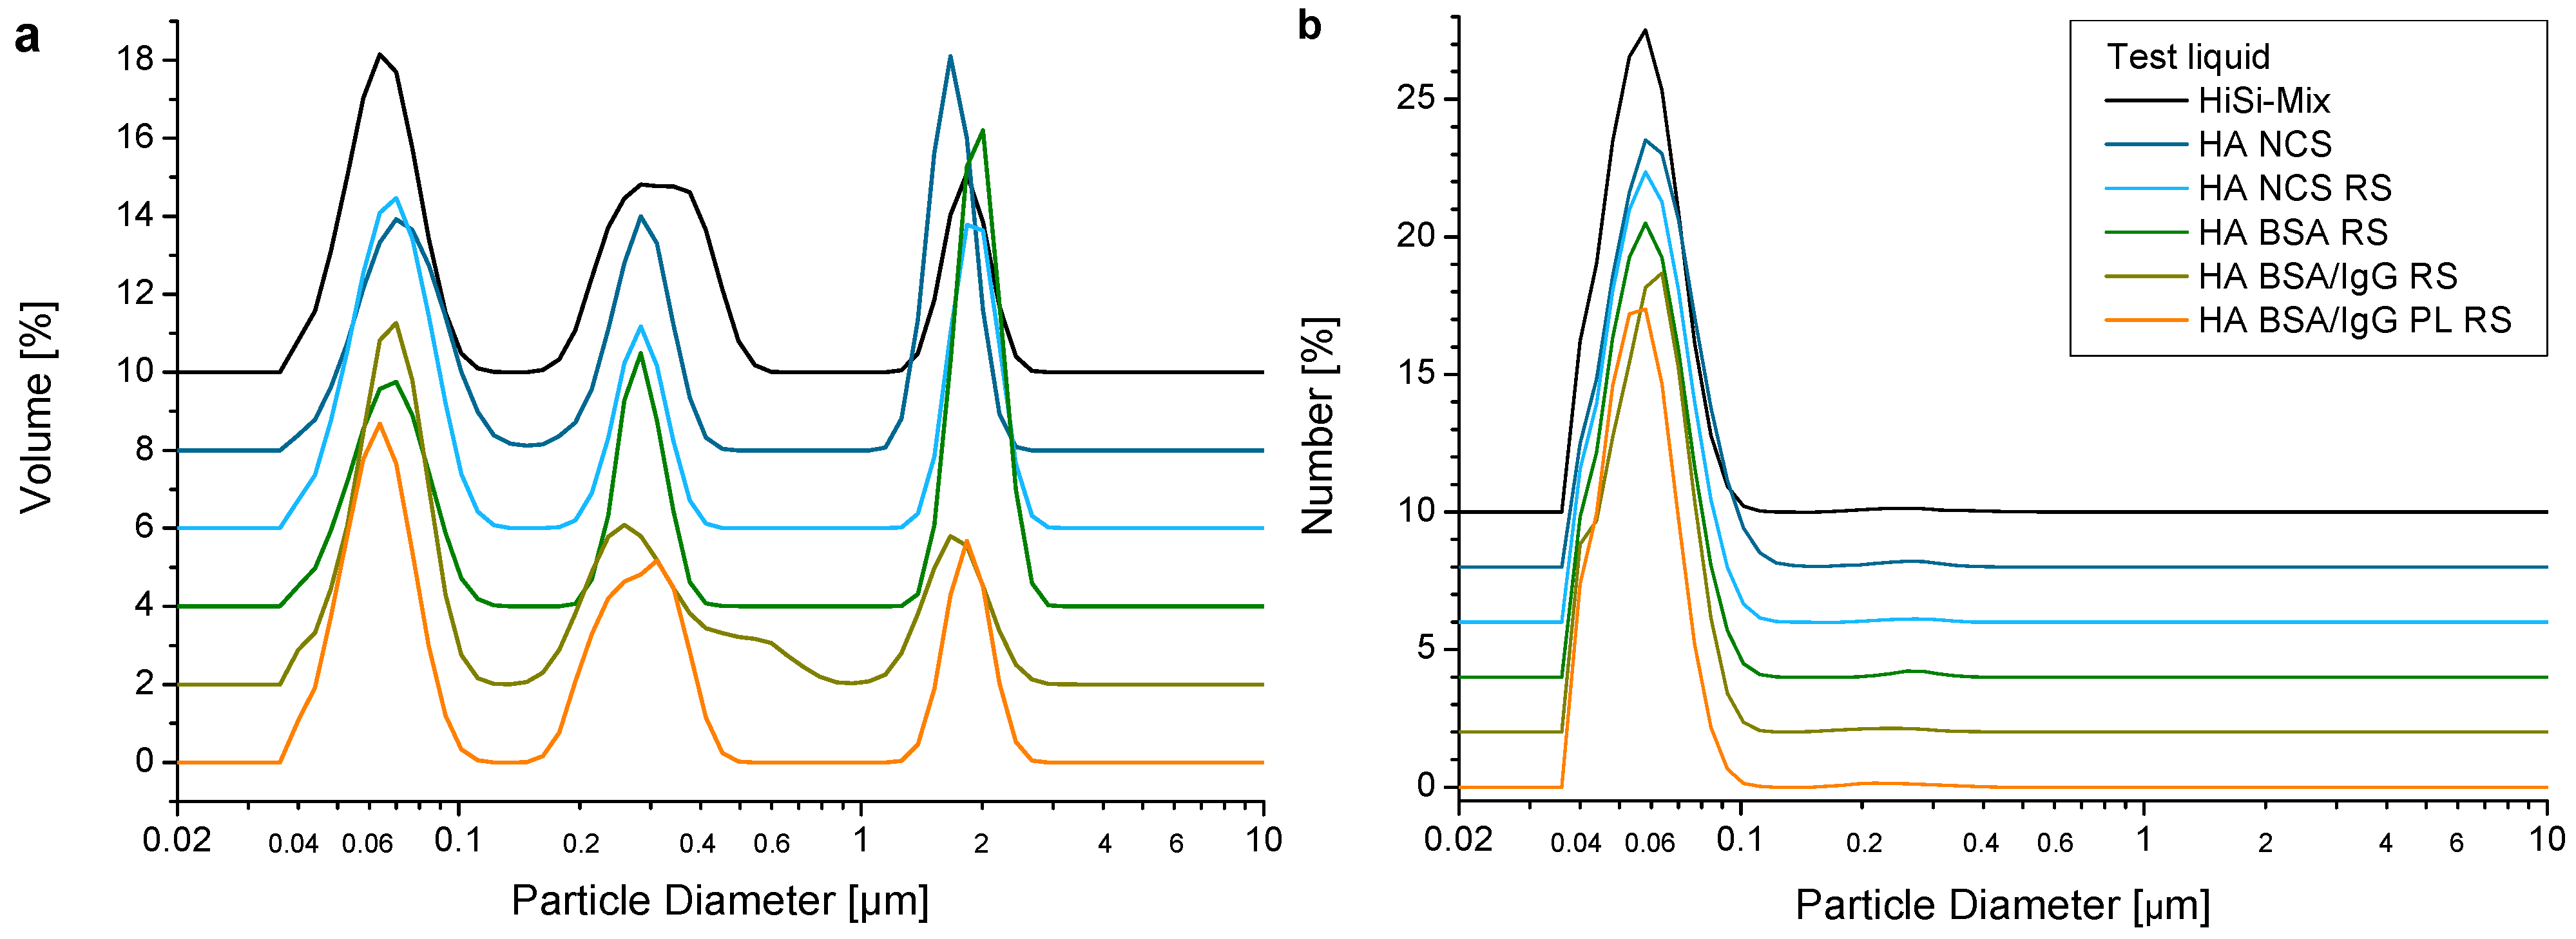
4.4. Wear Particles
4.5. New Test Liquid for Prostheses Testing?
5. Conclusions
- Using 3 g/L HA, the shear-dependent viscosity was in the range of human synovial fluid for diseased joints. The friction regime most likely changed from boundary lubrication at low sliding speeds to mixed lubrication at moderate sliding speeds, leading to lower friction coefficients and lower wear rates.
- Adding ions with the addition of RS led to an electrical screening of the dissociated acid groups over a shorter distance. Therefore, fewer hydrogen bonds between the HA chains were formed, leading to a slight decrease of the viscosity, which might explain the increase of wear.
- Replacing the NCS with selected proteins led to a further decrease of the viscosity, because the lyophilized proteins contained salts. With BSA as the only protein, the decrease of the viscosity led to higher friction at low sliding speeds. However, the wear tests were performed at higher sliding speeds of 20–40 mm/s and thus were not affected by the higher friction at low sliding speeds. In contrast, the lowest wear rate was obtained with BSA as the only protein. With the addition of IgG and PL, the wear rate increased, whereas, with adding both of them, the most realistic synthetic synovial fluid was realised. This also had the advantage of the best reproducibility of friction and wear.
- The obtained wear particles were mostly granular particles together with fibrils. The size distribution was similar for all test liquids and comparable to the ones produced in vivo.
Acknowledgments
Author Contributions
Conflicts of Interest
References
- Bergmann, G.; Graichen, F.; Rohlmann, A. Hip joint loading during walking and running, measured in two patients. J. Biomech. 1993, 26, 969–990. [Google Scholar] [CrossRef]
- Kutzner, I.; Heinlein, B.; Graichen, F.; Bender, A.; Rohlmann, A.; Halder, A.; Beier, A.; Bergmann, G. Loading of the knee joint during activities of daily living measured in vivo in five subjects. J. Biomech. 2010, 43, 2164–2173. [Google Scholar] [CrossRef] [PubMed]
- ISO 14242-1:2014 Implants for Surgery—Wear of Total Hip-Joint Prostheses—Part 1: Loading and Displacement Parameters for Wear-Testing Machines and Corresponding Environmental Conditions for Test. ISO Copyright Office: Geneva, Switzerland.
- ISO 14242-3:2009 Implants for Surgery—Wear of Total Hip-Joint Prostheses—Part 3: Loading and Displacement Parameters for Orbital Bearing Type Wear Testing Machines and Corresponding Environmental Conditions for Test. ISO Copyright Office: Geneva, Switzerland.
- ISO 14243-1:2009 Implants for Surgery—Wear of Total Knee-Joint Prostheses—Part 1: Loading and Displacement Parameters for Wear-Testing Machines with Load Control and Corresponding Environmental Conditions for Test. ISO Copyright Office: Geneva, Switzerland.
- ISO 14243-3:2004 Implants for Surgery—Wear of Total Knee-Joint Prostheses—Part 3: Loading and Displacement Parameters for Wear-Testing Machines with Displacement Control and Corresponding Environmental Conditions for Test. ISO Copyright Office: Geneva, Switzerland.
- Dumbleton, J.H. Tribology of Natural and Artificial Joints; University of Michigan: Ann Arbor, MI, USA, 1981. [Google Scholar]
- Saari, H.; Santavirta, S.; Nordstrom, D.; Paavolainen, P.; Konttinen, Y.T. Hyaluronate in total hip replacement. J. Rheumatol. 1993, 20, 87–90. [Google Scholar] [PubMed]
- Noordin, S.; Schmalzried, T.P.; Campbell, P.; Amstutz, H.C. Synovial fluid from patients with prosthetic joint arthroplasty: Protein concentration and in vivo wear of polyethylene. In Proceedings of the Transactions of the 43rd Annual Meeting of the Orthopaedic Research Society, San Francisco, CA, USA, 9–13 February 1997; Volume 22, p. 769.
- Guenther, L.E.; Pyle, B.W.; Turgeon, T.R.; Bohm, E.R.; Yss, U.P.W.; Schmidt, T.A.; Brandt, J.M. Biochemical analyses of human osteoarthritic and periprosthetic synovial fluid. Proc. Inst. Mech. Eng. Part H 2014, 228, 127–139. [Google Scholar] [CrossRef] [PubMed]
- McKellop, H.; Lu, B. Friction, lubrication and wear of polyethylene/metal and polyethylene/ceramic hip prostheses on a joint simulator. In Proceedings of the Fourth World Biomaterials Congress, Berlin, Germany, 24–28 April 1992; p. 118.
- Oral, E.; Ghali, B.W.; Muratoglu, O.K. The elimination of free radicals in irradiated UHMWPEs with and without vitamin e stabilization by annealing under pressure. J. Biomed. Mater. Res. Part B Appl. Biomater. 2011, 97, 167–174. [Google Scholar] [CrossRef] [PubMed]
- Liao, Y.S.; McKellop, H.; Lu, Z.; Campbell, P.; Benya, P. The effect of frictional heating and forced cooling on the serum lubricant and wear of UHMW polyethylene cups against cobalt-chromium and zirconia balls. Biomaterials 2003, 24, 3047–3059. [Google Scholar] [CrossRef]
- St. John, K.; Gupta, M. Evaluation of the wear performance of a polycarbonate-urethane acetabular component in a hip joint simulator and comparison with UHMWPE and cross-linked UHMWPE. J. Biomater. Appl. 2012, 27, 55–65. [Google Scholar] [CrossRef] [PubMed]
- Grupp, T.M.; Giurea, A.; Miehlke, R.K.; Hintner, M.; Gaisser, M.; Schilling, C.; Schwiesau, J.; Kaddick, C. Biotribology of a new bearing material combination in a rotating hinge knee articulation. Acta Biomater. 2013, 9, 7054–7063. [Google Scholar] [CrossRef] [PubMed]
- Heuberger, R.; Wahl, P.; Krieg, J.; Gautier, E. Low in vitro third-body wear on total hip prostheses induced by calcium sulphate used for local antibiotic therapy. Eur. Cell Mater. 2014, 28, 246–257. [Google Scholar] [PubMed]
- Kaddick, C.; Wimmer, M.A. Hip simulator wear testing according to the newly introduced standard ISO 14242. Proc. Inst. Mech. Eng. Part H 2001, 215, 429–442. [Google Scholar] [CrossRef]
- Crockett, R.; Roba, M.; Naka, M.; Gasser, B.; Delfosse, D.; Frauchiger, V.; Spencer, N.D. Friction, lubrication, and polymer transfer between UHMWPE and CoCrMo hip-implant materials: A fluorescence microscopy study. J. Biomed. Mater. Res. A 2009, 89, 1011. [Google Scholar] [CrossRef] [PubMed]
- McNulty, D.; Swope, S.; Liao, Y.S.; McKellop, H.; Shen, F.-W.; Galvin, A.; Fischer, J. Multi-lab evaluation of hip simulator test conditions on relative wear rates of crosslinked polyethylenes. In Proceedings of the 52nd Annual Meeting of the Orthopaedic Research Society, Chicago, IL, USA, 19–22 March 2006; p. 649.
- Wang, A.; Polineni, V.K.; Essner, A.; Stark, C.; Dumbleton, J.H. The Impact of Lubricant Protein Concentration on the Outcome of Hip Joint Simulator Wear Testing. In Proceedings of the 25th Annual Meeting Transactions of the Society for Biomaterials, Providence, RI, USA, 28 April–2 May 1999; p. 178.
- Saikko, V. Effect of lubricant protein concentration on the wear of ultra-high molecular weight polyethylene sliding against a CoCr counterface. J. Tribol. 2003, 125, 638–642. [Google Scholar] [CrossRef]
- Schwenke, T.; Wimmer, M.A.; Kaddick, C. Fluid composition influences wear testing of artificial knee implants. In Medical Device Materials II—Proceedings of the Materials and Processes for Medical Devices Conference 2004; Helmus, M., Medlin, D., Eds.; ASM International: Novelty, OH, USA, 24–27 August 2005; pp. 173–177. [Google Scholar]
- Wang, A.; Essner, A.; Schmidig, G. The Effects of Lubricant Composition on in vitro Wear Testing of Polymeric Acetabular Components. J. Biomed. Mater. Res. B Appl. Biomater. 2003, 68, 45–52. [Google Scholar] [CrossRef] [PubMed]
- Brandt, J.M.; Charron, K.; Zhao, L.; MacDonald, S.J.; Medley, J.B. Calf serum constituent fractions influence polyethylene wear and microbial growth in knee simulator testing. Proc. Inst. Mech. Eng. Part H 2012, 226, 427–440. [Google Scholar] [CrossRef]
- Brandt, J.M.; Mahmoud, K.K.; Koval, S.F.; MacDonald, S.J.; Medley, J.B. Antimicrobial agents and low-molecular weight polypeptides affect polyethylene wear in knee simulator testing. Tribol. Int. 2013, 65, 97–104. [Google Scholar] [CrossRef]
- Takadama, H.; Mizuno, M. A simulated synovial fluid for wear characterization of artificial hip joints by a hip joint simulator. Key Eng. Mater. 2006, 309–311, 1273–1276. [Google Scholar] [CrossRef]
- Roba, M.; Naka, M.; Gautier, E.; Spencer, N.D.; Crockett, R. The adsorption and lubrication behavior of synovial fluid proteins and glycoproteins on the bearing-surface materials of hip replacements. Biomaterials 2009, 30, 2072–2078. [Google Scholar] [CrossRef] [PubMed]
- Brandt, J.M.; Brière, L.K.; Marr, J.; MacDonald, S.J.; Bourne, R.B.; Medley, J.B. Biochemical comparisons of osteoarthritic human synovial fluid with calf sera used in knee simulator wear testing. J. Biomed. Mater. Res. A 2010, 94, 961–971. [Google Scholar] [CrossRef] [PubMed]
- Balazs, E.A.; Watson, D.; Duff, I.F.; Roseman, S. Hyaluronic acid in synovial fluid. I. Molecular parameters of hyaluronic acid in normal and arthritis human fluids. Arthritis Rheum. 1967, 10, 357–376. [Google Scholar] [CrossRef] [PubMed]
- Binette, J.P.; Schmid, K. The proteins of synovial fluid: A study of the α1/α2 globulin ratio. Arthritis Rheum. 1965, 8, 14–28. [Google Scholar] [CrossRef] [PubMed]
- Slack, S.M. Properties of Biological Fluids. In Biomaterial Science an Introduction to Materials in Medicine, 2nd ed.; Ratner, B.D., Hoffmann, A.S., Schoen, F.J., Lemons, J.E., Eds.; Elsevier: Philadelphia, PA, USA, 2004; pp. 813–817. [Google Scholar]
- Yao, J.Q.; Blanchet, T.A.; Murphy, D.J.; Laurent, M.P. Effect of fluid absorption on the wear resistance of UHMWPE orthopedic bearing surfaces. Wear 2003, 255, 1113–1120. [Google Scholar] [CrossRef]
- Körperflüssigkeiten. In Wissenschaftliche Tabellen Geigy; Ciba-Geigy Limited: Basle, Switzerland, 1977.
- Schurz, J.; Ribitsch, V.; Rainer, F. Rheologische Untersuchungen an Synovia und Synoviamodellen. Rheol. Acta 1979, 18, 139–150. [Google Scholar] [CrossRef]
- Ragan, C.; Meyer, K. The hyaluronic acid of synovial fluid in rheumatoid arthritis. J. Clin. Investig. 1949, 28, 56–59. [Google Scholar] [CrossRef] [PubMed]
- Nuki, G.; Ferguson, J. Studies on the nature and significance of macromolecular complexes in the rheology of synovial fluid from normal and diseased human joints. Rheol. Acta 1971, 10, 8–14. [Google Scholar] [CrossRef]
- Lee, D.W.; Banquy, X.; Das, S.; Cadirov, N.; Jay, G.; Israelachvili, J. Effects of molecular weight of grafted hyaluronic acid on wear initiation. Acta Biomater. 2014, 10, 1817–1823. [Google Scholar] [CrossRef] [PubMed]
- Kitano, T.; Ateshian, G.A.; Mow, V.C.; Kadoya, Y.; Yamano, Y. Constituents and pH changes in protein rich hyaluronan solution affect the biotribological properties of artificial articular joints. J. Biomech. 2001, 34, 1031–1037. [Google Scholar] [CrossRef]
- Hua, Z.K.; Su, S.H.; Zhang, J.H. Tribological study on new therapeutic bionic lubricants. Tribol. Lett. 2007, 28, 51–58. [Google Scholar] [CrossRef]
- Radin, E.L.; Paul, I.L.; Weisser, P.A. Joint lubrication with artificial lubricants. Arthritis Rheum. 1971, 14, 126–129. [Google Scholar] [CrossRef] [PubMed]
- Scholes, S.C.; Unsworth, A. The effects of proteins on the friction and lubrication of artificial joints. Proc. Inst. Mech. Eng. Part H 2006, 220, 687–693. [Google Scholar] [CrossRef]
- Hu, X.Q.; Wood, R.J.K.; Taylor, A.; Tuke, M.A. The tribological behaviour of different clearance MOM hip joints with lubricants of physiological viscosities. Proc. Inst. Mech. Eng. Part H 2011, 225, 1061–1069. [Google Scholar] [CrossRef]
- Nuki, G.; Ferguson, J.; Boyle, J.A.; Boddy, K. Rheological simulation of synovial fluid by a synthetic polymer solution. Nature 1969, 224, 1118–1119. [Google Scholar] [CrossRef] [PubMed]
- Smith, A.M.; Fleming, L.; Wudebwe, U.; Bowen, J.; Grover, L.M. Development of a synovial fluid analogue with bio-relevant rheology for wear testing of orthopaedic implants. J. Mech. Behav. Biomed. Mater. 2014, 32, 177–184. [Google Scholar] [CrossRef] [PubMed]
- Thompson, M.; Hunt, B.; Smith, A.; Joyce, T. Wear Tests of a Potential Biolubricant for Orthopedic Biopolymers. Lubricants 2015, 3, 80–90. [Google Scholar] [CrossRef]
- Sawae, Y.; Murakami, T.; Chen, J. Effect of synovia constituents on friction and wear of ultra-high molecular weight polyethylene sliding against prosthetic joint materials. Wear 1998, 216, 213–219. [Google Scholar] [CrossRef]
- Yao, J.Q.; Laurent, M.P.; Johnson, T.S.; Blanchard, C.R.; Crowninshield, R.D. The influences of lubricant and material on polymer/CoCr sliding friction. Wear 2003, 255, 780–784. [Google Scholar] [CrossRef]
- Schmid, V. Tribometer zur Untersuchung von biologischem und synthetischem Knorpel. Bachelor Thesis, Bern University of Applied Sciences, Berne, Switzerland, 2008. [Google Scholar]
- ISO 14242-2:2000 Implants for Surgery—Wear of Total Hip-Joint Prostheses—Part 2: Methods of Measurements. ISO Copyright Office: Geneva, Switzerland.
- Beamson, G.; Briggs, D. High Resolution XPS of Organic Polymers; John Wiley & Sons Ltd: Chichester, UK, 1992. [Google Scholar]
- Moulder, J.F.; Stickle, W.F.; Sobol, P.E.; Bomben, K.D. Handbook of X-Ray Photoelectron Spectroscopy; Physical Electronics, Inc.: Eden Prairie, MN, USA, 1995. [Google Scholar]
- Stribeck, R. Die wesentlichen Eigenschaften der Gleit- und Rollen-lager. Z. Ver. Dtsch. Ing. 1902, 46, 1341–1348. [Google Scholar]
- Data Sheet Ticona GUR 1020. Ticona: Florence, KY, USA, 2011.
- Bortel, E. Development of a Test Fluid to Mimic the Synovia for the Tribological Testing of Materials for Joint Replacements. Diploma Thesis, TU Hamburg, Germany & RMS Foundation, Bettlach, Switzerland, 2011. [Google Scholar]
- Cooke, A.F.; Dowson, D.; Wright, V. The rheology of synovial fluid and some potential synthetic lubricants for degenerate synovial joints. Eng. Med. 1978, 7, 66–72. [Google Scholar] [CrossRef]
- Seller, P.C.; Dowson, D.; Wright, V. The rheology of synovial fluid. Rheol. Acta 1971, 10, 2–7. [Google Scholar] [CrossRef]
- Roba, M. Interaction of Synovial Liquid Components with Artificial Hip-Joint Materials. PhD Thesis, ETH Zurich, Switzerland, 2009. [Google Scholar]
- Scholes, S.C.; Unsworth, A.; Goldsmith, A.A.J. A frictional study of total hip joint replacements. Phys. Med. Biol. 2000, 45, 3721–3735. [Google Scholar] [CrossRef] [PubMed]
- Kurtz, S.M.; Gawel, H.A.; Patel, J.D. History and systematic review of wear and osteolysis outcomes for first-generation highly crosslinked polyethylene. Clin. Orthop. Relat. Res. 2011, 469, 2262–2277. [Google Scholar] [CrossRef] [PubMed]
- Hall, R.M.; Unsworth, A. Wear in retrieved Charnley acetabular sockets. Proc. Inst. Mech. Eng. Part H 1996, 210, 197–207. [Google Scholar] [CrossRef]
- Forsey, R.W.; Fisher, J.; Thompson, J.; Stone, M.H.; Bell, C.; Ingham, E. The effect of hyaluronic acid and phospholipid based lubricants on friction within a human cartilage damage model. Biomaterials 2006, 27, 4581–4590. [Google Scholar] [CrossRef] [PubMed]
- Swann, D.A.; Radin, E.L.; Nazimiec, M. Role of hyaluronic acid in joint lubrication. Ann. Rheum. Dis. 1974, 33, 318–326. [Google Scholar] [CrossRef] [PubMed]
- Serro, A.P.; Degiampietro, K.; Colaço, R.; Saramago, B. Adsorption of albumin and sodium hyaluronate on UHMWPE: A QCM-D and AFM study. Colloids Surf. B 2010, 78, 1–7. [Google Scholar] [CrossRef] [PubMed]
- Hutchings, I.M. Tribology—Friction and Wear of Engineering Materials; Butterworth-Heinemann Ltd: London, UK, 1992. [Google Scholar]
- Unsworth, A.; Pearcy, M.J.; White, E.F.T.; White, G. Soft layer lubrication of artificial hip joints. In Proceedings of the Institution of Mechanical Engineers International Conference: Tribology—Friction, Lubrication and Wear; Institution of Mechanical Engineers: London, UK, 1987; pp. 715–724. [Google Scholar]
- Smith, S.L.; Ash, H.E.; Unsworth, A. A tribological study of UHMWPE acetabular cups and polyurethane compliant layer acetabular cups. J. Biomed. Mater. Res. 2000, 53, 710–716. [Google Scholar] [CrossRef]
- Scholes, S.C.; Smith, S.L.; Ash, H.E.; Unsworth, A. The lubrication and friction of conventional UHMWPE, novel compliant layer, and hard bearing surfaces for use in total hip prostheses. In Friction, Lubrication and Wear of Artificial Joints; Hutchings, I.M., Ed.; Professional Engineering Publishing: Bury St Edmunds/London, UK, 2003; pp. 59–74. [Google Scholar]
- Jalali-Vahid, D.; Jagatia, M.; Jin, Z.M.; Dowson, D. Prediction of lubricating film thickness in UHMWPE hip joint replacements. J. Biomech. 2001, 34, 261–266. [Google Scholar] [CrossRef]
- Mavraki, A.; Cann, P.M. Lubricating film thickness measurements with bovine serum. Tribol. Int. 2011, 44, 550–556. [Google Scholar] [CrossRef]
- Guenther, L.E.; Turgeon, T.R.; Bohm, E.R.; Brandt, J.M. The biochemical characteristics of wear testing lubricants affect polyethylene wear in orthopaedic pin-on-disc testing. Proc. Inst. Mech. Eng. Part H 2015, 229, 77–90. [Google Scholar] [CrossRef] [PubMed]
- Widmer, M.R.; Heuberger, M.; Vörös, J.; Spencer, N.D. Influence of polymer surface chemistry on frictional properties under protein-lubrication conditions: Implications for hip-implant design. Tribol. Lett. 2001, 10, 111–116. [Google Scholar] [CrossRef]
- Karuppiah, K.S.K.; Sundararajan, S.; Xu, Z.H.; Li, X. The effect of protein adsorption on the friction behavior of ultra-high molecular weight polyethylene. Tribol. Lett. 2006, 22, 181–188. [Google Scholar] [CrossRef]
- More, N.S.; Diomidis, N.; Paul, S.N.; Roy, M.; Mischler, S. Tribocorrosion behavior of β titanium alloys in physiological solutions containing synovial components. Mater. Sci. Eng. C 2011, 31, 400–408. [Google Scholar] [CrossRef]
- Wang, A.; Essner, A.; Stark, C.; Dumbleton, J.H. Comparison of the size and morphology of UHMWPE wear debris produced by a hip joint simulator under serum and water lubricated conditions. Biomaterials 1996, 17, 865–871. [Google Scholar] [CrossRef]
- Brandt, J.M.; Charron, K.D.J.; MacDonald, S.J.; Medley, J.B. Mass gain behaviour of tibial polyethylene inserts during soak testing. Proc. Inst. Mech. Eng. Part H 2011, 225, 324–331. [Google Scholar] [CrossRef]
- Mabrey, J.D.; Afsar-Keshmiri, A.; Engh, G.A.; Sychterz, C.J.; Wirth, M.A.; Rockwood, C.A.; Mauli Agrawal, C. Standardized analysis of UHMWPE wear particles from failed total joint arthroplasties. J. Biomed. Mater. Res. 2002, 63, 475–483. [Google Scholar] [CrossRef] [PubMed]
- Tipper, J.L.; Galvin, A.L.; Williams, S.; McEwen, H.M.J.; Stone, M.H.; Ingham, E.; Fisher, J. Isolation and characterization of UHMWPE wear particles down to ten nanometers in size from in vitro hip and knee joint simulators. J. Biomed. Mater. Res. Part A 2006, 78, 473–480. [Google Scholar] [CrossRef] [PubMed]
- Elfick, A.P.D.; Green, S.M.; Krikler, S.; Unsworth, A. The nature and dissemination of UHMWPE wear debris retrieved from periprosthetic tissue of THR. J. Biomed. Mater. Res. Part A 2003, 65, 95–108. [Google Scholar] [CrossRef] [PubMed]
- Šlouf, M.; Šloufová, I.; Horák, Z.; Štépánek, P.; Entlicher, G.; Krejčík, M.; Radonský, T.; Pokorný, D.; Sosna, A. New fast method for determination of number of UHMWPE wear particles. J. Mater. Sci. Mater. Med. 2004, 15, 1267–1278. [Google Scholar] [CrossRef] [PubMed]
- Billi, F.; Benya, P.; Kavanaugh, A.; Adams, J.; Ebramzadeh, E.; McKellop, H. The John Charnley award: An accurate and sensitive method to separate, display, and characterize wear debris: Part 1: Polyethylene particles. Clin. Orthop. Relat. Res. 2012, 470, 329–338. [Google Scholar] [CrossRef] [PubMed]
- Brandt, J.M.; Vecherya, A.; Guenther, L.E.; Koval, S.F.; Petrak, M.J.; Bohm, E.R.; Wyss, U.P. Wear testing of crosslinked polyethylene: Wear rate variability and microbial contamination. J. Mech. Behav. Biomed. Mater. 2014, 34, 208–216. [Google Scholar] [CrossRef] [PubMed]
- Wimmer, M.A.; Sah, R.; Laurent, M.P.; Virdi, A.S. The effect of bacterial contamination on friction and wear in metal/polyethylene bearings for total joint repair—A case report. Wear 2013, 301, 264–270. [Google Scholar] [CrossRef]
© 2015 by the authors; licensee MDPI, Basel, Switzerland. This article is an open access article distributed under the terms and conditions of the Creative Commons Attribution license (http://creativecommons.org/licenses/by/4.0/).
Share and Cite
Bortel, E.L.; Charbonnier, B.; Heuberger, R. Development of a Synthetic Synovial Fluid for Tribological Testing. Lubricants 2015, 3, 664-686. https://doi.org/10.3390/lubricants3040664
Bortel EL, Charbonnier B, Heuberger R. Development of a Synthetic Synovial Fluid for Tribological Testing. Lubricants. 2015; 3(4):664-686. https://doi.org/10.3390/lubricants3040664
Chicago/Turabian StyleBortel, Emely Lea, Baptiste Charbonnier, and Roman Heuberger. 2015. "Development of a Synthetic Synovial Fluid for Tribological Testing" Lubricants 3, no. 4: 664-686. https://doi.org/10.3390/lubricants3040664