1. Introduction
Bearings have made important contributions to almost all industries that use machinery. Almost every machine includes bearings as an important part. For example, over one hundred bearings are used in automobiles. Without bearings, automobiles cannot function well. Bearings can be classified according to the motion allowed or the direction of load applied to the part or types of operation. The most important aspect of a bearing is using it for a long time with initial precision. The precision of the bearing is very important, especially for thrust bearings. Usually, thrust bearings aid in smoothing the operation and supporting the load. However, various kinds of wear will occur during their use. Currently, bearing life is calculated according to ISO 281. According to ISO, the life of a bearing is calculated by a geometric factor, the contact angle of the rollers and the ratio between the roller and race. The failure of the bearing is judged as the first appearance of spalling in the roller and the race.
There have been a number of studies on the mechanism of spalling initiation and propagation in the rolling contact. Chiu
et al., (1970) analyzed the rolling contact fatigue that resulted from spalling in the material sub-surface according to stress concentration [
1]. Laird II
et al., inferred crack patterns caused by residual stress and Hertzian impact stress in the rolling contact. The crack initiation and propagation was introduced by tensile stress [
2]. Ding
et al., derived a spalling depth prediction model based on the ligament collapse spalling mechanism [
3]. Slack
et al., introduced a spalling initiation mechanism based on Hertzian pressure and a spalling propagation direction mechanism related to the friction directions [
4]. Warhadpande
et al., verified the effect of strain and stress in spalling by performing a fatigue test [
5]. Weinzapfel
et al., derived a spalling simulation in the material sub-surface by applying a fatigue damage model [
6]. Furthermore, several studies were done to predict bearing contact mechanism and failure. Pandiyarajan
et al., applied non-linear Hertzian contact theory in order to simulate the stress variation of a bearing [
7]. Singh
et al., introduced a non-linear analysis model of a bearing, which generates vibration according to the defect related impulsive forces [
8].
However, there is no practical research that predicts the actual failure of a bearing. In the field, it is important to predict when the failure will occur. The life calculated by ISO 281 can be referenced, but in reality, the run-out of the machine is the value that is used to judge the failure of a thrust bearing. Run-out is an inaccuracy of the rotating mechanical system, specifically, when the tool or shaft does not rotate exactly in line with the main axis. When spalling occurs on a bearing, a small amount of gap occurs between the roller and the race, which leads to run-out.
The reason why run-out is used to judge the failure of the bearing is that run-out is the actual value that affects precision. Also, it is impossible to take the bearing apart to check if spalling has occurred during its use. Despite the importance of run-out, there have only been a few studies on it. Kline and DeVor investigated the effect of run-out on the performance of end milling. They showed that the presence of run-out increases the average chip thickness and force on the machine [
9].
The purpose of this study is to predict the failure of the thrust bearing. Wear can be divided into two kinds: Linear and non-linear. Gradual wear that occurs due to surface contact is linear wear, and failure such as spalling is non-linear wear. In this paper, linear wear refers to abrasive wear. In order to find the coefficients of the linear and non-linear wear models, a pin-on-disc test and a bearing wear test were performed. With these wear models, the linear and non-linear wear of the bearing roller and race were calculated. The results of the geometry and run-out were compared to validate the wear models.
2. Bearing Wear
Wear that occurs in a bearing is caused by many reasons, such as the absence of lubrication, the contamination or deviation of the shaft or housing, and so on. The phenomenon of wear on a bearing can be divided into linear wear and non-linear wear. Linear wear gradually reduces the material’s surface, mainly due to the friction force. When the material’s surface becomes coarse and the rotation becomes instable, spalling may occur due to the propagation of the fatigue crack in the contact surfaces. This is non-linear wear phenomenon. Non-linear wear is inevitable, even in normal operation conditions, because of material fatigue. In order to predict bearing failure, both linear and non-linear wear have to be investigated. The following section explains the models.
2.1. Linear Wear
2.1.1. Linear Wear Model
Linear wear of the material is influenced by the load and sliding on the surface. Archard established a wear model to define the linear relationship between the loads and wear ratio, as shown in Equation (1). Through Archard’s wear model, the abrasive wear of the material can be predicted.
In this equation,
V is the volume of the wear and
s is the sliding distance.
FN,
H and
k are the normal load, hardness and the wear coefficient, respectively. In order to increase the degrees of freedom, Rhee used a modified Archard wear model, as shown in Equation (2) [
10]. In this way, material characteristics can be applied to the model.
W is the wear depth and
v is the sliding velocity.
P,
H and
k are the normal pressure, the hardness and the wear coefficient, respectively.
a,
b and
c are the wear constants. However, when two surfaces are in contact, the roughness of the surfaces also matters. Therefore, a roughness term is applied to the linear wear model, as shown in Equation (3).
W is the wear depth. Cw and iw are the constants. As the gradual wear depth increases, the roughness of the surface will get coarse and the wear rate will increase. By using this proposed linear wear model, the increase in wear rate according to roughness can be considered.
2.1.2. Pin-On-Disc Test
In order to determine the coefficients of the proposed linear wear model, a pin-on-disc test was performed. According to the ASTM G99 standard, this test is carried out at the selected constant parameters as the total sliding distance, the normal load on the pin and the sliding velocity [
11]. So [
12] found that the amount of wear will be dominated by the pin, whichever is rotating when the pin and the disc are made of the same material. Therefore, the wear of the disc is negligible.
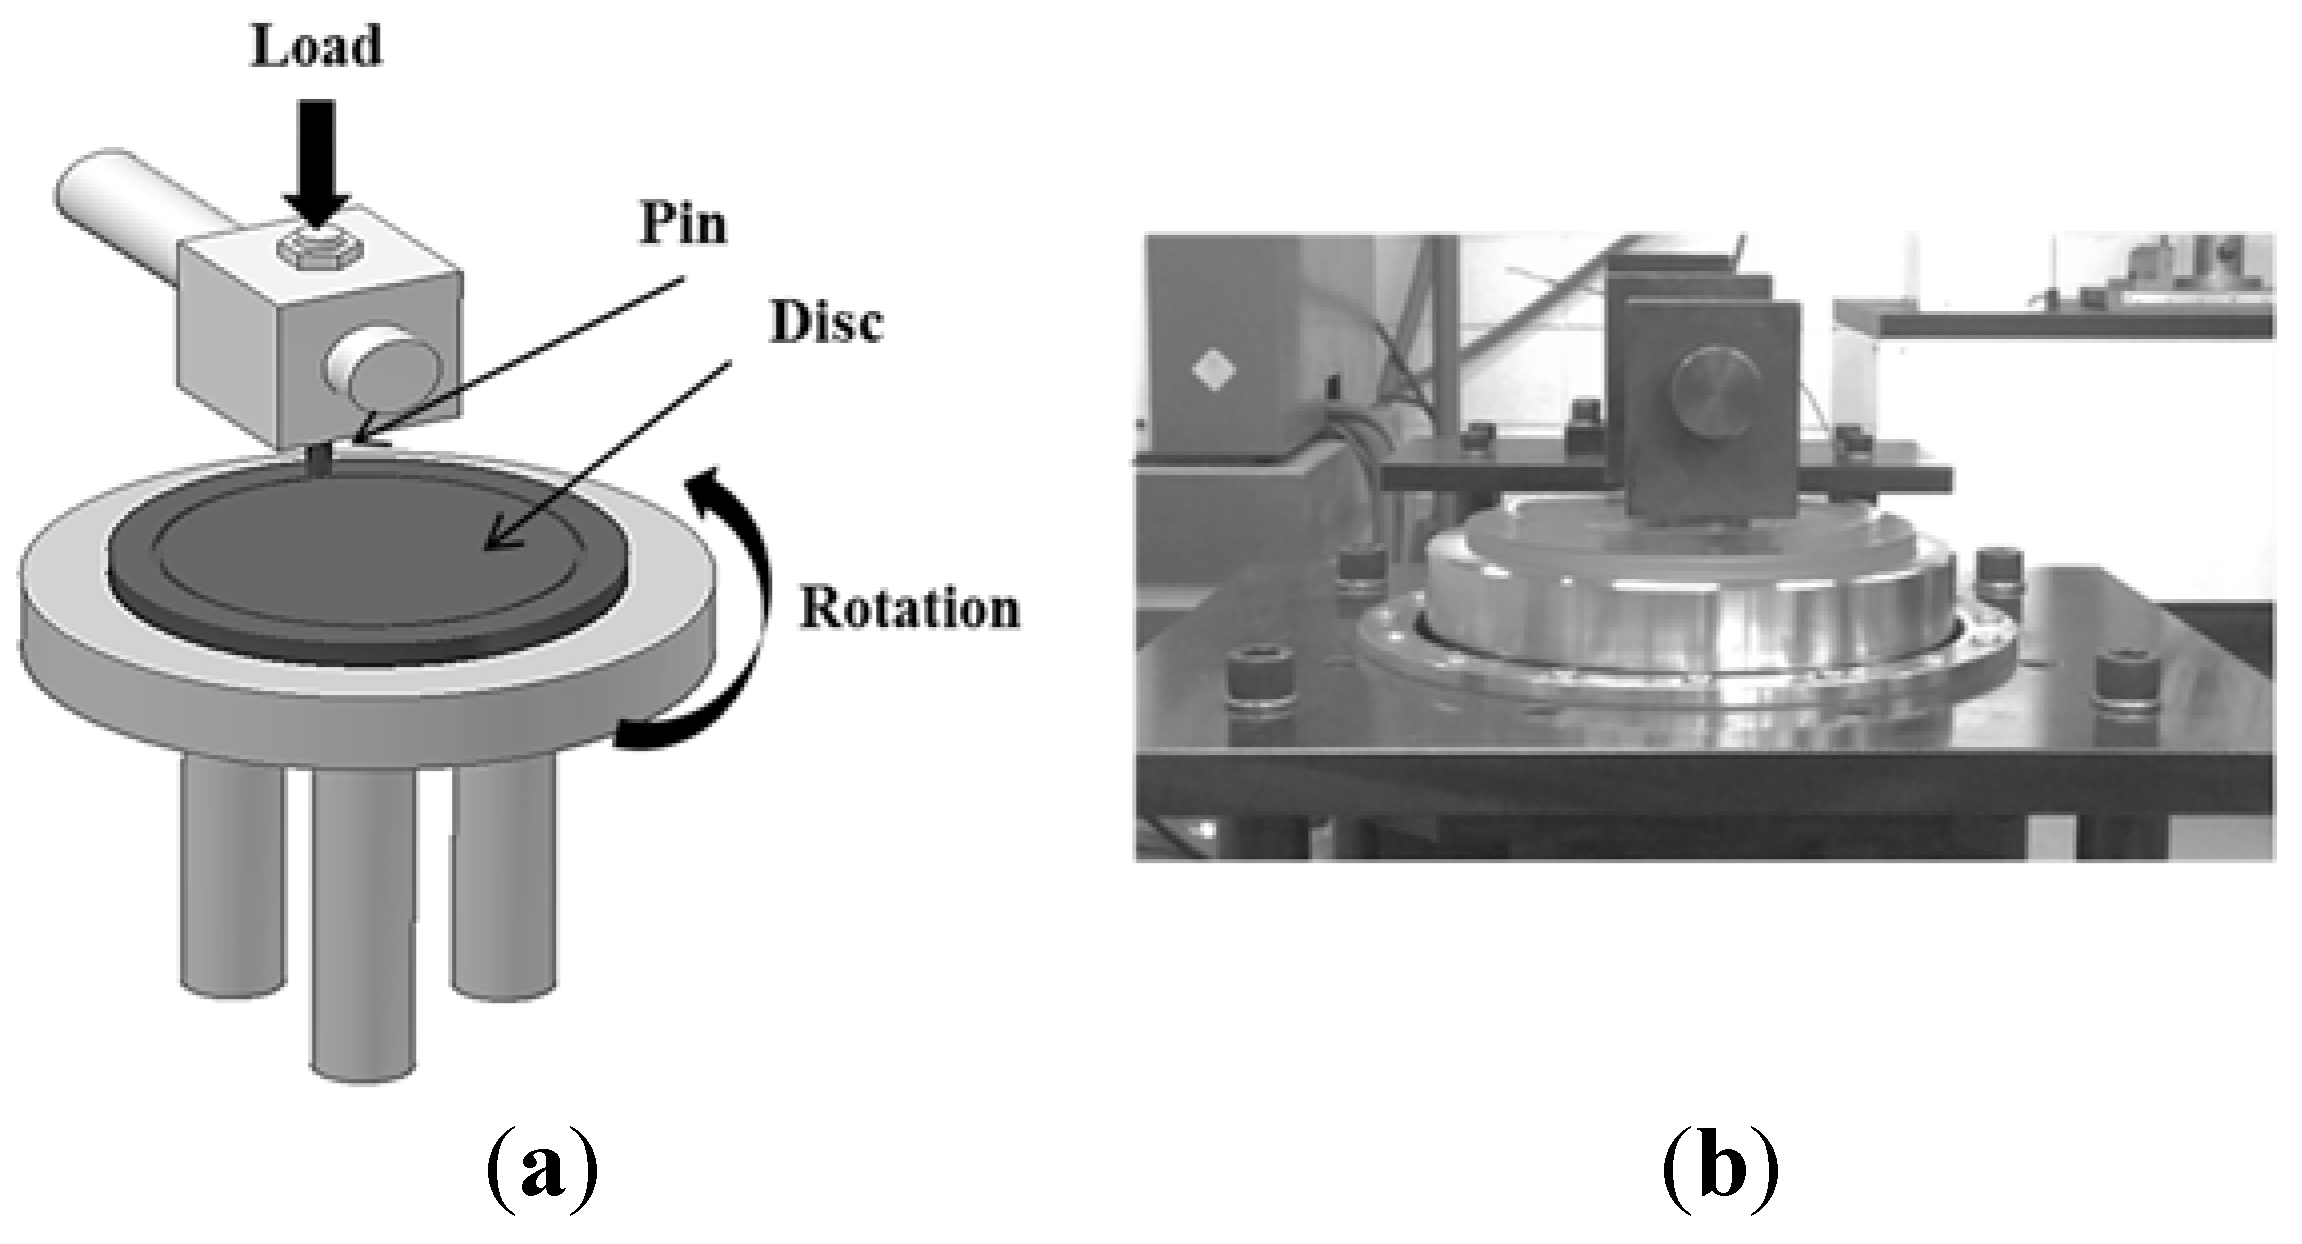
The schematic of the pin-on-disc test and a photograph of the test machine are shown in
Figure 1. The pin is the roller and the disc is the race of the bearing. The material of the pin and disc is both SUJ2, so only the wear of the pin is considered. Six cases total were tested and each test was repeated three times. The controlled test parameters were the load and velocity, as shown in
Table 1.
Figure 1.
(a) Schematic of pin-on-disc test; (b) Pin-on-disc testing machine.
Figure 1.
(a) Schematic of pin-on-disc test; (b) Pin-on-disc testing machine.
Table 1.
Pin-on-disc test.
Table 1.
Pin-on-disc test.
| | Load (kgf) | Velocity (RPM) |
|---|
| Level 1 | 100 | 250 |
| Level 2 | 150 | 500 |
| Level 3 | 200 | - |
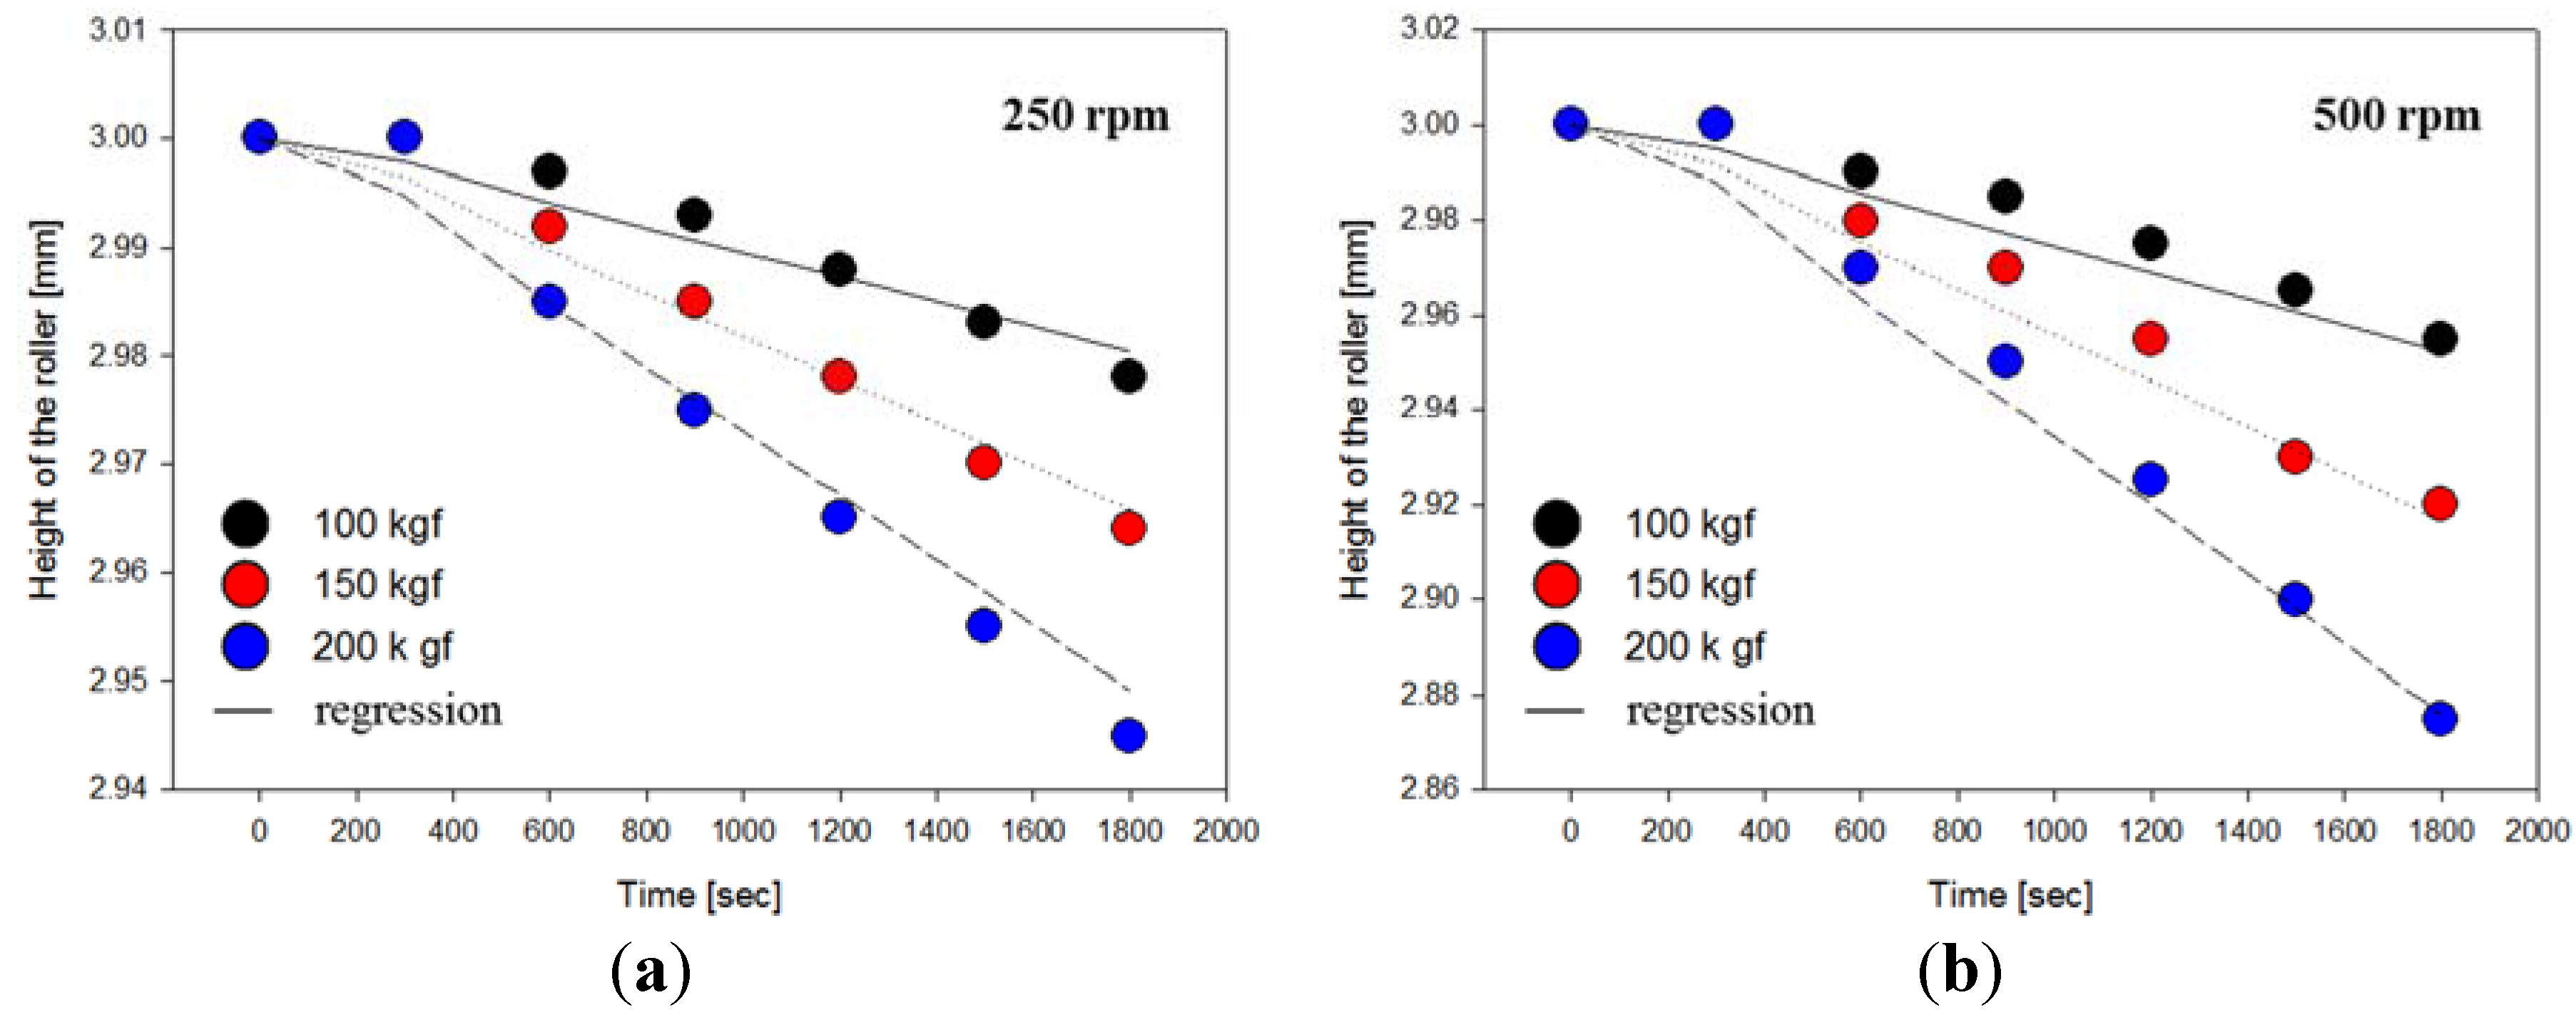
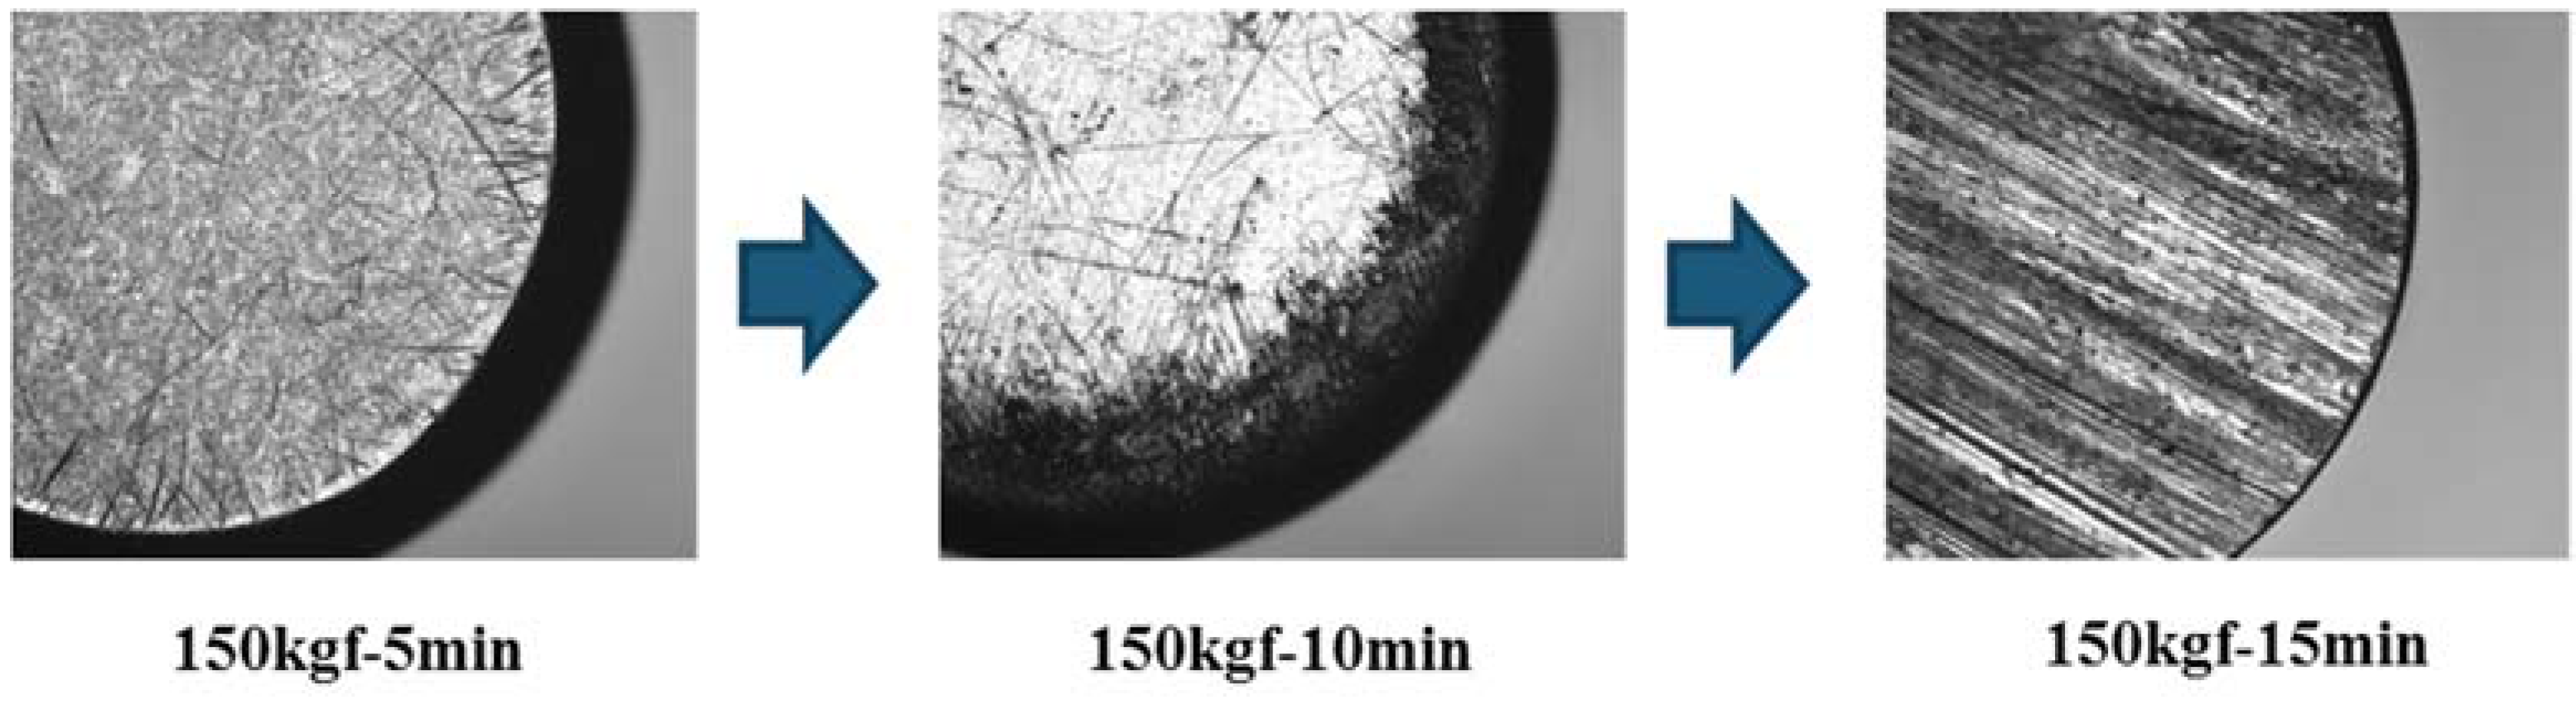
The pin is a cylindrical shape, with an initial height and diameter of 3 mm. Every five minutes, the height of the pin was measured. The surface of the pin was observed using a microscope, as shown in
Figure 2. It shows that as the time increases, the surface of the pin gets rough. The change in the roller’s height is shown as dots in
Figure 3. For a certain amount of time, the pin’s height does not change. After that, the decrease in height is linear. The results were used to fit Equation (3). As a result, Equation (4) was obtained. The regression line is drawn in
Figure 3. The difference between the experiment results and the fitted curve was 0.2%. Therefore, the linear wear model can be determined as Equation (4).
Figure 2.
Worn surface of the pin.
Figure 2.
Worn surface of the pin.
Figure 3.
Height of the roller at (a) 250 rpm, (b) 500 rpm.
Figure 3.
Height of the roller at (a) 250 rpm, (b) 500 rpm.
2.2. Non-Linear Wear
2.2.1. Non-Linear Wear Model
Non-linear wear is influenced by the damage of secondary tensile stress in the sub-surface. Therefore, a modified Cockcroft-Latham damage model was used to represent non-linear wear. Several studies have represented spalling of bearing by void growth which considers rolling bearing steel as a ductile material [
2,
4]. The Cockcroft-Latham damage model has been applied to predict ductile failure.
In this study, a normalized Cockcroft-Latham model was modified to simulate non-linear wear. Since spalling is the fatigue phenomenon, damage can be accumulated in the elastic range as well. Therefore, the total strain was considered. Also, spalling increases exponentially from initiation. So the exponent was applied to the non-linear wear model, as shown in Equation (5).
is the maximum principal stress and
is the effective stress.
and
stand for the critical damage effective strain and total strain, respectively. The proposed non-linear wear model can accumulate damage in the elastic range. If the damage reaches the critical value α, the material is assumed to be fractured.
2.2.2. Bearing Wear Test
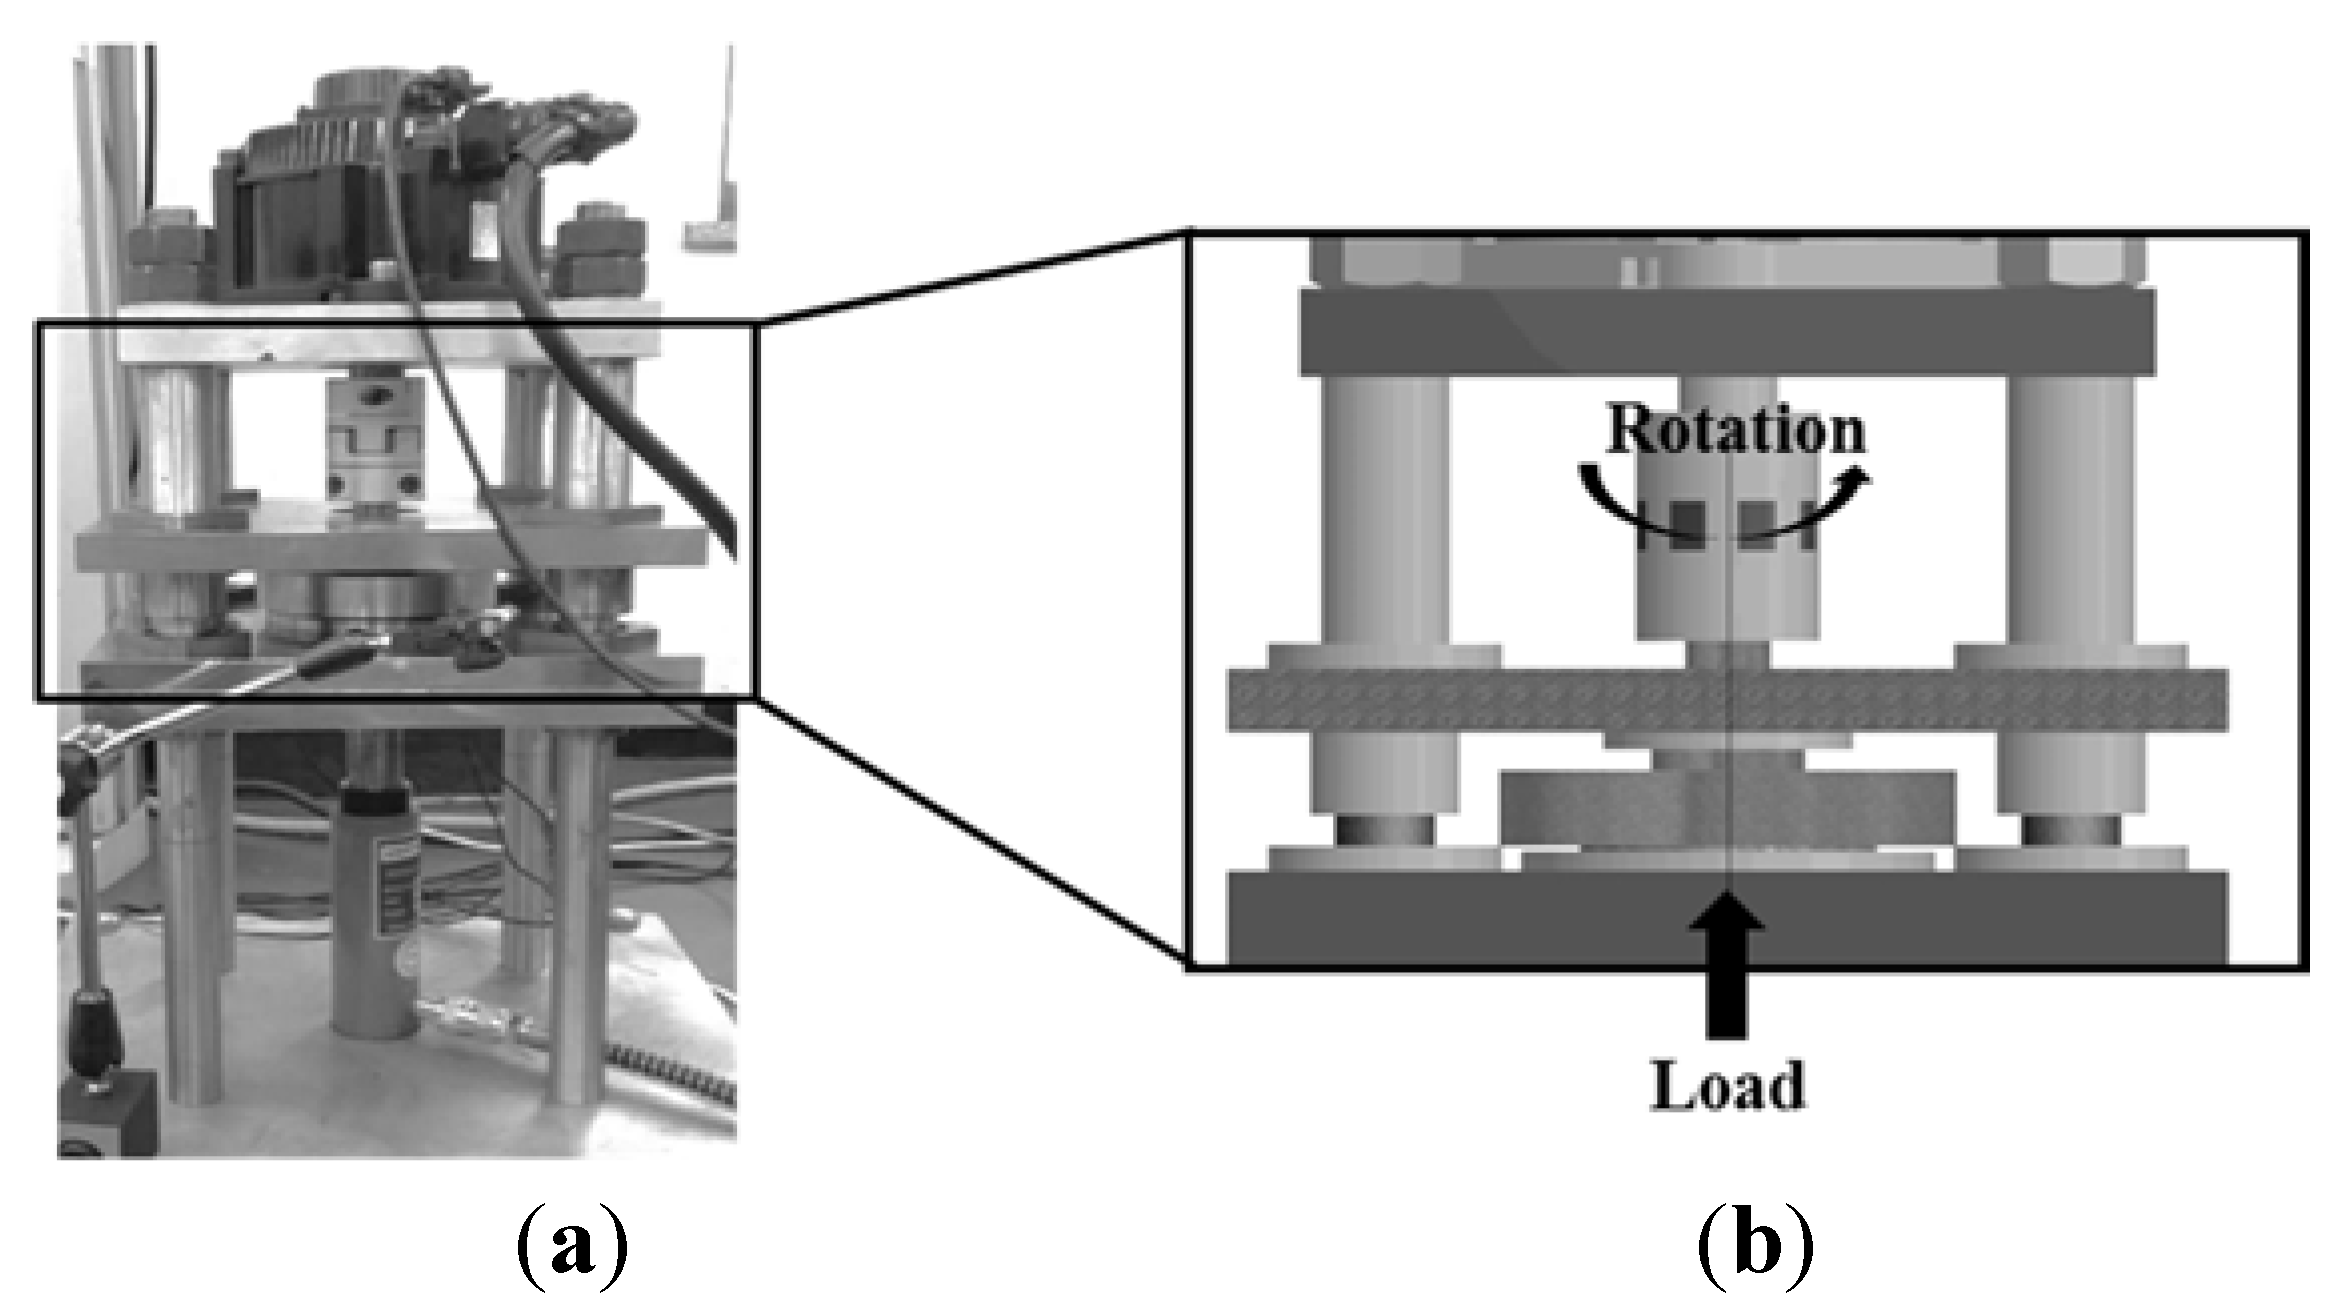
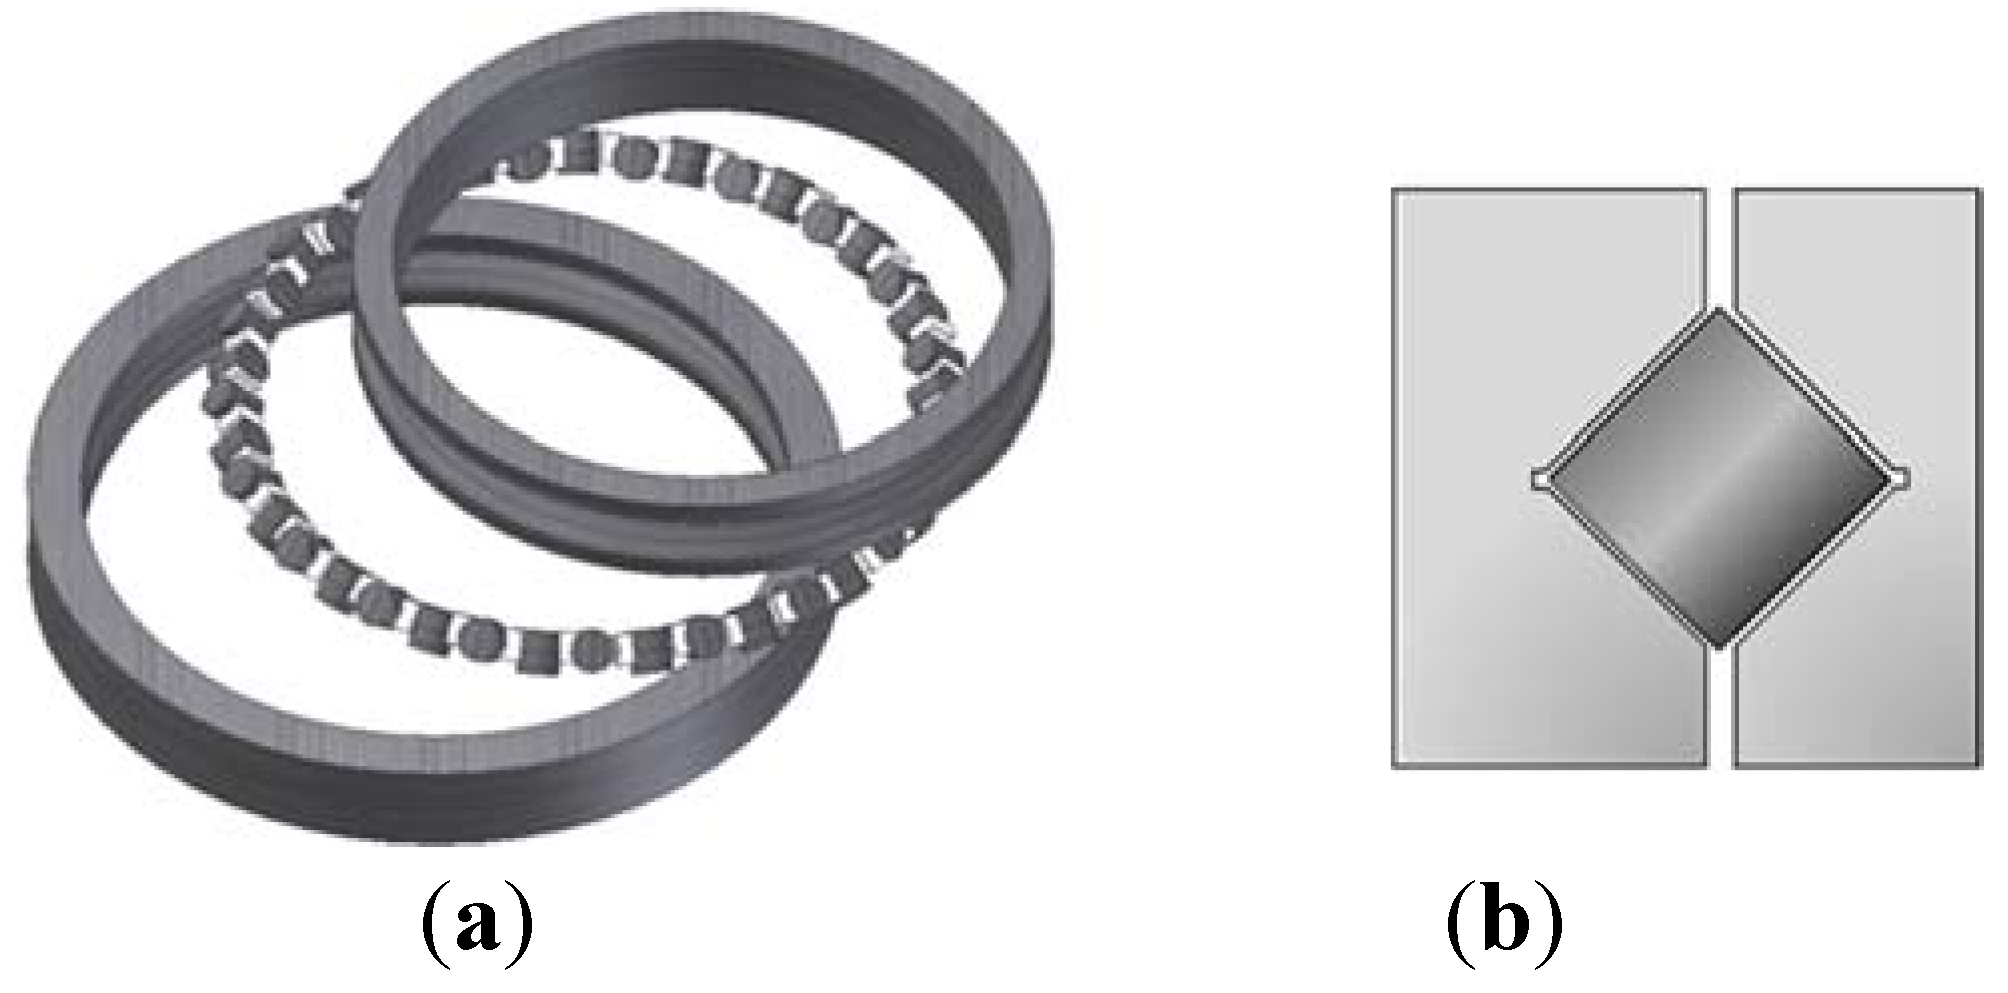
In order to determine the critical value and α of the non-linear wear model, a cross roller bearing wear test was performed. The bearing test machine was designed as shown in
Figure 4. The cross roller bearing was loaded by the hydraulic cylinder. The applied load on the bearing was measured by the load cells on the wear machine, and the motor rotated the bearing as shown in
Figure 4b. The rotation velocity was controlled by the motor.
Figure 4.
(a) Bearing wear testing machine; (b) Schematic of bearing wear test.
Figure 4.
(a) Bearing wear testing machine; (b) Schematic of bearing wear test.
In order to obtain quantitative results to validate the non-linear wear, the run-out was measured by a dial gauge. Non-linear wear predicts the propagation of the material. However, it is impossible to measure the propagation of the bearing because it occurs randomly. Therefore, run-out, which is the radial and axial vibration in equipment operation, is measured. The cause of the vibration is the change in the clearance of the bearing, and the clearance changes because of the propagation occurring on the bearing roller and race.
The shaft diameter of the test bearing was 50 mm and the outer diameter was 66 mm. The test loading conditions were set to a total of four different conditions. The rotation speed was 400 rpm for all four conditions. These conditions were chosen as a percentage of the rated load, as shown in
Table 2. The run-out was measured at every 40,000 cycles before the rating life, which was calculated according to ISO 281. After that, the run-out was measured at every 20,000 cycles.
Table 2.
Bearing wear test.
Table 2.
Bearing wear test.
| | Conditions |
|---|
| Test number | 1 | 2 | 3 | 4 |
| Percentage of rated load (%) | 200 | 150 | 100 | 75 |
| Applied load (kgf) | 1020 | 765 | 510 | 383 |
Using the run-out data obtained from the experiment, the critical value and α were determined through the Taguchi method. Three levels of critical value and α were selected. Then, the run-out was calculated at the measured cycle during the simulation technique described in the following section. Then the values were optimized. The steps and the results are explained in the following section.
3. Simulation Technique
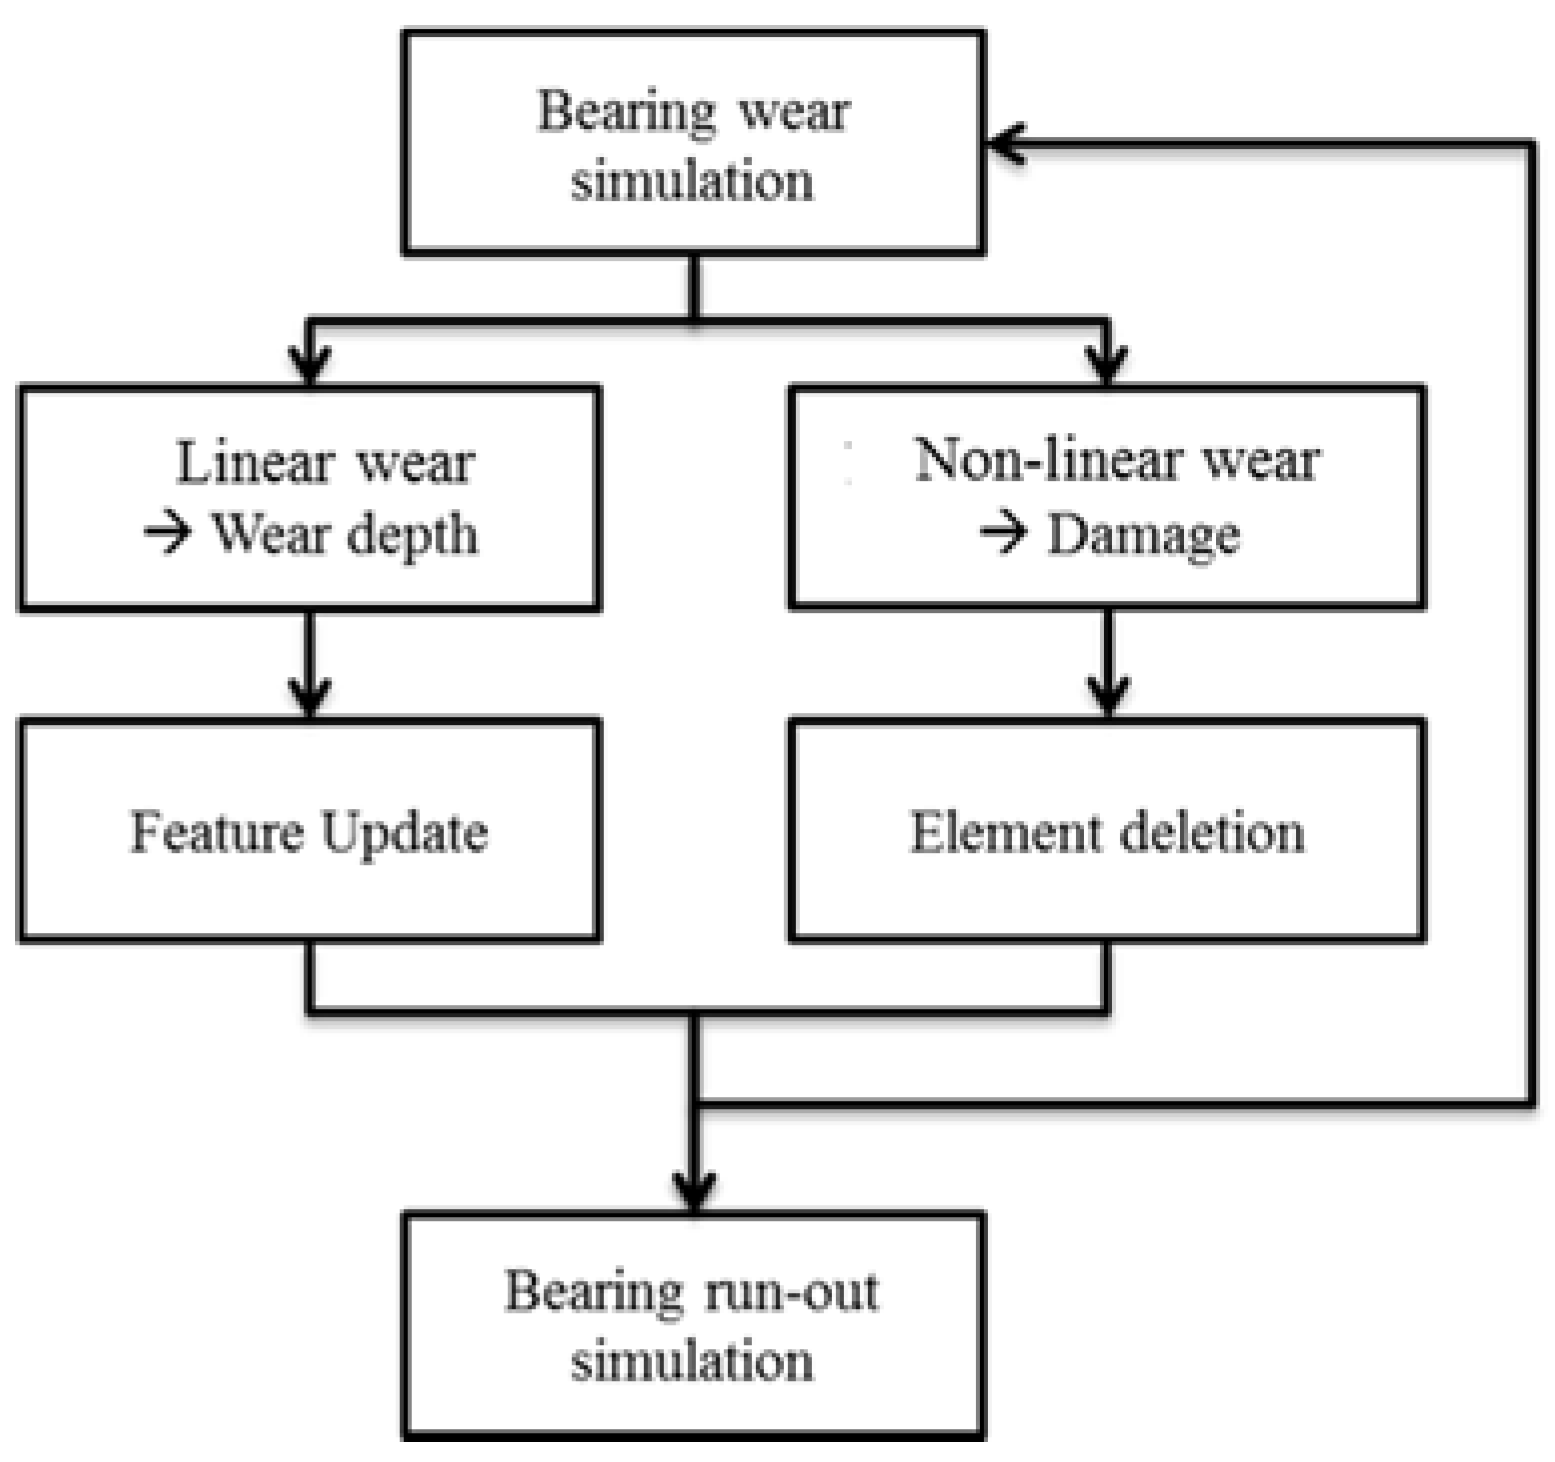
The wear of a bearing occurs when it is used for a long time. However, it is inefficient to simulate every cycle to predict bearing wear. The roughness of the surface also has to be considered in a simulation. Therefore, we used extrapolation to predict the wear, and the geometry of the bearing was updated so that the effects of roughness or propagation could be considered. This simulation technique is proposed to calculate wear efficiently. The simulation procedure is shown in
Figure 5.
Figure 5.
Simulation procedure.
Figure 5.
Simulation procedure.
First, the bearing wear was simulated. Linear and non-linear wear models are applied to the DEFORM 3D user subroutine. Tetra mesh is used and the average element size is 0.25 mm. The size of the element is chosen according to the size of the spalling that occurred during the bearing wear test. Operation conditions, such as load and rpm, are applied as boundary conditions. The cross roller bearing is modeled as shown in
Figure 6a. The cross section of the bearing is shown in
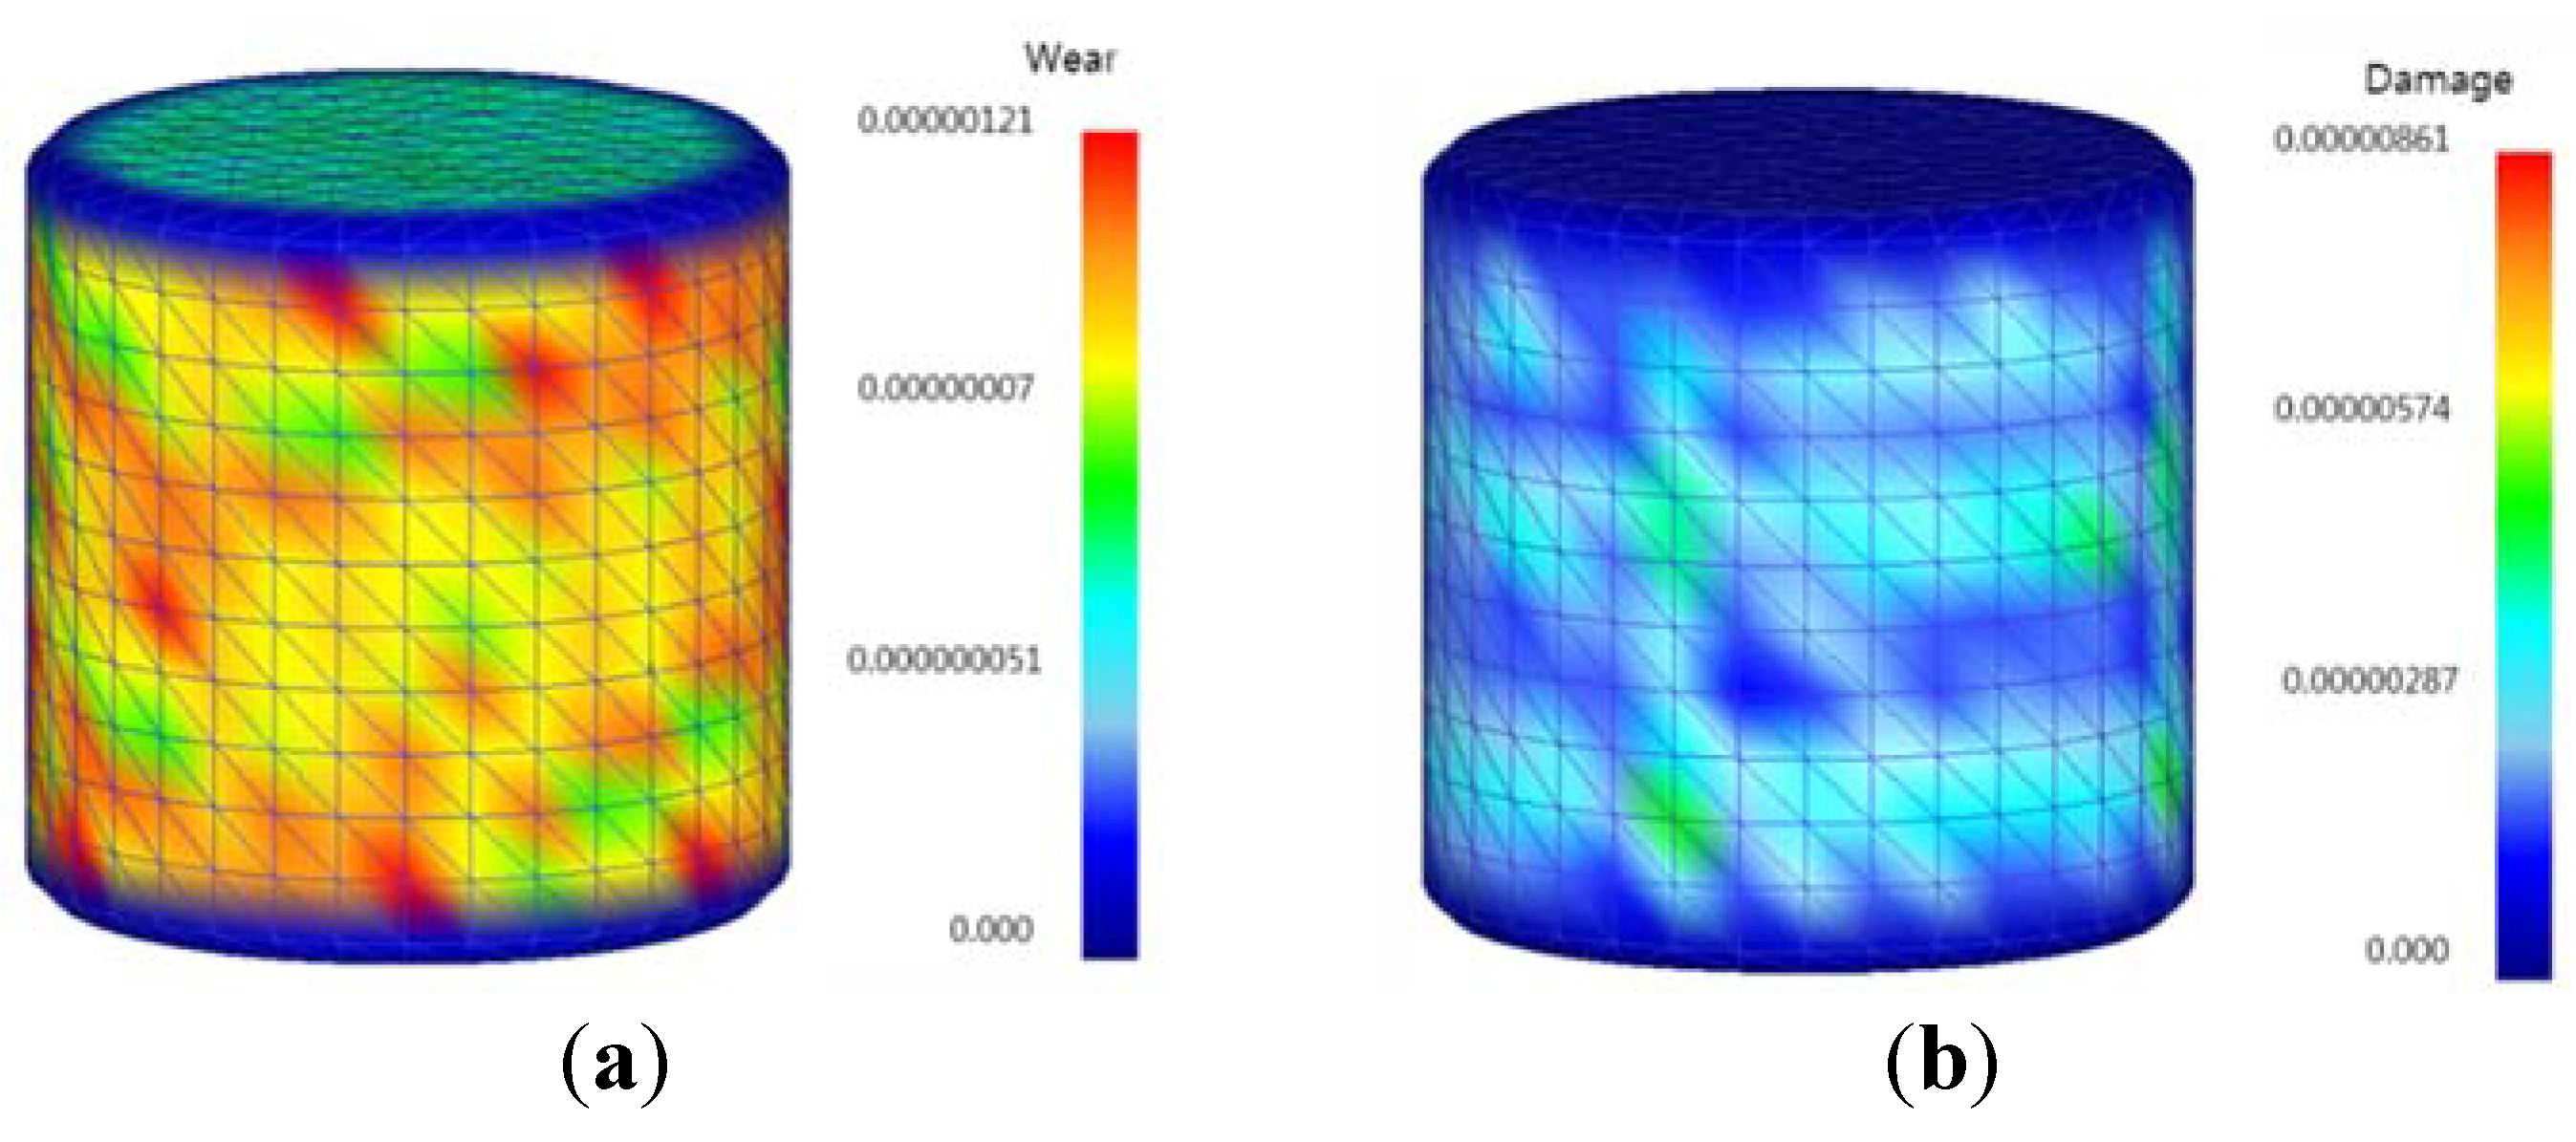
Figure 6b. Load and rotation speed are given to the rigid body that constrains the bearings. The simulation is done until the roller fully rotates itself. When the simulation is done, the roller and race have calculated values of the linear wear and non-linear wear, which is the wear depth and damage as shown in
Figure 7. The linear wear occurs on both cylindrical surface and flat surface of the rollers.
Figure 6.
(a) Cross roller bearing model; (b) Cross section of cross roller bearing.
Figure 6.
(a) Cross roller bearing model; (b) Cross section of cross roller bearing.
Figure 7.
Simulation results. (a) Linear wear. (b) Non-linear wear.
Figure 7.
Simulation results. (a) Linear wear. (b) Non-linear wear.
The next step is updating the geometry of the roller and the race. Since the simulation is done until the roller fully rotates itself, the values must be converted to one cycle. Then the amount of wear is re-calculated by multiplying the cycle. In this study, we multiplied the number of the cycle at which the wear was measured. So, the values obtained in the first simulation were multiplied by 4000, which was the cycle when we measured the wear. Then linear wear, which is the depth calculated for each node, is updated. For linear wear, damage is accumulated in each element. Then the re-calculated damage for each element is compared with the critical value. When the damage values exceed the critical value, the element is deleted.
When the geometry update is done, it is applied to the model and the bearing wear simulation is performed again. This is repeated until the last measured cycle.
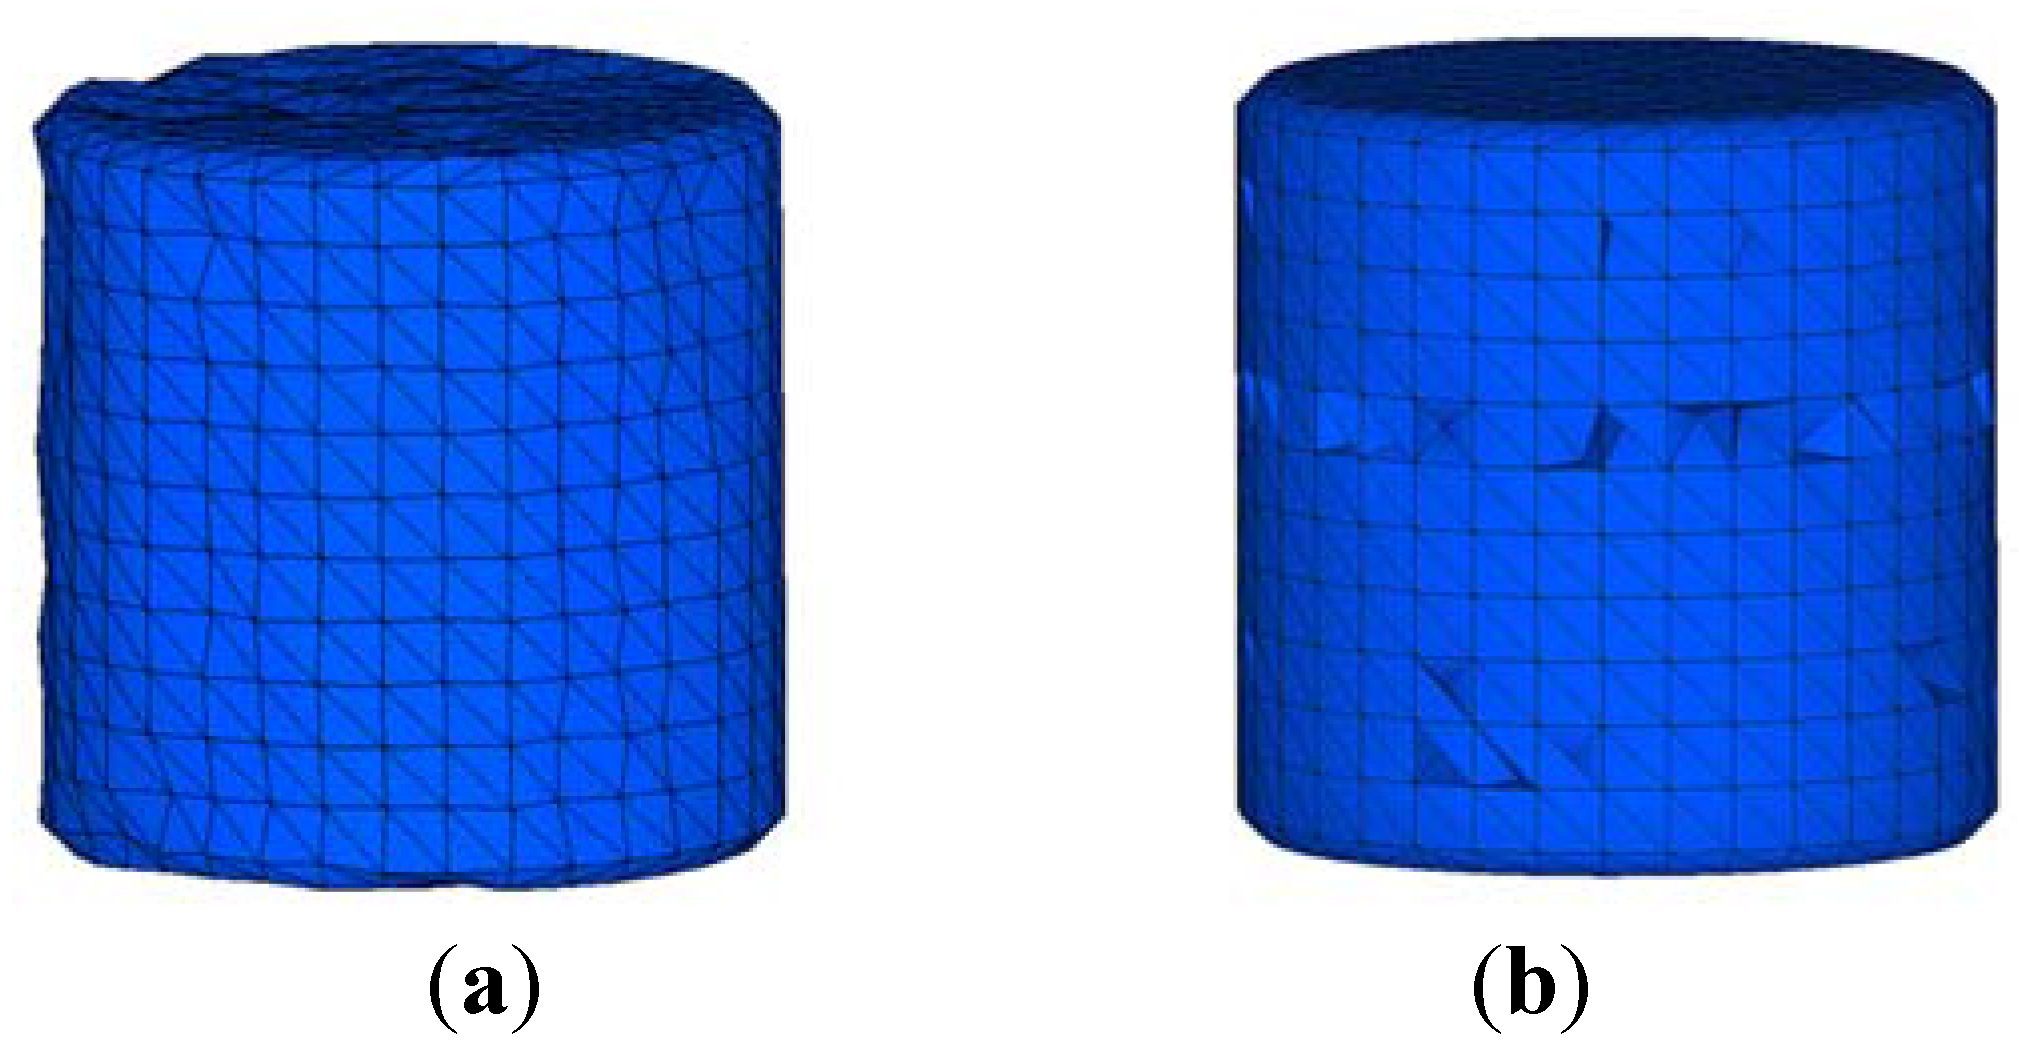
Figure 8 shows an example of the updated linear wear and the non-linear wear’s geometry update. It is done when the applied load is 765 kgf and cycle 400,000 has operated. The run-out of the bearing is calculated separately. When the geometry of the roller is determined, the clearance and maximum displacement of the bearing housing can be calculated. Then it can be converted to the amount of run-out.
Figure 8.
Geometry updates. (a) Linear wear; (b) Non-linear wear.
Figure 8.
Geometry updates. (a) Linear wear; (b) Non-linear wear.
Determination of Coefficients for the Non-Linear Wear Model
Through the simulation technique, the coefficient of the non-linear model can be determined. First, three levels of critical values and α are determined, as shown in
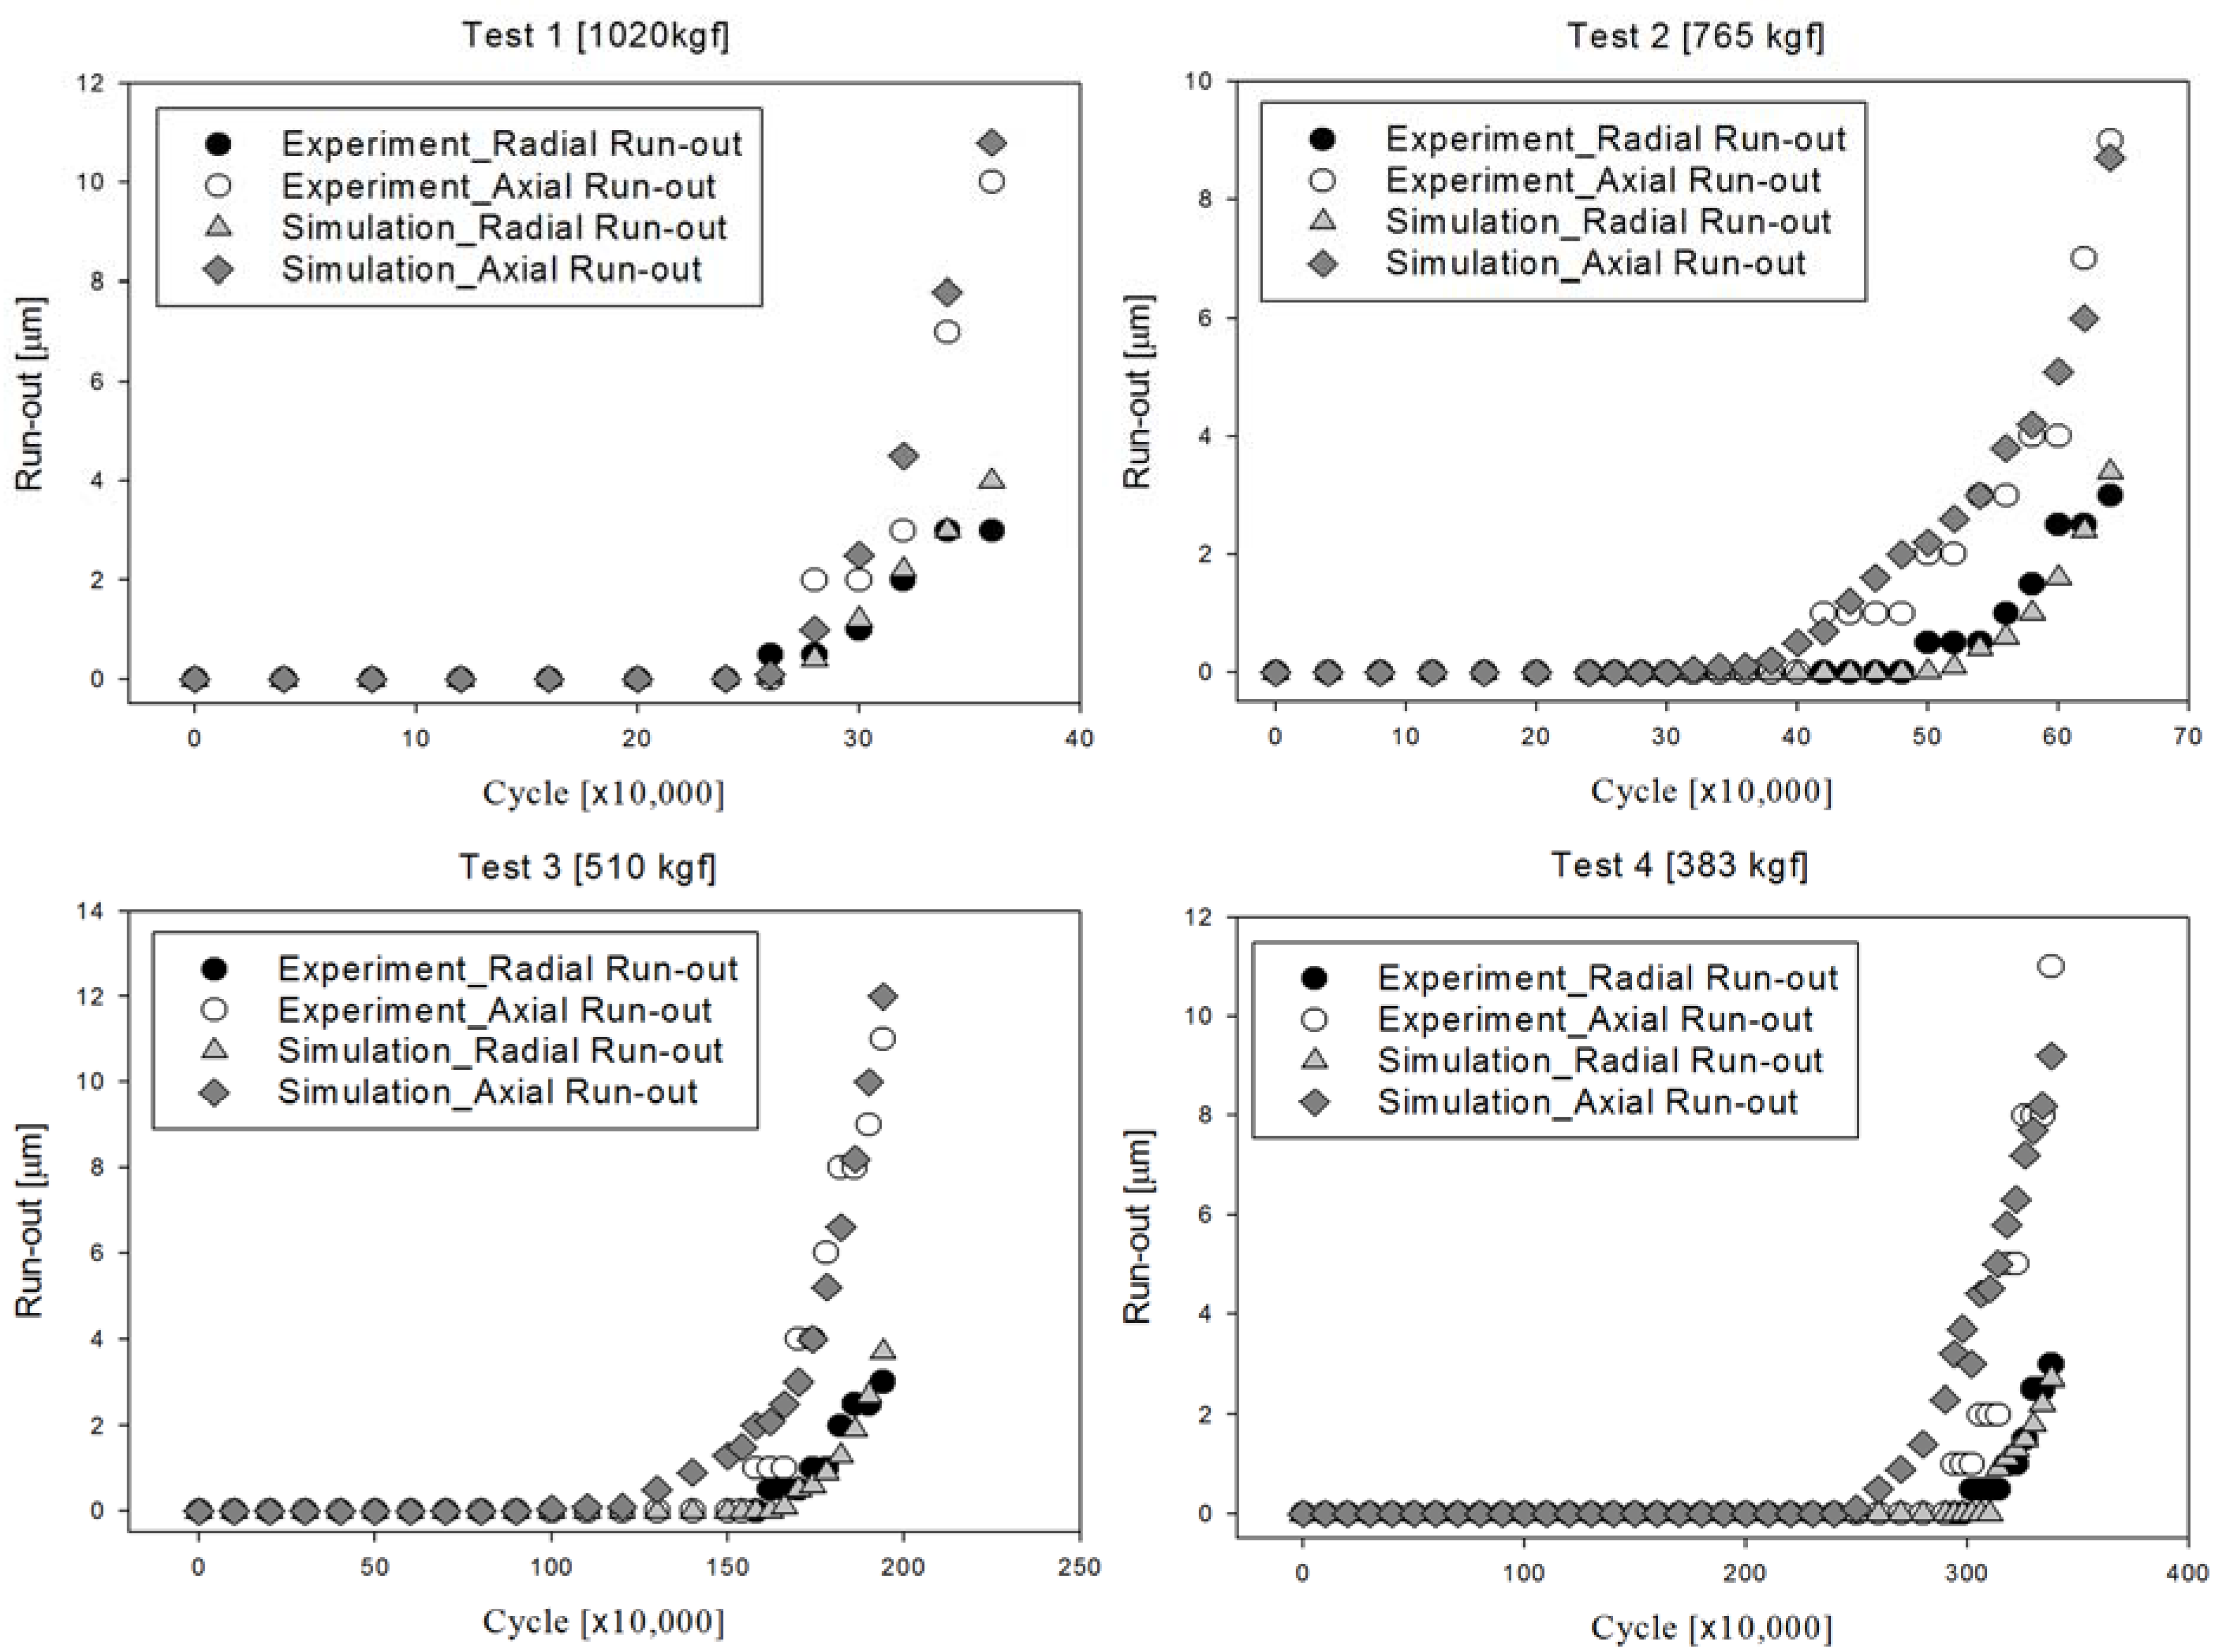
Table 3. Using the Taguchi method, a total of nine cases are selected. Then, through the simulation technique described in the previous section, run-out is calculated. The difference between the calculated value and the experiment is the response to optimize. This procedure is performed for four test conditions. The critical value and α that optimize test number one through three are 0.63 and 2.3, respectively. Since the simulation technique involves feature update and element deletion, the size of the element can be an important factor. Therefore if the average size of the element is different, then the critical value and α must be optimized again.
The run-out for each test condition is calculated with simulation. Average sliding velocity and pressure on the roller is as shown in
Table 4.
Figure 9 shows the experiment and calculated run-out for each test condition.
Table 3.
Bearing wear test conditions.
Table 3.
Bearing wear test conditions.
| | Level |
|---|
| Critical value | 0.3 | 0.5 | 0.7 |
| α | 1 | 2 | 3 |
Table 4.
Sliding velocity and pressure on cylindrical and flat part of the roller.
Table 4.
Sliding velocity and pressure on cylindrical and flat part of the roller.
| Load (kgf) | Sliding Velocity (mm/sec) | Pressure (MPa) |
|---|
| Cylindrical Part | Flat Part | Cylindrical Part | Flat Part |
|---|
| 1020 | 1270 | 1240 | 16100 | 15900 |
| 765 | 1250 | 1220 | 12000 | 11200 |
| 510 | 1220 | 1190 | 7850 | 7790 |
| 383 | 1210 | 1180 | 5830 | 5250 |
Figure 9.
Comparison of run-out for the test conditions (shaft 50 mm).
Figure 9.
Comparison of run-out for the test conditions (shaft 50 mm).
4. Wear Model Validation
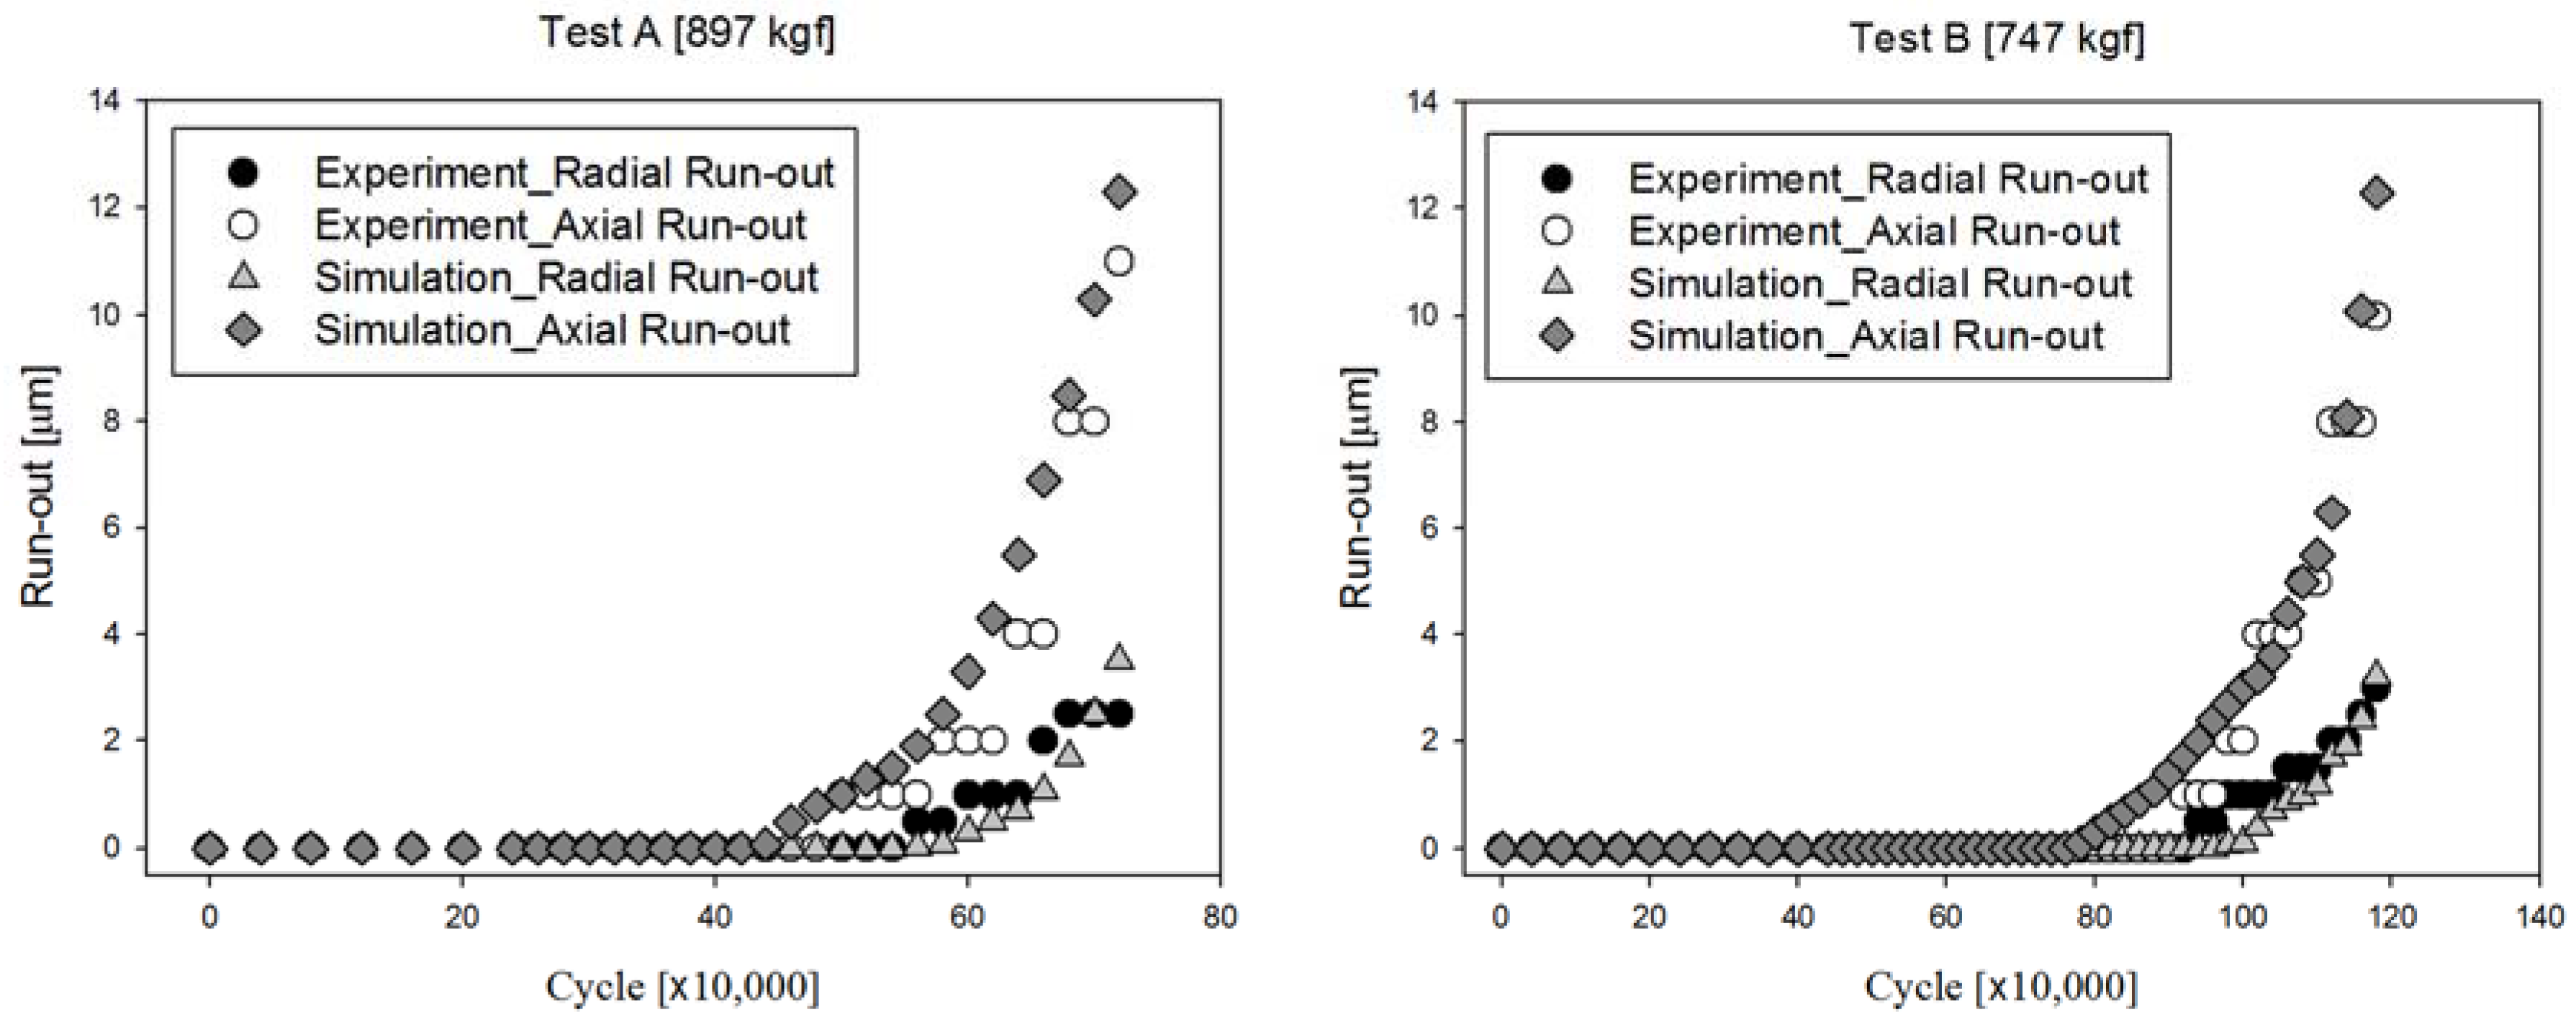
In order to validate the wear models, a cross roller bearing with a shaft diameter of 70 mm was tested. Two test conditions, applying 897 kgf and 747 kgf, were performed. The rotation speed was 400 rpm for both conditions. The simulation was done according to the technique described in
Section 3. The results of the run-out are shown in
Figure 10. The difference between the experiment and the simulation was 6%.
The simulation results start to predict the run-out earlier than the experiment results. This can be due to the precision of the indicator or other environmental factors. Also, run-out calculated by simulation increases gradually due to extrapolation. During the experiment, run-out does not increase during every step, but at about every other measured point. Bearing life is determined by a certain amount of run-out, so it is important to calculate the values above 1 μm. Therefore, the simulation can be used to predict the run-out according to wear.
Figure 10.
Comparison of run-out for the test conditions (shaft 70 mm).
Figure 10.
Comparison of run-out for the test conditions (shaft 70 mm).
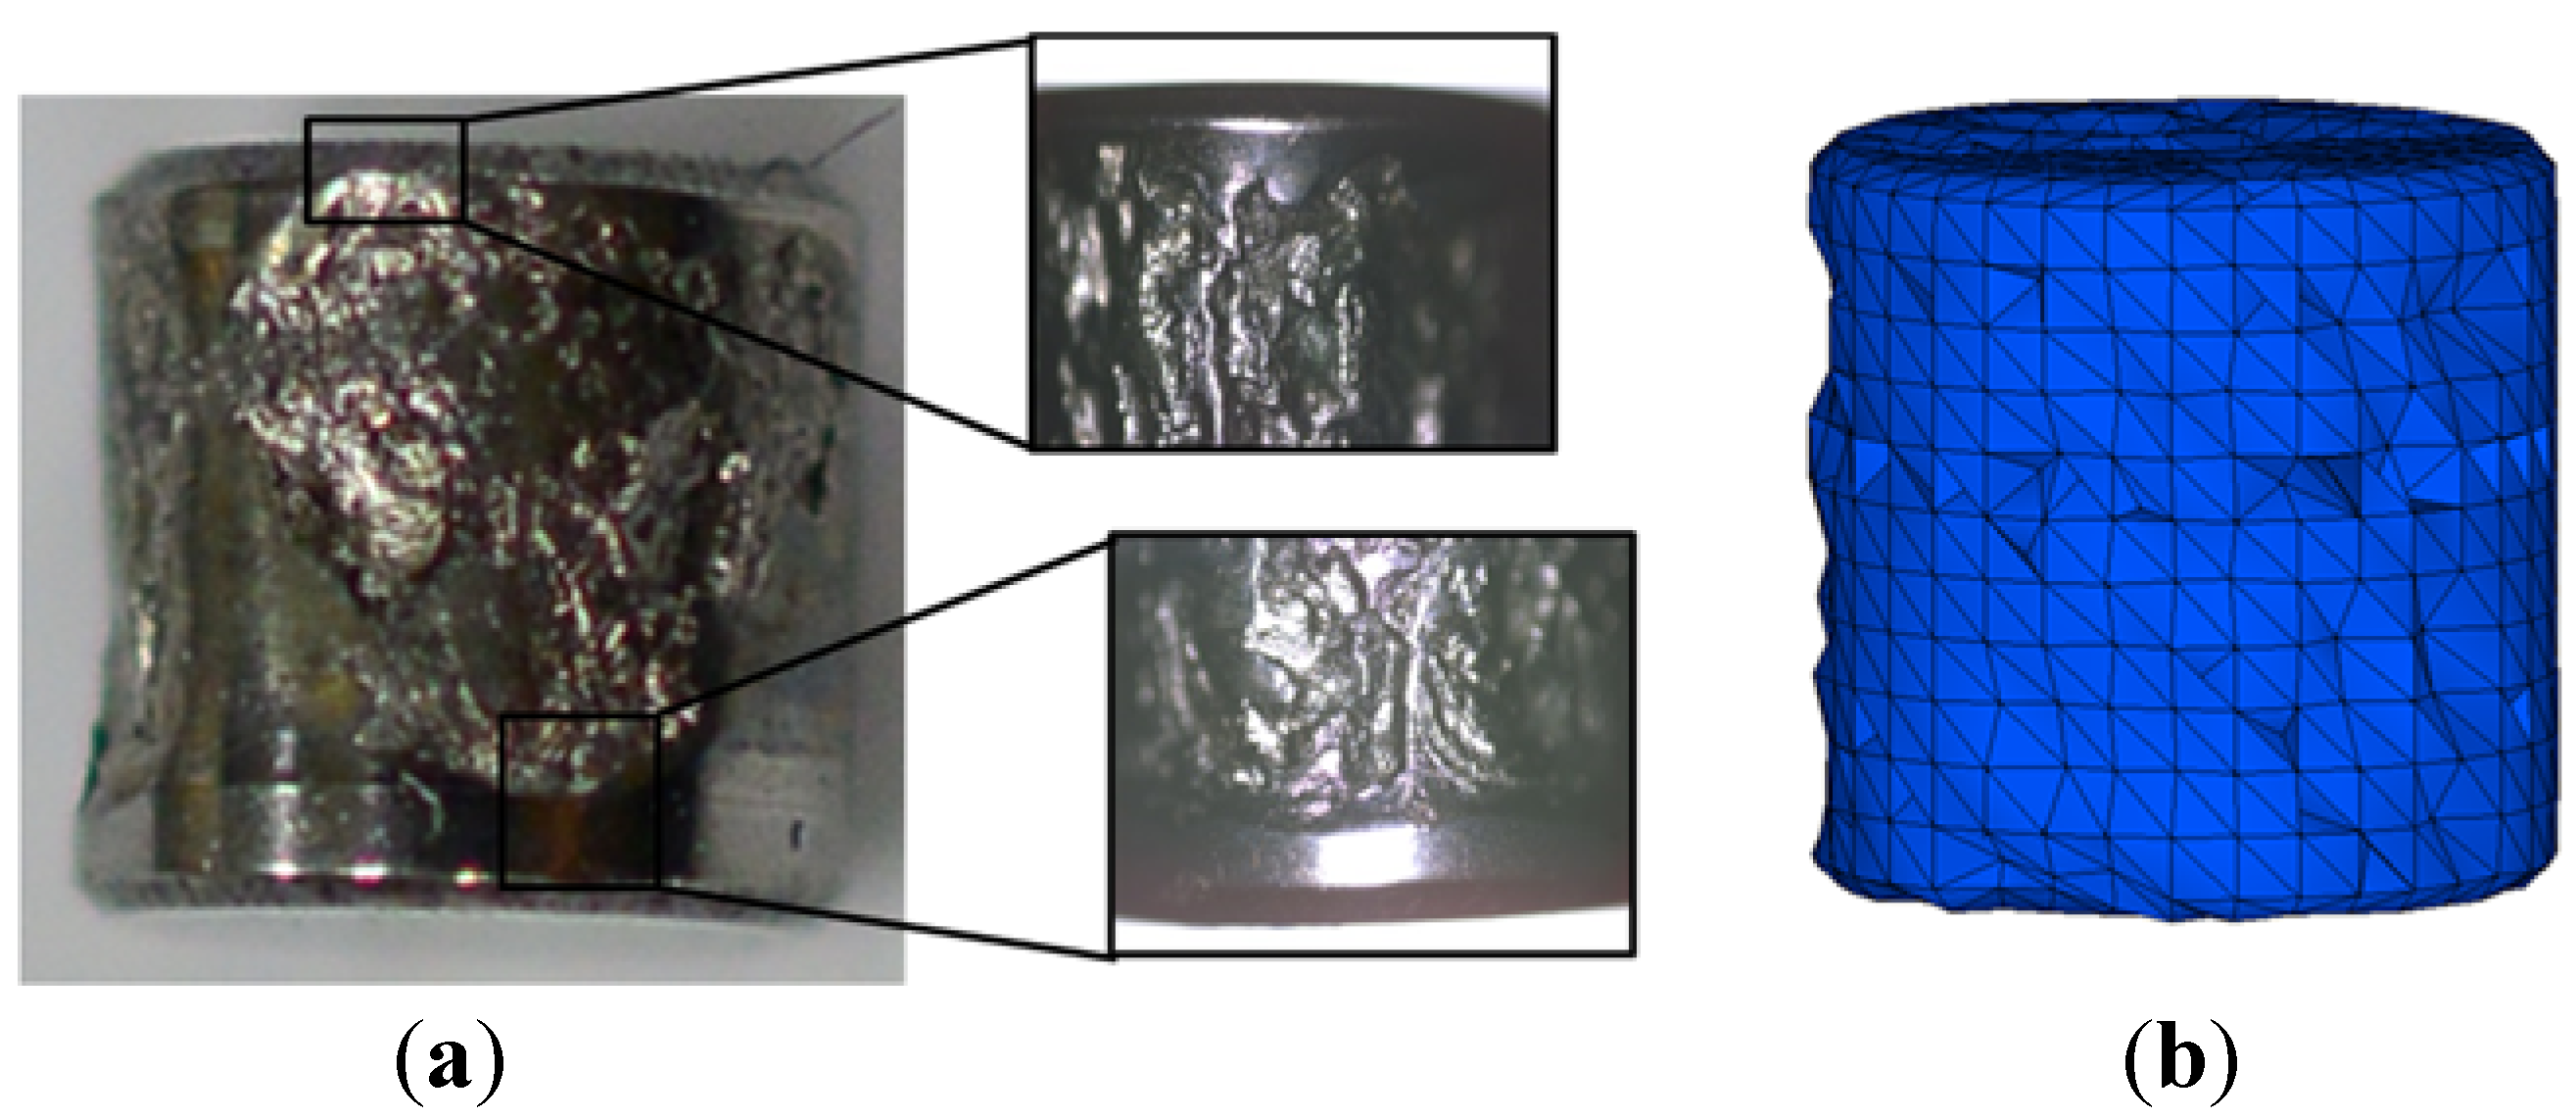
The edge of the roller was observed with a microscope as shown in
Figure 11a. Because of the geometry of the cross roller bearing, the edge of the roller is less damaged. The simulated roller is shown in
Figure 11b. The edge of the roller is also maintained relatively well during the simulation. The tendency of the wear between the simulation and experiment coincides.
By understanding the run-out tendency, it is possible to predict the life of a bearing according to run-out. Then it is possible to replace the bearing before it affects precision.
Figure 11.
Wear on the rollers. (a) Experiment; (b) Simulation.
Figure 11.
Wear on the rollers. (a) Experiment; (b) Simulation.
5. Conclusions
We have proposed a combined linear and non-linear wear model to simulate the wear of a thrust bearing. It is important to predict bearing wear because wear leads to bearing failure. In order to determine the coefficients of the wear models, a pin-on-disc test and bearing wear test were performed. Through the simulation technique, a wear value can be extrapolated. In order to quantify the wear amount, the run-out according to wear was considered.
In our results, an average of 16% difference was found between the experiment and the simulation for a cross roller bearing with a shaft diameter of 50 mm. For a 70 mm shaft diameter bearing, the difference was 6%. Comparing the wear surface of the rollers showed good agreement. The suggested wear models and simulation technique are expected to be used to predict the life of a bearing.


