Article

Relationship between Supplied Oil Flow Rates and Oil Film Thicknesses under Starved Elastohydrodynamic Lubrication

NSK Ltd., 1-5-50 Kugenumashinmei, Fujisawa-shi, Kanagawa 251-8501, Japan
*
Author to whom correspondence should be addressed.
Lubricants 2015, 3(2), 365-380; https://doi.org/10.3390/lubricants3020365
Submission received: 12 December 2014 / Revised: 31 March 2015 / Accepted: 8 April 2015 / Published: 28 April 2015
(This article belongs to the Special Issue Friction and Lubrication of Bearings)

Abstract

:
Many studies have already considered starved lubrication. However, there have been no reports on the oil film thicknesses under steady starved EHL (elastohydrodynamic lubrication), where the ultra-low volume of oil supplied per unit time is uniform. The present study examined the relationship between the supplied oil flow rate and oil film thickness under steady starved lubrication. A ball-on-disk testing machine was used in experiments to measure the oil film thickness by means of optical interferometry. A microsyringe pump was used to accurately control the supplied oil flow rate. The supplied oil flow rate was kept constant, and the minimum oil film thickness was measured for 1 h after the start of the tests to determine the relationship between the supplied oil flow rate and oil film thickness.

Graphical Abstract

1. Introduction

Rolling bearings are used in load support [1] and power transmission of various machines. The supplied oil flow rate is an important parameter that affects the bearing life and friction torque. In order to keep the bearing life long, the supplied oil flow rate must be high enough to form an oil film thicker than the surface roughness of raceway. However, an excessive supplied oil flow rate increases the bearing torque. Therefore, bearings should ideally be lubricated at the minimum supplied oil flow rate. Moreover, minimizing the amount of waste oil can also contribute to solving several problems, such as churning heating effect and ensuing emissions, side leakage out of contact, spillage, cost, conservation of environment, and so on.
Many studies have examined the oil film thickness under starved EHL (elastohydrodynamic lubrication). Wedeven et al. [2] studied the effects of the lubricating oil distribution at EHL inlet areas on the oil film thickness. Based on the fact that no hydrodynamic pressure was generated in contact areas when EHL inlet areas were starved, they found that the horseshoe shapes peculiar to EHL disappeared and that oil film thickness distributions similar to those in the case of Hertzian contact were formed. Furthermore, they theoretically determined the minimum meniscus lengths at EHL inlet areas to prevent starved lubrication. Liu et al. [3], Parinam et al. [4] and Wang et al. [5] proposed an equation that represents the degree of starvation at EHL contact. They stated that the oil film thickness under starved lubrication can be estimated from the thickness of liquid film existing at EHL inlet areas. Moreover, Mohammadpour et al. [6] indicated inlet and outlet boundary condition using entrainment flow with partial counter-flow in pure rolling EHL point contacts. Wolveridge et al. [7], Yang et al. [8] and Mihailidis et al. [9] calculated the starved oil film thickness in the case of line contacts. Chevalier et al. [10] pointed out that predicting the reduction in the oil film thickness is difficult in the case of completely starved lubrication where no meniscus lengths exist. They proposed an approach where the reduction in oil film thickness is predicted from the volume of the supplied oil existing on surfaces. Guangteng et al. [11] and Cann [12] performed experiments using optical interferometry to examine the relationship between the rolling speed and oil film thickness and found that starved lubrication occurred when the speed was increased above a certain value. Cann et al. [13,14] also investigated the transition of oil film and considered situations where the oil film thickness decreased with time. Svoboda et al. [15] described the transition between fully flooded and starved lubrication in EHL point contacts with surface texturing. Damiens et al. [16] and Yin et al. [17] studied the starved EHL condition in the case of ellipsoidal contacts. They compared the above case with a case involving point contacts. Gershuni et al. [18] conducted ball-on-disk tests and observed the grease replenishment. Wang et al. [19] measured and analyzed the oil film thickness under pure rolling reciprocating motions. They found that using the EHL theory based on starved lubrication produced results very close to the experimental values.
However, there have been no reports on the oil film thickness under steady starved lubrication when the ultra-low volume of oil supplied per unit time is uniform. In other words, no basic data exist for cases where the supplied oil flow rate is controlled in the manner of oil-air lubrication. Actually, Chiu [20] had already estimated the meniscus distance from the contact center as a function of the supplied oil flow rate. Nevertheless, they indicated that there was no significant dependence of meniscus distance on oil flow rate within their limits examined (from 5 to 100 drops per minute). Thus, the present study investigated the relationship between the supplied oil flow rate and oil film thickness under steady starved lubrication where the supplied oil flow rate was kept constant. Moreover, these experiments were conducted under the ultra-low oil flow rate (less than 1.67 × 10⁻¹ mm3/s) to reveal the influence of oil flow rate on oil film thickness. This paper reports the results.

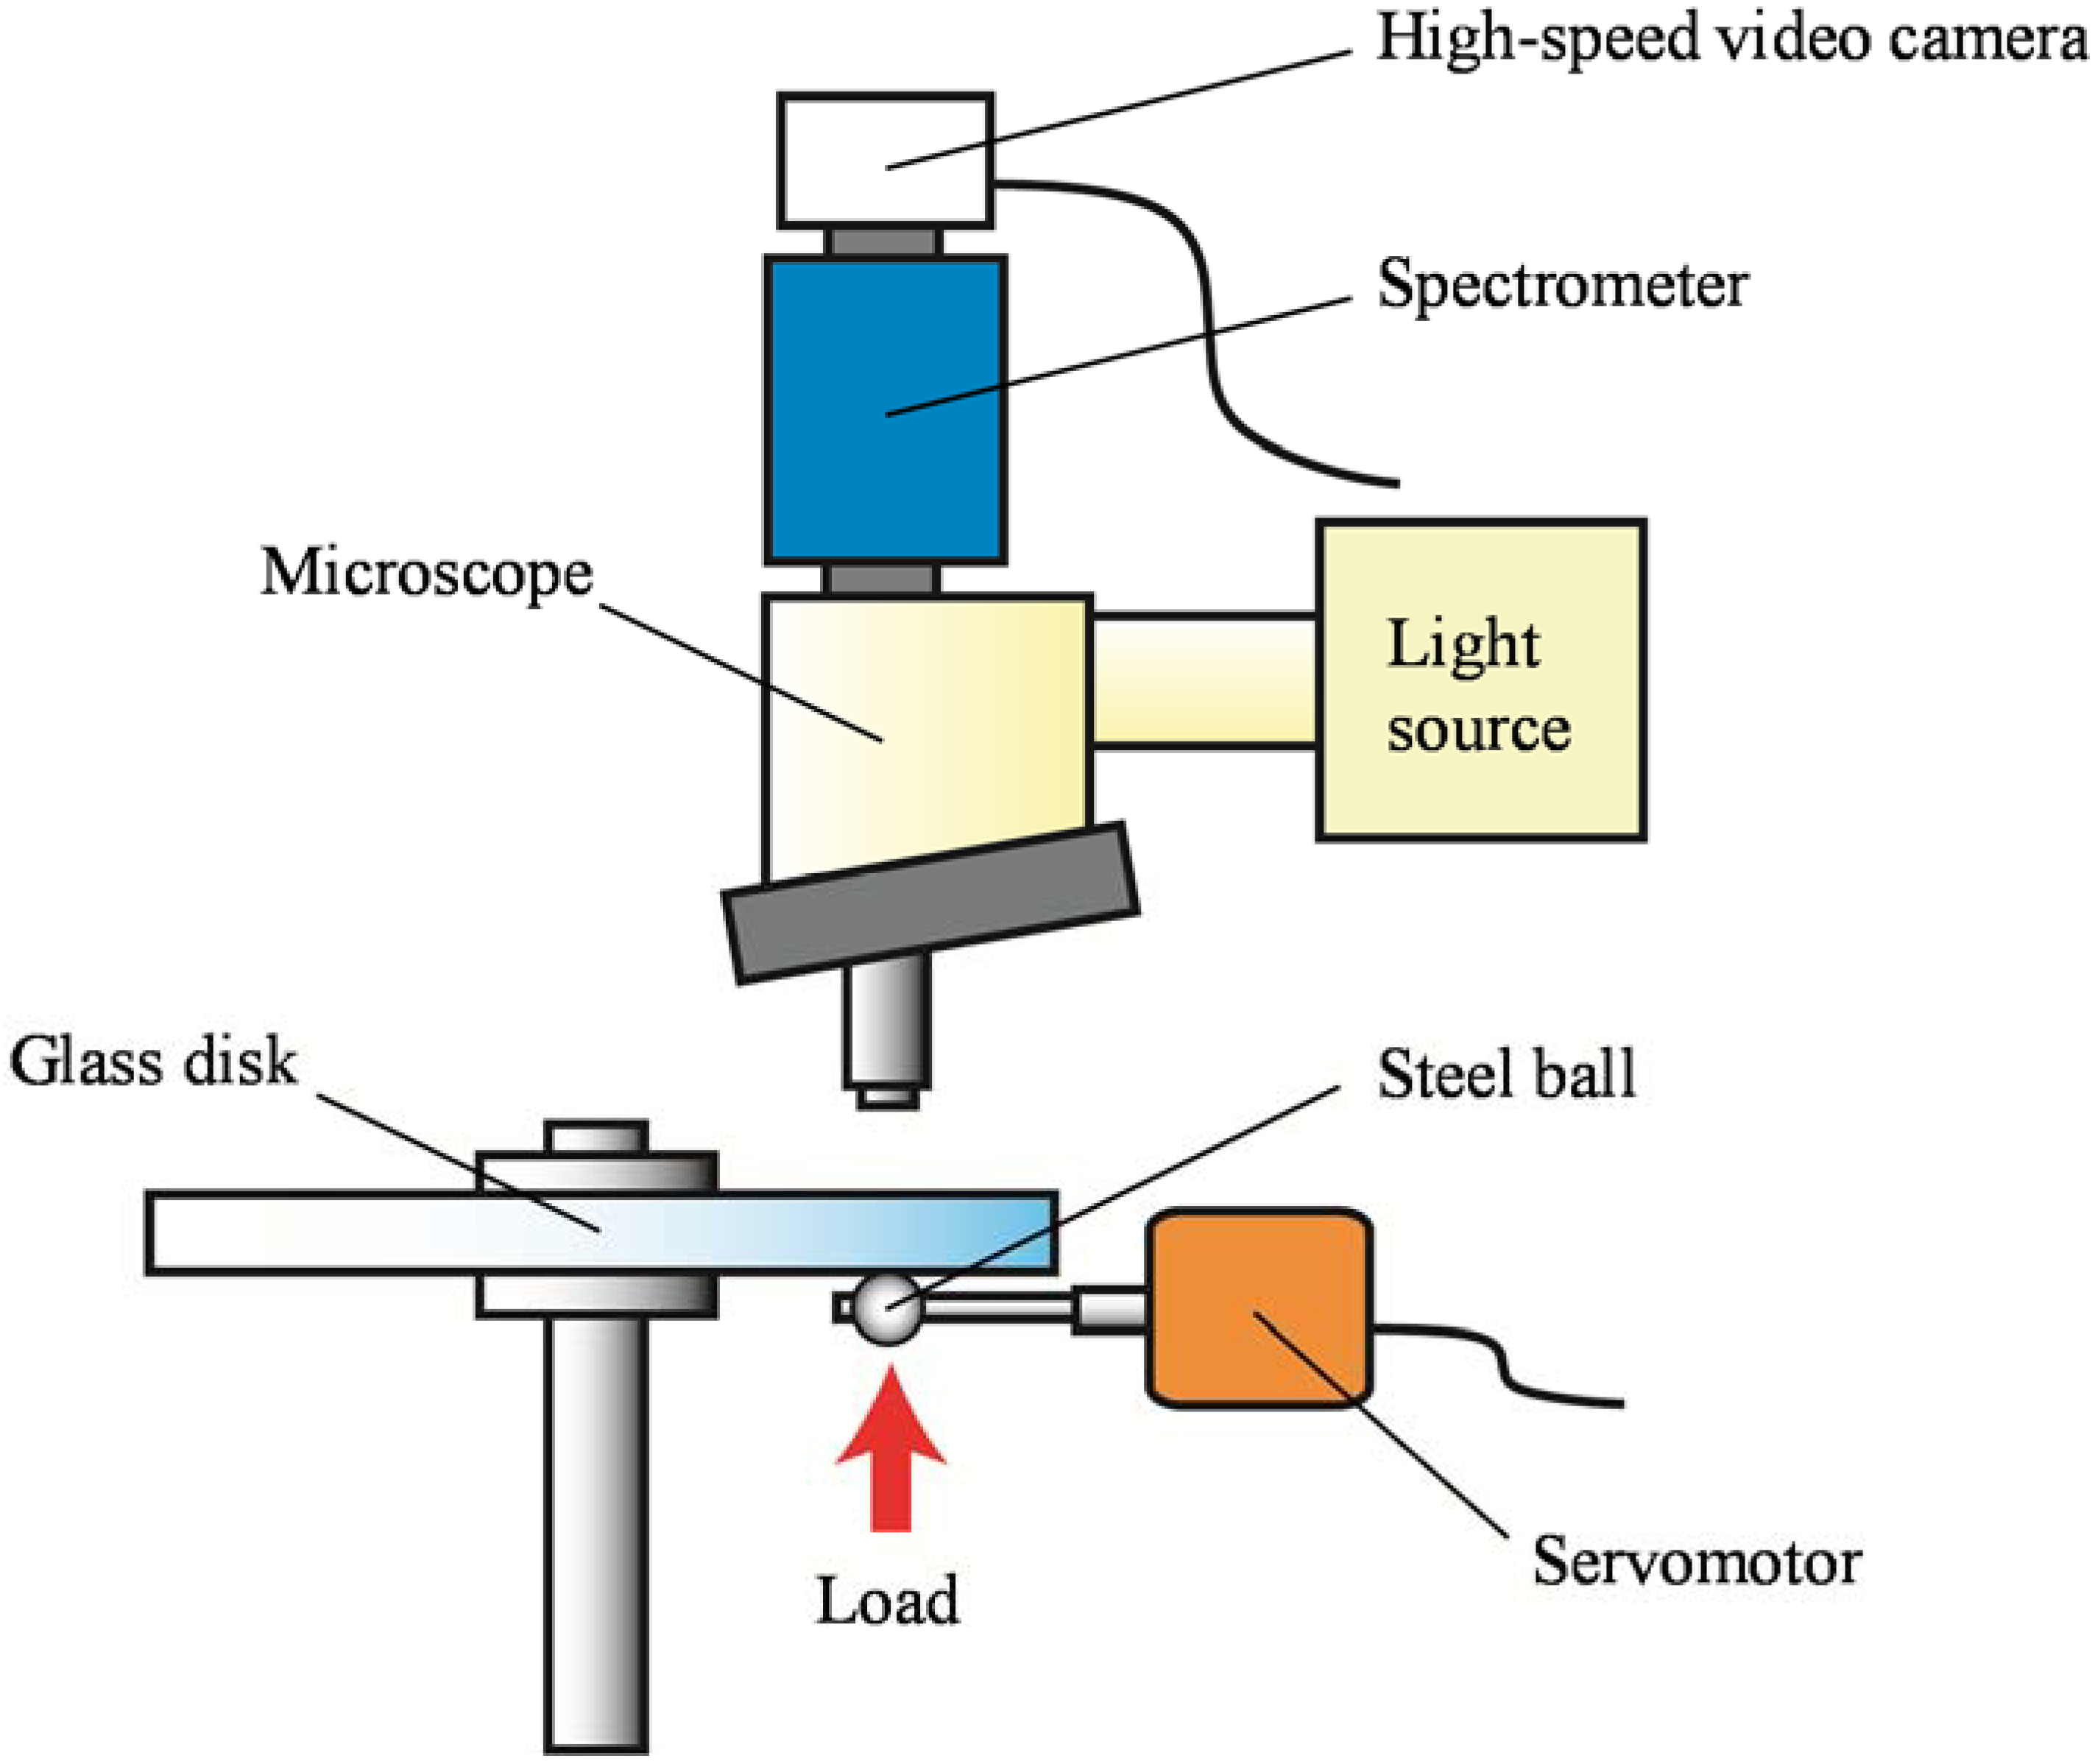
2. Experimental Methods

Figure 1 shows the schematic of the point contact EHL testing machine (ball-on-disk type) used in this research. With this device, light was emitted from a white light source to the Hertzian contact area, and the interference fringe was subjected to a spectrometer. The results were photographed with a high-speed video camera. Table 1 presents the specifications of the high-speed video camera. The oil film thickness was calculated from the wavelengths of resulting spectroscopic images.
Figure 1. Schematic of elastohydrodynamic lubrication (EHL) testing machine.
Lubricants 03 00365 g001
Table 1. Camera specifications.
Image Pickup DeviceCMOS
Number of pixels512 × 512 pixels
Frame rate500 frames/s
Figure 2 shows an enlarged view of the test portion. A semi-reflective Cr layer was attached to one side of the glass disk specimen. A SiO2 spacer layer was placed on this Cr layer. The thickness of the spacer layer was approximately 800 nm. A ball specimen was pressed against the lower side of this disk specimen. The oil film thickness was measured by the spacer layer method [21].
Figure 2. Enlarged view of test portion.
Lubricants 03 00365 g002
A microsyringe pump was used to supply a trace amount of lubricating oil to the contact area. The minimum oil flow rate provided by the microsyringe pump was 1.67 × 10⁻³ mm3/s. The oil filler port of this microsyringe pump was pressed against the disk, as shown in Figure 2, and oil was supplied to the contact area based on the centrifugal force generated by the rotation of the disk. In this manner, a sufficient amount of lubricating oil was already applied to the disk specimen before the start of the test—that is, the test was started under fully flooded lubrication. In order to keep the centrifugal force acting on the lubricating oil constant, the position where the ball specimen was to be pressed against the disk specimen was fixed at a location 40 mm away from the center of the disk specimen. Table 2 gives the specifications of the ball test and glass disk specimens, and Table 3 presents the test conditions.
Table 2. Specimens.
Table 2. Specimens.
Ball SpecimenDisk Specimen
Diameter25.4 mm100 mm
MaterialSUJ2BK7 (Glass)
Young’s modulus210 GPa73.1 GPa
Poisson’s ratio0.30.23
Surface roughness8.1 nmRa2.3 nmRa
Table 3. Test conditions.
Temperature25 °C
OilPoly-alpha-olefin oil (PAO)
Kinematic viscosity19 mm2/s at 40 °C
Load29.7 N
Maximum contact pressure0.49 GPa
Radius of Hertzian contact170 μm
Contact radius40 mm
Rolling speed0.6 m/s to 1.8 m/s
Slide-to-roll ratio0%
Supplied oil flow rate0 mm3/s to 1.67 × 10⁻¹ mm3/s
Figure 3 shows a view of the interference fringe in the contact area. In this study, the oil film profiles were observed along the Y-axis (X = 0), which was perpendicular to the rolling direction. In this paper, the disk rotation center side is referred to as the “inside”, and the outer side of the disk is referred to as the “outside”.
Figure 3. Interference fringe.
Lubricants 03 00365 g003

3. Experimental Results

3.1. Preparatory Experiments

First, the transition of oil film thickness without oil resupply was measured to find the experimental conditions of starved lubrication in this study. A test was carried out where a sufficient amount of lubricating oil was first applied to the disk specimen, and the results confirmed the starved lubrication process. Figure 4 shows the transition of the interference fringe when the rolling speed was 1.8 m/s. The interference fringe was confirmed to be symmetrical about the X-axis. The interference fringe lost symmetry 1 h after the start of the test. The thin oil film portion called the horseshoe-shaped zone was only left on the ‘inside’. The starved area (oil/air meniscus) of the EHL inlet region, which was small as shown by the left chart of Figure 4, became very large, as shown by the right chart. Thus, the starved area extended to the contact area.
Figure 4. Transition of interference fringe: (left) 1 s later, (right) 3600 s later. Rolling speed = 1.8 m/s.
Lubricants 03 00365 g004
Figure 5 shows the transition of the oil film profile. Immediately after the start of the test, the oil film profile was laterally symmetric, and the oil film became thinner only on the “outside” over time. The centrifugal force generated in the rotating disk acted from the “inside” to the “outside”. The oil film only became thinner on the “outside” because the lubricating oil became starved owing to the effect of the centrifugal force. Wedeven et al., observed similar interference fringes in their test results [2]. The oil film thickness on the “inside” did not change because the lubricating oil applied to the rotation center side was replenished under the effect of the centrifugal force.
Figure 5. Transition of oil film profile: Y-axis. Rolling speed = 1.8 m/s.
Lubricants 03 00365 g005
Figure 6 and Figure 7 show the measurement results when the rolling speed was reduced to 1.2 m/s. Figure 6 shows that the starved area 1 h after the start of the test was smaller than that shown in Figure 4. Also, Figure 7 shows that the position where the oil film became thinner was not located at the edge of the “outside” but shifted a little to the inside of the contact area. The amount of reduction in the oil film thickness also decreased. These results were caused by the fact that the centrifugal force was reduced by the decrease in the rolling speed. Because the centrifugal force dropped, the racetrack was replenished with lubricating oil from the wettability effect of the oil.
Figure 6. Transition of interference fringe: (left) 1 s later, (right) 3600 s later. Rolling speed = 1.2 m/s.
Lubricants 03 00365 g006
Figure 7. Transition of oil film profile: Y-axis. Rolling speed = 1.2 m/s.
Lubricants 03 00365 g007
Figure 8 and Figure 9 shows the measurement results when the rolling speed was reduced to 0.6 m/s. As shown in Figure 8, even 1 h after the start of the test, the starved area located at the EHL inlet region did not extend to the EHL contact area. Figure 9 shows that the oil film profile 1 h after the start of the test underwent almost no change compared to the corresponding profile immediately after the start. That is, the results confirmed that a lower speed produced a smaller centrifugal force acting on the lubricating oil, which lessened the tendency for starved lubrication.
Figure 8. Transition of interference fringe: (left) 1 s later, (right) 3600 s later. Rolling speed = 0.6 m/s.
Lubricants 03 00365 g008
Figure 9. Transition of oil film profile: Y-axis. Rolling speed = 0.6 m/s.
Lubricants 03 00365 g009
Figure 10 shows the relationship between the rolling speed and minimum oil film thickness (minimum values on Y-axis). The oil film thickness immediately after the start of the test increased with the rolling speed. This result is approximately the same as that from the Hamrock-Dowson equation [22]. However, when the rolling speed was 1.2 m/s or more, higher speeds meant reduced oil film thicknesses 1 h after the start of the test. These results agree with those of Guangteng et al. [11], Cann et al. [12] and Chiu [20]. Based on the above results, the rolling speed to reproduce starved lubrication was taken to be 1.8 m/s in this study.
Figure 10. Relationship between rolling speed and minimum oil film thickness.
Lubricants 03 00365 g010
Figure 11 shows the chronological changes in the minimum oil film thickness. Although no change occurred when the rolling speed was low, the oil film thickness decreased with time when the rolling speed was high. When the rolling speed was 1.8 m/s, the oil film thickness was almost constant at approximately 50 nm from 2700 s or more after the start of the test. Consequently, in this study, lubrication was considered to be in a steady starved lubrication 1 h after the start of the test.
Figure 11. Transition of minimum oil film thickness.
Lubricants 03 00365 g011

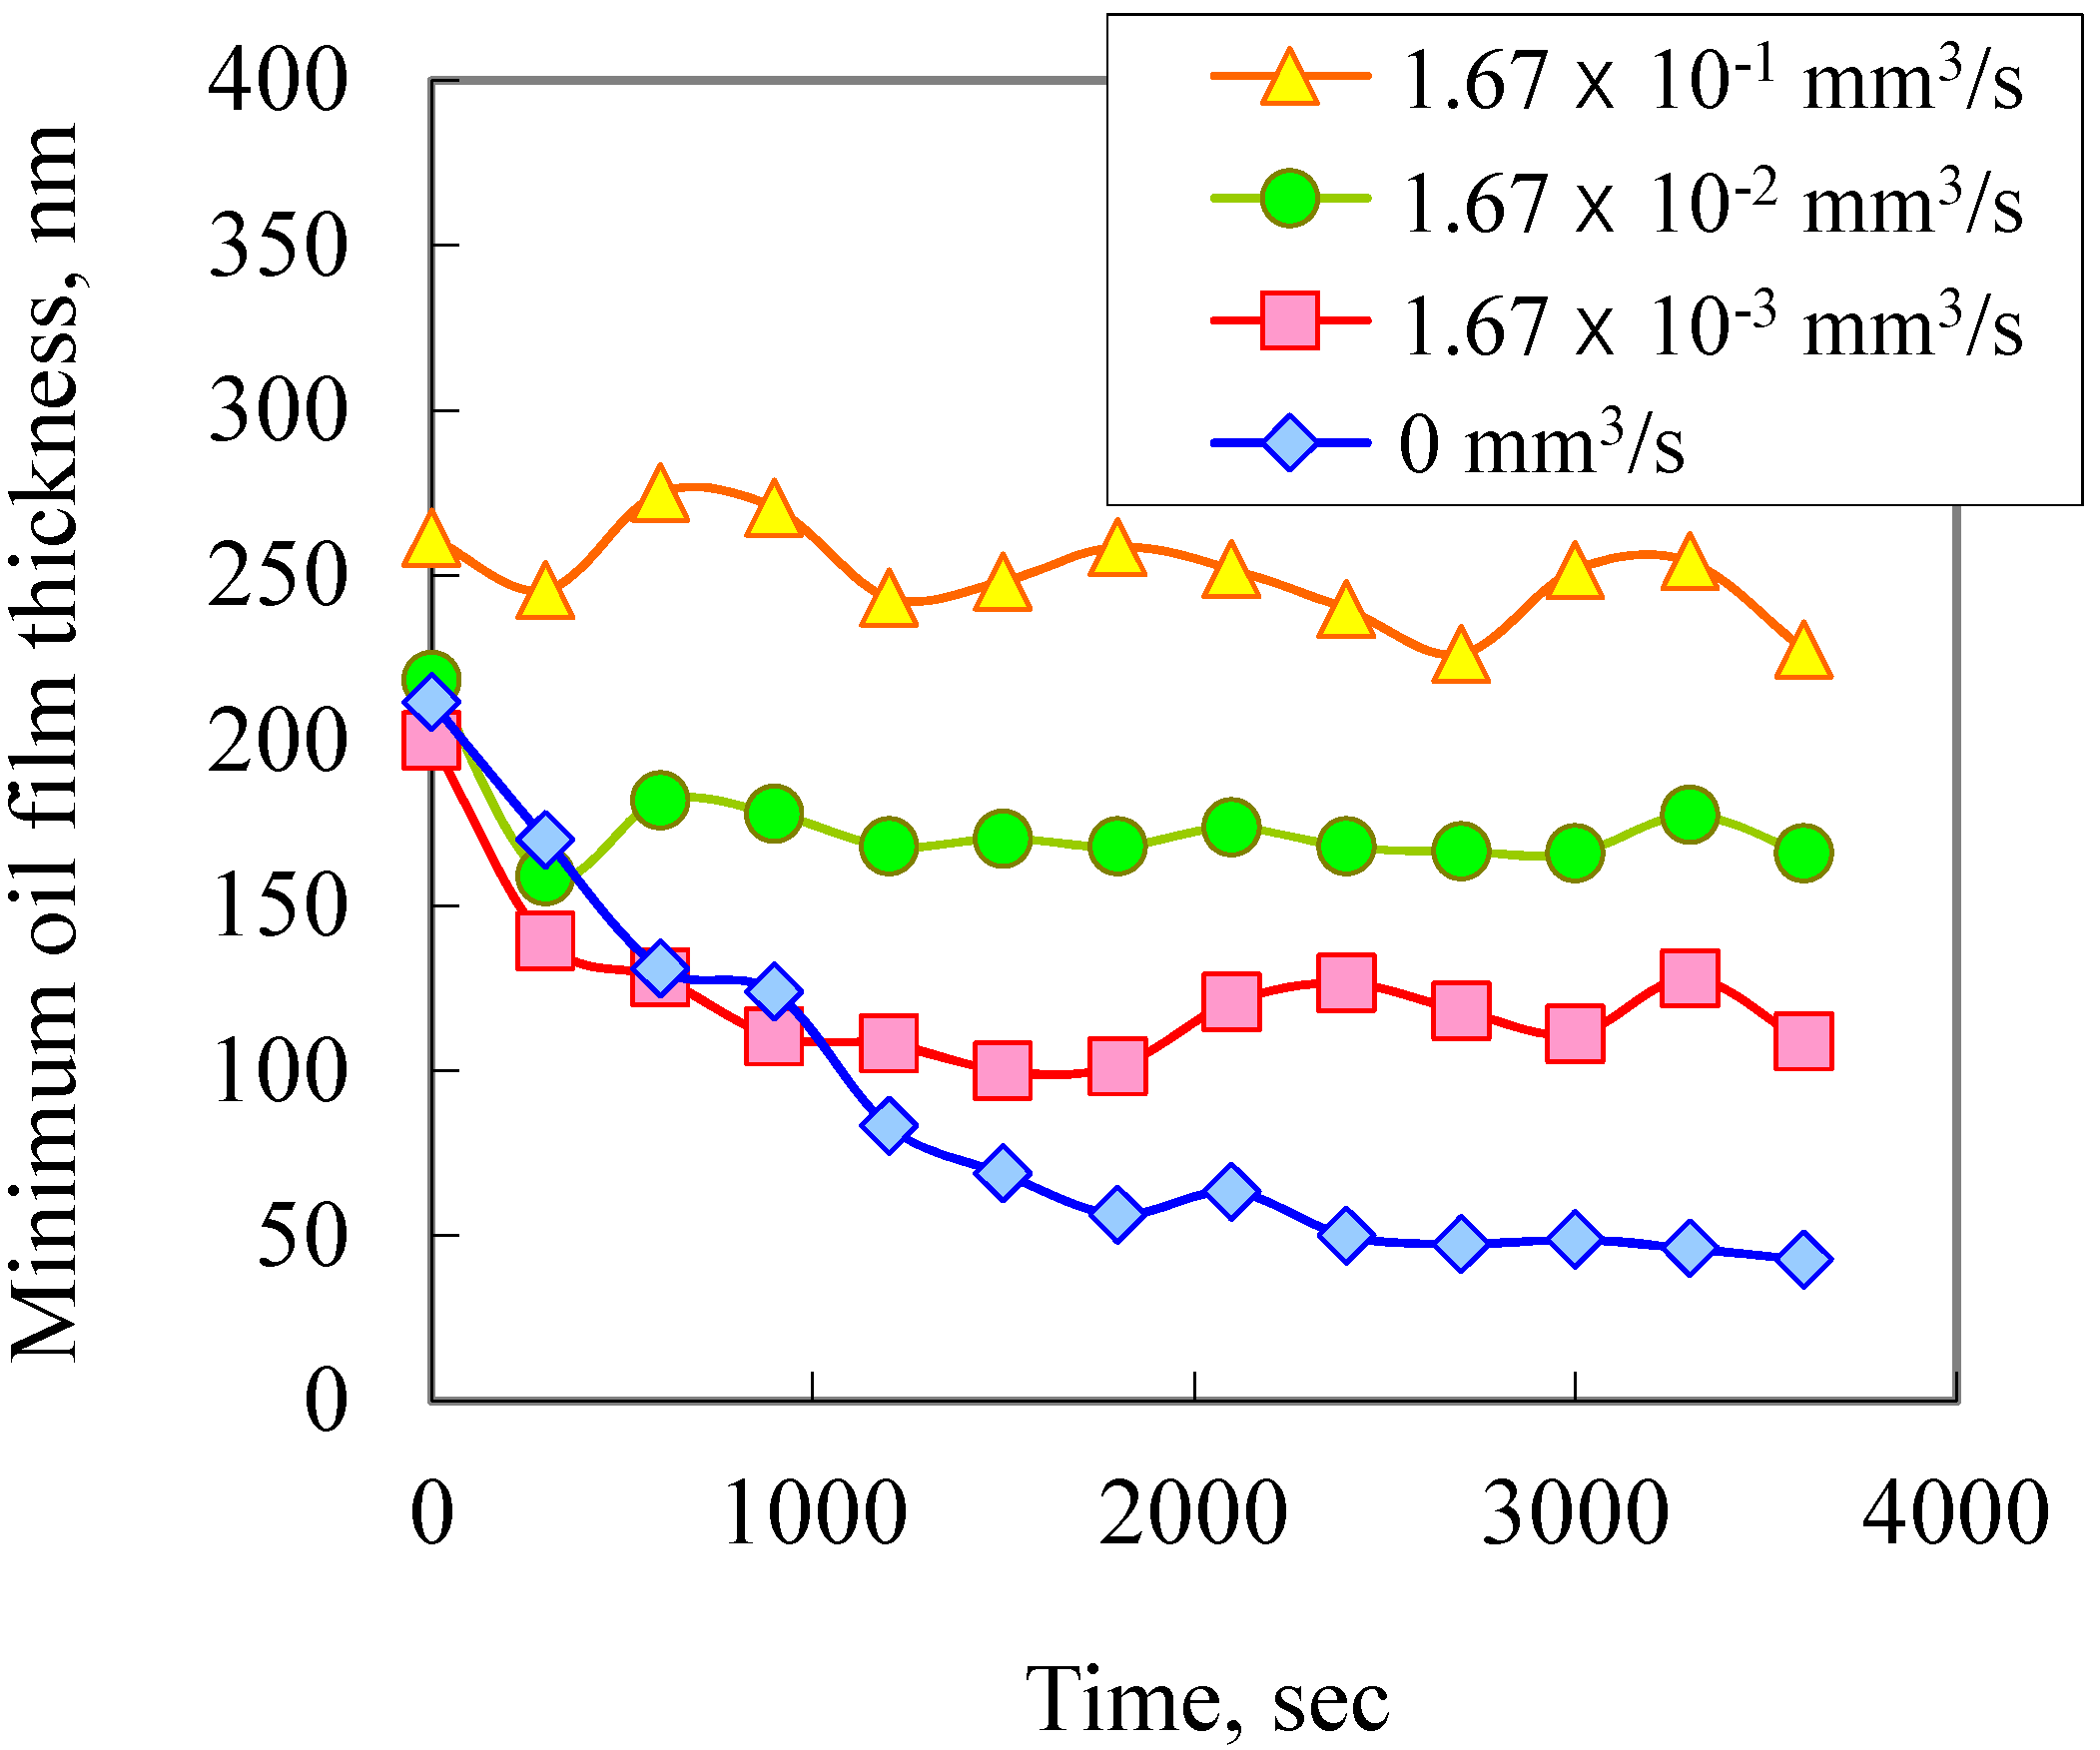
3.2. Relationship between Supplied Oil Flow Rates and Oil Film Thicknesses

The oil film thickness was then measured for different supplied oil flow rates, which were changed from 1.67 × 10⁻³ mm3/s to 1.67 × 10⁻¹ mm3/s. The results of these measurements are given below.
First, the oil film thickness was measured when the supplied oil flow rate was set to 1.67 × 10⁻¹ mm3/s. Figure 12 and Figure 13 shows the results of these measurements. Figure 12 shows that, 1 h after the start of the test, the starved area at the EHL inlet region was larger than that immediately after the start of the test. However, it did not extend to the EHL area, and the interference fringe formed a horseshoe shape that was almost symmetrical about the X-axis. According to the oil film profile shown in Figure 13, the oil film thickness did not decrease at all. Therefore, when the rolling speed is 1.8 m/s, sufficient lubrication can be achieved by setting the supplied oil flow rate to 1.67 × 10⁻¹ mm3/s.
Figure 12. Transition of interference fringe: (left) 1 s later, (right) 3600 s later. Supplied oil flow rate = 1.67 × 10⁻¹ mm3/s.
Lubricants 03 00365 g012
Figure 13. Transition of oil film profile: Y-axis. Supplied oil flow rate = 1.67 × 10⁻¹ mm3/s.
Lubricants 03 00365 g013
Figure 14 and Figure 15 show the oil film measurements when the supplied oil flow rate was set to 1.67 × 10⁻² mm3/s. The starved area shown in Figure 14 was larger than that shown in Figure 12 but did not extend to the EHL contact area. According to Figure 15, the oil film on the “outside” was a little thinner in the profile 300 s after the start of the test. Therefore, the lubrication was considered to be in a state of starved lubrication when the supplied oil flow rate was 1.67 × 10⁻² mm3/s. Furthermore, the oil film thickness was constant 300 s after the start of the test.
Figure 14. Transition of interference fringe: (left) 1 s later, (right) 3600 s later. Supplied oil flow rate = 1.67 × 10⁻² mm3/s.
Lubricants 03 00365 g014
Figure 15. Transition of oil film profile: Y-axis. Supplied oil flow rate = 1.67 × 10⁻² mm3/s.
Lubricants 03 00365 g015
Figure 16 and Figure 17 show the oil film measurements when the supplied oil flow rate was set to 1.67 × 10⁻³ mm3/s. Figure 16 shows that that the starved area at the EHL inlet region was even larger than that in Figure 14 and extended to the EHL contact area. Figure 17 shows that the oil thickness decreased with time and that the amount of reduction was larger on the “outside”.
Figure 16. Transition of interference fringe: (left) 1 s later, (right) 3600 s later. Supplied oil flow rate = 1.67 × 10⁻³ mm3/s.
Lubricants 03 00365 g016
Figure 17. Transition of oil film profile: Y-axis. Supplied oil flow rate = 1.67 × 10⁻³ mm3/s.
Lubricants 03 00365 g017
Figure 18 shows the transition of the minimum oil film thickness when the supplied oil flow rate was changed. A higher supplied oil flow rate decreased the time for the oil film thickness to become constant. In addition, a lower supplied oil flow rate produced a thinner oil film thickness.
Figure 18. Transition of minimum oil film thickness.
Lubricants 03 00365 g018

4. Discussion

Figure 19 shows the relationship between the supplied oil flow rate Q and minimum oil film thickness hmin 1 h after the start of the test. The values resulting from the Hamrock-Dowson equation and the measured oil film thickness without oil resupply (Q = 0 mm3/s) are shown together. When the supplied oil flow rate was approximately 10−1 mm3/s or more, oil films formed to approximately the same thicknesses as those from the Hamrock-Dowson equation. Therefore, fully flooded lubrication was achieved in this domain. When the supplied oil flow rate was reduced to approximately 10−2 mm3/s or less, the oil thickness gradually became thinner. Consequently, the starved lubrication was assumed to occur in this domain. When the supplied oil flow rate was reduced to 1.67 × 10⁻³ mm3/s, the oil film thickness was twice or more the corresponding thickness achieved without oil resupply. In consequence, even a very low lubricant flow rate was confirmed to contribute to lubrication.
Figure 19. Relationship between supplied oil flow rate and minimum oil film thickness (3600 s later).
Lubricants 03 00365 g019
Rauscher et al., theoretically determined the relationship between the supplied oil flow rate Q and thickness h of liquid on a rotating disk [23]. If the radius coordinate r on a disk specimen satisfies equation (1), then the liquid film thickness h is sufficiently small compared to r.
r > > ( 9 Q 2 4 π 2 ν ω ) 1 4
where ν is the kinematic viscosity of lubricating oil and ω is the angular velocity of the disk specimen. Therefore, they considered the following approximation to hold.
h r 0
In this study, the value of Q was so low that Equation (1) was sufficiently satisfied. Based on the Navier-Stokes equations, they approximated the liquid film thickness h by Equation (3).
h = ( 3 Q ν 2 π ω 2 r 2 ) 1 3
On the other hand, Wedeven et al. [1] experimentally estimated the distance xb from the inlet lubricant boundary to the center of the Hertzian contact by Equation (4).
x b = a + ( h b / h c 1 1.21 ) 2 3 ( R h c ) 2 3 a 1 / 3
where a is the Hertzian radius, hb is the liquid film thickness at lubricant boundary, hc is the central oil film thickness and R is the radius of ball specimen. According to Equations (3) and (4), the inlet distance xb can be calculated if the liquid film thickness h on the disk specimen is regarded as the liquid film thickness hb at lubricant boundary.
Furthermore, Hamrock et al. [24] calculated the minimum oil film thickness hmin,S under starved lubrication by Equation (5).
h min , S = h min , F ( x b a 1 3.34 ( ( R a ) 2 h min , F R ) 0.58 ) 0.25
where hmin,F is the minimum oil film thickness under fully flooded lubrication. From those equations, the minimum oil film thickness hmin,S under starved lubrication can be calculated by the supplied oil flow rate Q. Figure 19 also shows the minimum oil film thickness as a function of the supplied oil flow rate for the calculated results by Equation (5), comparing with the experimental results. It can be seen that the calculated results disagree with the results of experiments. This is because h was assumed to be hb. In fact, the lubricating oil was supplied into a racetrack under a centrifugal force. However, Figure 19 indicates that hb was much thinner than h due to the racetracks, generated behind EHL contact areas.

5. Conclusions

In this research, the ultra-low volume of oil supplied per unit time was assumed to be constant, and the relationship between the supplied oil flow rate and oil film thickness under steady starved lubrication was investigated. The obtained results are presented below:
  • An oil film measurement method using a microsyringe pump was developed to reproduce starved lubrication by means of an EHL testing machine.
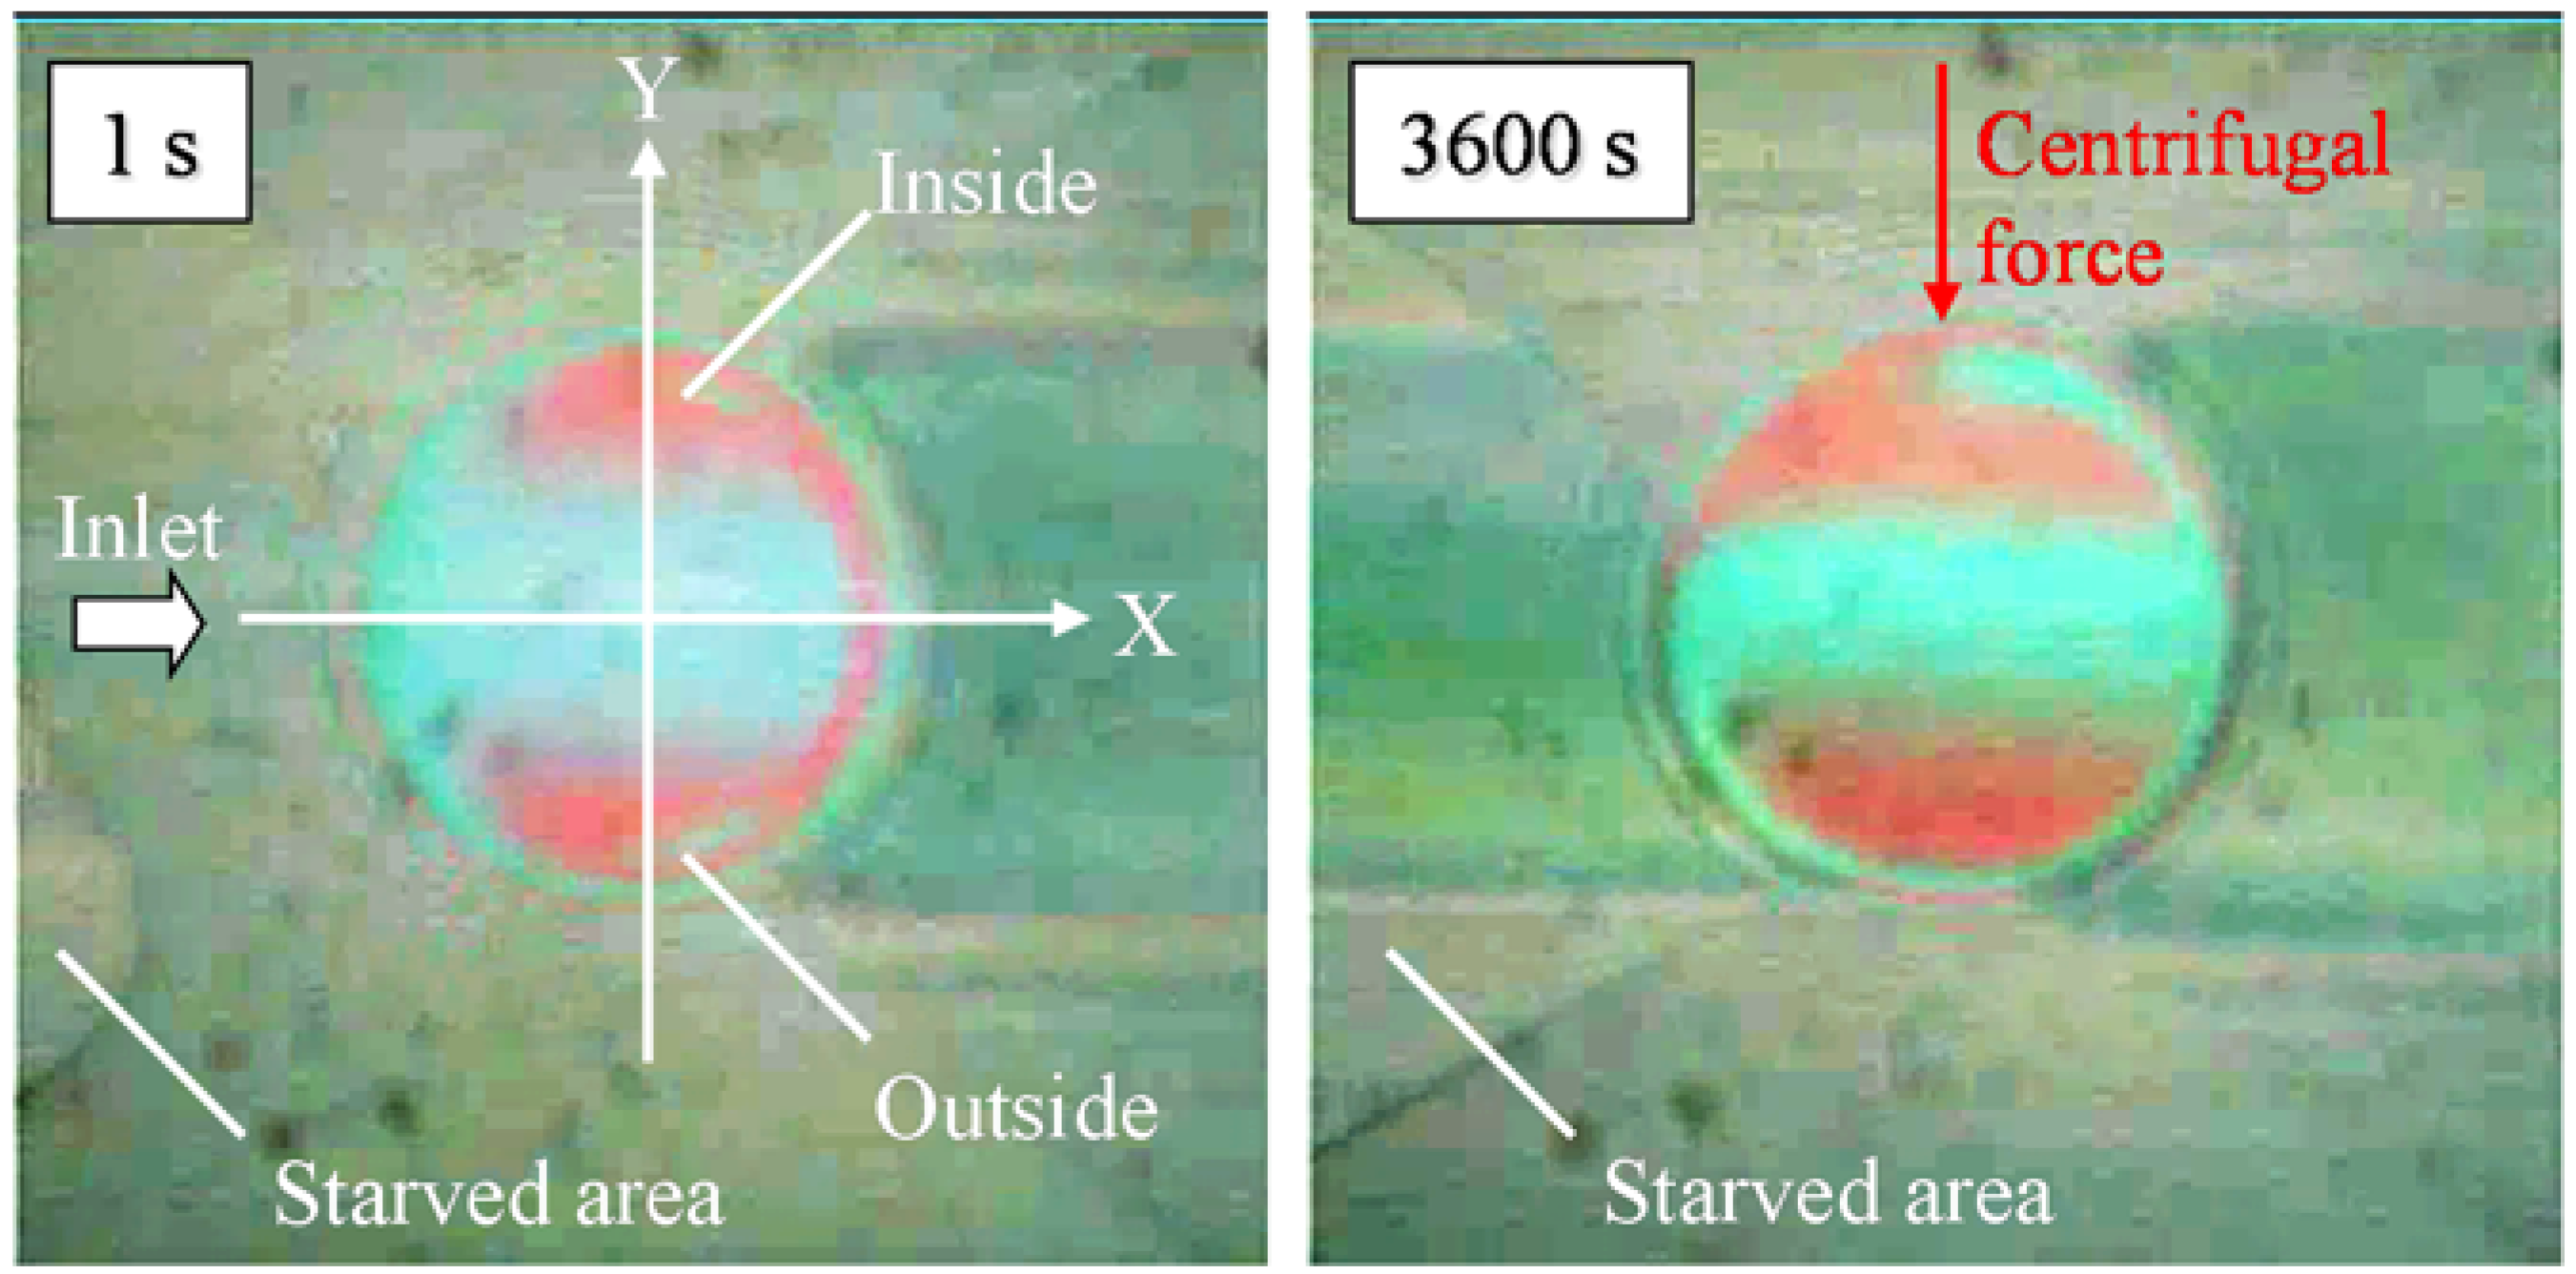
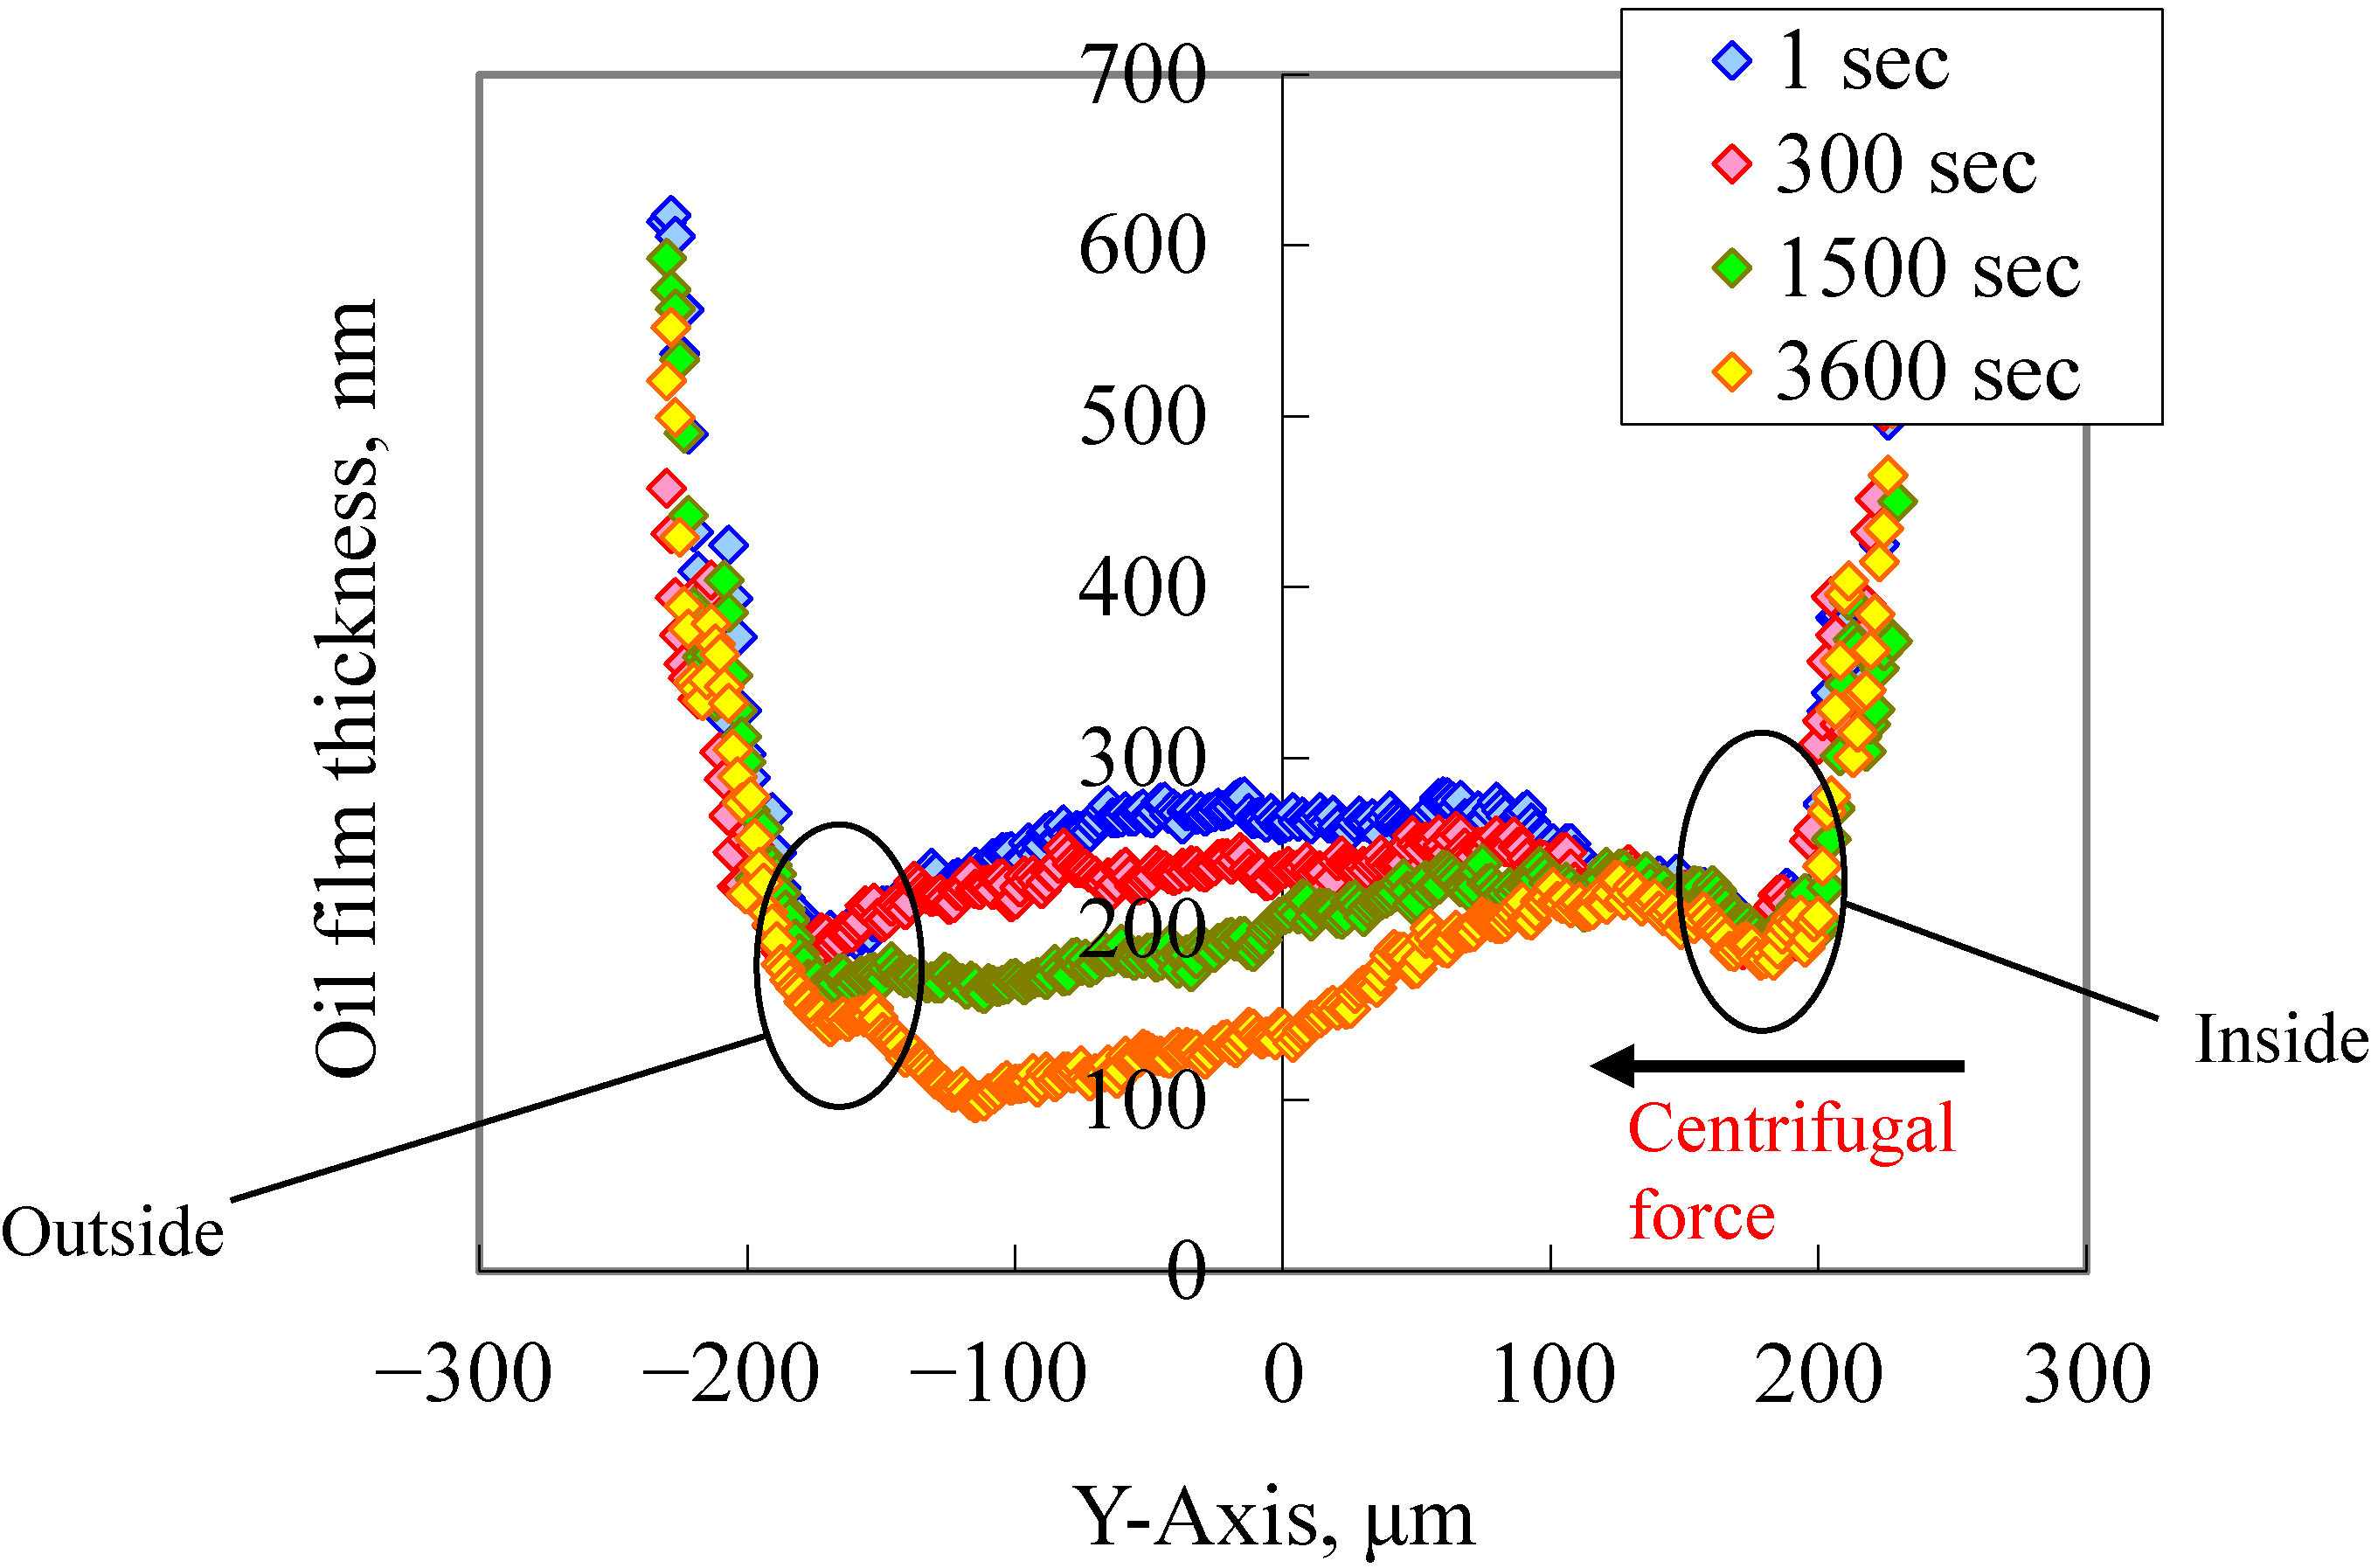
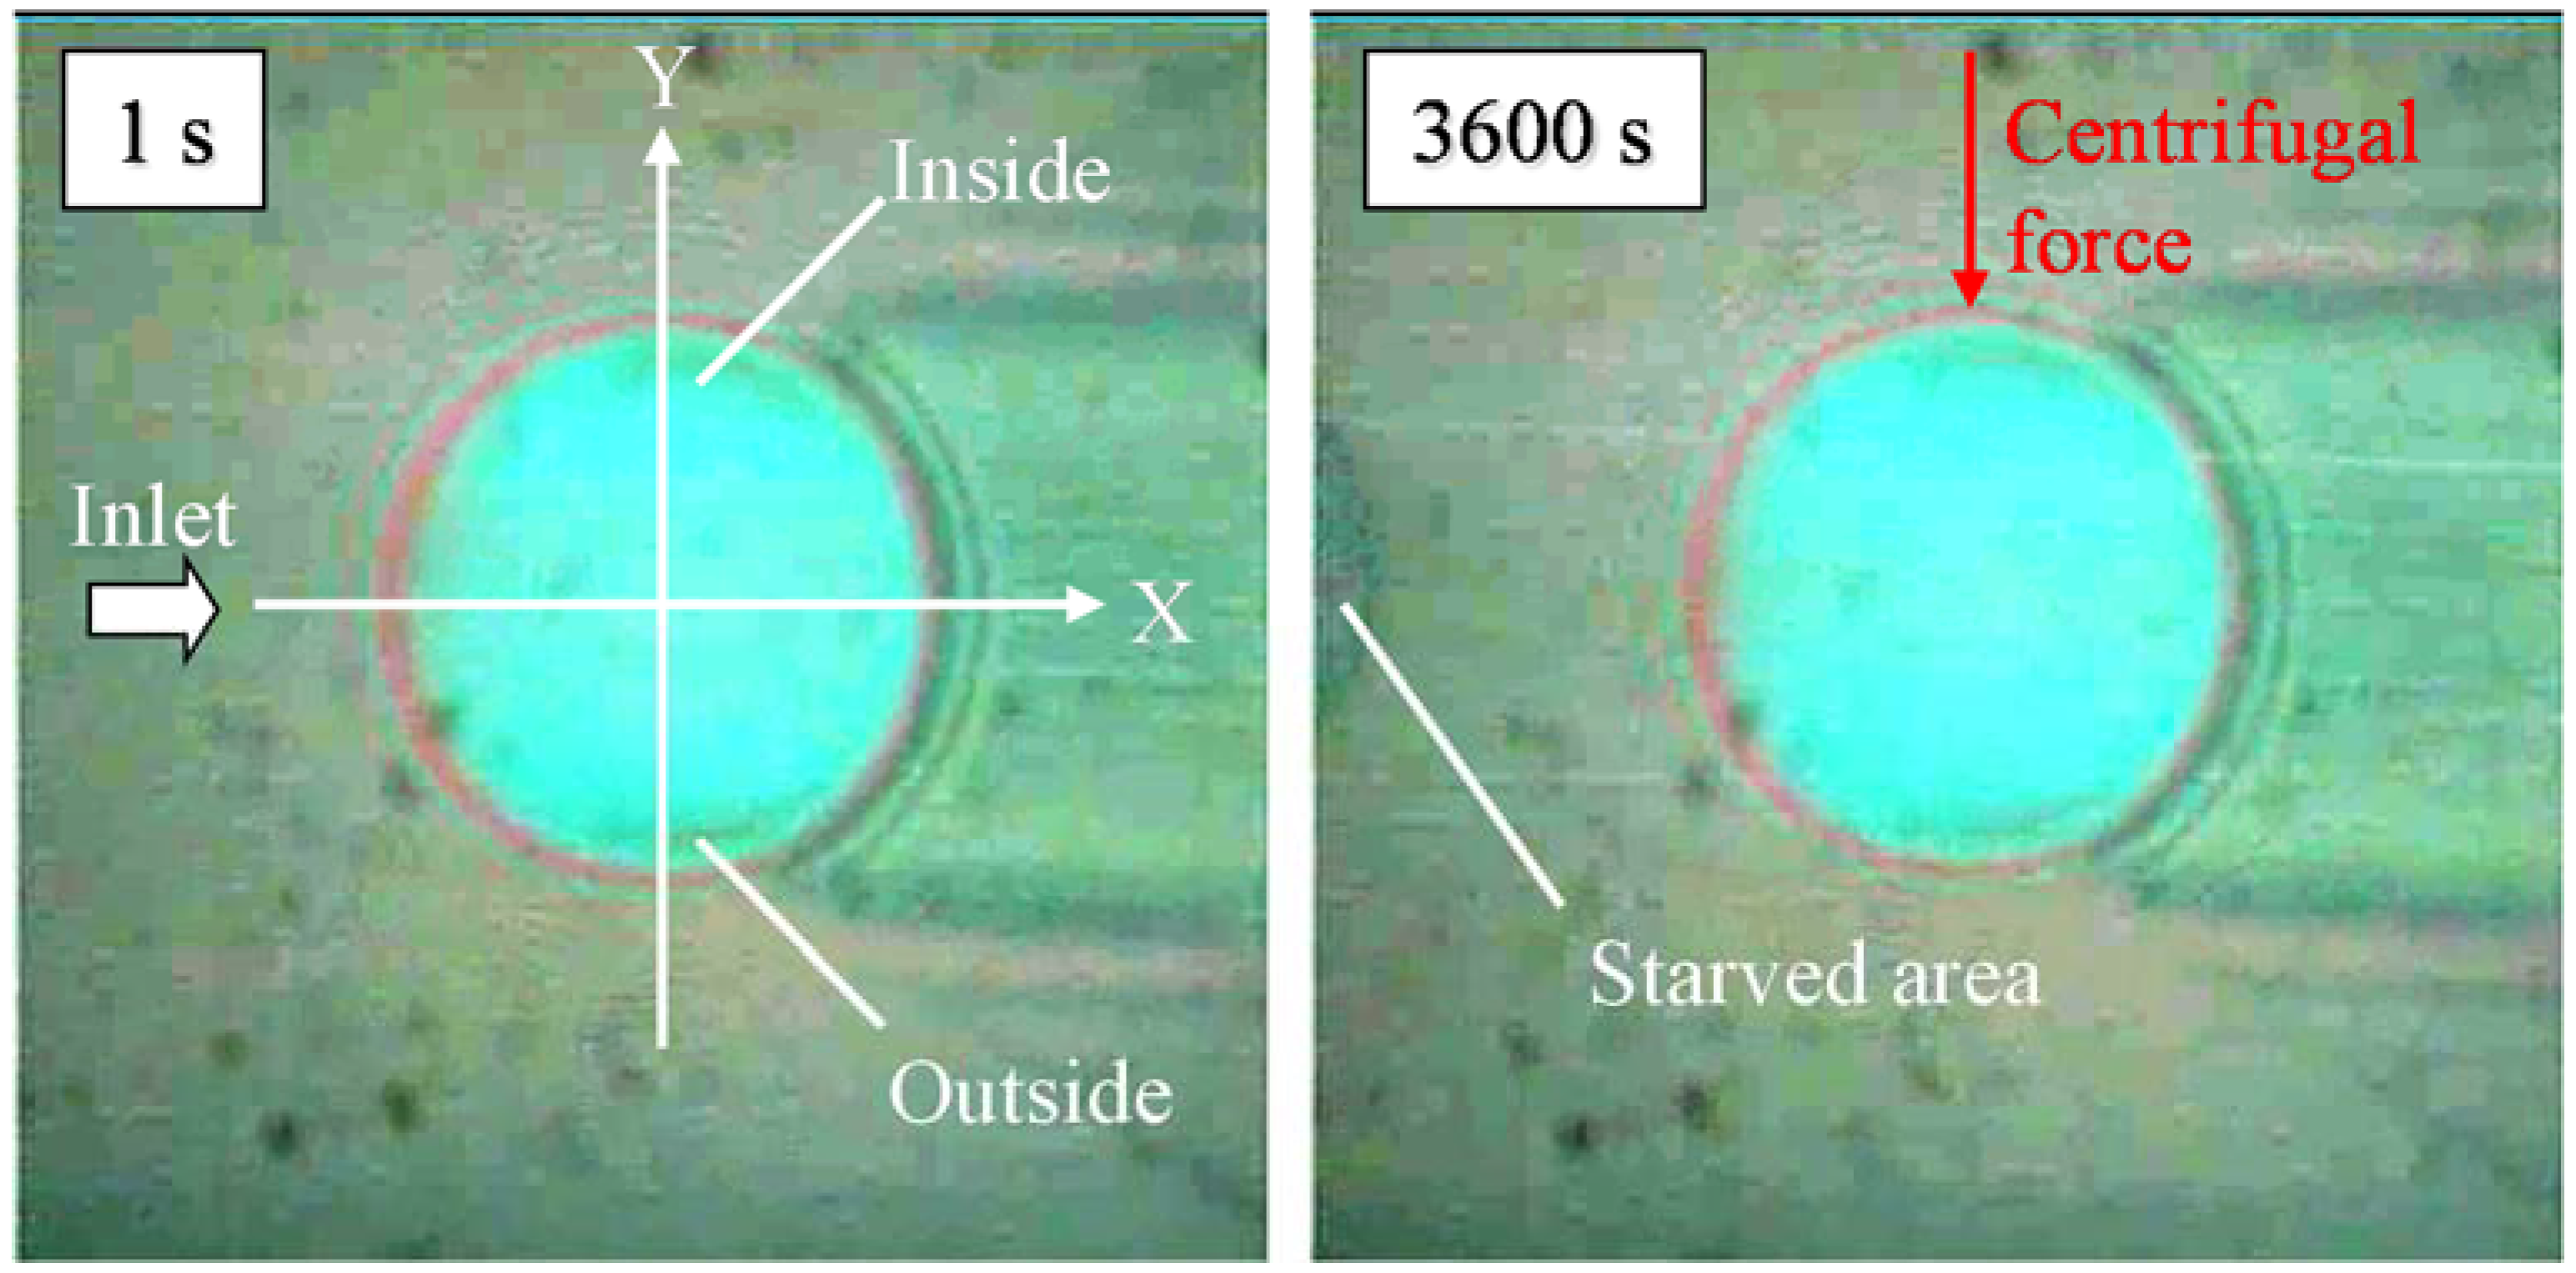
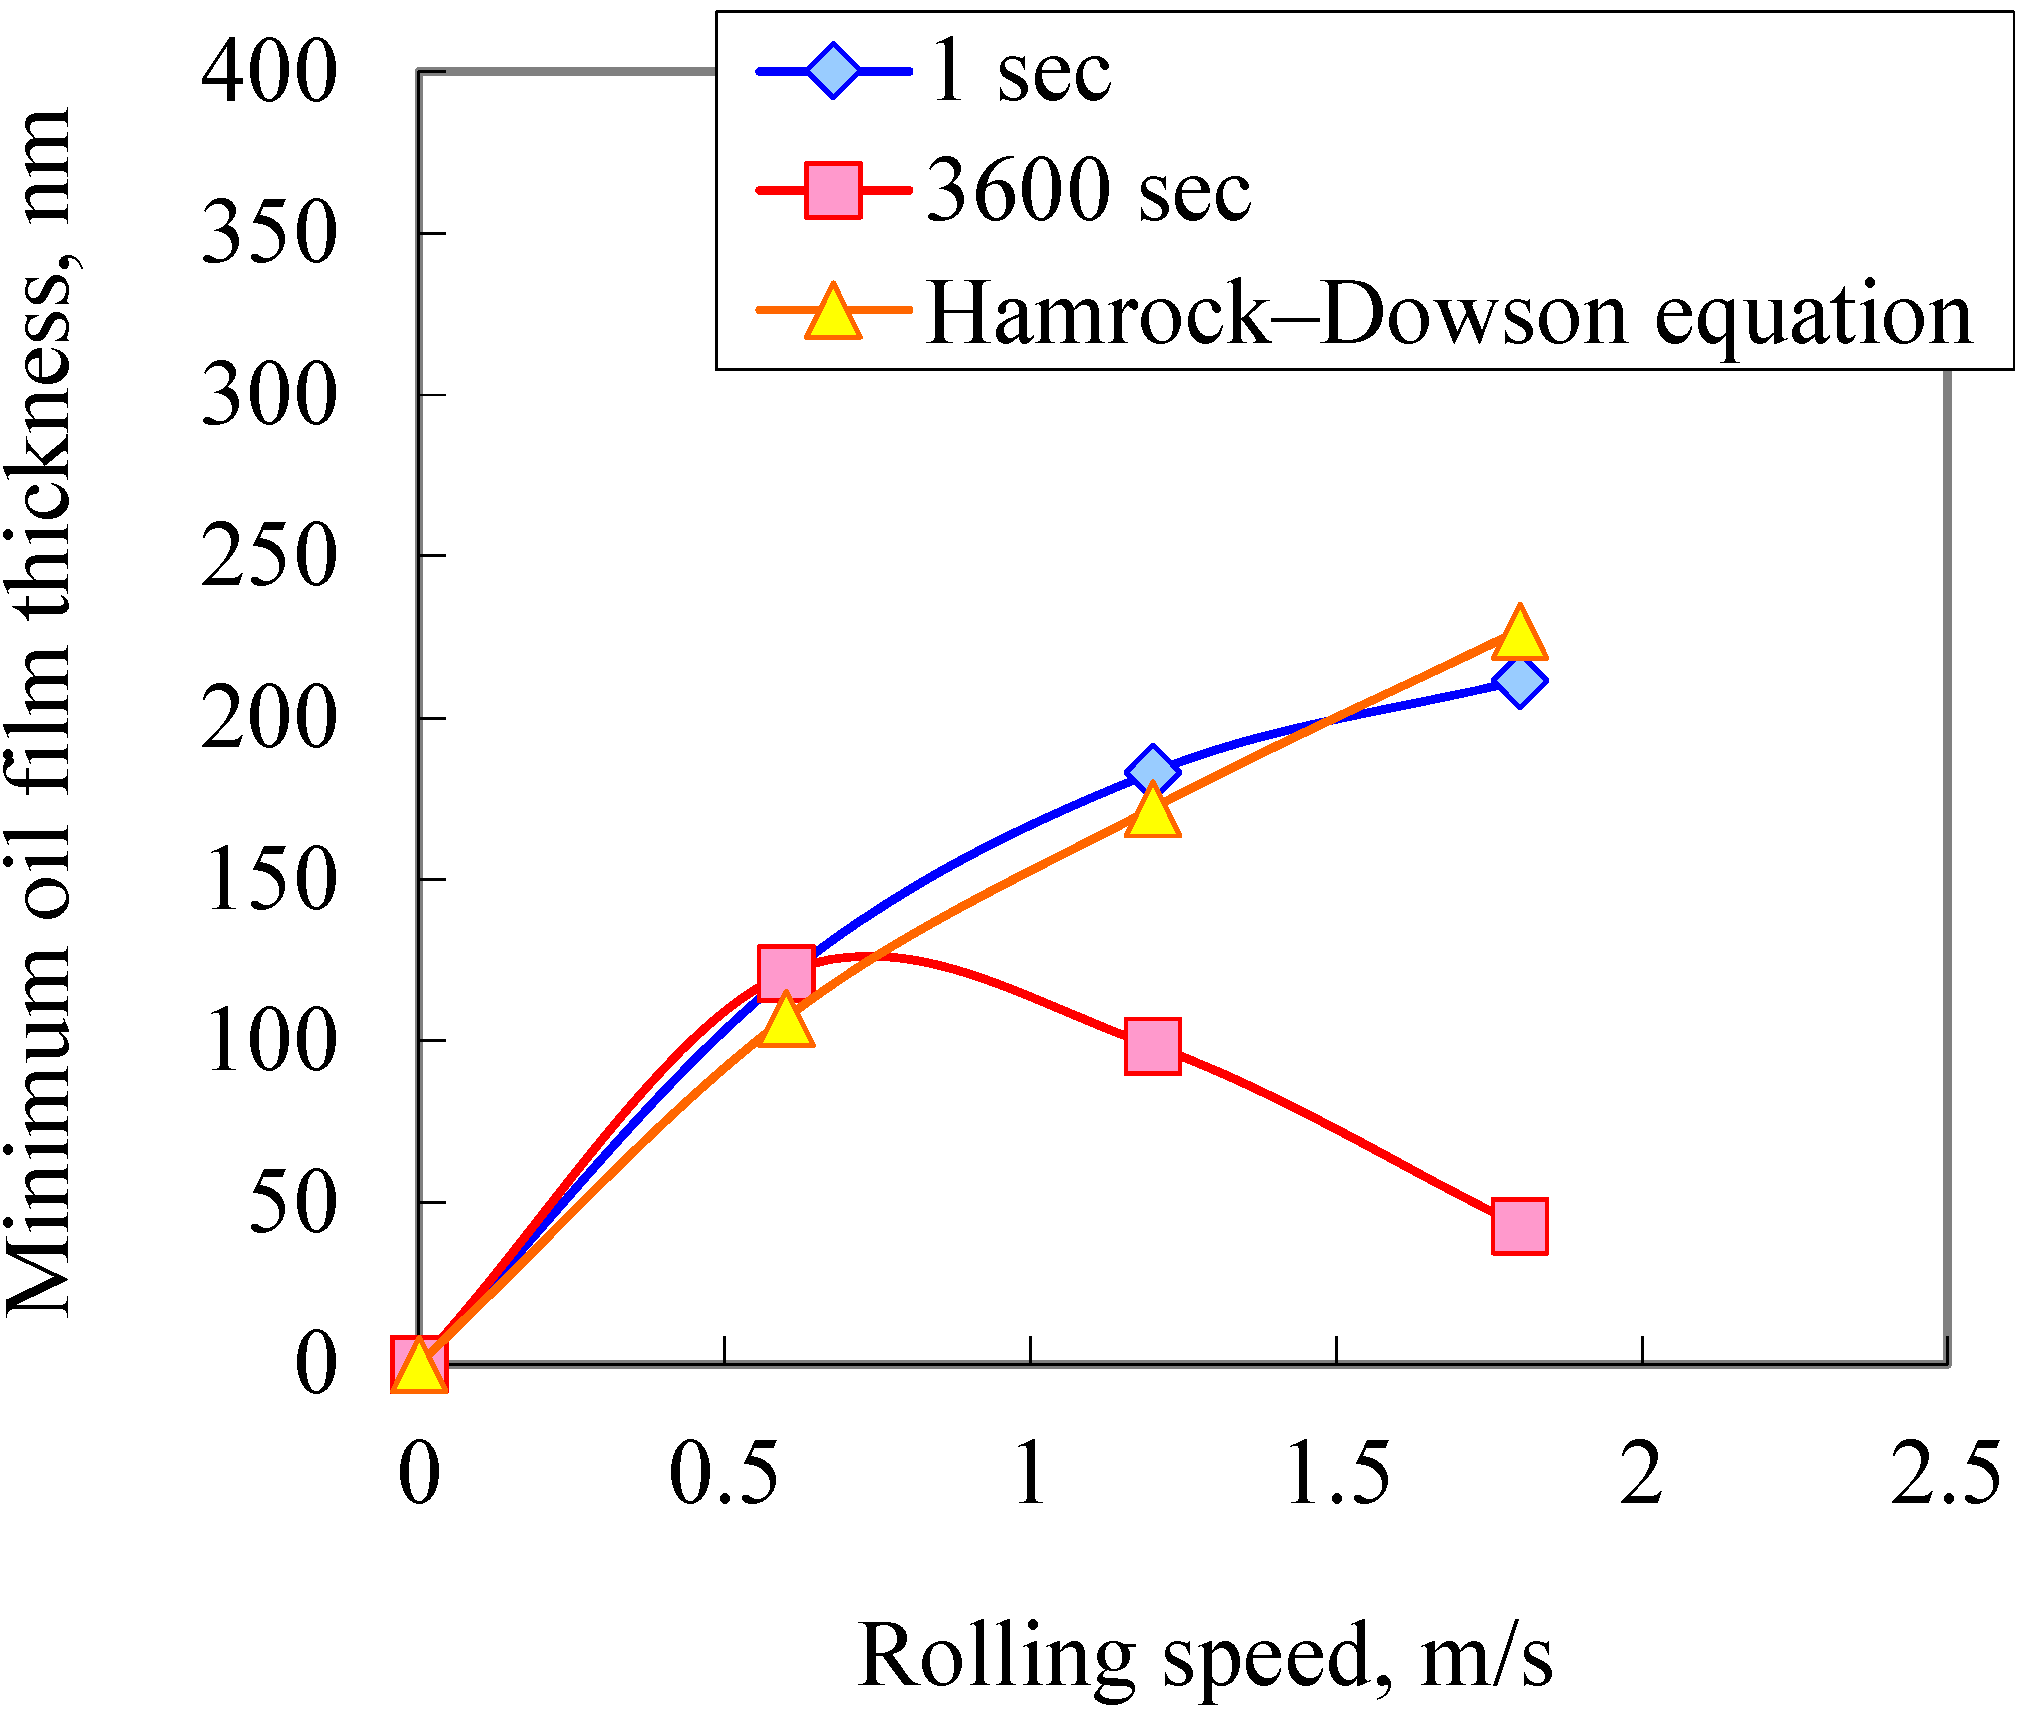
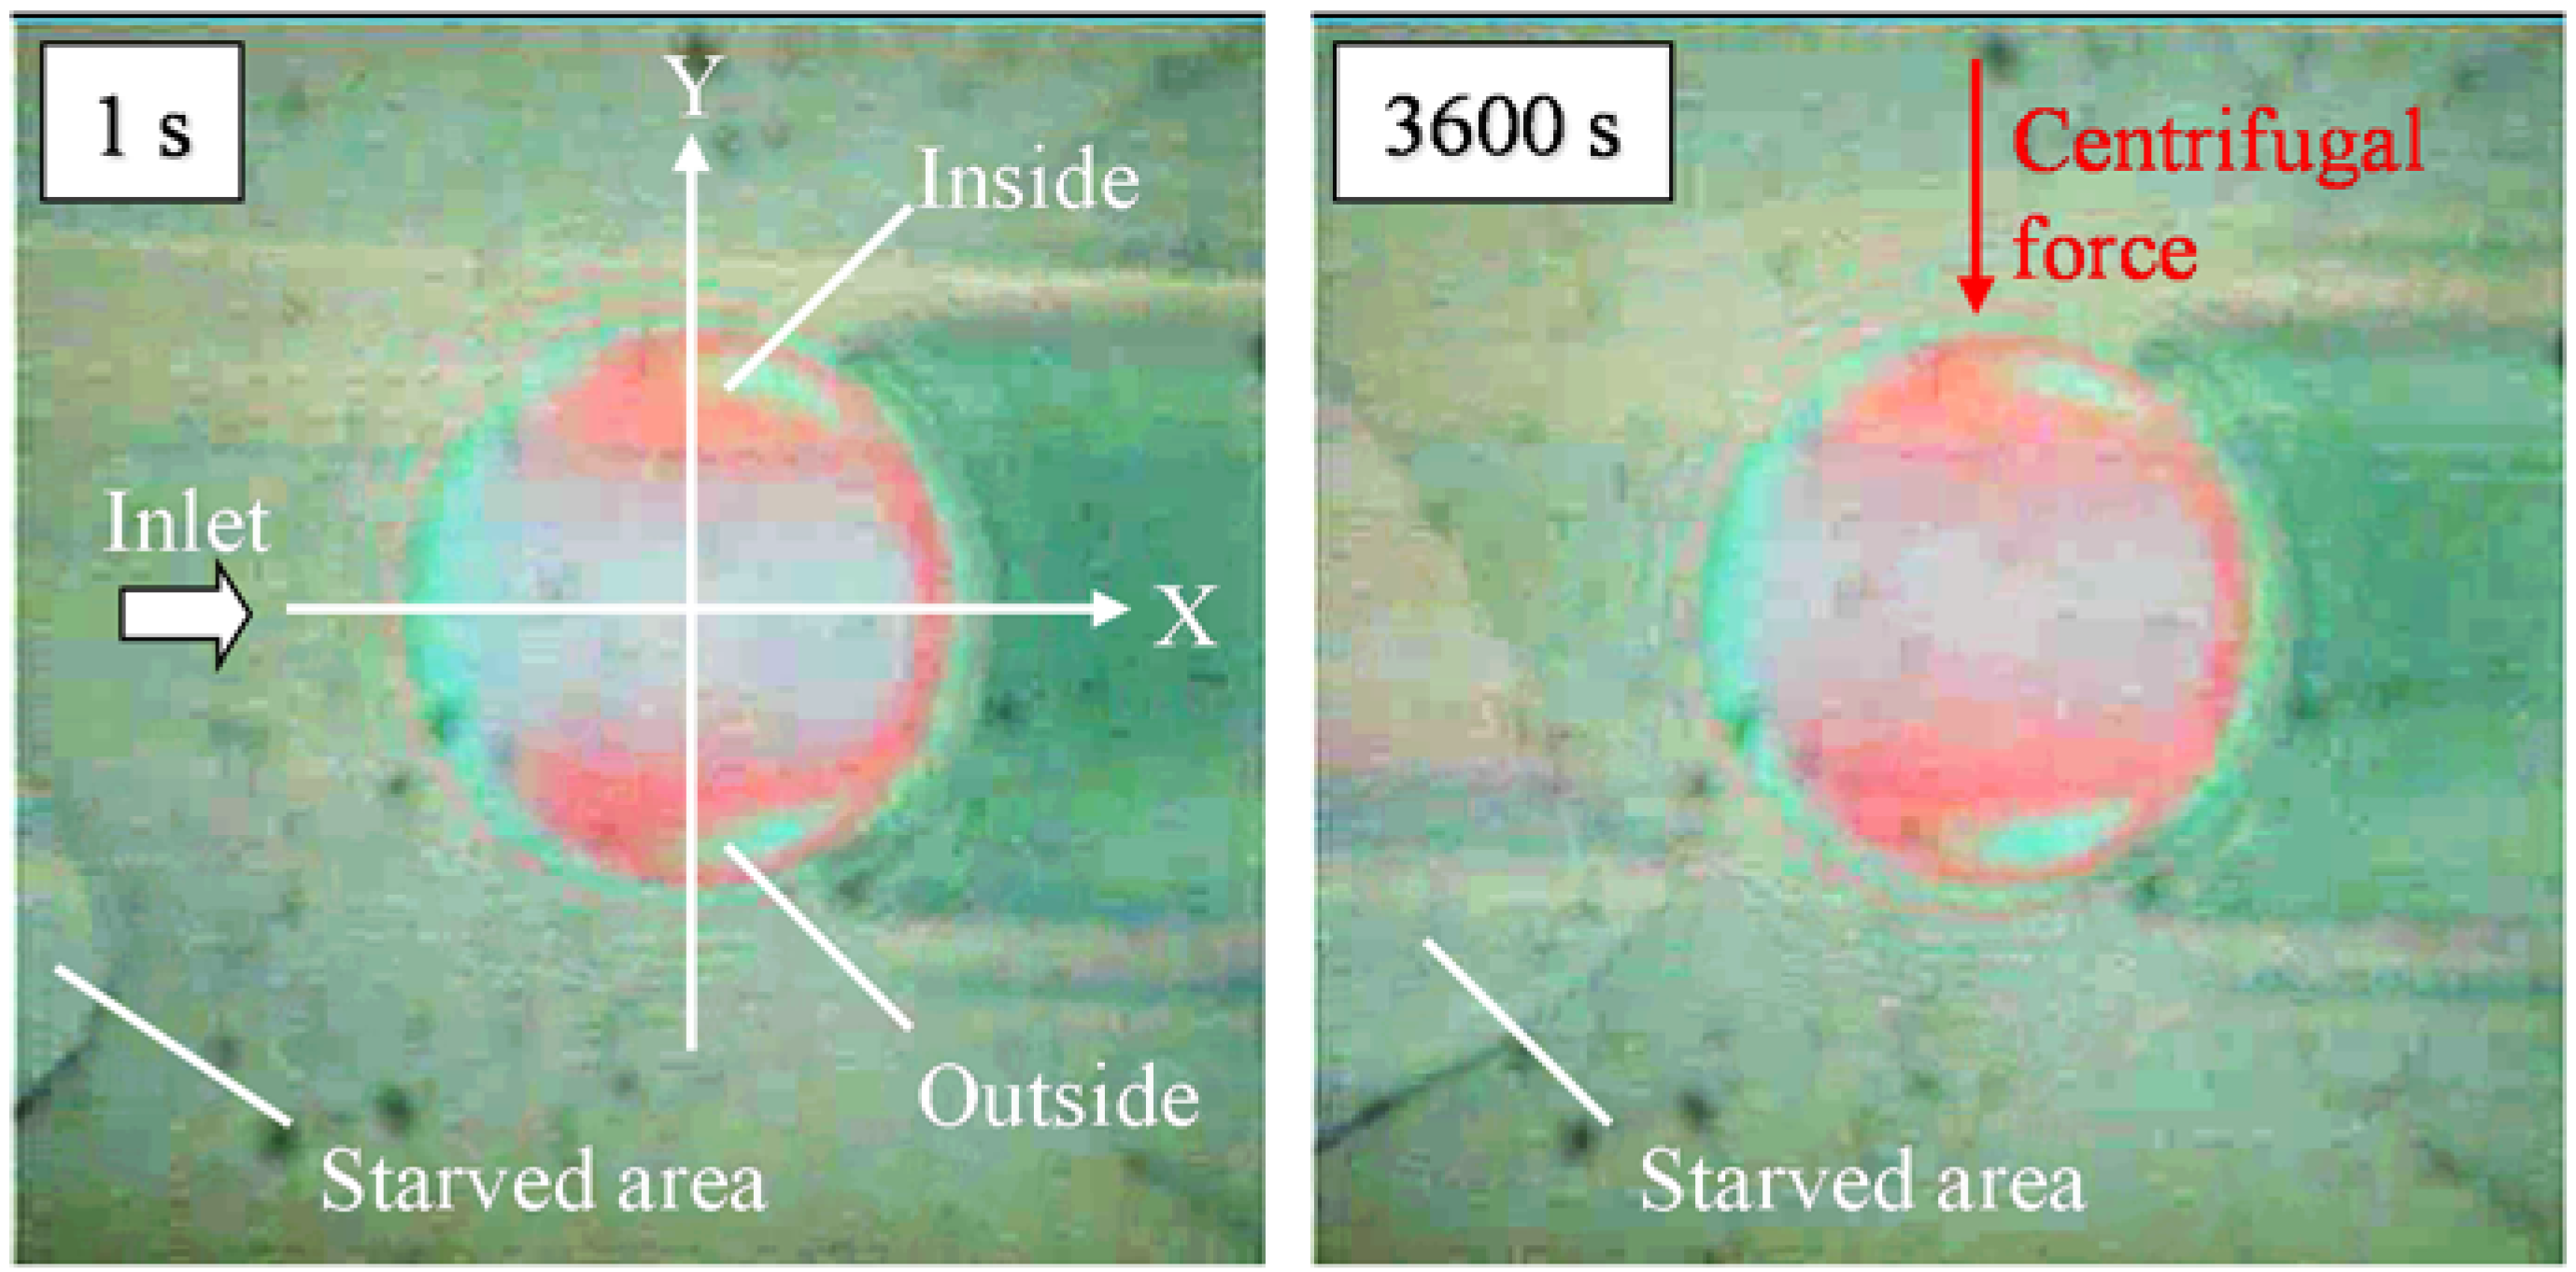
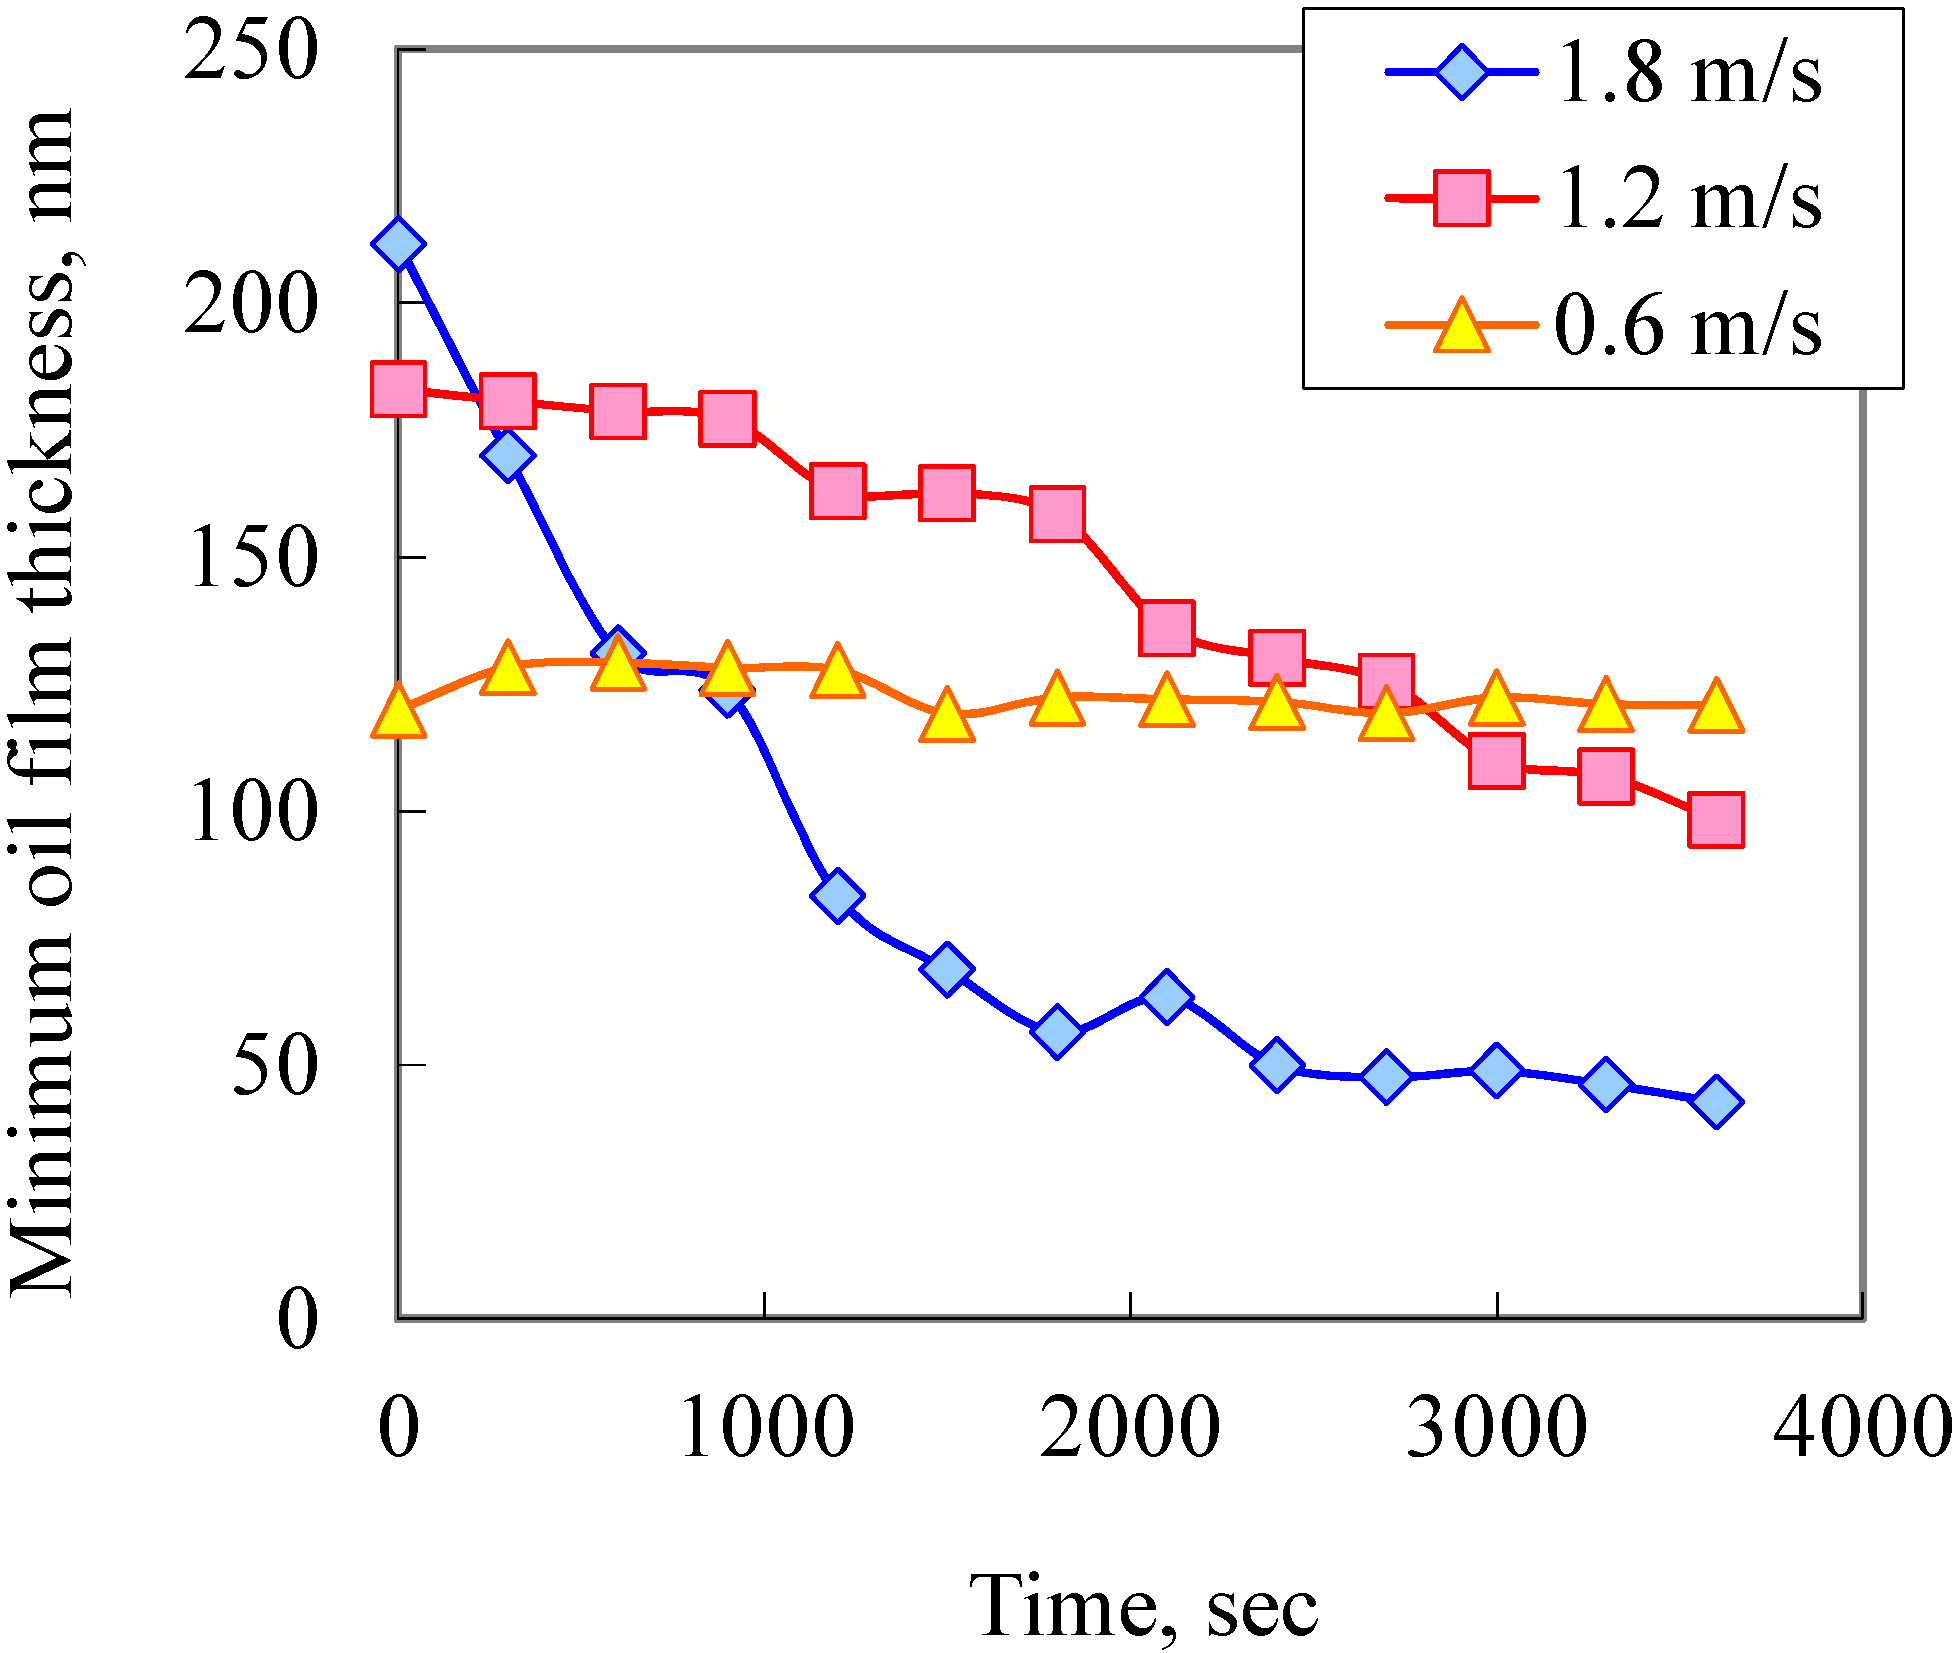
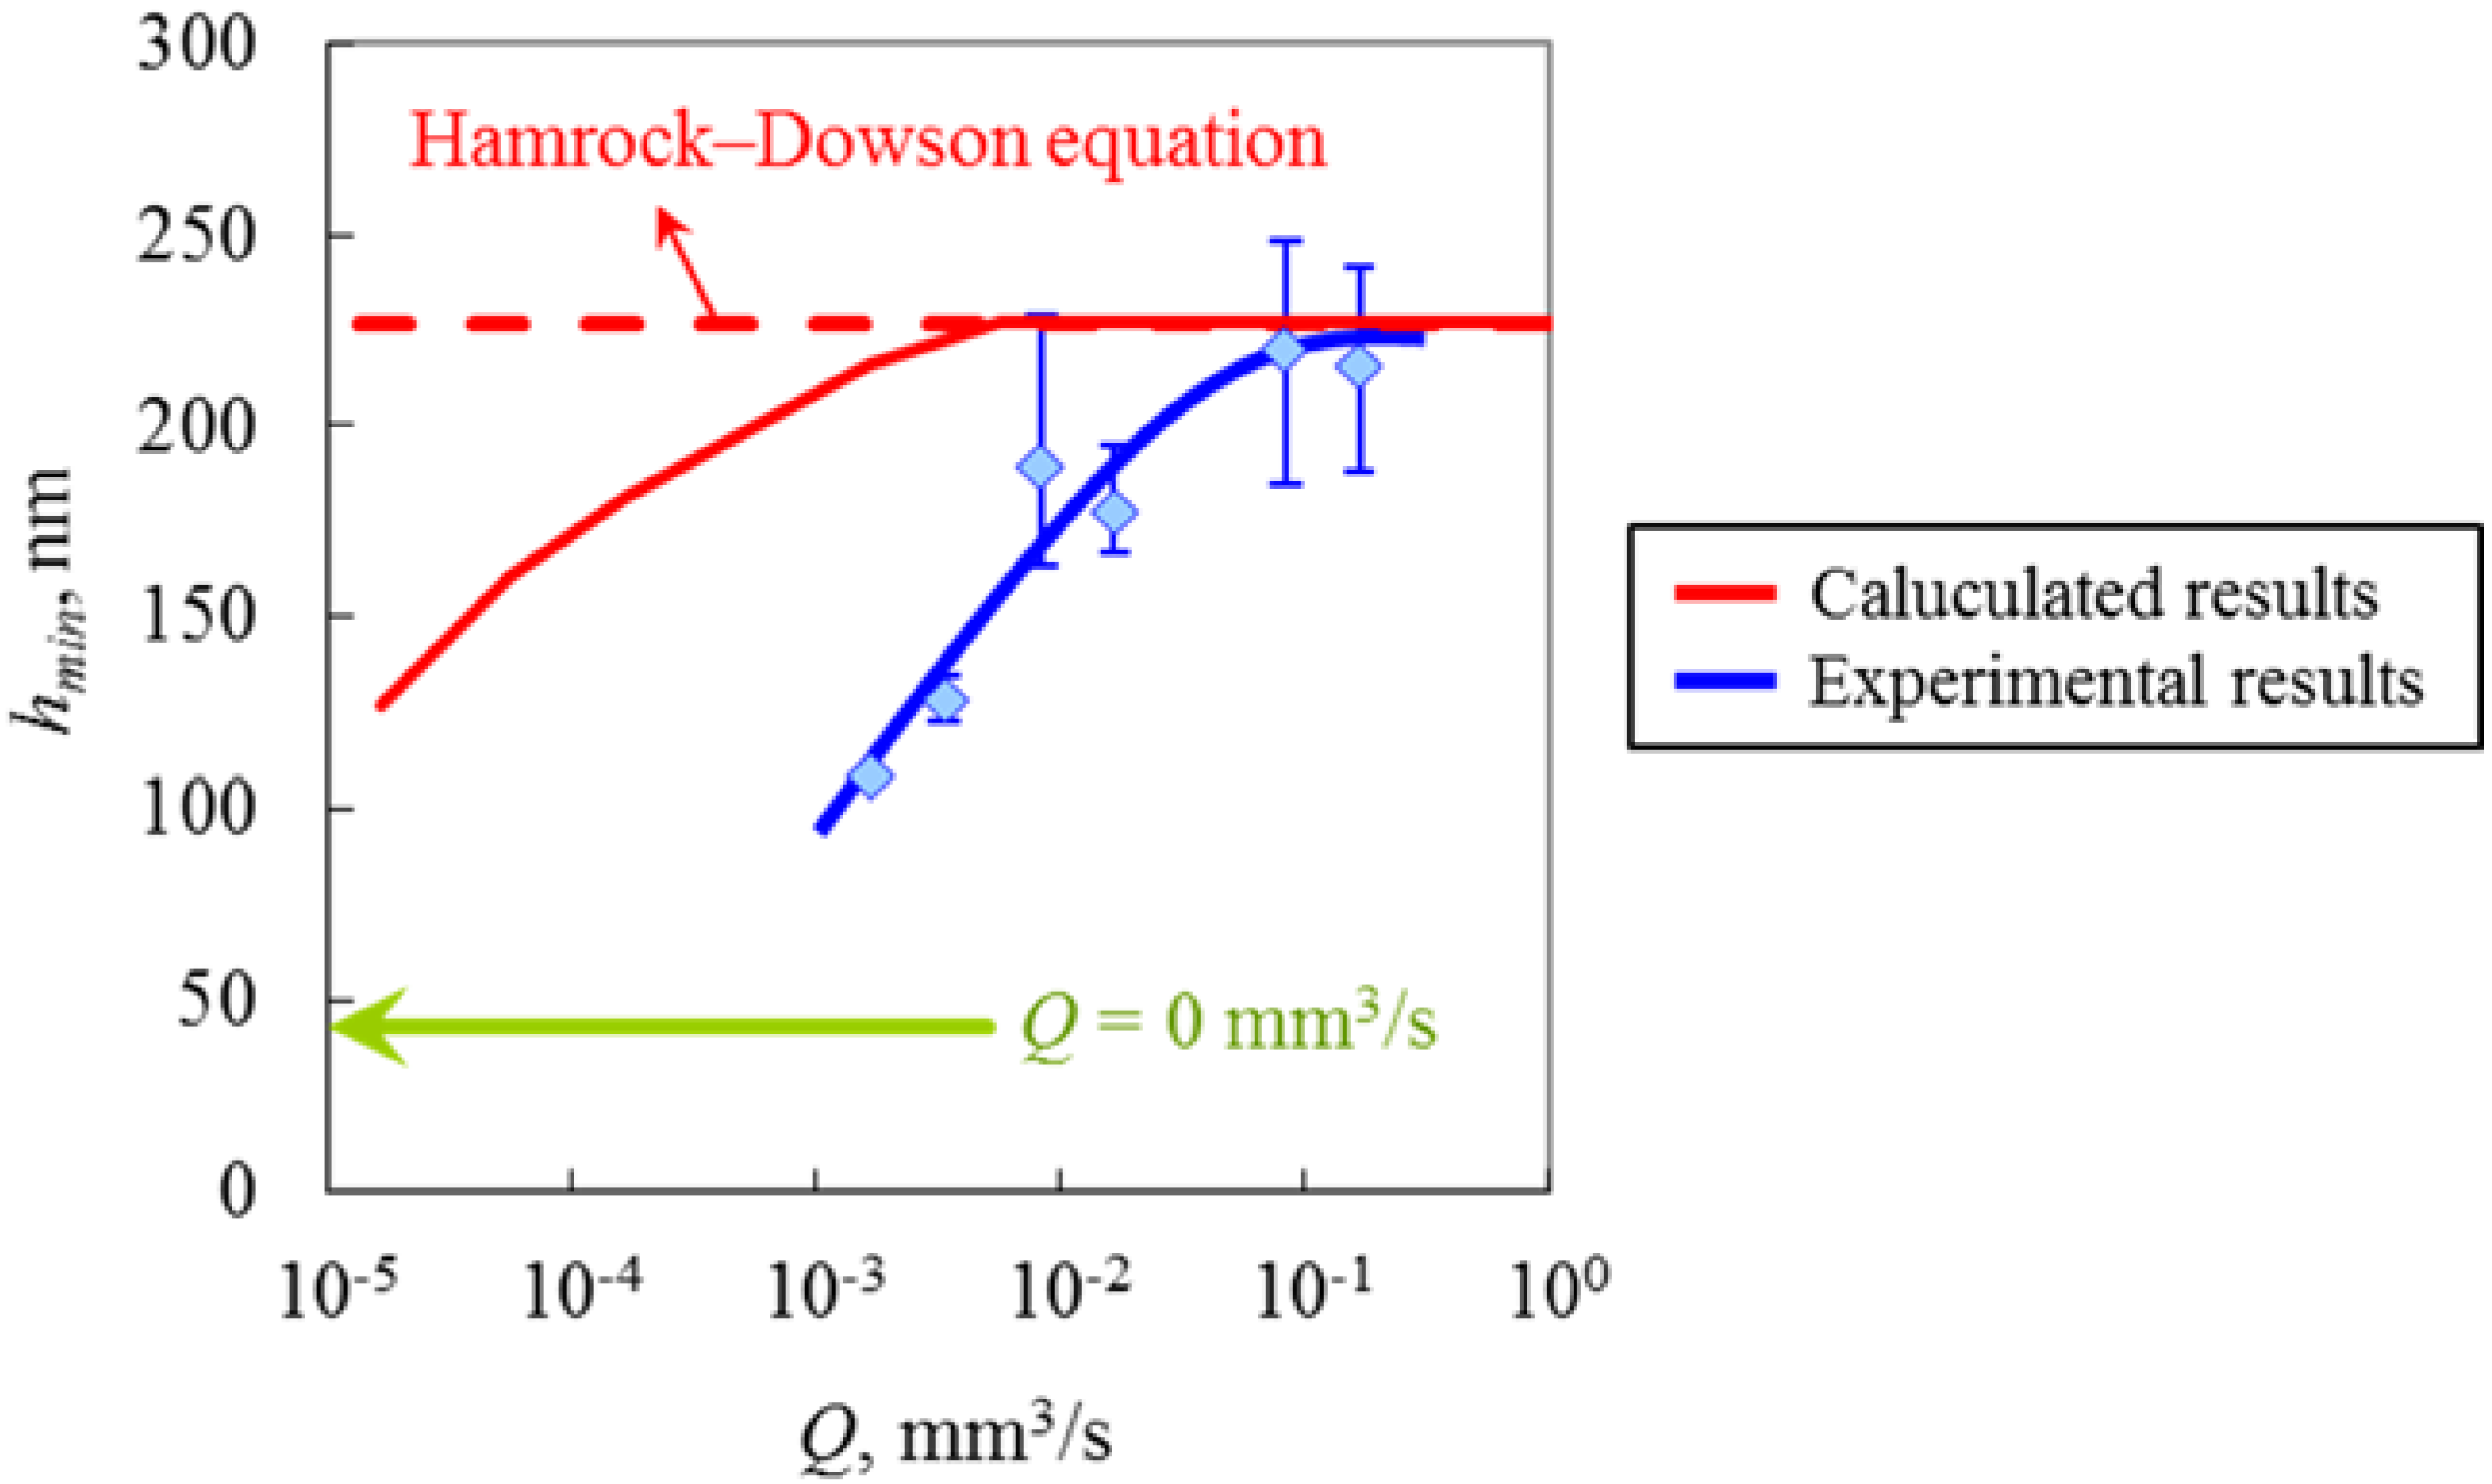
  • Based on the Hamrock-Dowson equation, with fully flooded lubrication, the oil film thickness increases with the rolling speed; with starved lubrication, the oil film thickness decreases because the lubricating oil is affected by centrifugal forces.
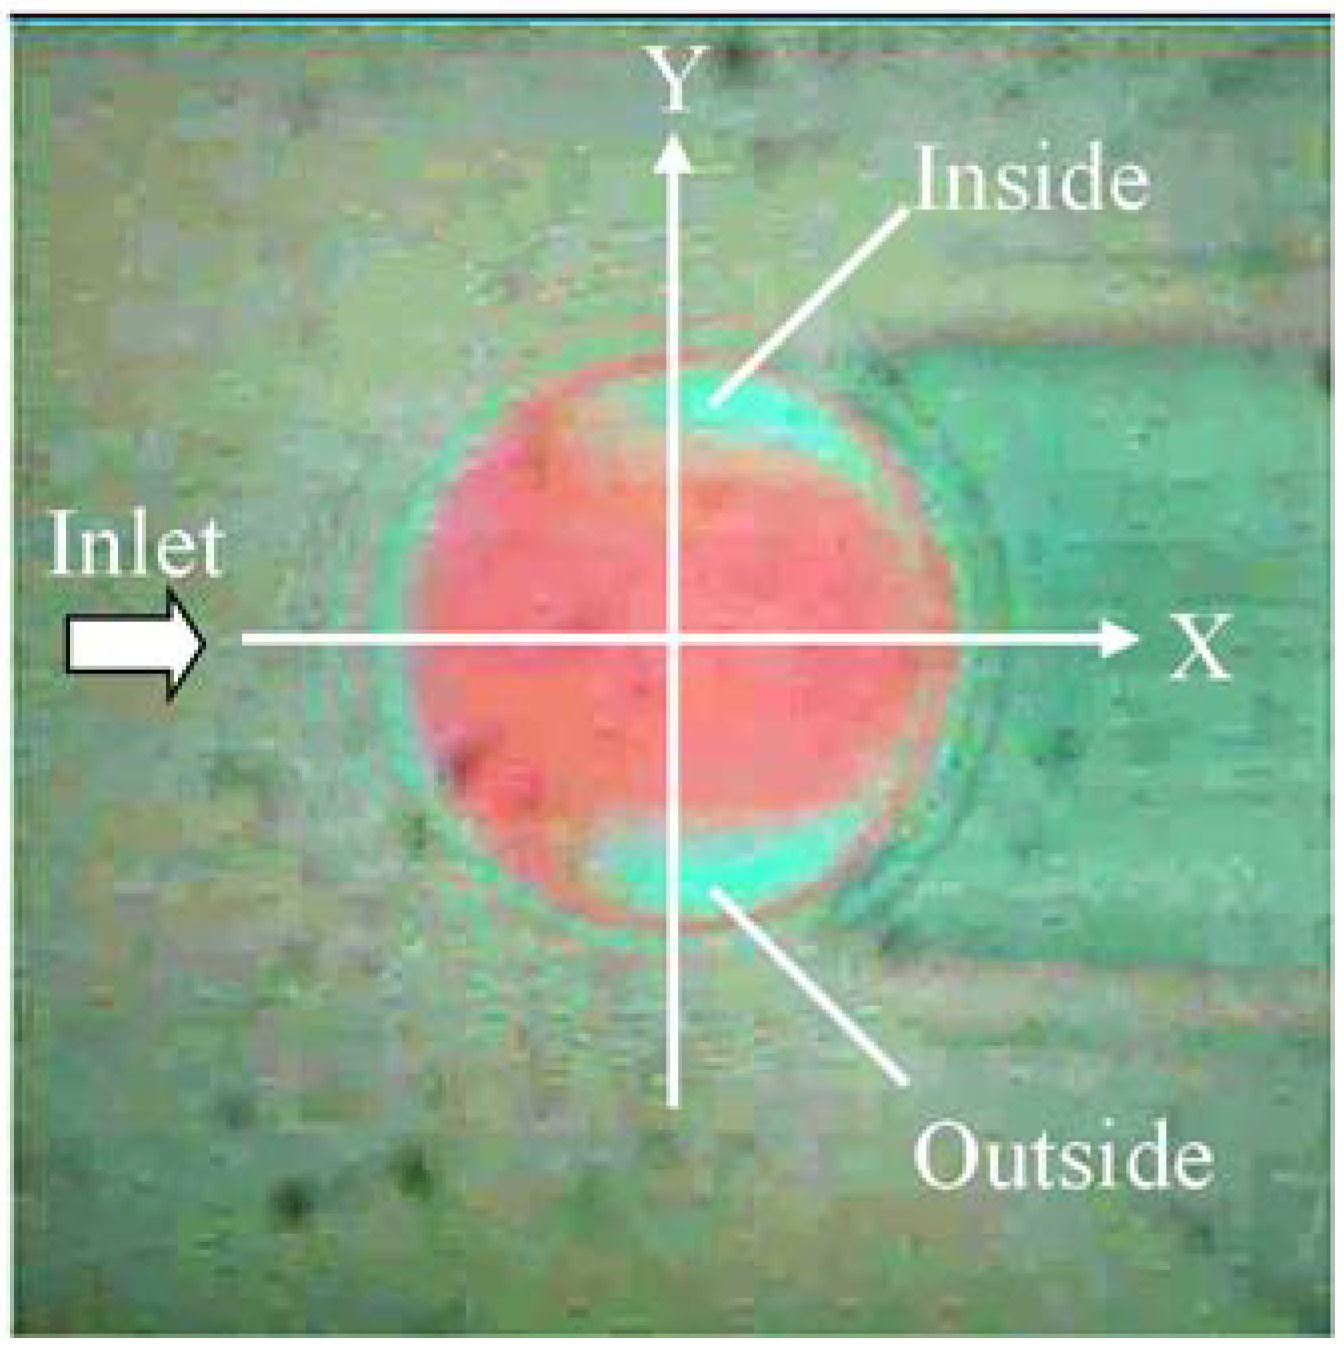
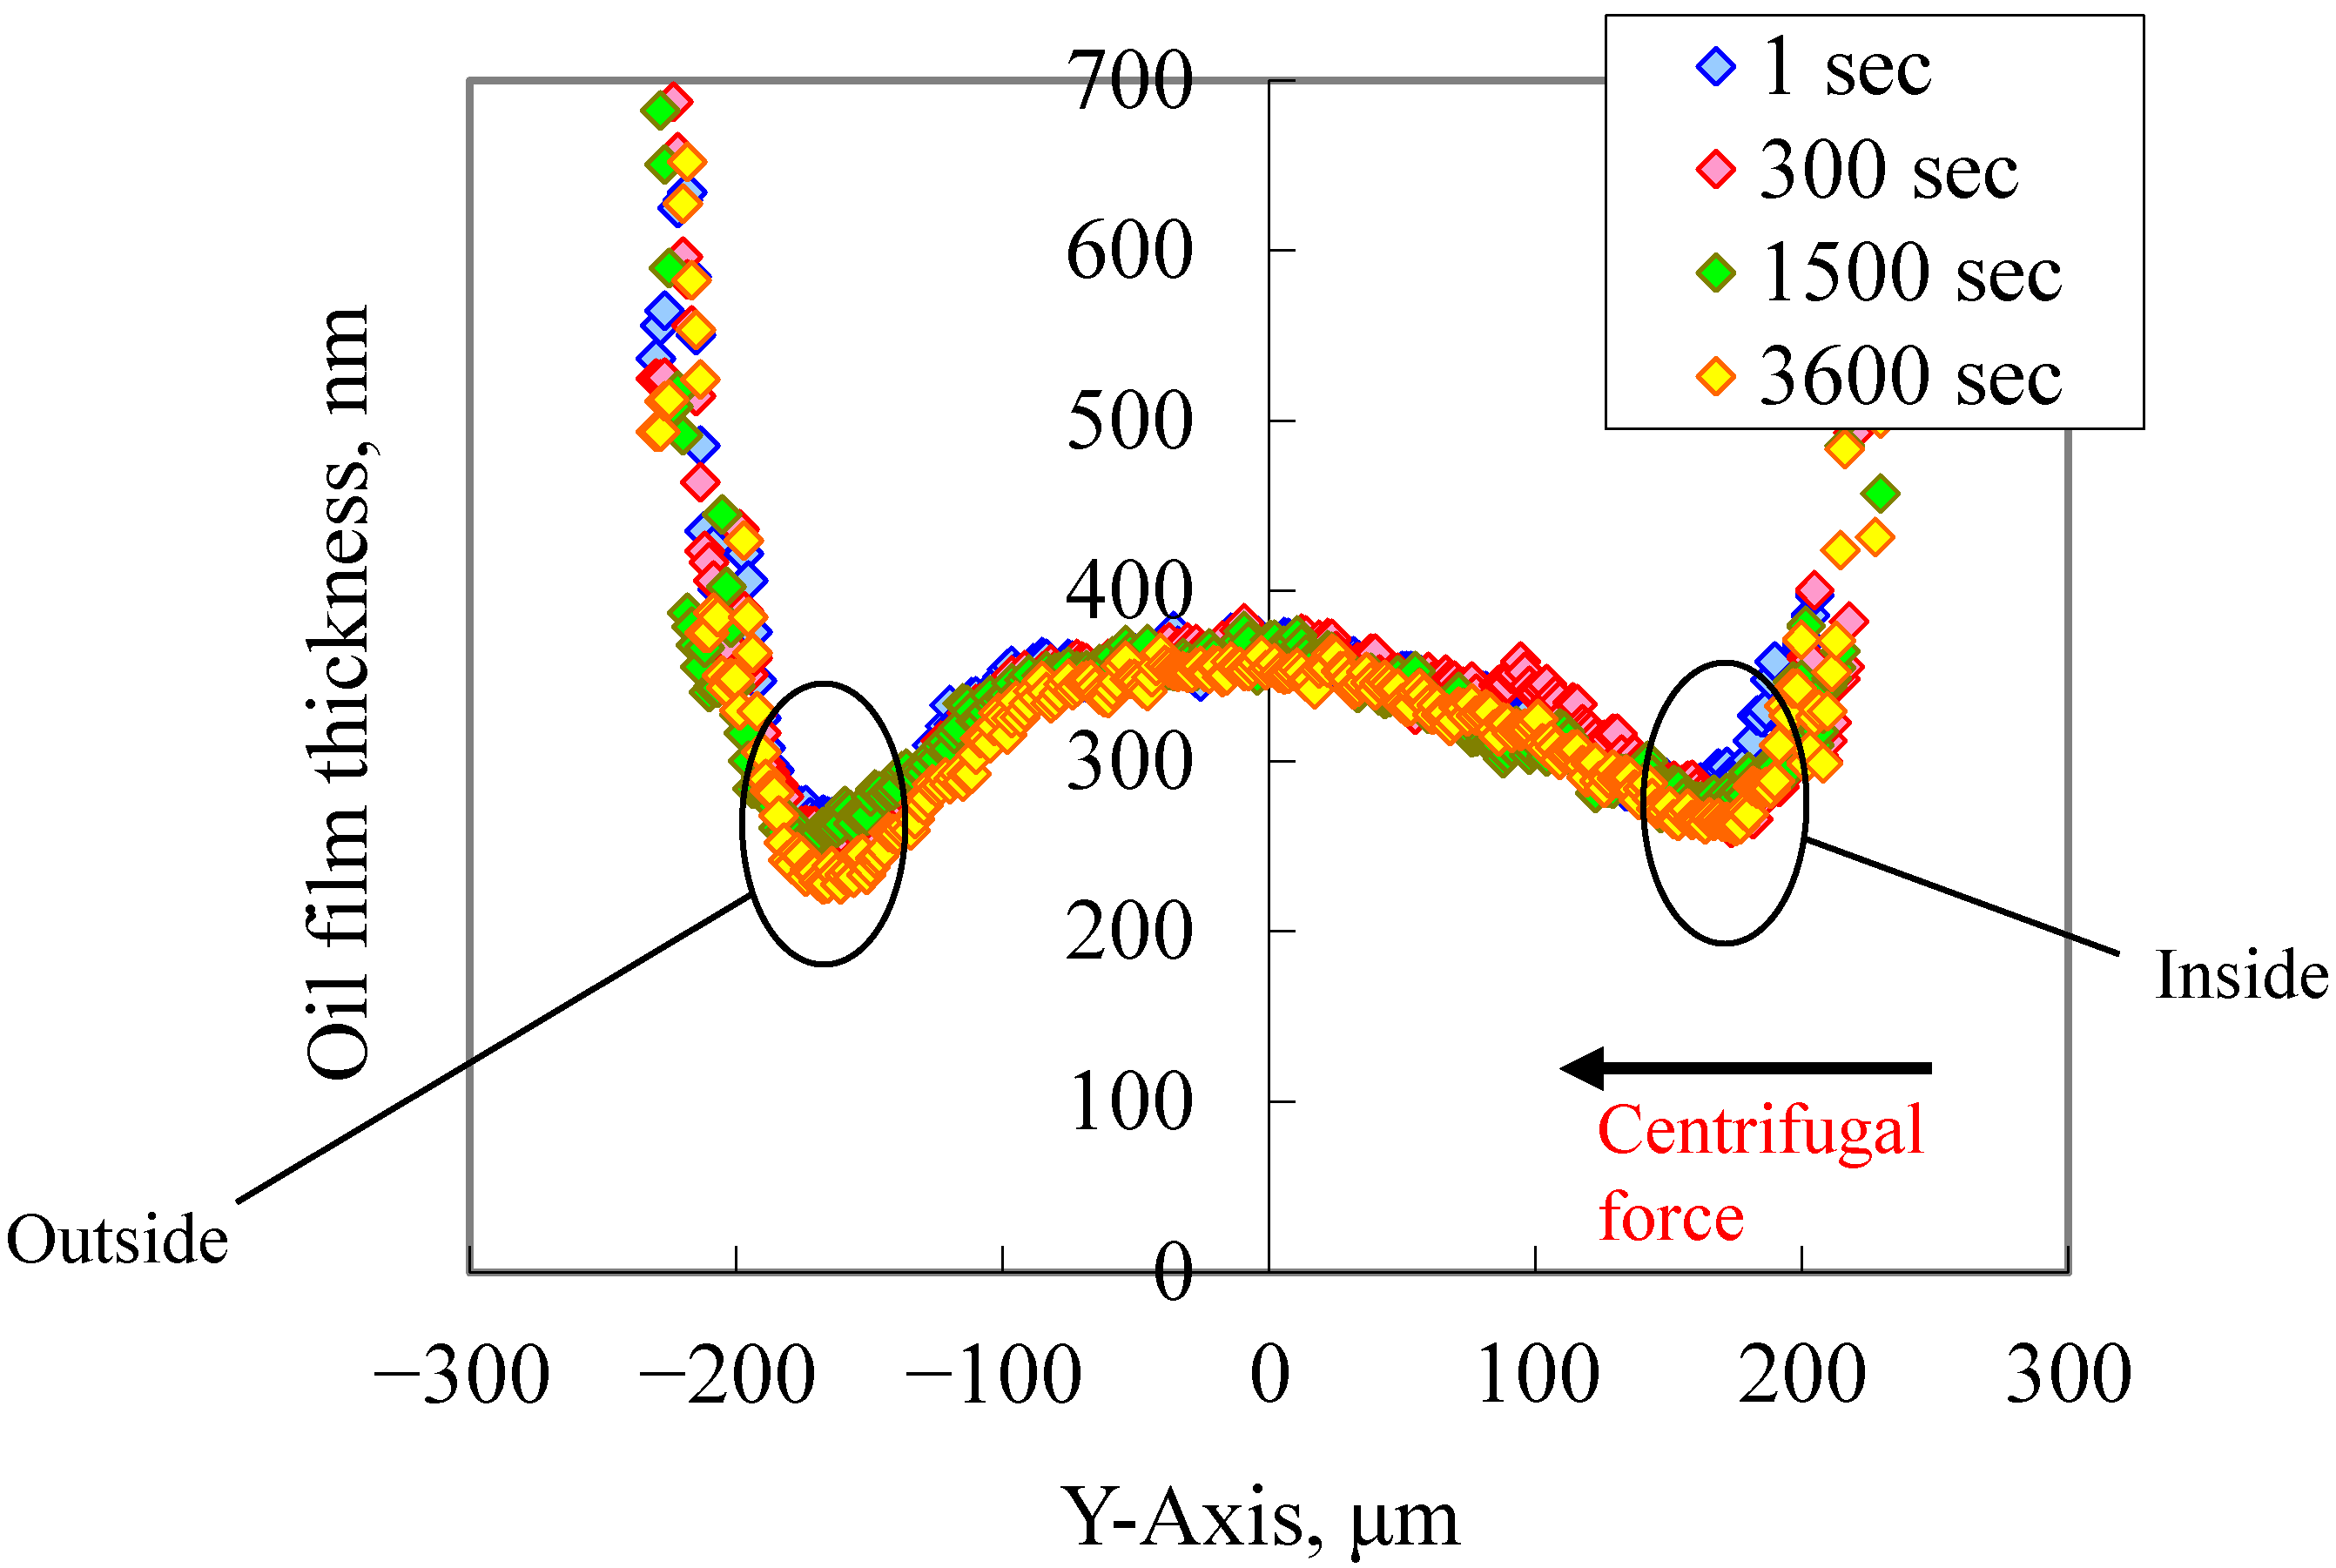
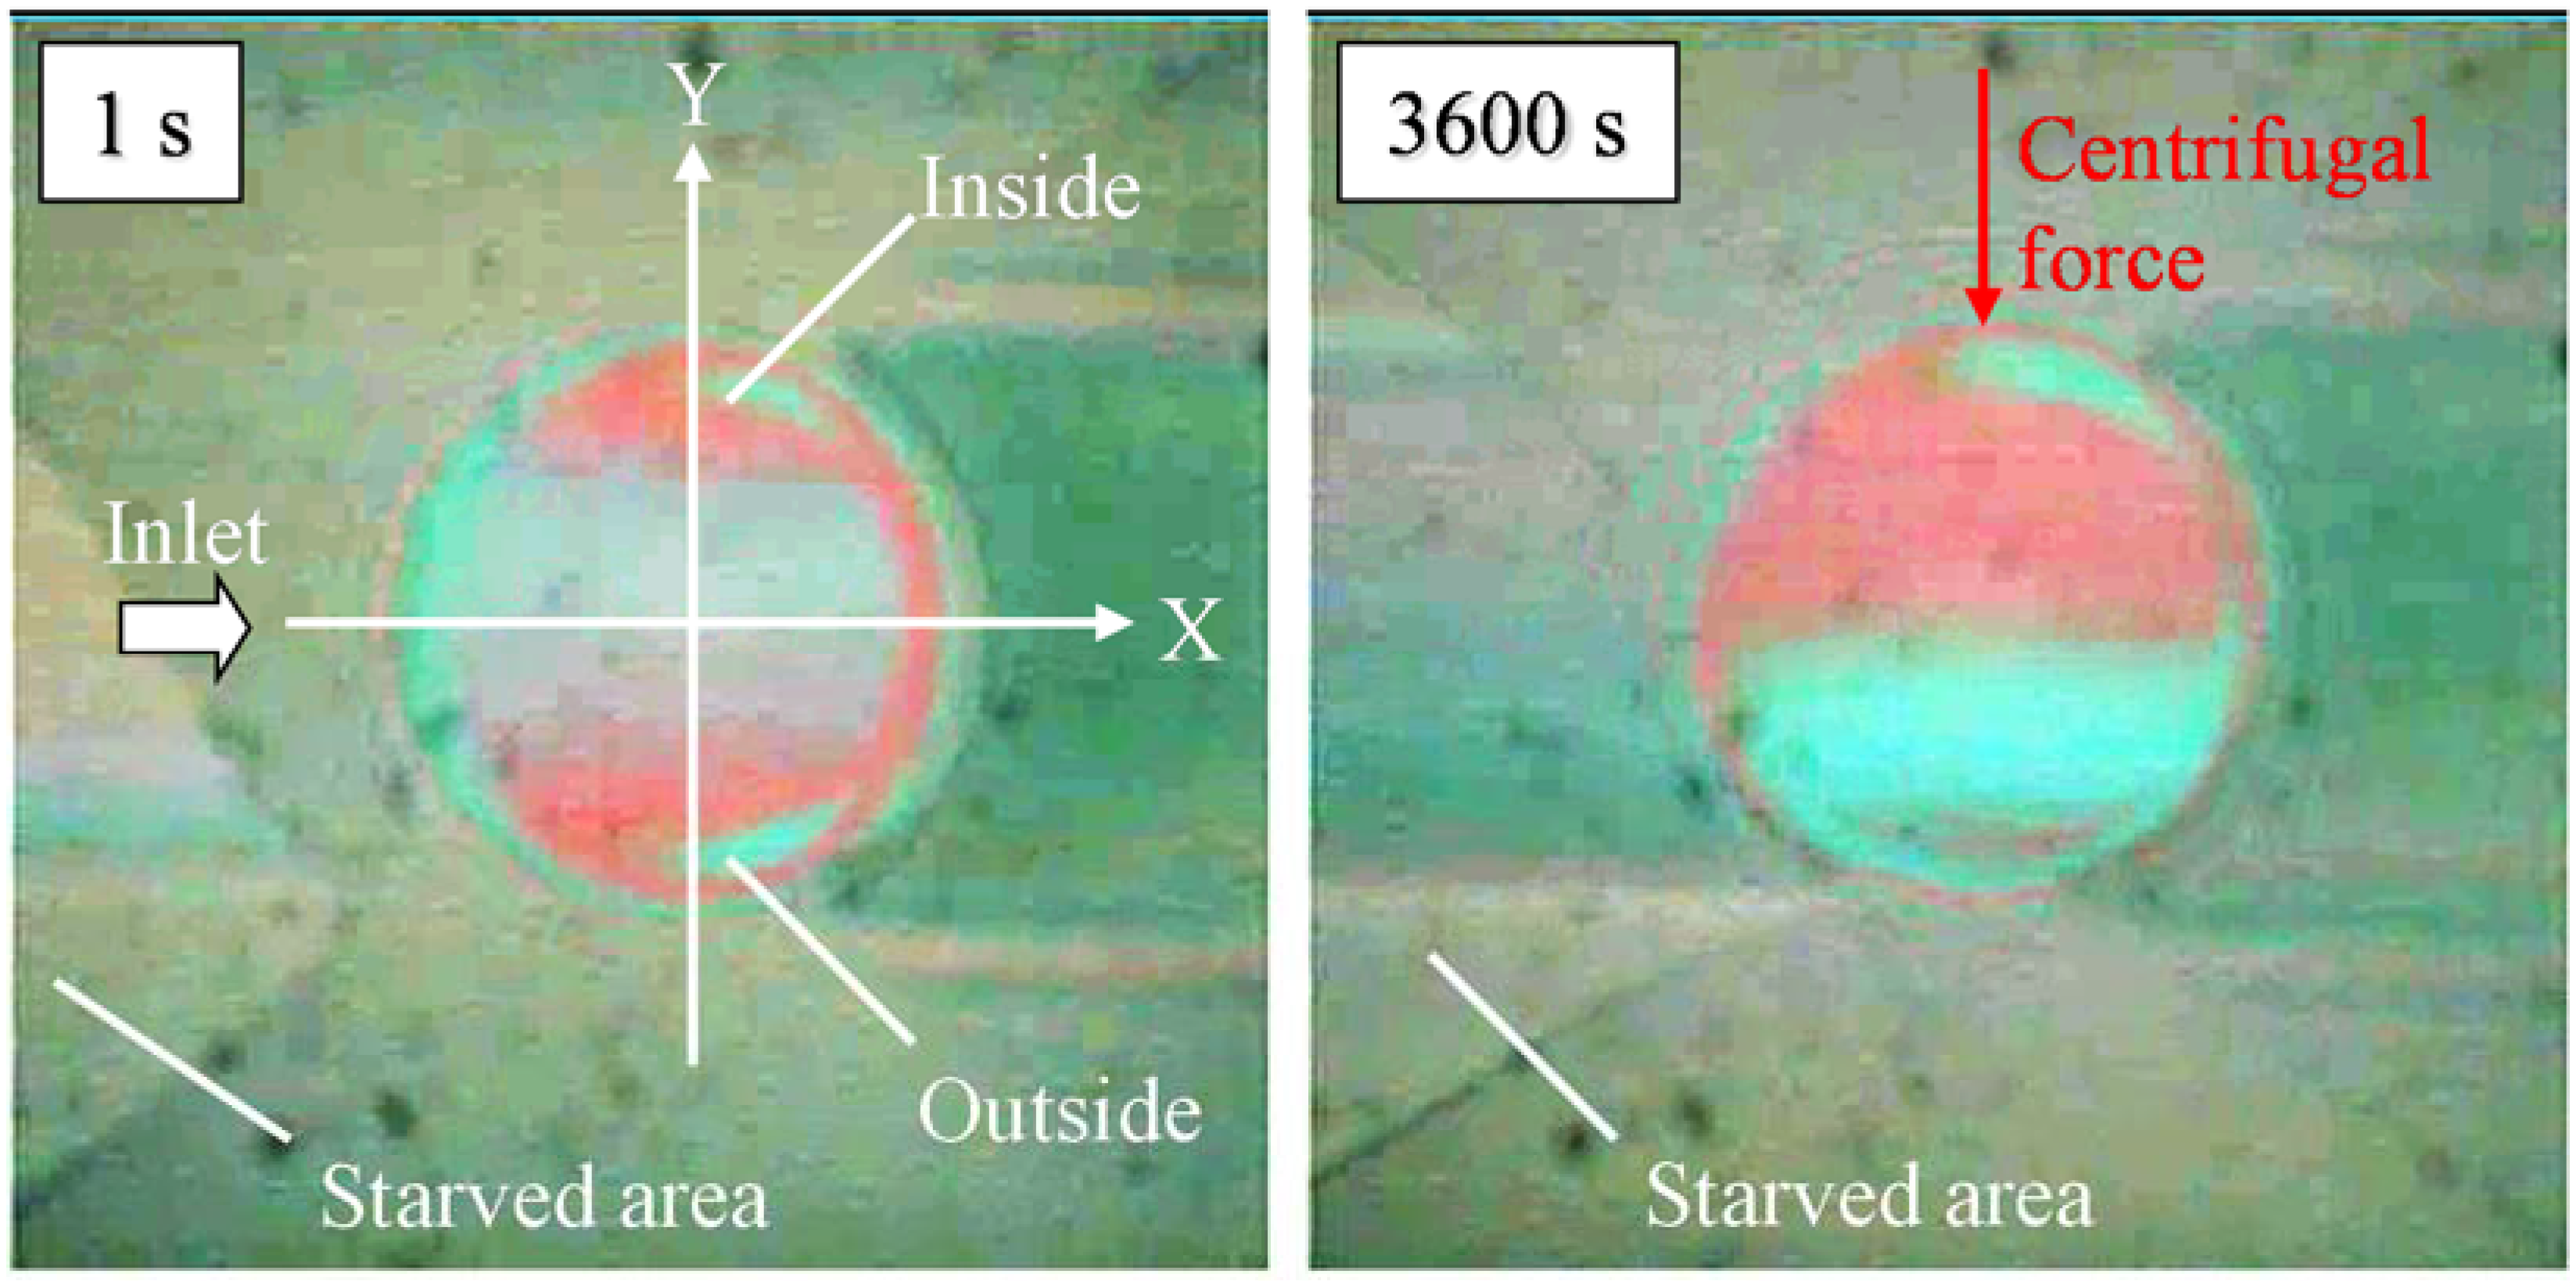
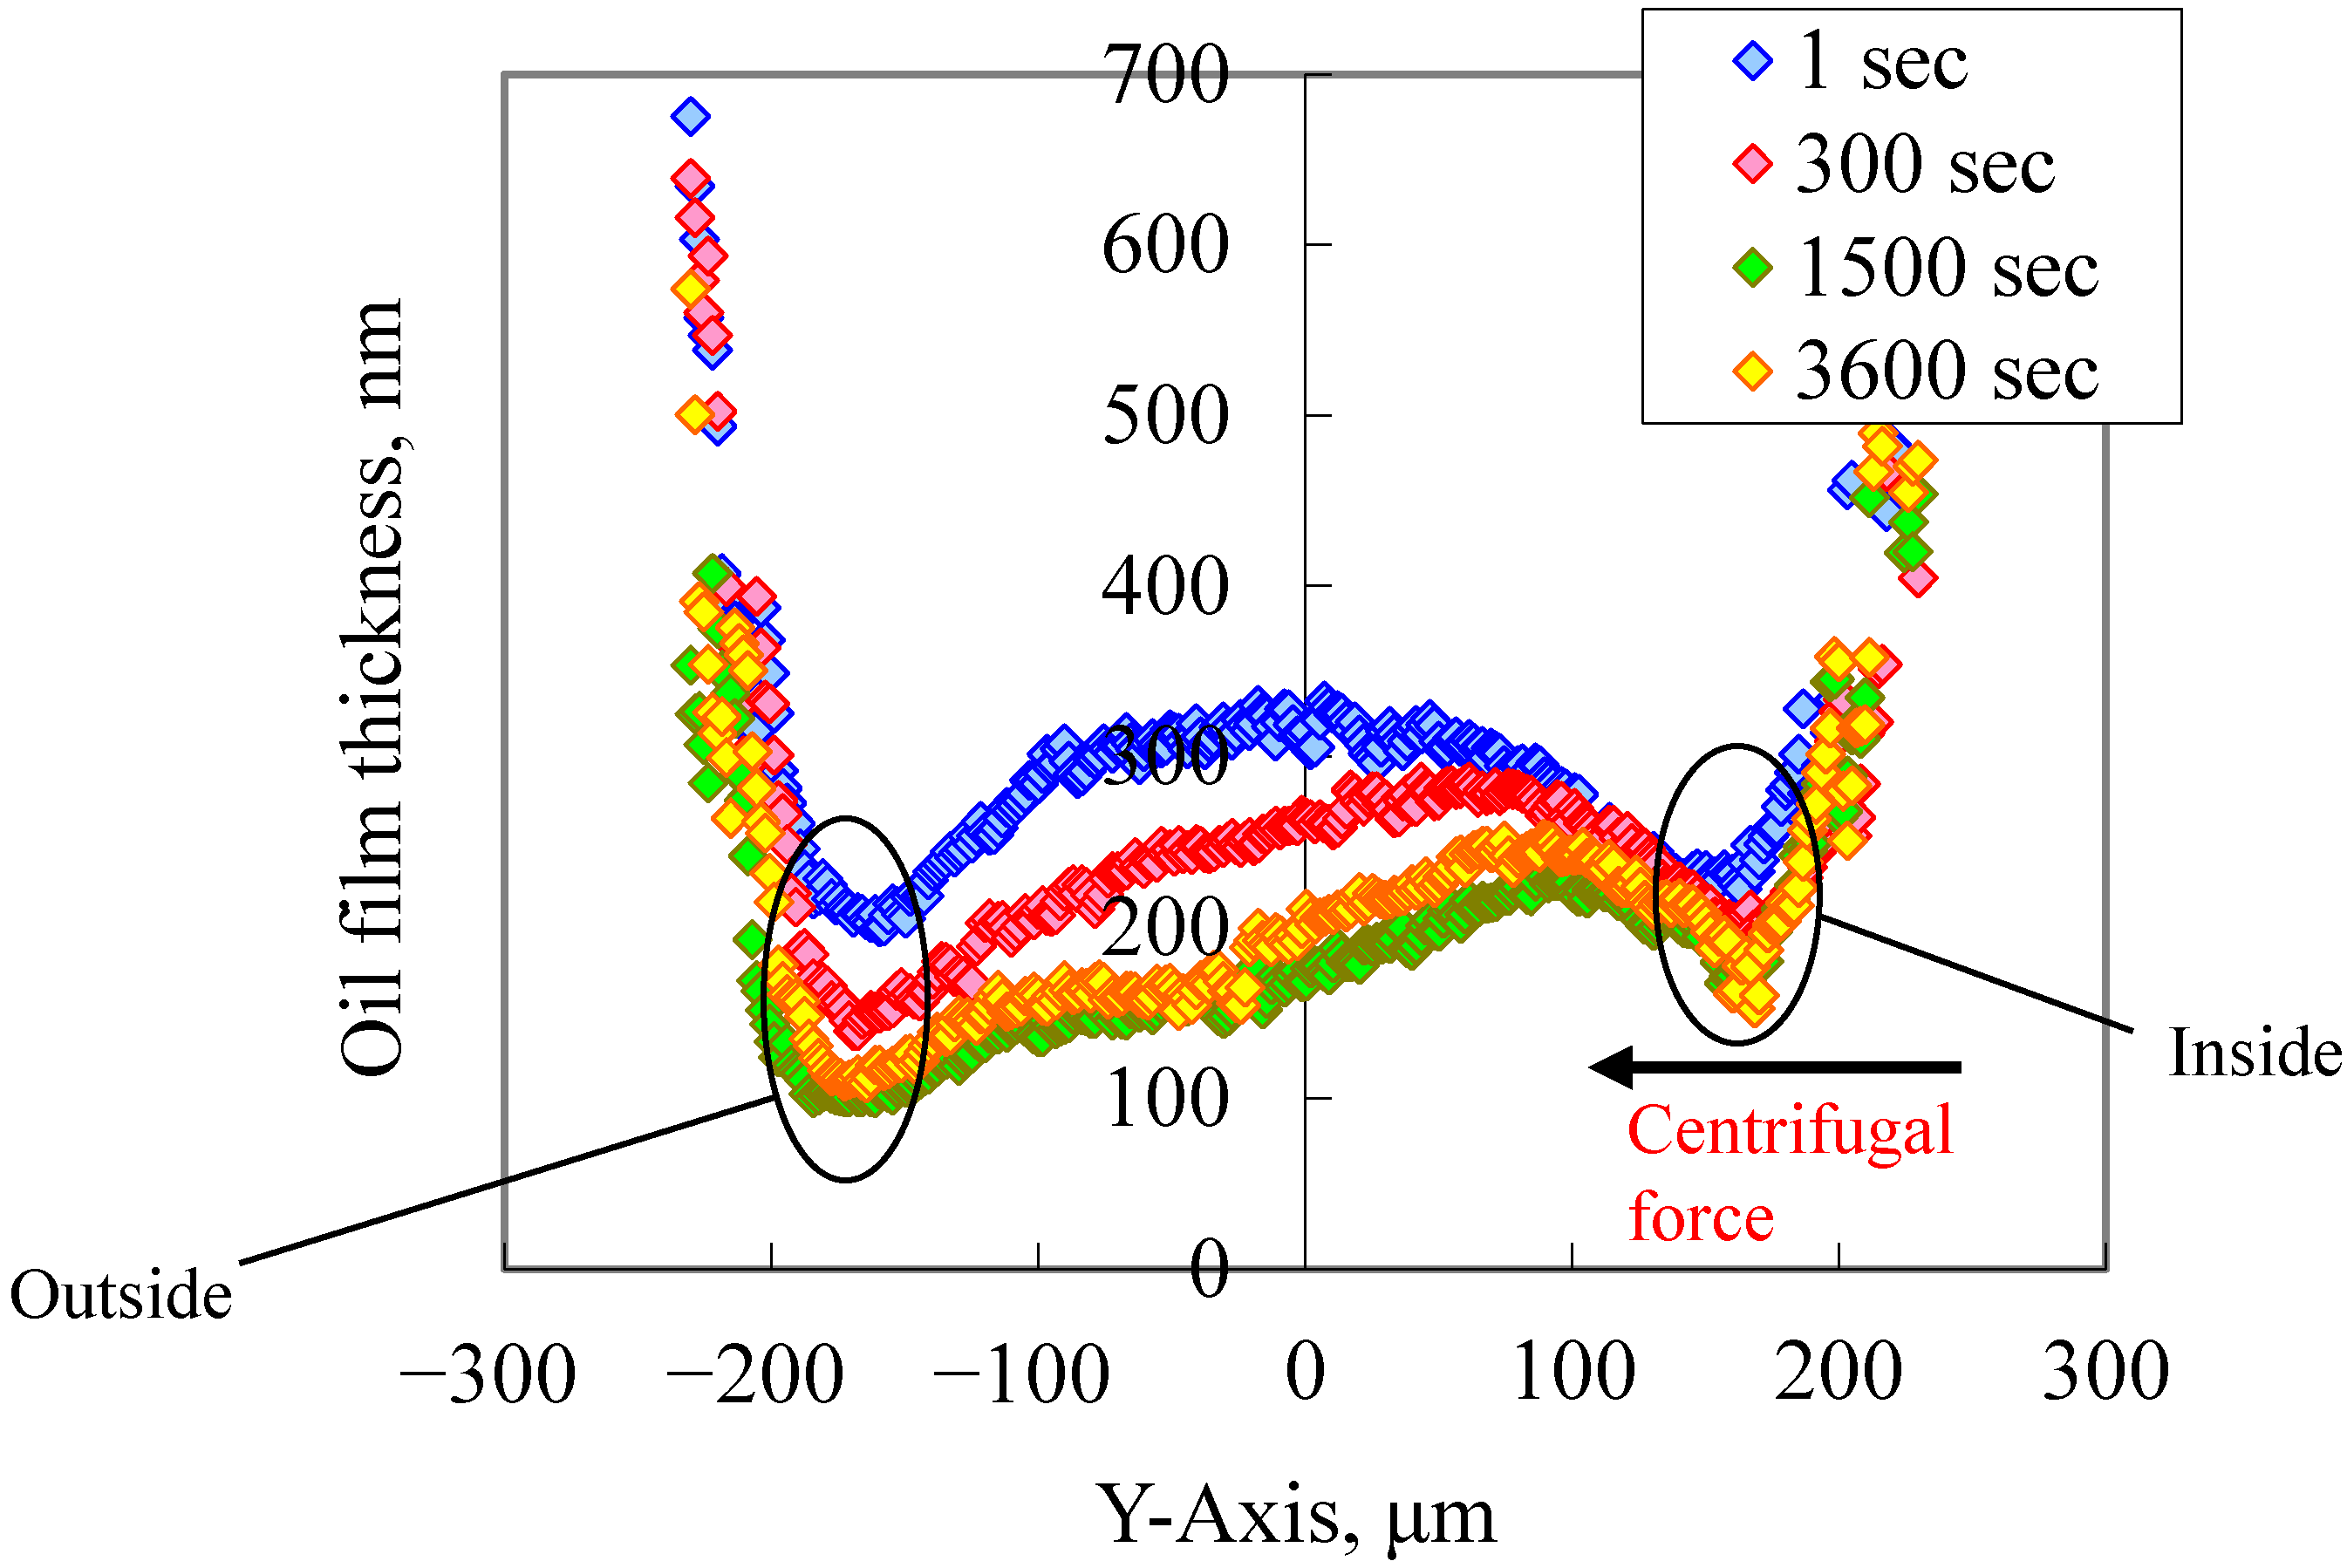
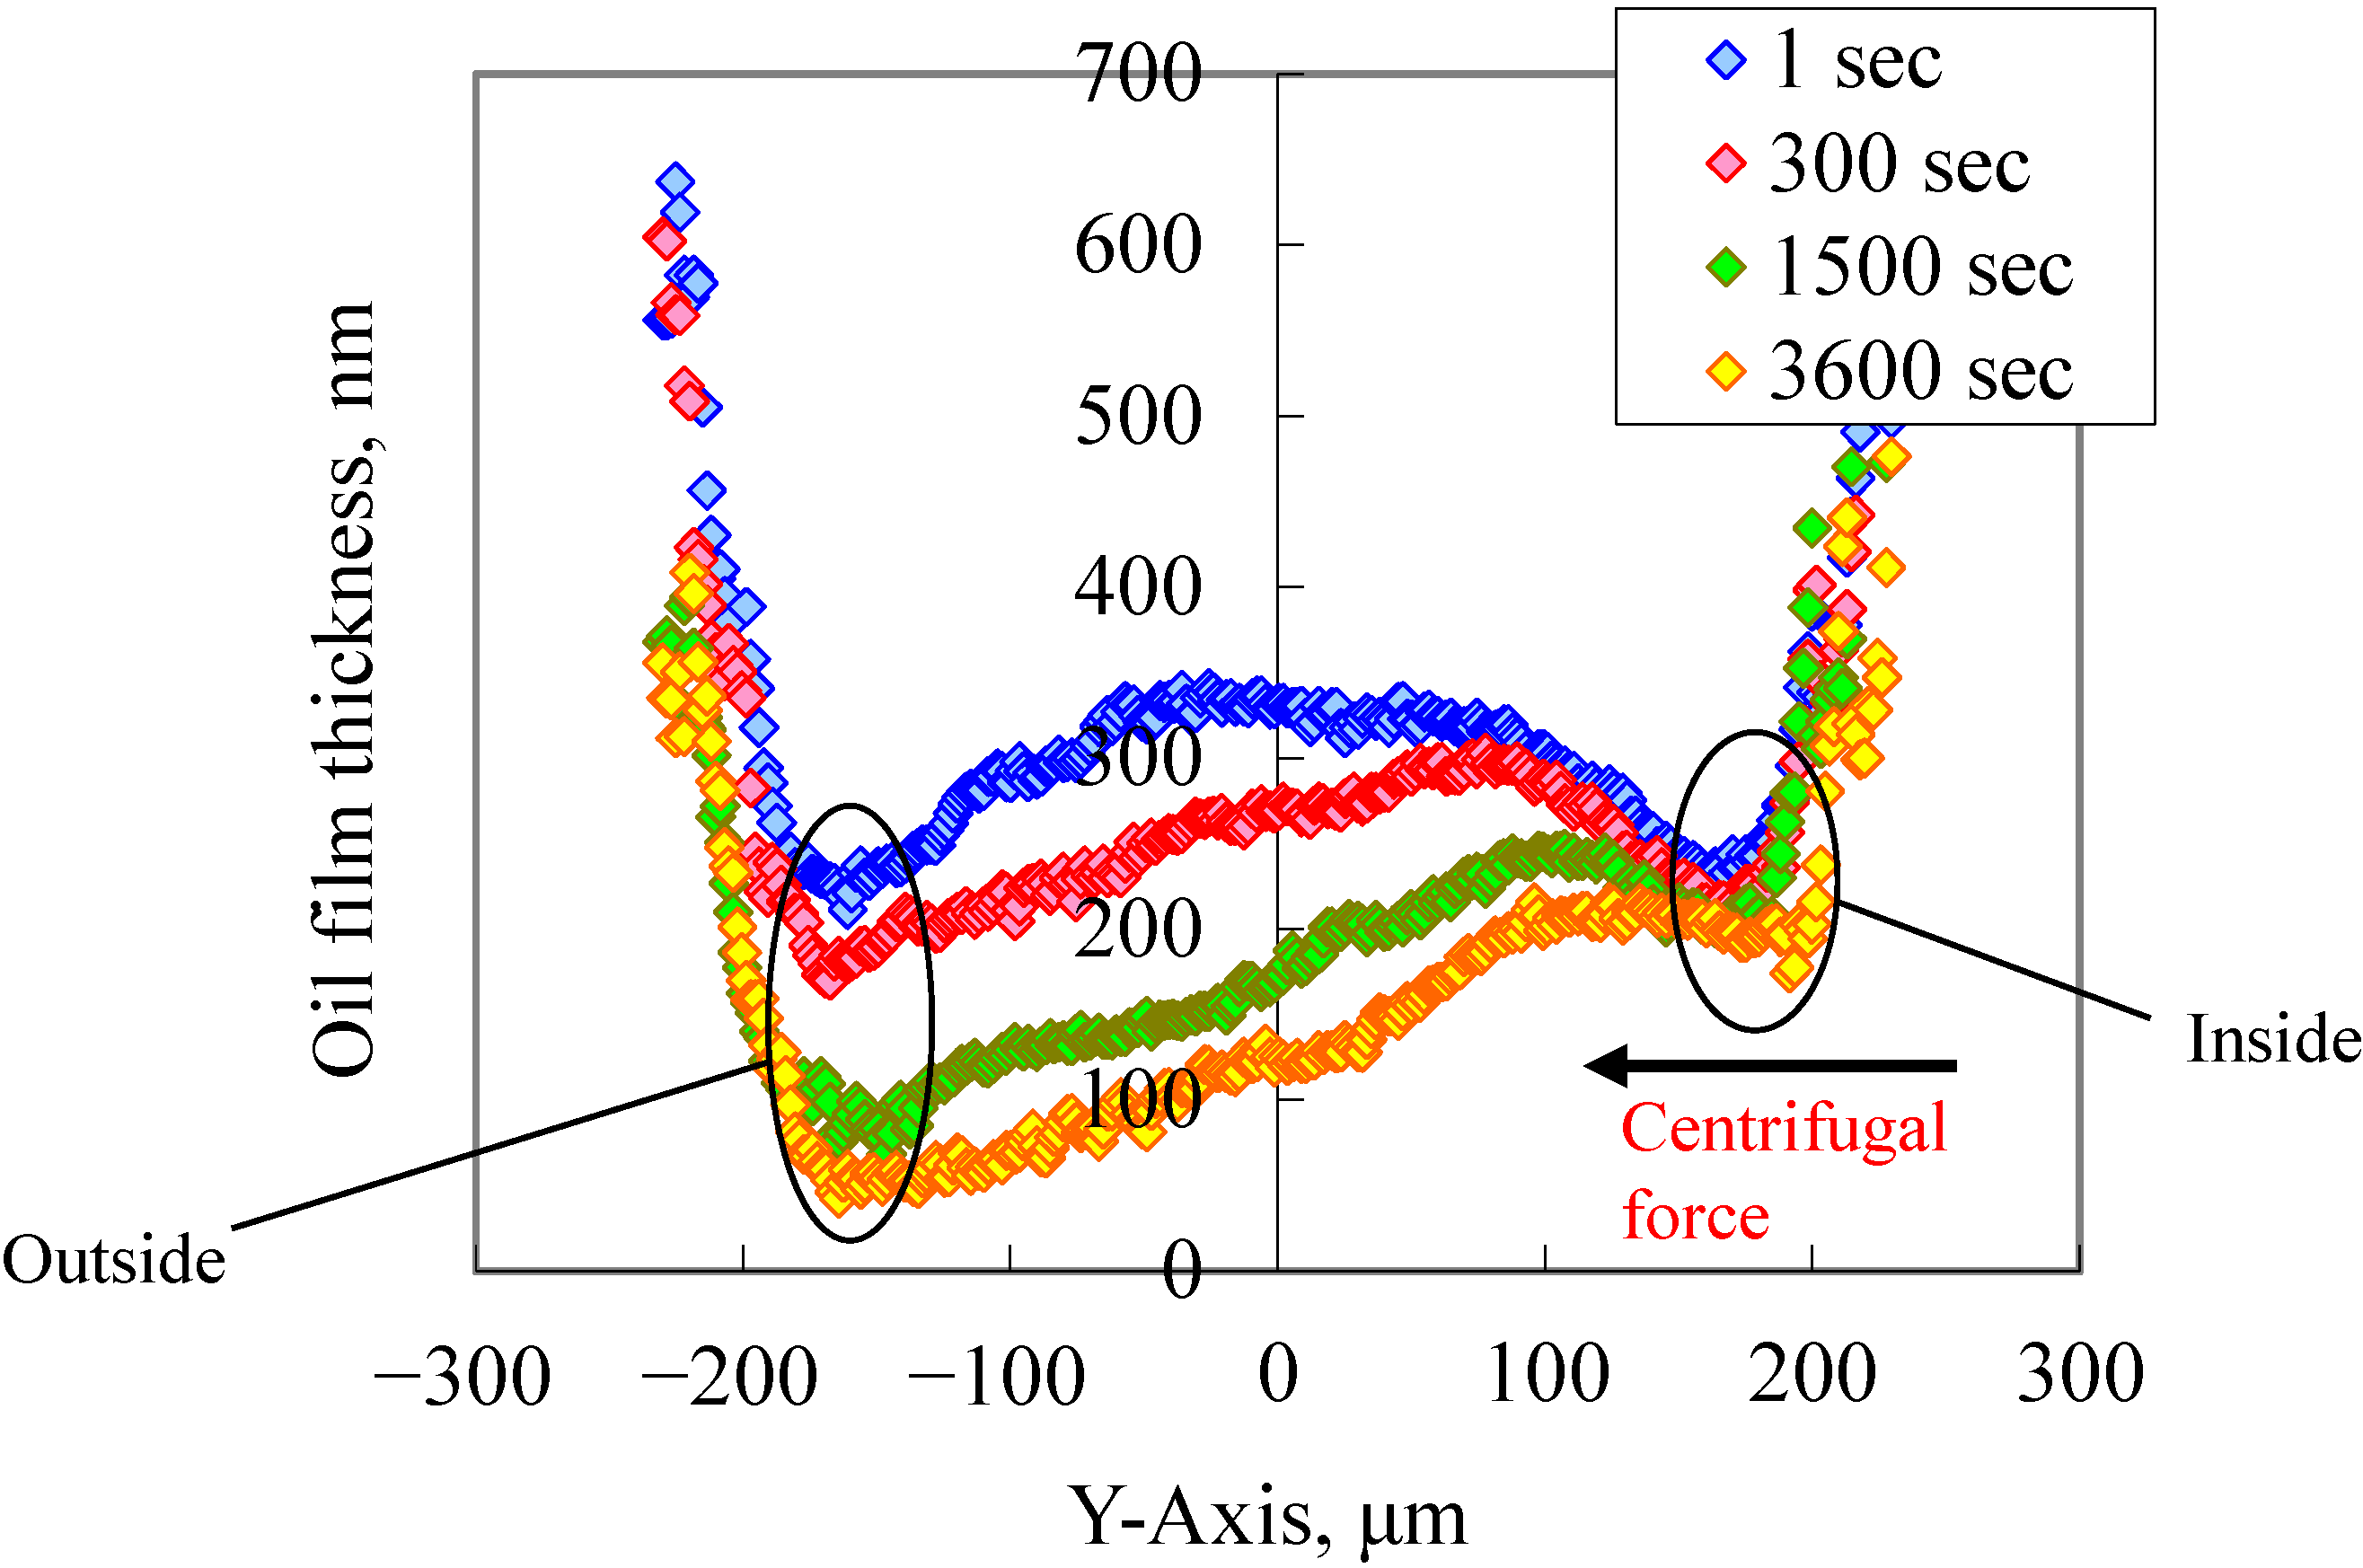
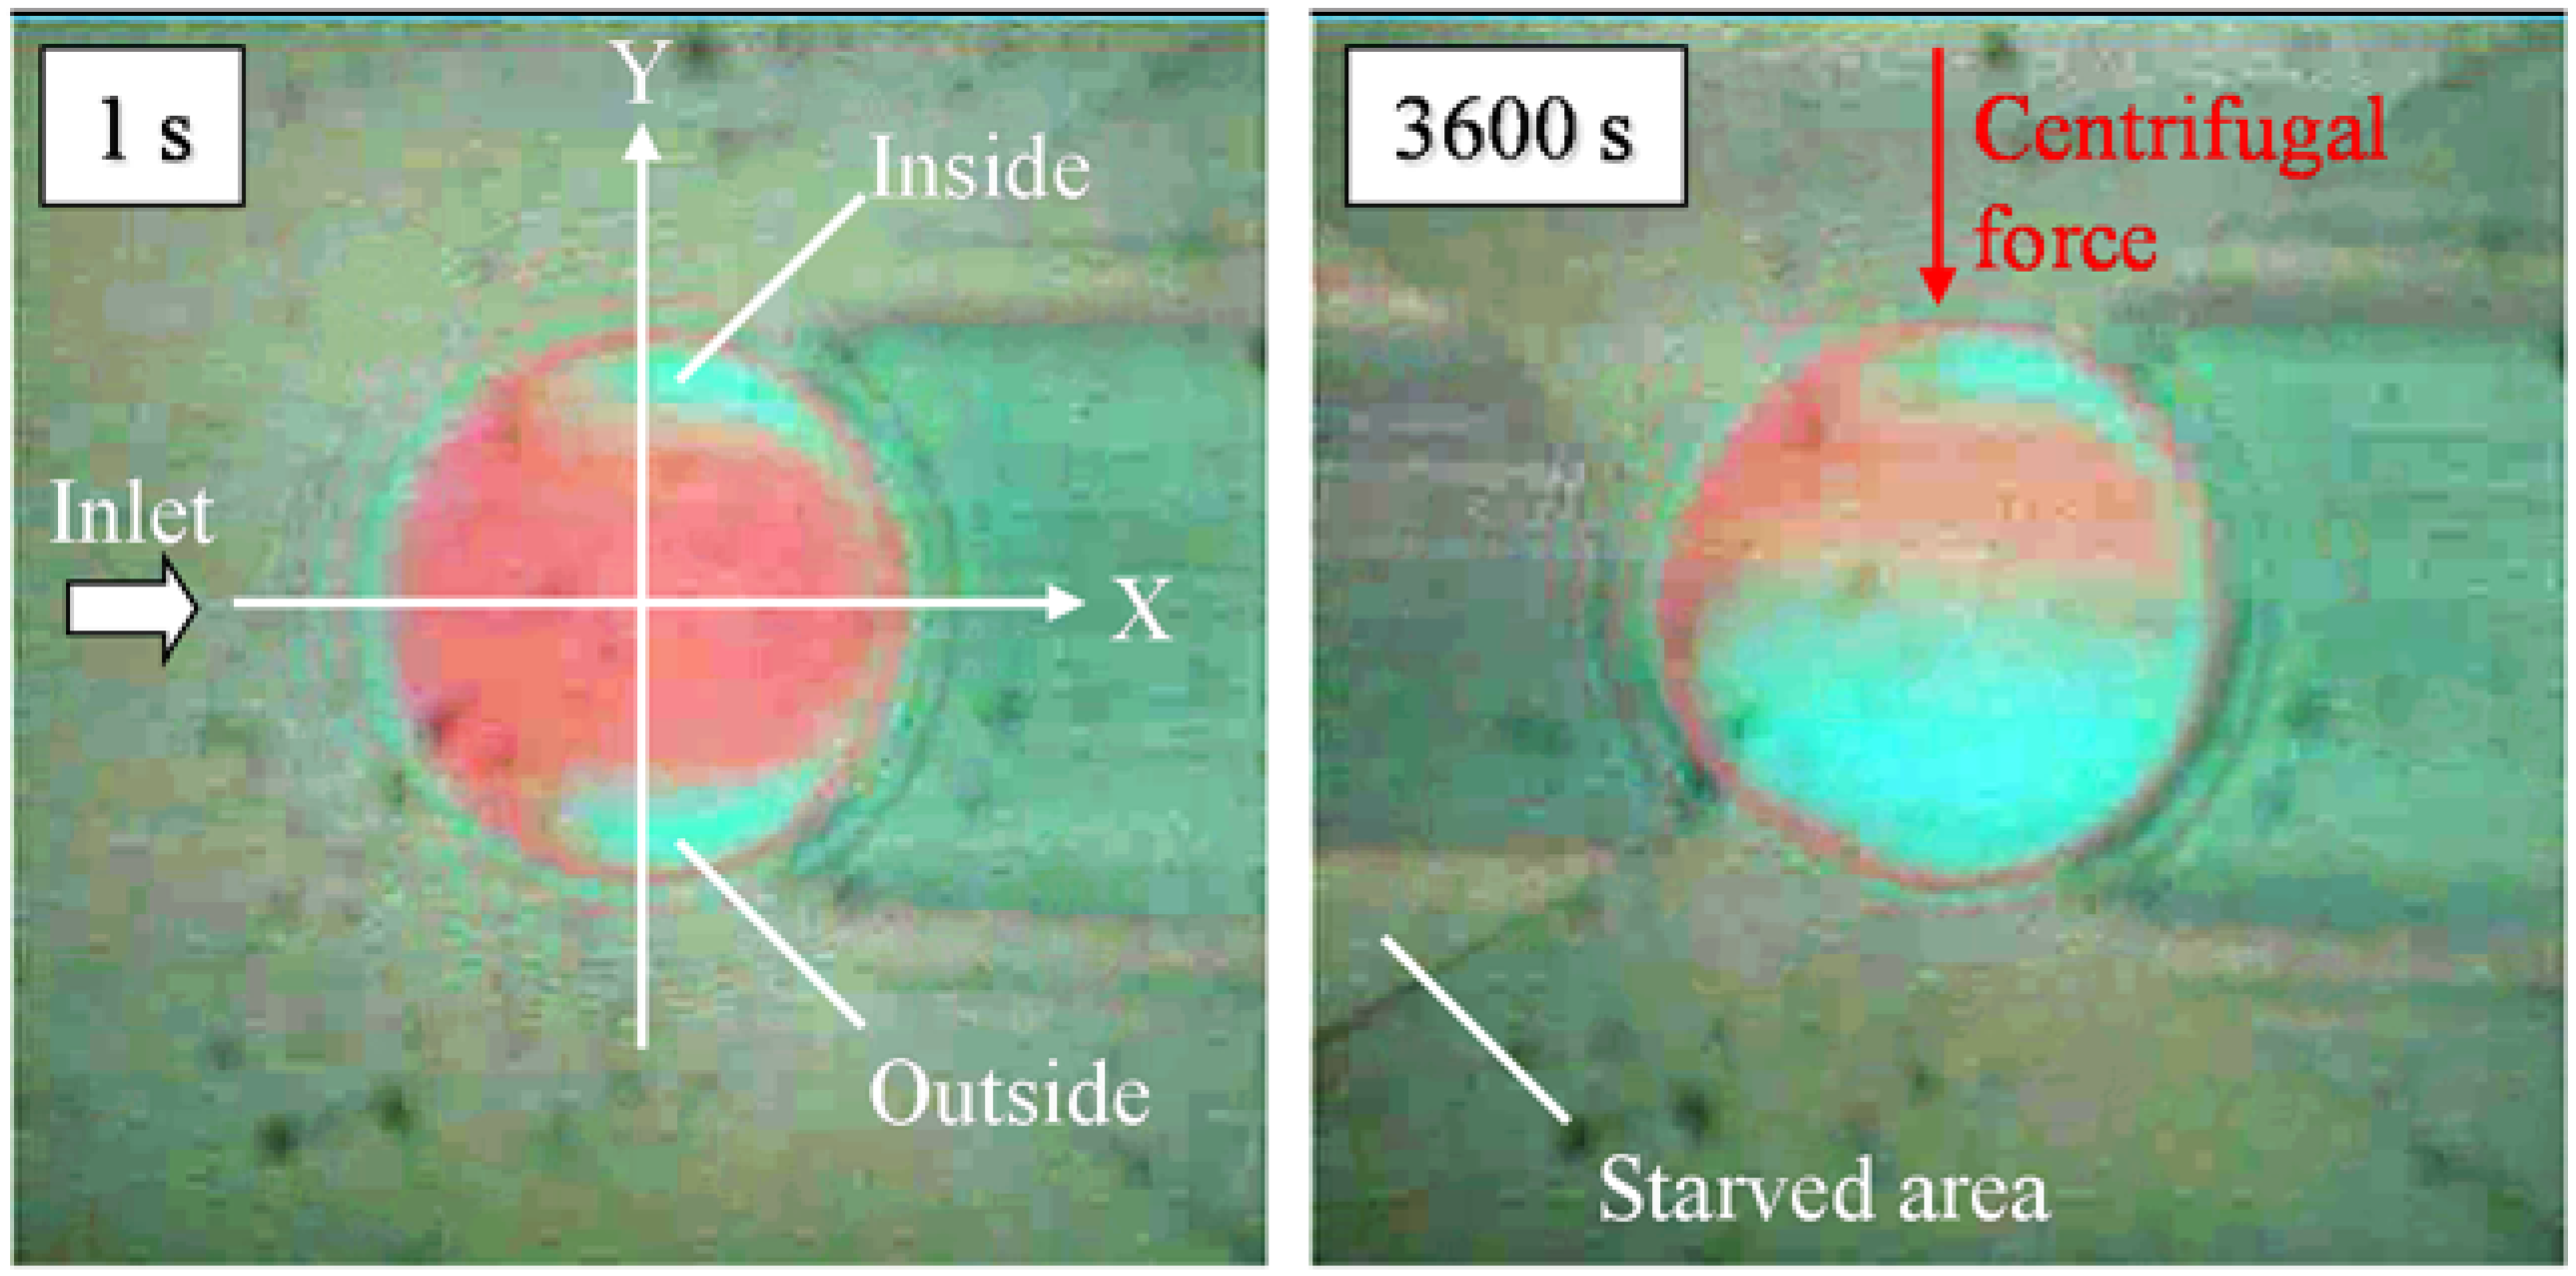
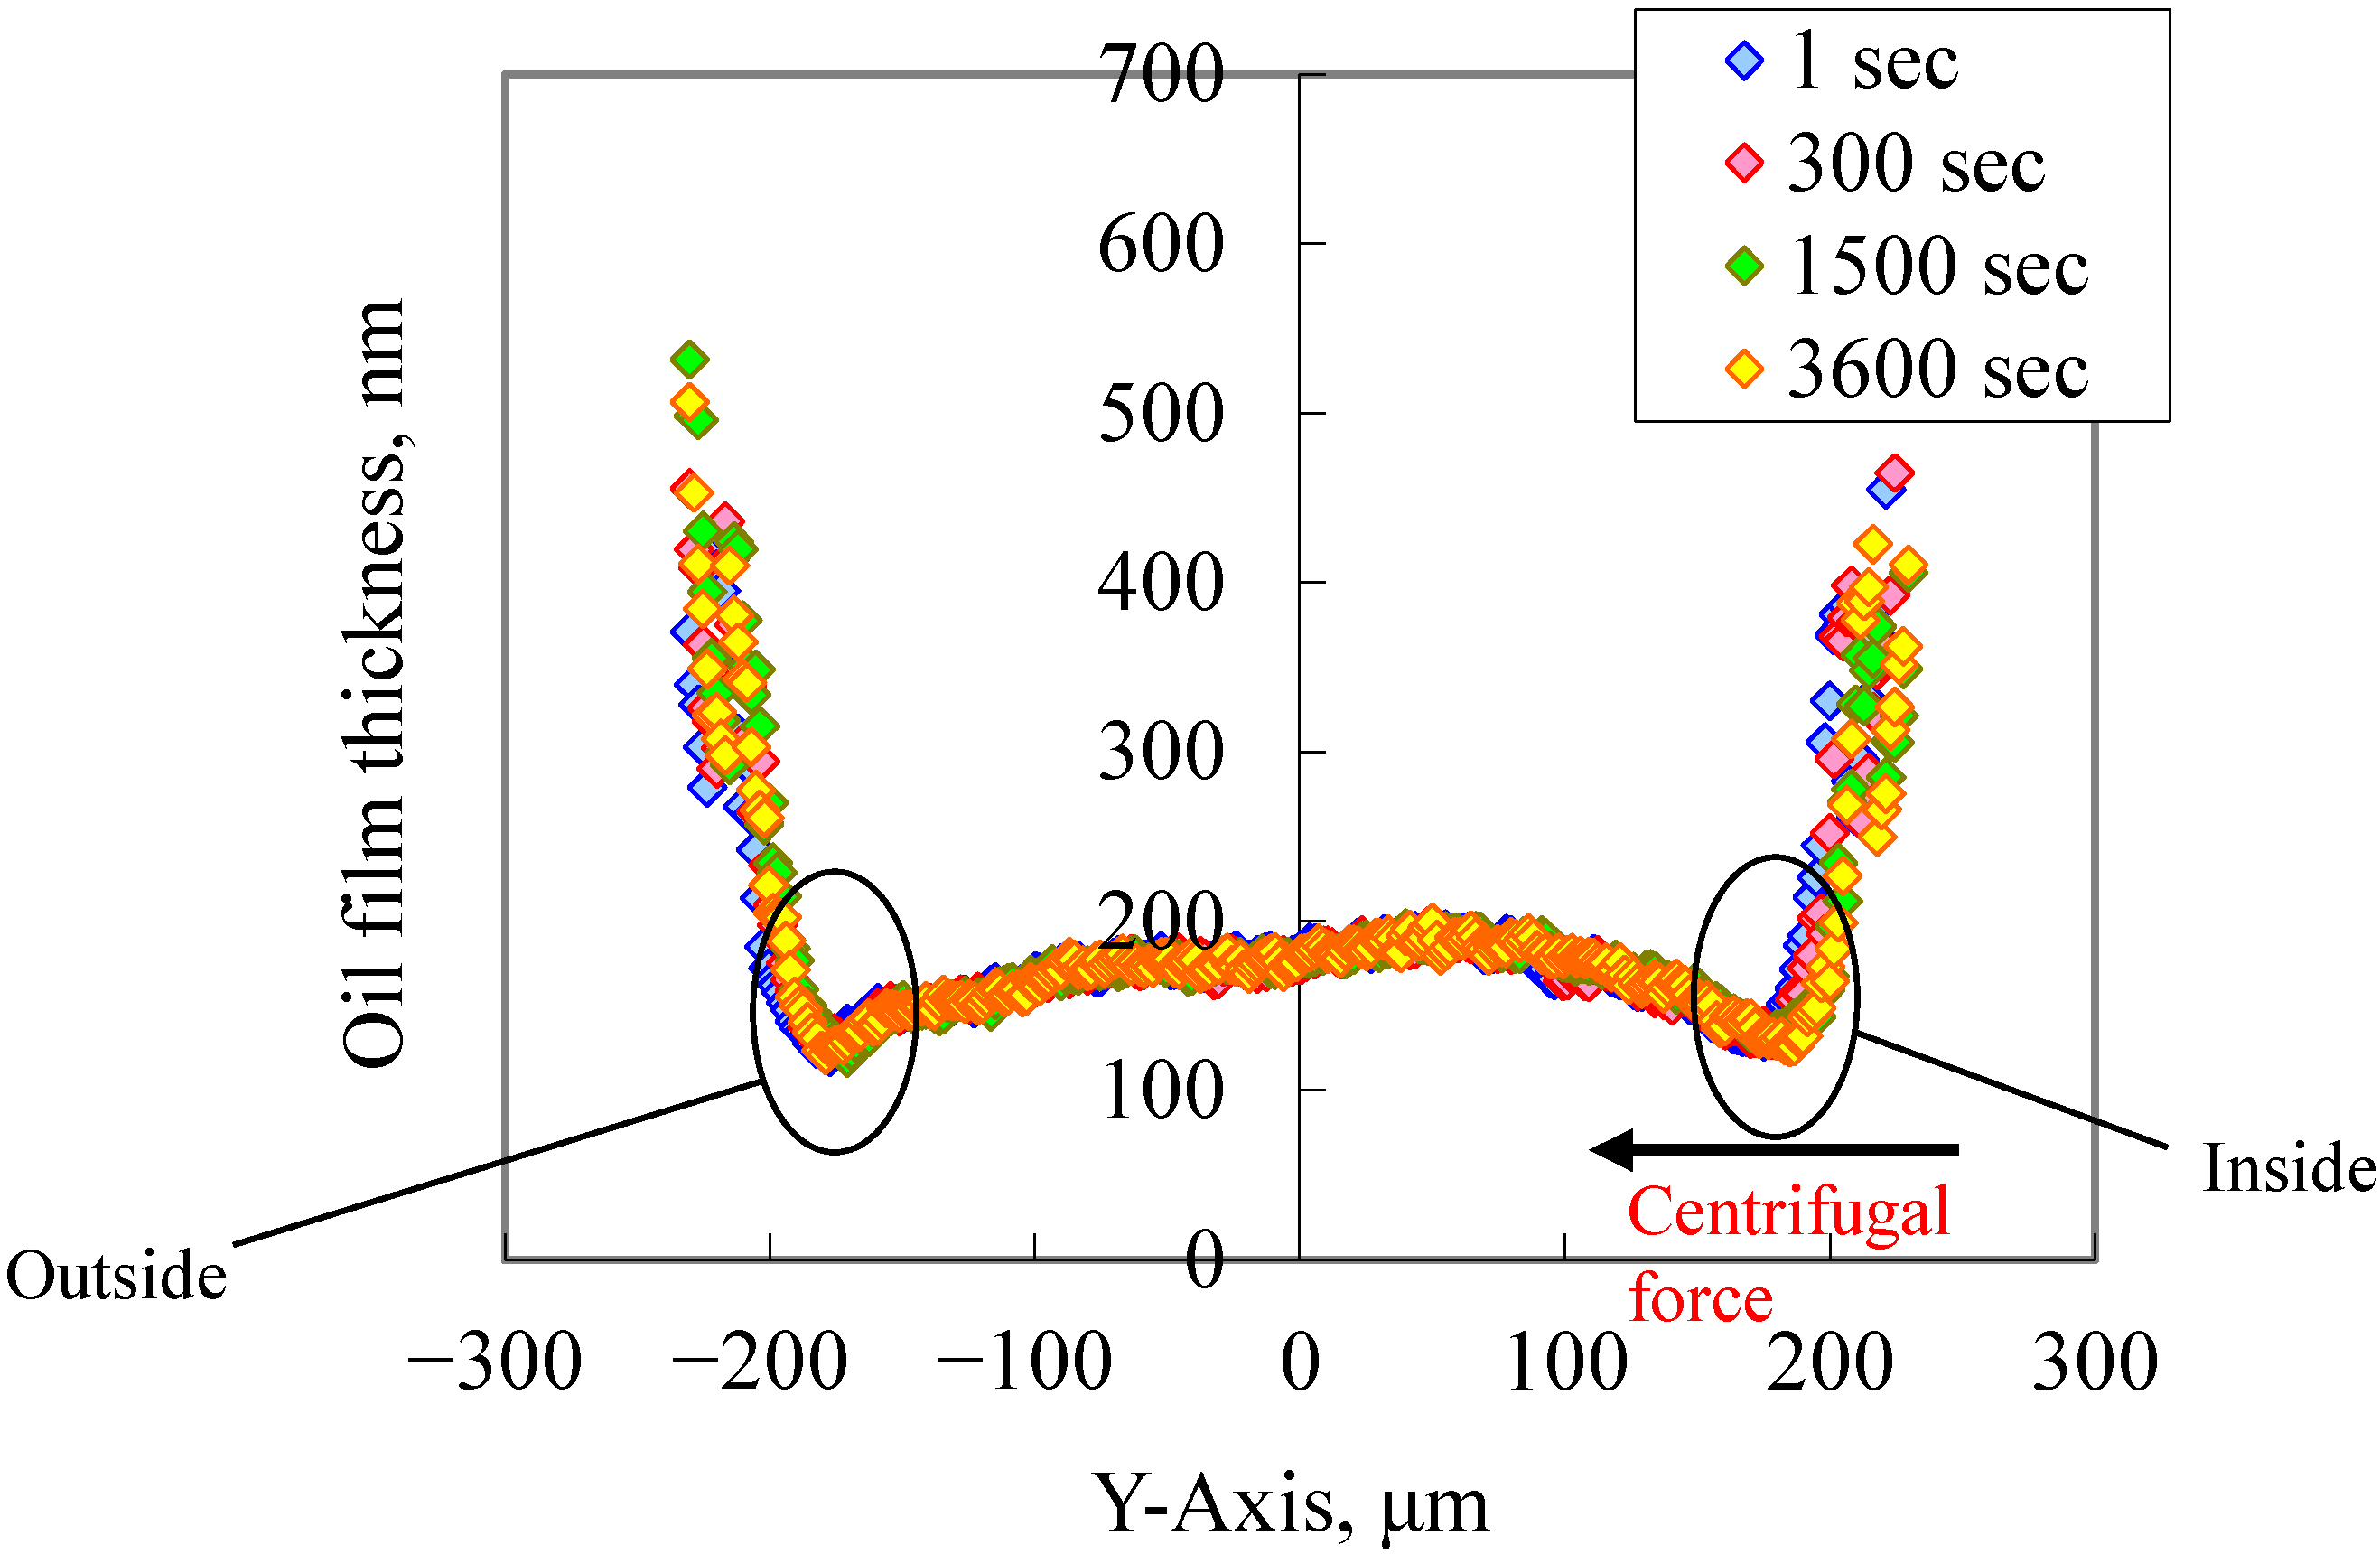
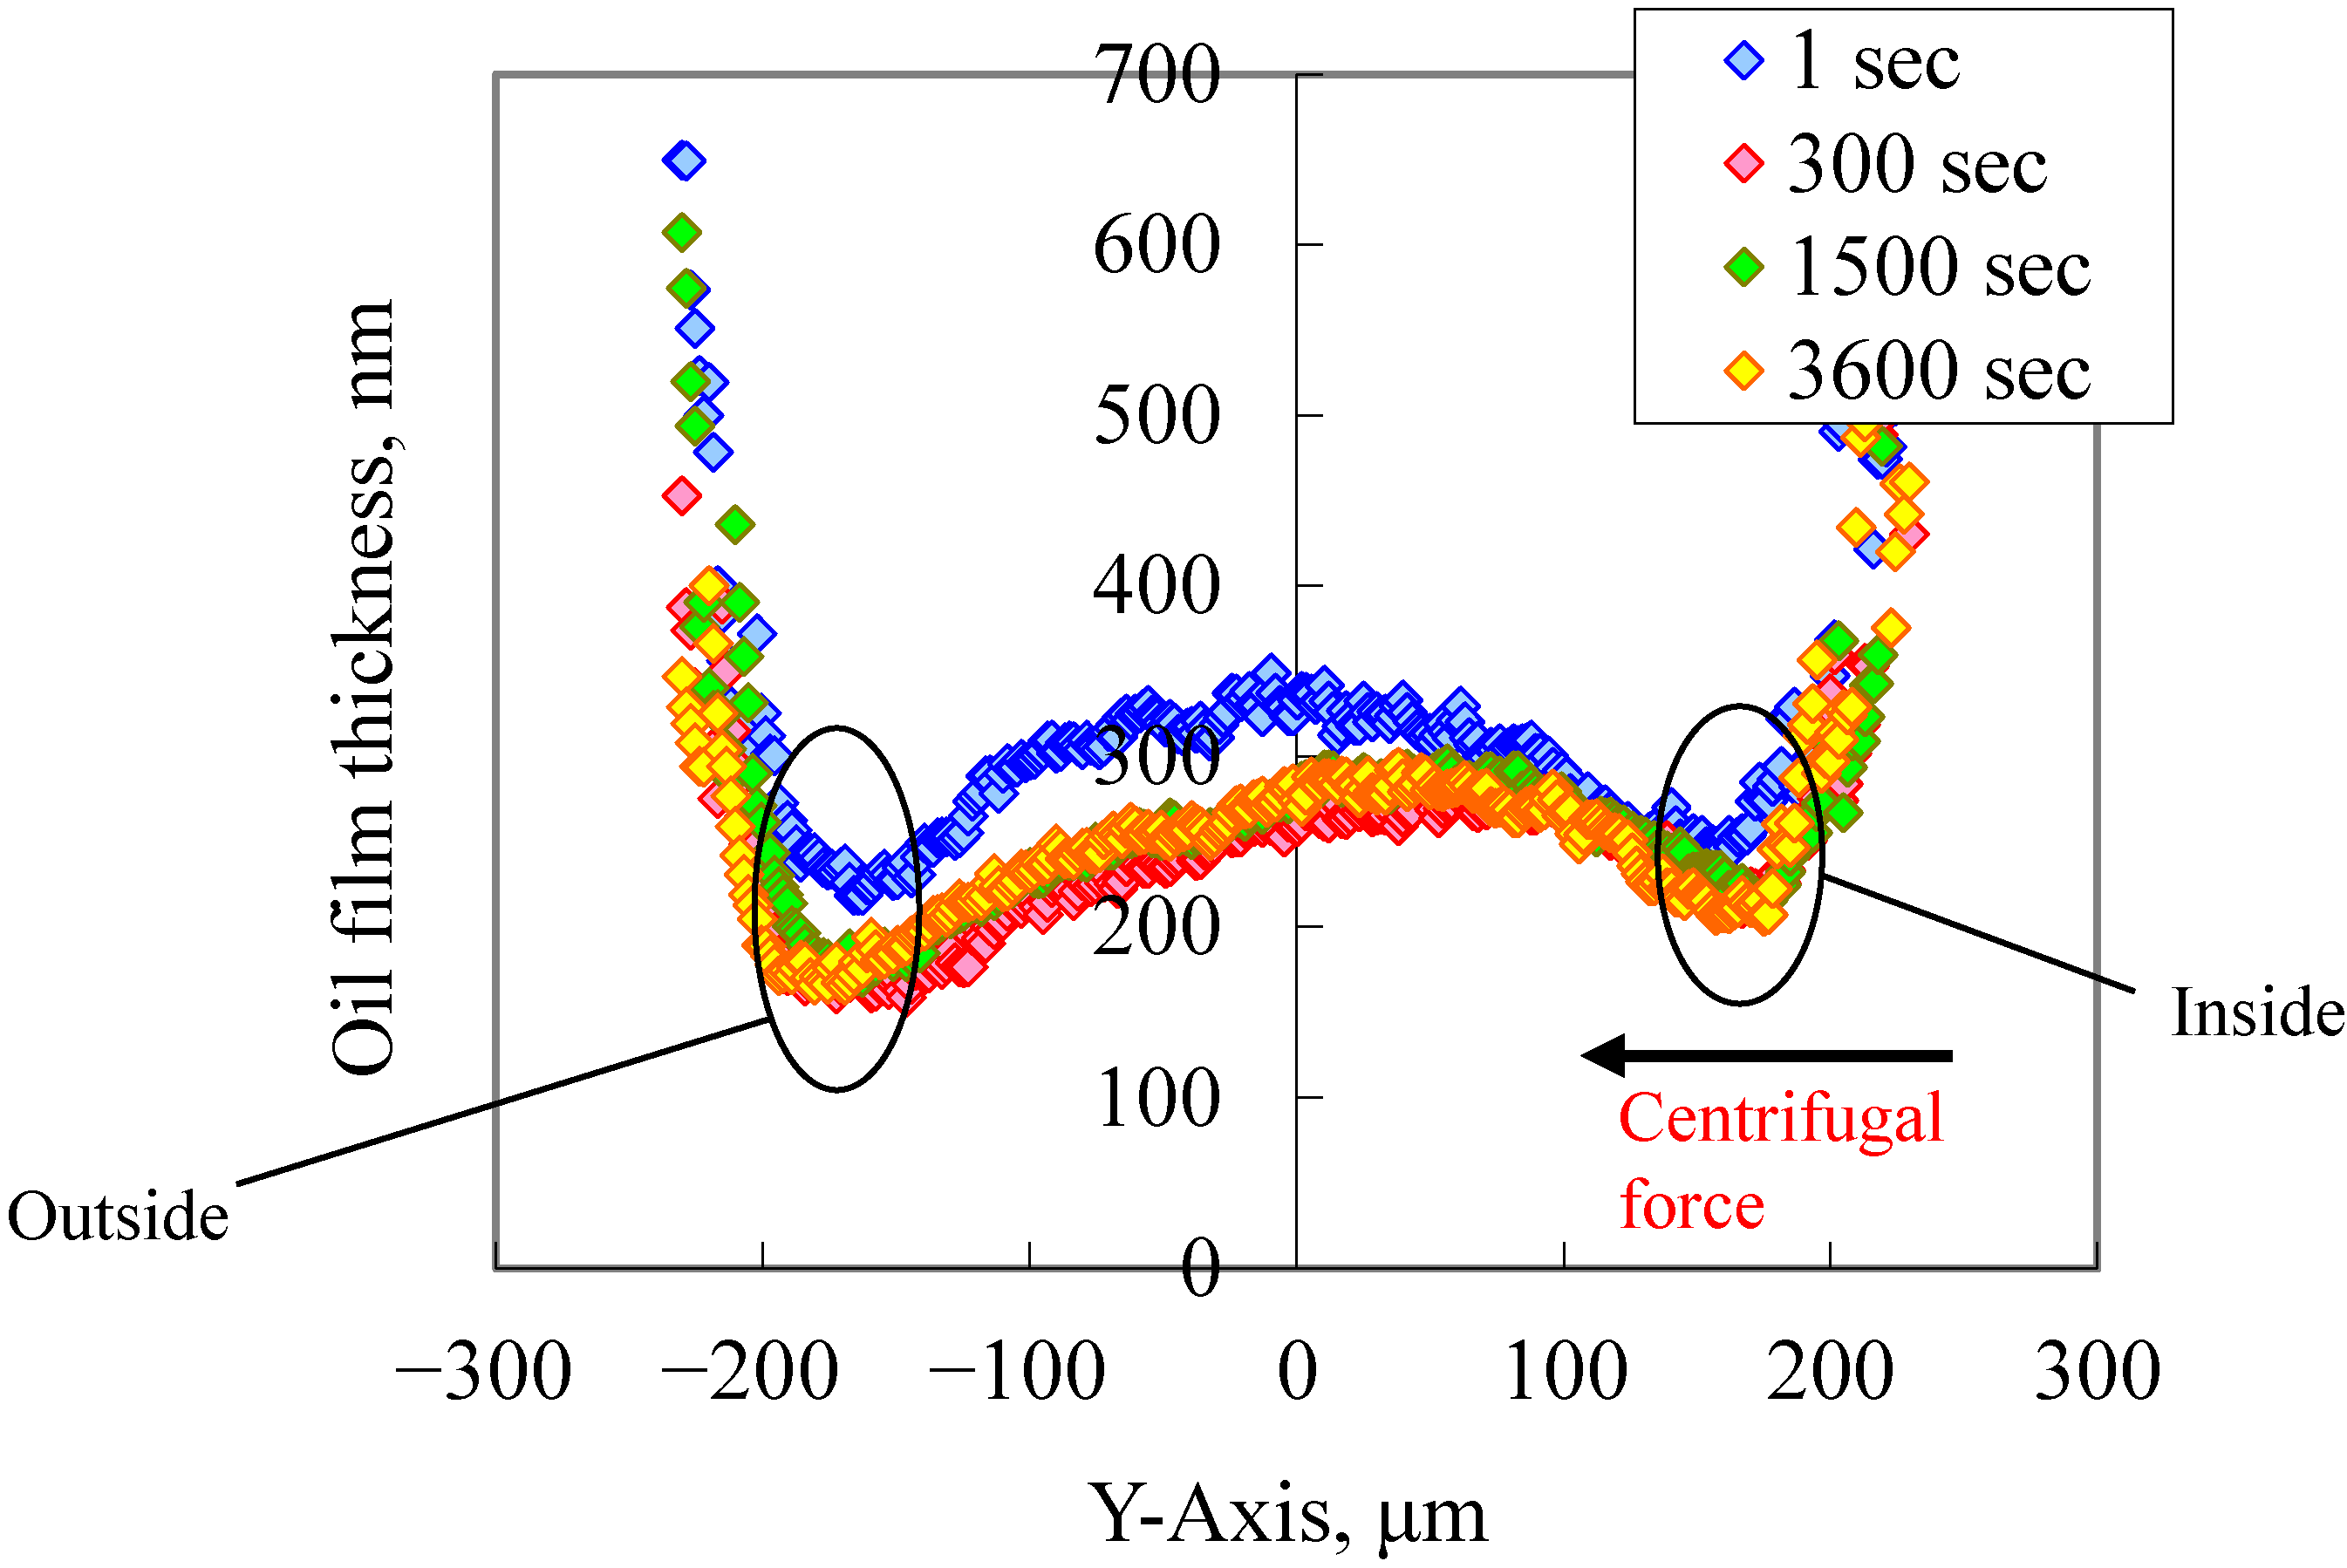
  • The oil film thickness on the “outside” of an EHL contact area becomes lower than that on the “inside”. This is also caused by the fact that the lubricating oil is affected by centrifugal forces.
  • The relationship between the supplied oil flow rate and oil film thickness was determined. In this relationship, if the supplied oil flow rate is set to approximately 10−2 mm3/s or less, the minimum oil film thickness decreases with the decrease of the supplied oil flow rate.
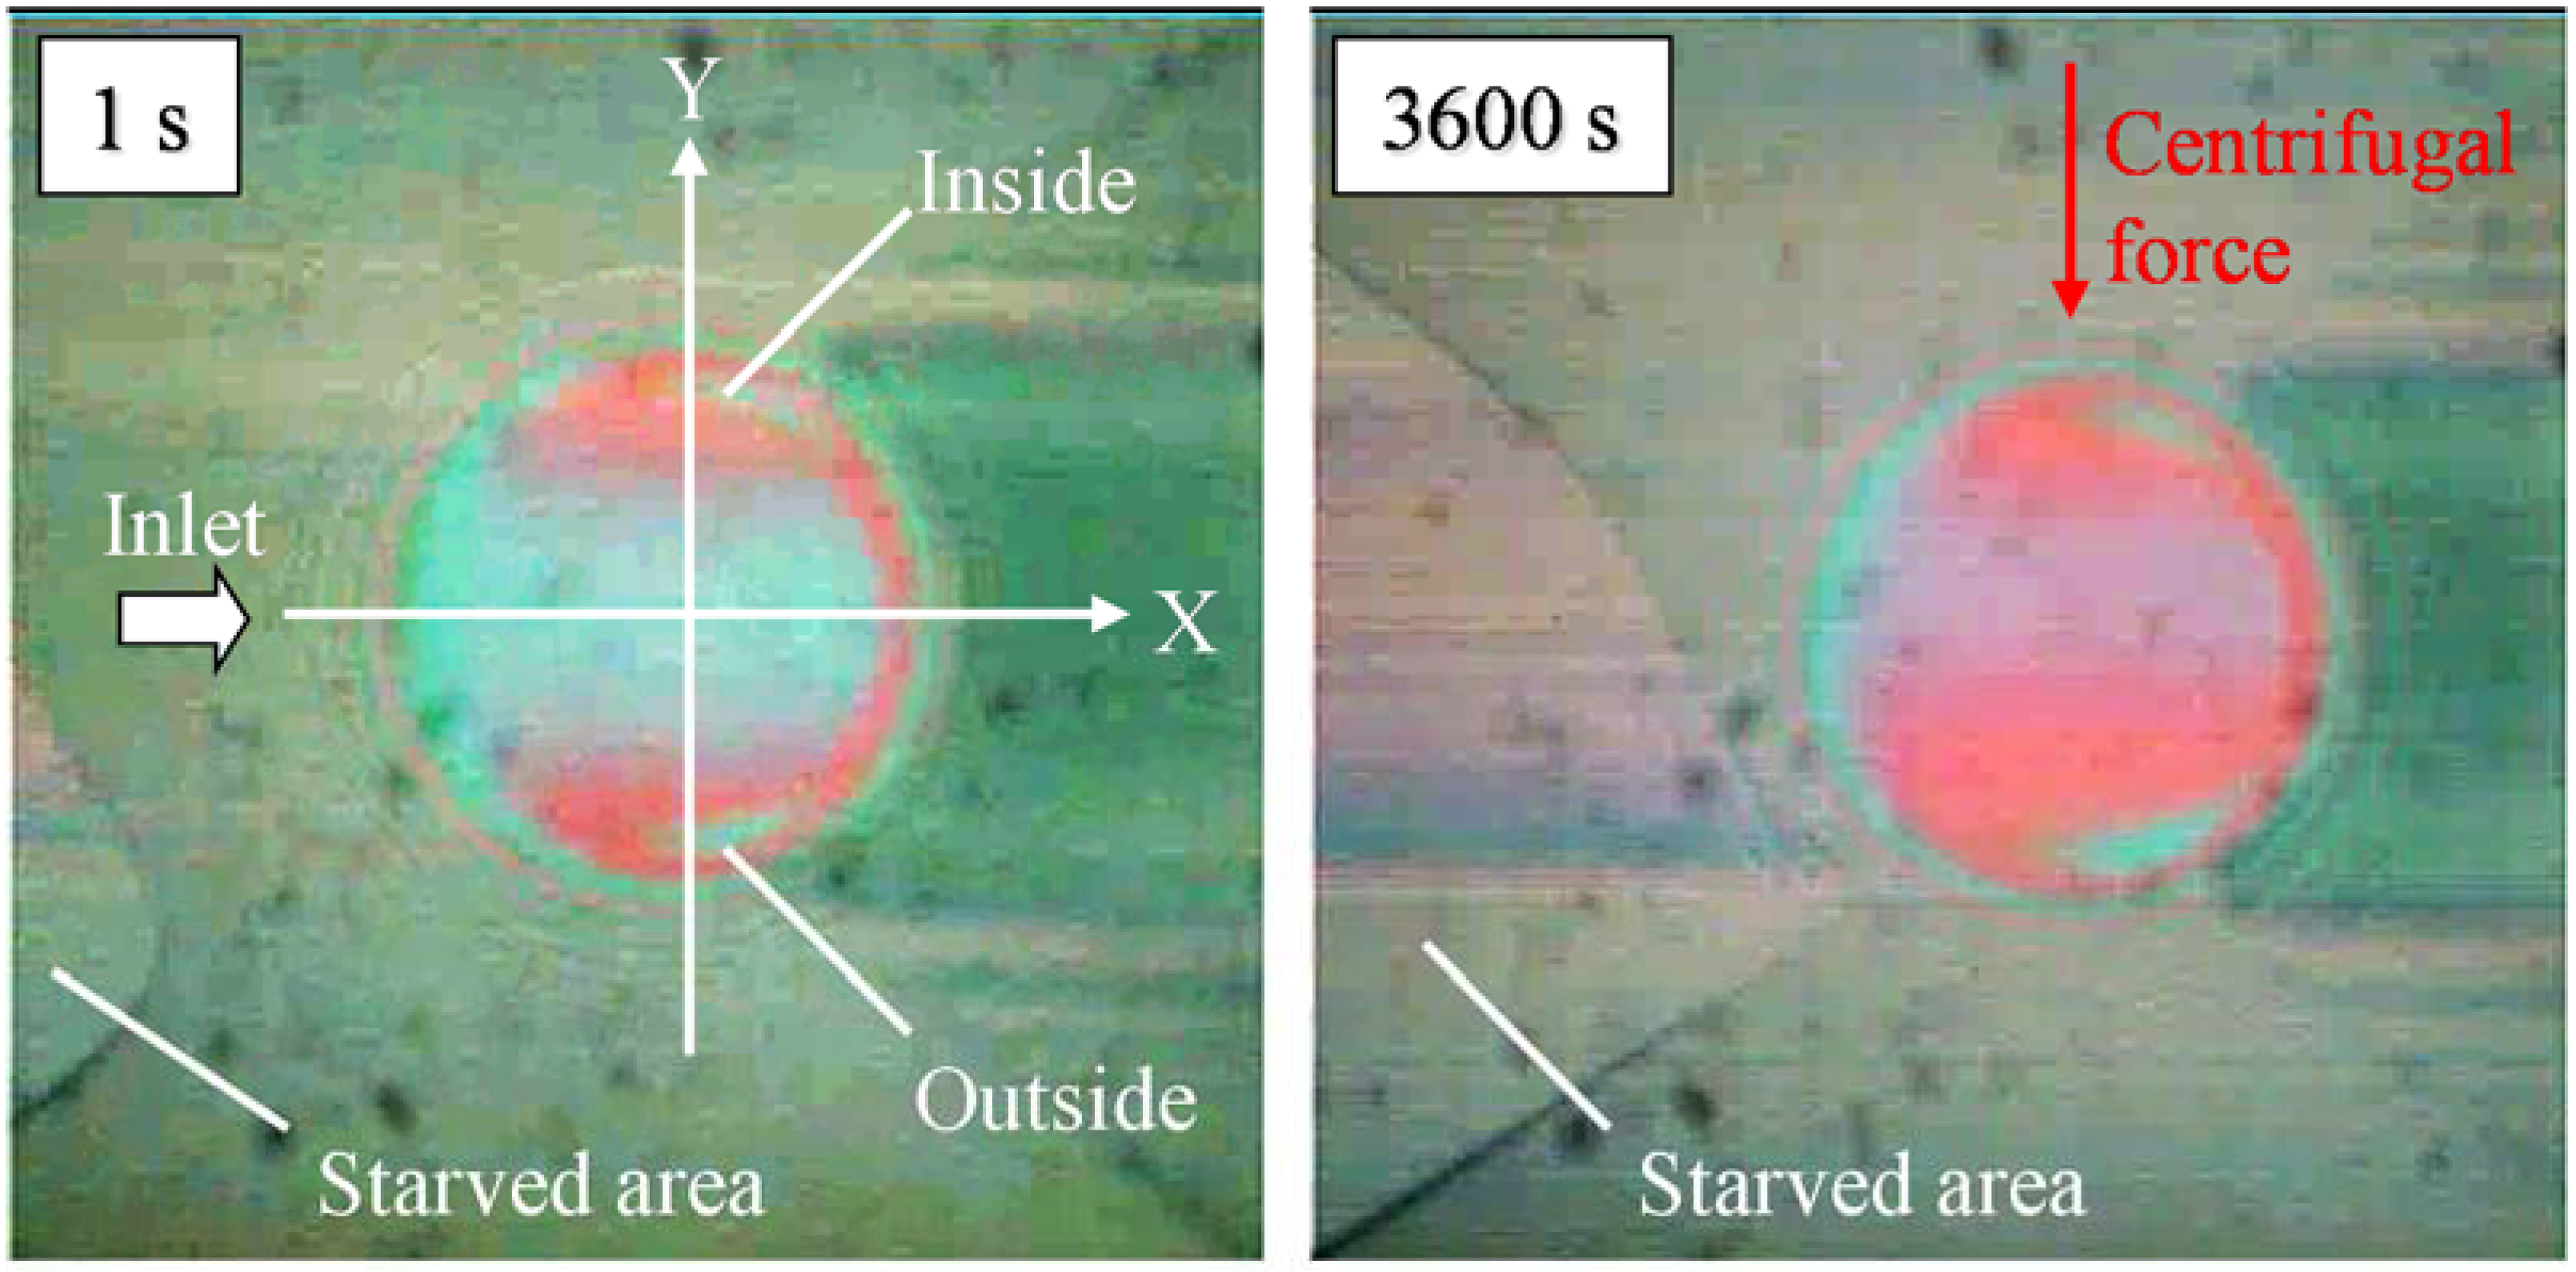
  • The minimum oil film thickness hmin,S under starved lubrication was calculated by the supplied oil flow rate Q. However, the calculated results didn’t agree with the experimental results, which meant that hb was much thinner than h because the racetracks were generated behind EHL contact areas.
In practice, it is considered that bearings are almost always used in the starved lubrication, irrespective of the supplied meniscus distance due to the racetrack generation. For instance, eccentric loads of roller bearings [1] may affect the outlet conditions even when the fully flooded lubrication is assumed. On the other hand, it was indicated that the surface tension could replenish the lubricant in the racetrack and prevent the starved lubrication [20]. Therefore, it is significantly important to consider the influence of outlet conditions on starved lubrication, as pointed by Mohammadpour et al. [6]. It is hoped that the results of this study will contribute to a better understanding of starved lubrication, and to the development of bearings.

Author Contributions

Taisuke Maruyama performed the experiments, analyzed the data, and wrote the paper. Tsuyoshi Saitoh supervised this work.

Conflicts of Interest

The authors declare no conflict of interest.

References

  1. Johns, P.M.; Gohar, R. Roller bearings under radial and eccentric loads. Tribol. Int. 1981, 14, 131–136. [Google Scholar] [CrossRef]
  2. Wedeven, L.D.; Evans, D.; Cameron, A. Optical analysis of ball bearing starvation. ASME Trans. J. Lubricat. Technol. 1971, 93, 349–363. [Google Scholar] [CrossRef]
  3. Lui, J.; Wen, S. Fully flooded starved and parched lubrication at a point contact system. Wear 1992, 159, 135–140. [Google Scholar] [CrossRef]
  4. Parinam, A.; Karan, R. Analysis of starved EHL line contacts for lubricants with linear pressure viscosity dependence. Int. J. Adv. Technol. 2014, 5, 11–27. [Google Scholar]
  5. Wang, W.Z.; Li, S.; Shen, D.; Zhang, S.; Hu, Y.Z. A mixed lubrication model with consideration of starvation and interasperity cavitations. Proc. Inst. Mech. Eng. J J. Eng. Tribol. 2012, 226, 1023–1038. [Google Scholar] [CrossRef]
  6. Mohammadpour, M.; Johns-Rahnejat, P.M.; Rahnejat, H.; Gohar, R. Boundary conditions for elastohydrodynamics of circular point contacts. Tribol. Lett. 2014, 53, 107–118. [Google Scholar] [CrossRef]
  7. Wolveridge, P.E.; Baglin, K.P.; Archard, J.F. The starved lubrication of cylinders in line contact. Proc. Inst. Mech. Engrs. 1970, 185, 1159–1169. [Google Scholar]
  8. Yang, P.; Wang, J.; Kaneta, M. Thermal and non-Newtonian numerical analyses for starved EHL line contacts. J. Tribol. 2006, 128, 282–290. [Google Scholar] [CrossRef]
  9. Mihailidis, A.; Agouridas, K.; Panagiotidis, K. Non-Newtonian starved thermal-elastohydrodynamic lubrication of finite line contacts. Tribol. Trans. 2013, 56, 88–100. [Google Scholar] [CrossRef]
  10. Chevalier, F.; Lubrecht, A.A.; Cann, P.M.E.; Colin, F.; Dalmaz, G. Film thickness in starved EHL point contacts. ASME J. Tribol. 1998, 120, 126–133. [Google Scholar] [CrossRef]
  11. Guangteng, G.; Cann, P.M.; Spikes, H.A. A study of parched lubrication. Wear 1992, 153, 91–105. [Google Scholar] [CrossRef]
  12. Cann, P.M. The transition between fully flooded and starved regimes in EHL. Tribol. Int. 2004, 37, 859–864. [Google Scholar] [CrossRef]
  13. Cann, P.M.E.; Chevalier, F.; Lubrecht, A.A. Track depletion and Replenishment in a grease lubricated point contact: A quantitative analysis. Tribol. Series 1997, 32, 405–413. [Google Scholar]
  14. Cann, P.M. Starved grease lubrication of rolling contacts. Tribol. Trans. 1999, 42, 867–873. [Google Scholar] [CrossRef]
  15. Svoboda, P.; Košťál, D.; Popelka, M.; Křupka, I. The experimental study of transition between fully flooded and starved regime in EHL contact. Eng. Mech. 2013, 20, 13–25. [Google Scholar]
  16. Damiens, B.; Venner, C.H.; Cann, P.M.E.; Lubrecht, A.A. Starved lubrication of elliptical EHD contacts. ASME J. Tribol. 2004, 126, 105–111. [Google Scholar] [CrossRef]
  17. Yin, C.; Yang, P.; Tan, H.; Wang, J. Thermal elastohydrodynamic lubrication of starved elliptical contacts. Tribol. Int. 2009, 42, 964–974. [Google Scholar] [CrossRef]
  18. Gershuni, L.; Larson, M.G.; Lugt, P.M. Lubricant replenishment in rolling bearing contacts. Tribol. Trans. 2008, 51, 643–651. [Google Scholar] [CrossRef]
  19. Wang, J.; Hashimoto, T.; Nishikawa, H.; Kaneta, M. Pure rolling elastohydrodynamic lubrication of short stroke reciprocating motion. Tribol. Int. 2005, 38, 1013–1021. [Google Scholar] [CrossRef]
  20. Chiu, Y.P. An analysis and prediction of lubricant film starvation in rolling contact systems. Tribol. Trans. 1974, 17, 22–35. [Google Scholar]
  21. Johnston, G.J.; Wayte, R.; Spikes, H.A. The measurement and study of very thin lubricant films in concentrated contacts. Tribol. Trans. 1991, 34, 187–194. [Google Scholar] [CrossRef]
  22. Hamrock, B.J.; Dowson, D. Isothermal elastohydrodynamic lubrication of point contacts: Part III—fully flooded results. ASME Trans. J. Lubricat. Technol. 1977, 99, 264–275. [Google Scholar] [CrossRef]
  23. Rauscher, J.W.; Kelly, R.E.; Cole, J.D. An asymptotic solution for the laminar flow of a thin film on a rotating disk. Trans. ASME J. Appl. Mech. 1973, 40, 43–47. [Google Scholar] [CrossRef]
  24. Hamrock, B.J.; Dowson, D. Isothermal elastohydrodynamic lubrication of point contacts: Part IV—starvation results. ASME Trans. J. Lubricat. Technol. 1977, 99, 15–23. [Google Scholar] [CrossRef]

