Influence of Ball Burnishing on Lubricated Fretting of the Titanium Alloy Ti6Al4V


Faculty of Mechanical Engineering and Aeronautics, Rzeszow University of Technology, Powstancow Warszawy 8 Street, 35-959 Rzeszow, Poland
Lubricants 2023, 11(8), 341; https://doi.org/10.3390/lubricants11080341
Submission received: 17 July 2023
/
Revised: 2 August 2023
/
Accepted: 8 August 2023
/
Published: 10 August 2023
(This article belongs to the Special Issue Friction and Wear of Alloys)
Abstract
:Ball burnishing is a very promising alternative to grinding because of it produces little environmental pollution. It can cause improvement of the functional properties of machine parts, such as friction and wear. The connection between the ball burnishing and the lubricated fretting has not been analysed yet. In this study, it was found that ball burnishing discs from titanium alloy Ti6Al4V caused a decrease in the height of the roughness up to 84% and an increase in the microhardness up to 26% compared to the turned surface. Tribological experiments were carried out under lubricated fretting conditions. Ceramic balls from WC material co-acted with the burnished discs. Ball burnishing resulted in significant improvement in the tribological behaviour of the ball-on-disc sliding pair. Due to ball burnishing, the friction coefficient decreased up to 45% and the volumetric wear of the disc decreased up to 50% compared to the turned disc. The smallest friction and disc wear were achieved for the sample burnished with a pressure of 30 MPa; this sample was characterised by a low roughness height and great microhardness. The turned disc sample corresponded to high friction and wear. Wear losses of the balls were negligible due to the large difference between the hardness values of the balls and discs.
1. Introduction
In ball burnishing, a ball made from hard material is pressed into the workpiece material via sliding. When the contact stress in the edge zone is higher than the material’s yield strength, the material near the surface starts flowing. As the ball moves across the machined surface, the elastically deformed material springs back, pushing the now plastically deformed zone into compression. The surface peaks are pressed down nearly vertically into the surface, and the material flows into the valleys between the peaks.
Burnishing parameters include the normal load, speed and feed [1,2]. This machining process causes the decrease in the roughness height, the increase in hardness and the creation of compressive stresses; therefore, it can cause enhancement of the surface quality, leading to improvement of the wear resistance, fatigue resistance and corrosion resistance of machine elements. Ball burnishing can also reduce production costs. Furthermore, due to low environmental pollution, ball burnishing can replace some finishing processes, such as grinding. Thanks to its merits, ball burnishing is used in various industries, for example, in aerospace engineering. Researchers have typically studied the effect of burnishing on the reduction in the average amplitude Ra of the roughness [3,4,5,6]. This parameter is the most frequently used in manufacturing. Revenkar et al. [3] reduced the roughness height and increased the hardness of a titanium alloy by 77 and 17%, respectively, due to ball burnishing. Attabi et al. [4] revealed that ball burnishing of steel caused a decrease in the Ra parameter of up to 93%. Kanovic et al. [5] achieved a reduction in the Ra parameter of a steel surface of more than 90% due to burnishing by a ceramic ball. Dzionk et al. [6] obtained a decrease in the Ra parameter of the hardened shaft of about 50%. Among the areal (3D) surface topography parameter, the reduction in the Sq parameter due to ball burnishing has mainly been studied. Sq is the root mean square of the surface amplitude [7]. Jerez-Mesa et al. [8] and Swirad et al. [9] reduced the values of the Sq parameter of samples of Ti-6Al-4V and martensitic steel, respectively, using ball burnishing. Jerez-Mesa at al. [8] obtained positive effects of additional vibrations on the surface height decrease. Swirad et al. [9] reduced the Sq parameter to 0.3 µm by application of the raster strategy of ball burnishing.
The effect of ball burnishing on increasing hardness has also been analysed. Bourieba et al. [10,11] obtained an increase of the hardness of a steel sample up to 45%. Revenkar et al. [3] achieved a higher hardness growth of a titanium alloy due to ball burnishing, up to 17%. Hardness growth is typically related to a reduction in the wear intensity. Ye at al. [12] found that an increase in the microhardness of a high entropy alloy by 67% resulted in the reduction in macroscopic wear by 78%.
Zhang et al. [13] and Han et al. [14] found that compressive residual stresses are created in ball burnishing. Zhang et al. [13] revealed that the burnishing pressure significantly affected the compressive residual stresses. Han et al. [14] changed the burnishing pressure, speed, feed and number of passes. A lower roughness height corresponded to higher compressive stresses.
Under lubrication, the higher surface roughness mainly led to an increase in the resistance to motion. This behaviour can be explained by the negligible effect of adhesion, in contrast to dry sliding conditions. Dzierwa et al. [15] and Sedlacek et al. [16,17] obtained an increase in the coefficient of friction due to the growth of the roughness height of the disc in contact with the rounded pin under lubrication. Swirad and Pawlus [18] found that a reduction in the surface amplitude of the disc due to ball burnishing produced a decrease in the coefficient of friction of the lubricated ball-on-disc assembly of up to 40%.
Fretting is a relative sliding oscillating motion when the amplitude of oscillation is smaller than the elastic contact radius [19]. Depending on the normal load and the amplitude of displacement, partial slip and gross slip can take place [20,21]. A partial slip occurs when the displacement amplitude is smaller than that of a gross slip and can lead to dangerous fretting fatigue; however, a gross slip can cause adhesive or abrasive wear. Fretting damage can be prevented by lubrication. The palliative effect of lubrication is substantial under the gross slip condition [22]. The capability of the lubricant to enter to the contact zone is very important [23]; therefore, low-viscosity oils are preferred over high-viscosity oils under a gross fretting regime. A lubricant can improve the tribological properties of the sliding part by eliminating the oxygen from the contact zone. An increase in the amplitude of displacement leads to better lubricant penetration to the contact area. Not only the oil viscosity, but also the boundary lubrication property of oil has important influence on reducing wear and friction.
The opinion exists that lubricating oil can be better maintained by the surface texture of a high amplitude; therefore, the tribological properties of rough surfaces in fretting conditions can be improved by lubrication. This opinion was confirmed in experimental works. Sato et al. [24] obtained low wear for a rough surface texture and large wear for a smooth texture. Imai et al. [25] and Okamoto et al. [26] improved the tribological properties in a lubricated fretting by surface grooving. Lenart et al. [27] achieved a lower coefficient of friction of a rougher surface when a comparatively small normal load was applied. The opposite behaviour was found for a greater normal load. Kubiak and Mathia [28] revealed that the coefficient of friction at the transition point from a partial to a gross slip was smaller for a rougher surface.
Ball burnishing often leads to an improvement in the tribological properties of the sliding elements; however, experiments have typically been carried out in dry sliding conditions [4,29,30,31,32,33]. Attabi et al. [4] obtained a wear reduction of more than 50% due to the burnishing of a stainless steel sample in unidirectional sliding in a ball-on-disc configuration. El Tayeb et al. [29] reduced the coefficient of friction by 48% and wear loss up to 80% due to ball burnishing of aluminum alloy compared to the turned specimen. Swirad and Pawlus [30,31] revealed that ball burnishing caused reductions in the wear and friction of steel discs compared to the milled sample. Yilmaz and Sadeler [32] reduced the volumetric wear of a stainless steel sample up to 62% under repeated impact loads. Revankar et al. [33] found that the ball burnishing of titanium alloy led to a decrease in the wear rate by 52% and a decrease in the coefficient of friction by 64% in unidirectional dry tests compared to the surface after turning. Burnishing can be performed with additional oscillatory horizontal movement of the tool in order to form regular patterns called micro-reliefs. The grooves formed lead to an increased lubricant-retaining capacity and a reduced bearing capacity. Both these properties should be considered when selecting the parameters of ball burnishing [34].
In spite of the abovementioned studies, the relationship between ball burnishing and lubricated fretting has not been analysed yet. This work attempts to fill this gap.
2. Materials and Methods
Investigations were carried out using an Optimol SRV 5 tribotester (Optimol Instruments, Munich, Germany). The ball from a ceramic WC was pressed onto a machined disc made of the titanium alloy, Ti6Al4V. This alloy is characterised by a high specific strength and excellent corrosion resistance. It is widely used in applications where low density and high corrosion resistance are required, such as biomechanical applications and in the aerospace industry. The tests were carried out under lubricated gross fretting conditions. The frequency of oscillation was 50 Hz, the stroke was 0.1 mm and the number of cycles was 45,000. Before each test, a drop of mineral oil L-AN-46 (0.07 mL) was applied to the inlet side of the contact zone. This lubricant, used in a previous study [18], has the following properties: the kinematic viscosity at 40 °C is 46.0 mm2/s; the kinematic viscosity at 100 °C is 6.66 mm2/s; the viscosity index is 96; the ignition temperature was a minimum of 170 °C; the flow temperature was a maximum of −12 °C; and the density at 15 °C is 880 kg/m3. It was selected because it contains a small number of additives.
The normal loads applied were 40, 60 and 80 N. The tribological tests were repeated three times. Figure 1 presents the tribotester scheme and Table 1 lists the experimental conditions.
After turning, the discs were ball-burnished with the Haas CNC Vertical Mill Centre VF-1. Table 2 presents the burnishing parameters.
Images of the tested disc surfaces were obtained with the Phenom ProX SEM (Thermo Fisher, Waltham, MA, USA).
The topographies of the disc surfaces were measured using a white light interferometer Talysurf CCI Lite (Taylor Hobson Ltd., Leicester, UK). The area of measurement was 3.29 mm × 3.29 mm. The same post-processing procedure was applied to all the tested disc surfaces. The measured topographies were only leveled, without using digital filtration. The wear volumes of the disc samples were also determined by white light interferometer. This equipment is commonly used for wear loss measurements [35].
The microhardness of the discs was measured using Reicherter Brivisor KL2 Vickers indenters (Buehler Ltd., Lake Bluff, IL, USA).
3. Results and Discussion
Figure 2 presents pseudo-colour images, isometric views and selected profiles after turning and burnishing with various pressures.
Table 3 lists the parameters of the measured surface textures according to the ISO 25178-2 standard [7]. The following parameters were analysed: rms. height Sq, skewness Ssk, kurtosis Sku, maximum peak height Sp, maximum valley depth Sv, maximum height Sz, arithmetical mean height Sa, correlation length Sal, texture aspect ratio Str, rms. slope Sdq, developed interfacial areal ratio Sdr, peak density Spd, mean peak curvature Spc, core height Sk, reduced peak height Spk and reduced valley depth Svk. These parameters were selected based on previous research of the author of this article and a review of the technical literature. Most of these parameters were used for descriptions of surface textures after various machining processes [36]. Some parameters are functionally important [7]. The surface randomness/periodicity was assessed on the basis of the autocorrelation function. One can see from the analysis of Figure 2 that the surface after turning had a periodic character with a number of random components. This surface was anisotropic. After burnishing, the surface with the smallest pressure was also anisotropic, in contrast to other burnished surfaces of mixed qualities. Burnished disc surfaces have deterministic–random structures. The main wavelengths (mean widths of the elements of the profiles) of the burnished samples were similar; however, they were larger than that of the turned sample and resulted from the burnishing parameters. The maximum amplitude of the specimen burnished with the smallest pressure was similar to that of the turned disc; however, increases in the burnishing pressure led to decreases in the surface amplitudes. After turning, the surface texture seemed to be more homogeneous than the burnished textures. Among the burnished disc samples, the smallest amount of random component was found for the disc machined with a pressure of 30 MPa.
Similar conclusions can be drawn from the analysis of Table 3. Although no parameter described the surface periodicity or randomness, the hybrid parameters rms. slope Sdq and developed interfacial areal ratio Sdr, as well as the mean peak curvature of the surface burnished with a pressure of 30 MPa are considerably smaller than those of the surface machined by a pressure of 20 MPa; these surfaces have similar amplitude characterised by the Sq parameter. This phenomenon confirmed a smaller amount of the random component of the texture burnished with a pressure of 30 MPa. Due to an analysis of the parameters, a decrease of the surface height can be better described compared to a study of the surface views and profiles. For the smallest pressure, small changes were obtained for the following parameters: Sq, Sv, Sz, Sa and Svk. Parameters Sp, Sk and Spk changed more; the kurtosis Sku was stable and the skewness Ssk decreased to −0.345. Surfaces with negative skewness have good tribological properties [7]. The height of the roughness decreased more as a result of burnishing when the pressure increased to 20 and 30 MPa; however, the use of the highest burnishing pressure led to growth in the surface amplitude compared to the applications of pressures of 20 and 30 MPa. Perhaps the burnishing pressure of 40 MPa was too high, considering the surface quality. In this case, the amount of the random component was higher compared to the pressure of 30 MPa. The smallest amplitude parameters Sq, Sv, Sz, Sa, Spk, Svk and Spk were achieved for a pressure of 30 MPa; the decrease in the Sq parameter achieved 85%. Due to burnishing, the correlation length Sal considerably increased from 0.053 mm to a range of 0.109–0.264 mm. The observation obtained from the analysis of Figure 2 that the main wavelength increased due to burnishing was confirmed by the analysis of the surface texture parameters. The use of the smallest burnishing pressure caused a negligible change in the texture aspect ratio Str. This parameter increased from 0.137 (turned sample) to about 0.5 when the burnishing pressures were 20, 30 and 40 MPa; therefore, the surface character changed from anisotropic to mixed. Due to ball burnishing, hybrid parameters Sdq and Sdr, as well as the mean peak curvature Spc decreased; their changes were the smallest for a pressure of 10 MPa and the highest for a pressure of 30 MPa. Ball burnishing caused decreases in the values of the peak density Spd; the reductions were the highest for a pressure of 30 MPa, which was also visible in Figure 2. Ball burnishing led to an increase in kurtosis Sku to values characteristic for random surfaces.
Figure 3 presents the results of the microhardness measurement. The mean values and standard deviations are shown. Figure 4 presents the indentations for the milled and burnished samples. The lowest burnishing pressure of 10 MPa caused a small increase in the microhardness. When a burnishing pressure of 20 MPa was used, the microhardness increased by 10%. A similar growth in the microhardness was reached for the highest pressures used of 30 and 40 MPa; in these cases, the microhardness increased by 26% (Figure 3). An increase in the microhardness can cause a decrease in the wear intensity of the disc samples. One can see from the analysis of Figure 4 that the microhardness of the burnished sample at a pressure of 40 MPa is higher than that of the turned disc.
Figure 5 presents the changes in the coefficient of friction with time, while Figure 6 shows the average values and error bars (standard deviations) of the coefficient of friction. The coefficient of friction was calculated as the ratio of the friction force to the normal force. The mean values of the coefficient of friction for the whole tests, after the initial fluctuations (240 s) and in the final test parts (last 60 s), are shown in Figure 6.
For all the normal loads used, a great fluctuation of the friction forces with sudden jumps occurred in the initial periods of the tests. This is related to the accommodation of the sliding surfaces of the balls and discs; therefore, the values of the coefficient of friction for the entire tests (Figure 6a) were higher than those obtained after the initial fluctuation (Figure 6b) and in the final parts of tests (Figure 6c). After the initial periods of 200–250 s, the coefficients of friction were stable for the normal loads of 60 and 80 N. In the last case (normal load of 80 N), sudden jumps of the coefficient of friction occurred after 600 s, which may be related to the risk of seizure of the sliding pair; however, when the normal load was the lowest, the friction force after the early fluctuations decreased as the test progressed. This can be related to the presence of the lubricant in the contact zone. In this case, the smallest friction coefficient was reached for sample burnished with a pressure of 30 MPa. The sliding pair with a turned disc surface provided the highest friction force. The other sliding pairs led to similar coefficients of friction. For a medium normal force of 60 N, a burnishing pressure of 30 MPa caused the smallest coefficient of friction, followed by pressures of 40 MPa and 20 MPa; however, high resistance to motion was obtained for the sliding assemblies with the turned sample and with the sample burnished with the smallest pressure of 10 MPa. Similar results were obtained when the highest normal load of 80 N was used; however, the final coefficients of friction were the smallest for the burnishing pressures of 30 MPa and 40 MPa. An increase in the normal load typically caused an increase in the coefficient of friction. This behaviour existed particularly for normal loads of 40 and 60 N. This performance could be related to the lack of accommodation between the sliding surfaces; presumably, non-conformal contacts existed throughout the entire tests.
Figure 7 presents examples of the fretting loops in the final parts of tests. The shapes of these loops are typical of gross fretting. One can see that a stroke of 0.1 mm was maintained throughout the tests.
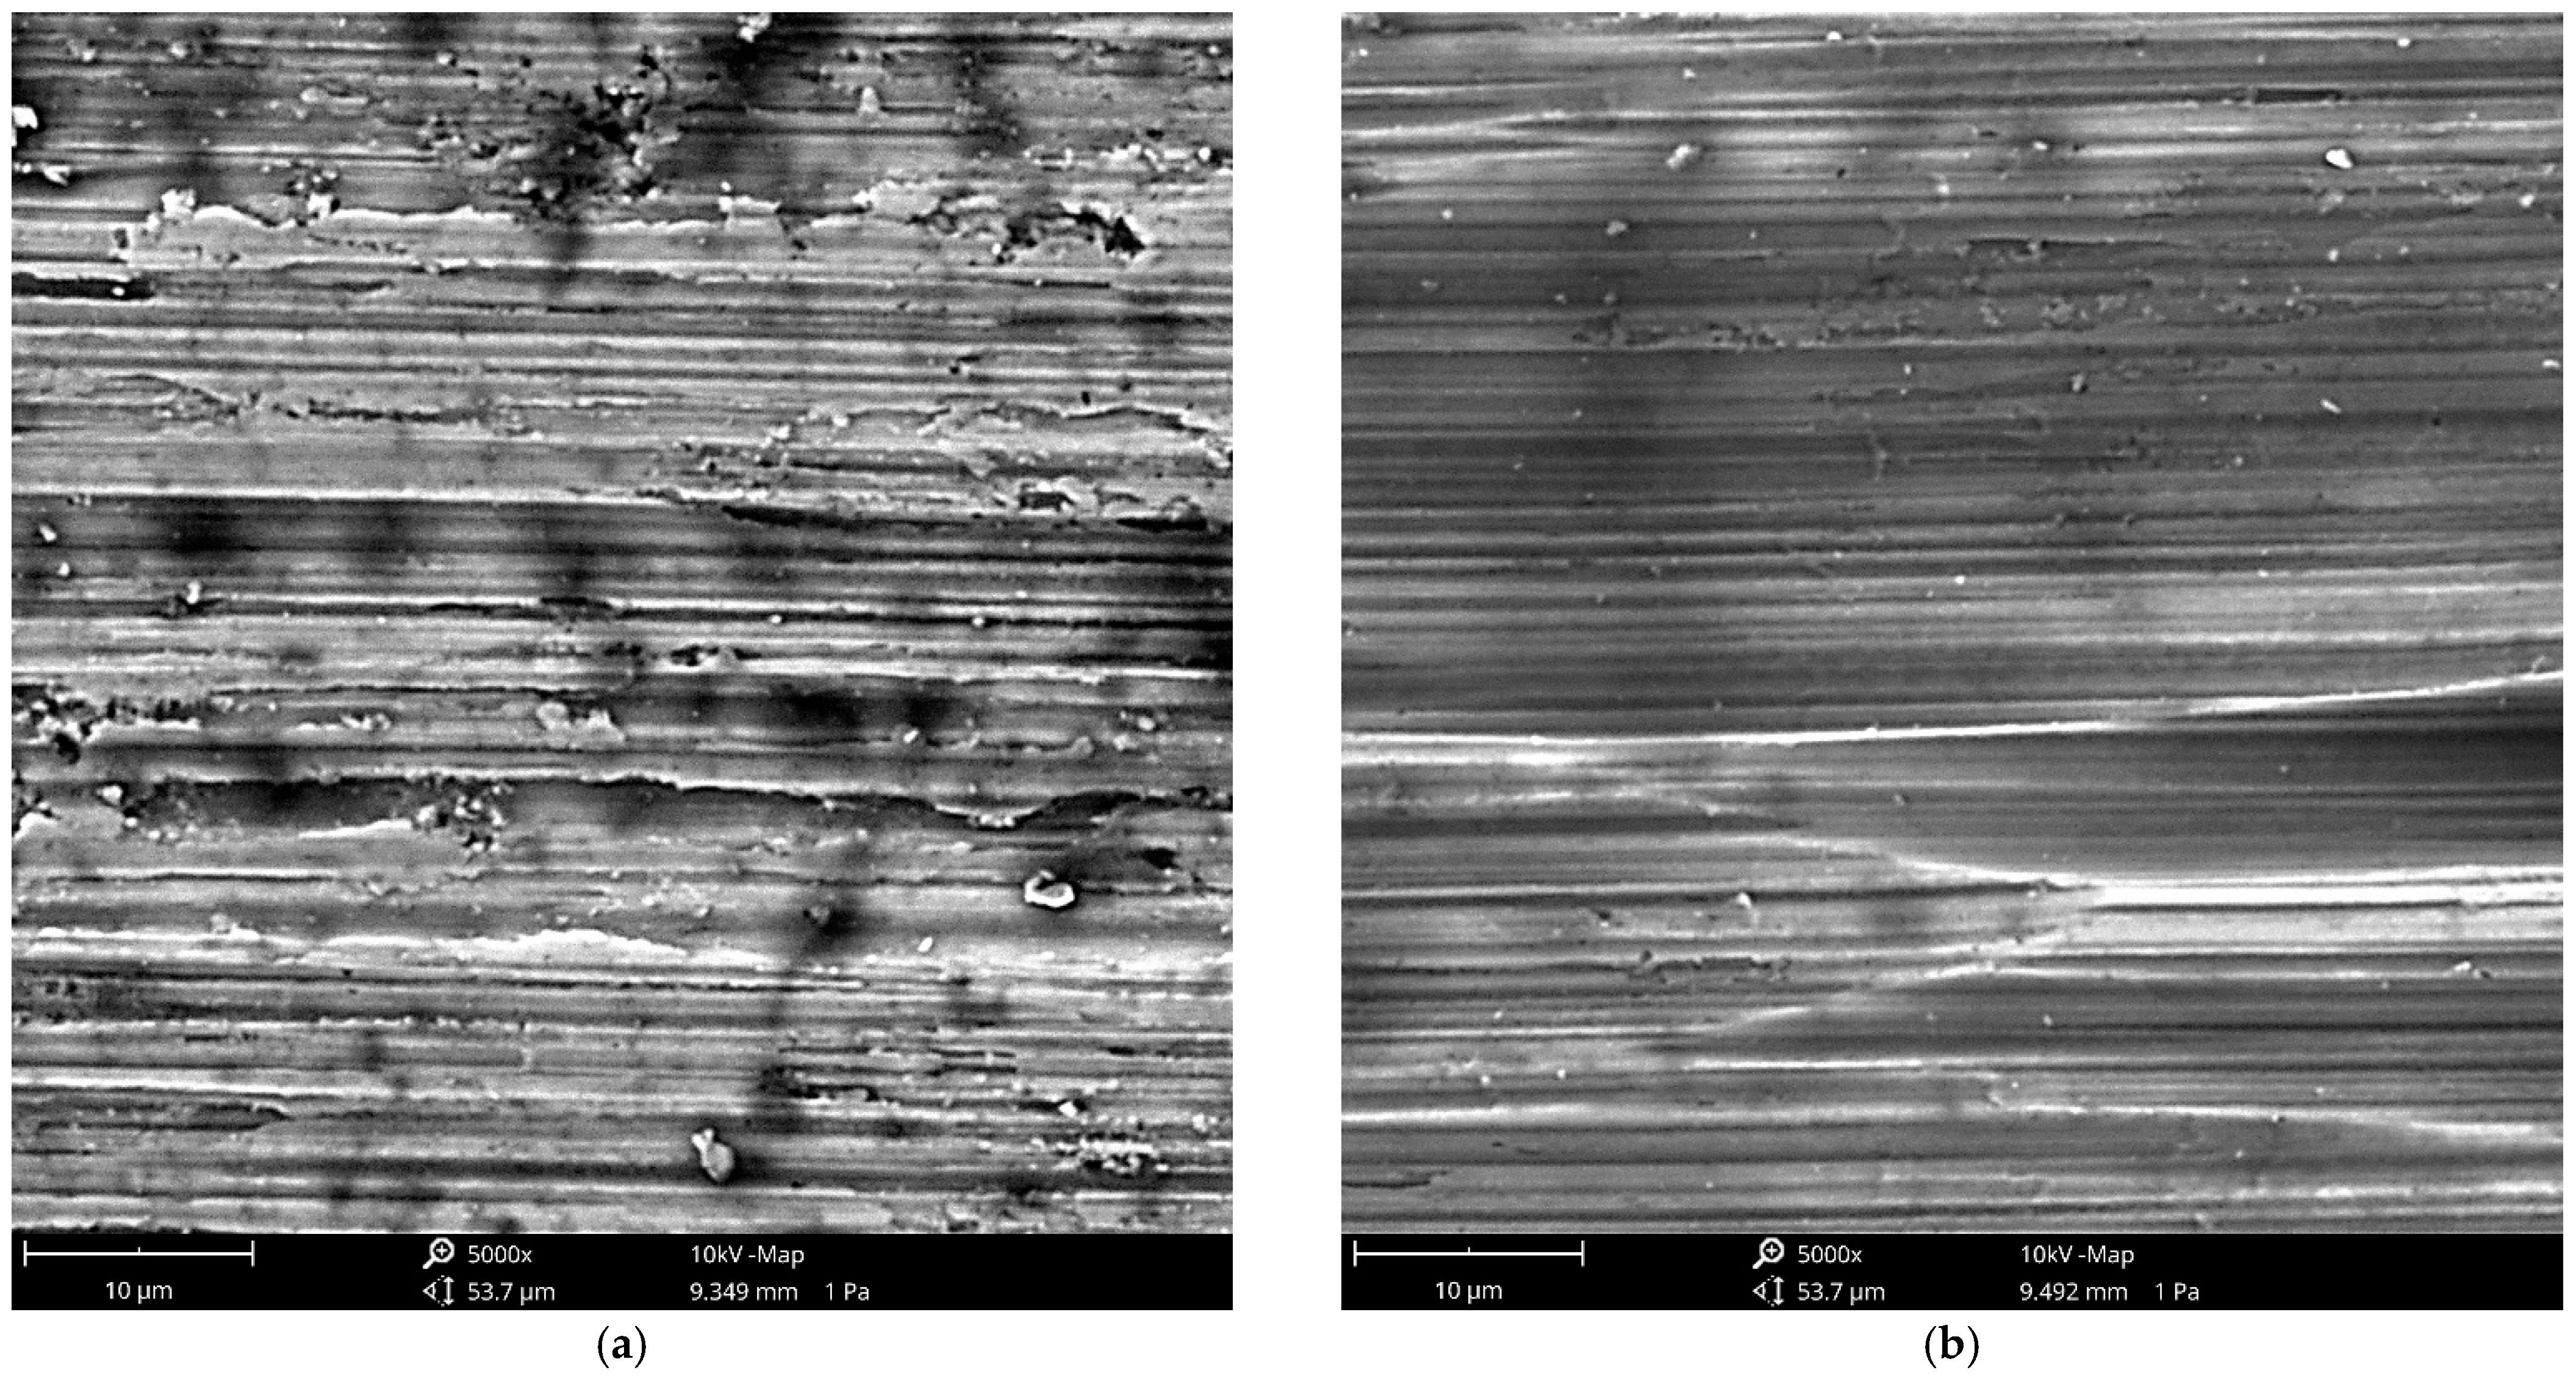
Figure 8 presents the wear volumes of the tested discs. They were obtained as the result of measurements of the wear scars using an optical method. Figure 9 shows the 3D views and selected profiles of the tested worn disc when the normal load was the highest, at 80 N. The wear levels of the balls were negligible. In contrast, the wear depths of the discs were larger than the initial roughness height. This behaviour was caused by the balls being much harder than the discs. An increase in the normal load led to an increase in the disc volumetric wear; this behaviour is common. Independently of the applied normal load, the largest wear corresponded to the turned sample, followed by the specimen after burnishing with a pressure of 10 MPa. When the normal loads were 40 N and 60 N, the lowest wear was achieved for the sliding pair with the sample machined with a pressure of 30 N; however, for the largest normal load, the increase in the burnishing pressure caused a decrease in the disc wear. The smallest disc wear corresponds to the highest pressure of 40 MPa, followed by pressures of 30, 20 and 10 MPa. The wear scars had the shape of the letter “U”, which means that the wear had a non-adhesive character (Figure 9) [20], which can be a result of lubrication. The analysis of Figure 10 showing the SEM images of selected worn disc samples after using the highest normal load proves that the wear had a mainly abrasive character; however, for the disc sample obtained for the smallest burnishing pressure of 10 MPa, delamination was also observed in Figure 10a. In this case, the wear level was higher compared to the sample shown in Figure 10b.
From the analysis of the results of the research, one can conclude that there were difficulties with penetrating the oil to the contact zone. In some publications [24,25,26,27,28], the tribological properties of a rough surface were improved by lubrication in gross fretting conditions; however, in this work the lowest friction was reached for the disc surface burnished with a pressure of 30 MPa. This behaviour was obtained for all the normal loads used. This surface seemed to have the best quality in the lubrication regime. It was characterised by the smallest roughness height and hybrid parameters, as well as the smallest peak density from all the analysed disc textures. In contrast, the surface with the highest amplitude after turning and the burnished surface with the smallest normal load of 10 MPa led to high resistances to motion. The surface burnished with a pressure of 10 MPa was similar to the surface after turning; therefore, the frictional behaviour of these two surfaces were similar. In lubricated sliding, smooth surfaces typically lead to a reduction in friction [15,16,17]. Due to burnishing, the friction coefficient was reduced up to 45%. Similar results were obtained in [18]. The characteristics of the fretting loops could be seen on the presence of the gross fretting. Throughout the tests, the ceramic ball co-acted with the discs in a non-conformal contact regime. This was proved by increasing the coefficient of friction with the normal load and by the negligible wear of the balls that were much harder than the discs made from a titanium alloy.
Ball burnishing of the disc surfaces caused also a decrease in the volumetric wear of the disc by up to 50%. When the normal loads were 40 and 60 N, the wear volumes were proportional to the coefficients of friction (Figure 6 and Figure 8). Higher resistance to motion corresponded to larger wear levels of the discs. The smallest wear volume was reached for the burnished sample with a pressure of 30 MPa, while the highest for the turned sample was followed by the burnished disc with the smallest pressure of 10 MPa. Because the wear depths were larger than the heights of the initial (machined) surface textures, not only the disc surface texture, but also the microhardness could affect the wear levels. The disc samples burnished with pressures of 40 and 30 MPa were characterised by the highest microhardness, and the turned disc and disc burnished with the smallest pressure of 10 MPa were characterised by the smallest microhardness. When the highest normal load of 80 N was applied, the increase in the burnishing pressure led to a decrease in the disc volumetric wear. For the highest normal load, the microhardness mostly affected the wear levels. The lowest wear was reached on the burnished disc with the largest pressure of 40 MPa, which may be related to the largest microhardness of this disc sample. In this case, the wear depths of the discs were between 50 and 75 µm, much higher than the maximum heights of the machined surfaces (Figure 9). The abrasive wear of the disc typically took place; for the greater wear, delamination also occurred. An increase in hardness is typically related to a reduction in the wear intensity.
4. Conclusions
- The application of ball burnishing to discs made from the titanium alloy in contact with ceramic balls reduced the coefficient of friction up to 45% compared to the turned disc sample in lubricated gross fretting conditions. The highest friction decrease was achieved for a burnishing pressure of 30 MPa, while the lowest was obtained for the smallest pressure of 10 MPa. The greatest friction reduction was acquired for the smoothest disc sample of high microhardness.
- Ball burnishing of the discs also led to a reduction in disc volume loss up to 50% compared to the turned sample. For normal forces of 40 N and 60 N, the highest reductions were achieved for a specimen burnished with a pressure of 30 MPa. For the highest normal force of 80 N, the increase in burnishing pressure caused a decrease in the disc’s volumetric wear.
- The wear of the disc had an abrasive character with the presence of delamination, which corresponds to larger wear losses. The wear levels of balls made from WC ceramic were negligible due to the large difference between the hardness values of the balls and discs. Co-action between the disc and ball during the tests occurred in non-conformal conditions.
- A decrease in the height of the roughness was obtained due to ball burnishing. This decrease was the lowest for a pressure of 10 MPa, but the largest for a pressure of 30 MPa. The maximum decrease in the Sq parameter was 84%. Ball burnishing also led to reductions in the rms. slope Sdq, the development of an interfacial areal ratio Sdr, the peak density Spd and mean peak curvature Spc, and growths in the correlation length Sal, texture aspect ratio Str and kurtosis Sku.
- Ball burnishing produced growth in the microhardness of the samples up to 26%. The smallest microhardness increase was acquired for the smallest burnishing pressure, while the highest was obtained for pressures of 30 and 40 MPa.
Funding
This research received no external funding.
Data Availability Statement
Data are contained within the article.
Conflicts of Interest
The author declares no conflict of interest.
References
- Saldaa-Robles, A.; Diosdado-De La Peña, J.; Balvantin-Garcia, A.; Aguilera-Gomez, E.; Plasencia-Mora, H.; Saldaña-Robles, N. Ball. burnishing process: State of the art of a technology in development. Dyna 2017, 92, 28–33. [Google Scholar] [CrossRef] [Green Version]
- Mahajan, D.; Tajane, R. A Review on the Ball Burnishing Process. Int. J. Sci. Res. Publ. 2013, 3–4, 1–8. [Google Scholar]
- Revankar, G.D.; Shetty, R.; Rao, S.S.; Gaitonde, V.N. Analysis. of the surface roughness and hardness in ball burnishing of titanium alloy. Measurement 2014, 58, 256–268. [Google Scholar] [CrossRef]
- Attabi, S.; Himour, A.; Laouar, L.; Motallebzadeh, A. Effect of ball burnishing on surface roughness and wear of the surface of AISI 316L SS. J. Bio-Tribo-Corros. 2020, 7, 7. [Google Scholar] [CrossRef]
- Kanovic, Z.; Vukelic, D.; Simunovic, K.; Prica, M.; Saric, T.; Tadic, B.; Simunovic, G. Modelling of Surface Roughness after the Ball Burnishing Process with a High-Stiffness Tool Using Regression Analysis, Artificial Neural Networks, and Support Vector Regression. Metals 2022, 12, 320. [Google Scholar] [CrossRef]
- Dzionk, S.; Scibiorski, B.; Przybylski, W. Surface texture analysis of Hardened Shafts after ceramic ball burning. Materials 2019, 12, 204. [Google Scholar] [CrossRef] [Green Version]
- Pawlus, P.; Reizer, R.; Wieczorowski, M. Functional Importance of Surface Texture Parameters. Materials 2021, 14, 5326. [Google Scholar] [CrossRef]
- Jerez-Mesa, R.; Travieso-Rodrguez, J.A.; Landon, Y.; Dessein, G.; Lluma-Fuentes, J.; Wagner, V. Comprehensive. analysis of surface integrity modification of Ti-6Al-4V surfaces through vibration-assisted ball burnishing. J. Mater. Process. Technol. 2019, 267, 230–240. [Google Scholar] [CrossRef]
- Swirad, S.; Wydrzynski, D.; Nieslony, P.; Krolczyk, G.M. Influence. of hydrostatic burnishing strategy on the surface topography of martensitic steel. Measurement 2019, 138, 590–601. [Google Scholar] [CrossRef]
- Bourebia, M.; Hamadache, H.; Lakhdar, L.; Mentouri, Z.; Kamila, D.; Tarek, H.; Ahlem, T. Effect of the ball burnishing process on the mechanical properties and impact behavior of S355JR steel. Int. J. Adv. Manuf. Technol. 2021, 116, 1373–1384. [Google Scholar] [CrossRef]
- Bourebia, M.; Bouri, A.; Hamadache, H.; Achouri, S.; Laouar, L.; Gharbi, A.; Bouhamla, K. Study of the effect of burnishing on superficial hardness and hardening of S355JR steel using experimental planning. Energy Procedia 2019, 157, 568–577. [Google Scholar] [CrossRef]
- Ye, W.; Xie, M.; Huang, Z.; Wang, H.; Zhou, Q.; Wang, L.; Chen, B.; Wang, H.; Liu, W. Microstructure and tribological properties of in-situ carbide/CoCrFeNiMn high entropy alloy composites synthesized by flake powder metallurgy. Tribol. Int. 2023, 181, 108295. [Google Scholar] [CrossRef]
- Zhang, T.; Bugtai, N.; Marinescu, I.D. Burnishing of aerospace alloy: A theoretical–experimental approach. J. Manuf. Syst. 2015, 37, 472–478. [Google Scholar] [CrossRef]
- Han, K.; Zhang, D.; Yao, C.; Zhou, Z.; Zhao, Y. Neural Network Modeling of Surface Roughness and Residual Stress Induced by Ball Burnishing. In Proceedings of the IEEE Aerospace Conference Proceedings, Big Sky, MT, USA, 6–13 March 2021; p. 9438416. [Google Scholar]
- Dzierwa, A.; Pawlus, P.; Zelasko, W.; Reizer, R. The study of the tribological properties of one-process and two-process textures after vapour blasting and lapping using pin-on-disc tests. Key Eng. Mater. 2013, 527, 217–222. [Google Scholar] [CrossRef]
- Sedlacek, M.; Podgornik, B.; Vizintin, J. Correlation between standard roughness parameters skewness and kurtosis and tribological behaviour of contact surfaces. Tribol. Int. 2012, 48, 102–112. [Google Scholar] [CrossRef]
- Sedlacek, M.; Podgornik, B.; Vizintin, J. Influence of surface preparation on roughness parameters, friction and wear. Wear 2009, 266, 482–487. [Google Scholar] [CrossRef]
- Swirad, S.; Pawlus, P. The Influence of Ball Burnishing on Friction in Lubricated Sliding. Materials 2020, 13, 5027. [Google Scholar] [CrossRef] [PubMed]
- Fouvry, S.; Kapsa, P.; Vincent, L. Analysis of sliding behavior for fretting loading: Determination of transition. Wear 1995, 185, 21–46. [Google Scholar] [CrossRef]
- Vingsbo, O.; Soerberg, S. On fretting maps. Wear 1988, 126, 131–147. [Google Scholar] [CrossRef]
- Zhou, Z.R.; Nakazawa, S.; Zhu, M.H.; Maruyama, N.; Kapsa, P.; Vincent, L. Progress in fretting maps. Tribol. Criteria Int. 2006, 39, 1068–1073. [Google Scholar] [CrossRef]
- Wang, Z.A.; Zhou, Z.R. An investigation of fretting behaviour of several synthetic base oils. Wear 2009, 267, 1399–1404. [Google Scholar] [CrossRef]
- Warmuth, A.R.; Sun, W.; Shipway, P.H. The roles of contact conformity, temperature and displacement amplitude on the lubricated fretting wear of a steel-on-steel contact. R. Soc. Open Sci. 2016, 3, 150637. [Google Scholar] [CrossRef] [Green Version]
- Sato, J.; Shima, M.; Sugawara, T.; Tahara, A. Effect of lubricants on fretting wear of steel. Wear 1988, 125, 83–95. [Google Scholar] [CrossRef]
- Imai, M.; Teramoto, H.; Shimauchi, Y.; Tonegawa, E. Effect of oil supply on fretting wear. Wear 1986, 110, 217–225. [Google Scholar] [CrossRef]
- Okamoto, M.; Jibiki, T.; Ito, S.; Motoda, T. Role of cross-grooved type texturing in acceleration of initial running-in under lubricated fretting. Tribol. Int. 2016, 100, 126–131. [Google Scholar] [CrossRef]
- Lenart, A.; Pawlus, P.; Dzierwa, A.; Wos, S.; Reizer, R. The effect of surface texture on lubricated fretting. Materials 2020, 13, 4886. [Google Scholar] [CrossRef] [PubMed]
- Kubiak, K.J.; Mathia, T.G. Influence of roughness on contact interface in fretting under dry an boundary lubricated sliding regimes. Wear 2009, 267, 315–321. [Google Scholar] [CrossRef] [Green Version]
- El-Tayeb, N.S.M.; Low, K.O.; Brevern, P.V. Enhancement of surface quality and tribological properties using the ball burnishing process. Mach. Sci. Technol. 2015, 12, 234–248. [Google Scholar] [CrossRef]
- Swirad, S.; Pawlus, P. The Effect of Ball Burnishing on Tribological Performance of 42CrMo4 Steel under Dry Sliding Conditions. Materials 2020, 13, 2127. [Google Scholar] [CrossRef]
- Swirad, S.; Pawlus, P. The Effect of Ball Burnishing on Dry Fretting. Materials 2021, 14, 7073. [Google Scholar] [CrossRef]
- Yilmaz, H.; Sadeler, R. Impact wear behavior of ball-blended 316L stainless steel. Surf. Coat. Technol. 2019, 363, 369–378. [Google Scholar] [CrossRef]
- Revankar, G.D.; Shetty, R.; Rao, S.S.; Gaitonde, V.N. Improvement. in the wear resistance of titanium alloy (Ti–6Al–4V) by the ball burnishing process. J. Mater. Res. Technol. 2017, 6, 13–32. [Google Scholar] [CrossRef] [Green Version]
- Dzyura, V.; Maruschak, P.; Slavov, S.; Dimitrov, D.; Semehen, V.; Markov, O. Evaluating Some Functional Properties of Surfaces with Partially Regular Microreliefs Formed by Ball-Burnishing. Machines 2023, 11, 633. [Google Scholar] [CrossRef]
- Ren, Y.; Huang, Z.; Wang, Y.; Zhou, Q.; Yang, T.; Li, Q.; Jia, Q.; Wang, H. Friction-induced rapid amorphization in a wear-resistant (CoCrNi)88Mo12 dual-phase medium-entropy alloy at cryogenic temperature. Compos. Part B Eng. 2023, 263, 110833. [Google Scholar] [CrossRef]
- Pawlus, P.; Reizer, R.; Wieczorowski, M.; Królczyk, G. Parametric description of one-process surface texture. Meas. J. Int. Meas. Confed. 2022, 204, 112066. [Google Scholar] [CrossRef]
Figure 1.
The scheme of the tribotester.

Figure 2.
Pseudo-colour images, 3D views and profiles of the disc texture after turning (a) and after burnishing with pressures of 10 (b), 20 (c), 30 (d) and 40 MPa (e).
Figure 2.
Pseudo-colour images, 3D views and profiles of the disc texture after turning (a) and after burnishing with pressures of 10 (b), 20 (c), 30 (d) and 40 MPa (e).
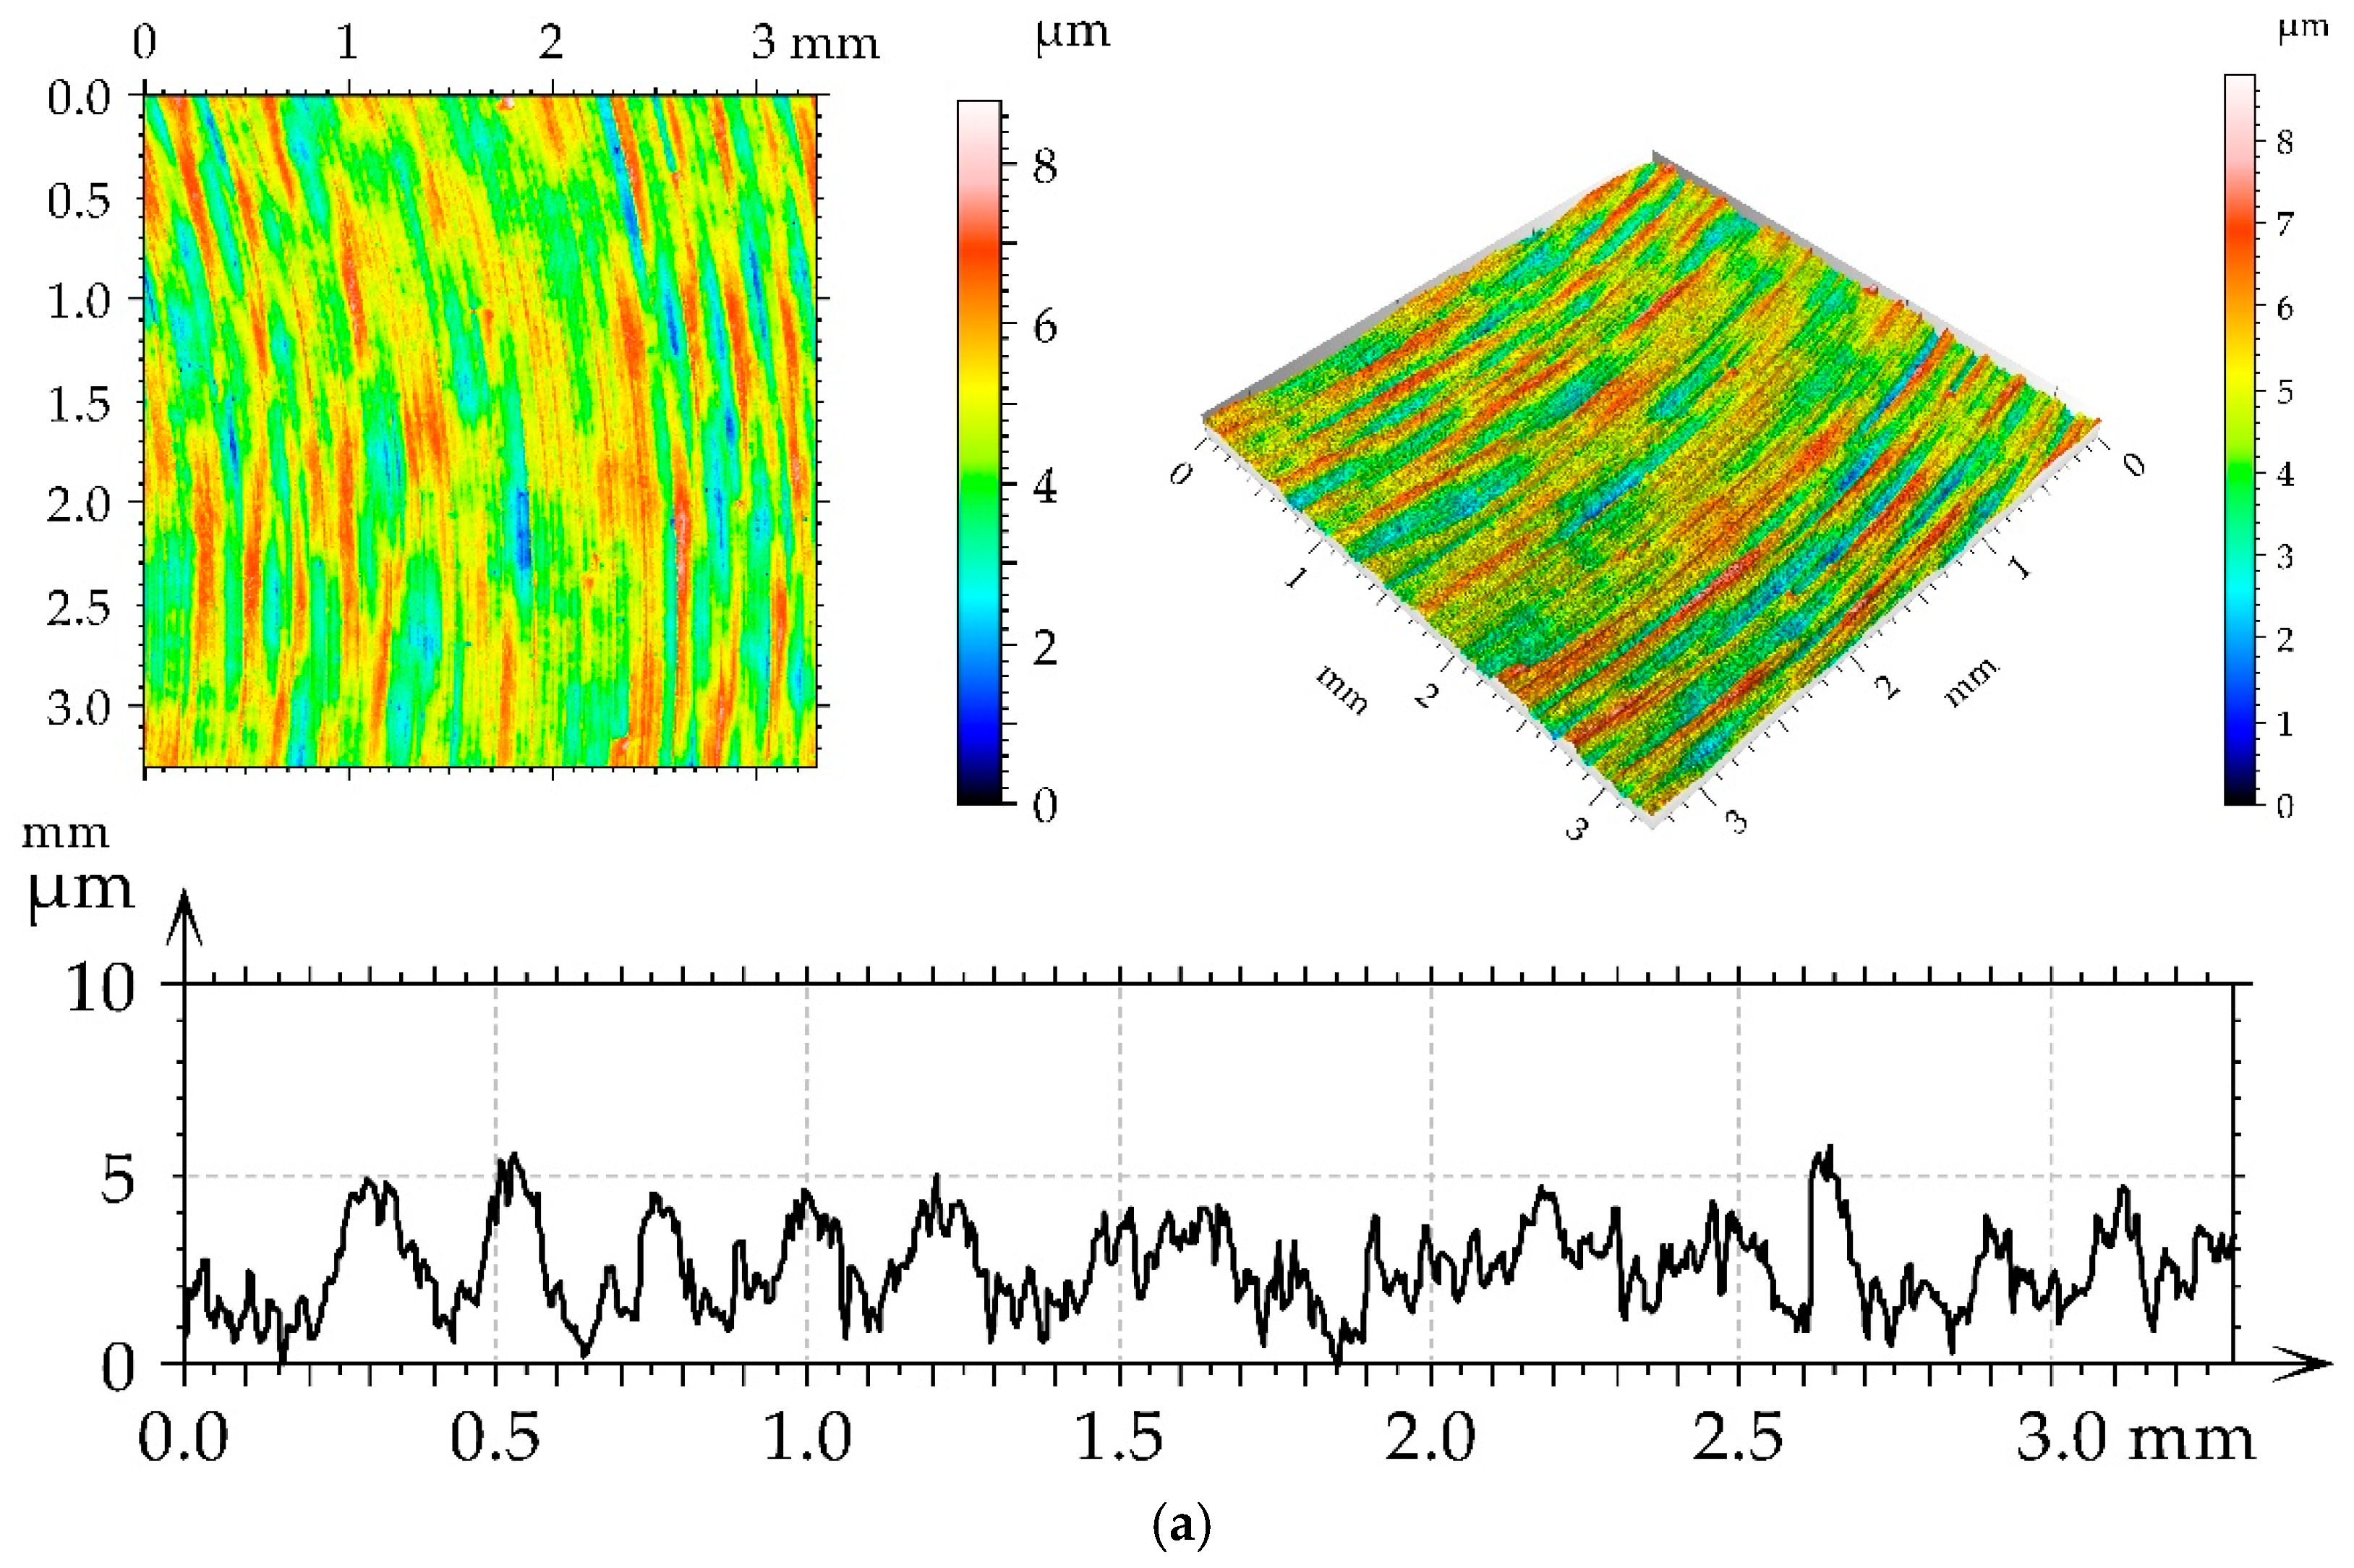


Figure 3.
Microhardness values of disc samples.
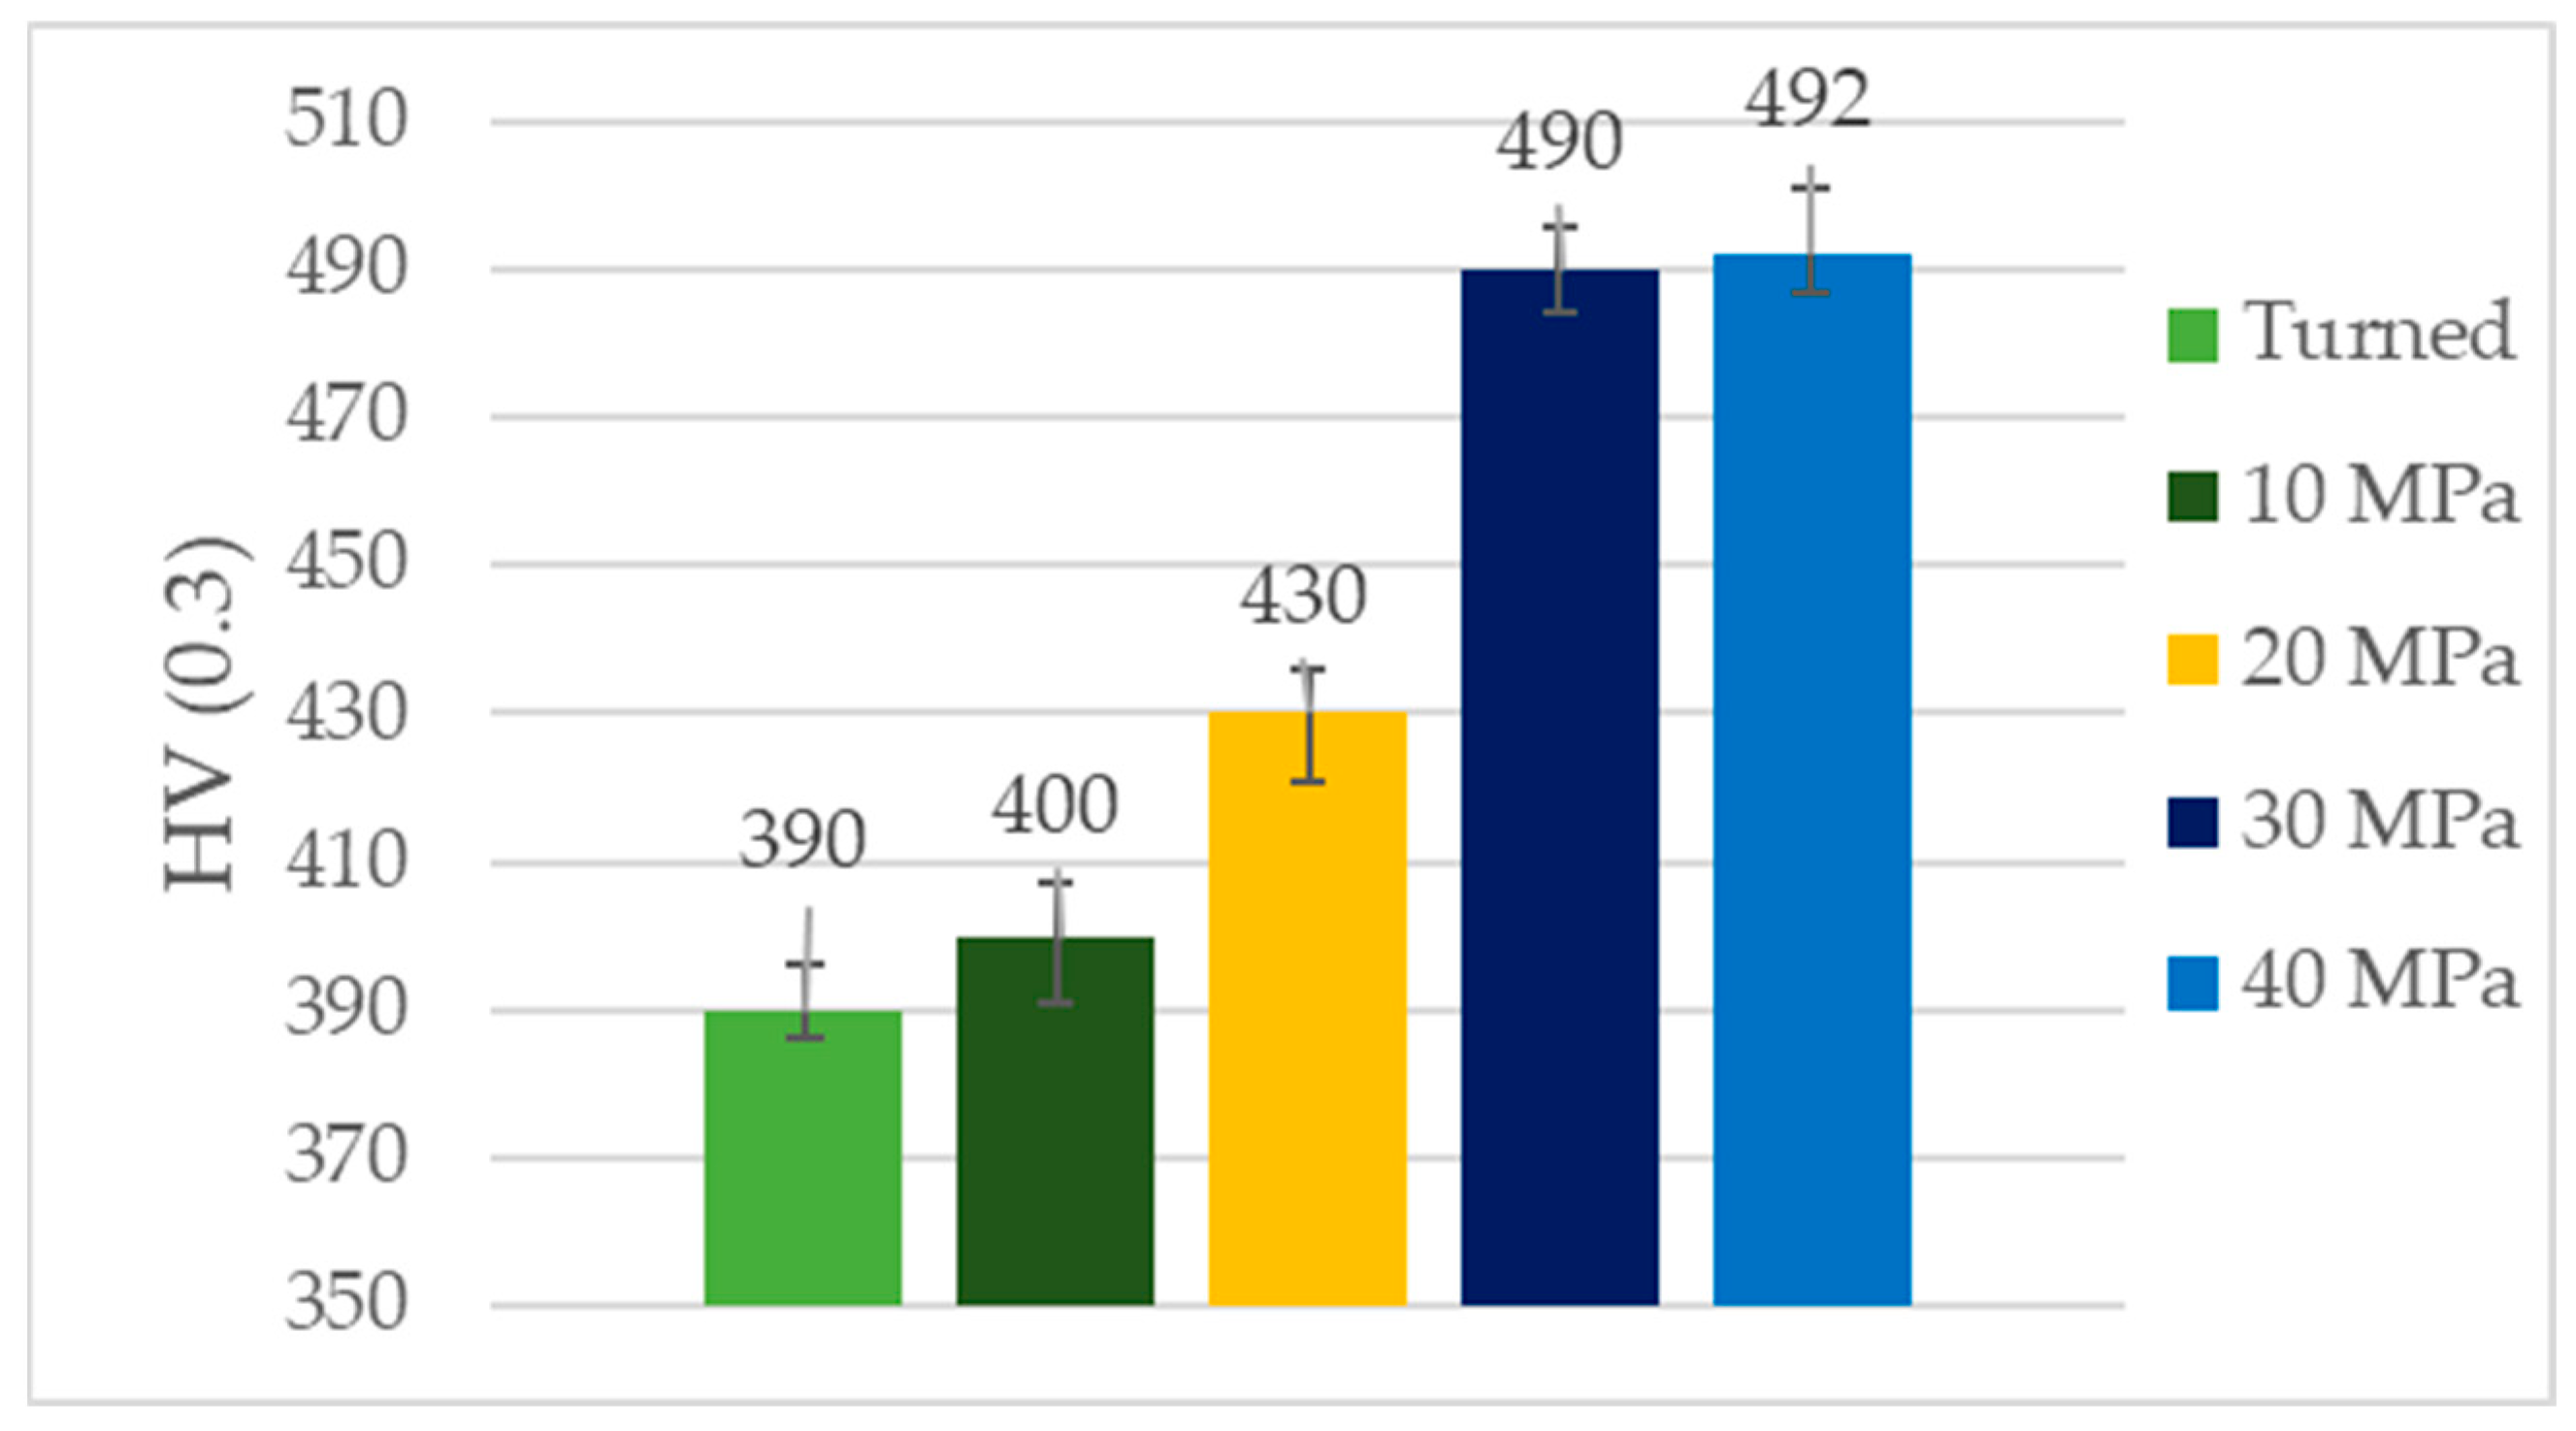
Figure 4.
Microhardness indentations for the turned sample (a) and burnished sample at a pressure of 40 MPa (b).
Figure 4.
Microhardness indentations for the turned sample (a) and burnished sample at a pressure of 40 MPa (b).
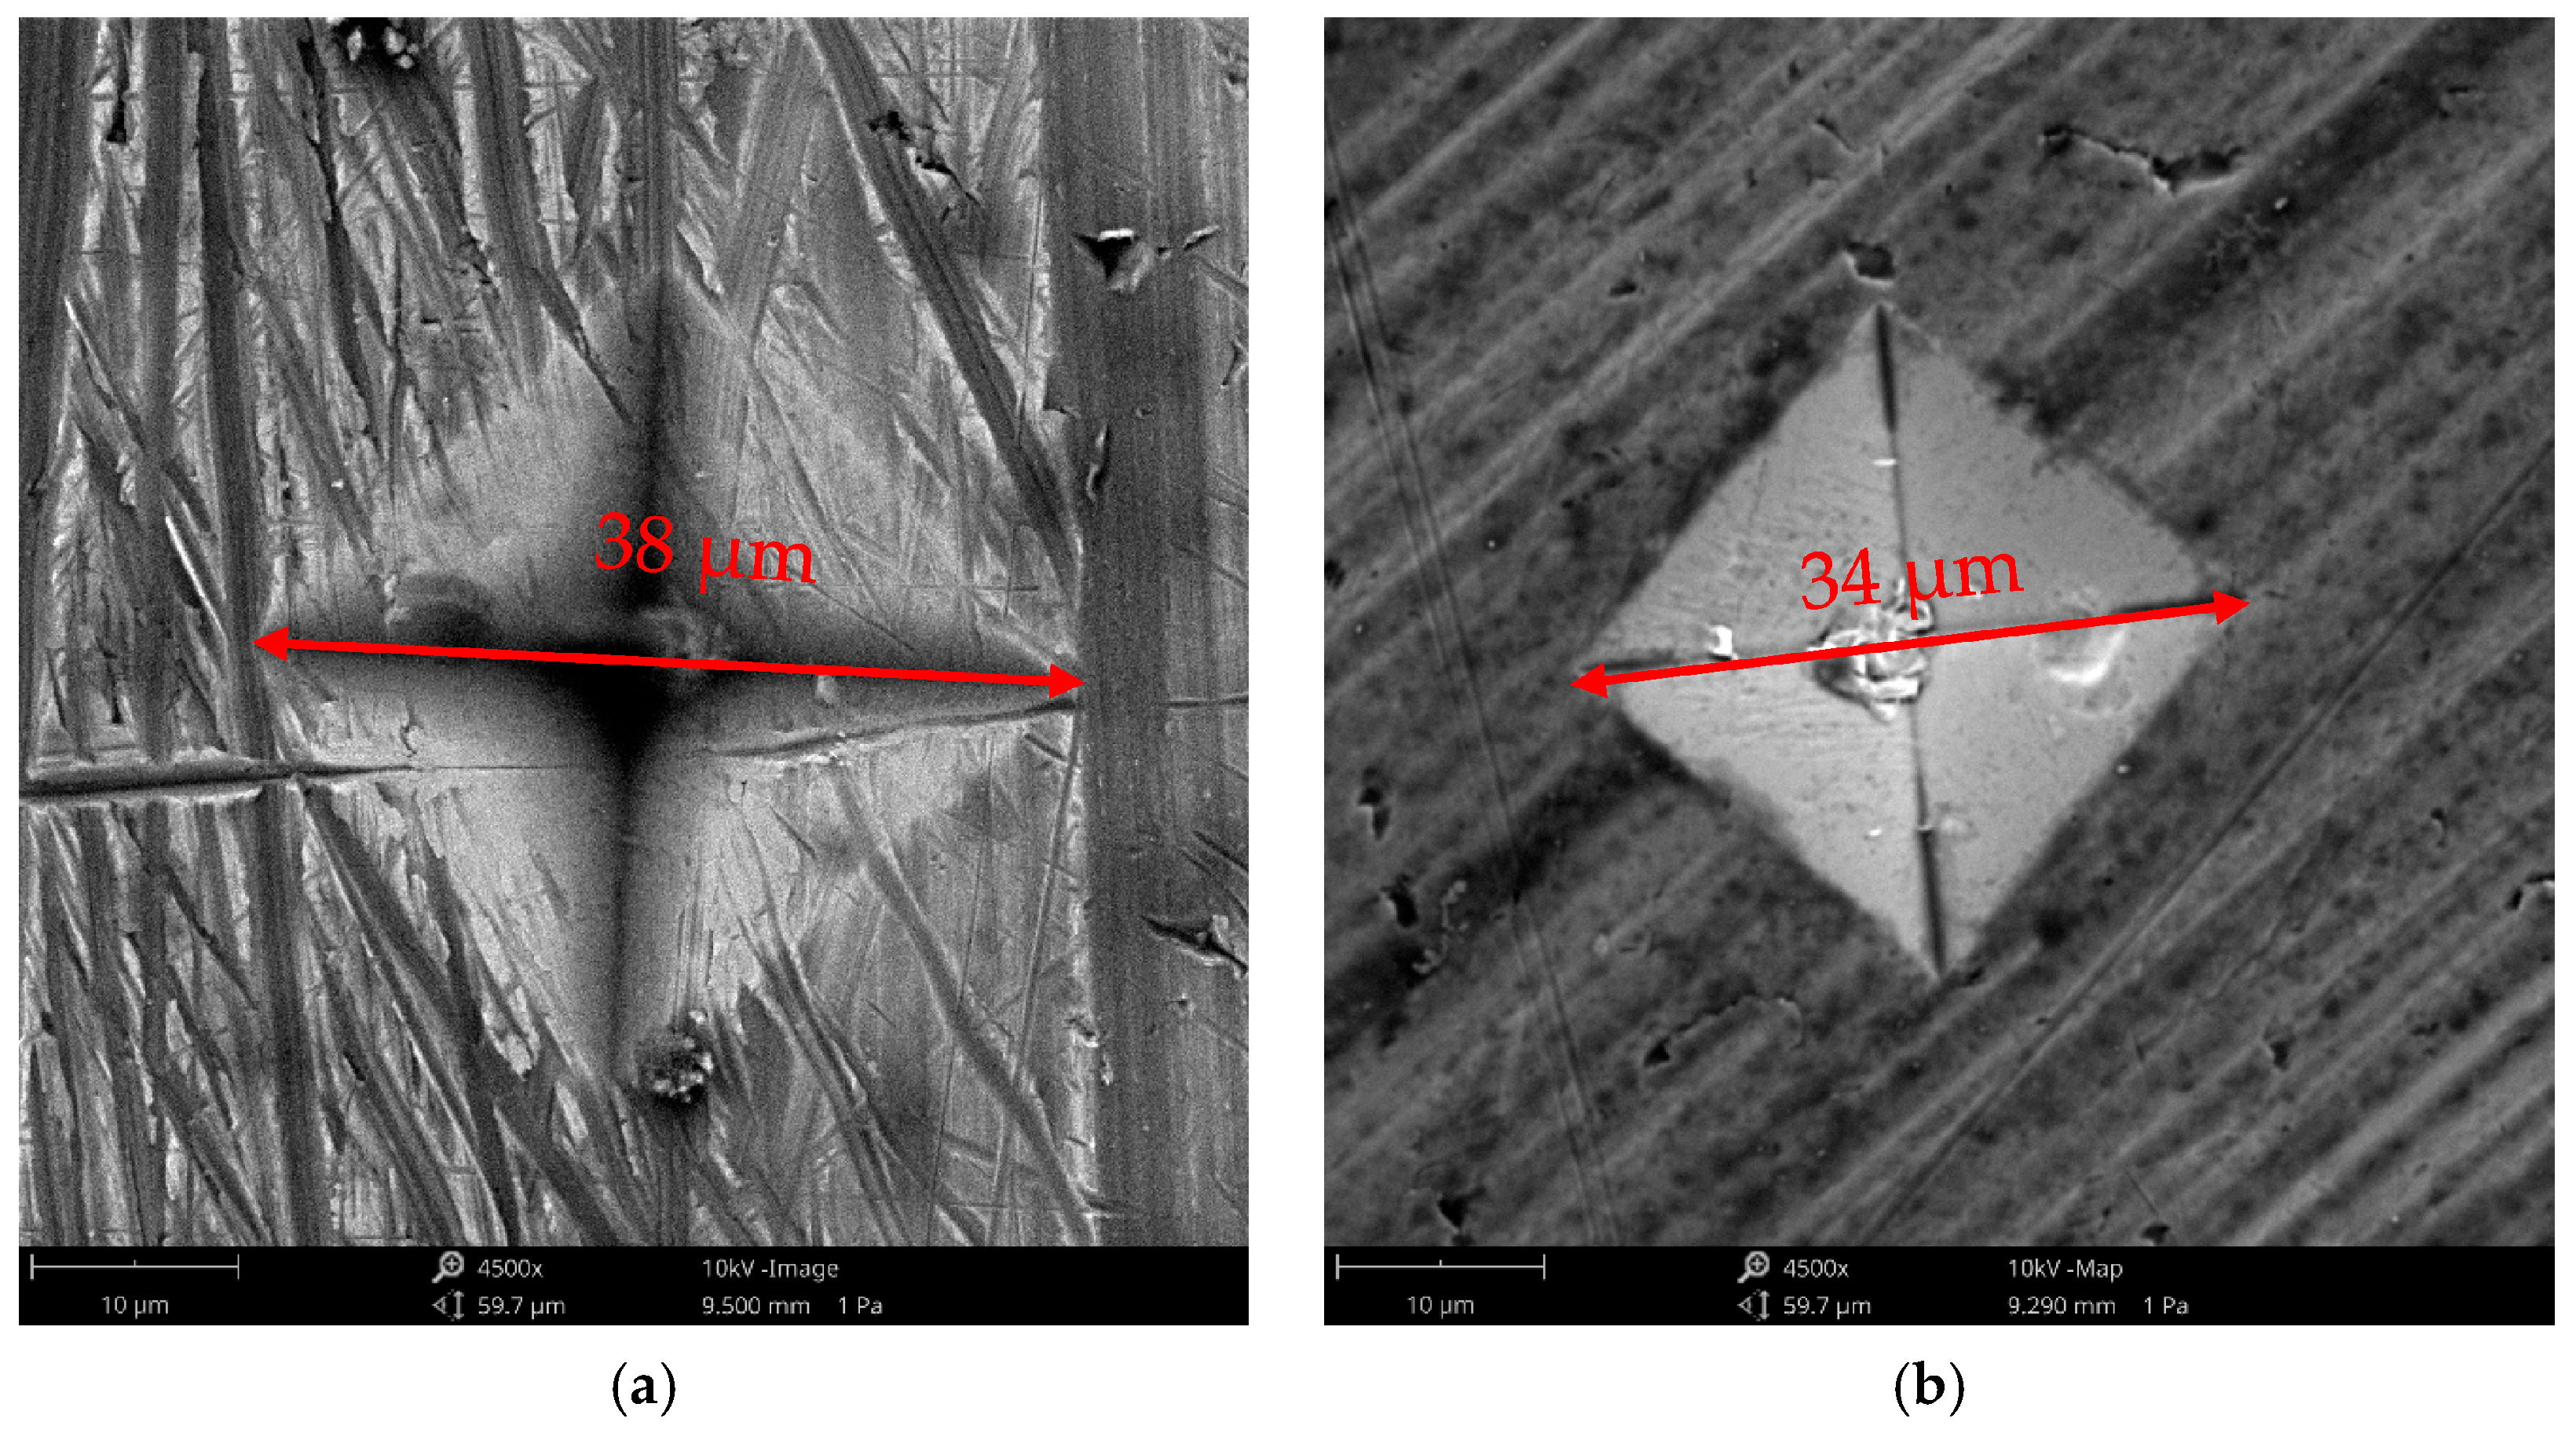
Figure 5.
The friction coefficient versus time, for the normal force of 40 (a), 60 (b) and 80 N (c).
Figure 5.
The friction coefficient versus time, for the normal force of 40 (a), 60 (b) and 80 N (c).
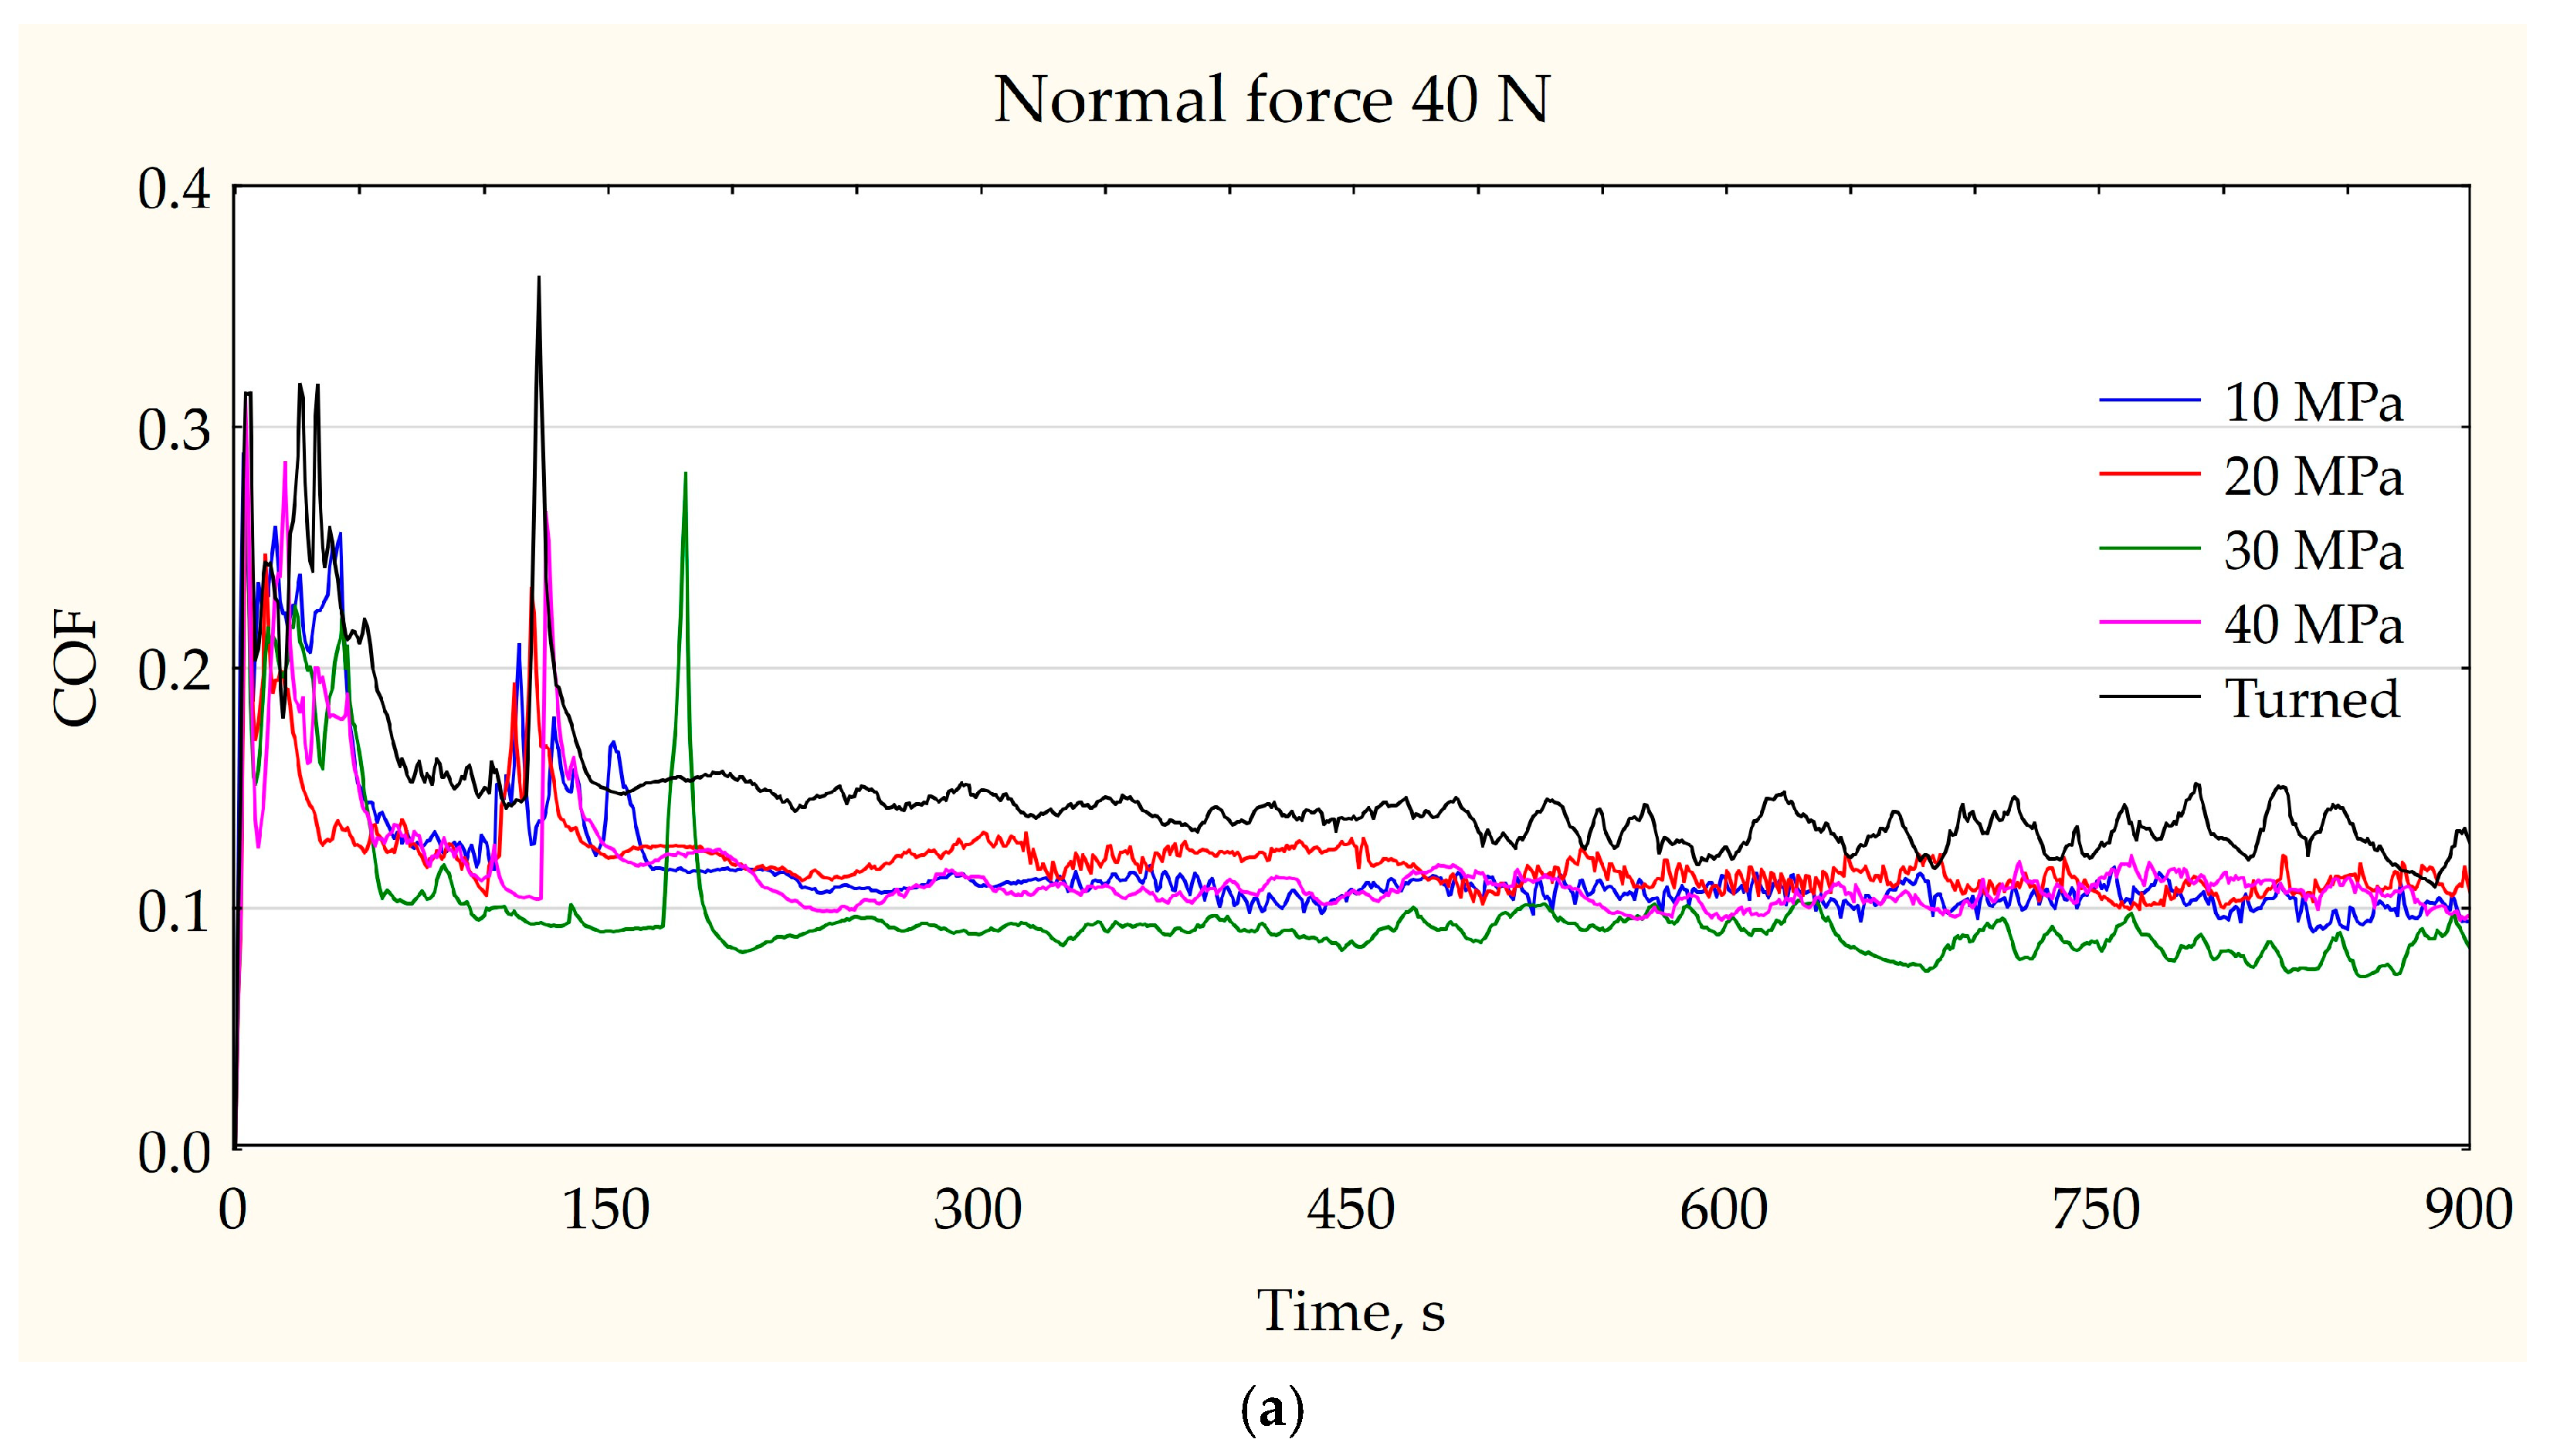
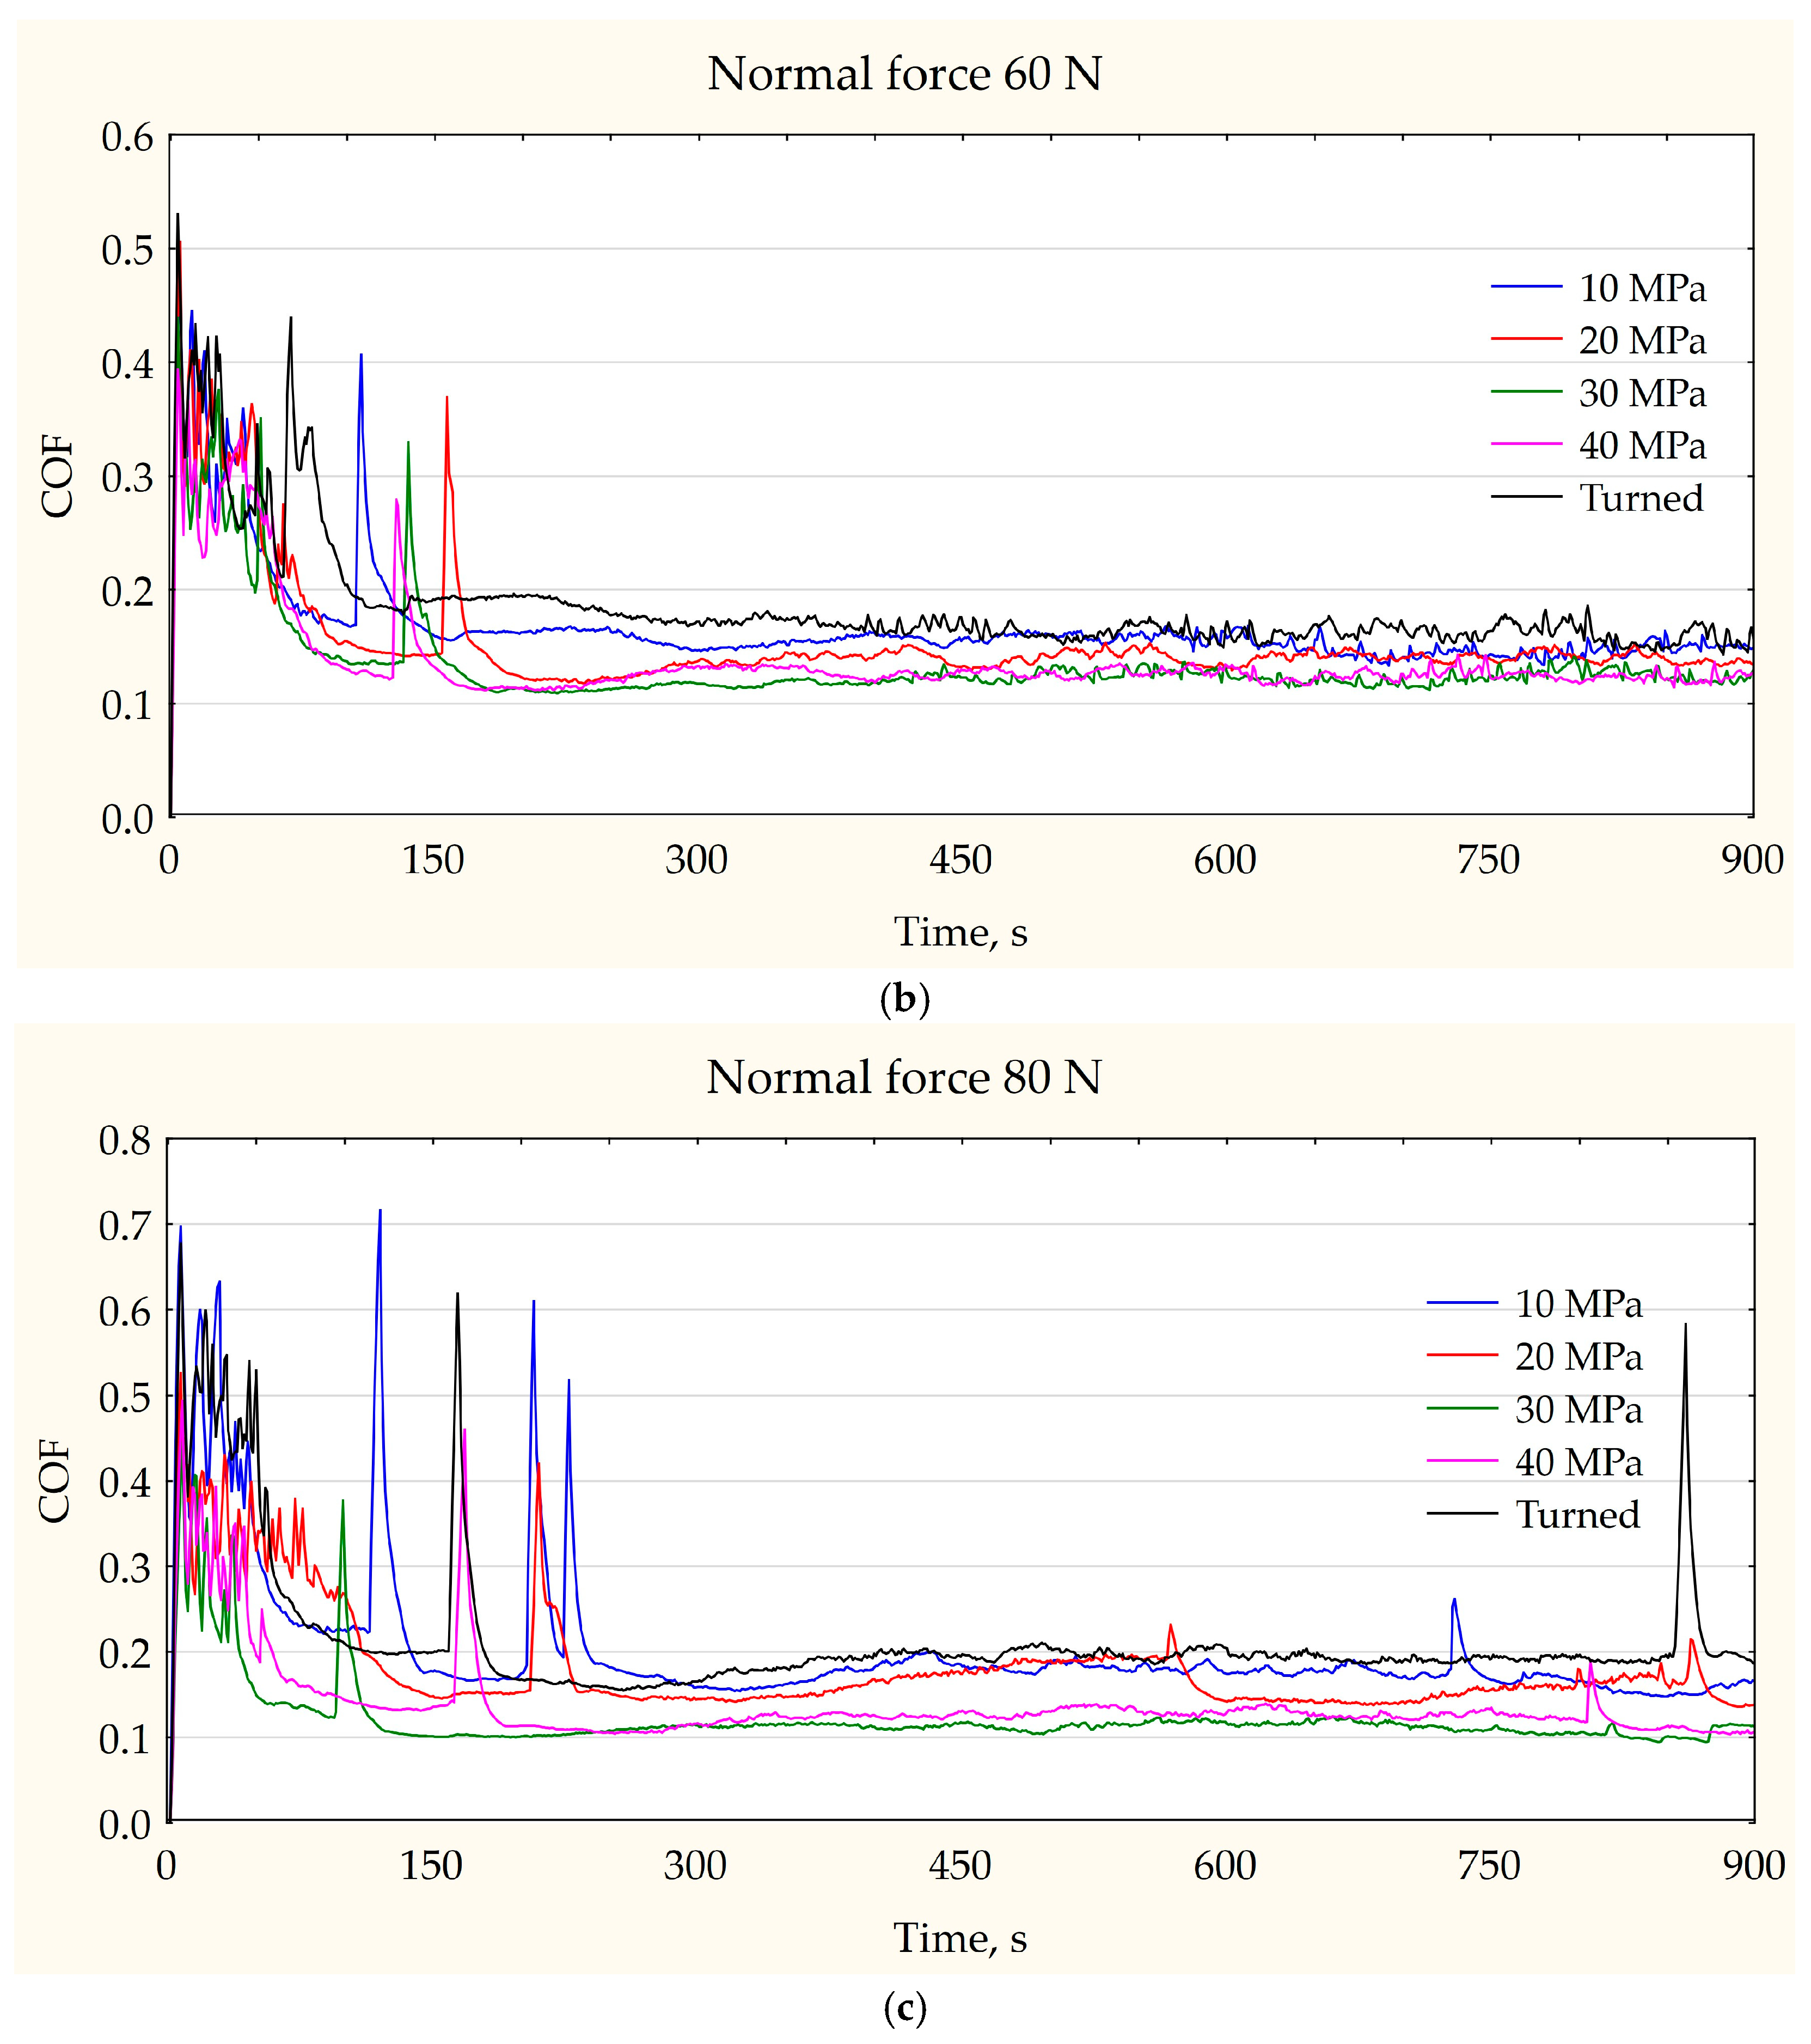
Figure 6.
Mean friction coefficient (a), after 240 s (b) and for the last 60 s (c).
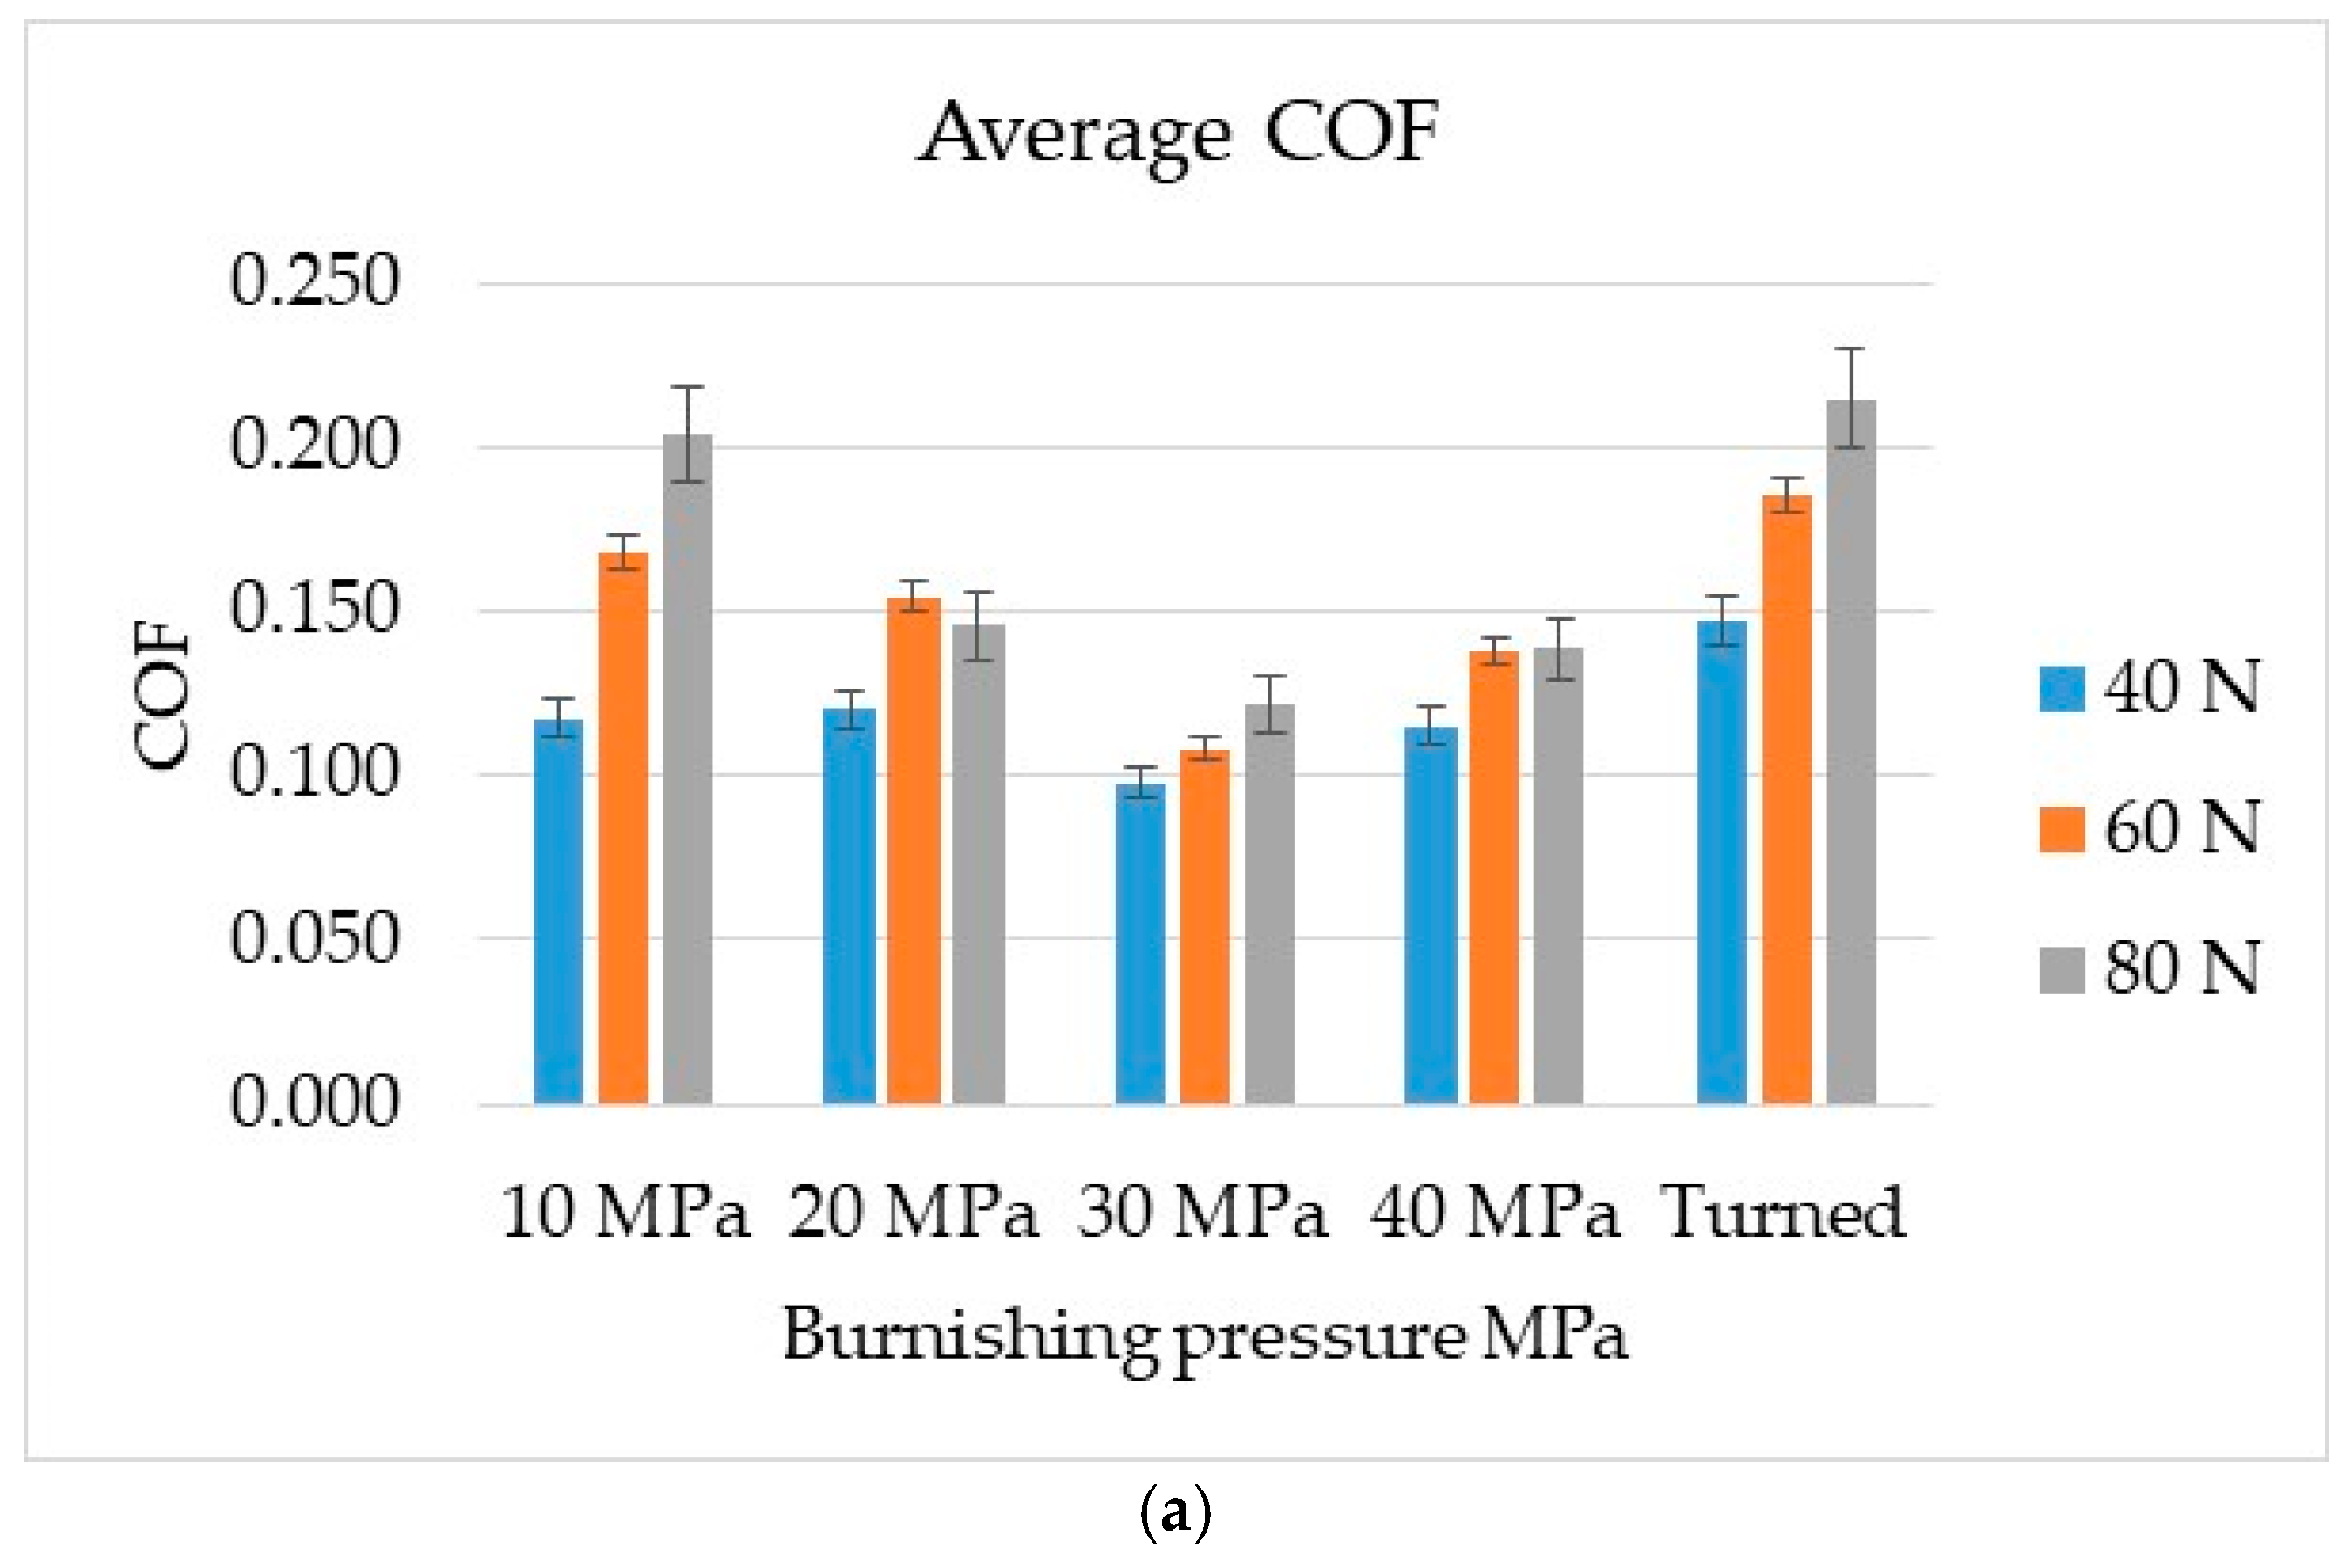
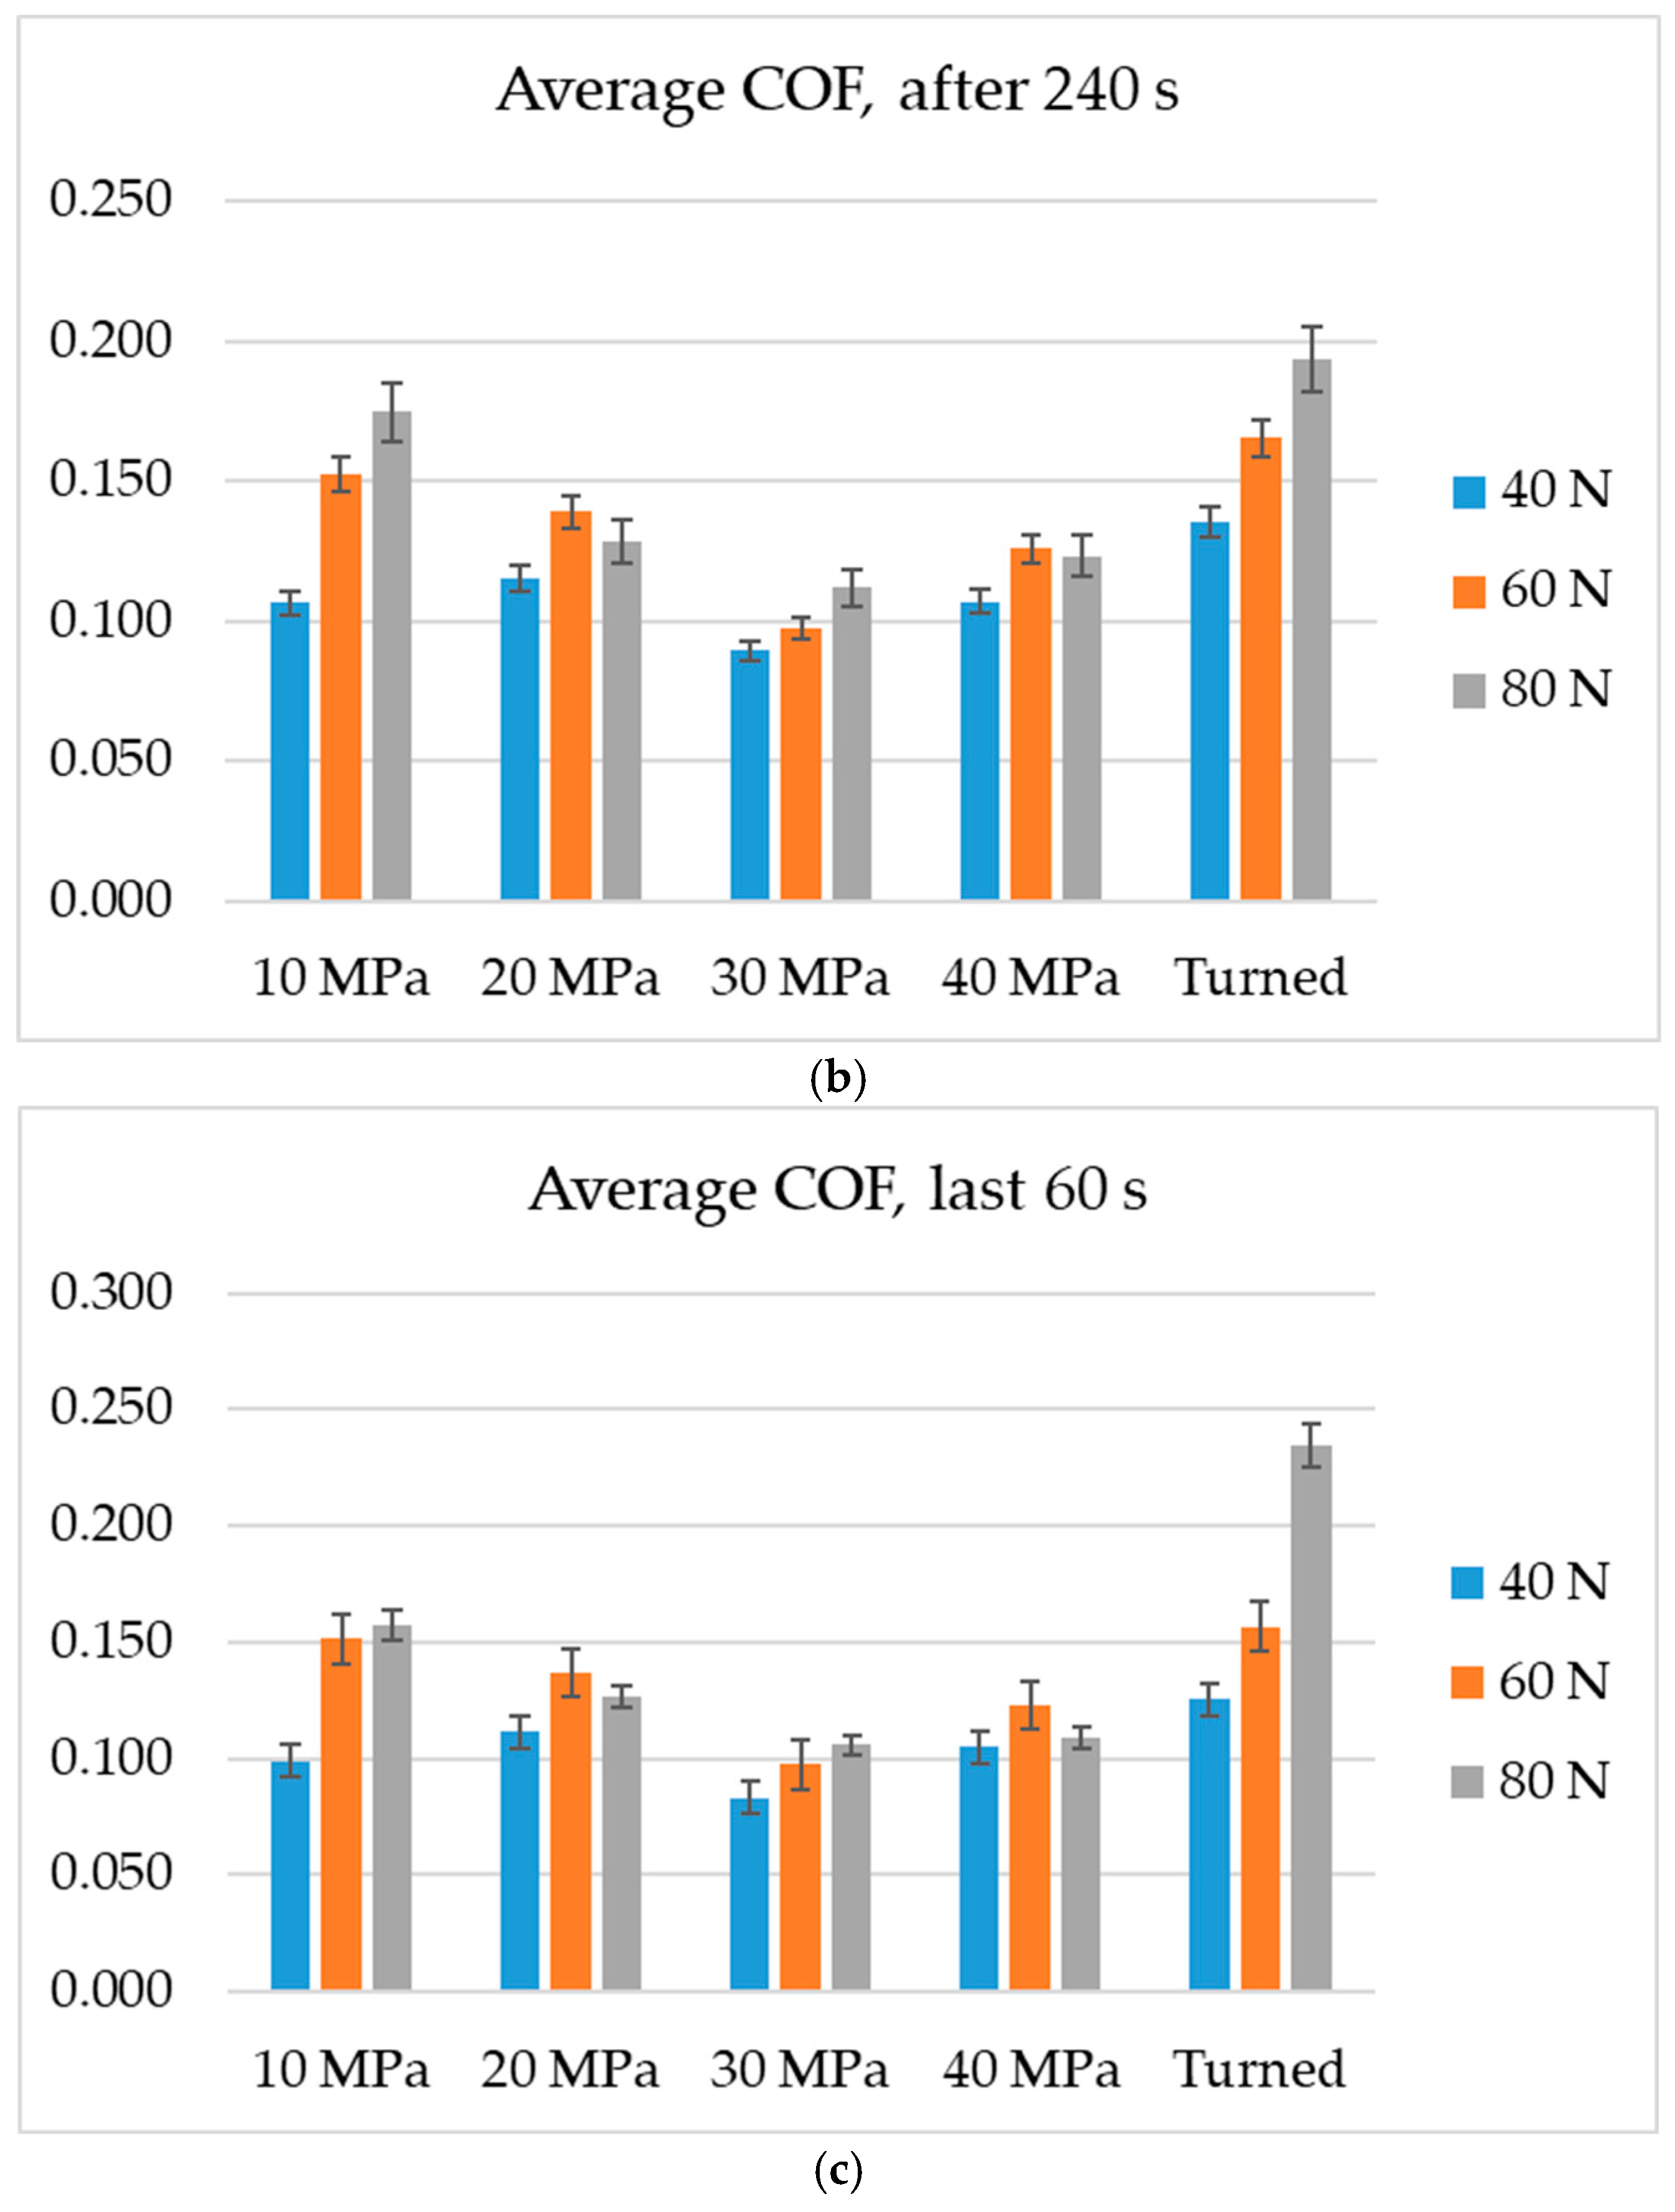
Figure 7.
Fretting loops for assemblies with discs (a) turned, (b) burnished pressure 10 MPa, (c) burnished pressure 20 MPa, (d) burnished pressure 30 MPa and (e) burnished pressure 40 MPa; the normal load was 80 N.
Figure 7.
Fretting loops for assemblies with discs (a) turned, (b) burnished pressure 10 MPa, (c) burnished pressure 20 MPa, (d) burnished pressure 30 MPa and (e) burnished pressure 40 MPa; the normal load was 80 N.
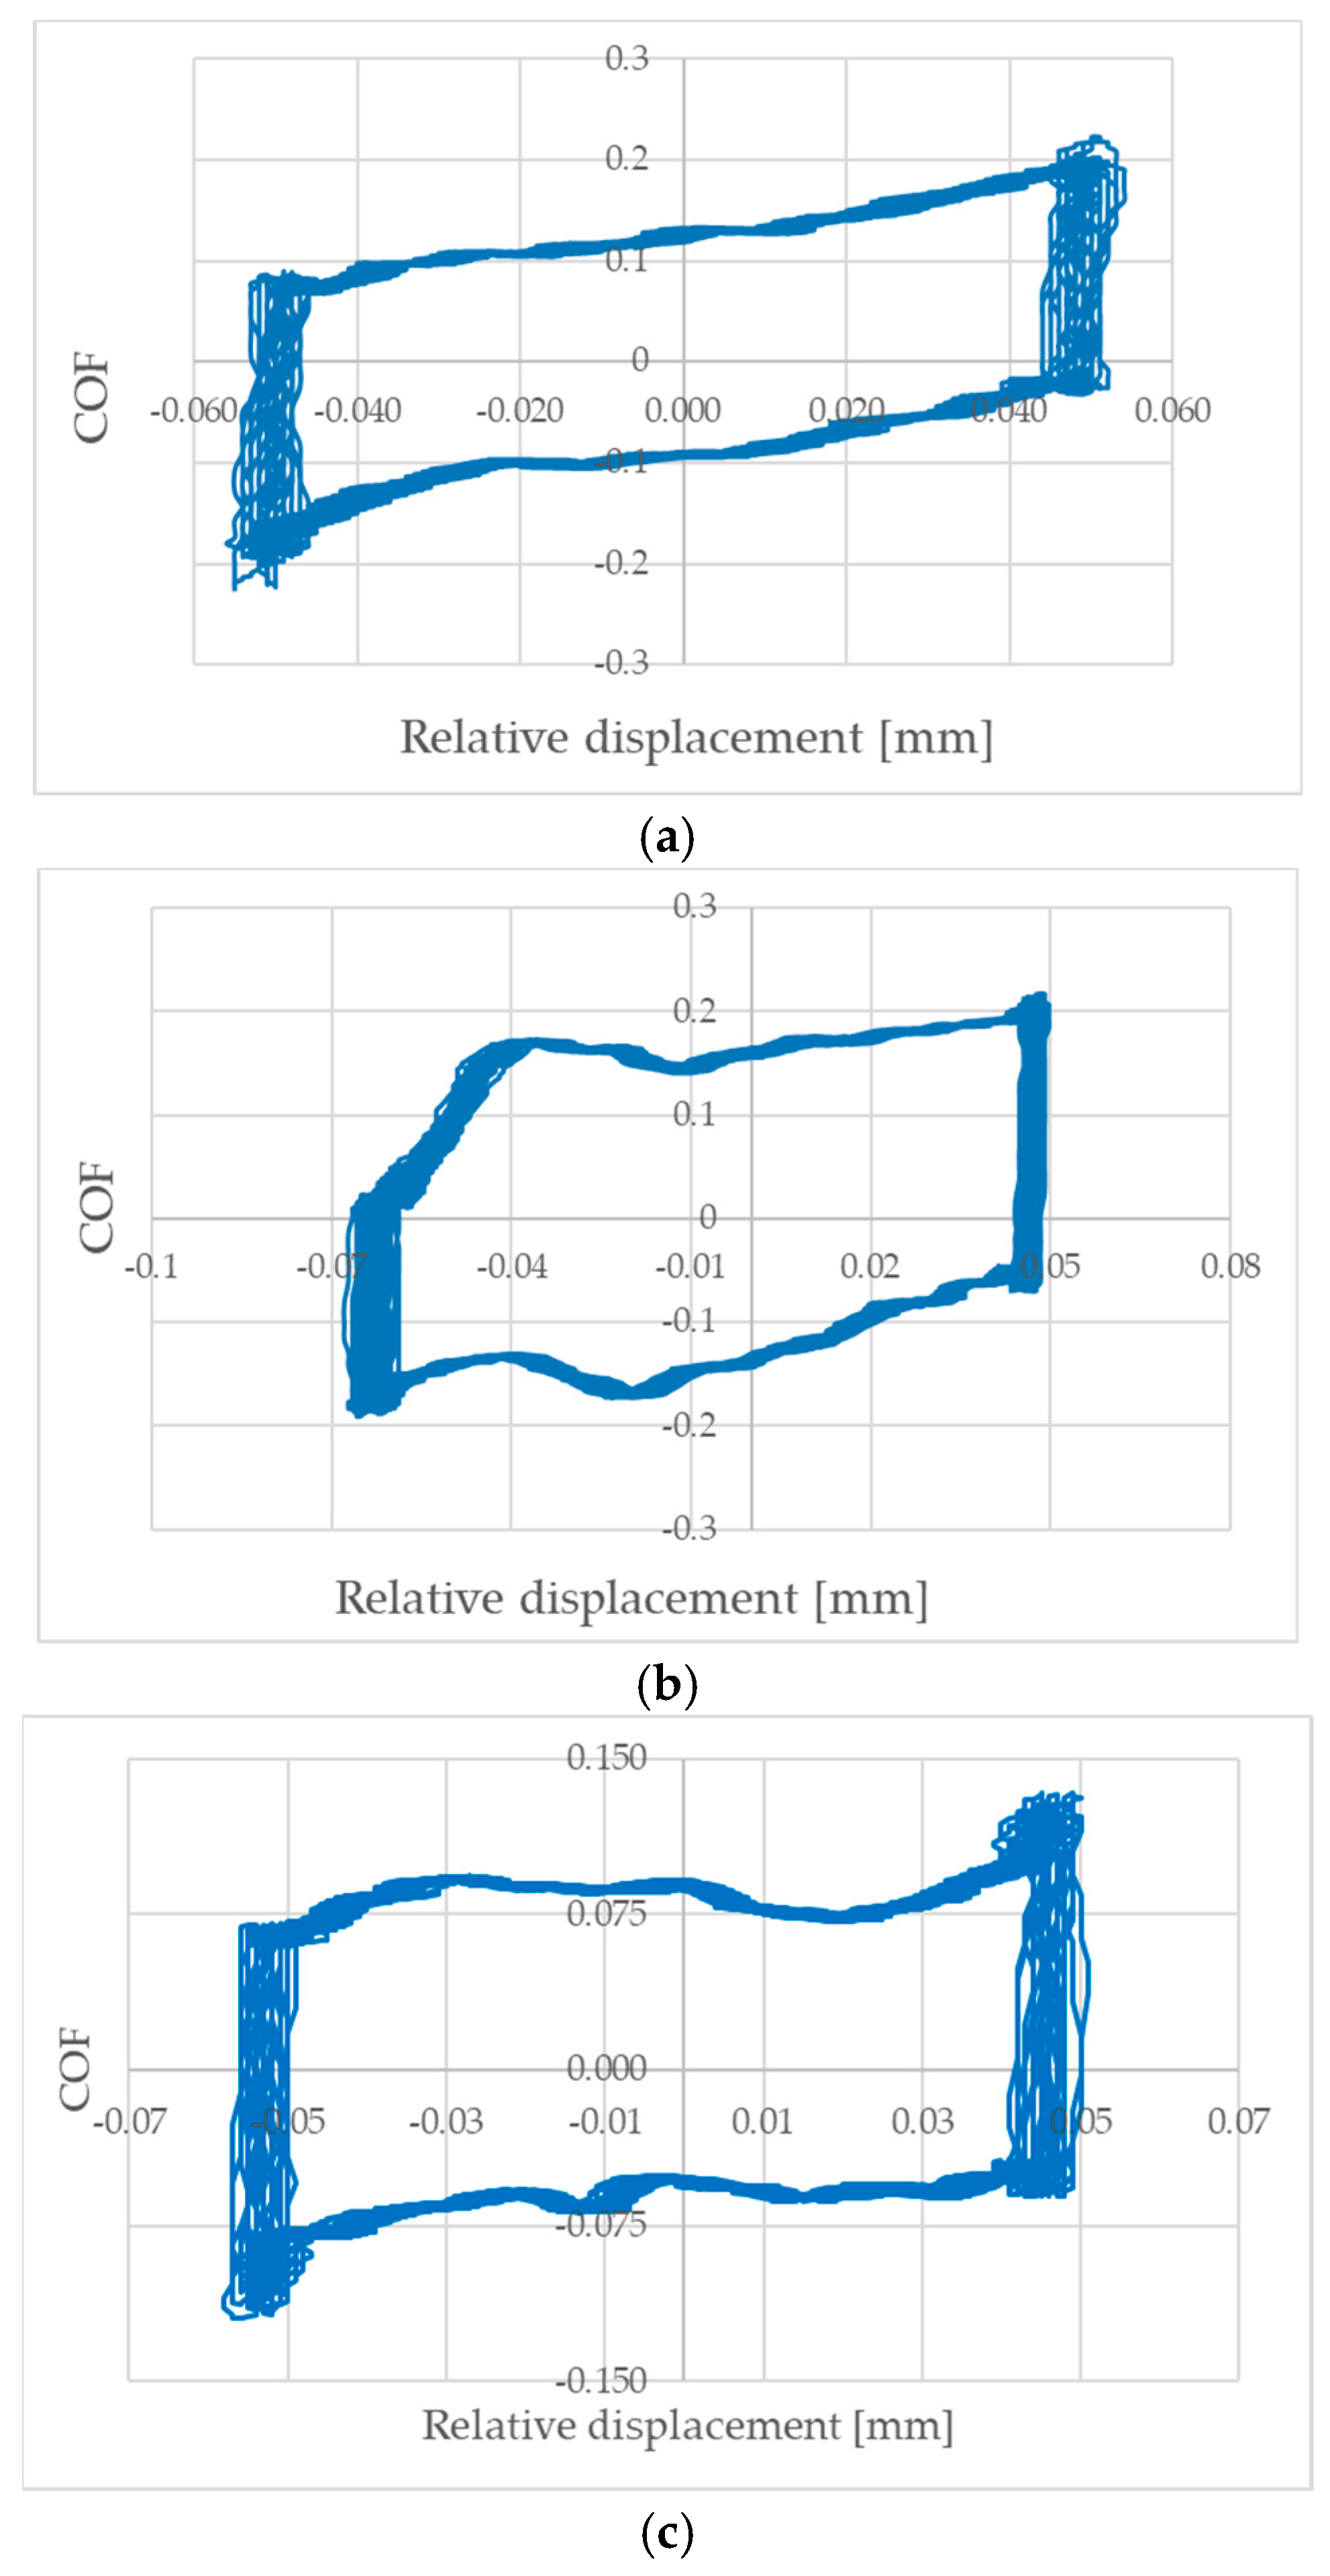
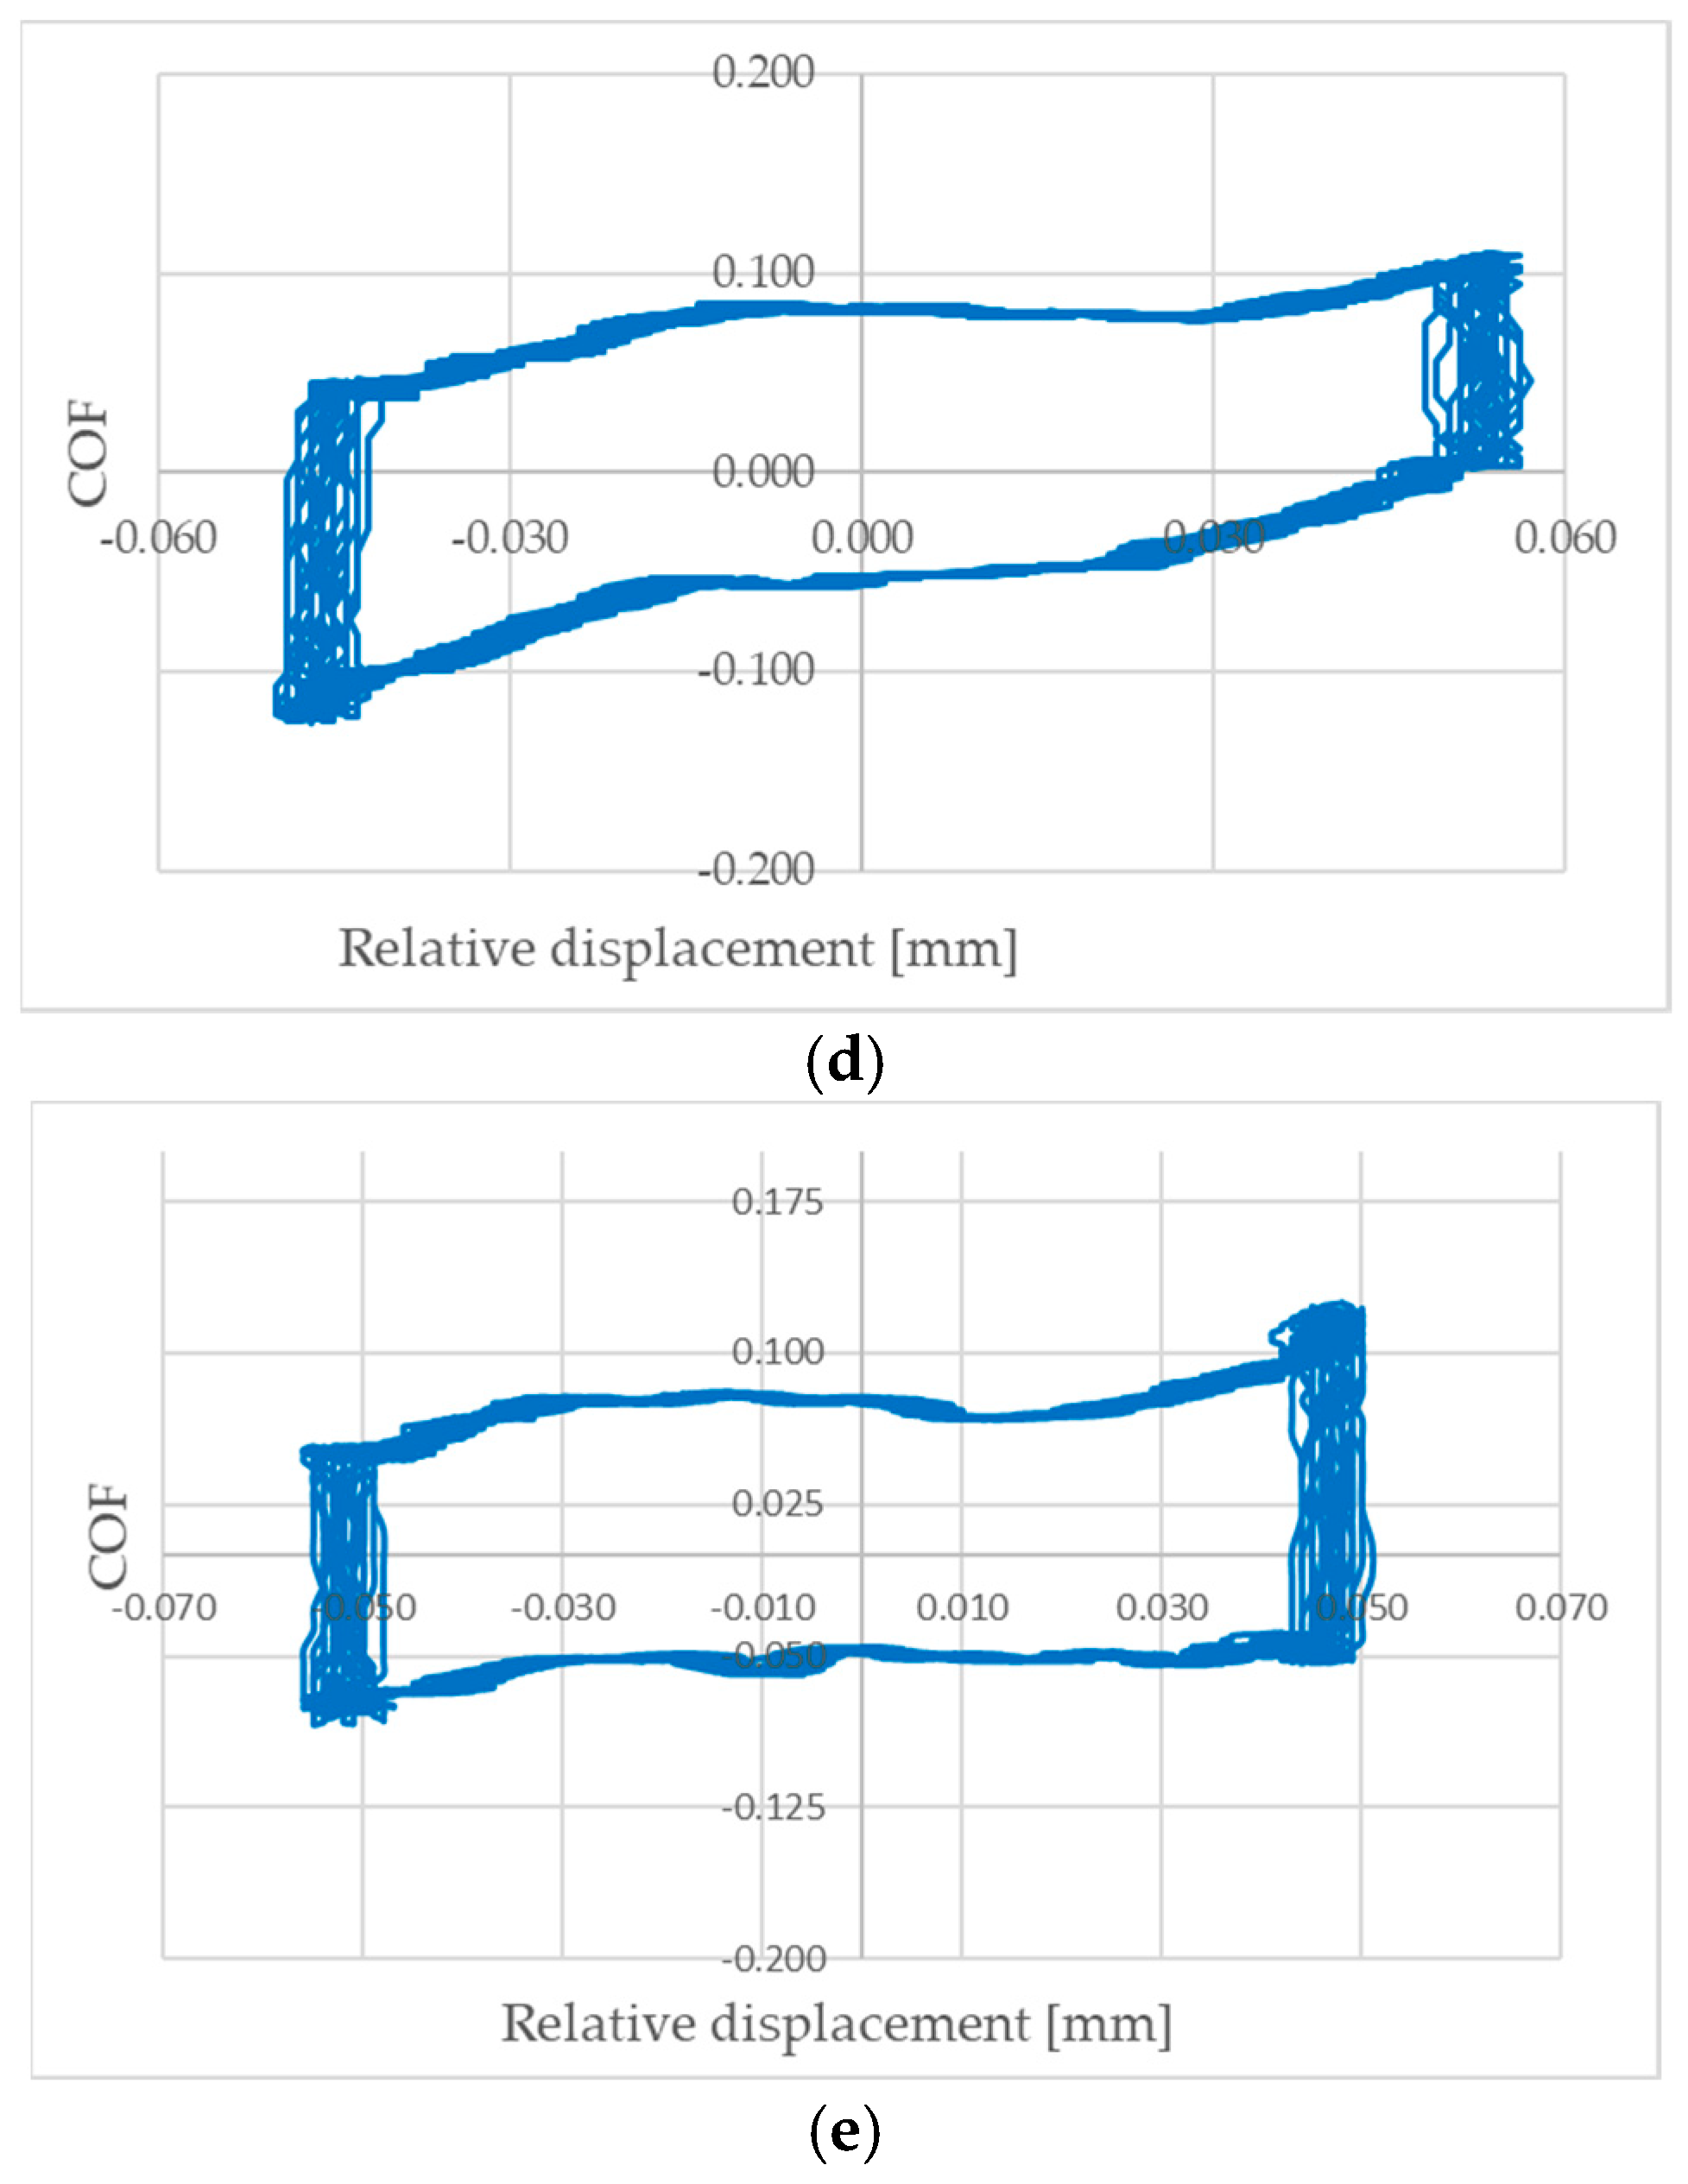
Figure 8.
Wear volumes of disc samples.
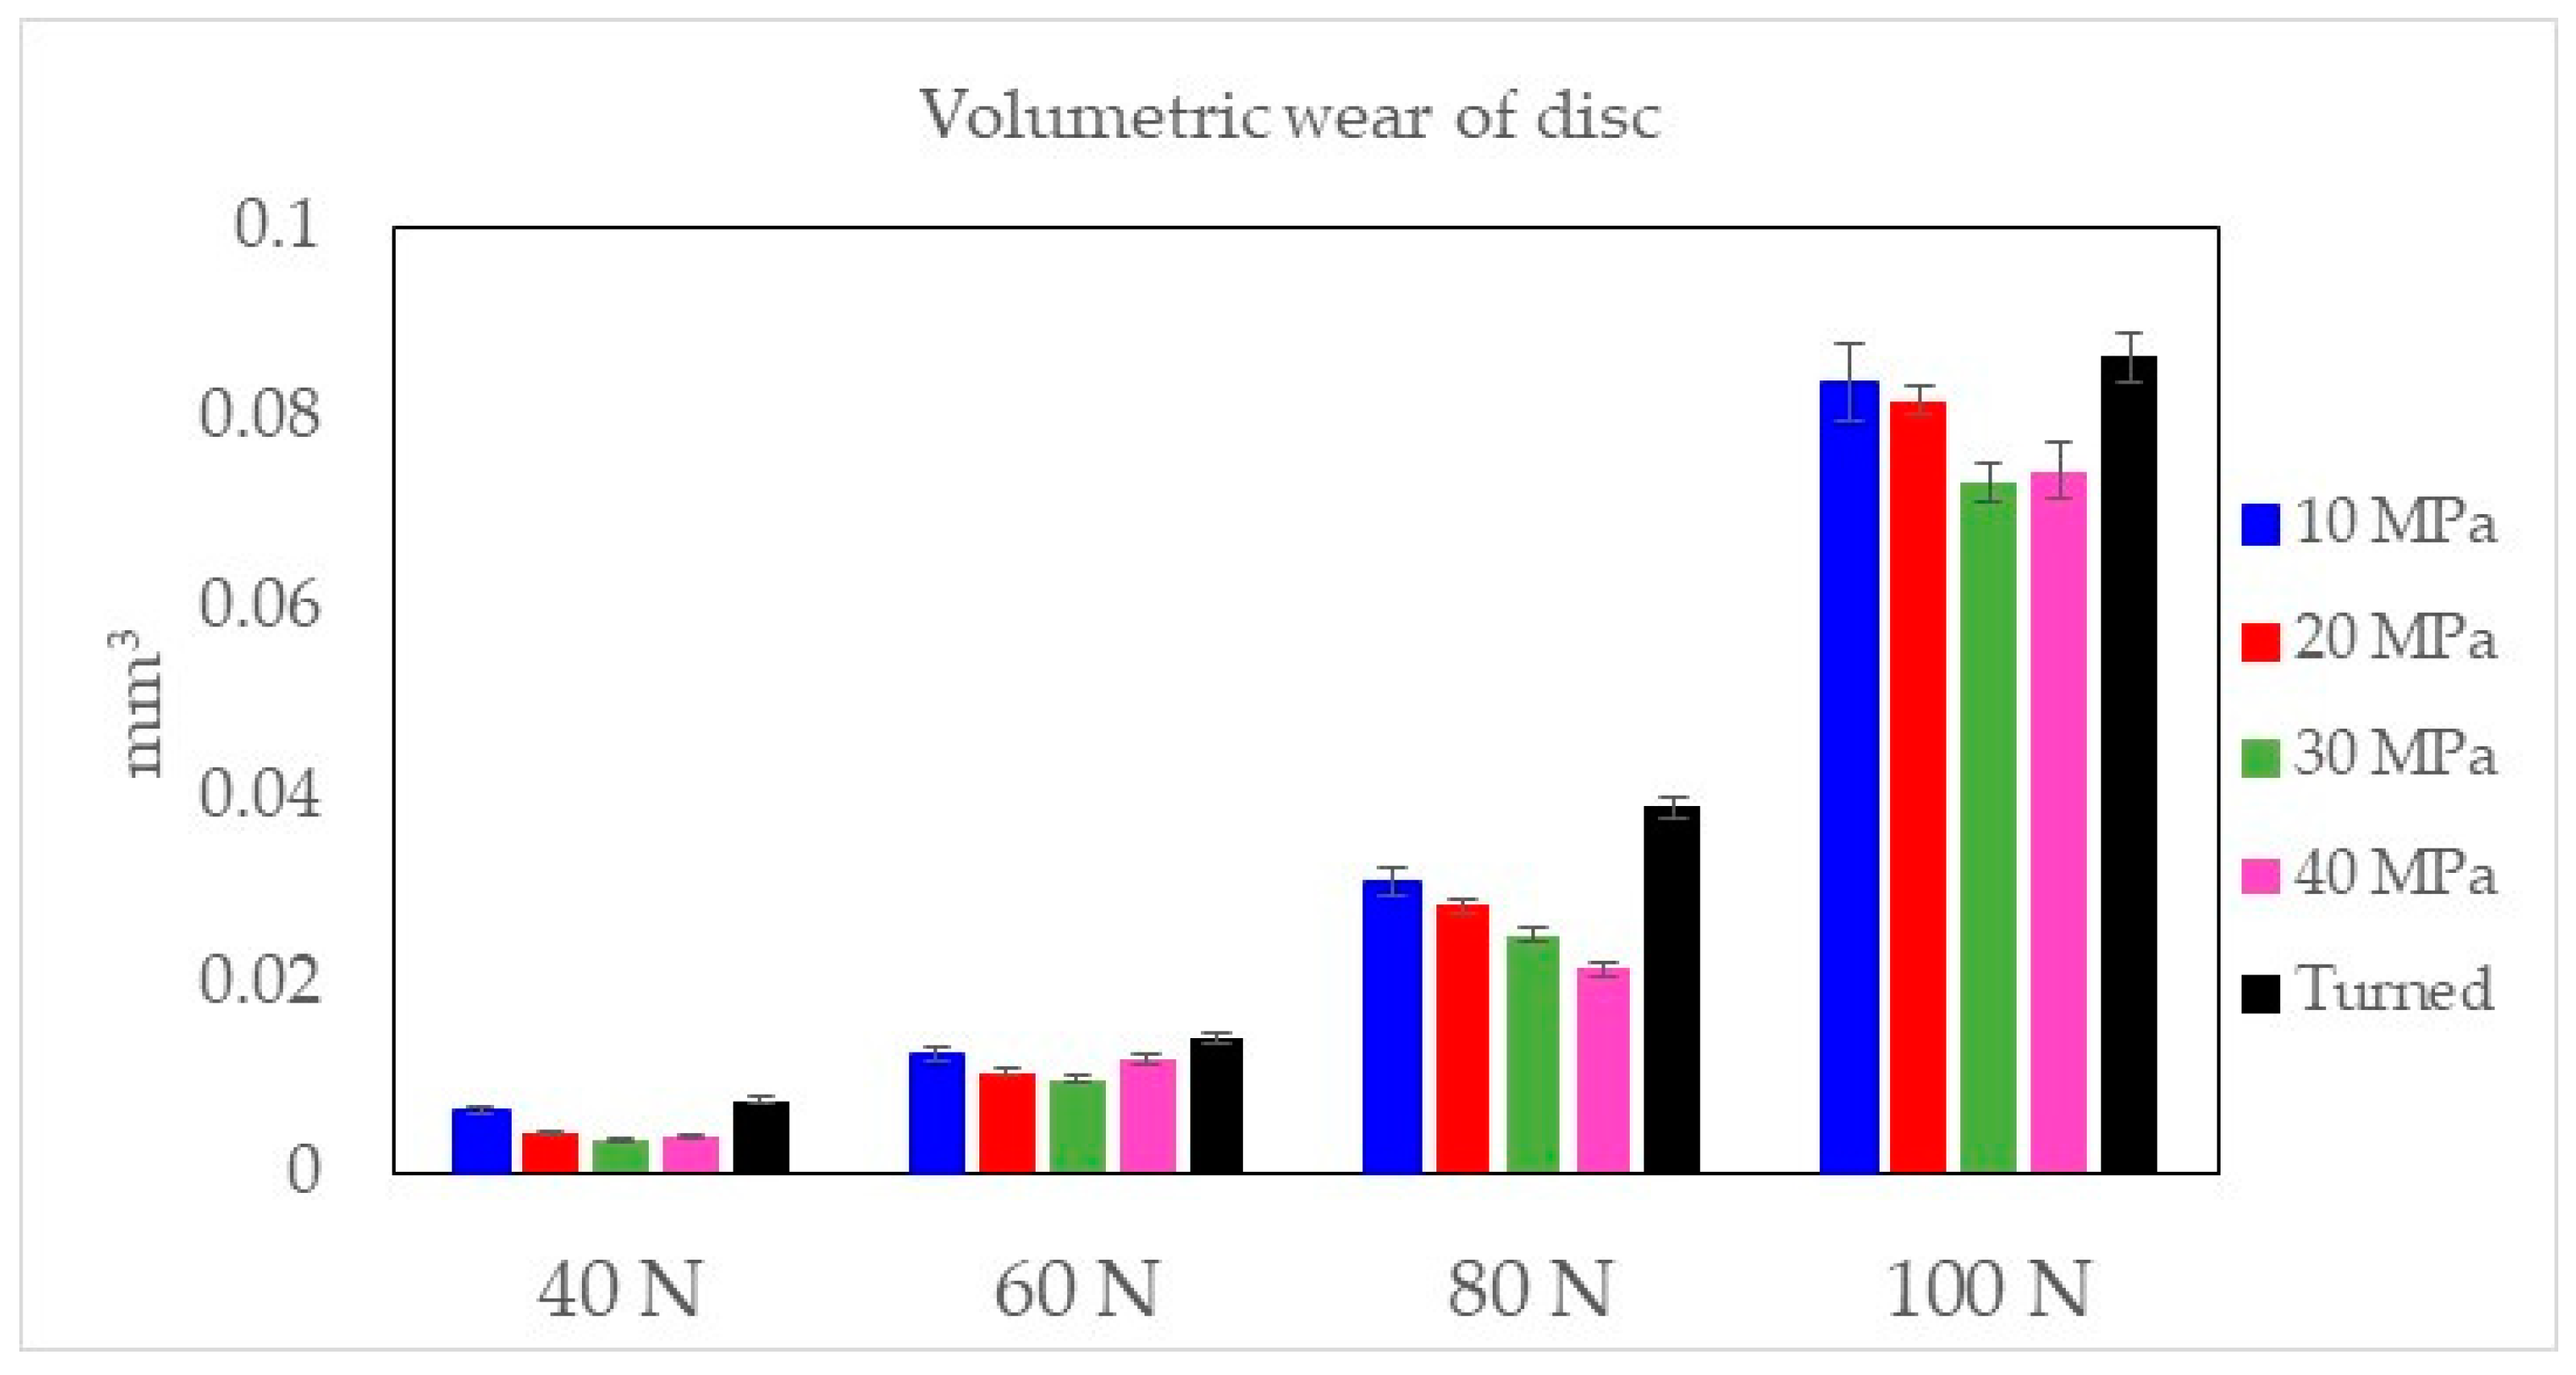
Figure 9.
Isometric views and profiles perpendicular to wear scars for the tested disc samples at a normal force of 80 N, (a) the turned specimen, and (b) discs burnished with pressures of 10 MPa, (c) 20 MPa, (d) 30 MPa and (e) 40 MPa.
Figure 9.
Isometric views and profiles perpendicular to wear scars for the tested disc samples at a normal force of 80 N, (a) the turned specimen, and (b) discs burnished with pressures of 10 MPa, (c) 20 MPa, (d) 30 MPa and (e) 40 MPa.
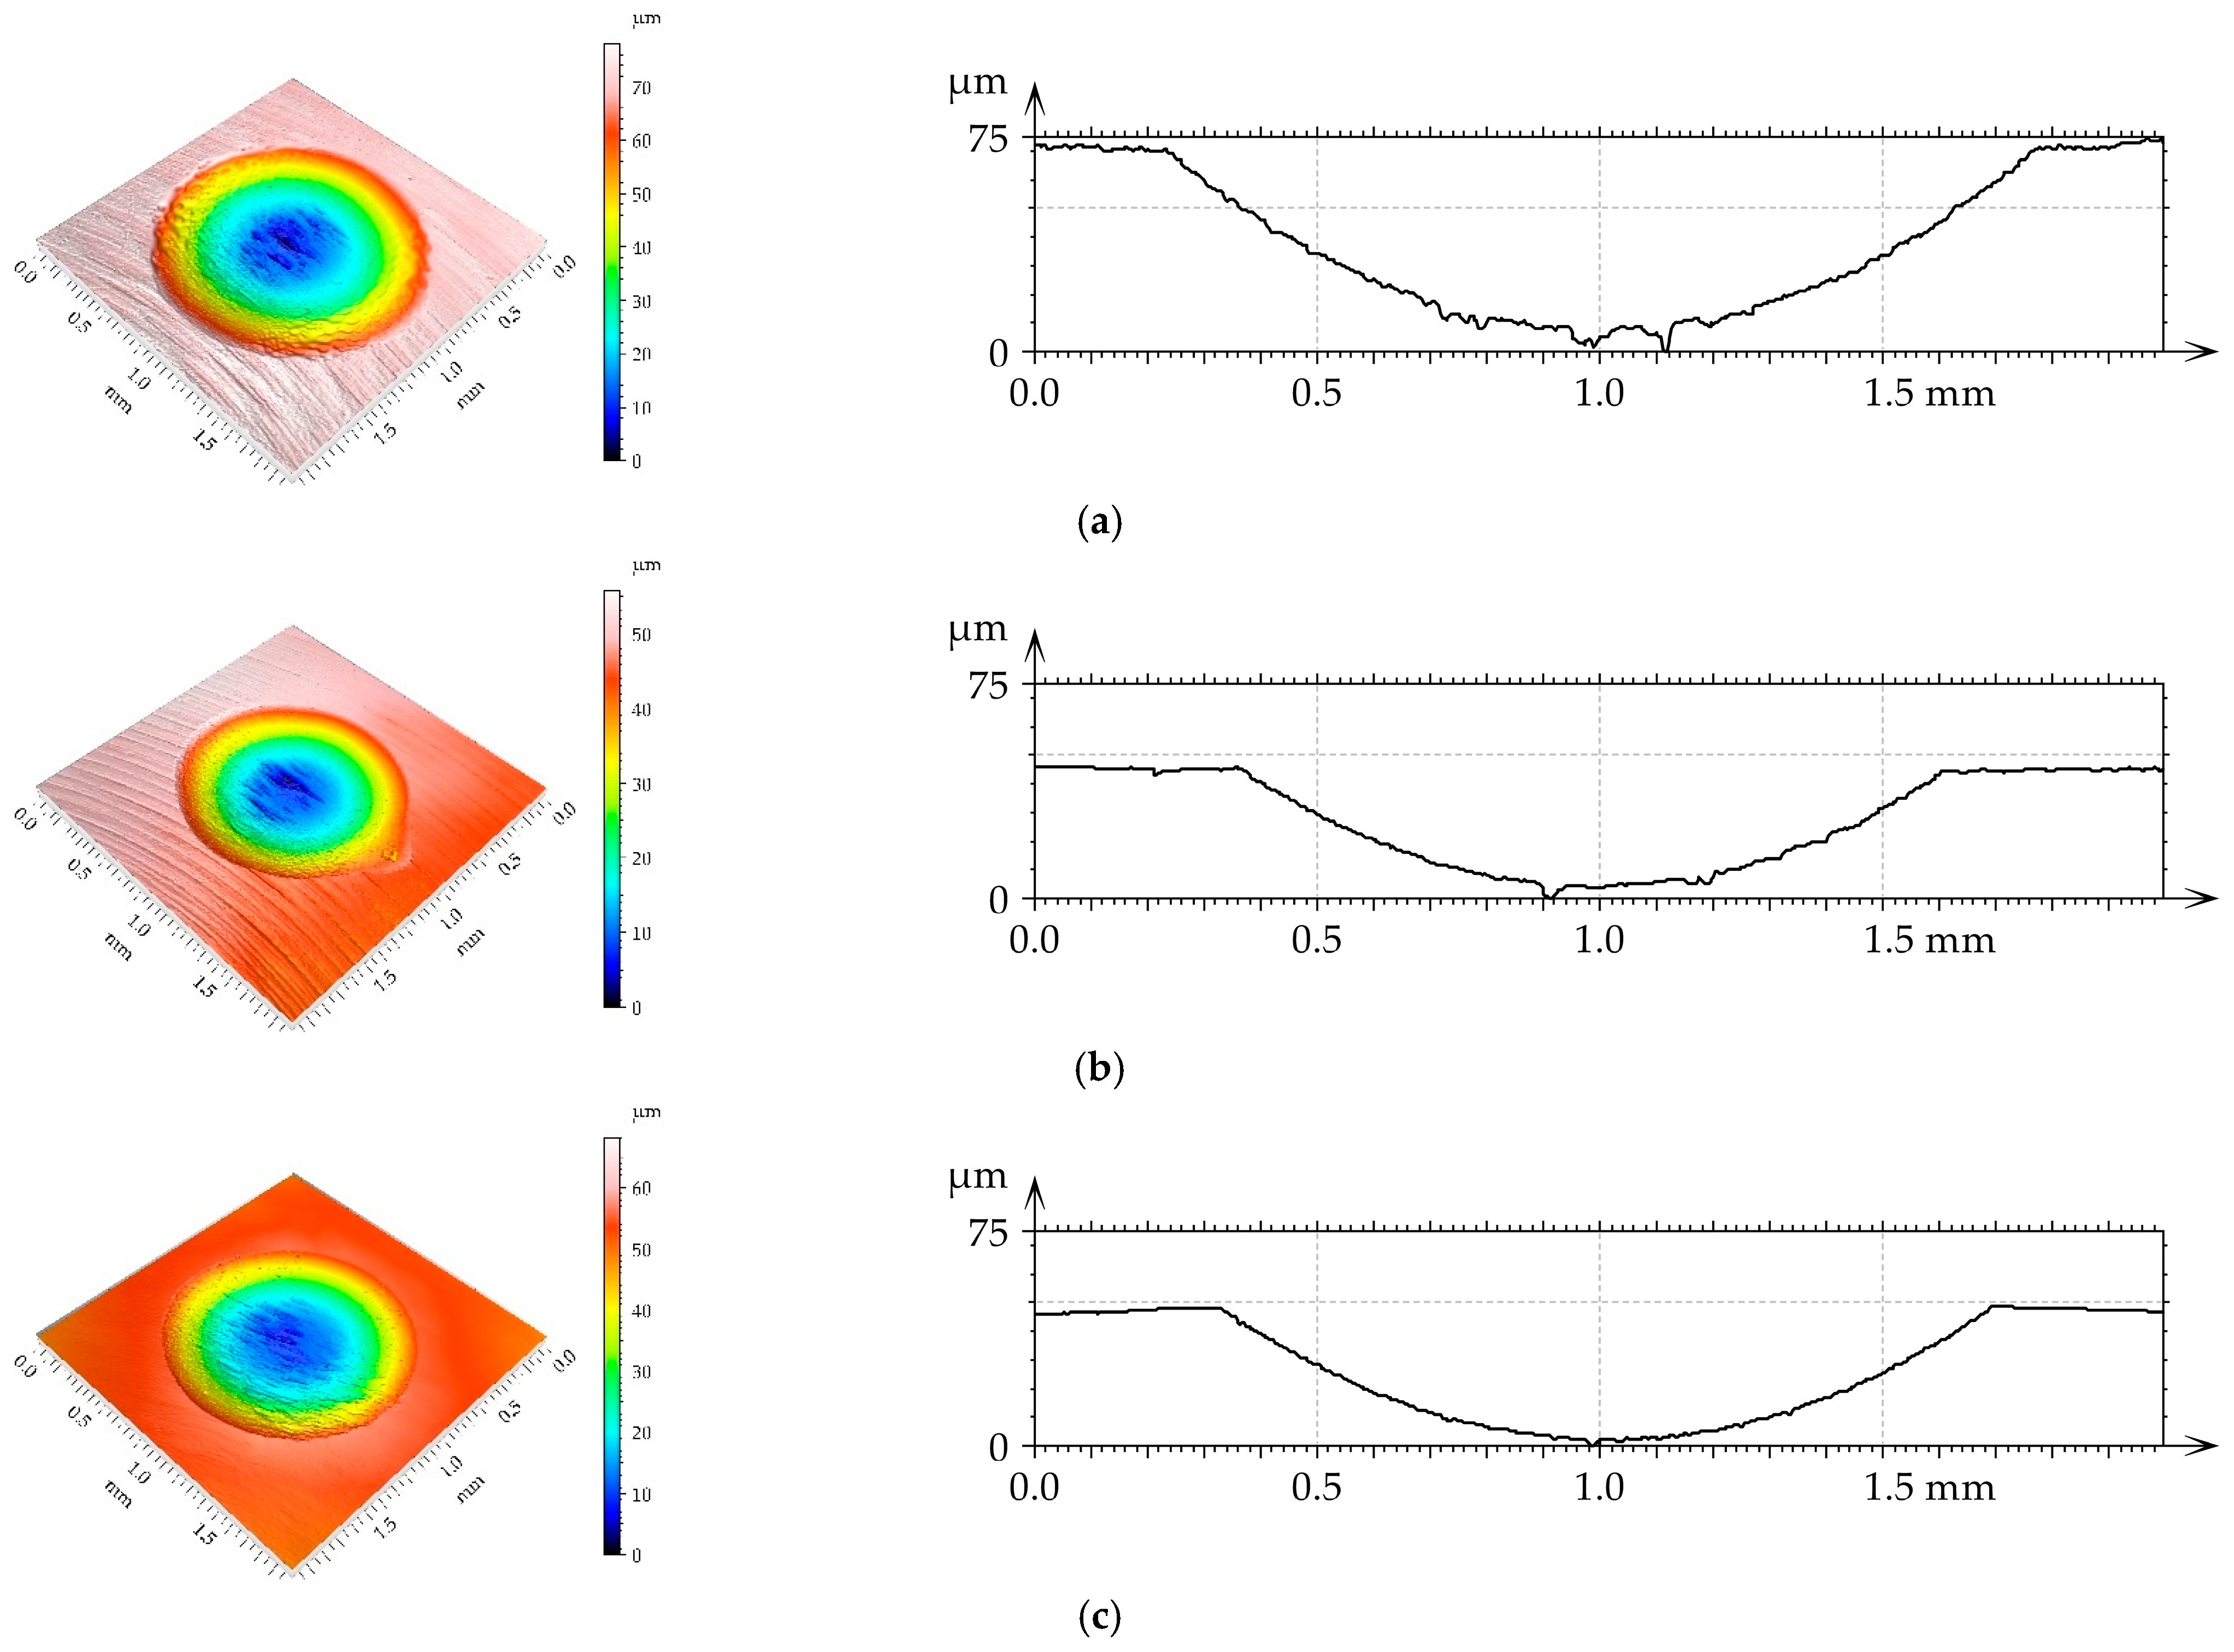

Figure 10.
SEM images of the burnished disc samples with a pressure of 10 MPa (a) and 30 MPa (b) after the tribological test at the normal load of 80 N.
Figure 10.
SEM images of the burnished disc samples with a pressure of 10 MPa (a) and 30 MPa (b) after the tribological test at the normal load of 80 N.

Table 1.
Fretting test parameters.
| Parameter | Value |
|---|---|
| Frequency | 50 Hz |
| Humidity | 40–50% |
| Stroke | 0.1 mm |
| Normal load | 40, 60, 80 N |
| Number of cycles | 45,000 |
| Lubricant | L-AN-46 oil (0.07 mL) |
Table 2.
Burnishing parameters.
| Parameter | Value |
|---|---|
| Burnishing strategy | Spiral |
| Speed | 400 mm/min |
| Ball | 4 mm |
| Pressure | 10, 20, 30, 40 MPa |
Table 3.
Surface texture parameters of machined discs.
| Parameters | Turned | 10 MPa | 20 MPa | 30 MPa | 40 MPa | |
|---|---|---|---|---|---|---|
| Height Parameters | ||||||
| Sq | µm | 1.08 | 1.01 | 0.189 | 0.178 | 0.431 |
| Ssk | −0.007 | −0.345 | 0.037 | 0.221 | −0.060 | |
| Sku | 2.79 | 2.99 | 3.24 | 3.6 | 3.63 | |
| Sp | µm | 4.2 | 3.23 | 0.947 | 1.05 | 2.78 |
| Sv | µm | 4.59 | 4.92 | 1.43 | 0.789 | 1.94 |
| Sz | µm | 8.79 | 8.15 | 2.37 | 1.84 | 4.72 |
| Sa | µm | 0.869 | 0.82 | 0.15 | 0.139 | 0.331 |
| Spatial parameters | ||||||
| Sal | mm | 0.0534 | 0.264 | 0.109 | 0.152 | 0.157 |
| Str | 0.137 | 0.133 | 0.504 | 0.502 | 0.478 | |
| Hybrid parameters | ||||||
| Sdq | 0.123 | 0.0629 | 0.0123 | 0.00354 | 0.0276 | |
| Sdr | % | 0.74 | 0.197 | 0.00756 | 0.000626 | 0.0379 |
| Feature parameters | ||||||
| Spd | 1/mm2 | 336 | 30.9 | 48.7 | 4.34 | 84.2 |
| Spc | 1/mm | 74.3 | 60.1 | 8.36 | 0.493 | 30.1 |
| Functional parameters | ||||||
| Sk | µm | 2.46 | 1.14 | 0.43 | 0.337 | 0.787 |
| Spk | µm | 0.901 | 0.298 | 0.151 | 0.138 | 0.315 |
| Svk | µm | 0.934 | 0.953 | 0.162 | 0.0993 | 0.367 |
Disclaimer/Publisher’s Note: The statements, opinions and data contained in all publications are solely those of the individual author(s) and contributor(s) and not of MDPI and/or the editor(s). MDPI and/or the editor(s) disclaim responsibility for any injury to people or property resulting from any ideas, methods, instructions or products referred to in the content. |
© 2023 by the author. Licensee MDPI, Basel, Switzerland. This article is an open access article distributed under the terms and conditions of the Creative Commons Attribution (CC BY) license (https://creativecommons.org/licenses/by/4.0/).
Share and Cite
MDPI and ACS Style
Swirad, S. Influence of Ball Burnishing on Lubricated Fretting of the Titanium Alloy Ti6Al4V. Lubricants 2023, 11, 341. https://doi.org/10.3390/lubricants11080341
AMA Style
Swirad S. Influence of Ball Burnishing on Lubricated Fretting of the Titanium Alloy Ti6Al4V. Lubricants. 2023; 11(8):341. https://doi.org/10.3390/lubricants11080341
Chicago/Turabian StyleSwirad, Slawomir. 2023. "Influence of Ball Burnishing on Lubricated Fretting of the Titanium Alloy Ti6Al4V" Lubricants 11, no. 8: 341. https://doi.org/10.3390/lubricants11080341
Note that from the first issue of 2016, this journal uses article numbers instead of page numbers. See further details here.