


Abstract
Advanced Virgo+ is a major upgrade of the Advanced Virgo gravitational-wave detector aiming to increase sensitivity in terms of binary neutron star (BNS) range by a factor 3–5 in the next few years. In this work, we present an optimization of the mirror transmittances for the second phase of the project (to be implemented for the O5 observation run) using a random walk algorithm implemented with the advGWINC software. In addition to BNS range, a post merger (PM) SNR is also used as a figure of merit to identify configurations that fine-tune the sensitivity curve, as a function of arm-cavity round trip losses.
1. Introduction
In the last five years since the first detection of a binary black hole merger [1], the Advanced Virgo (AdV) and Advanced LIGO detector network has expanded its contribution to gravitational-wave astronomy. After a series of detector upgrades, the network entered its third observation run (O3), beginning in April 2019 and ending in March 2020. A total of 39 new sources have been discovered in the first part of the run (from April 2019 to October 2019) and included in the second catalog of gravitational-wave transient sources (GWTC-2) [2], with exceptional events independently published [3,4,5,6,7]. The analysis is ongoing for the second part of the run.
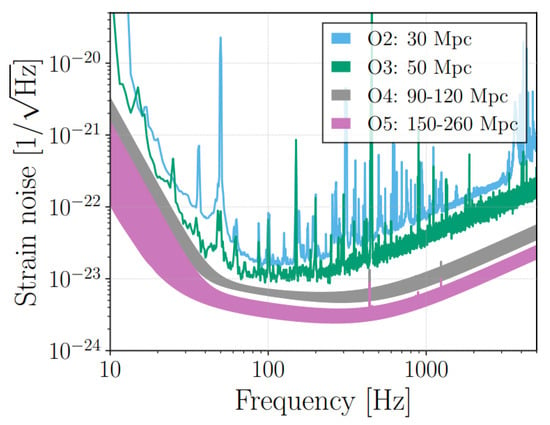
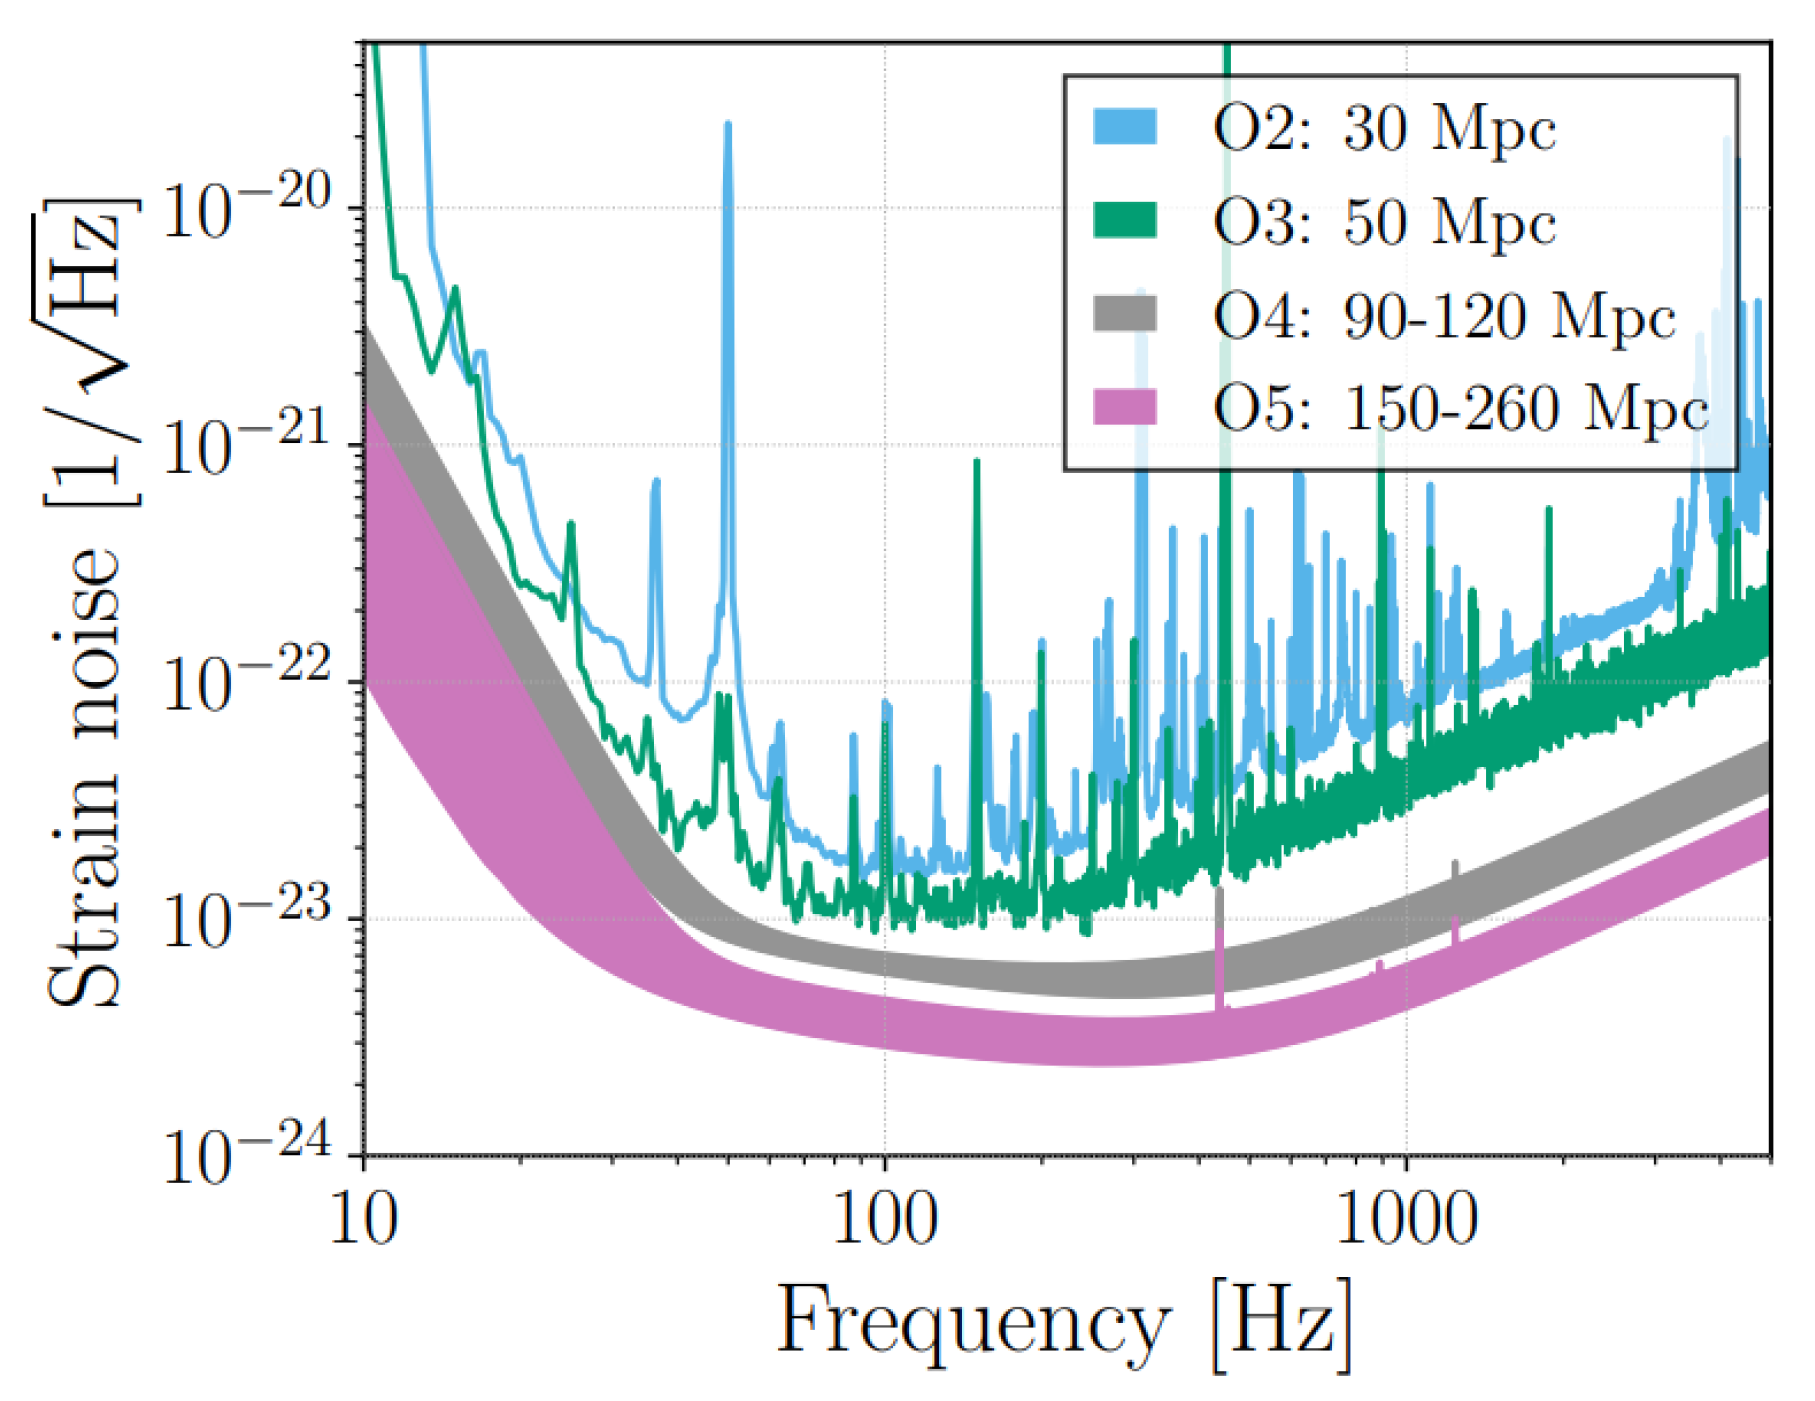
The AdV gravitational wave detector [8], an upgraded version of the Virgo detector [9] situated in Cascina Italy, is a power-recycled, Michelson interferometer (ITF) with Fabry–Perot cavities in each km arm. Following the end of O3, AdV will undergo another set of upgrades in two phases (phase I and phase II), before the fourth and fifth observation runs (O4 and O5). These enhancements will take the ITF from AdV to Advanced Virgo+ (AdV+). Each upgrade phase will produce a global reduction in the detector noise as shown in Figure 1 (taken from Figure 1 in [10]), where the O2 and current O3 measured sensitivity (blue and green) will be lowered into the two projected sensitivities (gray for O4 and purple for O5).
Figure 1.
Advanced Virgo and Advanced Virgo+ sensitivities from O2 to O5 observation runs, taken from Figure 1 in [10]. The O2 and O3 sensitivity is shown while O4 and O5 give possible ranges depending on outcomes of current studies.
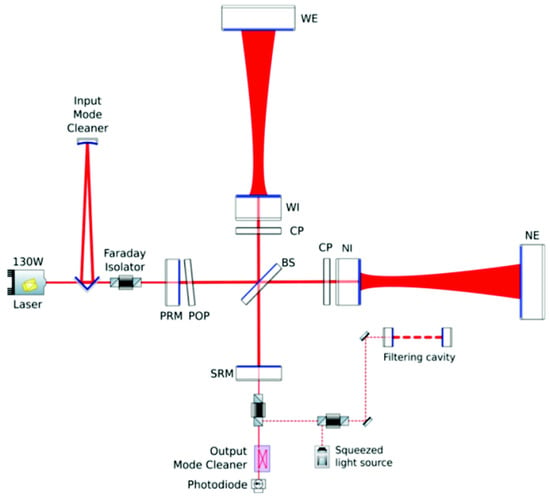
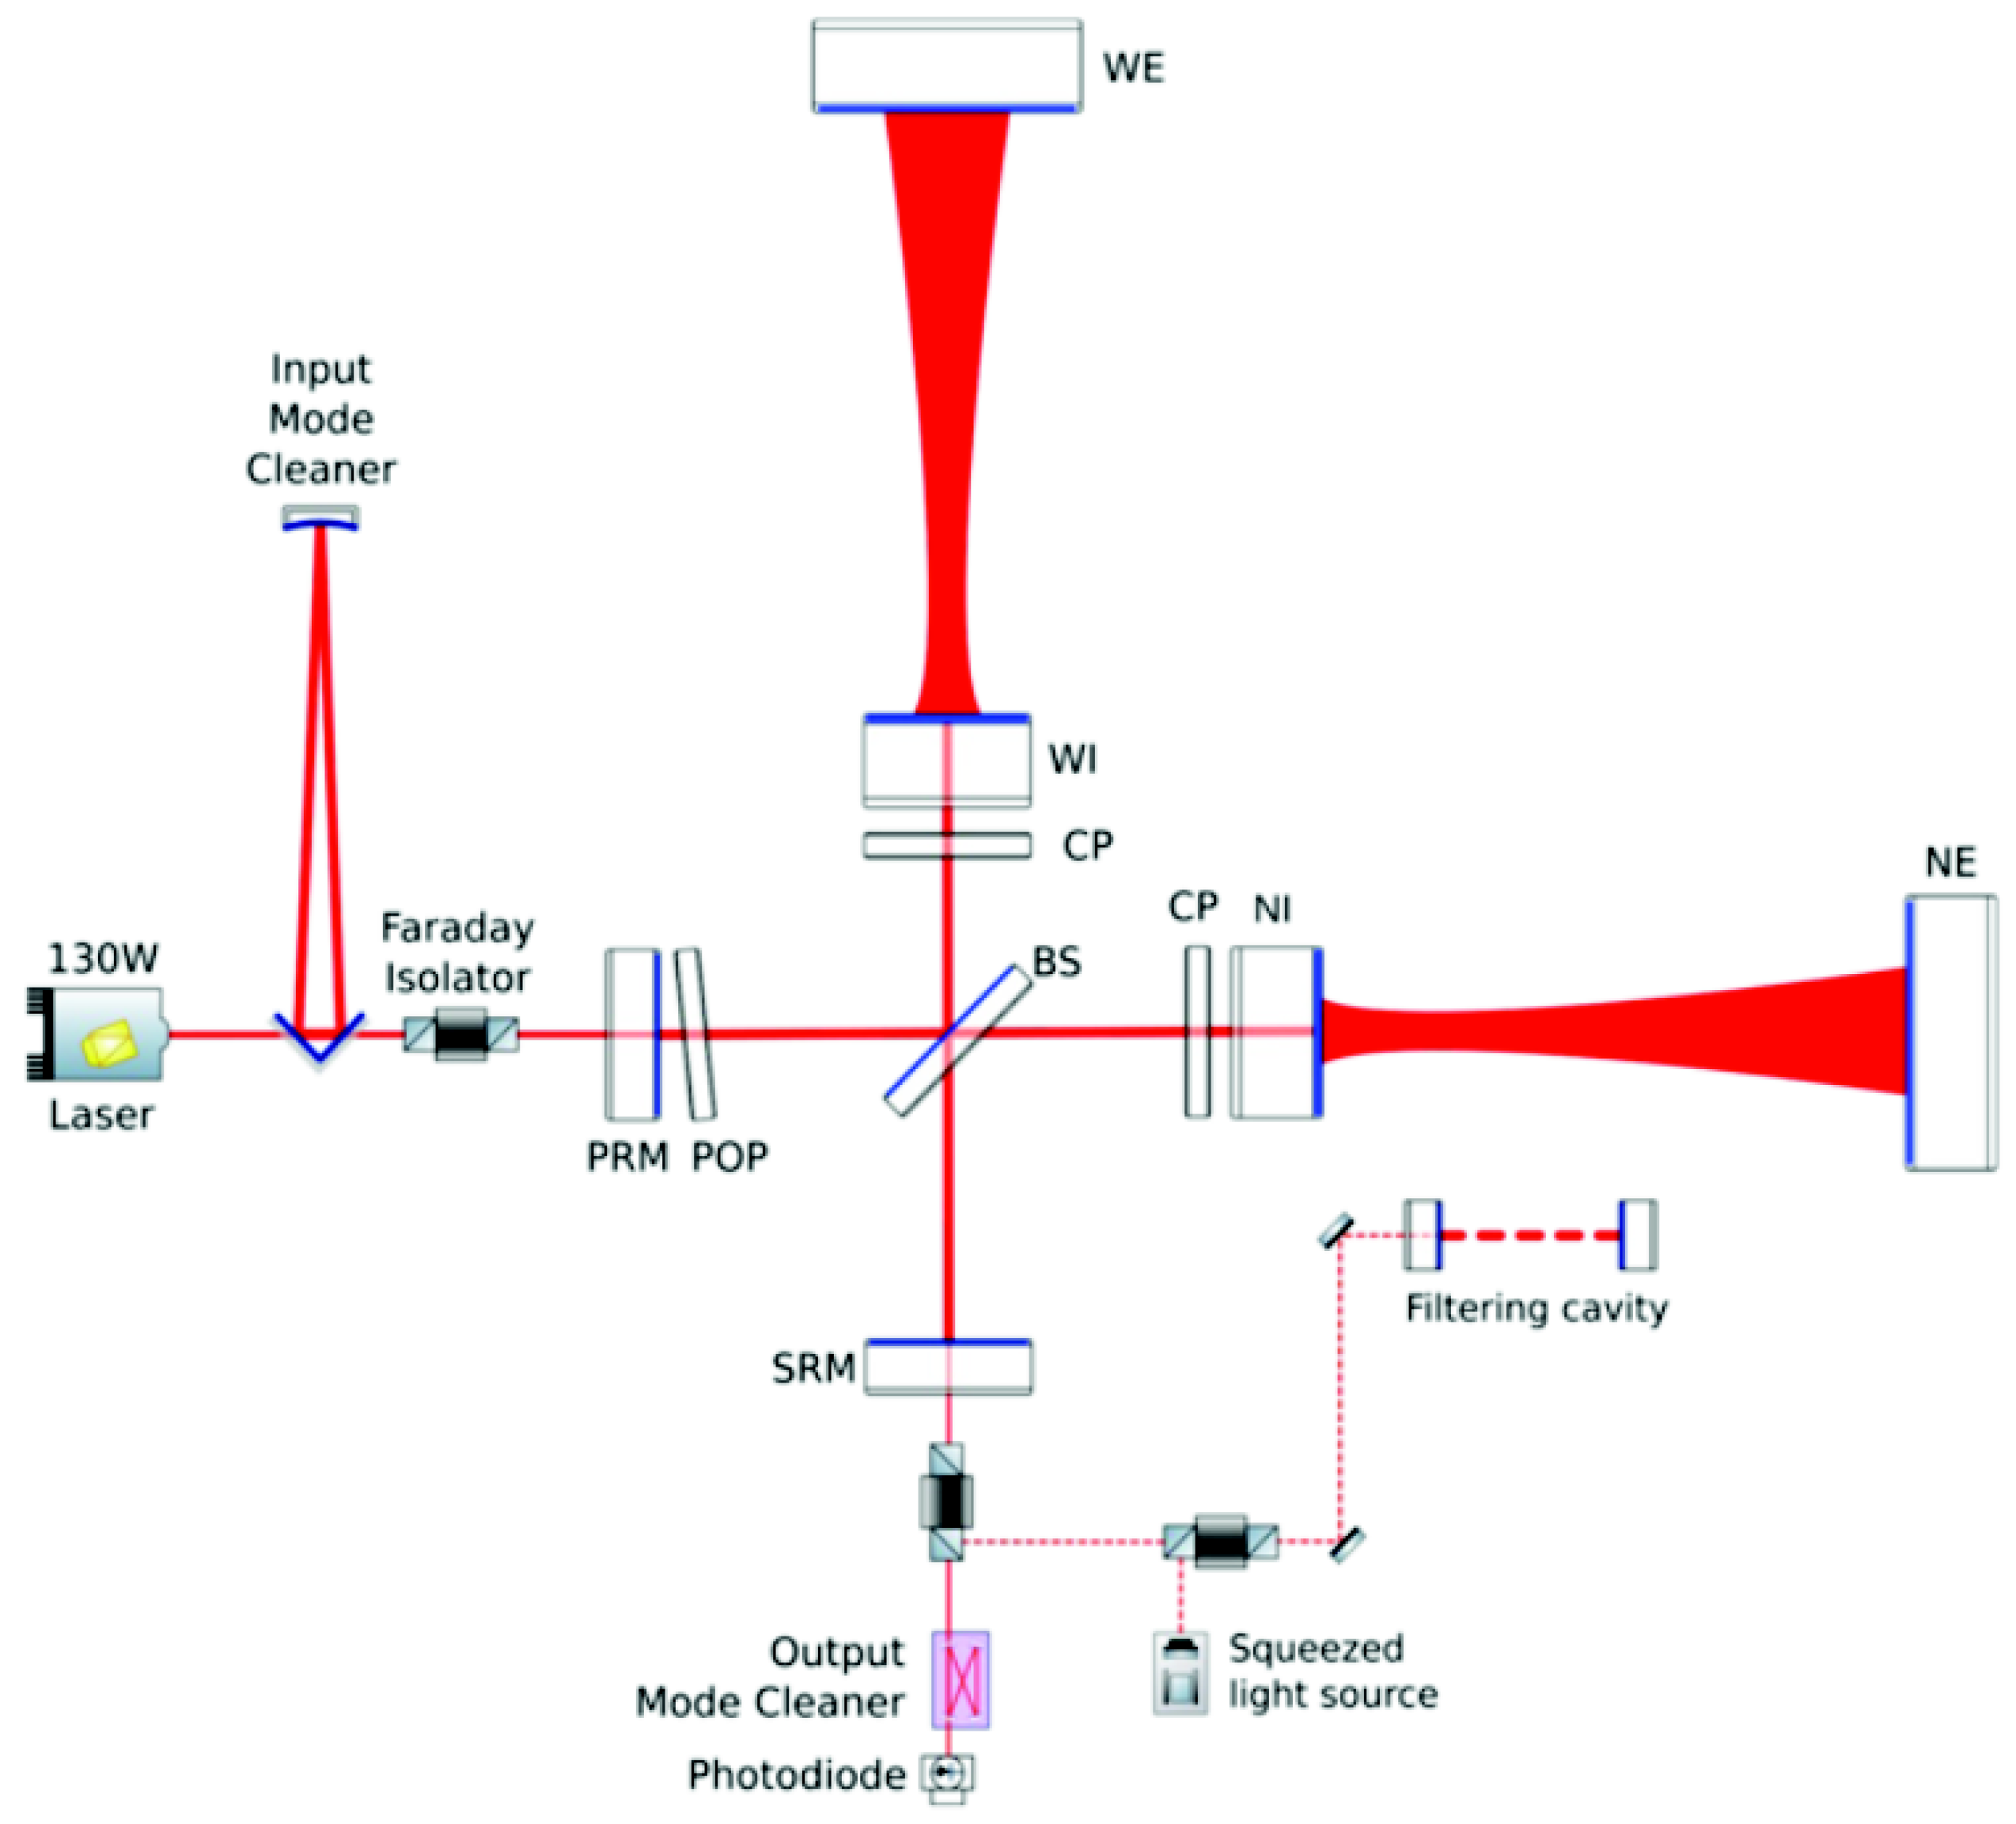
Phase I upgrades mainly aim to reduce quantum noise (QN) by implementing a signal recycling technique, frequency dependent squeezing, and a higher laser power. Phase II upgrades will see an additional reduction in QN by a further increase in input laser power, but will mainly focus on a reduction of coating Brownian thermal noise. This will be done by improving the mechanical properties of test mass coatings and increasing the laser beam spot size on cavity end mirrors, consequently requiring end mirrors to be replaced with mirrors of larger radius. In order to achieve a larger beam spot size on the end mirrors, all curved mirrors in the ITF will be replaced with mirrors polished to different radii of curvature (RoCs). The resulting optical layout for O5 is shown in Figure 2.
Figure 2.
AdV+ target optical layout, including the PR mirror (PRM), SR mirror (SRM), beam splitter (BS), and two Fabry–Perot resonant cavities (WI-WE and NI-NE mirrors).
In light of the necessary mirror replacements in Phase II, the goal of this study was to study an optimization of the input mirror (IM), power recycling mirror (PRM), and signal recycling mirror (SRM) transmittances (, , and , respectively) that fine-tunes the ITF response to astrophysical signals [11].
Currently, mirror transmittances for Phase II (O5) are nominally set to Phase I (O4) values: at , at , and at . was chosen so that the arm-cavity finesse will equal the O3 measured finesse of 450. was chosen to limit the power recycling gain, thereby reducing wavefront distortions in the power recycling cavity (PRC) and easing requirements on the thermal compensation system accuracy. With these prior selections, was then set by the choice of input laser power following a study into detector sensitivity [12,13] as a function of the correlation between these parameters.
Starting from the “nominal” configuration for O5, in this study we explore a larger parameter space: we let all three mirror transmittances vary as we do not assume a strongly over-coupled ITF or a finesse and power recycling gain matching O4. We also explore results for a large range of arm-cavity round trip losses (from 55 ppm to 105 ppm). Moreover, a post-merger (PM) signal (see Section 2 for definition) is used in addition to the usual binary neutron star (BNS) range as a figure of merit for the optimization. Finally, the approach presented in previous work is formalized here using a search algorithm with a specifically developed waveform generator for post-merger signals (in addition to the pre-existing BNS inspiral-merger-ringdown approximant).
The optimization method is explained in Section 2, results are outlined in Section 3.1 and Section 3.2, and a comparison drawn between the two sensitivity parameters in Section 3.3. Section 4 then provides some concluding remarks and details future steps.
2. Method
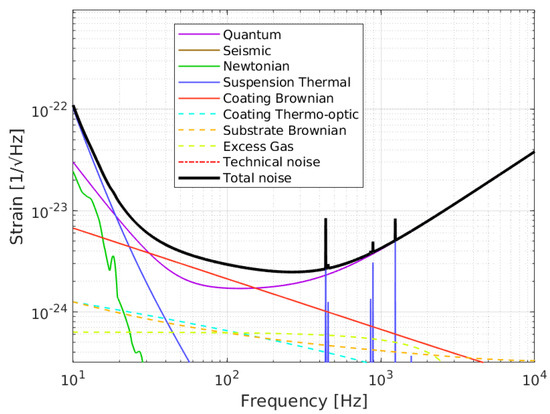
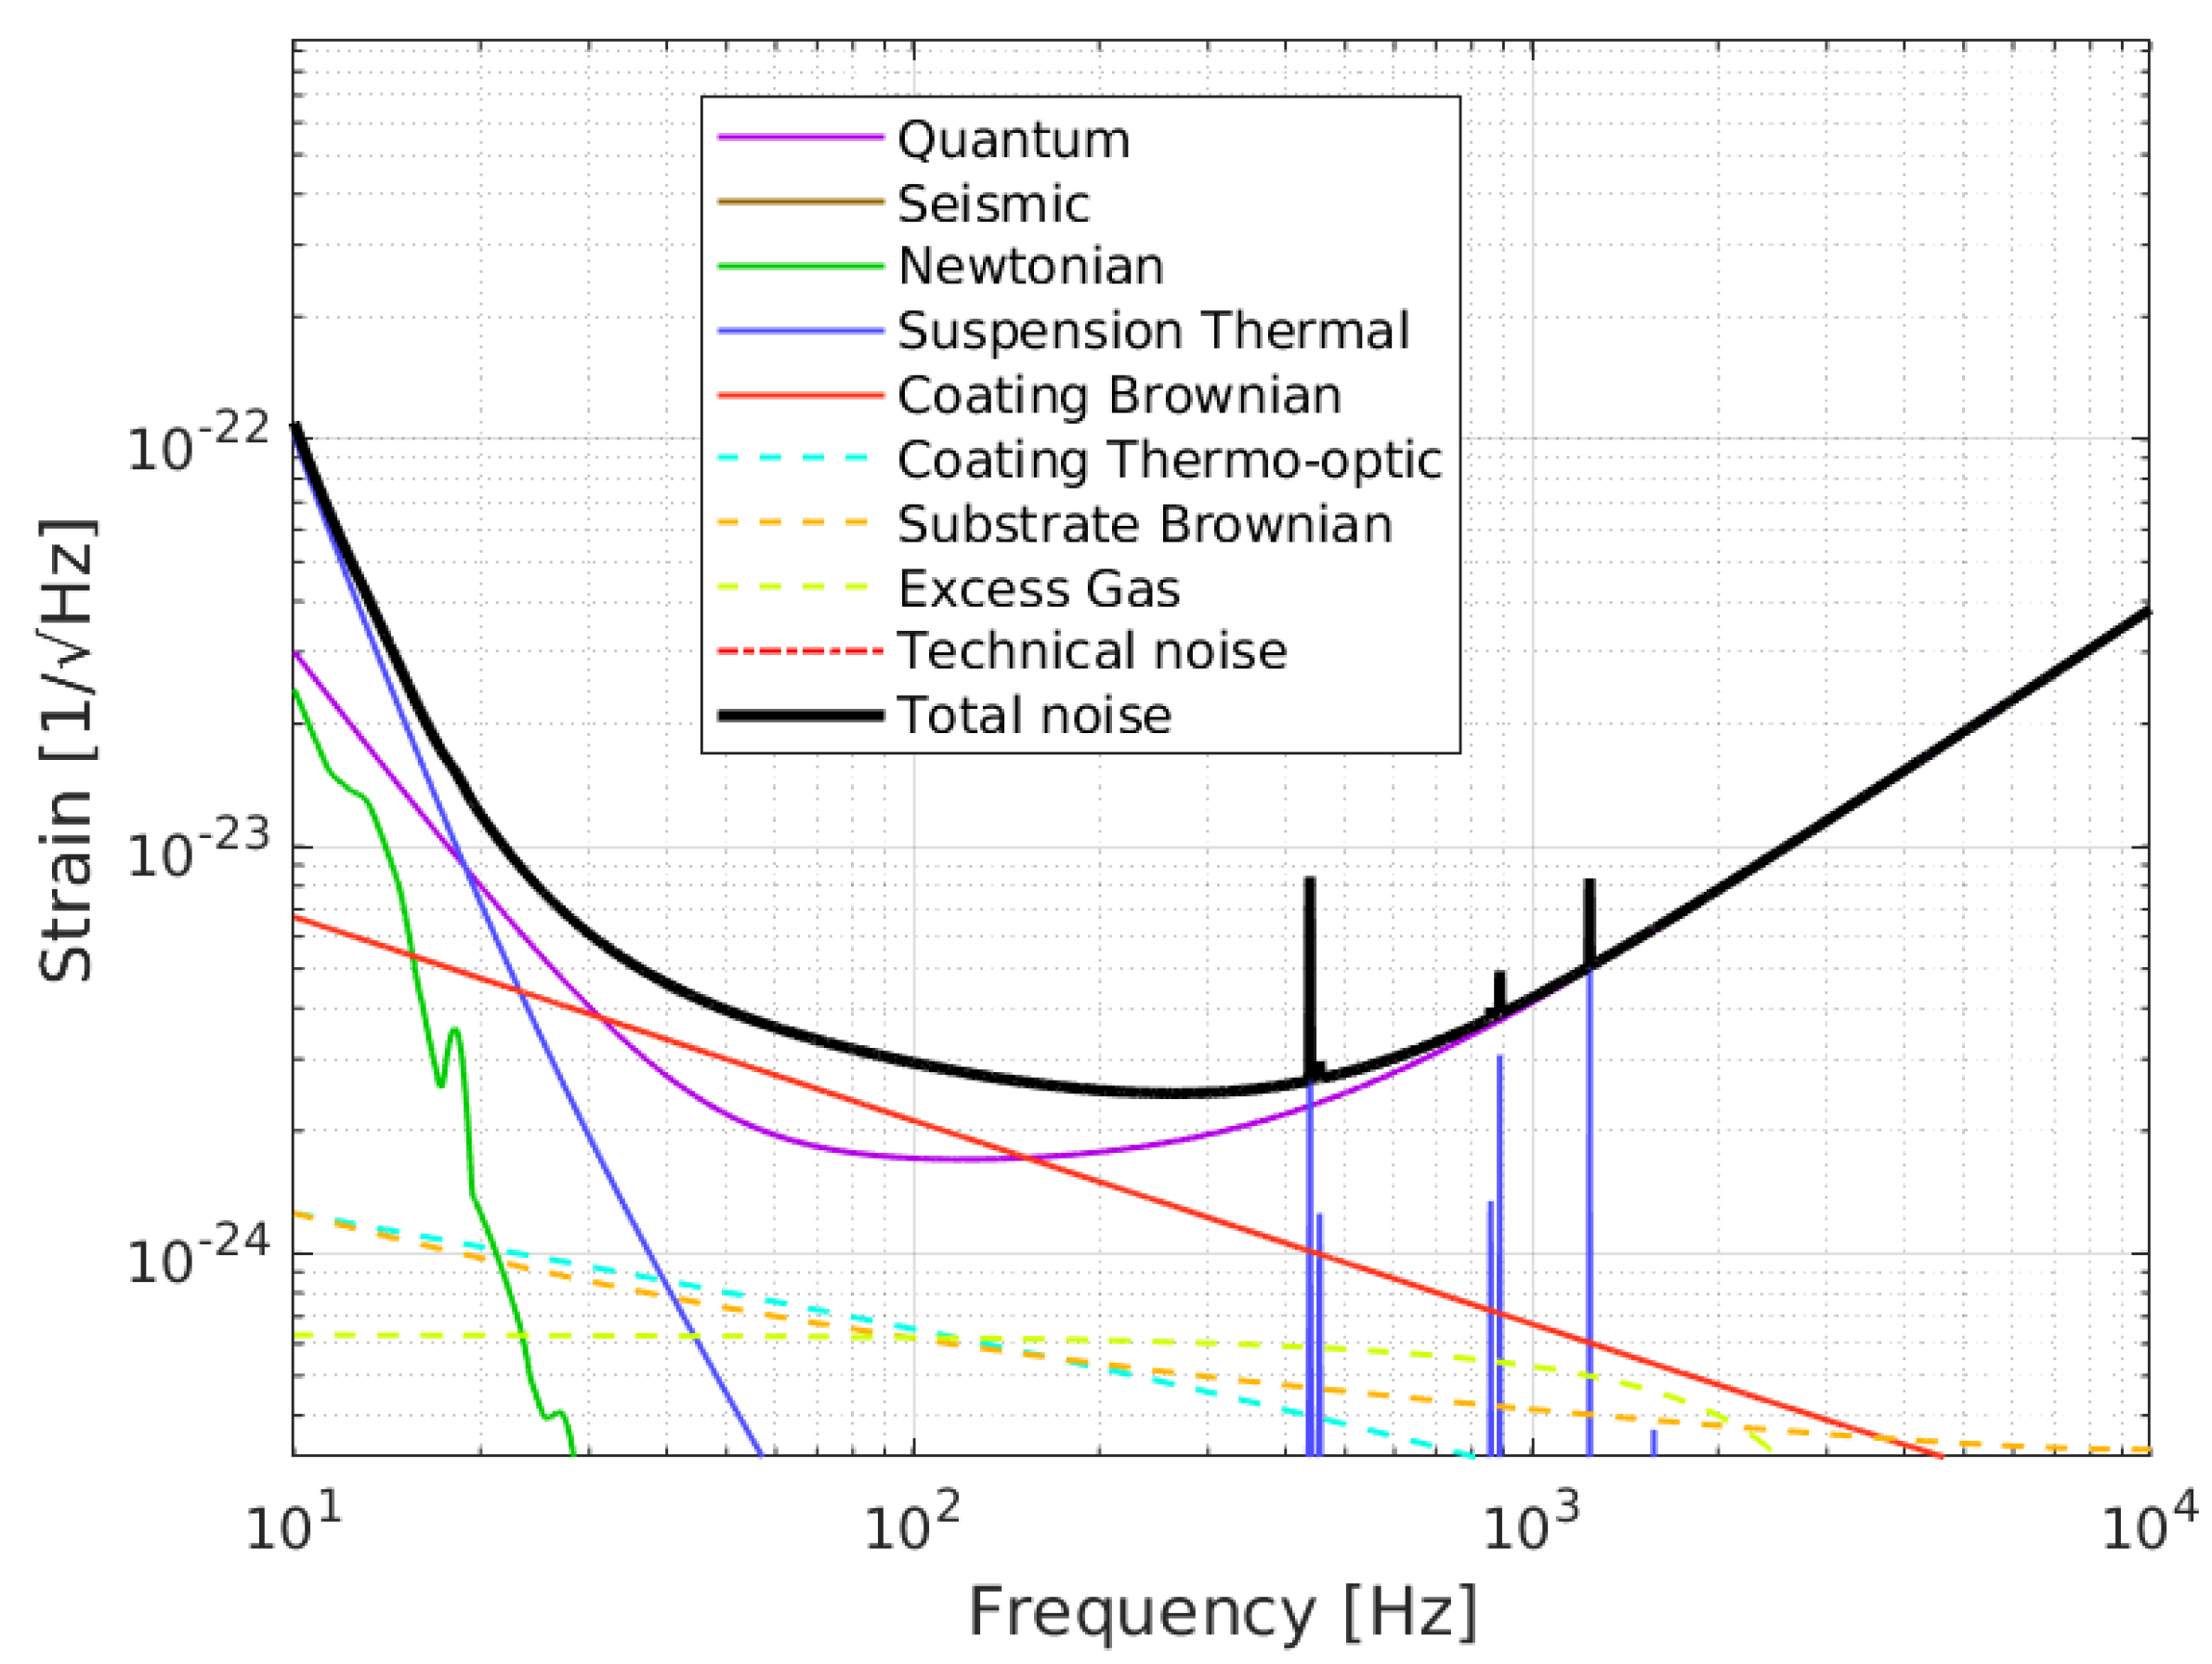
Parameters such as mirror RoCs, transmittances, and input laser power defining the possible sensitivity realizations for phase II (O5) are given in Table 1. Two scenarios of O5 high (pessimistic) and O5 low (optimistic) define the violet band extremes in Figure 1. An important parameter is arm cavity round trip losses (RTLs), arising from imperfect mirror surface quality (flatness, roughness, and point defects) and mirror absorption. The nominal RTL value is ppm, but in this work we consider a range of RTLs varying from ppm to ppm since uncertainties still exist on the values achievable for phase II. Concerning other parameters, we assume the ITF to be operating at the O5 low (optimistic) configuration with broadband signal recycling, shown in Figure 3 with a breakdown of limiting noise contributions. The total noise (black) is dominated at higher frequencies by QN only (purple), at mid to low frequencies by QN and coating thermal Brownian noise (red), and at frequencies below Hz by suspension thermal noise (blue). Since optimization of mirror transmittances will only affect the QN curve, which is not the only limitation at mid to low frequencies, it should be possible to find a configuration that fine-tunes high frequency sensitivity with reduced cost to lower frequencies.
Table 1.
Interferometer parameters for phase II of AdV+. The final parameter values and sensitivity curve will depend on photodetector quantum efficiency performance, achievable laser power, and mechanical losses of new coatings used.
Figure 3.
Example low (optimistic) sensitivity for O5, including breakdown into sub-component contributions.
A global noise calculator for the AdV and AdV+ detectors advGWINC1 is used to obtain the AdV+ theoretical sensitivity. Inputting the O5 low parameters to the simulator, an ITF sensitivity is calculated along with leading sub-system contributions and astrophysical figures of merit.
A random walk routine was used to find the transmittances that optimize one of two astrophysical figures of merit (BNS range or PM SNR ), labeled the ‘primary parameter’. While searching for the optimal transmittances, the sampler takes note of the secondary sensitivity parameter as well as optics parameters such as arm cavity finesse , arm cavity stored power , power incident on beam splitter , PR gain , and PRC losses . A predefined ‘budget’ (a variation window) was allowed around the optimal value so that the sampler filled out correlations between parameters. In each simulation run, the configuration found that gives the optimal primary parameter is labeled ‘opt.’, while the configuration that maximizes the secondary parameter within the predefined budget is labeled ‘max’. For example, when the routine is run to optimize BNS range , the best range found is ‘opt. ’ and the best PM SNR found within a Mpc budget is ‘max ’. Conversely, when the routine is run to optimize PM SNR , the best SNR found is ‘opt. ’ and the best BNS range found within a SNR budget is ‘max ’.
Operating similarly to a Monte Carlo, the random-walk routine draws a point in transmittance space and calls advGWINC to evaluate the ITF sensitivity and its astrophysical figures of merit. It then randomly samples a new trial point close to the current point, and repeats the calculations. For an initial ‘burn in’ period, the trial point is accepted as the new current point only if its primary parameter is larger than at the current point. Once the initial ‘burn in’ period is completed, a trial point is also accepted if its primary parameter is within the error budget of the running global maximum value. If these criteria are not met, then the trial point is discarded and a new point drawn. This is repeated for a large number of draws to produce a chain of accepted points. Once the optimization is completed, points drawn in the initial ‘burn in’ period, where the algorithm is locating the global maximum, are removed from the chain.
The first of the two sensitivity parameters used in this study is BNS inspiral-merger-ringdown (IMR) range . It corresponds to an averaged maximum distance at which a BNS IMR event can be measured [14] with SNR greater than or equal to some pre-defined threshold, assuming a detector with strain noise power spectral density . It was one of the primary quantifiers of detector sensitivity during the first three observation runs. The advGWINC software approximates this number using an optimally aligned inspiral-merger-ringdown (IMR) waveform produced by IMRPhenomD [15] scaled to a range of redshifts z to find the cutoff distance where the SNR falls below a threshold . More precisely, advGWINC defines in frequency space as
where is the Hubble constant, c the speed of light, / the matter/dark energy content of the universe today, and the redshift horizon (a large upper limit on the integral). is the probability of a source at a given redshift having SNR greater than the threshold SNR after averaging over angular orientation of the binary orbital plane and sky location [16]. The function is a conversion from redshift to luminosity distance [17], and takes the form
where coefficients and are produced by fits to numerical data, and the input variables follow
The second optimization parameter used is the SNR of a BNS post-merger (PM) [18] GW signal, produced by a quasi-stable, rapidly rotating, super/hyper-massive neutron star formed for a fraction of a second or longer after the merger. The objects spin and deformation allow it to emit GWs in the kiloHertz region, making it a complementary sensitivity parameter to . Although other high-frequency astrophysical signals can be used in our optimizations, the successful measurements of BNS events in previous observation runs make PM signals an interesting target.
The SNR of a full BNS event with a PM feature is dominated by the inspiral phase. We therefore restrict our waveform to the PM feature only, similar to Figure 1 in [19], so that there is negligible contribution below kHz and focus is on optimizing PM visibility. Realizations of detector strain noise power spectral density are combined with a frequency domain waveform to give the SNR , defined by
where is the frequency range in which the waveform is computed.
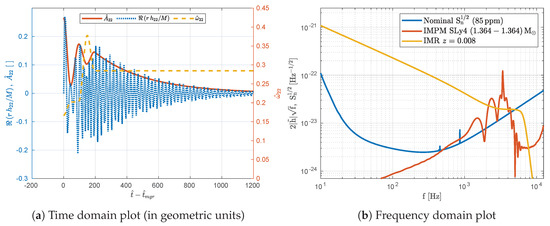
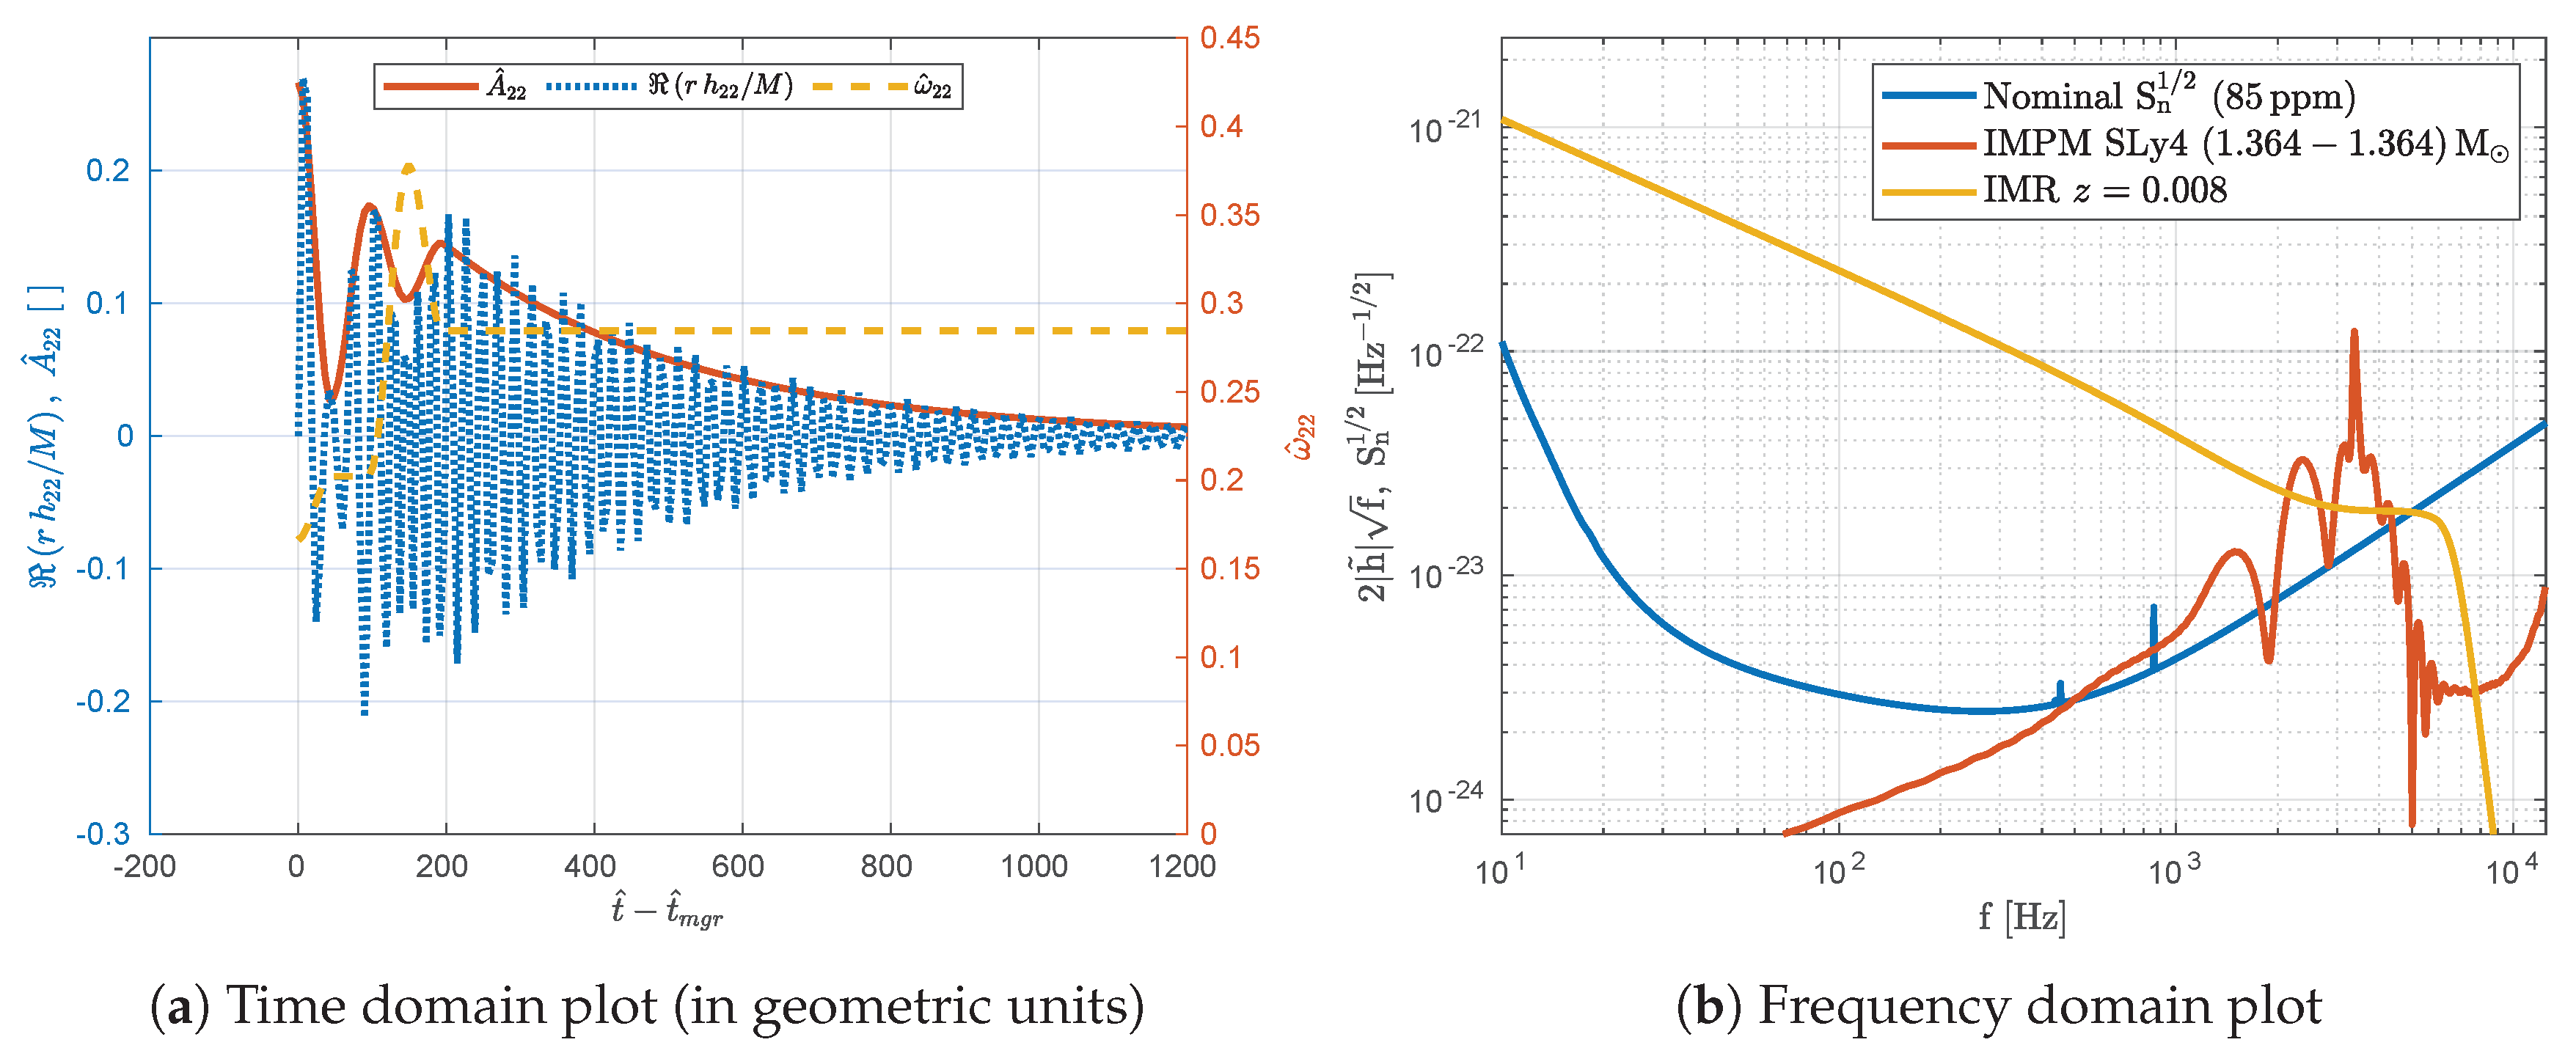
Computation of was done by a specialized module added to advGWINC that follows the numerical approximations reported by Breschi et al. [20] and assumes co-aligned spins and ideal binary orientation to the line of sight. Characteristic frequencies and times are calculated with polynomial fits to numerical data for several neutron star equations of state. In this work, the SLy4 equation of state [21] is used for a source with total mass (). Figure 4 shows the reproduced waveform from the green curves of Figure 5 in [20]. Figure 4a shows the amplitude, angular frequency, and real component of the waveform in geometric units scaled to the total mass. Figure 4b shows the Fourier transform of a time domain waveform (red) assuming a redshift of , roughly matching the luminosity distance used in the reference, the equivalent IMR waveform with the same redshift (yellow), and the nominal sensitivity curve (blue). In this example, the O5 low nominal sensitivity curve has a BNS range of Mpc, and the PM waveform has SNR .
Figure 4.
(a) Reproduction of time domain post-merger waveform following the numerical model by Breschi et al. [20]. The SLy4 equation of state reported by the authors in the left plot (green curve) of their Figure 5 is reproduced here. Units are geometric and scaled to total binary mass. (b) Frequency domain post-merger only waveform (red) and equivalent binary neutron star (BNS) inspiral-merger-ringdown (IMR) waveform (yellow), both at redshift . A nominal detector sensitivity with ppm round trip losses is also shown (blue). In this example, and are and Mpc, respectively.
Figure 5.
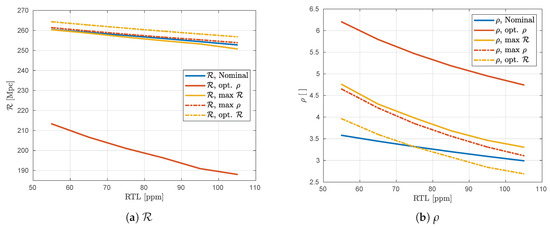
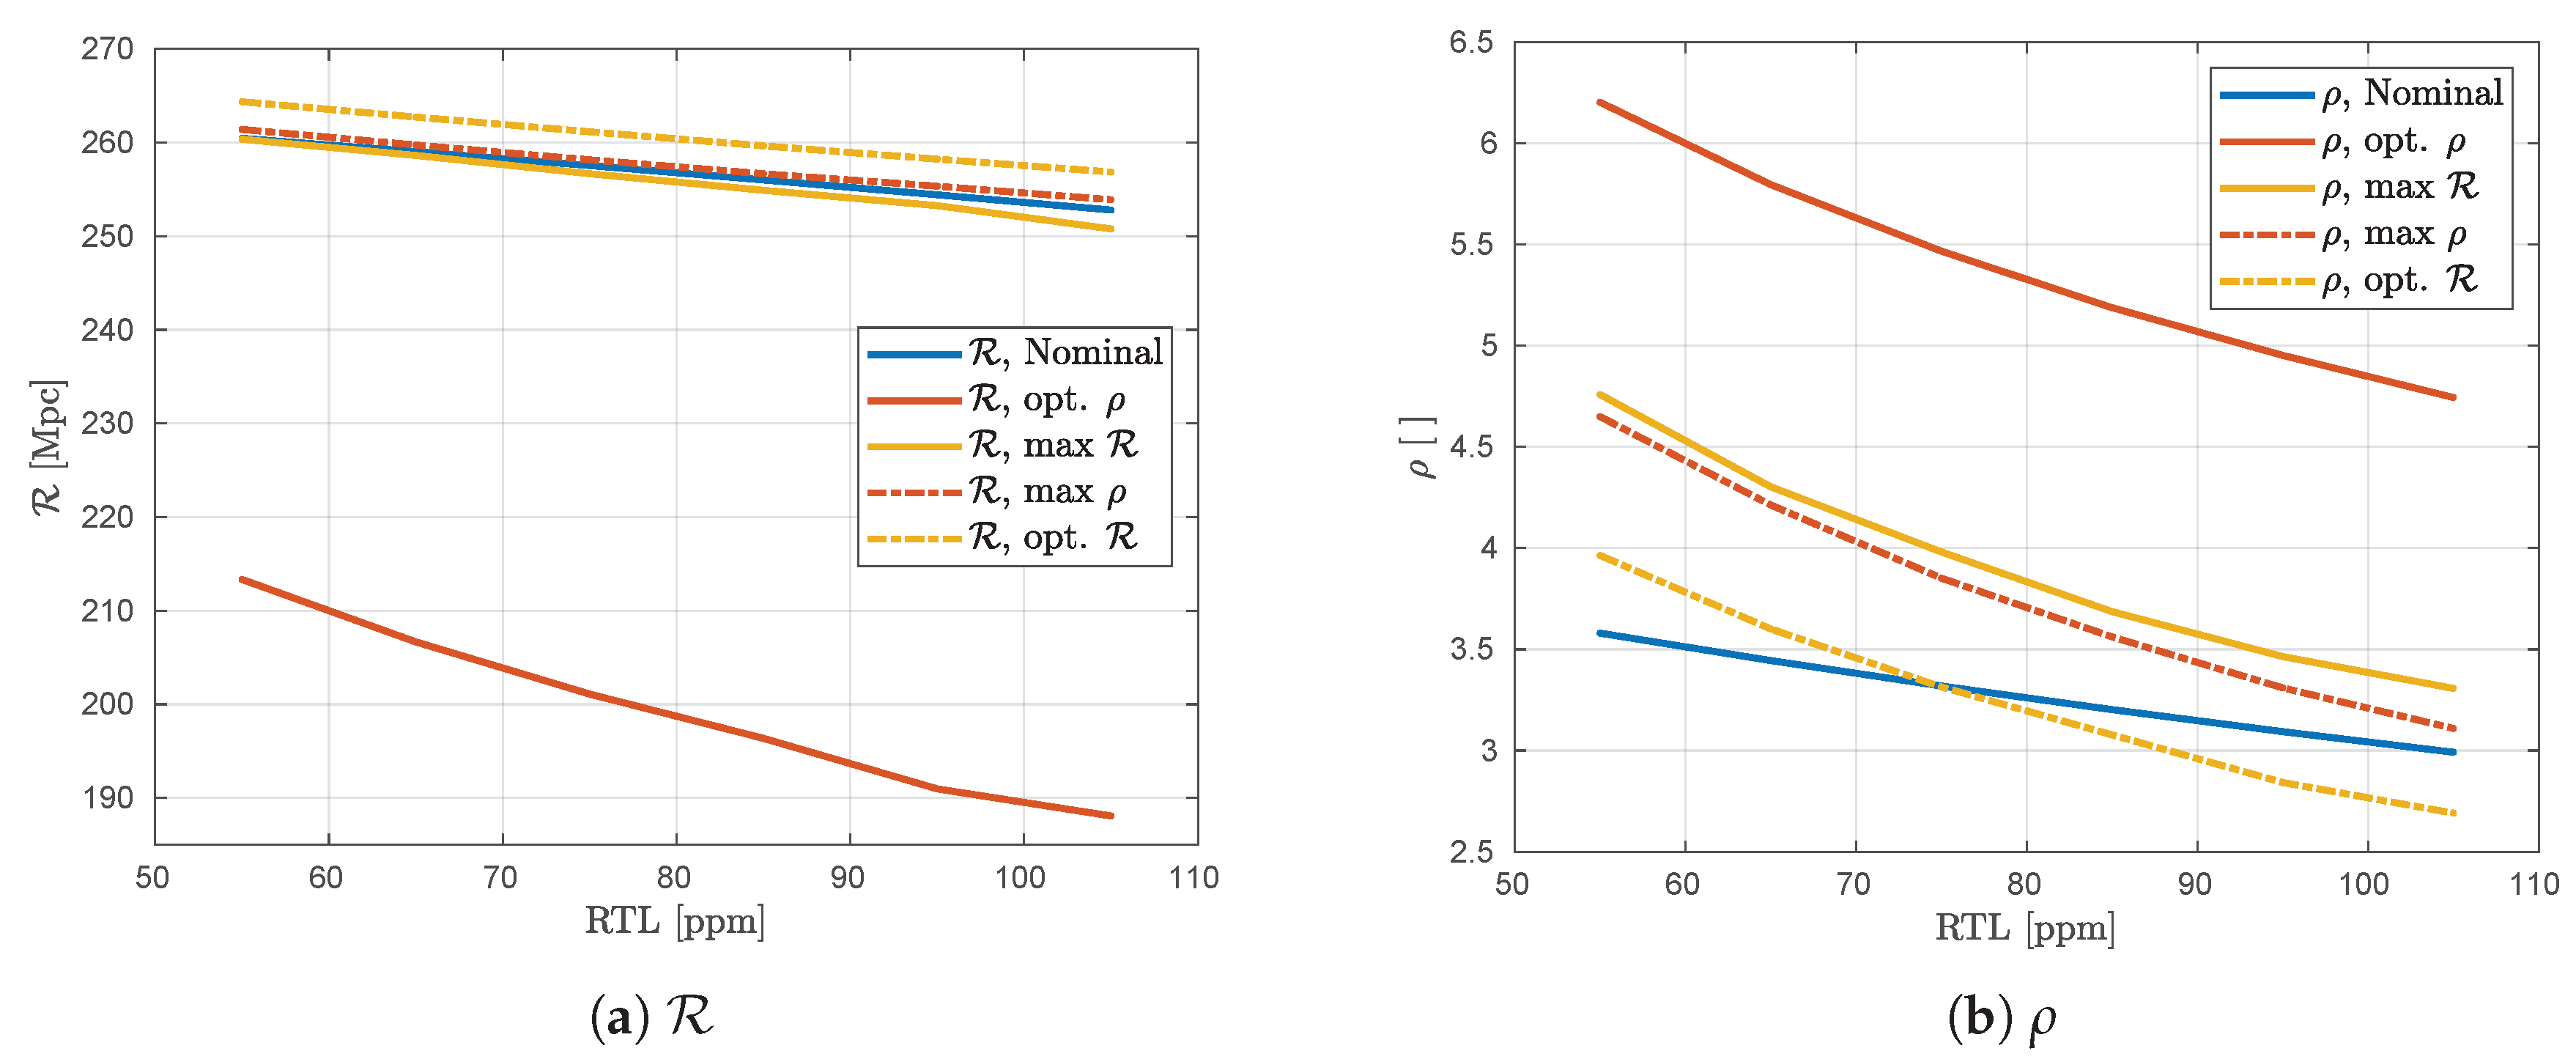
Sensitivity parameters as functions of round trip losses (RTLs). ‘Opt’ corresponds to an optimal primary parameter, while ‘max’ corresponds to a maximum secondary parameter within a budget of the optimal primary parameter. Nominal configurations that use the currently expected input mirror (IM), power recycling mirror (PRM), and signal recycling mirror (SRM) transmittances are shown for comparison.
3. Results and Discussion
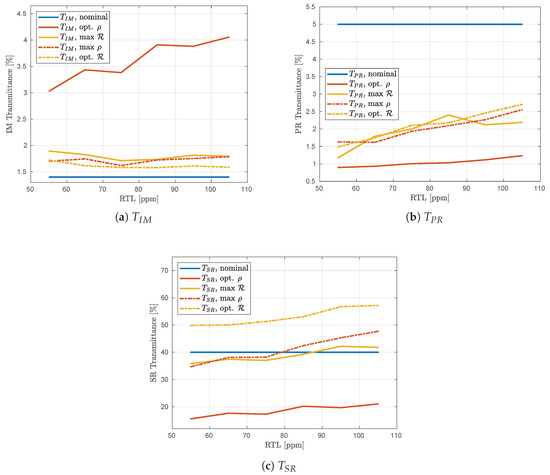
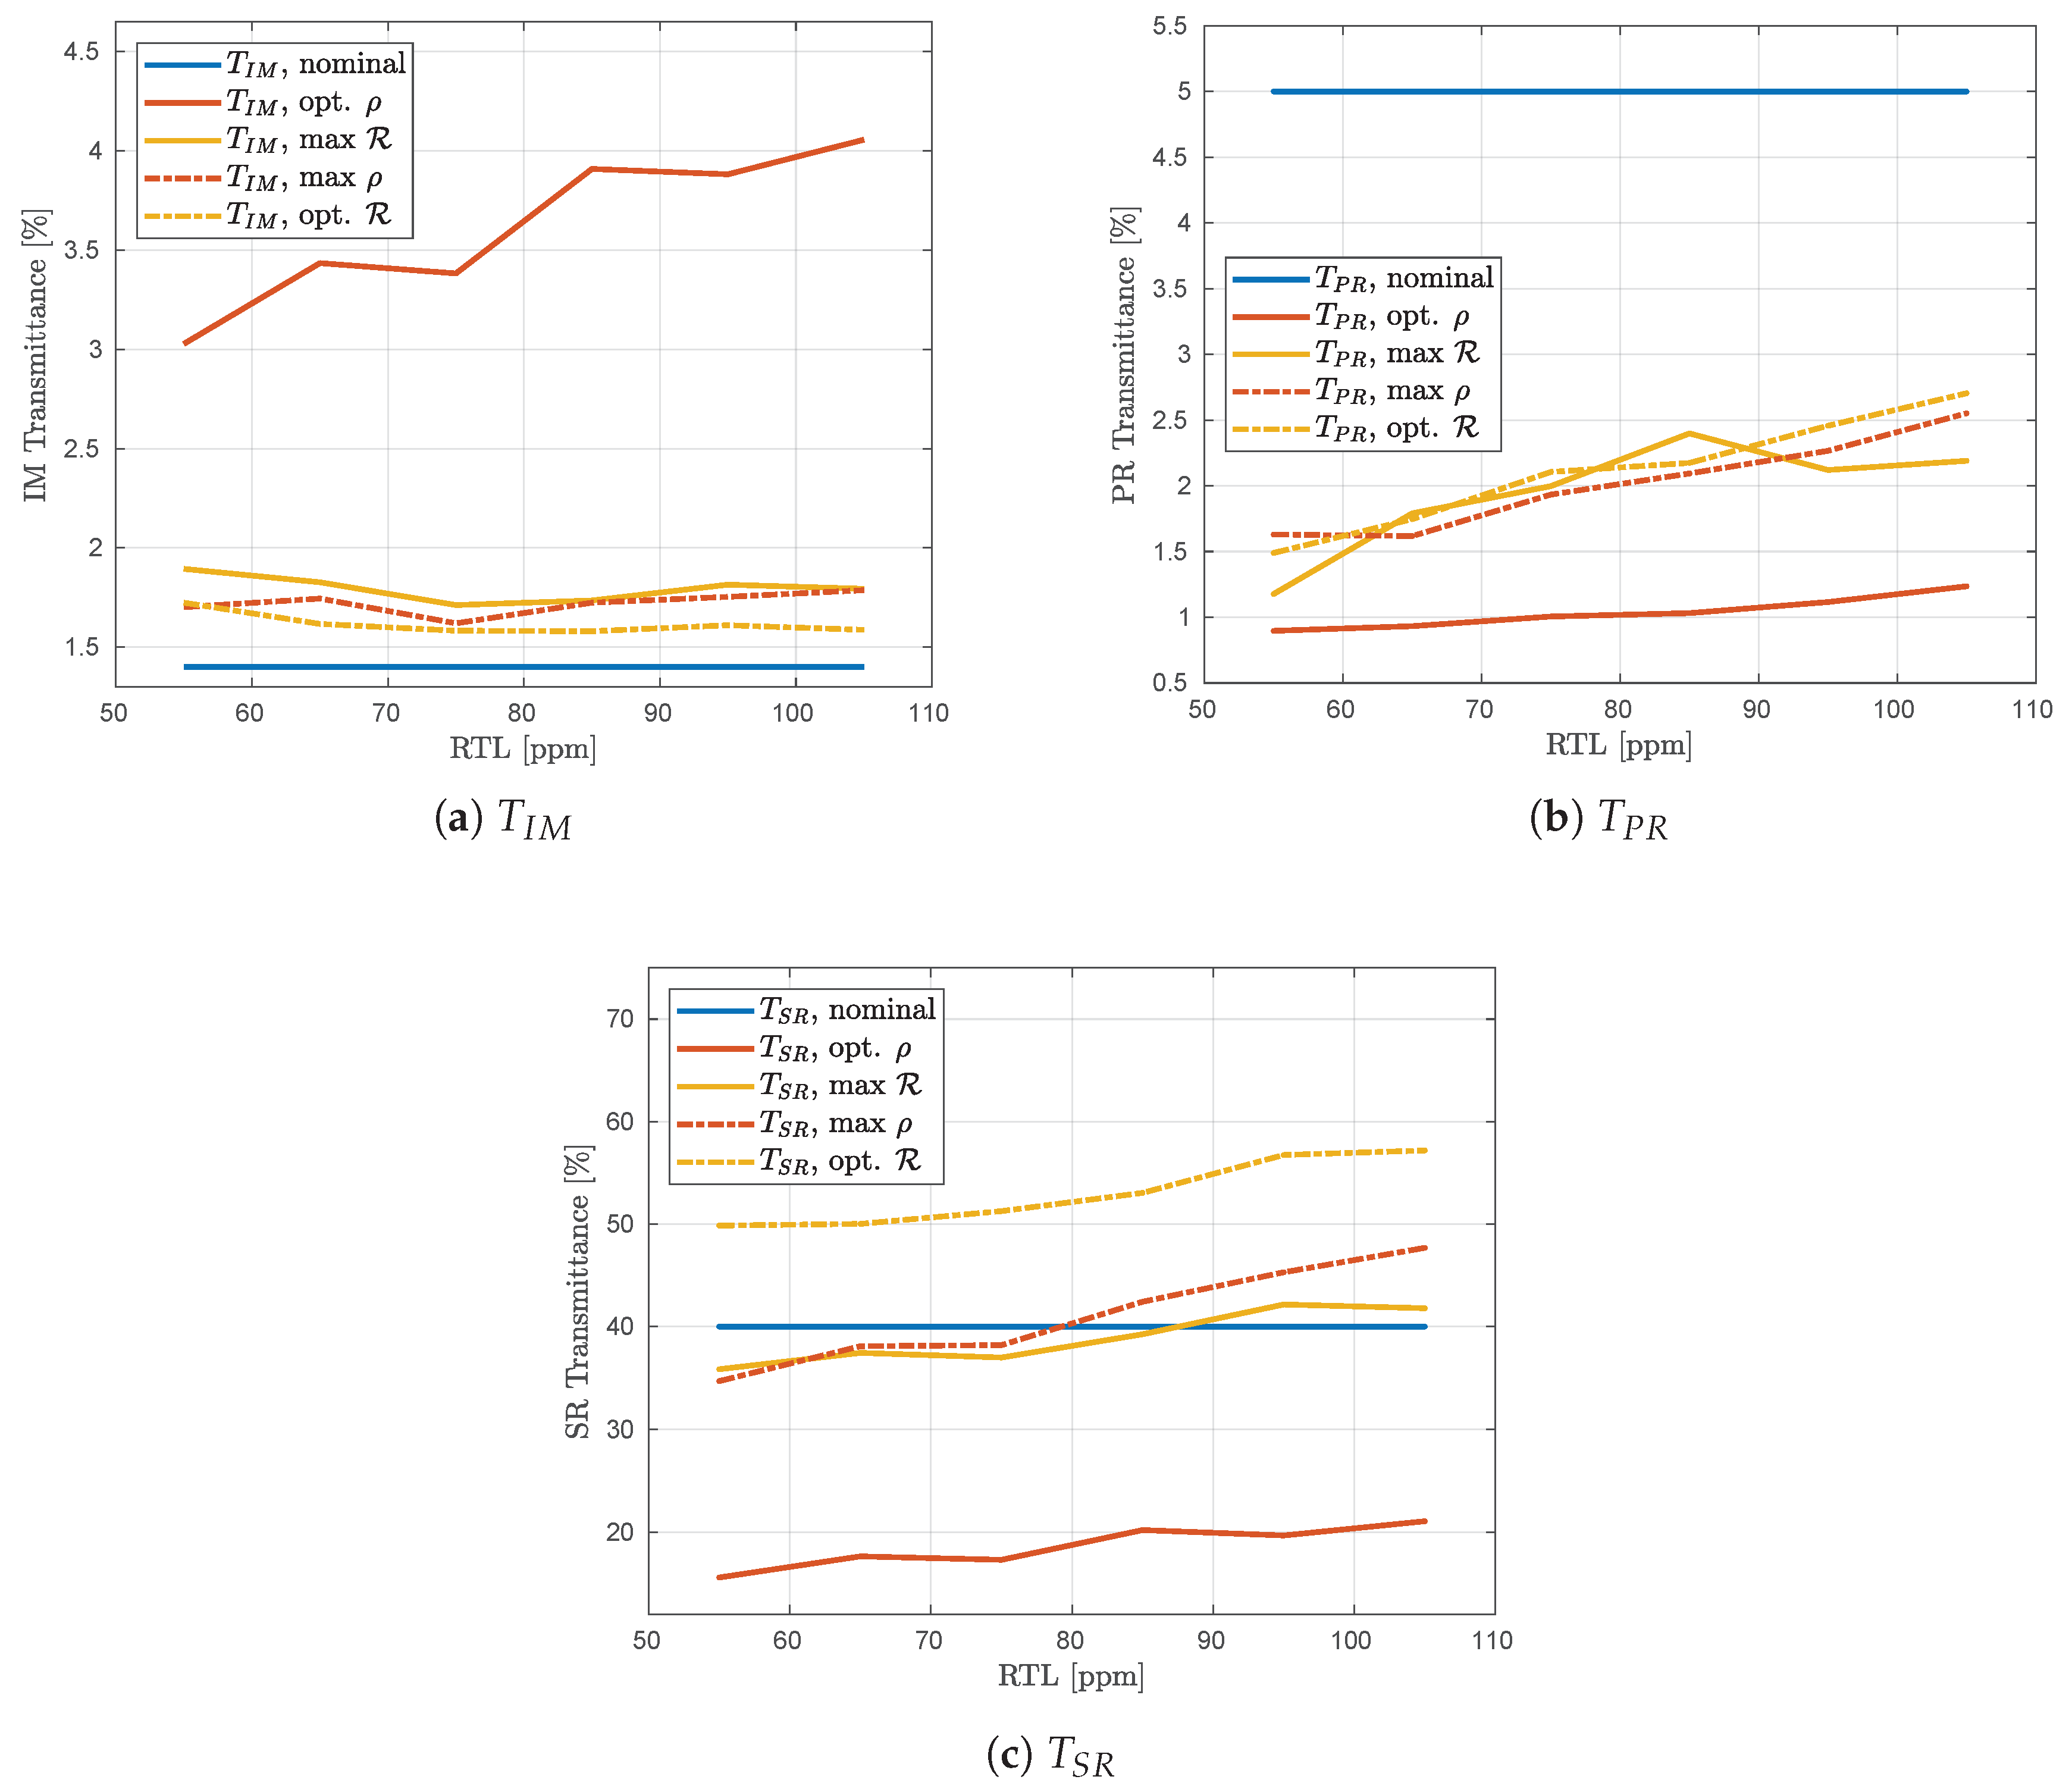
Figure 5 shows values of and , while Figure 6 shows the corresponding transmittances for each opt and max configuration using budgets of Mpc for and SNR for . Additional parameters linked to the optical system are shown in Figure 7. The reader is directed to Table A1 in Appendix A for numerical values. Simulations were run multiple times to check numerical convergence; each iteration presented some stochastic fluctuation due to finite sampling but asymptotically produced the same results on increasing the number of draws. Simulations were terminated once sensitivity parameters changed by less than on running double the number of draws again.
Figure 6.
Opt and max configuration transmittances found by the optimization routine. ‘Opt’ corresponds to an optimal primary parameter, while ‘max’ corresponds to a maximum secondary parameter within a predefined budget of the optimal primary parameter found. Nominal configurations that use the currently expected IM, PRM, and SRM transmittances are shown for comparison.
Figure 7.
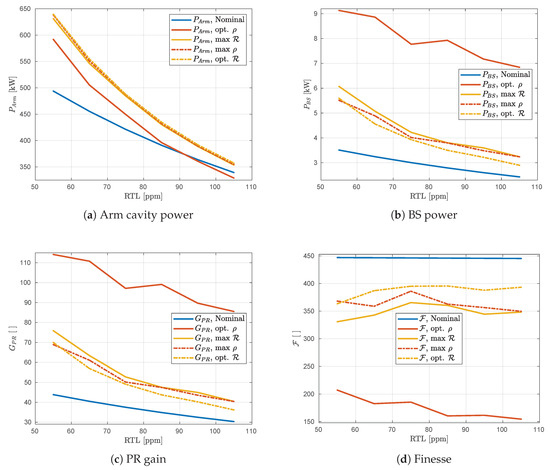
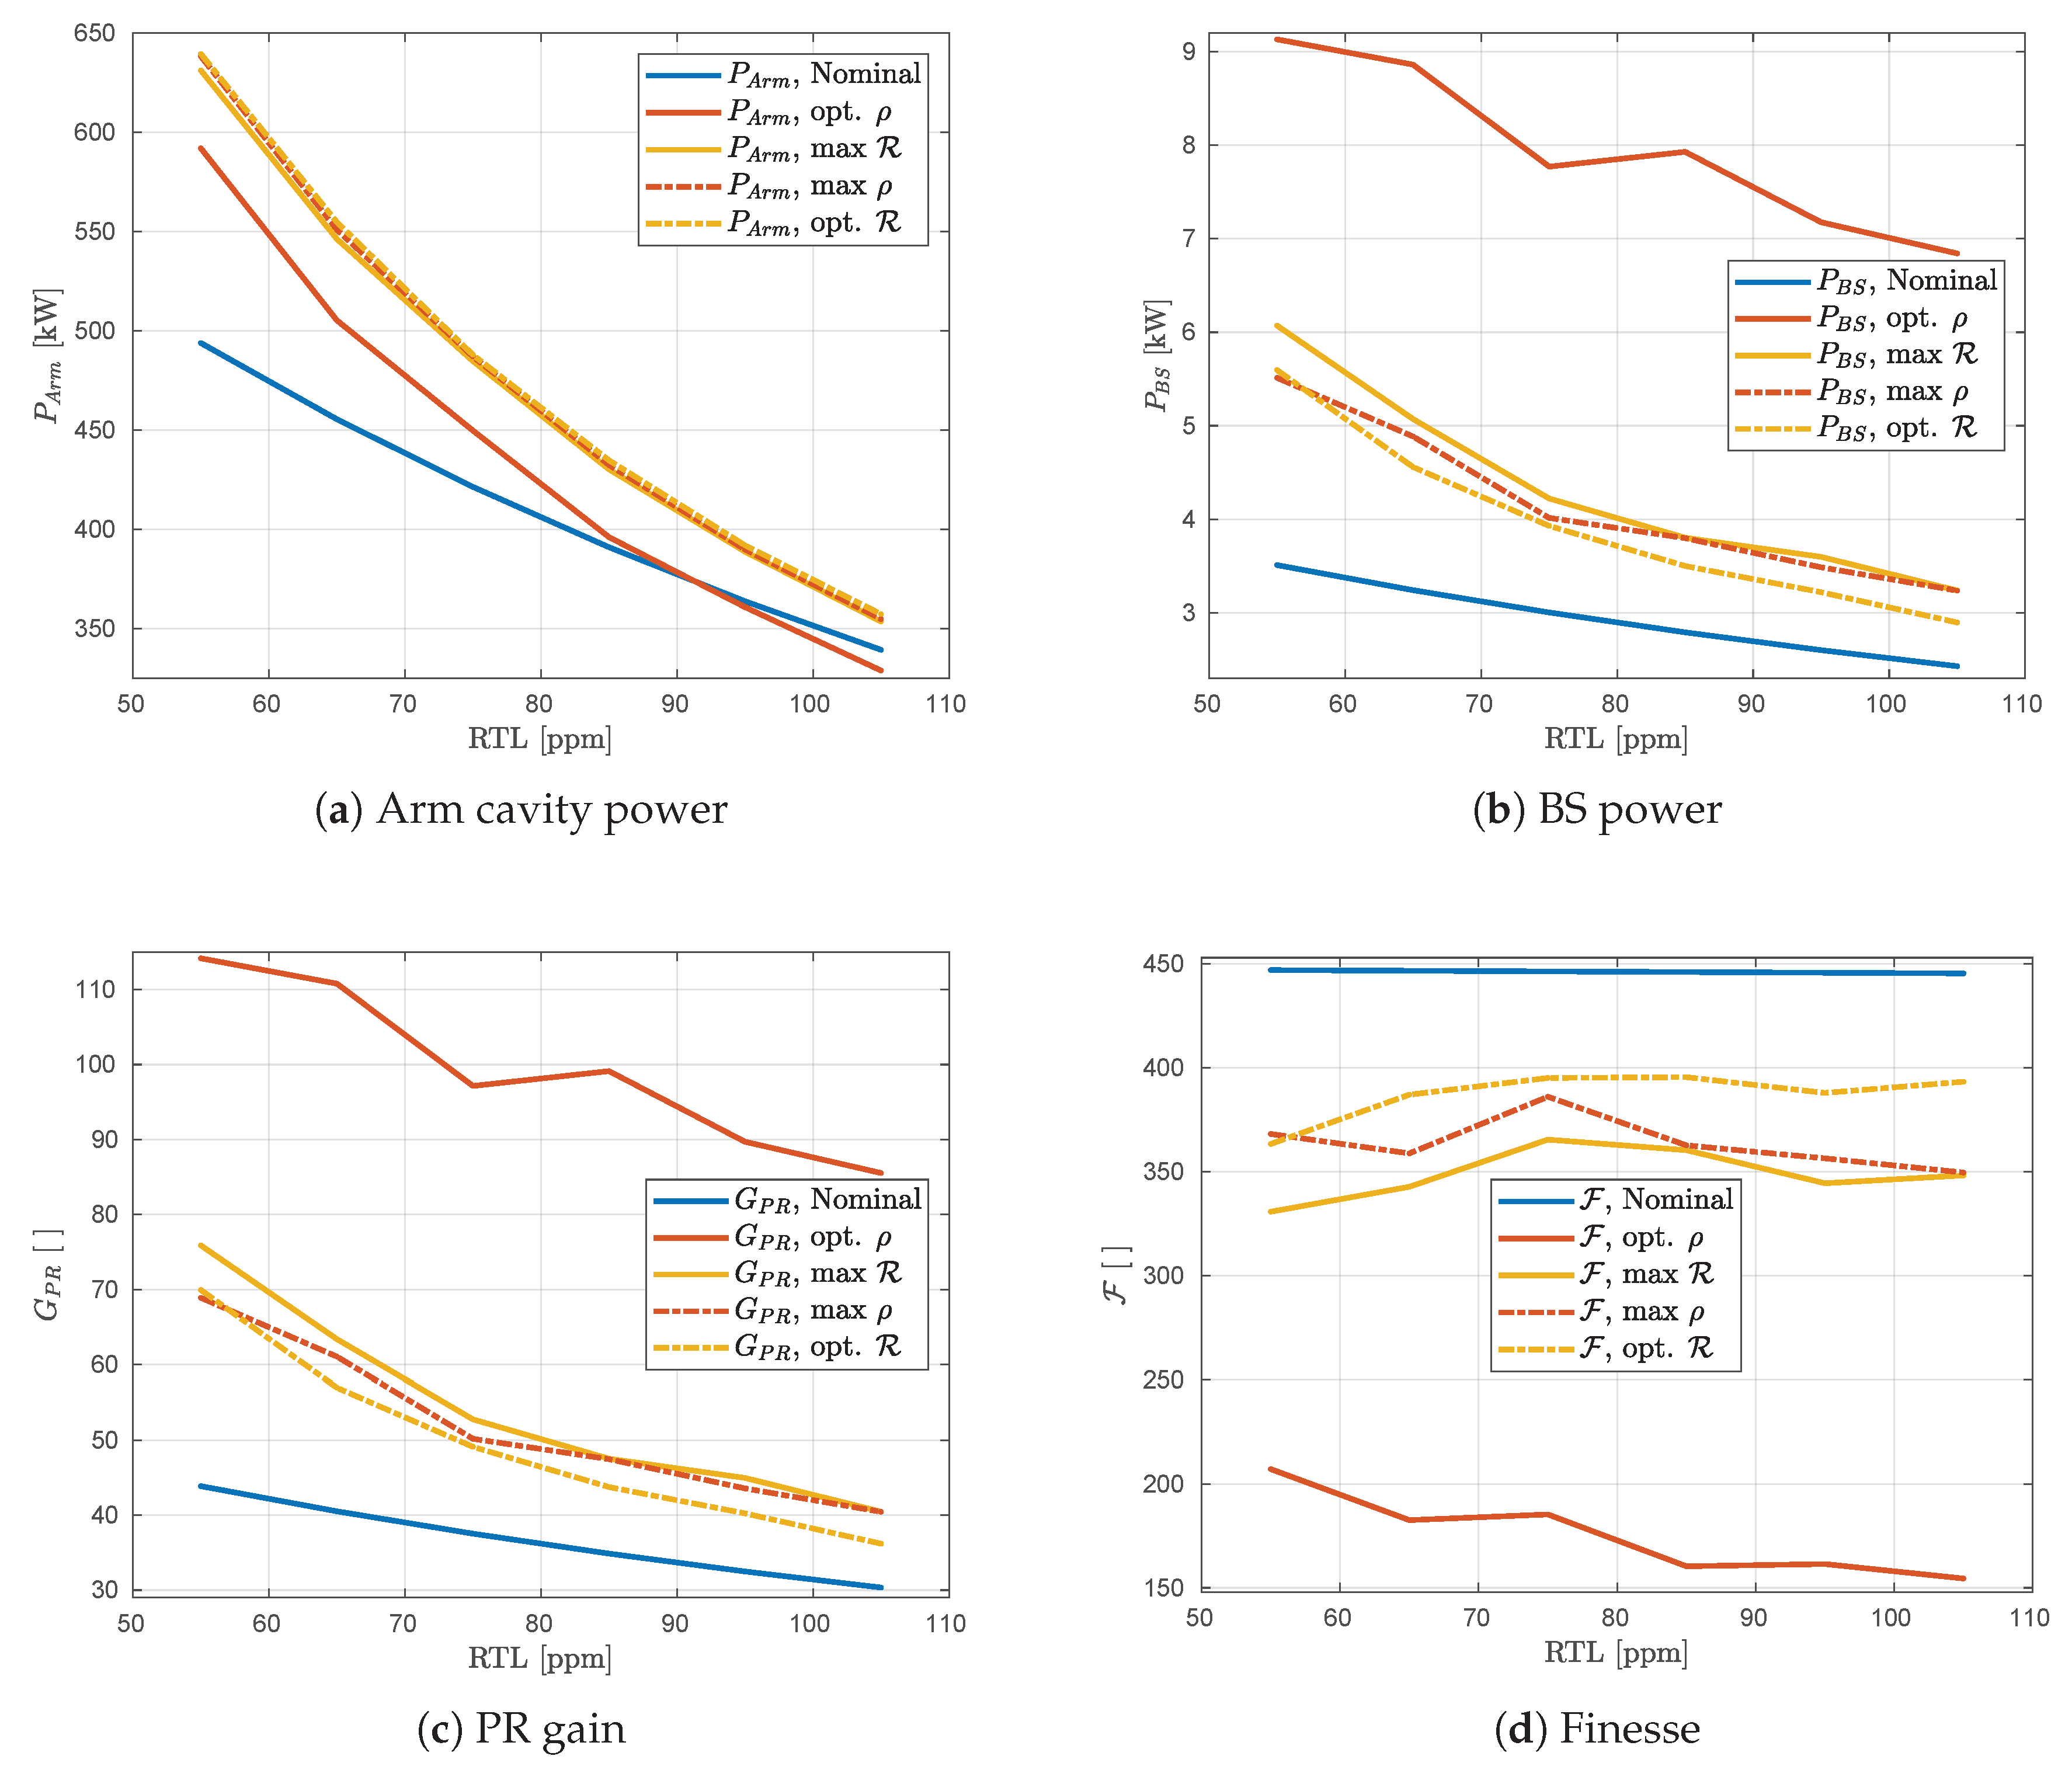
Additional parameters calculated by the algorithm but not used in its search criteria. ‘Opt’ corresponds to an optimal primary parameter, while ‘max’ corresponds to a maximum secondary parameter within a predefined budget of the optimal primary parameter found. Nominal configurations that use the currently expected IM, PRM, and SRM transmittances are shown for comparison.
3.1. Optimizing
As previously stated, the optimization of BNS range is limited by coating thermal noise that dominates at mid to low frequencies. Hence, the opt. configuration (yellow dot-dashed in Figure 5a) only improves the BNS range by several Mpc from the nominal values (blue). For RTLs of ppm (similar to O3), is improved by Mpc from Mpc to Mpc by marginally increasing , reducing from to , and increasing from to (as shown in Figure 6). Considering the optical parameters shown in Figure 7, the opt. configuration for ppm RTLs changes the finesse from the nominal 446 to 395, the PR gain from 35 to 44, the arm cavity power from kW to kW, and the recycling cavity power from kW to kW. The reduced finesse reduces total losses in the arm-cavities which, when coupled with a reduction in , increases . Since the proportional increase in is larger than the proportional drop in , both the arm and recycling cavity powers increase from the nominal stored powers.
Looking now at Figure 5b, the max. configuration (dot-dashed red) illustrates that there is room for the nominal high frequency sensitivity to be improved. Comparing Figure 5a,b for all RTLs simulated, the max configuration maintains the nominal while improving the PM SNR . In fact, for the specific case of ppm, Mpc is added to from the nominal 256 while is increased from to . This is achieved by decreasing from (opt. ) to (max ), almost meeting the nominal value of , while keeping and relatively unchanged from the opt. configuration. As a result, the optical parameters do not show much change from the opt. configuration, except the finesse that decreases from 396 (opt. ) to 363 (max ).
3.2. Optimizing
Due to QN being the only limitation at high frequencies, the optimization routine can freely change the sensitivity in this region. Indeed, the opt. configuration (solid red in Figure 5) presents a sharp gain of in at ppm from to , and a drop of in from Mpc to Mpc, indicating a trade off between high and low frequency sensitivity. For all RTLs, the opt. configuration has very different transmittances and optical parameters to those found for other configurations, again due to the lack of feedback from lower frequencies in the search algorithm. Figure 6 suggests that, for ppm RTLs, the opt. configuration is achieved by an increase in from the nominal to , a reduction in from to , and a reduction in from to . Looking at Figure 7, the opt. configuration shows a marginal increase in arm cavity power from the nominal kW to kW, and a large increase in recycling cavity power from kW to kW. The PR gain is also increased from 35 to 99 at ppm, while the finesse is reduced from 446 to 160.
Given the opt. configurations cost to and the drastic changes in optics parameters it presents, a more reasonable fine-tuning of high frequency sensitivity would take into account the cost to low frequency sensitivity. In Figure 5, the max configuration (solid yellow) shows that this is indeed possible. For the specific case of ppm RTLs, is decreased from the optimal value of to while is increased from Mpc to Mpc, just Mpc under the nominal value. Looking at Figure 6, the difference between the max configuration (solid yellow) and the opt. configuration (solid red) is a decrease in , increase in , and an increase in , for all RTLs. Looking at the specific case of ppm, is reduced from to , is increased from to , and is increased from to . In Figure 7, the max configuration (solid yellow) has the same optics parameters as the opt. and max configurations (dot-dashed yellow and red).
3.3. Comparing Results
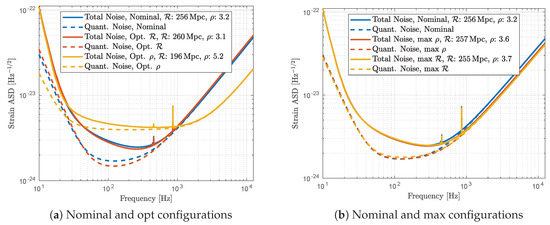
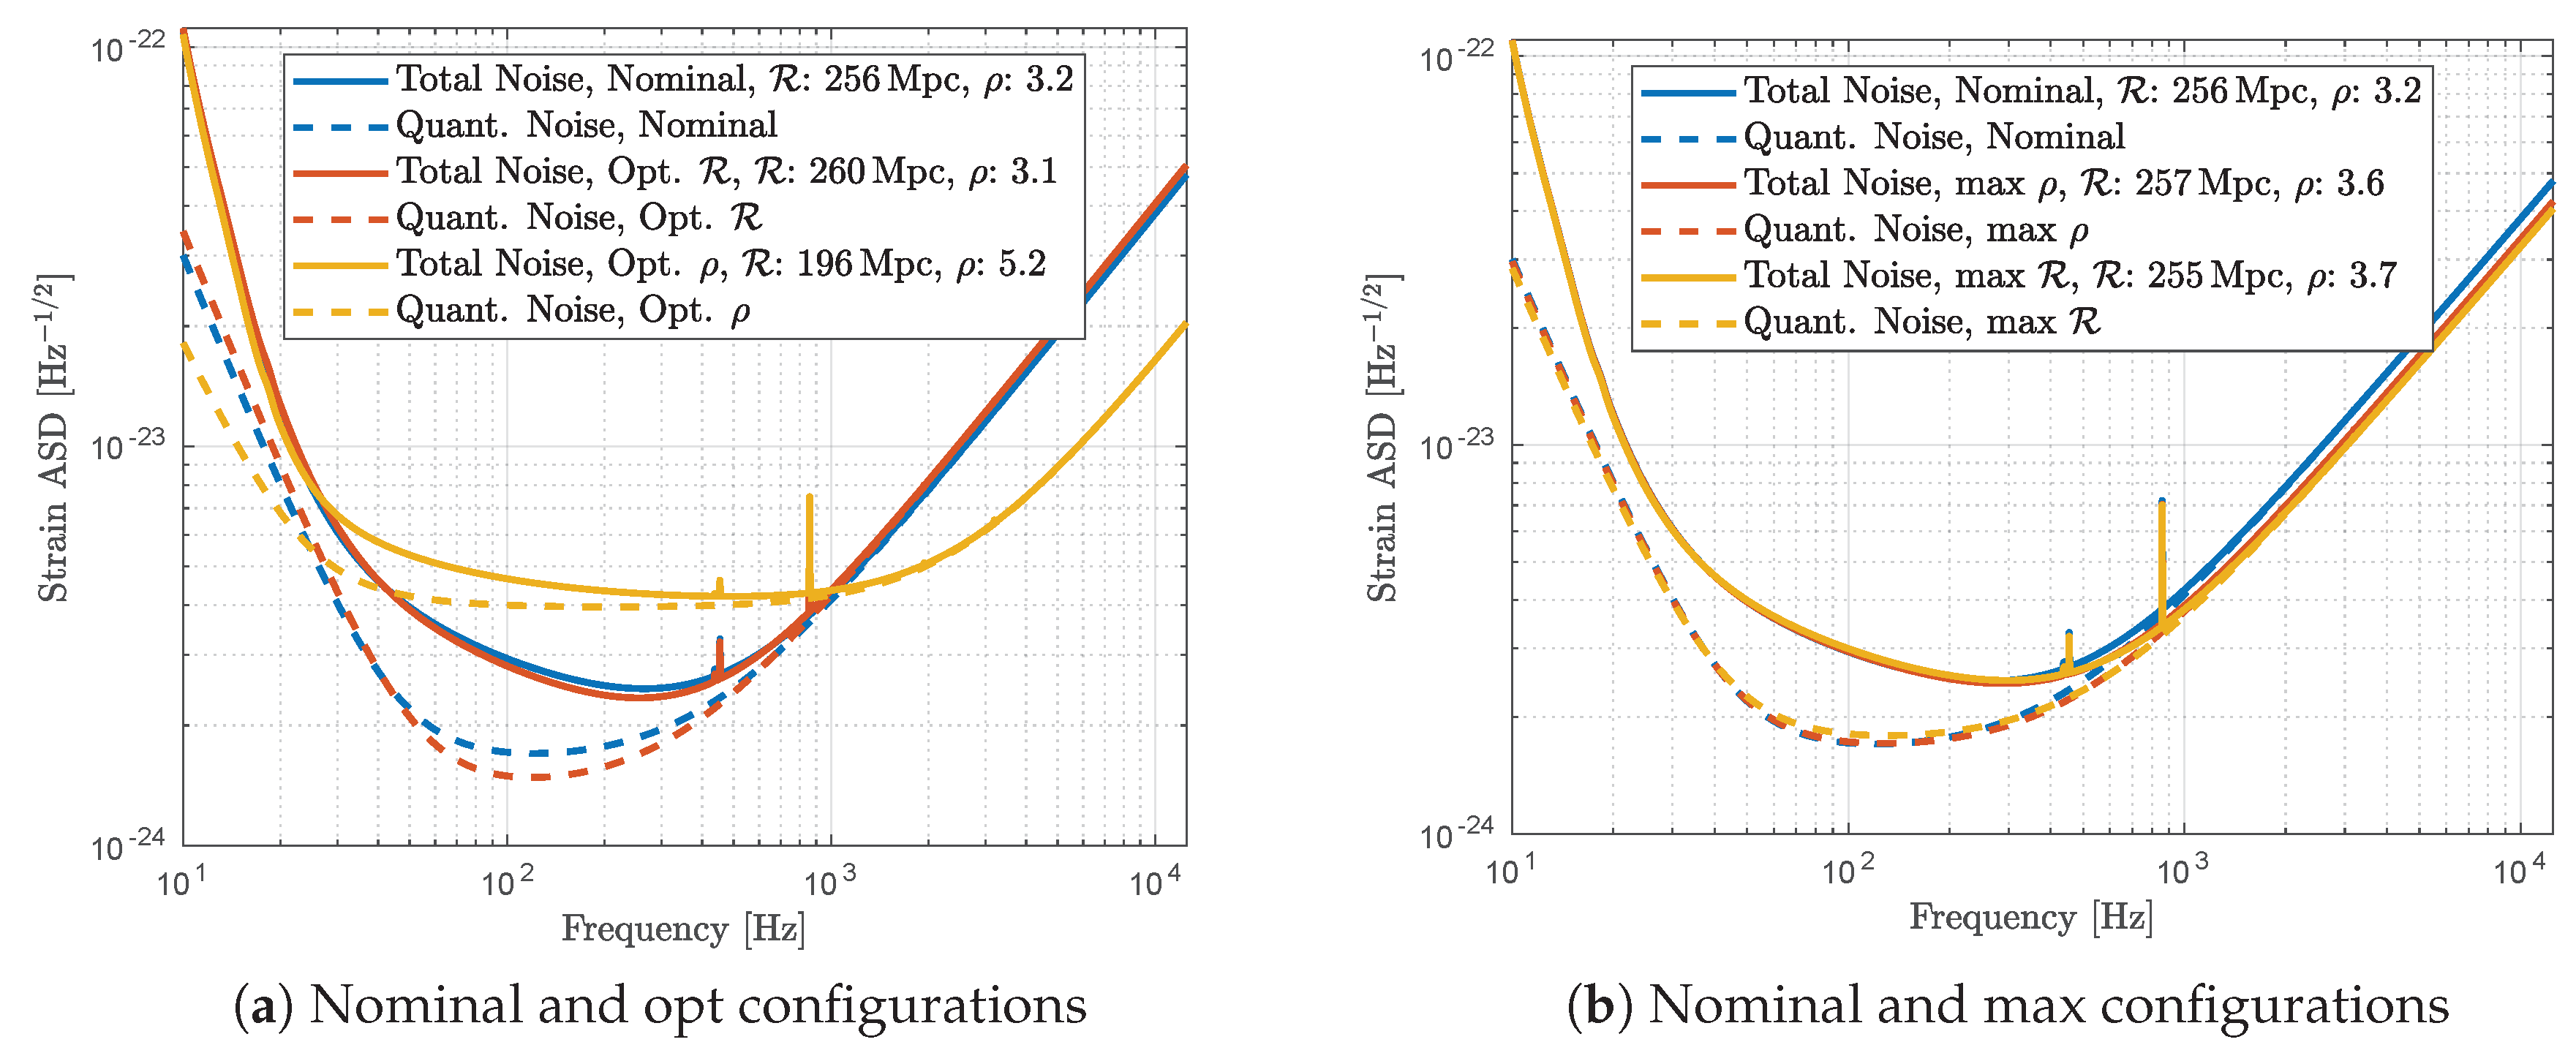
The opt. and opt. sensitivity curves are shown in Figure 8a along with the nominal sensitivity (blue). While the bucket of the QN curve is greatly enhanced for the opt. configuration (red), the high frequency band is slightly above the nominal curve. In sharp contrast, the opt. configuration (yellow) shows a greatly reduced high frequency noise at the cost of sensitivity in the bucket. In contrast, the max and max sensitivities shown in Figure 8b almost overlap. Compared to the blue nominal curve, there is a noticeable reduction in high frequency noise in both cases while the mid frequency sensitivity is almost unchanged. This further shows the potential to gain sensitivity at high frequencies without compromising low frequency performance.
Figure 8.
Sensitivity curves for ppm RTL optimal and max parameter configurations found for both optimization routines. ‘Opt’ corresponds to an optimal primary parameter, while ‘max’ corresponds to a maximum secondary parameter within a predefined budget of the optimal primary parameter found. Nominal configurations that use the currently expected IM, PRM, and SRM transmittances are shown for comparison.
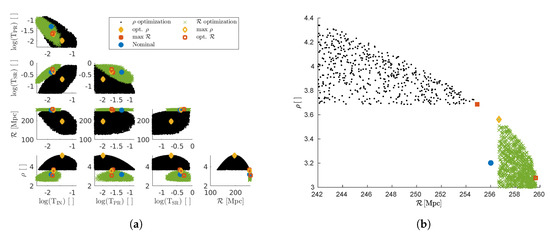
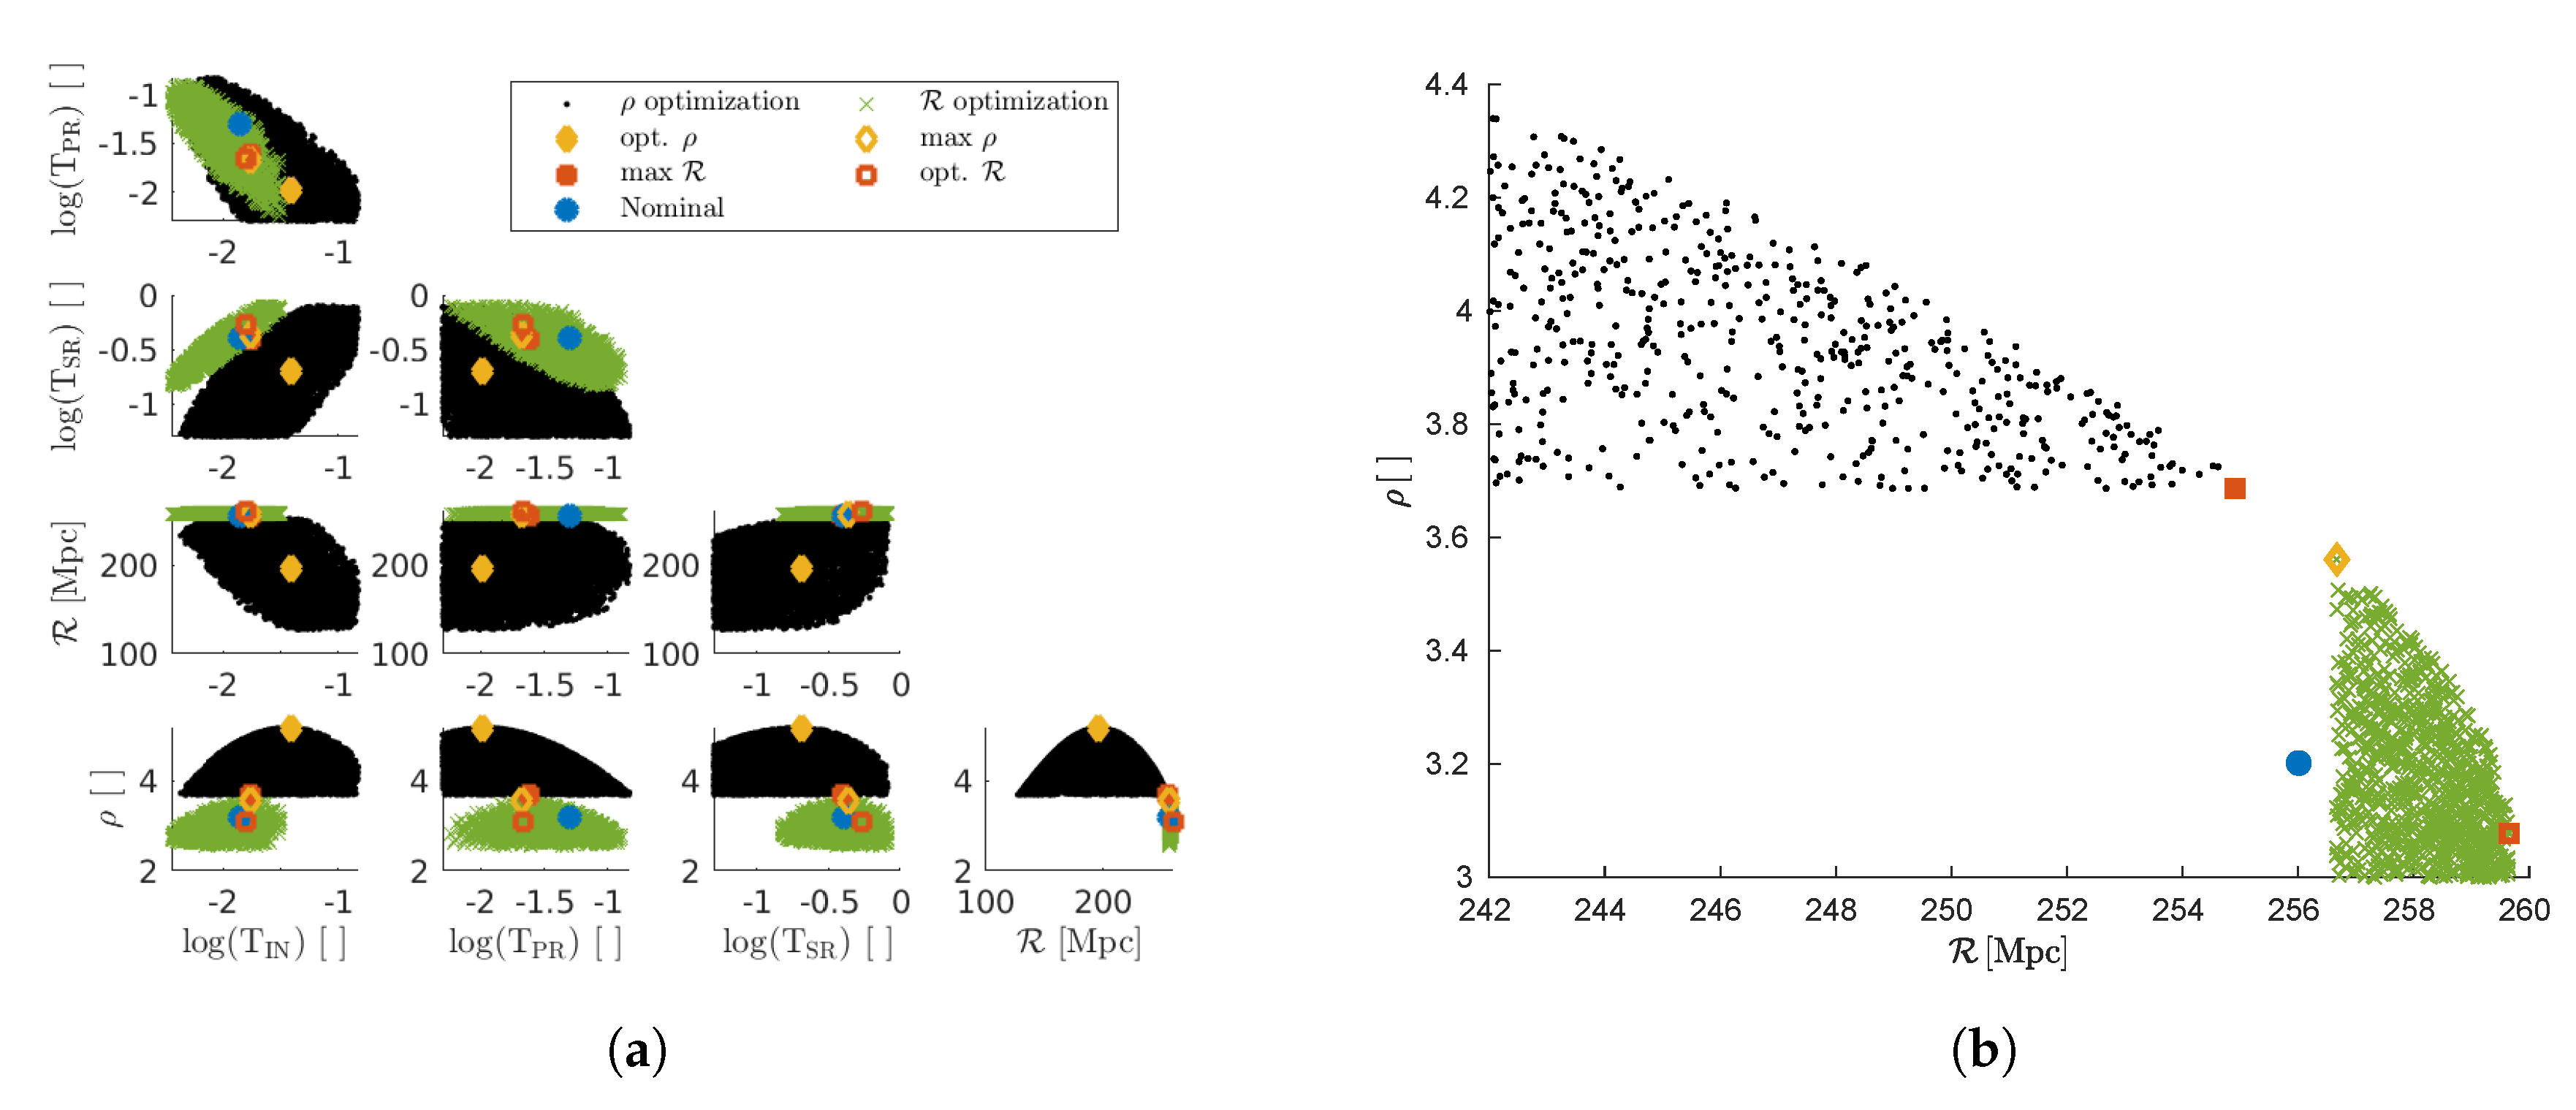
Figure 9 shows correlations found for ppm RTLs between the two figures of merit and transmittances using budgets of Mpc for (green) and SNR for (black). There is a clear change in correlations depending on choice of primary parameter, and a filled parabolic trade-off between and indicated by the bottom right plot, which is enlarged in Figure (BLAH). Color points show the opt. (open red), max (open yellow), opt. (solid yellow), max (solid red), and nominal (blue) configurations. Transmittances are in log scale. Note the near overlap of max (open yellow) and max (solid red) points, indicating again the equivalence between these configurations.
Figure 9.
(a) Correlations found for ppm RTLs. (green) uses Mpc budget and (black) uses SNR budget. Color points indicate nominal configuration (blue), opt. (open red), max (open yellow), opt. (solid yellow), and max (solid red). (b) Enlargement of and plot (bottom right of corner plot).
Assuming similar RTLs to those measured in O3 of ppm, the max configuration gives a increase in from SNR to at the cost of Mpc to now at Mpc. The corresponding transmittances to achieve this configuration move the nominal values from , , and to , , and for , , and , respectively.
3.4. Stability of Results with Arm-Cavity Losses
Uncertainties exist on RTLs for O5 and there is a strong dependence of the optimal and max configurations on RTLs. A check was done to investigate the effects of implementing the max configuration transmittances found with ppm RTLs, in ITFs with ppm and ppm RTLs. For ppm, the sensitivity parameters and were changed from Mpc and SNR to Mpc and SNR, respectively. For ppm, and were changed to Mpc and SNR. These correspond to a gain of Mpc and SNR if the RTLs are better than expected, and a loss of Mpc and SNR if the RTLs are worse than expected.
This was then repeated for the nominal configuration. For ppm, and were changed from Mpc and SNR to Mpc and SNR. For ppm, and were changed to Mpc and SNR. This is a gain of Mpc and SNR for a better than expected RTL, and a loss of Mpc and SNR if the RTLs are worse than expected.
Table 2 shows the values of and when the transmittances for the max or nominal configurations with ppm RTLs are implemented in ITFs with ppm or ppm RTLs. The potential change in both and are larger for the max configuration than the nominal configuration. In both cases, the potential gain is larger than the potential loss. The max configuration, however, shows a larger potential gain than the nominal configuration.
Table 2.
Astrophysical figures of merit using transmittances found for the max configuration with ppm in interferometers (ITFs) with RTLs indicated by column headers.
4. Conclusions and Future Steps
In this work, we have investigated the optimization of the sensitivity of the Advanced Virgo+ phase II detector (corresponding to the O5 observation run) by changing the interferometer mirror transmittances and using a random walk algorithm. A post-merger SNR was used for the optimization in addition to the usual IMR range . The two figures of merit roughly correspond to high-frequency and mid frequency signals, respectively.
It was found that, assuming arm cavity RTLs similar to O3 around ppm, independent of choice of primary optimization parameter ( or ), a configuration could be identified that enhanced the high frequency sensitivity without compromising the foreseen performance at low frequencies. This configuration, labeled ‘max ’ in this paper, would set , , and to , , and .
This configuration was checked for stability against measured losses different than those assumed in the study of ppm. In this respect, the max configuration poses a slightly higher risk if RTLs are larger than expected, but a much larger pay-off if RTLs are smaller than expected.
A detailed study of the control system should be made before making a decision on the final configuration. For instance, since the optimized configuration found in this work corresponds to an increase in recycling gain, additional difficulties can arise for the control systems of the marginally stable recycling cavities. In addition, since power is significantly redistributed between the nominal and max configurations, the perturbation to mirror RoCs due to thermal loads should be checked against thermal compensation system ranges. Moreover, this study was done in the context of a broadband signal recycling configuration, but can be continued to include a tuned configuration.
In the future, we plan to perform a qualification of the gains in sensitivity in the context of parameter estimation. A change in could be converted to a change in posterior error on a parameter proposed in the literature like [22] that includes information on the equation of state. This would permit a more quantitative comparison between proposed gains in to proposed losses in .
Although this work was carried out in the context of the AdV+ phase II upgrades, the methods used would be useful to future optimization studies, such as fine-tuning the sensitivity for future gravitational-wave detectors like Einstein Telescope [23] and Cosmic Explorer [24]. In the context of these detectors, that are expected to extract PM features, a study of this kind would be highly informative to compare the risks and gains of each optical design.
Author Contributions
Investigation, J.B. and M.B.; writing—original draft preparation, J.B.; writing—review and editing, J.B. and M.B. All authors have read and agreed to the published version of the manuscript.
Funding
J.B. supported by the European Gravitational Observatory.
Acknowledgments
The authors acknowledge the useful feedback and discussions with Eleonora Capocasa, Jérôme Degallaix, Sebastian Steinlechner, Gianluca Gemme, Alessio Rocchi, Eric Chassande-Mottin, Simone Mastrogiovanni and the developers of the advGWINC code. The authors also acknowledge the useful work by Breschi et al. and the helpful communications in developing a dedicated PM waveform module within advGWINC.
Conflicts of Interest
The authors declare no conflict of interest. The funders had no role in the design of the study; in the collection, analyses, or interpretation of data; in the writing of the manuscript, or in the decision to publish the results.
Abbreviations
The following abbreviations are used in this manuscript:
| ITF | Interferometer |
| AdV | Advanced Virgo |
| AdV+ | Advanced Virgo+ |
| QN | quantum noise |
| IM | input mirror |
| EM | end mirror |
| PRM | power recycling mirror |
| SRM | signal recycling mirror |
| PRC | power recycling cavity |
| input mirror transmittance | |
| power recycling mirror transmittance | |
| signal recycling mirror transmittance | |
| PM | post-merger |
| IMR | inspiral-merger-ringdown |
| BNS | binary neutron star |
| SNR | signal to noise ratio |
| RTL | round trip losses |
| BNS IMR range | |
| BNS PM SNR | |
| GW | gravitational wave |
| RoC | radius of curvature |
Appendix A
Table A1.
Optimization results for six values of round trip losses for the two primary parameters and . Shown are the configurations for optimal (), maximum () within Mpc ( SNR) of the optimal primary parameter, and nominal configurations, where colours indicated correspond to curves plotted in Figure 5 and Figure 6 Also shown are the corresponding Finesse (F), power recycling gain (), PRC losses (), arm cavity power (), and power impinging on the beam splitter ().
References
- Abbott, B. et al. [LIGO Scientific Collaboration and Virgo Collaboration] Observation of gravitational waves from a binary black hole merger. Phys. Rev. Lett. 2016, 116, 061102. [Google Scholar] [CrossRef] [Scilit]
- Abbott, R. et al. [LIGO Scientific Collaboration and Virgo Collaboration] GWTC-2: Compact Binary Coalescences Observed by LIGO and Virgo During the First Half of the Third Observing Run. arXiv 2020, arXiv:2010.14527. [Google Scholar]
- Abbott, R. et al. [LIGO Scientific Collaboration and Virgo Collaboration] GW190412: Observation of a binary-black-hole coalescence with asymmetric masses. Phys. Rev. D 2020, 102, 043015. [Google Scholar] [CrossRef] [Scilit]
- Abbott, B. et al. [LIGO Scientific Collaboration and Virgo Collaboration] GW190425: Observation of a Compact Binary Coalescence with Total Mass ∼ 3.4 M⊙. Astrophys. J. Lett. 2020, 892, L3. [Google Scholar] [CrossRef] [Scilit]
- Abbott, R. et al. [LIGO Scientific Collaboration and Virgo Collaboration] GW190814: Gravitational Waves from the Coalescence of a 23 Solar Mass Black Hole with a 2.6 Solar Mass Compact Object. Astrophys. J. Lett. 2020, 896, L44. [Google Scholar] [CrossRef] [Scilit]
- Abbott, R. et al. [LIGO Scientific Collaboration and Virgo Collaboration] GW190521: A Binary Black Hole Merger with a Total Mass of 150 M⊙. Phys. Rev. Lett. 2020, 125, 101102. [Google Scholar] [CrossRef] [Scilit]
- Abbott, R. et al. [LIGO Scientific Collaboration and Virgo Collaboration] Properties and Astrophysical Implications of the 150 M⊙ Binary Black Hole Merger GW190521. Astrophys. J. Lett. 2020, 900, L13. [Google Scholar] [CrossRef] [Scilit]
- Acernese, F. et al. [Virgo Collaboration] Advanced Virgo: A second-generation interferometric gravitational wave detector. Class. Quant. Grav. 2015, 32, 024001. [Google Scholar] [CrossRef] [Scilit]
- Accadia, T. et al. [Virgo Collaboration] Virgo: A laser interferometer to detect gravitational waves. J. Instrum. 2012, 7, P03012. [Google Scholar]
- Abbott, B. et al. [KAGRA Collaboration, LIGO Scientific Collaboration and Virgo Collaboration] Prospects for observing and localizing gravitational-wave transients with Advanced LIGO, Advanced Virgo and KAGRA. Living Rev. Relativ. 2018, 21, 3. [Google Scholar] [CrossRef] [Scilit]
- Mizuno, J.; Strain, K.A.; Nelson, P.G.; Chen, J.M.; Schilling, R.; Rudiger, A.; Winkler, W.; Danzmann, K. Resonant sideband extraction: A new configuration for interferometric gravitational wave detectors. Phys. Lett. A 1993, 175, 273–276. [Google Scholar] [CrossRef] [Scilit]
- Barsotti, L.; Evans, M.; Fritschel, P. aLIGO ISC design study for low power operation. LIGO Tech. Note 2012, T1200128-v4. [Google Scholar]
- Gemme, G.; Bertolini, A.; Degallaix, J.; Eisenmann, M.; Was, M. SR Mirror Reflectivity Choice for O4. Intern. Opt. Study 2019. Available online: https://wiki.virgo-gw.eu/AdvancedVirgoPlus/SRmirrorReflectivity (accessed on 7 December 2020).
- Miller, J. On the inspiral range. LIGO Tech. Note 2016, LIGO-T1500491-v2. [Google Scholar]
- Khan, S.; Husa, S.; Hannam, M.; Ohme, F.; Purrer, M.; Forteza, X.J.; Bohe, A. Frequency-domain gravitational waves from nonprecessing black-hole binaries. II. A phenomenological model for the advanced detector era. Phys. Rev. D 2016, 93, 044007. [Google Scholar] [CrossRef] [Scilit]
- Sutton, P. A Rule of Thumb for the Detectability of Gravitational-Wave Bursts. arXiv 2013, arXiv:1304.0210. [Google Scholar]
- Adachi, M.; Kasai, M. An Analytical Approximation of the Luminosity Distance in Flat Cosmologies with a Cosmological Constant. Prog. Theor. Phys. 2012, 127, 145–152. [Google Scholar] [CrossRef] [Scilit]
- Shibata, M. Merger of binary neutron stars: Gravitational waves and electromagnetic counterparts. Nucl. Phys. 2016, 956, 225–232. [Google Scholar] [CrossRef] [Scilit]
- Chatziioannou, K.; Clark, J.A.; Bauswein, A.; Millhouse, M.; Littenberg, T.B.; Cornish, N. Inferring the post-merger gravitational wave emission from binary neutron star coalescences. Phys. Rev. D 2017, 96, 124035. [Google Scholar] [CrossRef] [Scilit]
- Breschi, M.; Bernuzzi, S.; Zappa, F.; Agathos, M.; Perego, A.; Radice, D.; Nagar, A. Kilohertz gravitational waves from binary neutron star remnants: Time-domain model and constraints on extreme matter. Phys. Rev. D 2019, 100, 104029. [Google Scholar] [CrossRef] [Scilit]
- Shabanat, E.; Bonche, P.; Haensel, P.; Meyer, J.; Schaeffer, R. Erratum to “A Skyrme parametrization from subnuclear to neutron star densities. (II): Nuclei far from stabilities” [Nucl. Phys. A 635 (1998) 231–256]. Nucl. Phys. A 1998, 643, 441. [Google Scholar]
- Tsang, K.; Dietrich, T.; Van Den Broeck, C. Modeling the postmerger gravitational wave signal and extracting binary properties from future binary neutron star detections. Phys. Rev. D 2019, 100, 044047. [Google Scholar] [CrossRef] [Scilit]
- Maggiore, M.; Van Den Broeck, C.; Bartolo, N.; Belgacem, E.; Bertacca, D.; Bizouard, M.A.; Branchesi, M.; Clesse, S.; Foffa, S.; Garcia-Bellido, J.; et al. Science case for the Einstein telescope. J. Cosmol. Astropart. Phys. 2020, 2020, 50. [Google Scholar] [CrossRef] [Scilit]
- Reitze, D.; Adhikari, R.X.; Ballmer, S.; Barish, B.; Barsotti, L.; Billingsley, G.; Brown, D.A.; Chen, Y.; Coyne, D.; Eisenstein, R.; et al. Cosmic Explorer: The U.S. Contribution to Gravitational-Wave Astronomy beyond LIGO. Bull. Am. Astron. Soc. 2019, 51, 35. [Google Scholar]
| 1. |

Publisher’s Note: MDPI stays neutral with regard to jurisdictional claims in published maps and institutional affiliations. |
© 2020 by the authors. Licensee MDPI, Basel, Switzerland. This article is an open access article distributed under the terms and conditions of the Creative Commons Attribution (CC BY) license (http://creativecommons.org/licenses/by/4.0/).