Article

H.E.S.S. Monitoring of PKS 2155-304 in 2015 and 2016

1
Institute of Nuclear Physics, Polish Academy of Sciences, PL-31342 Krakow, Poland
2
Institut für Theoretische Physik, Lehrstuhl IV: Weltraum und Astrophysik, Ruhr-Universität Bochum, D-44780 Bochum, Germany
3
Centre for Space Science, North-West University, Potchefstroom 2520, South Africa
4
Landessternwarte, Universität Heidelberg, Königstuhl, D-69117 Heidelberg, Germany
*
Author to whom correspondence should be addressed.
Galaxies 2019, 7(1), 21; https://doi.org/10.3390/galaxies7010021
Submission received: 24 November 2018 / Revised: 3 January 2019 / Accepted: 14 January 2019 / Published: 19 January 2019
(This article belongs to the Special Issue Monitoring the Non-Thermal Universe)

Abstract

:
PKS 2155-304 is one of the brightest blazar located in Southern Hemisphere, monitored with H.E.S.S. since the first light of the experiment. Here we report multiwavelength monitoring observations collected during the period of 2015–2016 with H.E.S.S., Fermi-LAT, Swift-XRT, Swift-UVOT, and ATOM. Two years of multiwavelength data with very good temporal coverage allowed to characterize broadband emission observed from the region of PKS 2155-304 and study potential multifrequency correlations. During the period of monitoring, PKS 2155-304 revealed complex multiwavelength variability with two outbursts characterized by completely different multiband properties. The 2015 activity of the blazar is characterized by a flare observed at all wavelengths studied. The broadband emission observed during the outburst is well correlated without any time lags. Contrary to 2015, in 2016, only orphan outburst in the optical and ultraviolet wavelengths was observed. Such an orphan activity is reported for the first time for the blazar PKS 2155-304.

1. Introduction

BL Lacertae (BL Lac) type objects and flat spectrum radio quasars (FSRQs) constitute a class of blazars. According to the unified scheme of active galactic nuclei (AGNs), blazars are AGNs that are characterized by jets pointing at small angles with respect to the line of sight [1]. The radiative energy output from these sources is highly dominated with Doppler-boosted nonthermal emission (e.g., [2]).
Blazars are sources that are known for their temporal variability, which can be observed at different wavelengths and on various timescales (see e.g., [3,4,5,6]). The spectral energy distribution (SED) of blazars, in the ν - ν F ν representation, is characterized by a double-humped structure. The low-energy bump in the SED is usually attributed to the synchrotron radiation of ultra-relativistic electrons accelerated within the jets. The high-energy bump is generally discussed in the context of different scenarios. In the most popular leptonic explanation, the second bump is interpreted as the inverse Compton radiation from the same population of relativistic electrons scattering the synchrotron photons (so-called Synchrotron Self Compton models; for details see e.g. [7,8]) or external photons from the accretion disc, broad lines region or dust (EC, External Compton model; for details see e.g., [9,10]). As alternative hadronic scenarios have been proposed (e.g., [11,12,13]).
The frequency of low energy peak in the blazars’ SED has been used as a parameter to divide these objects into subclasses of high-, intermediate- and low-energy peaked BL Lac objects: HBL, IBL, LBL, respectively [14,15]. In the case of HBL blazars, the synchrotron peak is located in the X-ray range, for IBL objects in the optical-UV range, and for LBL type blazars in the infrared regime [15].
The blazar PKS 2155-304 (redshift z = 0.116 ) is one of the brightest HBL type object, located in the Southern Hemisphere. Its strongly variable non-thermal emission was observed in different energy bands for already more than 40 years. The object was discovered in the radio frequencies as part of the Parkes survey [16], and later identified as a BL Lac type blazar [17].
Since 2004, in the very high energy γ -ray regime, PKS 2155-304 was frequently observed with the H.E.S.S. telescopes, and this resulted in the discovery of different activity states including low flux level and flaring activity of the object.
In July 2006, an exceptional γ -ray flare was detected with H.E.S.S. four telescopes. The outburst was characterized in the very high energy regime (VHE, E > 100 GeV) with fluxes 40 times the average flux, and flux doubling timescales of the order of a few minutes. Such an ultrafast variability requires very large Doppler factors of the jets and suggests that the observed variability is not directly connected to the central black hole instantaneous activity [18].
The second flaring event detected in PKS 2155-304 in July 2006 was observed during simultaneous MWL observations with H.E.S.S. and Chandra [19]. It revealed a strong correlation both in flux and spectrum, with no evidence of lags. However, during the decaying phase of the flare cubic relation between fluxes for X-ray and γ -ray fluxes has been observed. No universal optical–VHE correlations were found in the 2006 flaring data. Analysis of longterm VHE monitoring data including H.E.S.S. observations collected between 2004 and 2012 and Fermi-LAT observations taken between 2008 and 2012 showed that emission observed in the quiescent state of PKS 2155-304 is consistent with a log-normal spectral behavior [20].

2. Materials and Methods

2.1. VHE γ -Ray Observations with H.E.S.S.

The High Energy Stereoscopic System (H.E.S.S.) is an array of five Imaging Atmospheric Cherenkov Telescopes (IACTs), located in the Khomas Highland in Namibia. The observations are performed in the regime of very-high-energy γ rays (VHE, E > 100 GeV) (for details see [21]). Since 2012, the system consists of four 12 m telescopes, each with a mirror area of 108 m 2 , a fifth, larger telescope with a mirror area of 614 m 2 .
The blazar PKS 2155-304 was observed with the H.E.S.S. telescopes in 2015 and 2016 in 91 and 40 runs, respectively. This corresponds to 36 and 16.5 h of observations. The analysis was performed using ImPACT analysis chain [22] with the Loose Cuts configuration [21]. Similar results as those presented in the paper were obtained using an independent analysis chain (the Model Analysis, [23]).

2.2. HE γ -Ray Observations with Fermi-LAT

High energy γ -ray data (HE, E > 100 GeV) collected with the Fermi-LAT in the period of 1 January 2015, and 31 December 2016, have been analyzed using standard Fermi Science Tools (version v10r0p5) with P8R2_SOURCE_V6 instrument response functions [24]. The analysis was performed using all events in the energy range from 100 MeV to 300 GeV and zenith angles were limited to 90 degrees. The region of interest was constrained to have a size of 10 degree and be centered on the source. As an analysis method binned maximum-likelihood was applied with the Galactic diffuse background modeled using the gll_iem_v06 map cube, and the extragalactic diffuse and residual instrument backgrounds modeled jointly using the iso_P8R2_SOURCE_V6_v06 template [25].

2.3. X-ray and Ultraviolet Observations with Swift-XRT and Swift-UVOT

X-ray, optical and ultraviolet observations collected with Swift-XRT and Swift-UVOT, respectively with ObsID 00049686003-00049686005 were analysis. These ObsIDs correspond to all data collected in 2015–2016. In the case of X-ray observations, the analysis was performed using HEASOFT v.6.23 and for spectral fitting XSPEC v.12.9.1 was used. All data were binned in order to have at least 20 counts per bin and fitted using a single power-law model with a Galactic absorption value of 1.52 × 10 20 cm 2 [26] set as a fixed parameter.
In the case of optical/ultraviolet observations, instrumental magnitudes were calculated using uvotsource. A region of interest and was defined as a circle with a radius of 5 arcsec. Same size region, located close to the source region, but being uncontaminated with any signal from the nearby sources, was used in the case of background definition. The flux conversion factors were taken from [27]. The UVOT data were corrected for the influence of the Galactic extinction based on the model from [28] with the most recent recalibration by [29], using the Extinction Calculator from NED (NASA/IPAC EXTRAGALACTIC DATABASE).

2.4. Optical Observations with ATOM

In 2015–2016 PKS 2155-304 was also monitored with the 75 cm Automatic Telescope for Optical Monitoring (ATOM) located in Namibia at the H.E.S.S. site in B and R bands [30]. The magnitude of each observation was derived using differential photometry using six secondary standard stars located in the field of view of PKS 2155-304.
The magnitudes have been corrected against the Galactic extinction. For the spectral studies, ATOM data were also corrected for the contribution of the host galaxy, using the template of an elliptical galaxy provided by [31] and observations in Gunn filter i [32], with an assumed de Vaucouleurs profile of the starlight.

3. Results

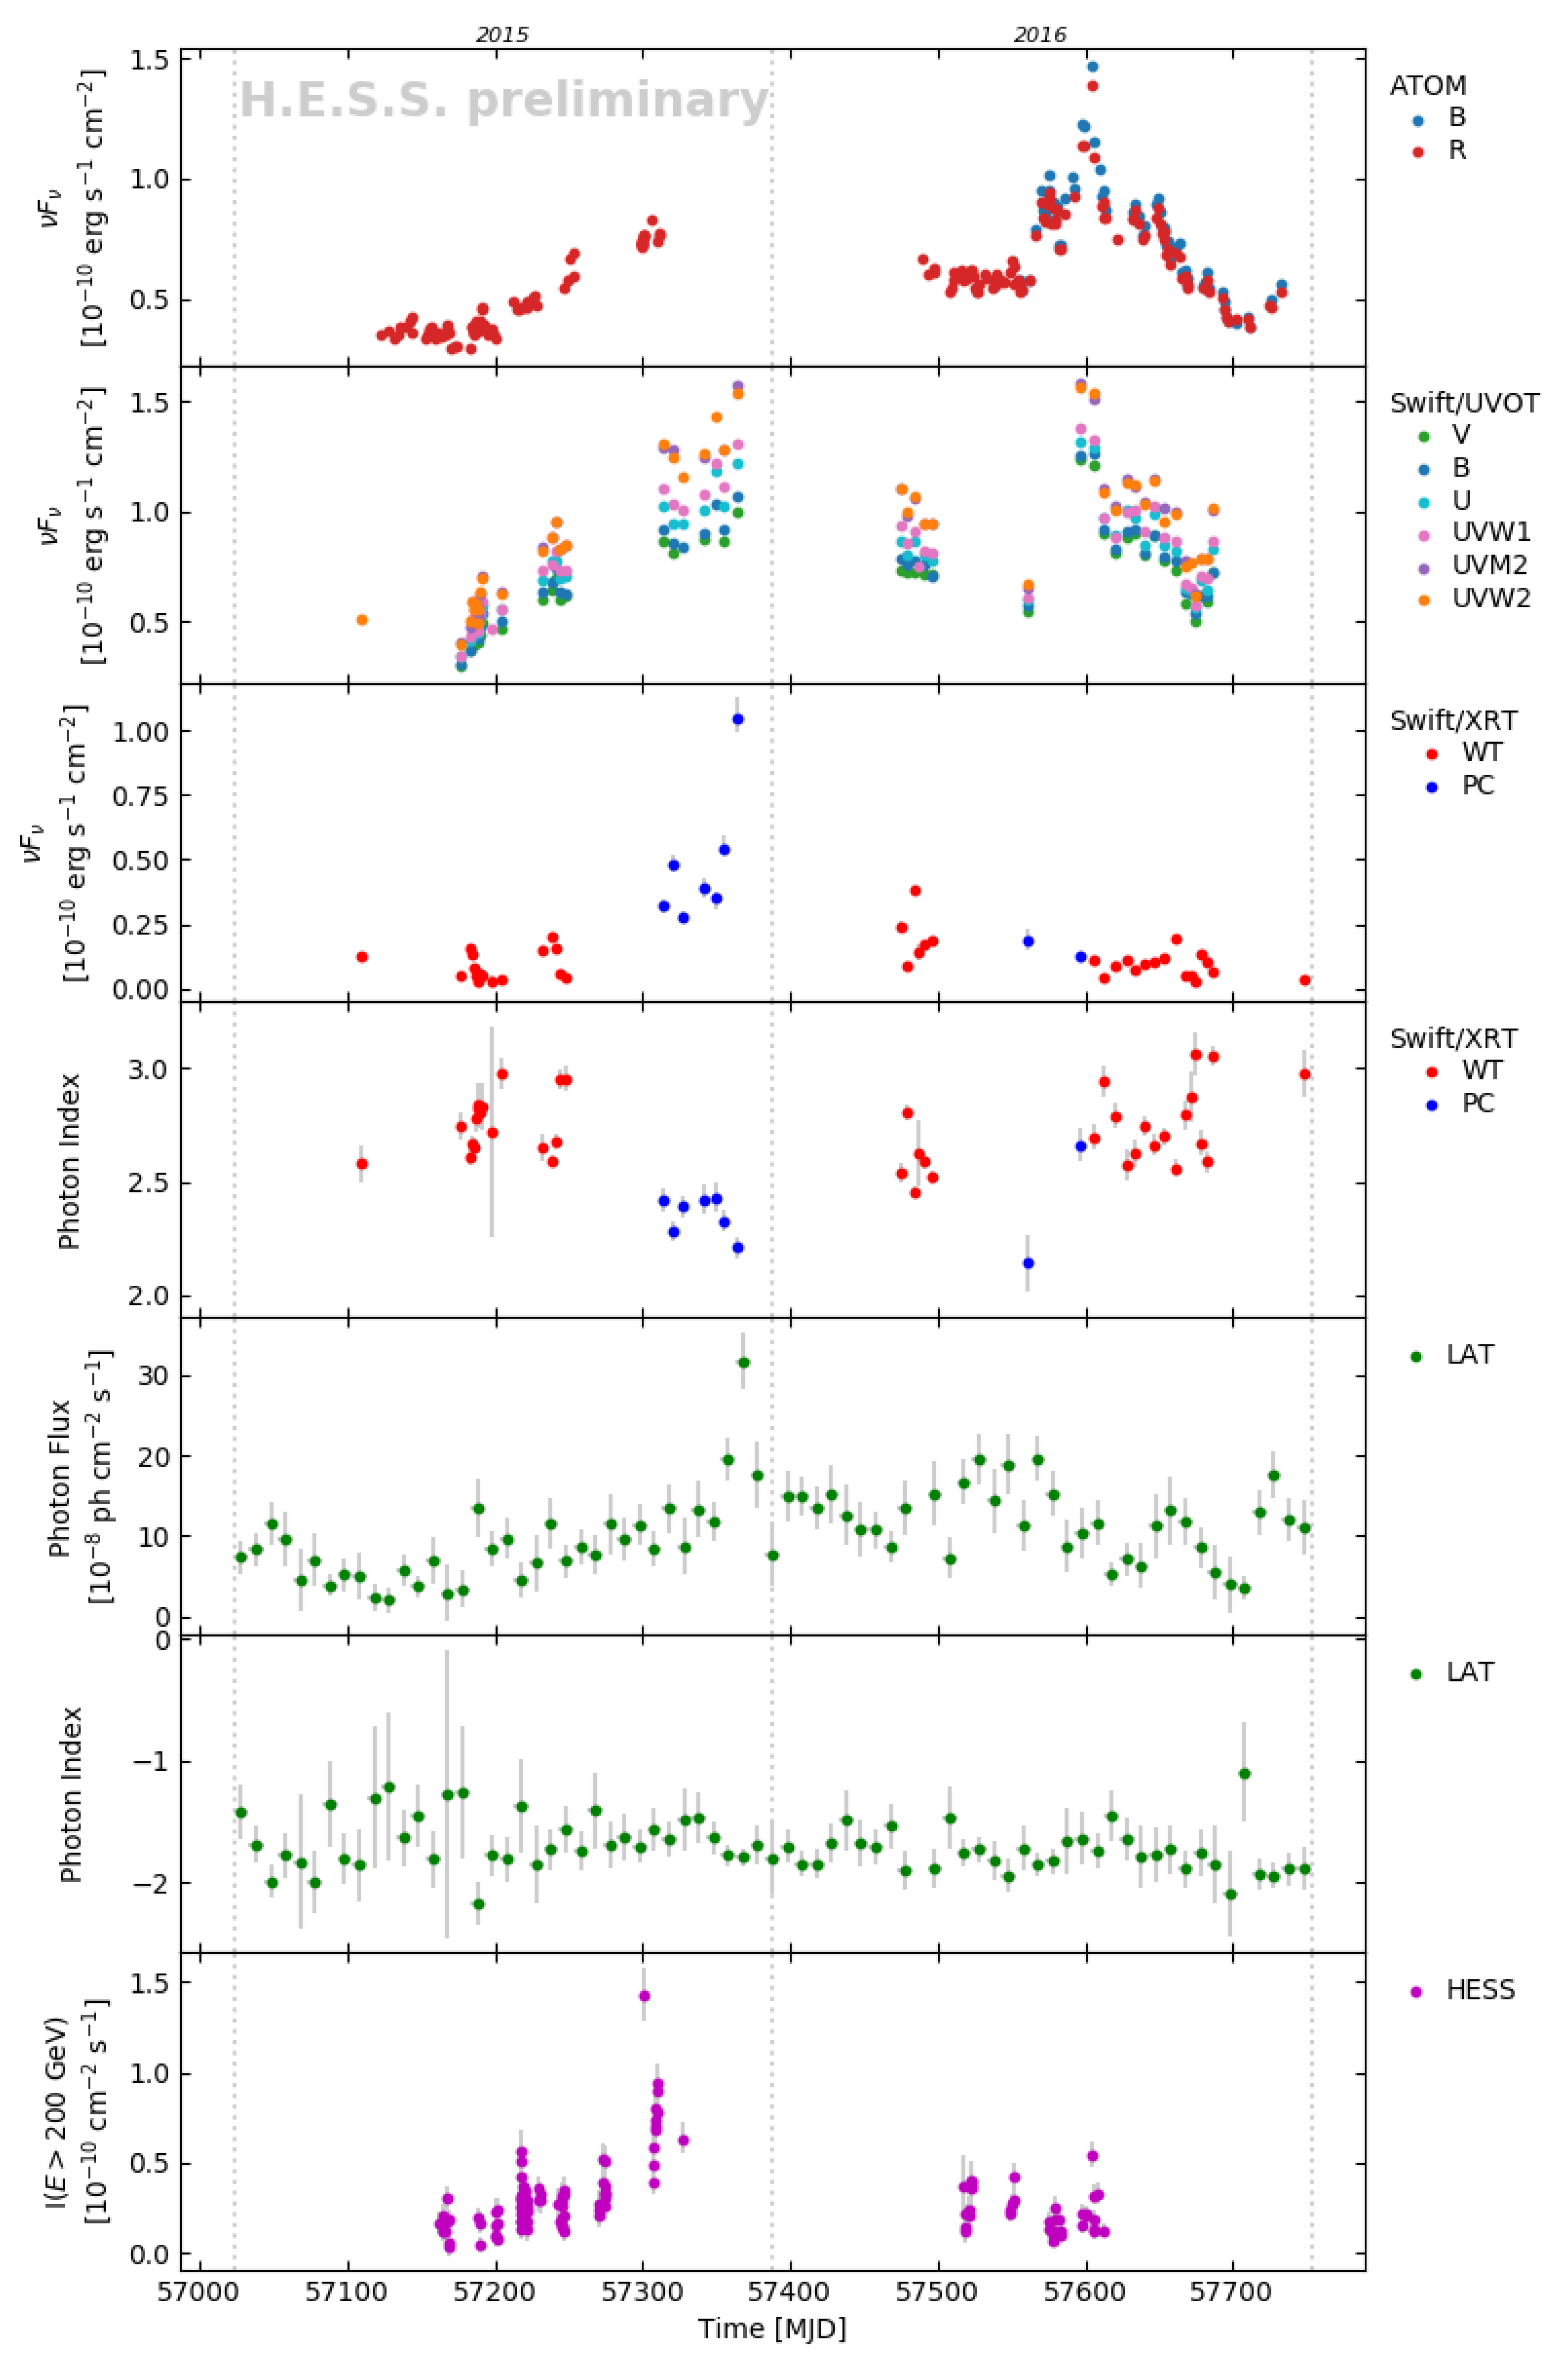
3.1. Longterm Variability
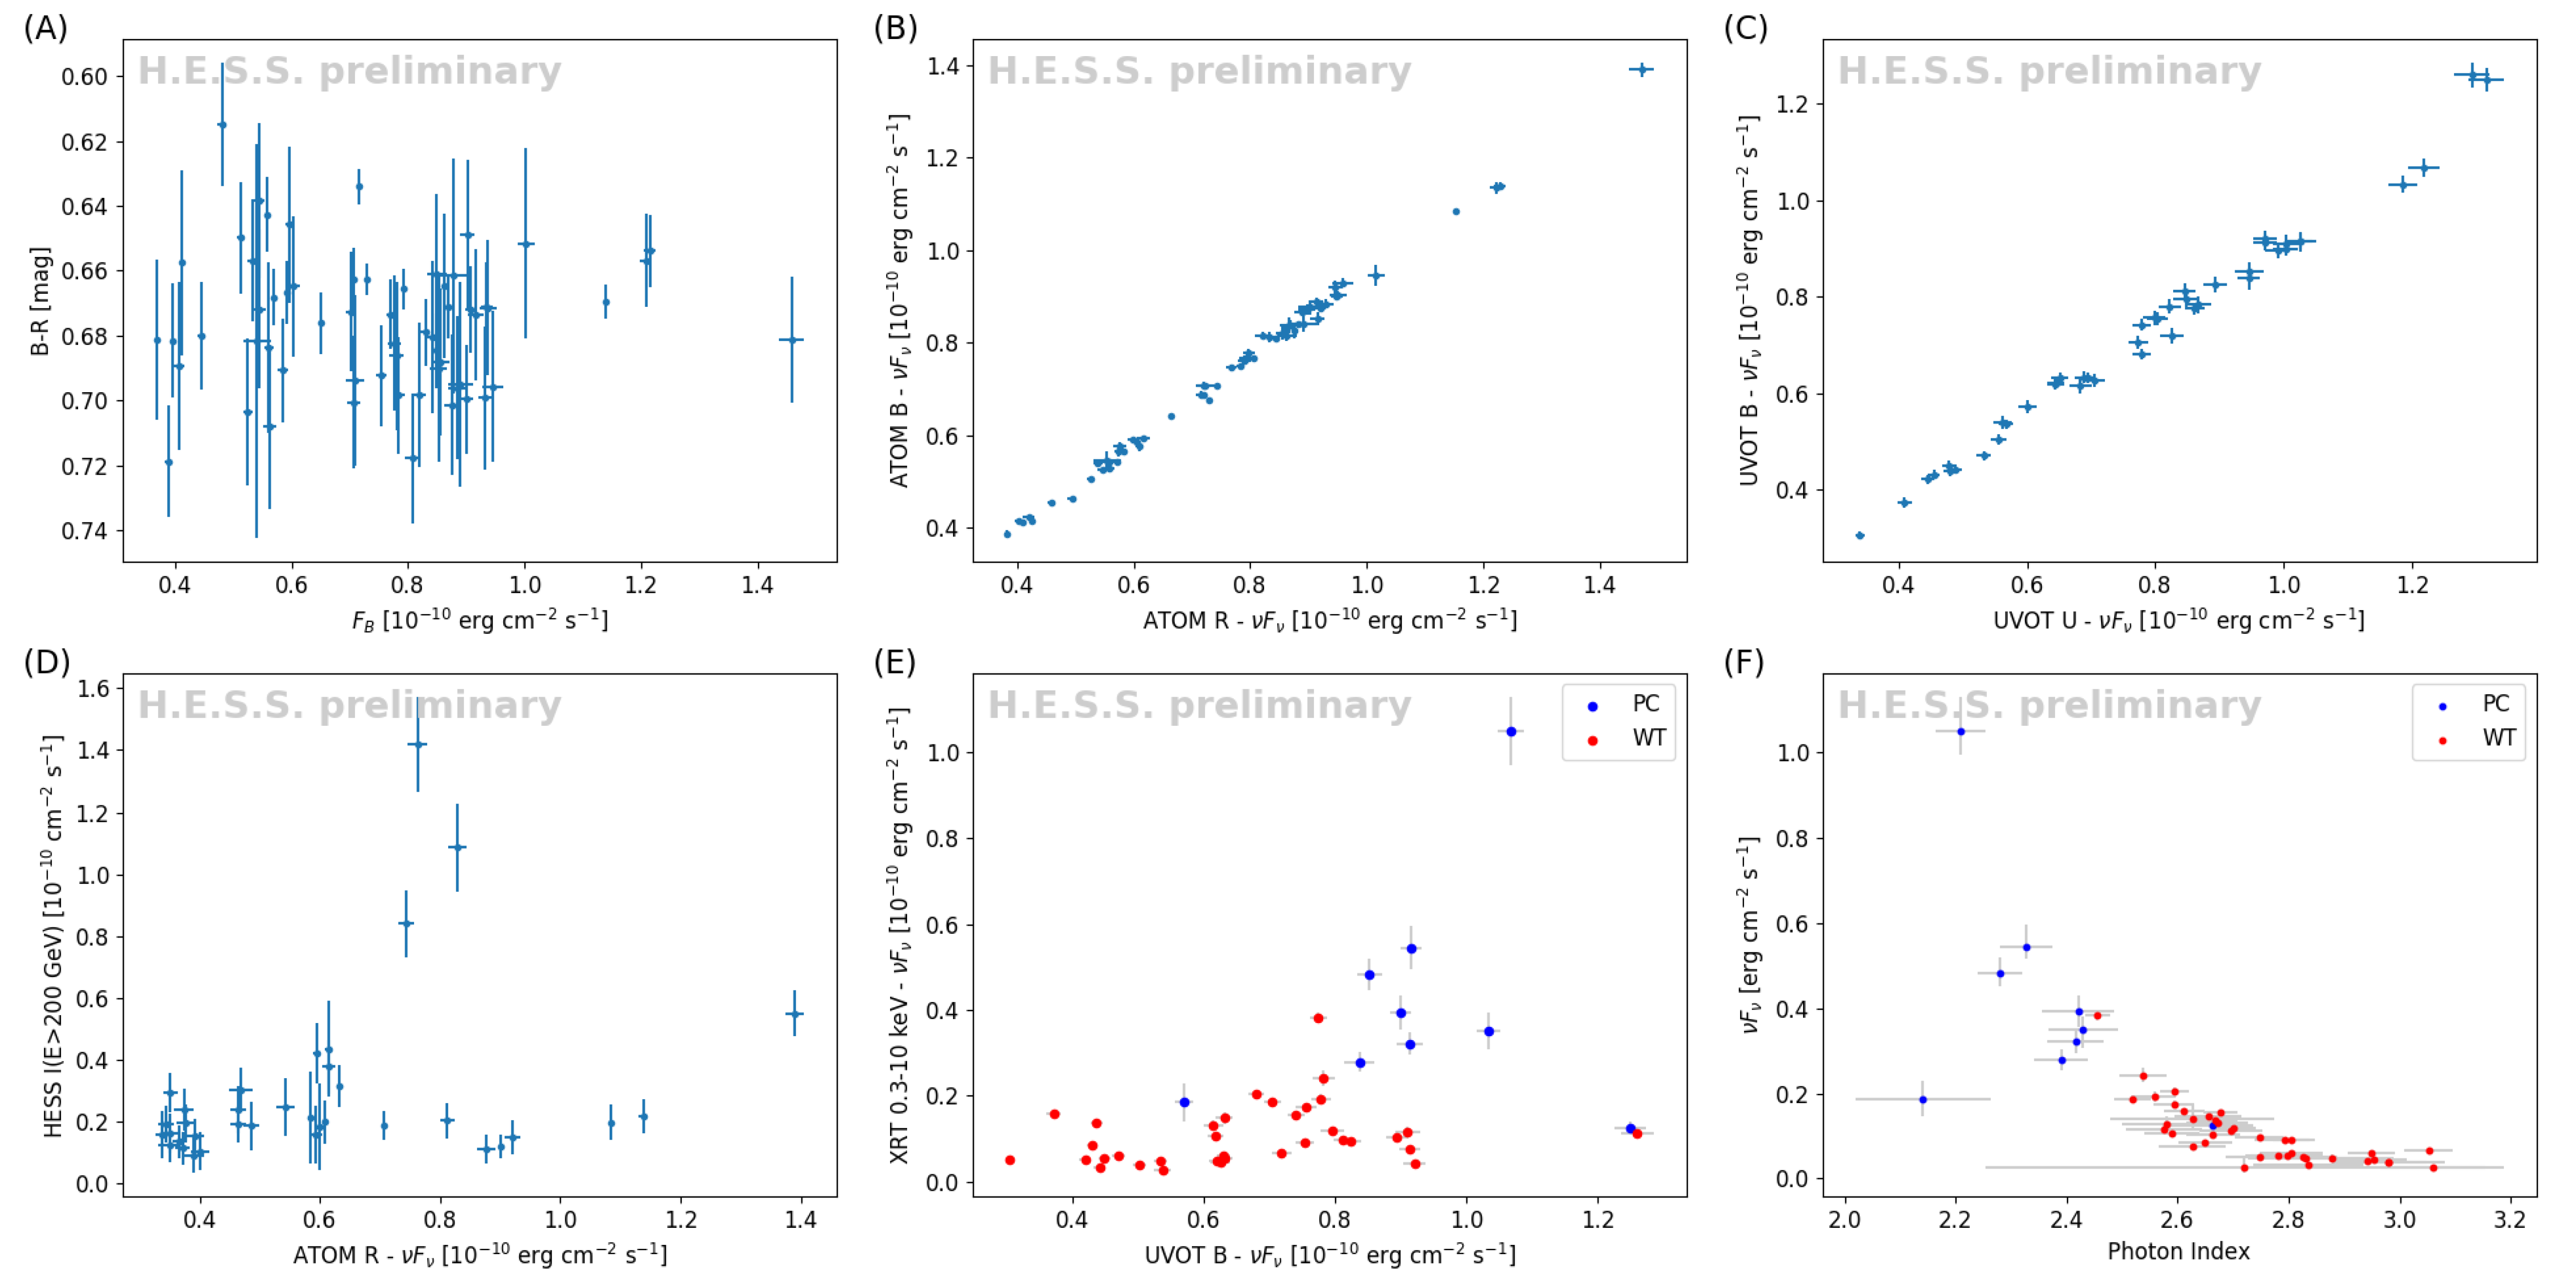
The longterm multiwavelength light curves presenting observations of PKS 2155-304 performed in 2015–2016 is shown in Figure 1. From top to bottom panels present: optical fluxes in B and R bands as observed with ATOM, optical and ultraviolet observations taken with Swift-UVOT, Swift-XRT flux and photon index, Fermi-LAT flux and photon index, and flux above 200 GeV observed with H.E.S.S. Fermi-LAT data are binned into 10-day intervals. In all other cases, 1-day bins are used. Significant variability of PKS 2155-304 is observed at all wavelengths. However, the trends visible in both years are different. In 2015, an increase of the flux observed at all wavelengths has been observed. In the VHE γ -ray regime the highest point in the light curve correspond to the flux of about 1.5 × 10 10 cm 2 s 1 , which is an equivalent to 3 times the flux observed from the direction of PKS 2155-304 during its quiescent state as defined in [20]. The larger increasing activity corresponds to constant Fermi-LAT photon index values and hardening of the X-ray photon flux observed with Swift-XRT. In 2016, there was also flaring activity observed in multiwavelength observations of PKS 2155-304, but in this case, the flare was detected only in an optical and ultraviolet regime. No counterpart either in X rays or in γ rays has been observed.
The multiwavelength data provide good coverage of both bumps in the SED of PKS 2155-304 both for 2015 and for 2016. To quantify the broadband variability, the fractional variability amplitude is used. It is defined following [33] as:
F v a r = S 2 σ e r r 2 < F > ,
where < F > is an average flux, S 2 is the variance, and σ e r r 2 is the square mean error. The resulting F v a r values for different instruments are listed in Table 1. The comparison of yearly variability quantified with F v a r , shows that the source was more variable in 2015 than 2016.

3.2. Correlations

The diagram shown in Figure 2A presents a color-magnitude diagram, i.e., B-R color vs. B band magnitude for all optical observation collected with ATOM in 2015–2016. Since the correlation coefficient for a linear fit to the data is 0.03, no color-flux relation can be claimed in the case of 2015–2016 monitoring of PKS 2155-304.
Panel B and C of the same plot show comparison optical (ultraviolet) fluxes of PKS 2155-304 for the same period of observations for ATOM and UVOT observations, respectively. For both cases, strong and significant correlation, with Pearson correlation coefficient of (0.98–0.99) ± <0.01. Errors of the Pearson correlation coefficients were estimated as described in [34].
The corresponding VHE γ -ray flux changes as a function of the B-band energy flux of the source are presented in the panel D of Figure 2. The correlation coefficient for the entire set of observations presented in the figure is 0.45. In the plot, two separate trends (branches) are visible. The lower one corresponds to the data collected during the orphan optical flare observed in 2015. We note here also that the plot includes less data than the light curve plot since not for all night simultaneously VHE and optical observation were taken.
Almost exact simultaneous monitoring that is performed within the X-ray and optical regimes with Swift instruments, provides perfect data for X-ray-optical correction studies. Such a comparison of the data studied in this paper is presented in Figure 2E. In the case of PKS 2155-304 both X-ray and optical emission is assigned to the low-energy bump in the broadband SED. Thus, the correlation between both bands can be expected. For the X-ray and optical observations of PKS 2155-304, as shown in Figure 2E, the correlation coefficient is 0.45. In the figure two branches are visible: one which follows positive correlation trend and the second, corresponding to the 2016 orphan optical flare and it is responsible for a lack of correlation.
The last panel (F) of Figure 2 presents a comparison of the X-ray flux and photon index. The trend visible in the plot, spectra harden with the increasing flux, provides evidence for a general harder-when-brighter behavior of the blazar. The correlation coefficient for the set of data presented is equal −0.75 ± 0.05.

4. Discussion and Summary

The extragalactic sky as seen in VHE γ rays (see e.g., tevcat.uchicago.edu) is dominated by blazars. This population counts about 60 objects. However, most of them have been observed very randomly and usually during the flaring state. There are only a few extragalactic targets that can be intensively monitored in the VHE γ rays and detected within the time of one observing run. One of such blazars is PKS 2155-304, which is monitored with H.E.S.S. since the beginning of its functionality. PKS 2155-304 is a unique blazar that can be significantly detected in the VHE regime within about 1 h of H.E.S.S. observations, depending on its states of activity. In addition, this makes PKS 2155-304 a perfect target for studies on long-term spectral and temporal variability.
During the last two decades, multiwavelength observational campaigns have become essential for studies on blazars’ nature. Despite several observations collected during this period, we have learned that observed patterns and correlations seemed to vary from object to object, and even for epoch to epoch in the case of one target (e.g., [35,36,37,38]). This is also the case for PKS 2155-304. Large set of observations including VHE γ -ray data, disclosed complex behavior of the blazar (e.g., [18,19,39,40]).
The monitoring of PKS 2155-304 performed in 2015–2016 also presents different facets of the source. The multiwavelength set of data revealed well correlated flaring activity observed in 2015. The presence of correlation between optical, ultraviolet X-ray and γ -ray regimes indicates that same physical process is responsible for the emission observed at all frequencies. During this period of observation, the harder-when-brighter trend was also found in the X-ray data. Such a behavior has been previously reported for several HBL type blazars including PKS 2155-304 [41,42,43].
The 2016 monitoring data exposed a completely different picture of the blazar. This was due to the orphan flare observed only in the optical and ultraviolet range. This optical isolated activity indicates that no obvious relation has been found between emission observed at different wavebands. We note here that orphan optical activity has been never reported for PKS 2155-304 before.
Studies of the optical observations of PKS 2155-304 collected in 2015–2016 with ATOM and Swift-UVOT reveal a strong and significant correlation between emission observed in different optical bands. Comparison of the optical color and optical flux do not exhibit bluer-when-brighter or redder-when-brighter relation. Previous optical observations of PKS 2155-304 have shown different behavior of the blazar in this regime. Lack of color-magnitude correlation according to 18 months of optical data taken with the Kanata telescope was reported [44]. Using the longterm ATOM monitoring performed during 792 nights in 2007–2012 the only weak bluer-when-brighter trend was noted in the entire dataset analyzed [45]. However, the authors pointed out two separate branches in the color-magnitude diagram, with a clear correlation visible in both components.
The H.E.S.S. monitoring data together with other wavelengths observations collected in 2015–2016 again demonstrated that PKS 2155-304 is multifaceted blazar. It is also the argument that simultaneous, multiwavelength monitoring and deep studied on variability behavior in blazars is the only tool to search for anomalous events and disclose the nature of these sources.

Author Contributions

A.W. was resposible for conceptualization and paper writing; A.W., M.Z., F.J., and S.W. provided instruments and softwares, data validation and analysis, and interpretation.

Funding

The support of the Namibian authorities and of the University of Namibia in facilitating the construction and operation of H.E.S.S. is gratefully acknowledged, as is the support by the German Ministry for Education and Research (BMBF), the Max Planck Society, the German Research Foundation (DFG), the Helmholtz Association, the Alexander von Humboldt Foundation, the French Ministry of Higher Education, Research and Innovation, the Centre National de la Recherche Scientifique (CNRS/IN2P3 and CNRS/INSU), the Commissariat à l’énergie atomique et aux énergies alternatives (CEA), the U.K. Science and Technology Facilities Council (STFC), the Knut and Alice Wallenberg Foundation, the National Science Centre, Poland grant no. 2016/22/M/ST9/00382, the South African Department of Science and Technology and National Research Foundation, the University of Namibia, the National Commission on Research, Science & Technology of Namibia (NCRST), the Austrian Federal Ministry of Education, Science and Research and the Austrian Science Fund (FWF), the Australian Research Council (ARC), the Japan Society for the Promotion of Science and by the University of Amsterdam. We appreciate the excellent work of the technical support staff in Berlin, Zeuthen, Heidelberg, Palaiseau, Paris, Saclay, Tübingen and in Namibia in the construction and operation of the equipment. This work benefited from services provided by the H.E.S.S. Virtual Organisation, supported by the national resource providers of the EGI Federation.

Conflicts of Interest

The authors declare no conflicts of interest.

References

  1. Urry, C.M.; Padovani, P. Unified Schemes for Radio-Loud Active Galactic Nuclei. Publ. Astron. Soc. Pac. 1995, 107, 803. [Google Scholar] [CrossRef] [Green Version]
  2. Begelman, M.C.; Blandford, R.D.; Rees, M.J. Theory of extragalactic radio sources. Rev. Mod. Phys. 1984, 56, 255–351. [Google Scholar] [CrossRef]
  3. Wagner, S. Multiwavelength observations of Blazars. In Astrophysics with All-Sky X-ray Observations; Proceedings of the RIKEN Symposium, 10–12 June 2008; RIKEN, and JAXA Suzuki Umetaro Hall, RIKEN Wako: Saitama, Japan, 2008; p. 186. [Google Scholar]
  4. Wierzcholska, A.; Siejkowski, H. Swift/XRT view of S5 0716+714 during a flare. Mon. Not. R. Astron. Soc. Lett. 2015, 452, L11–L15. [Google Scholar] [CrossRef]
  5. Siejkowski, H.; Wierzcholska, A. Characterizing long-term optical, ultraviolet and X-ray variability in different activity states of OJ 287. Mon. Not. R. Astron. Soc. Lett. 2017, 468, 426–434. [Google Scholar] [CrossRef]
  6. Wierzcholska, A.; Siejkowski, H. First hard X-ray observations of the blazar S5 0716+714 with NuSTAR during a multiwavelength campaign. Mon. Not. R. Astron. Soc. Lett. 2016, 458, 2350–2359. [Google Scholar] [CrossRef] [Green Version]
  7. Maraschi, L.; Ghisellini, G.; Celotti, A. A jet model for the gamma-ray emitting blazar 3C 279. Astrophys. J. 1992, 397, L5–L9. [Google Scholar] [CrossRef]
  8. Kirk, J.G.; Rieger, F.M.; Mastichiadis, A. Particle acceleration and synchrotron emission in blazar jets. Astron. Astrophys. 1998, 333, 452–458. [Google Scholar]
  9. Dermer, C.D.; Schlickeiser, R.; Mastichiadis, A. High-energy gamma radiation from extragalactic radio sources. Astron. Astrophys. 1992, 256, L27–L30. [Google Scholar]
  10. Sikora, M.; Begelman, M.C.; Rees, M.J. Comptonization of diffuse ambient radiation by a relativistic jet: The source of gamma rays from blazars? Astrophys. J. 1994, 421, 153–162. [Google Scholar] [CrossRef]
  11. Aharonian, F.A. TeV gamma rays from BL Lac objects due to synchrotron radiation of extremely high energy protons. New Astron. 2000, 5, 377–395. [Google Scholar] [CrossRef] [Green Version]
  12. Atoyan, A.M.; Dermer, C.D. Neutral Beams from Blazar Jets. Astrophys. J. 2003, 586, 79–96. [Google Scholar] [CrossRef] [Green Version]
  13. Böttcher, M.; Reimer, A.; Sweeney, K.; Prakash, A. Leptonic and Hadronic Modeling of Fermi-detected Blazars. Astrophys. J. 2013, 768, 54. [Google Scholar] [CrossRef]
  14. Fossati, G.; Maraschi, L.; Celotti, A.; Comastri, A.; Ghisellini, G. A unifying view of the spectral energy distributions of blazars. Mon. Not. R. Astron. Soc. Lett. 1998, 299, 433–448. [Google Scholar] [CrossRef] [Green Version]
  15. Abdo, A.A.; Ackermann, M.; Agudo, I.; Ajello, M.; Aller, H.D.; Aller, M.F.; Angelakis, E.; Arkharov, A.A.; Axelsson, M.; Bach, U.; et al. The Spectral Energy Distribution of Fermi Bright Blazars. Astrophys. J. 2010, 716, 30–70. [Google Scholar] [CrossRef]
  16. Shimmins, A.J.; Bolton, J.G. The Parkes 2700 MHz Survey (Sixth Part): Catalogue for the Declination zone −30° to −35°. Australian J. Phys. Astrophys. Suppl. 1974, 32, 1. [Google Scholar] [CrossRef]
  17. Hewitt, A.; Burbidge, G. A revised optical catalog of quasi-stellar objects. Astrophys. J. Suppl. Ser. 1980, 43, 57–158. [Google Scholar] [CrossRef]
  18. Aharonian, F.; Akhperjanian, A.G.; Bazer-Bachi, A.R.; Behera, B.; Beilicke, M.; Benbow, W.; Berge, D.; Bernlöhr, K.; Boisson, C.; Bolz, O.; et al. An Exceptional Very High Energy Gamma-Ray Flare of PKS 2155-304. Astrophys. J. 2007, 664, L71–L74. [Google Scholar] [CrossRef] [Green Version]
  19. Aharonian, F.; Akhperjanian, A.G.; Anton, G.; Barres de Almeida, U.; Bazer-Bachi, A.R.; Becherini, Y.; Behera, B.; Benbow, W.; Bernlöhr, K.; Boisson, C.; et al. Simultaneous multiwavelength observations of the second exceptional γ-ray flare of PKS 2155-304 in July 2006. Astron. Astrophys. 2009, 502, 749–770. [Google Scholar] [CrossRef]
  20. H.E.S.S. Collaboration; Abdalla, H.; Abramowski, A.; Aharonian, F.; Ait Benkhali, F.; Akhperjanian, A.G.; Andersson, T.; Angüner, E.O.; Arrieta, M.; Aubert, P.; et al. Characterizing the γ-ray long-term variability of PKS 2155-304 with H.E.S.S. and Fermi-LAT. Astron. Astrophys. 2017, 598, A39. [Google Scholar] [CrossRef]
  21. Aharonian, F.; Akhperjanian, A.G.; Bazer-Bachi, A.R.; Beilicke, M.; Benbow, W.; Berge, D.; Bernlöhr, K.; Boisson, C.; Bolz, O.; Borrel, V.; et al. Observations of the Crab nebula with HESS. Astron. Astrophys. 2006, 457, 899–915. [Google Scholar] [CrossRef] [Green Version]
  22. Parsons, R.D.; Hinton, J.A. A Monte Carlo template based analysis for air-Cherenkov arrays. Astropart. Phys. 2014, 56, 26–34. [Google Scholar] [CrossRef] [Green Version]
  23. De Naurois, M.; Rolland, L. A high performance likelihood reconstruction of γ-rays for imaging atmospheric Cherenkov telescopes. Astropart. Phys. 2009, 32, 231–252. [Google Scholar] [CrossRef]
  24. Atwood, W.; Albert, A.; Baldini, L.; Tinivella, M.; Bregeon, J.; Pesce-Rollins, M.; Sgrò, C.; Bruel, P.; Charles, E.; Drlica-Wagner, A.; et al. Pass 8: Toward the Full Realization of the Fermi-LAT Scientific Potential. arXiv, 2013; arXiv:1303.3514. [Google Scholar]
  25. Mattox, J.R.; Bertsch, D.L.; Chiang, J.; Dingus, B.L.; Digel, S.W.; Esposito, J.A.; Fierro, J.M.; Hartman, R.C.; Hunter, S.D.; Kanbach, G.; et al. Likelihood Analysis of EGRET Data. Astrophys. J. 1996, 461, 396. [Google Scholar] [CrossRef]
  26. Kalberla, P.M.W.; Burton, W.B.; Hartmann, D.; Arnal, E.M.; Bajaja, E.; Morras, R.; Pöppel, W.G.L. The Leiden/Argentine/Bonn (LAB) Survey of Galactic HI. Final data release of the combined LDS and IAR surveys with improved stray-radiation corrections. Astron. Astrophys. 2005, 440, 775–782. [Google Scholar] [CrossRef]
  27. Poole, T.S.; Breeveld, A.A.; Page, M.J.; Landsman, W.; Holland, S.T.; Roming, P.; Kuin, N.P.M.; Brown, P.J.; Gronwall, C.; Hunsberger, S.; et al. Photometric calibration of the Swift ultraviolet/optical telescope. Mon. Not. R. Astron. Soc. Lett. 2008, 383, 627–645. [Google Scholar] [CrossRef]
  28. Schlegel, D.J.; Finkbeiner, D.P.; Davis, M. Maps of Dust Infrared Emission for Use in Estimation of Reddening and Cosmic Microwave Background Radiation Foregrounds. Astrophys. J. 1998, 500, 525–553. [Google Scholar] [CrossRef] [Green Version]
  29. Schlafly, E.F.; Finkbeiner, D.P. Measuring Reddening with Sloan Digital Sky Survey Stellar Spectra and Recalibrating SFD. Astrophys. J. 2011, 737, 103. [Google Scholar] [CrossRef]
  30. Hauser, M.; Möllenhoff, C.; Pühlhofer, G.; Wagner, S.J.; Hagen, H.J.; Knoll, M. ATOM—An Automatic Telescope for Optical Monitoring. Astron. Nachr. 2004, 325, 659. [Google Scholar] [CrossRef]
  31. Fukugita, M.; Shimasaku, K.; Ichikawa, T. Galaxy Colors in Various Photometric Band Systems. Publ. Astron. Soc. Pac. 1995, 107, 945. [Google Scholar] [CrossRef] [Green Version]
  32. Falomo, R.; Giraud, E.; Maraschi, L.; Melnick, J.; Tanzi, E.G.; Treves, A. On the nebulosity surrounding the BL Lacertae object PKS 2155-304. Astrophys. J. 1991, 380, L67–L69. [Google Scholar] [CrossRef]
  33. Vaughan, S.; Edelson, R.; Warwick, R.S.; Uttley, P. On characterizing the variability properties of X-ray light curves from active galaxies. Mon. Not. R. Astron. Soc. Lett. 2003, 345, 1271–1284. [Google Scholar] [CrossRef] [Green Version]
  34. Wierzcholska, A. Nine years of multi-frequency monitoring of the blazar PKS 0048-097: spectral and temporal variability. Astron. Astrophys. 2015, 580, A104. [Google Scholar] [CrossRef]
  35. Abdo, A.A.; Ackermann, M.; Ajello, M.; Axelsson, M.; Baldini, L.; Ballet, J.; Barbiellini, G.; Bastieri, D.; Baughman, B.M.; Bechtol, K.; et al. A change in the optical polarization associated with a γ-ray flare in the blazar 3C279. Nature 2010, 463, 919–923. [Google Scholar] [CrossRef] [PubMed]
  36. Rani, B.; Krichbaum, T.P.; Fuhrmann, L.; Böttcher, M.; Lott, B.; Aller, H.D.; Aller, M.F.; Angelakis, E.; Bach, U.; Bastieri, D.; et al. Radio to gamma-ray variability study of blazar S5 0716+714. Astron. Astrophys. 2013, 552, A11. [Google Scholar] [CrossRef]
  37. Chatterjee, R.; Nalewajko, K.; Myers, A.D. Implications of the Anomalous Outburst in the Blazar PKS 0208-512. Astrophys. J. 2013, 771, L25. [Google Scholar] [CrossRef]
  38. Ahnen, M.L.; Ansoldi, S.; Antonelli, L.A.; Arcaro, C.; Babić, A.; Banerjee, B.; Bangale, P.; Barres de Almeida, U.; Barrio, J.A.; Becerra González, J.; et al. The extreme HBL behaviour of Markarian 501 during 2012. arXiv, 2018; arXiv:1808.04300. [Google Scholar]
  39. Aharonian, F.; Akhperjanian, A.G.; Anton, G.; Barres de Almeida, U.; Bazer-Bachi, A.R.; Becherini, Y.; Behera, B.; Bernlöhr, K.; Boisson, C.; Bochow, A.; et al. Simultaneous Observations of PKS 2155-304 with HESS, Fermi, RXTE, and Atom: Spectral Energy Distributions and Variability in a Low State. Astrophys. J. 2009, 696, L150–L155. [Google Scholar] [CrossRef]
  40. H.E.S.S. Collaboration; Abramowski, A.; Aharonian, F.; Ait Benkhali, F.; Akhperjanian, A.G.; Angüner, E.O.; Backes, M.; Balenderan, S.; Balzer, A.; Barnacka, A.; et al. Long-term monitoring of PKS 2155-304 with ATOM and H.E.S.S.: investigation of optical/γ-ray correlations in different spectral states. Astron. Astrophys. 2014, 571, A39. [Google Scholar] [CrossRef]
  41. Zhang, Y.H.; Treves, A.; Celotti, A.; Qin, Y.P.; Bai, J.M. XMM-Newton View of PKS 2155-304: Characterizing the X-Ray Variability Properties with EPIC pn. Astrophys. J. 2005, 629, 686–699. [Google Scholar] [CrossRef]
  42. Zhang, Y.H.; Bai, J.M.; Zhang, S.N.; Treves, A.; Maraschi, L.; Celotti, A. Multiwavelength Observations of the BL Lacertae Object PKS 2155-304 with XMM-Newton. Astrophys. J. 2006, 651, 782–790. [Google Scholar] [CrossRef]
  43. Kapanadze, B.; Romano, P.; Vercellone, S.; Kapanadze, S. The X-ray behaviour of the high-energy peaked BL Lacertae source PKS 2155-304 in the 0.3–10 keV band. Mon. Not. R. Astron. Soc. Lett. 2014, 444, 1077–1094. [Google Scholar] [CrossRef]
  44. Ikejiri, Y.; Uemura, M.; Sasada, M.; Ito, R.; Yamanaka, M.; Sakimoto, K.; Arai, A.; Fukazawa, Y.; Ohsugi, T.; Kawabata, K.S.; et al. Photopolarimetric Monitoring of Blazars in the Optical and Near-Infrared Bands with the Kanata Telescope. I. Correlations between Flux, Color, and Polarization. Publ. Astron. Soc. Jpn. 2011, 63, 639–675. [Google Scholar] [CrossRef] [Green Version]
  45. Wierzcholska, A.; Ostrowski, M.; Stawarz, Ł.; Wagner, S.; Hauser, M. Longterm optical monitoring of bright BL Lacertae objects with ATOM: Spectral variability and multiwavelength correlations. Astron. Astrophys. 2015, 573, A69. [Google Scholar] [CrossRef]
Figure 1. Multiwavelength light curve of PKS 2155-304 presenting data collected in 2015–2016 with ATOM, Swift-UVOT, Swift-XRT, Fermi-LAT and H.E.S.S.
Galaxies 07 00021 g001
Figure 2. Comparisons of emission observed at different wavelengths. The following panels presents: (A): B−R color vs. the B-band energy flux. (B): Comparison of B and R fluxes as observed with ATOM. (C): Comparison of optical U and B fluxes as observed with UVOT. (D): VHE γ -ray photon flux of the source also as a function of the B-band energy flux. (E) Comparison of X-ray flux in the energy range of 0.3–10 keV and optical flux in B band as observed with Swift-XRT and Swift-UVOT, respectively. Different colors are used to denote PC (blue) and WT (red) mode X-ray observations. (F) X-ray flux in the energy range of 0.3–10 keV and corresponding photon index. Different colors are used to denote PC (blue) and WT (red) mode X-ray observations.
Galaxies 07 00021 g002
Table 1. Fractional variability amplitudes for H.E.S.S., Fermi-LAT, Swift-XRT, Swift-UVOT and ATOM observations of PKS 2155-304 collected in 2015 and 2016.
InstrumentF var , 2015 F var , 2016
H.E.S.S.0.68 ± 0.020.38 ± 0.05
LAT0.53 ± 0.050.25 ± 0.05
XRT1.14 ± 0.030.62 ± 0.02
UVOT (B)0.354 ± 0.0050.234 ± 0.004
ATOM (R)0.322 ± 0.0010.29 ± 0.01

