
Accuracy in Wrist-Worn, Sensor-Based Measurements of Heart Rate and Energy Expenditure in a Diverse Cohort

 , , ,
, , ,
Abstract
:1. Introduction
2. Methods
2.1. Devices
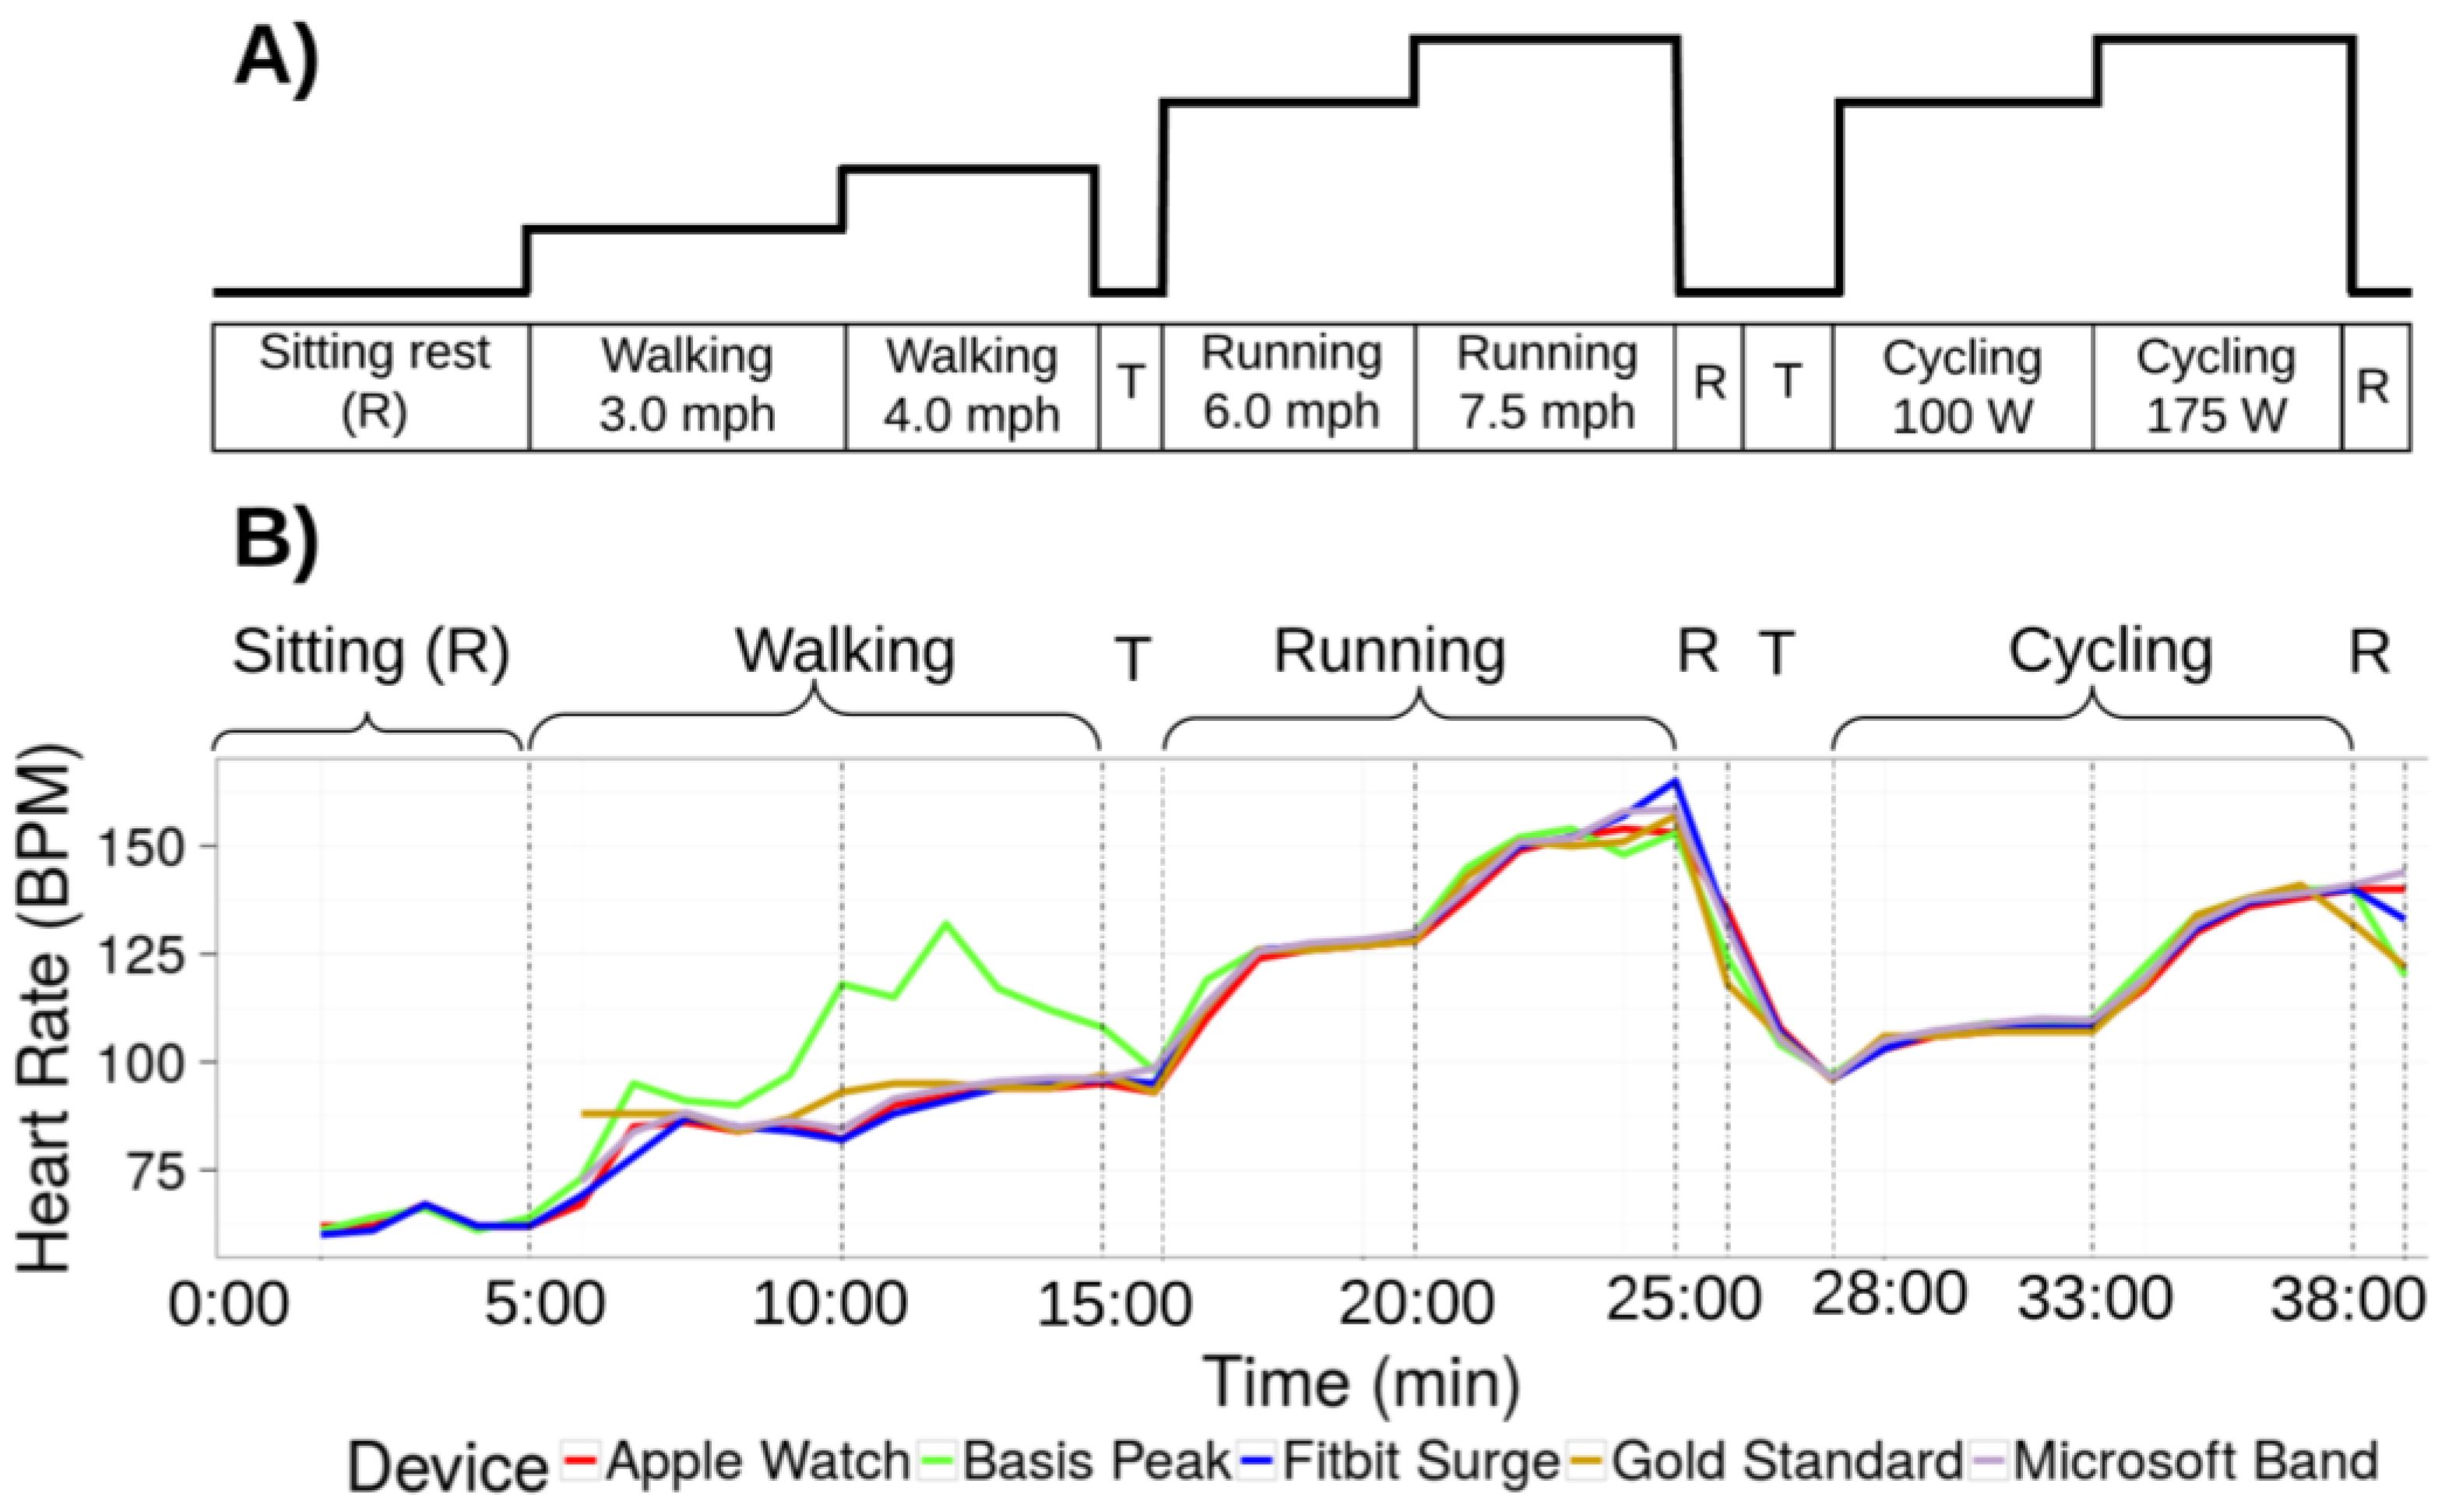
2.2. Protocol
2.3. Device Data Collection
2.3.1. Apple Watch
2.3.2. Basis Peak (Version 1)
2.3.3. Fitbit Surge
2.3.4. Microsoft Band (Version 1)
2.3.5. Mio Alpha 2
2.3.6. PulseOn
2.3.7. Samsung Gear S2
2.4. Statistical Analysis
2.5. Error
3. Results
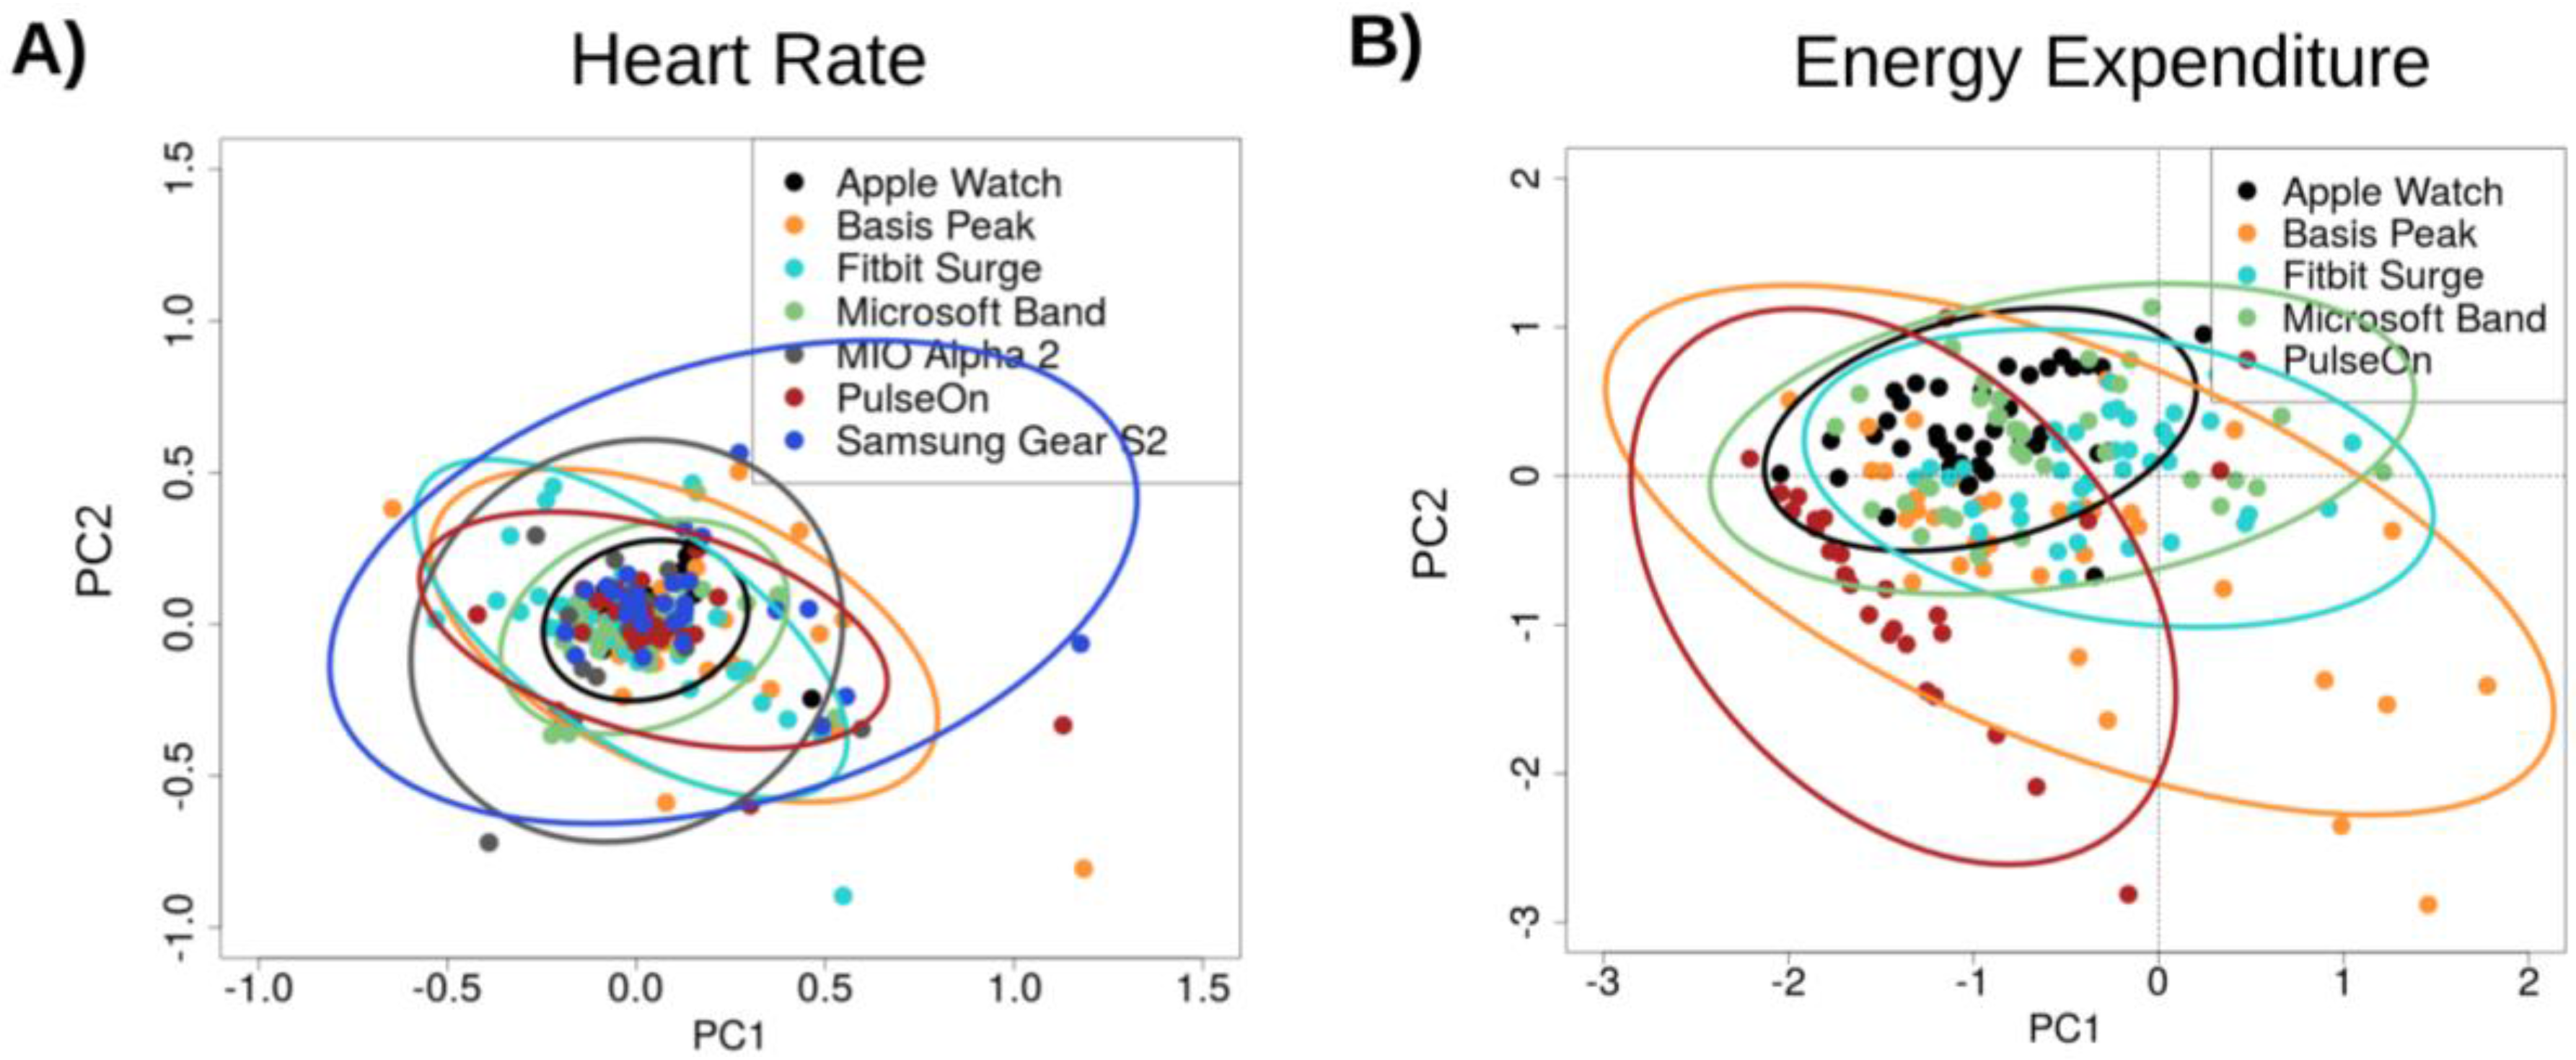
3.1. Heart Rate (HR)
3.2. Energy Expenditure (EE)
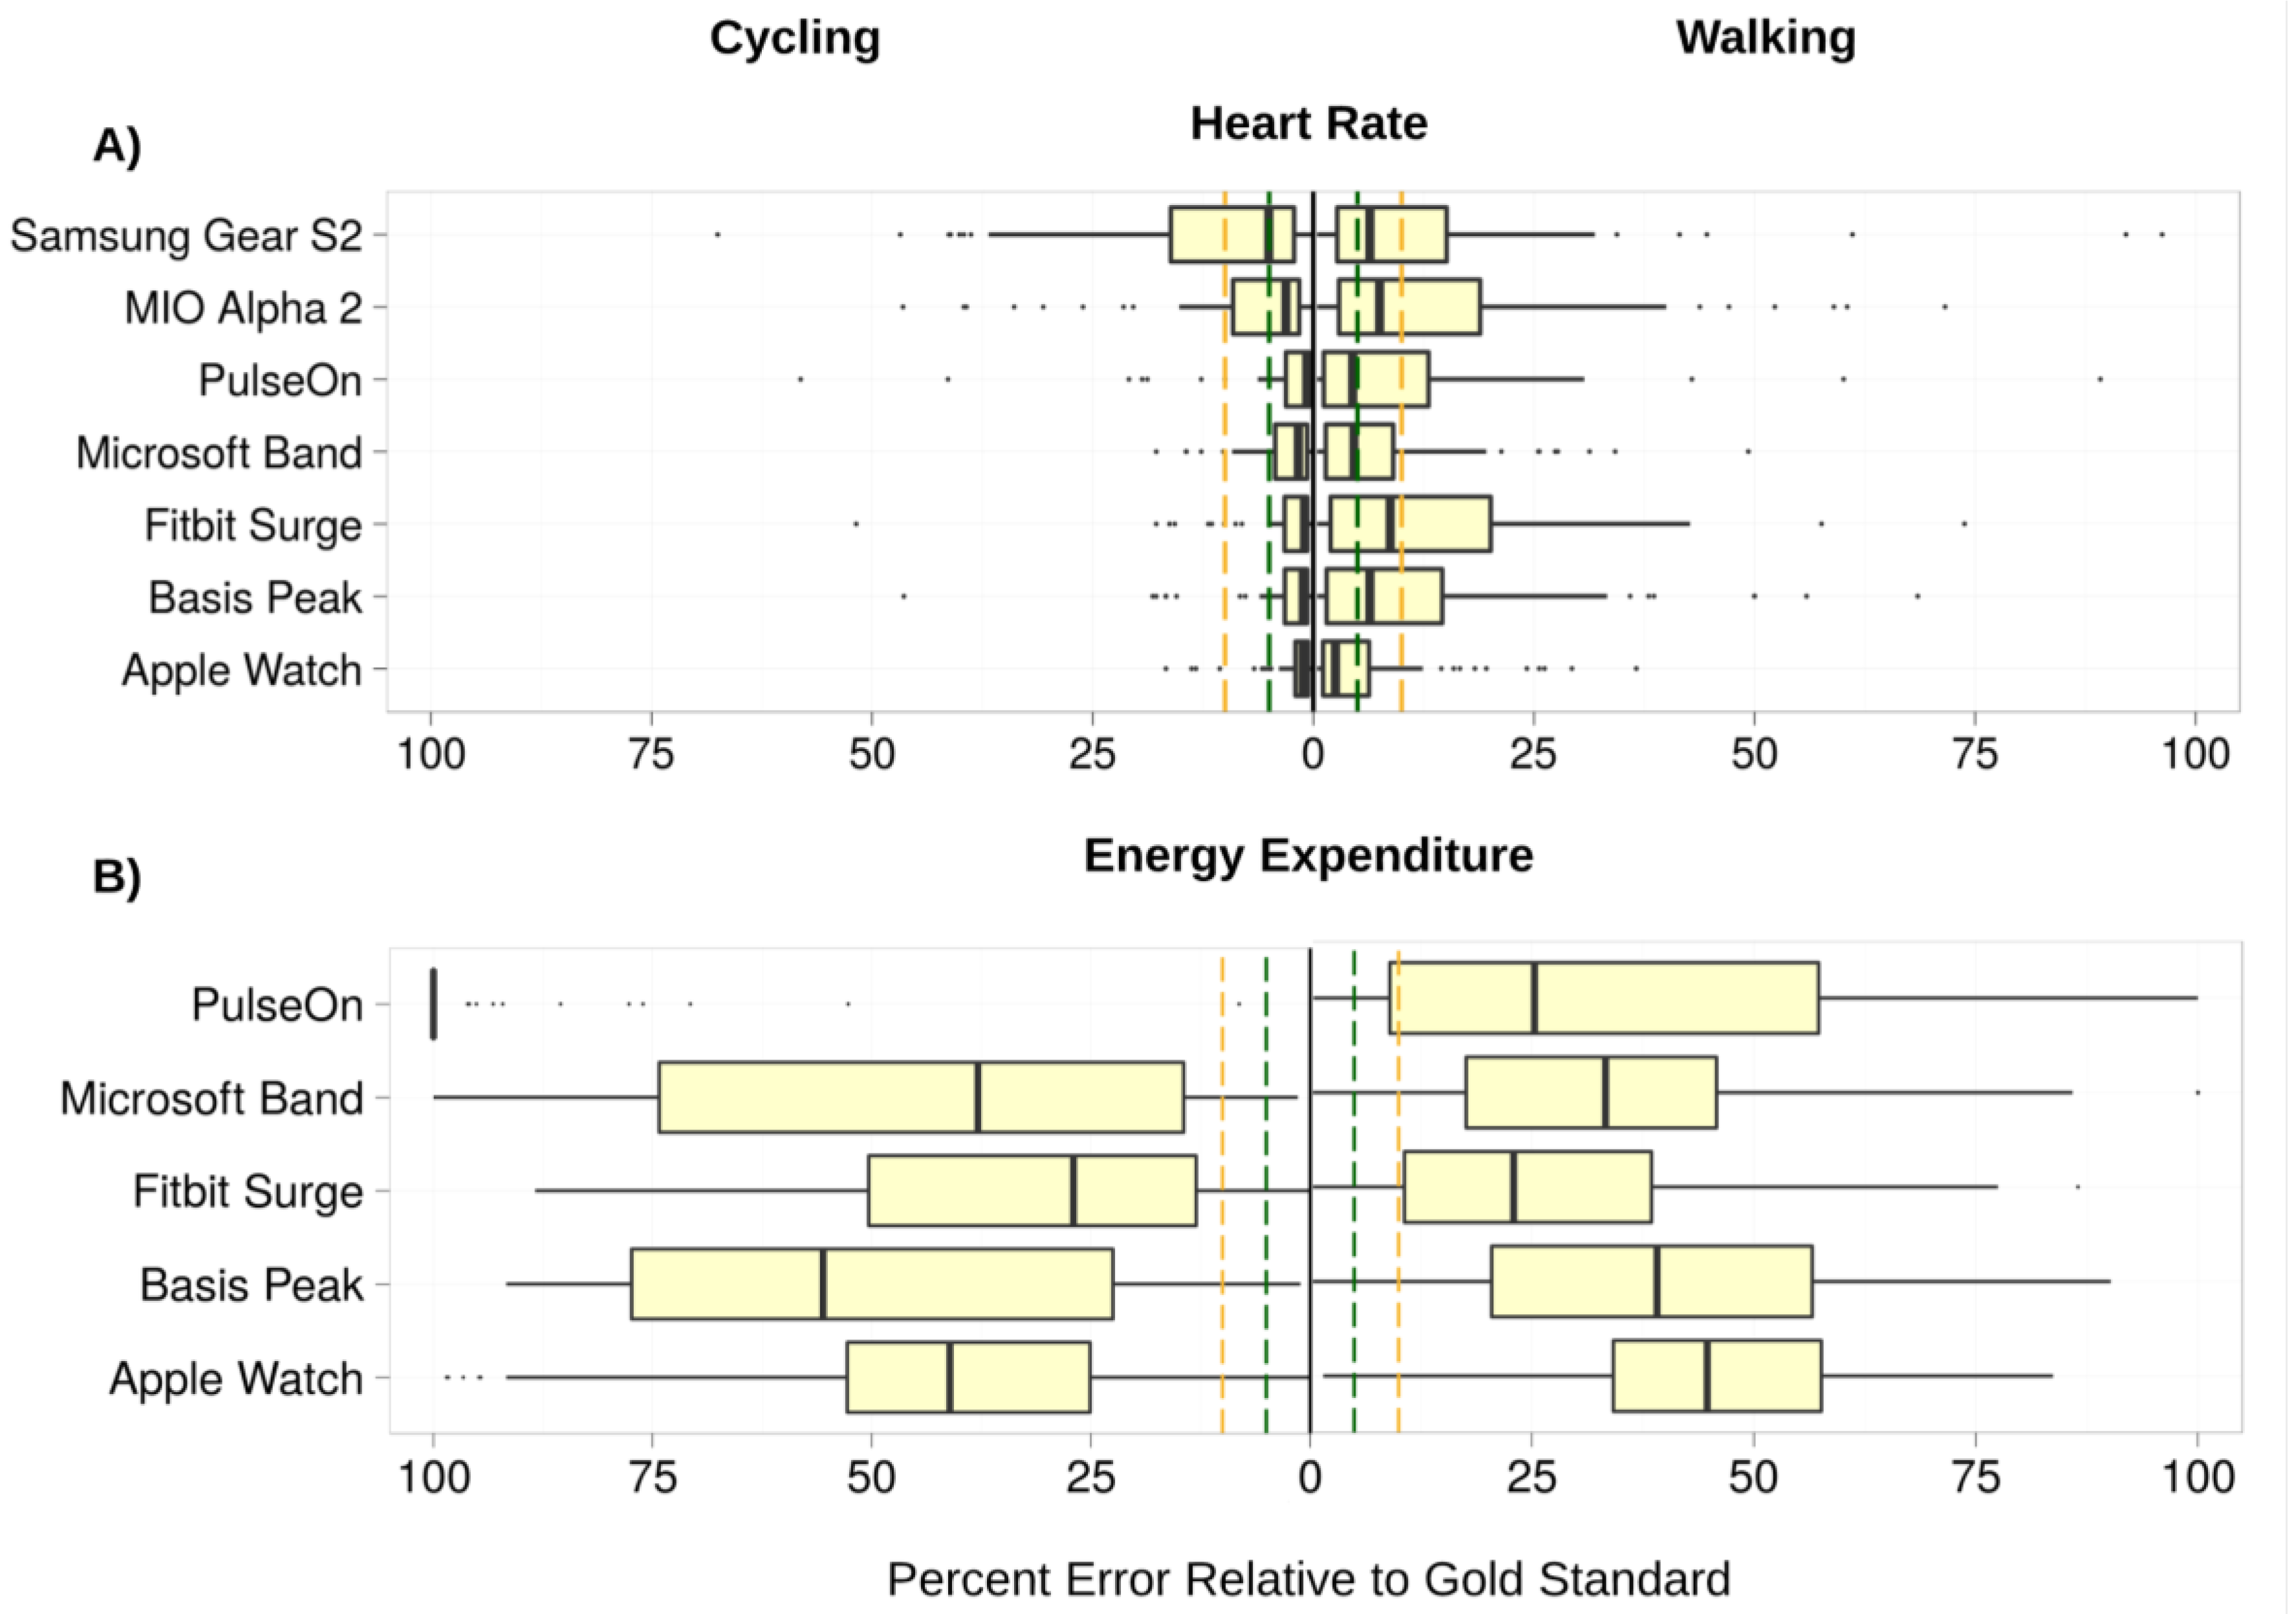
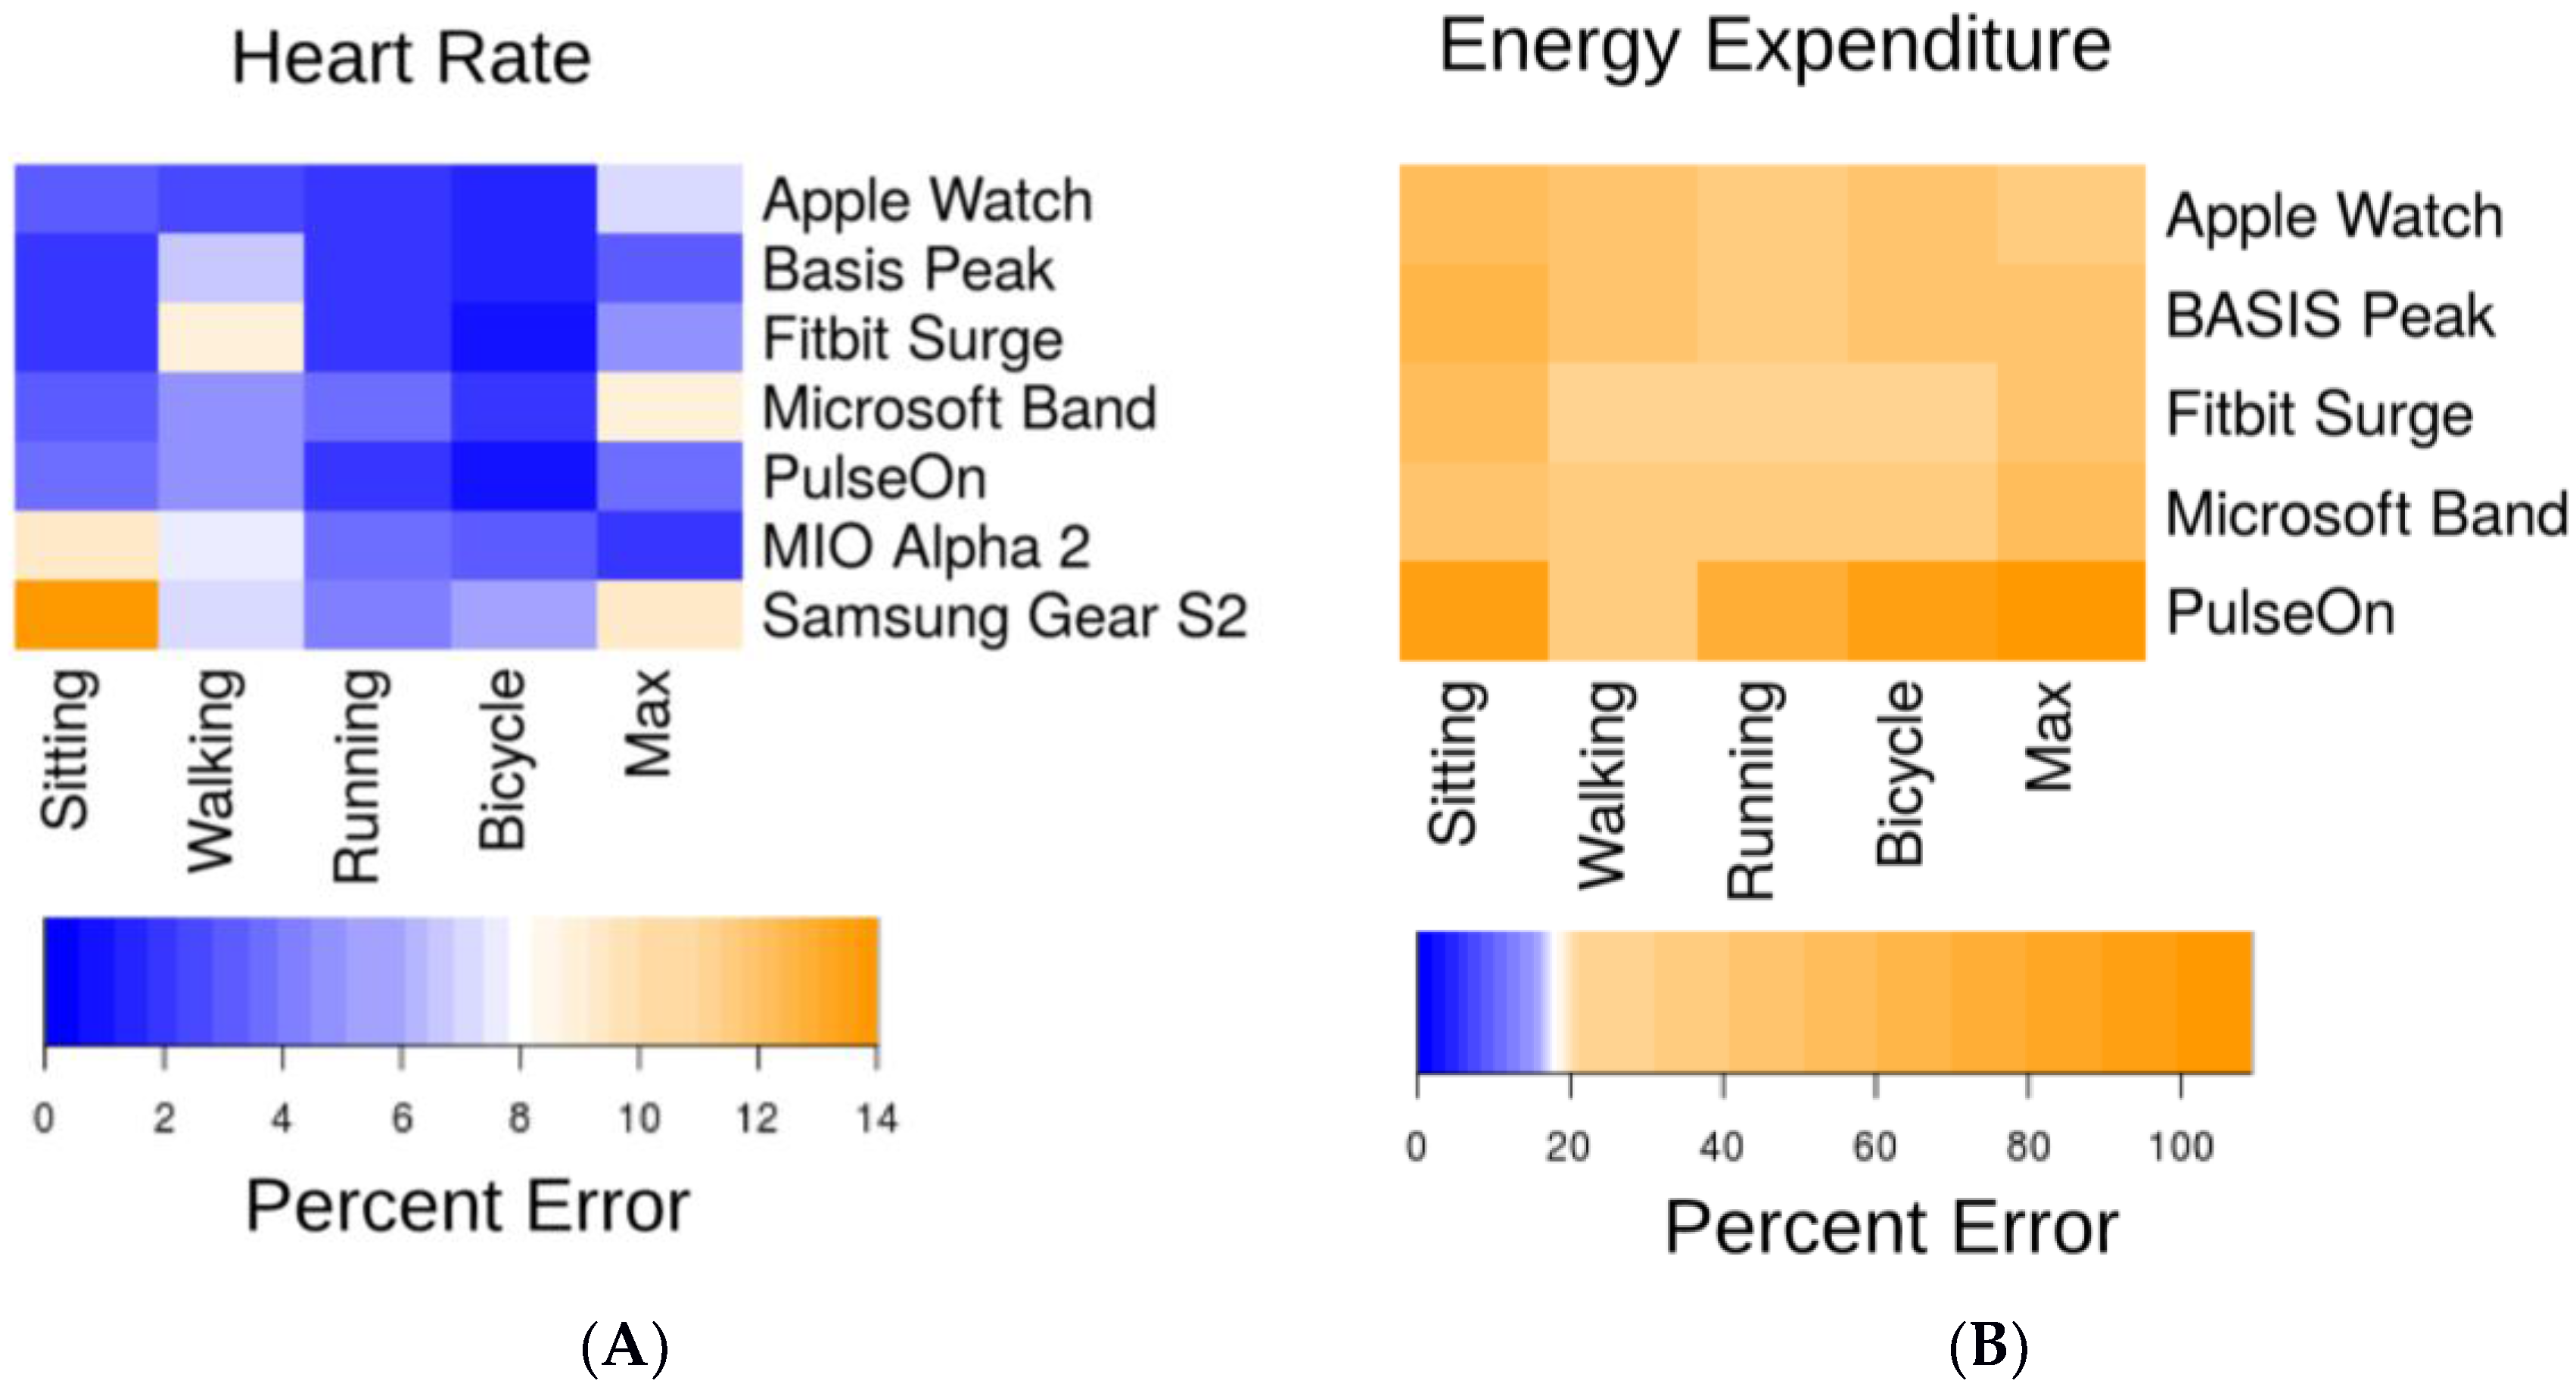
3.3. Error
3.4. Predictor Variable Associations with Heart Rate and Energy Expenditure Estimation Errors
4. Discussion
Limitations
5. Conclusions
Supplementary Materials
Author Contributions
Conflicts of Interest
References
- Hollis, J.F.; Gullion, C.M.; Stevens, V.J.; Brantley, P.J.; Appel, L.J.; Ard, J.D.; Laferriere, D. Weight Loss During the Intensive Intervention Phase of the Weight-Loss Maintenance Trial. Am. J. Prev. Med. 2008, 35, 118–126. [Google Scholar] [CrossRef] [PubMed]
- Zhang, Z.; Pi, Z.; Liu, B. TROIKA: A general framework for heart rate monitoring using wrist-type photoplethysmographic signals during intensive physical exercise. IEEE Trans. Biomed. Eng. 2015, 62, 522–531. [Google Scholar] [CrossRef] [PubMed]
- Brage, S.; Westgate, K.; Franks, P.W.; Stegle, O.; Wright, A.; Ekelund, U.; Wareham, N.J. Estimation of Free-Living Energy Expenditure by Heart Rate and Movement Sensing: A Doubly-Labelled Water Study. PLoS ONE 2015, 10, e0137206. [Google Scholar] [CrossRef] [PubMed]
- Schrack, J.A.; Zipunnikov, V.; Goldsmith, J.; Bandeen-Roche, K.; Crainiceanu, C.M.; Ferrucci, L. Estimating Energy Expenditure from Heart Rate in Older Adults: A Case for Calibration. PLoS ONE 2014, 9, e93520. [Google Scholar] [CrossRef] [PubMed]
- Zong, C.; Jafari, R. Robust heart rate estimation using wrist-based PPG signals in the presence of intense physical activities. In Proceedings of the 2015 37th Annual International Conference of the IEEE Engineering in Medicine and Biology Society (EMBC), Milan, Italy, 25–29 August 2015; pp. 8078–8082. Available online: ieeexplore.ieee.org (accessed on 23 May 2017).
- Hickey, A.M.; Freedson, P.S. Utility of Consumer Physical Activity Trackers as an Intervention Tool in Cardiovascular Disease Prevention and Treatment. Prog. Cardiovasc. Dis. 2016, 58, 613–619. [Google Scholar] [CrossRef] [PubMed]
- Temko, A. Estimation of heart rate from photoplethysmography during physical exercise using Wiener filtering and the phase vocoder. Conf. Proc. IEEE Eng. Med. Biol. Soc. 2015, 2015, 1500–1503. [Google Scholar] [PubMed]
- Waggott, D.; Bog, A.; Singh, E.; Batra, P.; Wright, M.; Ashley, E. The Next Generation Precision Medical Record—A Framework for Integrating Genomes and Wearable Sensors with Medical Records. Cold Spring Harbor Labs J. 2016. [Google Scholar] [CrossRef]
- Krebs, P.; Duncan, D.T. Health App Use among US Mobile Phone Owners: A National Survey. JMIR Mhealth Uhealth 2015, 3, e101. [Google Scholar] [CrossRef] [PubMed]
- Stanford Health Care Launches Custom Mobile App That Connects to Epic EHR and Lets Patients Manage Their Care on the Go. Available online: https://stanfordhealthcare.org/newsroom/articles/2015/myhealth-app-launch.html (accessed on 17 October 2016).
- Fitzpatrick, T.B. The validity and practicality of sun-reactive skin types I through VI. Arch. Dermatol. 1988, 124, 869–871. [Google Scholar] [CrossRef] [PubMed]
- Astrand, I. Aerobic work capacity in men and women with special reference to age. Acta Physiol. Scand. Suppl. 1960, 49, 1–92. [Google Scholar] [PubMed]
- Borg, G. Borg’s Perceived Exertion and Pain Scales, 1st ed.; Human Kinetics: Champaign, IL, USA, 1998. [Google Scholar]
- Fitbit Developer API. Available online: https://dev.fitbit.com/ (accessed on 3 April 2016).
- Mitmproxy—Home. Available online: http://mitmproxy.org/ (accessed on 3 April 2016).
- Jeff Huang Extracting My Data from the Microsoft Band. Available online: http://jeffhuang.com/extracting_my_data_from_the_microsoft_band.html (accessed on 3 April 2016).
- Rohatgi, A. WebPlotDigitizer. Available online: http://arohatgi.info/WebPlotDigitizer (accessed on 1 November 2015).
- R Core Team. R: A Language and Environment for Statistical Computing; R Foundation for Statistical Computing: Vienna, Austria, 2013. [Google Scholar]
- Hardin, J.W.; Hilbe, J.M. Generalized Estimating Equations: Introduction. In Wiley StatsRef: Statistics Reference Online; John Wiley & Sons, Ltd.: Chichester, UK, 2014; ISBN 9781118445112. [Google Scholar]
- Barton, K. Package “MuMIn: Multi-Model Inference”. CRAN. Available online: https://cran.r-project.org/web/packages/MuMIn/index.html (accessed on 3 April 2016).
- Lehnert, B. Package “BlandAltmanLeh.” CRAN. Available online: https://cran.r-project.org/web/packages/BlandAltmanLeh/BlandAltmanLeh.pdf (accessed on 15 October 2016).
- Rosenberger, M.E.; Buman, M.P.; Haskell, W.L.; McConnell, M.V.; Carstensen, L.L. 24 h of Sleep, Sedentary Behavior, and Physical Activity with Nine Wearable Devices. Med. Sci. Sports Exerc. 2015. [Google Scholar] [CrossRef]
- Wallen, M.P.; Gomersall, S.R.; Keating, S.E.; Wisløff, U.; Coombes, J.S. Accuracy of Heart Rate Watches: Implications for Weight Management. PLoS ONE 2016, 11, e0154420. [Google Scholar] [CrossRef] [PubMed]
- Glass, S.; Dwyer, G.B. American College of Sports Medicine. In ACSM’s Metabolic Calculations Handbook; Lippincott Williams & Wilkins: Philadelphia, PA, USA, 2007. [Google Scholar]
- Jo, E; Dolezal, B.A. Validation of the Fitbit® SurgeTM and Charge HRTM Fitness Trackers. Available online: http://www.lieffcabraser.com/pdf/Fitbit_Validation_Study.pdf (accessed on 1 February 2016).
- Leininger, L.J.; Cook, B.J. Validation and Accuracy of FITBIT Charge: A Pilot Study in a University Worksite Walking Program. J. Fit. 2016, 5, 3–9. [Google Scholar] [CrossRef]
- Silva, A.M.; Santos, D.A.; Matias, C.N.; Judice, P.B.; Magalhães, J.P.; Ekelund, U.; Sardinha, L.B. Accuracy of a combined heart rate and motion sensor for assessing energy expenditure in free-living adults during a double-blind crossover caffeine trial using doubly labeled water as the reference method. Eur. J. Clin. Nutr. 2015, 69, 20–27. [Google Scholar] [CrossRef] [PubMed]
- Preejith, S.P.; Alex, A.; Joseph, J.; Sivaprakasam, M. Design, development and clinical validation of a wrist-based optical heart rate monitor. In Proceedings of the 2016 IEEE International Symposium on Msedical Measurements and Applications (MeMeA), Benevento, Italy, 15–18 May 2016; pp. 1–6. Available online: ieeexplore.ieee.org (accessed on 23 May 2017).
- U.S. Food and Drug Administration. General Wellness: Policy for Low Risk Devices. Fed. Reg. 2016, 81, 49993–49995. [Google Scholar]


| Men (n = 29) | Women (n = 31) | |
|---|---|---|
| Age (years) | 40 (21–64, sd = 11.48) | 37 (23–57, sd = 9.77) |
| Body mass (kg) | 80.1 (53.9–130.6, sd = 13.25) | 61.7 (47.8–89.2, sd = 12.91) |
| Height (cm) | 179.0 (159.1–190.0, sd = 7.81) | 165.9 (154.4–184.2, sd = 7.90) |
| Body mass index (kg/m2) | 24.9 (20.7–39.3, sd = 3.46) | 22.4 (17.2–28.8, sd = 3.31) |
| Skin tone (scale 1–6) | 3.7 (1–5, sd = 1.39) | 3.7 (1–6, sd = 1.25) |
| Wrist circumference (cm) | 17.3 (16.0–21.0, sd = 1.11) | 15.4 (13.5–17.5, sd = 1.30) |
| VO2max (ml/kg/min) | 52.8 (38.2–66.6, sd = 8.48) | 45.3 (31.7–56.5, sd = 7.62) |
© 2017 by the authors. Licensee MDPI, Basel, Switzerland. This article is an open access article distributed under the terms and conditions of the Creative Commons Attribution (CC BY) license (http://creativecommons.org/licenses/by/4.0/).
Share and Cite
Shcherbina, A.; Mattsson, C.M.; Waggott, D.; Salisbury, H.; Christle, J.W.; Hastie, T.; Wheeler, M.T.; Ashley, E.A. Accuracy in Wrist-Worn, Sensor-Based Measurements of Heart Rate and Energy Expenditure in a Diverse Cohort. J. Pers. Med. 2017, 7, 3. https://doi.org/10.3390/jpm7020003
Shcherbina A, Mattsson CM, Waggott D, Salisbury H, Christle JW, Hastie T, Wheeler MT, Ashley EA. Accuracy in Wrist-Worn, Sensor-Based Measurements of Heart Rate and Energy Expenditure in a Diverse Cohort. Journal of Personalized Medicine. 2017; 7(2):3. https://doi.org/10.3390/jpm7020003
Chicago/Turabian StyleShcherbina, Anna, C. Mikael Mattsson, Daryl Waggott, Heidi Salisbury, Jeffrey W. Christle, Trevor Hastie, Matthew T. Wheeler, and Euan A. Ashley. 2017. "Accuracy in Wrist-Worn, Sensor-Based Measurements of Heart Rate and Energy Expenditure in a Diverse Cohort" Journal of Personalized Medicine 7, no. 2: 3. https://doi.org/10.3390/jpm7020003
APA StyleShcherbina, A., Mattsson, C. M., Waggott, D., Salisbury, H., Christle, J. W., Hastie, T., Wheeler, M. T., & Ashley, E. A. (2017). Accuracy in Wrist-Worn, Sensor-Based Measurements of Heart Rate and Energy Expenditure in a Diverse Cohort. Journal of Personalized Medicine, 7(2), 3. https://doi.org/10.3390/jpm7020003