Article

Utilizing Empirical Bayes Estimation to Assess Reliability in Inverted Exponentiated Rayleigh Distribution with Progressive Hybrid Censored Medical Data

1
Department of Mathematics and Statistics, Imam Mohammad Ibn Saud Islamic University (IMSIU), Riyadh 11432, Saudi Arabia
2
Mathematics and Computer Science Department, Faculty of Science, Beni-Suef University, Beni-Suef 62511, Egypt
3
Department of Mathematics, Faculty of Science, New Valley University, El-Khargah 72511, Egypt
*
Author to whom correspondence should be addressed.
Axioms 2023, 12(9), 872; https://doi.org/10.3390/axioms12090872
Submission received: 2 August 2023 / Revised: 5 September 2023 / Accepted: 6 September 2023 / Published: 11 September 2023

Abstract

:
This study addresses the issue of estimating the shape parameter of the inverted exponentiated Rayleigh distribution, along with the assessment of reliability and failure rate, by utilizing Type-I progressive hybrid censored data. The study explores the estimators based on maximum likelihood, Bayes, and empirical Bayes methodologies. Additionally, the study focuses on the development of Bayes and empirical Bayes estimators with balanced loss functions. A concrete example based on actual data from the field of medicine is used to illustrate the theoretical insights provided in this study. Monte Carlo simulations are employed to conduct numerical comparisons and evaluate the performance and accuracy of the estimation methods.

1. Introduction

In problems involving the modeling of failure processes and the analysis of experimental data, various statistical distributions are employed. Ghitany et al. [1] introduced the inverted exponentiated Rayleigh distribution (IER) distribution, a specific member of a larger class of inverse exponentiated distributions. The two-parameter IER( η , λ ) distribution has the probability density function (PDF)
f ( x ) = 2 η λ x 3 e λ / x 2 ( 1 e λ / x 2 ) η 1 , x > 0 , ( η , λ > 0 ) ,
and the cumulative distribution function (CDF)
F ( x ) = 1 ( 1 e λ / x 2 ) η , x > 0 , ( η , λ > 0 ) ,
where λ and η 
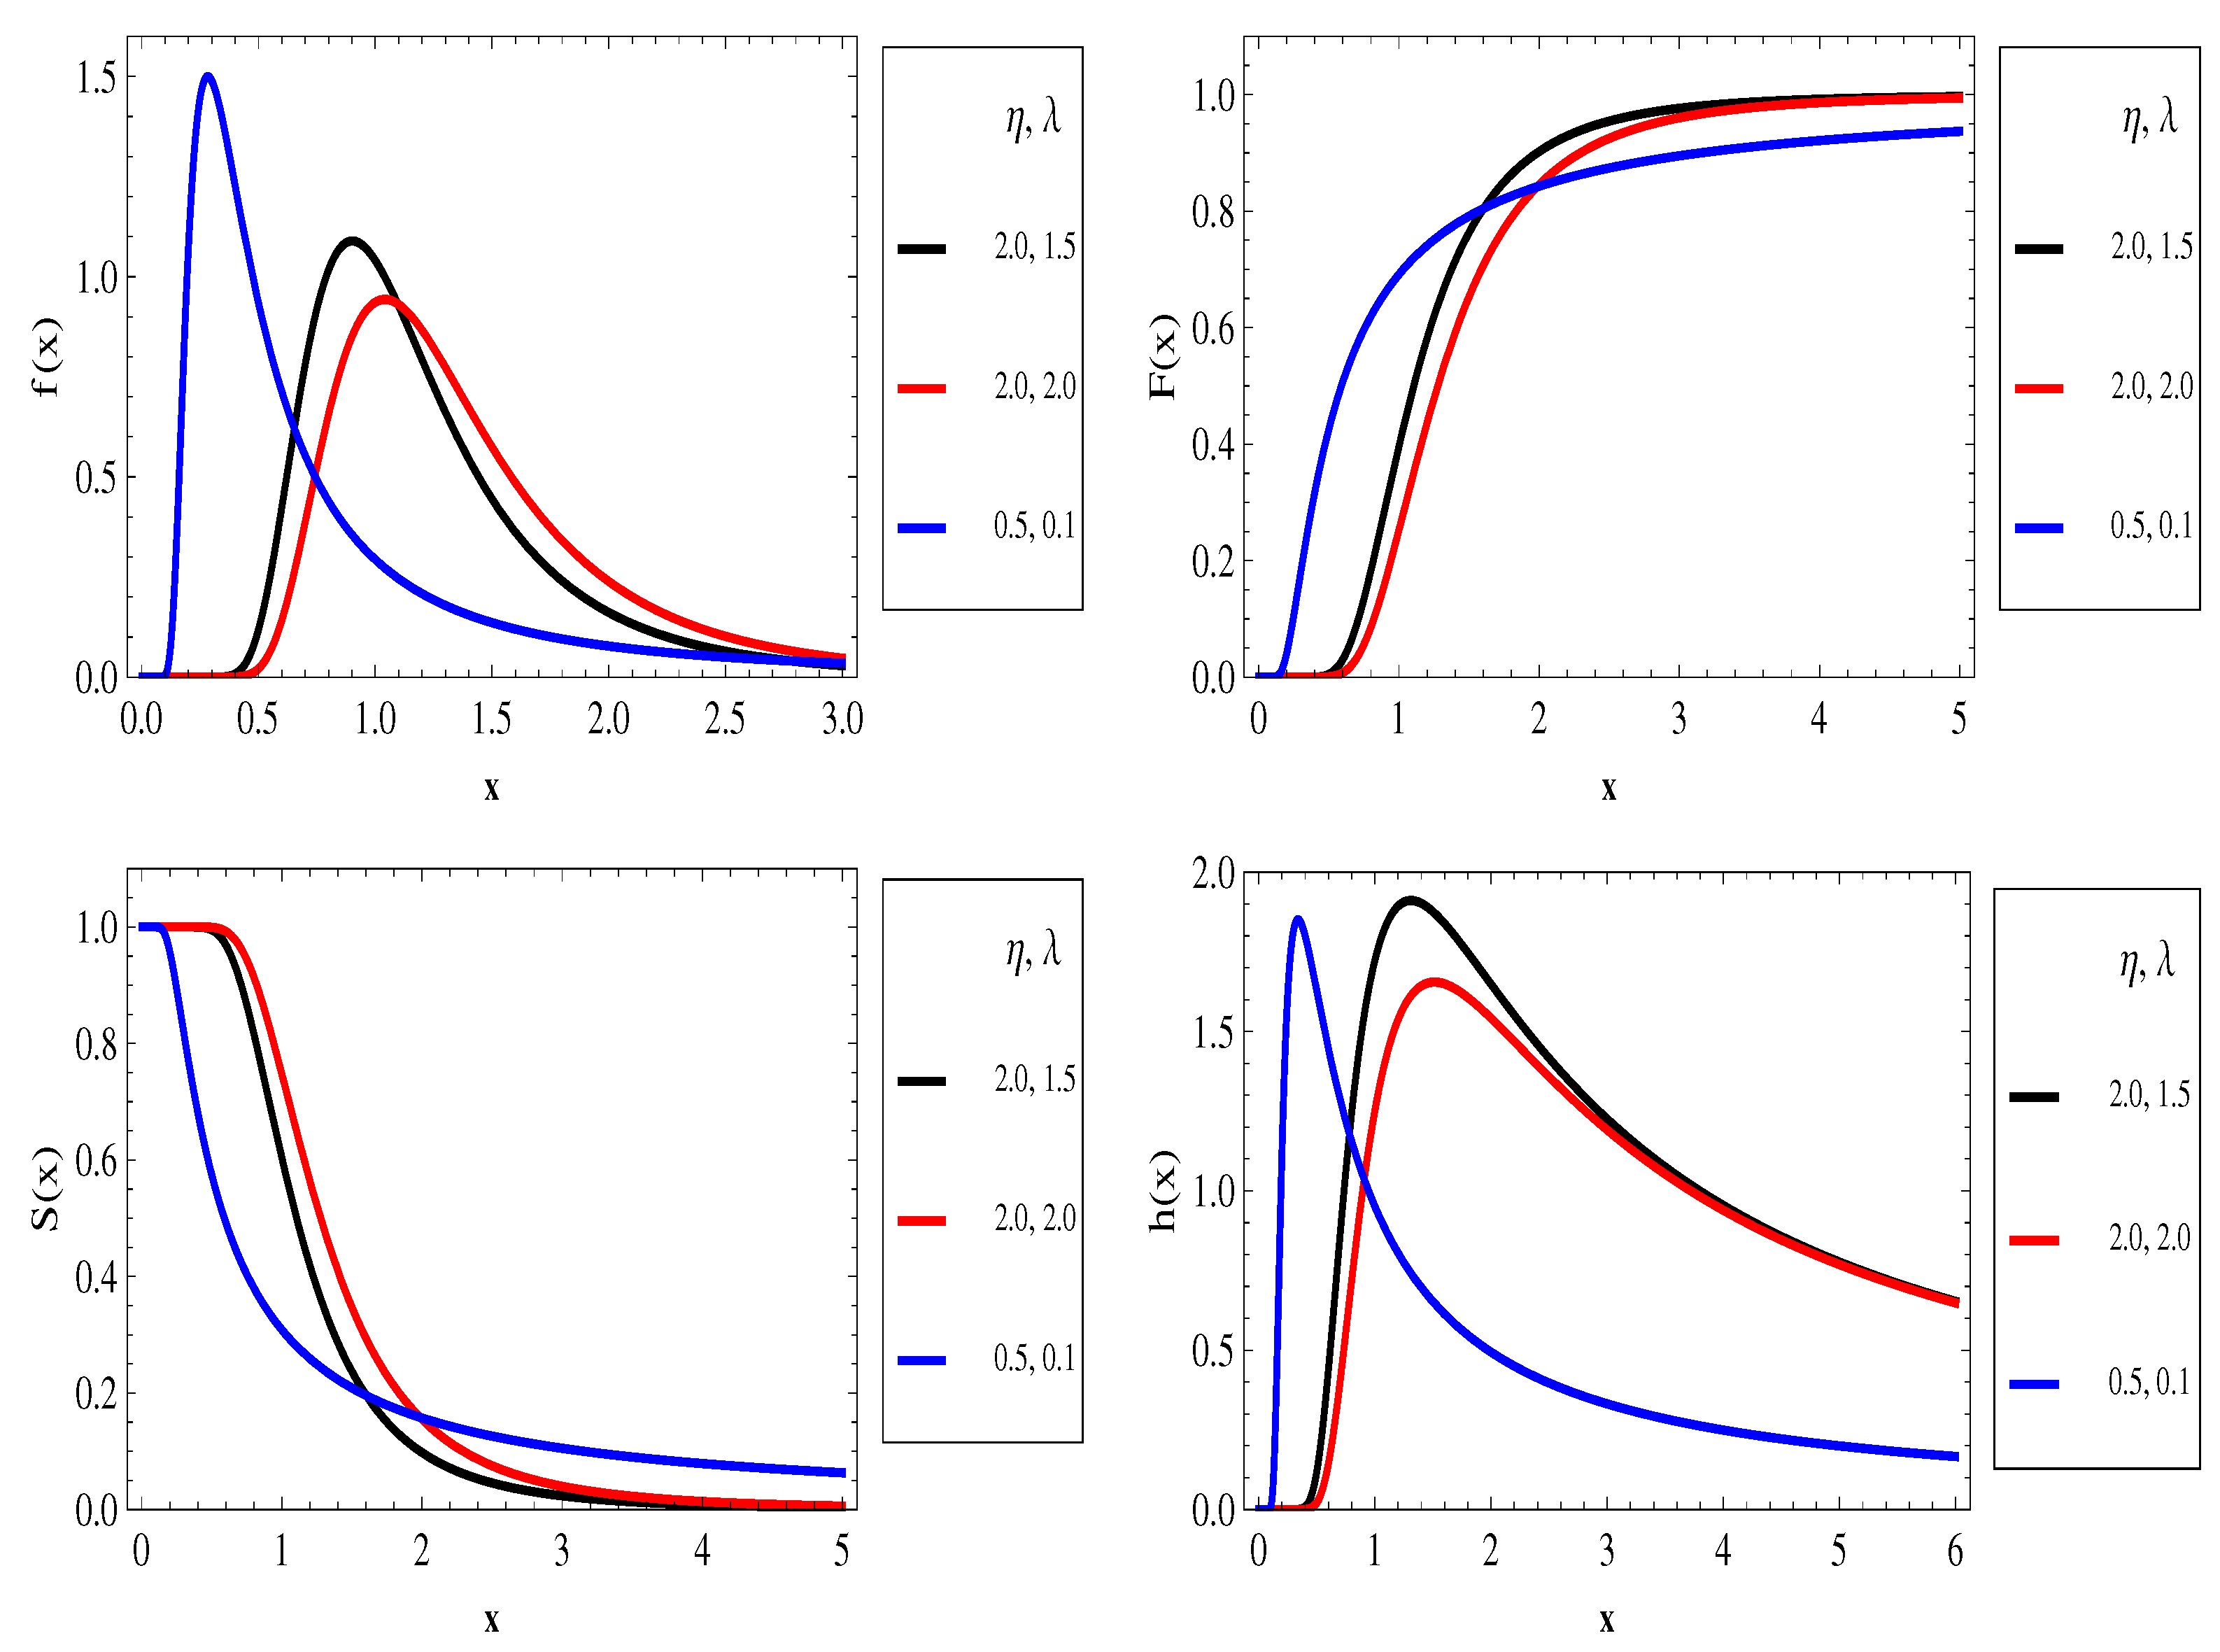
are scale and shape parameters. The failure rate function of this distribution shows nonmonotone behavior for various parameter values. It can be used to simulate the life cycle of mechanical and electrical components, as well as patient treatment patterns. The IER distribution’s failure rate exhibits behavior that is similar to some well-known statistical distributions, including the lognormal, inverse Weibull, and generalized inverted exponential distribution.s As a result, the IER distribution has been applied widely. In this light, IER distribution can be considered as a valuable alternative model to several other well-known lifetime distributions. The reliability, S ( x ) , and failure rate, h ( x ) , functions for the IER distribution are given by
S ( x ) = ( 1 e λ / x 2 ) η , x > 0 ,
h ( x ) = 2 η λ x 3 e λ / x 2 ( 1 e λ / x 2 ) 1 , x > 0 .
PDF (1), CDF (2), reliability function (3), and failure rate function (4) are plotted in Figure 1 for different values of λ and η . It can be noticed that PDF (1) and failure rate function (4) are always nonmonotonic behaviors for various values of λ and η . As a result, the IER distribution presents a valuable alternative to several other lifetime distributions, including the Weibull distribution. Its applicability extends across multiple fields, particularly finding effective use in various domains such as electrical and mechanical device experiments, patient treatments, and more.
The IER distribution has received some attention from researchers in recent years, and interesting results have come out of it. For example, Rastogi and Tripathi [2] have considered parameter, reliability, and hazard estimations for IER distribution based on Type-II progressive censored samples. Kohansal [3] investigated the estimation of R = P ( X < Y ) when X and Y come from two independent IER distributions with the same scale parameter but having different shape parameters. Kayal et al. [4] studied maximum likelihood (ML) and Bayesian estimations of the IER distribution based on a hybrid censoring scheme (HCS). Maurya et al. [5] considered the problem of prediction and estimation for the IER distribution using progressively first failure censored data. Rao and Mbwambo [6] described different methods of parametric estimations of IER distribution. The estimation of stress–strength reliability when two independent IER distributions with different shape parameters and a common scale parameter was proposed by Rao et al. [7]. Gao et al. [8] considered the pivotal inference methods for estimating the unknown parameters of the IER distribution using progressively censored data. Panahi and Moradi [9] discussed ML and Bayesian estimations of the IER distribution parameters under adaptive progressively hybrid censored. Fan and Gui [10] conducted a study on the statistical inference of IER distribution, utilizing joint progressively type-II censoring. More papers have discussed IER distribution, such as [11,12].
The HCS was first proposed by Epstein [13], and it has become very common in life-testing and reliability studies. Live units in HCS can only be eliminated at the end of the experiment. However, it is not unusual in some practical applications to remove live units for experiments at points other than the end termination, which is especially handy when the units being experimented are quite expensive. As a result, Kundu and Joarder [14] suggested a hybrid censoring scheme called Type-I progressive HCS (Type-I PHCS), which combines elements of progressive Type-II and conventional Type-I schemes. Under Type-I PHCS, life tests terminate either after a predetermined number of failures or when the specified duration of the experiment has elapsed. For further information and recent references on progressive hybrid censoring, please refer to [15,16,17,18,19,20,21].
Under Type-I PHCS, n identical units are placed on a life test, and the number of occurred failures, m ( < n ) , is fixed before starting the experiment. Assume that R 1 , R 2 , , R m , is the prescribed censoring scheme (CS) following the assumption n m = R 1 + R 2 + + R m . The pre-chosen time point, T, is also fixed. When the first failure, X 1 : m : n , occurs, the R 1 of the remaining units are eliminated from the experiment at random. In the same way, for the second failure, X 2 : m : n , R 2 
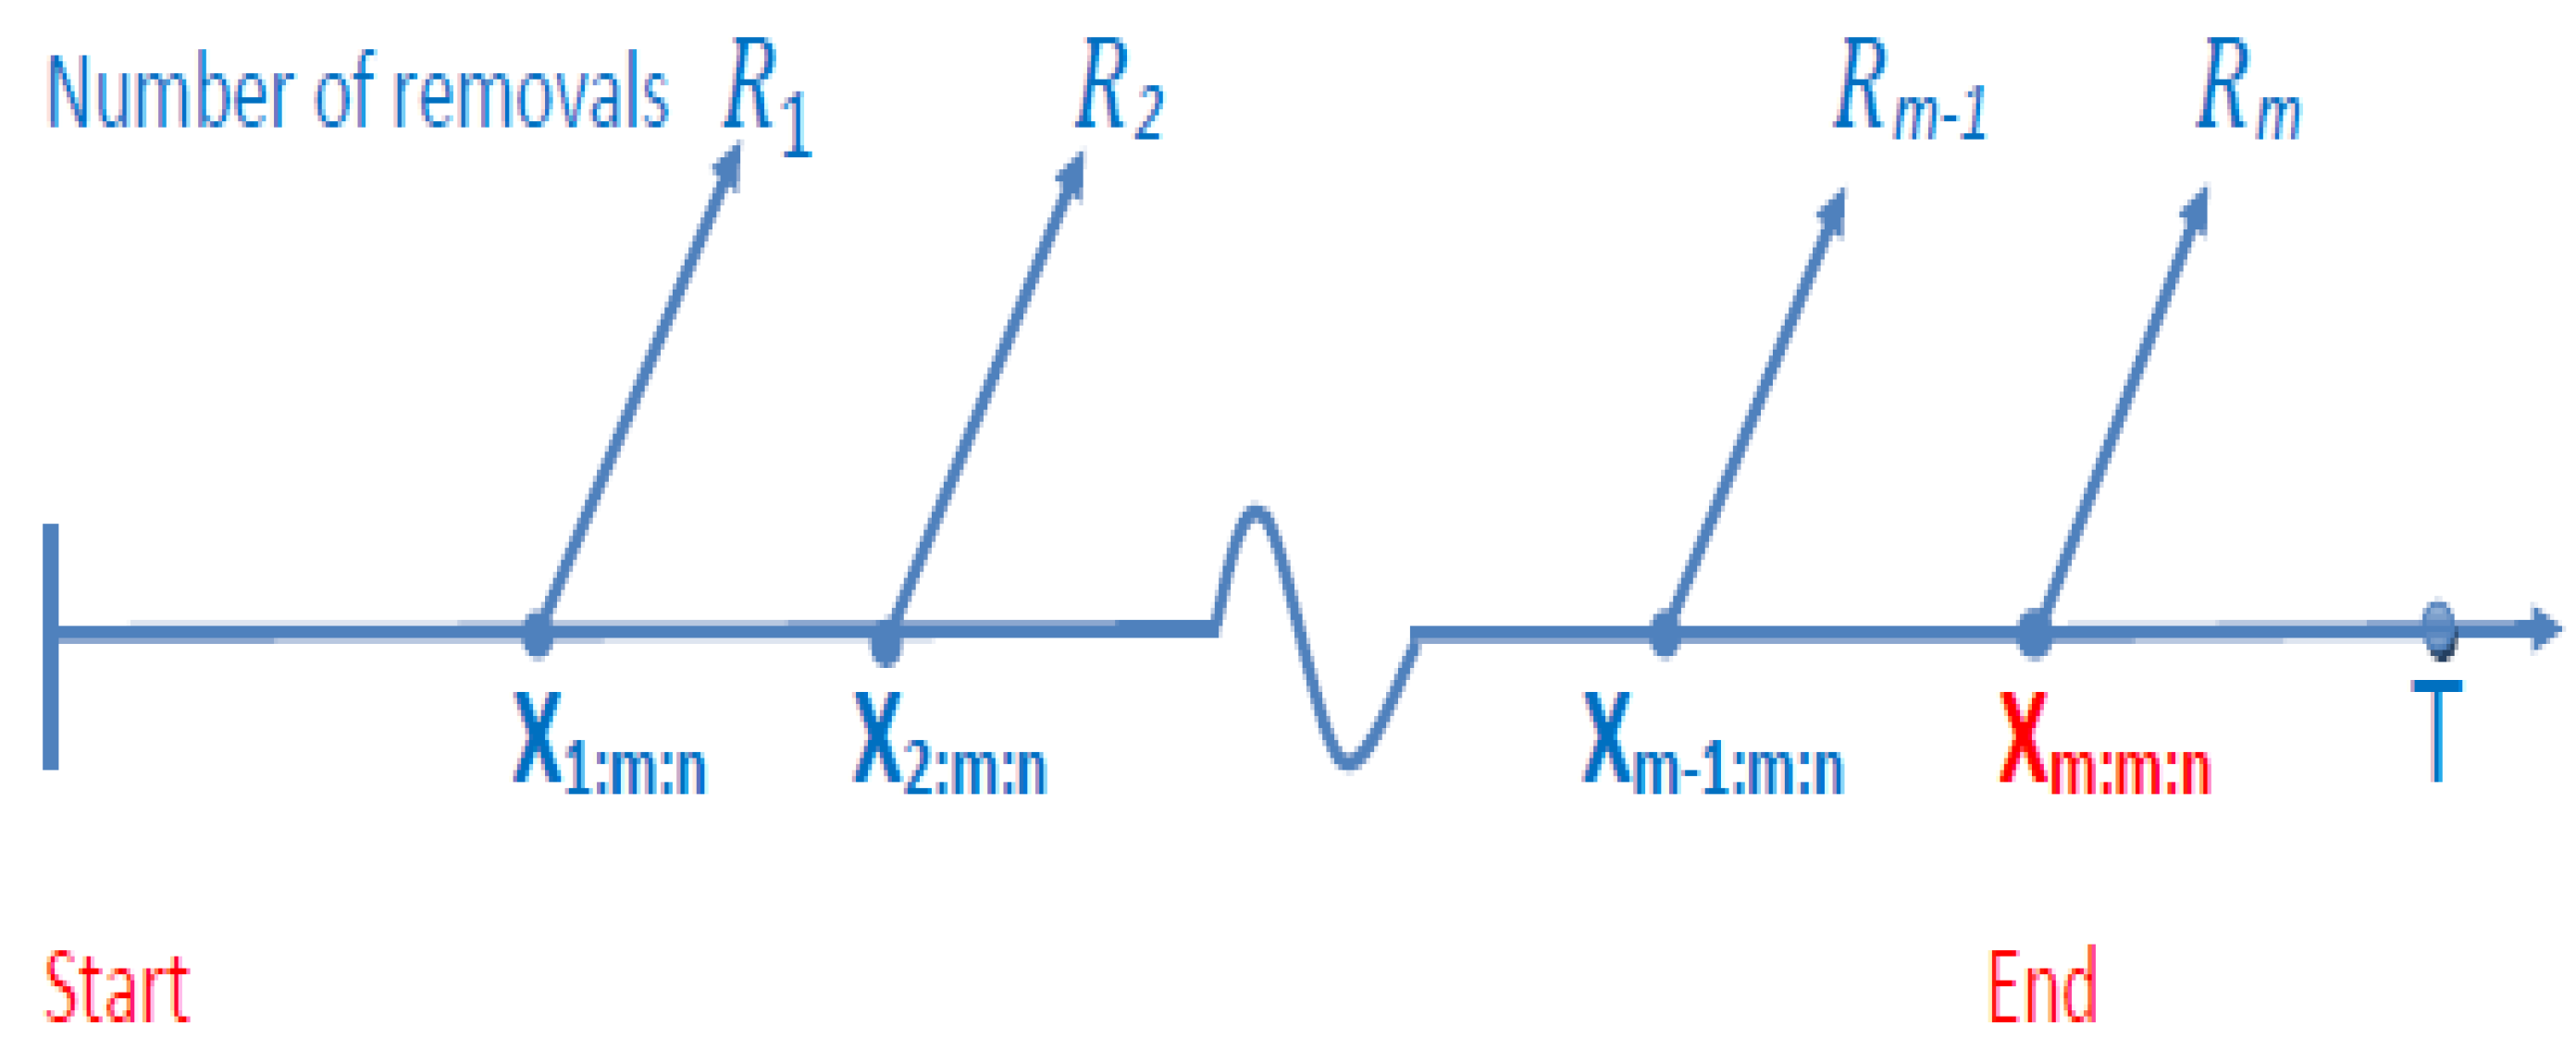
of the remaining units are eliminated from the experiment at random, and so on. The Type-I PHCS involves the termination of the life-test at the time T * = min ( X m : m : n , T ) . If the m t h failure occurs before T, then the experiment is finished at the time point X m : m : n and all remaining R m = n R 1 R 2 R m 1 m surviving units are eliminated, see 
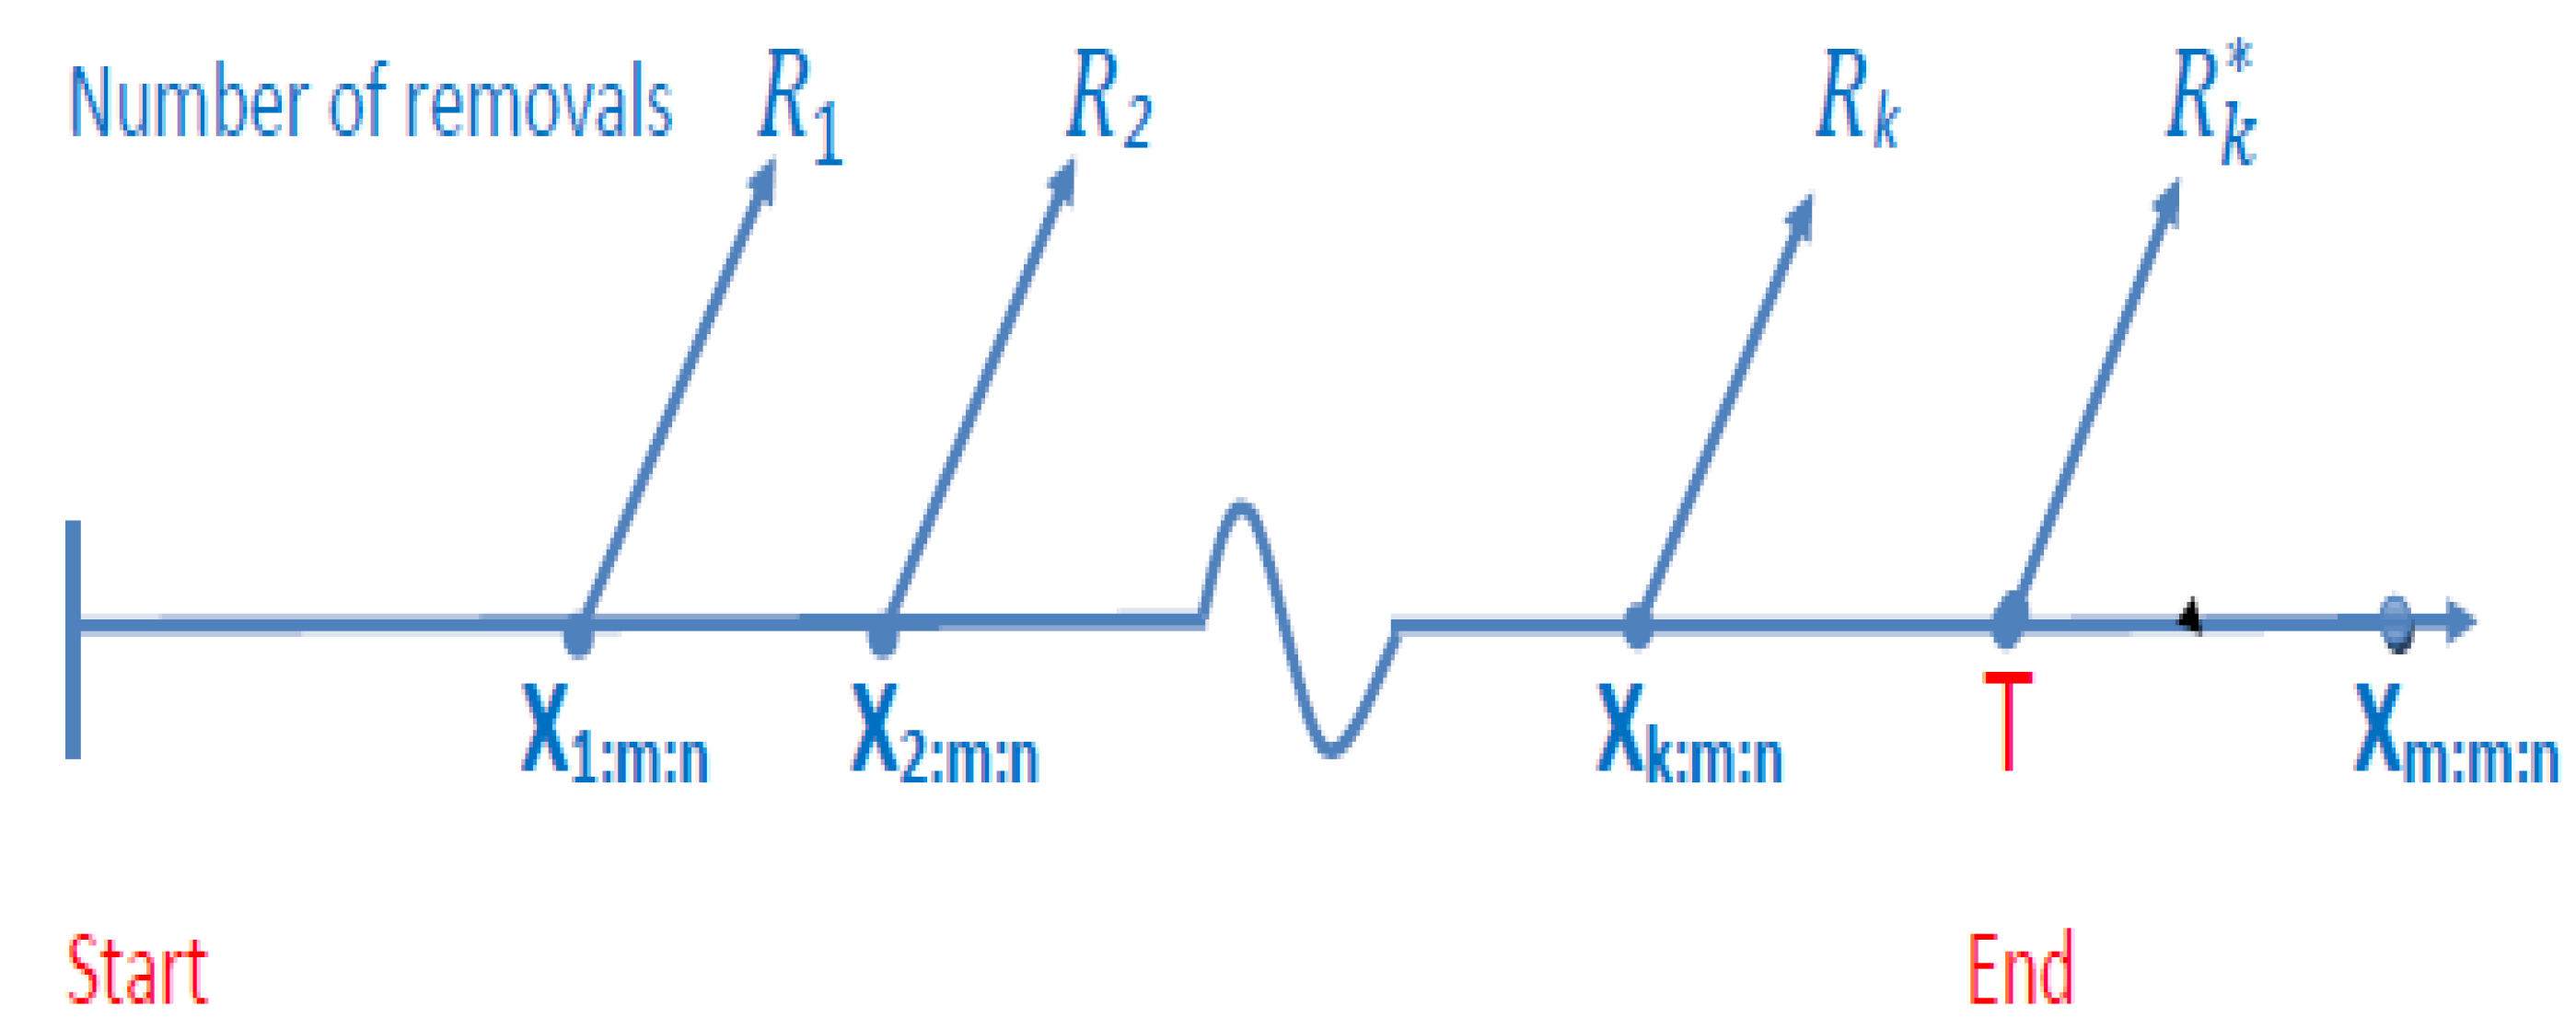
Figure 2. Otherwise, the experiment finishes at time T, satisfying X k : m : n < T < X k + 1 : m : n , and all the remaining R k * = n R 1 R k k surviving units are eliminated, see Figure 3. Here, k denotes the number of failures observing up to the time point T. Two scenarios are summarized in the following two cases:
  • Case 1: X 1 : m : n < X 2 : m : n < < X m : m : n , if X m : m : n < T .
  • Case 2: X 1 : m : n < X 2 : m : n < < X k : m : n , if X k : m : n < T < X k + 1 : m : n .
To the best of our knowledge, the empirical Bayes estimation of IER distribution has not yet been investigated using Type-I PHCS. This essay’s primary goals are dual. Therefore, we suggest developing such an estimation approach to estimate the parameter, reliability, and failure rate functions, under Type-I PHCS. The aim of the current piece of work is to design empirical Bayes estimators with informative prior for the unknown IER’s shape parameter using Type-I PHCS under various loss functions. In addition, the Bayes and empirical estimators are obtained based on two different balanced loss functions, viz., balanced squared error (symmetric) and balanced LINEX (asymmetric) loss functions. To illustrate the theoretical insights presented in this study, a specific real-world example from the field of medicine is employed, utilizing actual data.
The organization of this paper is as follows: the ML estimators (MLEs) of the parameters η , S ( x ) , and h ( x ) are derived in Section 2. Bayes estimators of the parameters η , S ( x ) , and h ( x ) under balanced loss function are derived in Section 3. Estimate of the hyper - parameter in addition to empirical Bayes estimators of the parameters η , S ( x ) , and h ( x ) under balanced loss function are given in Section 4. An application to a real dataset is presented in Section 5. To investigate the accuracy of the estimation methods, a Monte Carlo simulation followed by a discussion is presented in Section 6. Finally, the current study is concluded in Section 7.

2. Maximum Likelihood Estimation

In this section, we obtain MLEs of the unknown parameter η , S ( x ) , and h ( x ) at time x based on Type-I PHCS. The scale parameter, λ , is assumed to be known. The joint density function based on Type-I PHCS is as follows:
f X ( x ) = Ω i = 1 D f ( x i : D : n ; η ) [ 1 F ( x i : D : n ; η ) ] R i [ 1 F ( T ; η ) ] R D * ,
where Ω = n ( n R 1 1 ) ( n R 1 R 2 R D 1 D + 1 ) ,
D = k , x k : m : n < T < x m : m : n , m , x m : m : n < T ,
and R D * represents the count of units that remain in operation until time, T, before being eliminated, and is given by
R D * = n k j = 1 k R j , x k : m : n < T < x m : m : n , 0 , x m : m : n < T .
By substituting (1) and (2) into (5), the likelihood function of η based on Type-I PHCS can be written as
l ( η | x ̲ ) = Ω η D W ( λ | x ̲ ) e η V ( λ | x ̲ ) ,
where x ̲ = ( x 1 , , x D ) , x i x i : D : n to simplify the notation and
W ( λ | x ̲ ) = ( 2 λ ) D e [ 3 i = 1 D ln x i + λ i = 1 D x i 2 + i = 1 D ln ( 1 e λ x i 2 ) ] , V ( λ | x ̲ ) = i = 1 D ( R i + 1 ) ln ( 1 e λ x i 2 ) + R D * ln ( 1 e λ T 2 ) .
By applying the natural logarithm to the likelihood function (6), we obtain the log-likelihood function as
ln l ( η | x ̲ ) = ln Ω + D ln η + ln W ( λ | x ̲ ) + η V ( λ | x ̲ ) .
To obtain the MLE of η , we maximize the expression (8) with respect to η . Given that ln l ( η | x ̲ ) is unimodal (see Appendix A), we can find the MLE, denoted as η ^ , by differentiating (8) with respect to η , setting it equal to zero, and solving for η . Thus, the estimator for η is obtained as follows:
η ^ = D V ( λ | x ̲ ) ,
where V ( λ | x ̲ ) is given by (7). The corresponding MLEs of S ( x ) and h ( x ) at time x ( x > 0 ) can be computed from the following
S ^ ( x ) = ( 1 e λ / x 2 ) η ^ ,
h ^ ( x ) = 2 η ^ λ x 3 e λ / x 2 ( 1 e λ / x 2 ) 1 .

3. Bayes Estimation

In this section, we show how to obtain the Bayes estimator of the unknown parameter η , S ( x ) , and h ( x ) . We explore Bayesian estimation techniques assuming an exponential prior distribution for the random variable H (with realizations η ). This prior distribution can be represented as follows:
π ( η ) = a e a η , η > 0 , ( a > 0 ) .
Berger [22] employs Bayesian theory extensively. It should be noted that the exponential family prior has additionally been applied by Wang et al. [23], Zimmer et al. [24], Nassar and Eissa [25], and Kim et al. [26] because it is flexible and simple enough to cover a wide range of the experimenter’s prior beliefs.
Using likelihood function (6) and prior density (12), we can express the posterior density of η as follows:
π * ( η | x ) = Q η D e [ a V ( λ | x ̲ ) ] η ,
where
Q = [ a V ( λ | x ̲ ) ] D + 1 Γ ( D + 1 ) .
In Bayesian analysis, the choice of the loss function is essential. For a thorough comparison of Bayes estimates, two different types of loss functions—namely, the squared error (SE) and LINEX loss functions—are considered. The squared error and LINEX loss functions for the model parameter θ are defined as:
L S E ( θ , θ ^ ) = ( θ θ ^ ) 2 , L L I N E X ( θ , θ ^ ) = e c ( θ ^ θ ) c ( θ ^ θ ) 1 , c 0 .
where the magnitude of c indicates the degree of asymmetry. For c > 0 , the LINEX loss function around 0 is quite asymmetric, with overestimation being more serious than underestimation. For c < 0 , the opposite is true. If c is close to zero, the estimates obtained by LINEX loss function are nearly identical to the estimates obtained by SE loss function. As a result, LINEX loss function is more applicable in lifetime modeling; for example, an overestimation of the survival function and failure rate function is usually more serious than an underestimation; for more details, see [27,28].
It is well known that the Bayes estimate of a function of the model parameter H = H ( θ ) based on squared error (SE) and LINEX loss functions are given by
H ^ S E = E ( H ( θ ) | x ) = θ H ( θ ) π * ( θ | x ) d θ , H ^ L I N E X = 1 c ln [ E ( exp [ c H ( θ ) ] | x ) ] = 1 c ln θ exp [ c H ( θ ) ] π * ( θ | x ) d θ .
In the Bayesian approach, a loss function must be specified in order to choose a single value that represents the best estimate of an unknown parameter. To describe different types of loss structures, a wide range of loss functions have been developed in the literature. This study suggests using a balanced loss function, which was first introduced by Zellner [29]. This function generates a balance between classical and Bayesian approaches. Ahmadi et al. [30] and Jafari et al. [31] recommended using the alleged balanced loss function, which has the following form:
L * ( θ , ϖ ) = Δ ρ ( ϖ o , ϖ ) + ( 1 Δ ) ρ ( θ , ϖ ) ,
where ρ ( θ , ϖ ) represents an arbitrary loss function, ϖ o is a selected estimate of ϖ , and the weight 0 Δ 1 . If we choose ρ ( θ , ϖ ) = ( ϖ θ ) 2 , the balanced loss function can be simplified to the balanced squared error (BSE) loss function, given by:
L * ( θ , ϖ ) = Δ ( ϖ ϖ o ) 2 + ( 1 Δ ) ( ϖ θ ) 2 .
The Bayes estimator of the function H can be determined as follows:
H ^ B S E = Δ H ^ + ( 1 Δ ) E ( H ( θ ) | x ) ,
where H ^ represents the maximum likelihood estimate (MLE) of H. Additionally, if we select ρ ( θ , ϖ ) = exp [ c ( ϖ θ ) ] c ( ϖ θ ) 1 , we obtain the balanced LINEX (BLINEX) loss function, given by:
L * ( θ , ϖ ) = Δ ( exp [ c ( ϖ ϖ o ) ] c ( ϖ ϖ o ) 1 ) + ( 1 Δ ) ( exp [ c ( ϖ θ ) ] c ( ϖ θ ) 1 ) .
In this particular case, the Bayes estimator can be represented in the following manner:
H ^ B L I N E X = 1 c ln [ Δ exp [ c ( ϖ o ) ] + ( 1 Δ ) E ( exp [ c H ( θ ) ] | x ̲ ) ] ,
where c 0 denotes the shape parameter of the BLINEX loss function. For further papers discussing the balanced loss function, see [32,33,34,35].
The Bayes estimators of the unknown parameter η , S ( x ) , and h ( x ) at time x under BSE loss function are given by
η ^ B S E = D Δ V ( λ | x ̲ ) + ( 1 Δ ) D + 1 a V ( λ | x ̲ ) ,
S ^ ( x ) B S E = Δ ( 1 e λ / x 2 ) η ^ + ( 1 Δ ) 1 ln ( 1 e λ / x 2 ) a V ( λ | x ̲ ) ( D + 1 ) ,
h ^ ( x ) B S E = Δ 2 η ^ λ x 3 e λ / x 2 1 e λ / x 2 + ( 1 Δ ) 2 λ x 3 e λ / x 2 1 e λ / x 2 D + 1 a V ( λ | x ̲ ) .
The Bayes estimators of the unknown parameter η , S ( x ) , and h ( x ) under BLINEX loss function are
η ^ B L I N E X = 1 c ln D Δ V ( λ | x ̲ ) + ( 1 Δ ) 1 + c a V ( λ | x ̲ ) ( D + 1 ) ,
S ^ ( x ) B L I N E X = 1 c ln Δ ( 1 e λ / x 2 ) η ^ + ( 1 Δ ) r = 0 ( c ) r Γ ( r ) 1 r ln ( 1 e λ / x 2 ) a V ( λ | x ̲ ) ( D + 1 ) , h ^ ( x ) B L I N E X = 1 c ln Δ 2 η ^ λ x 3 e λ / x 2 1 e λ / x 2
+ ( 1 Δ ) 1 + 2 c λ x 3 e λ / x 2 ( a V ( λ | x ̲ ) ) ( 1 e λ / x 2 ) ( D + 1 ) .

4. Empirical Bayes Estimation

Previous studies conducted by Yan and Gendai [36] and Shi et al. [37] employed the MLE method to estimate the hyper-parameter of the prior distribution. This estimation was utilized to analyze the Bayesian reliability quantitative indexes of the cold standby system, for more details see [38]. In (14) and (17), the hyper-parameter a is an unknown constant, which renders direct utilization of η impossible. Consequently, we employ the MLE technique to estimate the value of a.
By utilizing (1) and (12), we compute the marginal PDF and CDF for x, represented by the density function:
f ( x ) = 0 f ( x ; η , λ ) π ( η ) d η = 2 a x 3 λ e λ x 2 ( 1 e λ x 2 ) ( a ln ( 1 e λ x 2 ) ) 2 ,
F ( x ) = 1 a a ln ( 1 e λ x 2 ) .
Therefore, we can represent (6) as follows:
l ( a | x ̲ ) = Ω i = 1 D f ( x i : D : n ) [ 1 F ( x i : D : n ) ] R i [ 1 F ( T ) ] R D * .
Substituting (20) and (21) into (22), we obtain
l ( a | x ̲ ) = A W ( λ | x ̲ ) a ( n + R D * ) e i = 1 D ( R i + 2 ) ln ( a ln ( 1 e λ / x 2 ) ) e R D * ln ( a ln ( 1 e λ / T 2 ) ) .
We can express the log-likelihood function as follows:
ln l ( a | x ̲ ) = ln Ω + ( n + R D * ) ln a i = 1 D ( R i + 2 ) ln ( a ln ( 1 e λ / x 2 ) ) R D * ln ( a ln ( 1 e λ / T 2 ) ) .
The derivative of (24) with respect to a is given as follows:
d ln l ( a | x ̲ ) d a = ( n + R D * ) a i = 1 D ( R i + 2 ) a ln ( 1 e λ / x 2 ) R D * a ln ( 1 e λ / T 2 ) .
It is evident that solving (25), after equating it to zero, explicitly is not feasible, necessitating the application of a suitable numerical method to obtain the estimate a ^ .
The empirical Bayesian estimator of parameter η based on BSE loss function is given by
η ^ B S E = D Δ V ( λ | x ̲ ) + ( 1 Δ ) D + 1 a ^ V ( λ | x ̲ ) ,
where a is replaced by a ^ in (14). Substituting a ^ in (15) and (16), the empirical Bayes estimator of S ( x ) and h ( x ) are given, respectively, by
S ^ ( x ) B S E = Δ ( 1 e λ / x 2 ) η ^ + ( 1 Δ ) 1 ln ( 1 e λ / x 2 ) a ^ V ( λ | x ̲ ) ( D + 1 ) ,
h ^ ( x ) B S E = Δ 2 η ^ λ x 3 e λ / x 2 1 e λ / x 2 + ( 1 Δ ) 2 λ x 3 e λ / x 2 1 e λ / x 2 D + 1 a ^ V ( λ | x ̲ ) .
Similarly, the empirical Bayesian estimators of the parameters η , S ( x ) , and h ( x ) based on BLINEX loss function are given, respectively, by
η ^ B L I N E X = 1 c ln D Δ V ( λ | x ̲ ) + ( 1 Δ ) 1 + c a ^ V ( λ | x ̲ ) ( D + 1 ) ,
S ^ ( x ) B L I N E X = 1 c ln Δ ( 1 e λ / x 2 ) η ^ + ( 1 Δ ) r = 0 ( c ) r Γ ( r ) 1 r ln ( 1 e λ / x 2 ) a ^ V ( λ | x ̲ ) ( D + 1 ) , h ^ ( x ) B L I N E X = 1 c ln Δ 2 η ^ λ x 3 e λ / x 2 1 e λ / x 2
+ ( 1 Δ ) 1 + 2 c λ x 3 e λ / x 2 ( a ^ V ( λ | x ̲ ) ) ( 1 e λ / x 2 ) ( D + 1 ) .

5. Application of IER Distribution to Real Data

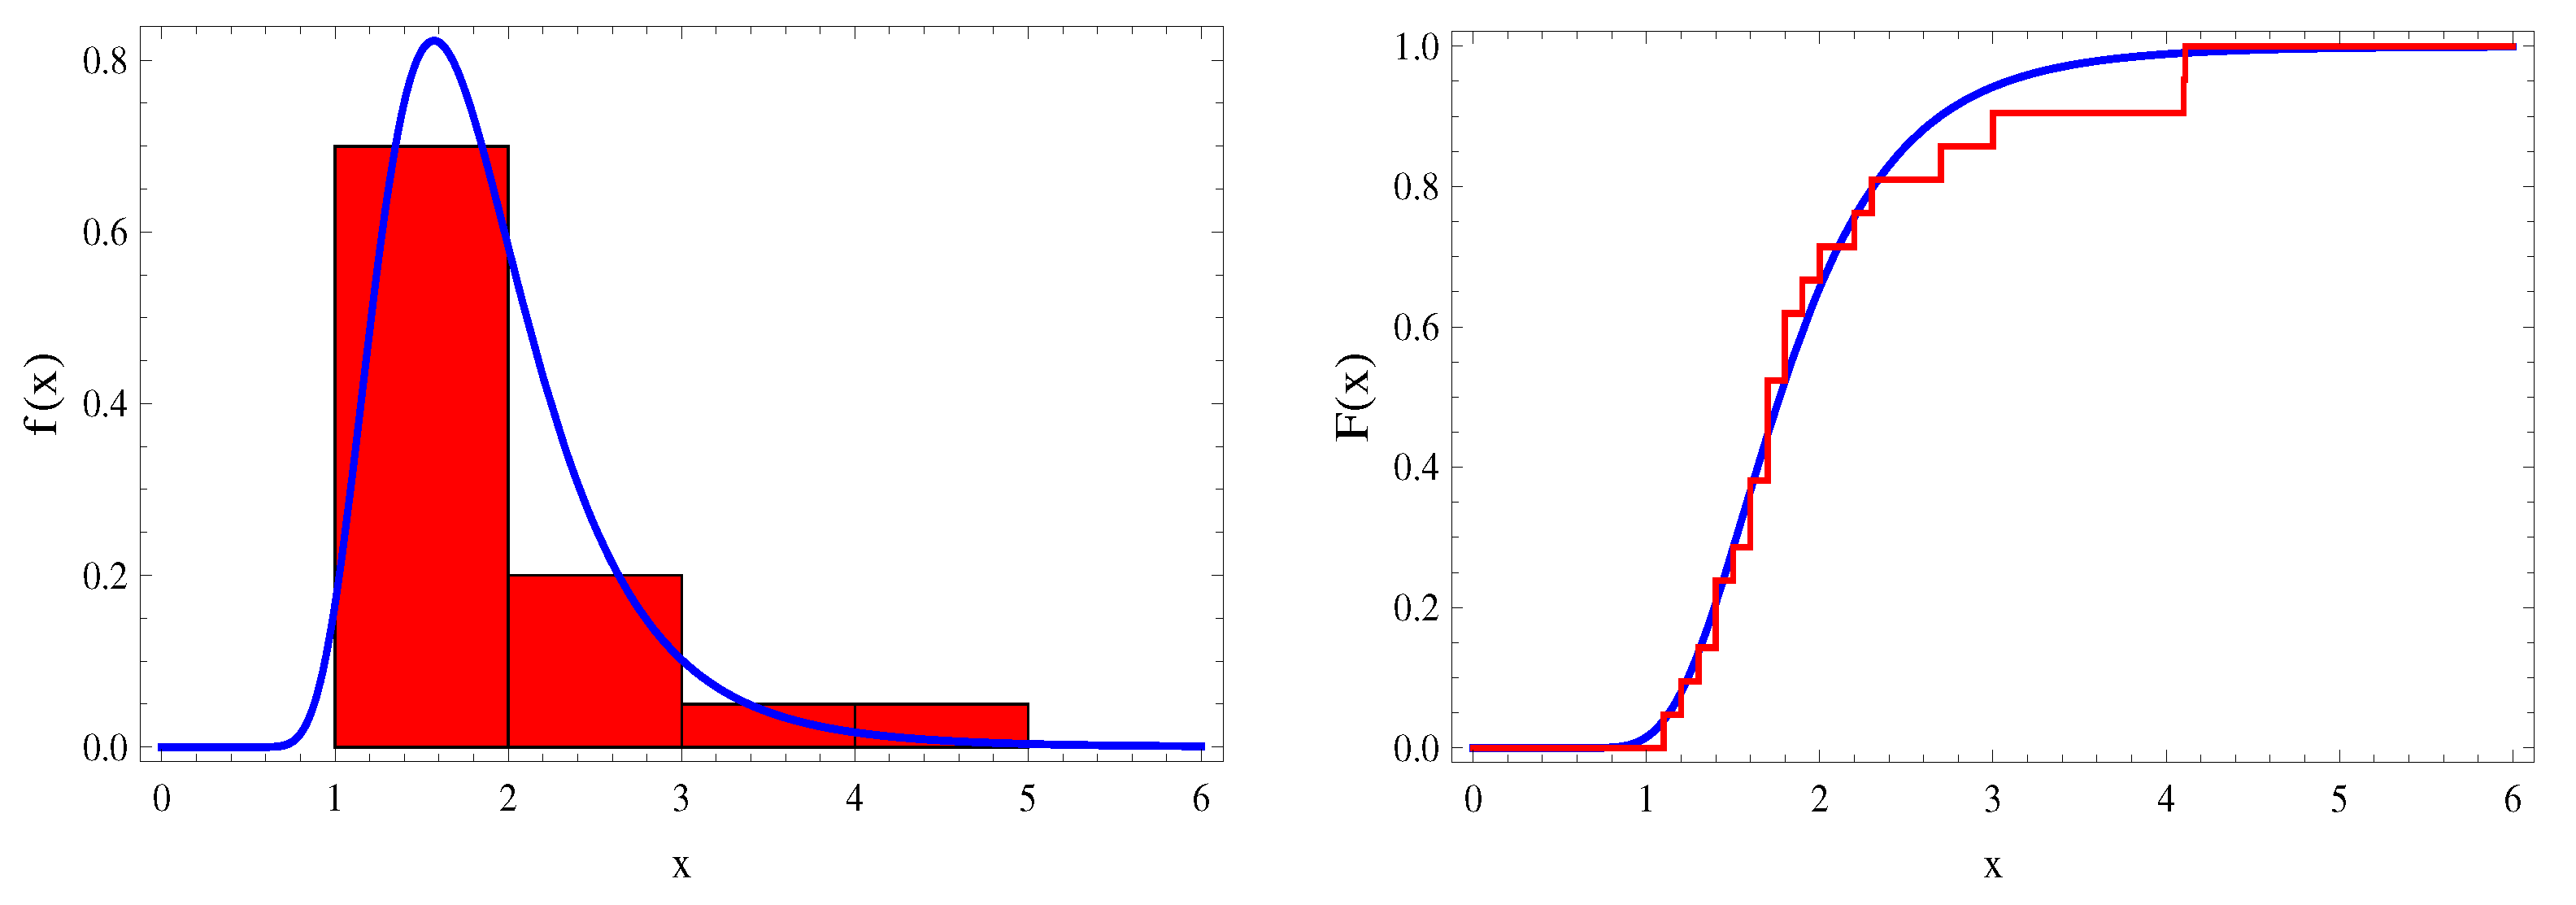
Here, we illustrate the theoretical results obtained in the above sections using a real dataset from the medicine field. The dataset consists of the recorded relief times for a group of 20 patients who were administered an analgesic. It is taken from Gross and Clark [39] as follows: 1.1, 1.4, 1.3, 1.7, 1.9, 1.8, 1.6, 2.2, 1.7, 2.7, 4.1, 1.8, 1.5, 1.2, 1.4, 3.0, 1.7, 2.3, 1.6, 2.0.
To determine if the IER distribution with CDF (2) is suitable for fitting the given data, we perform a Kolmogorov–Smirnov (K–S) test and calculate its associated p-value. The estimates for the shape and scale parameters η ^ = 3.60983 and λ ^ = 5.45534 , are obtained by maximizing the likelihood function of η and λ based on the data and CDF (2). The K–S test statistic is found to be 0.09547, with a corresponding p-value of 0.9932. The provided real dataset appears to be well-matched by the IER distribution with CDF (2), as evidenced by the calculated p-value exceeding 0.050. This is also supported by Figure 4, which displays the histogram and empirical CDF of the dataset, as well as the PDF (1) and CDF (2). These plots visually demonstrate a good agreement between the empirical data and the fitted IER distribution. The prior parameter value has been determined to be a = 0.2769 to produce population parameter value η = 3.60983 using (12).
Type-I PHCS is applied to the above real dataset to obtain samples subjecting to Type-I PHCS. The Type-I PHCS is considered with n = 20 , m = 16 , T = 1.75 , 2.75 , and three various CSs presented in Table 1. Based on the samples presented in Table 2, the MLEs, Bayes, and empirical Bayes estimates based on BSE and BLINEX (with Δ = 0.4 and c = 0.3 , 3.0 ) loss functions of η , S ( x ) , and h ( x ) (at x = 1.35 ) are calculated and presented in Table 3 and Table 4.
The above tables are a comprehensive snapshot of the η , S ( x ) , and h ( x ) (at x = 1.35 ) estimates under various CSs, providing insights into the performance of different estimation approaches. The results demonstrate the applicability and effectiveness of the proposed methodology, allowing for a thorough understanding of the IER distribution within the context of progressive hybrid CSs.
From Table 3 and Table 4, we can see that the Bayes and empirical Bayes estimates under BSE and BLINEX (with c = 0.3 ) are very close to the MLEs.

6. Simulation

A Monte Carlo simulation is introduced to show the theoretical results. Based on Type-I PHCS, the Bayes and empirical Bayes estimates (under balanced loss function) of the unknown parameter η , S ( x ) , and h ( x ) (at time x) are calculated and compared with the MLE. The next steps are applied:
  • For a given value of the prior parameter, a ( = 0.5 ) , generate the shape parameter η ( = 2.0 ) from (12).
  • Choose the values of n ( = 50 , 100 ) , m ( = 25 , 40 , 50 , 80 ) , T ( = 1.5 , 3.0 ) , and three different CSs, ( R 1 , , R m ) , presented in Table 1.
  • Generate a Type-I PHCS sample from IER( η = 2.0 , λ = 1.5 ) distribution with CDF (2), considering the algorithm shown in [13].
  • The MLEs and Bayes estimates based on BSE and BLINEX (with Δ = 0.4 and c = 0.3 , 3.0 ) loss functions of η , S ( x ) , and h ( x ) (at x = 1.2 ) are calculated as shown in Section 2 and Section 3.
  • The MLE of the prior parameter a is calculated and then the empirical Bayes estimates based on BSE and BLINEX (with Δ = 0.4 and c = 0.3 , 3.0 ) loss functions of the η , S ( x ) , and h ( x ) (at time x = 1.2 ) are calculated as shown in Section 4.
  • Steps 3 to 5 are repeated M = 10,000 times and the average of estimates ( ρ ^ ¯ = 1 M i = 1 M ρ ^ i ) , mean squared error ( MSE ( ρ ^ ) = 1 M i = 1 M ( ρ ^ i ρ ) 2 ) , and relative absolute bias ( RAB ( ρ ^ ) = 1 M i = 1 M | ρ ^ i ρ | ρ ) are calculated where ρ ^ is an estimate of ρ (= η , S ( x ) , and h ( x ) (at x = 1.2 )).
  • The computational results of the ML, Bayes, and empirical Bayes estimates are presented in Table A1 and Table A2; see Appendix B.

Discussion

The numerical results obtained from simulation studies, presented in Table A1 and Table A2, indicate the following:
  • The MSEs and RABs of the three methods of estimation decrease by increasing m for fixed T and n.
  • The MSEs and RABs of the three methods of estimation decrease by increasing n for fixed T and m.
  • The MSEs and RABs of the three methods of estimation decrease by increasing T for fixed n and m.
  • The Bayes estimates of η , S ( x ) , and h ( x ) (at time x = 1.2 ) are better than the ML and empirical Bayes estimates by means of the MSEs and RABs.
  • The empirical Bayes estimates of η , S ( x ) , and h ( x ) (at time x = 1.2 ) are better than the MLEs by means of the MSEs and RABs.
  • The Bayes (empirical Bayes) estimates based on BLINEX (with c = 3.0 ) loss function of η , S ( x ) , and h ( x ) (at time x = 1.2 ) are better than the Bayes (empirical Bayes) estimates based on BSE loss function by means of the MSEs and RABs.
Except for a few unique states, the above results are correct; this could be due to data volatility. Based on the above observations, we recommend using the Bayes approach to estimate the parameters, reliability, and failure rate functions included in the used progressive hybrid censoring cases.

7. Concluding Remarks

The maximum likelihood, Bayes, and empirical Bayes estimations of reliability performances for inverted exponentiated Rayleigh distribution have been investigated. Based on Type-I PHCS, the MLE, Bayes, and empirical Bayes (under BSE and BLINEX loss functions) estimates of the unknown parameter η , reliability S ( x ) , and failure rate h ( x ) functions have been derived. The theoretical insights given in this paper have been illustrated using a real dataset from the medicine field. Finally, a Monte Carlo simulation study has been performed to test the performance and accuracy of the estimation methods. Based on the numerical outcomes, we recommend employing the Bayes approach for estimating the parameters, reliability, and failure rate functions within the contexts of the employed censoring scenarios.

Author Contributions

All authors have contributed equally to the manuscript. All authors have read and agreed to the published version of the manuscript.

Funding

The authors extend their appreciation to the Deputyship for Research & Innovation, Ministry of Education in Saudi Arabia for funding this research through the project number IFP-IMSIU-2023124. The authors also appreciate the Deanship of Scientific Research at Imam Mohammad Ibn Saud Islamic University (IMSIU) for supporting and supervising this project.

Data Availability Statement

Data sets are available in the application section.

Conflicts of Interest

The authors declare no conflict of interest.

Appendix A

The second derivative of ln l ( η | x ̲ ) is given by
d 2 ln l ( η | x ̲ ) d η 2 = D η 2
Now observe that η > 0 . Hence d 2 ln l ( η | x ̲ ) d η 2 < 0 ; this means that ln l ( η | x ̲ ) is unimodal.

Appendix B

Table A1. MLEs and Bayes estimates of η , S ( x ) , and h ( x ) (at time x = 1.2 ) with their MSEs and RABs.
Bayes Estimate
BLINEX
MLEBSE c = 0.3 c = 3.0
η ^ ¯ S ^ ¯ ( x ) h ^ ¯ ( x ) η ^ ¯ S ^ ¯ ( x ) h ^ ¯ ( x ) η ^ ¯ S ^ ¯ ( x ) h ^ ¯ ( x ) η ^ ¯ S ^ ¯ ( x ) h ^ ¯ ( x )
MSEMSEMSEMSEMSEMSEMSEMSEMSEMSEMSEMSE
n m T CSRABRABRABRABRABRABRABRABRABRABRABRAB
50251.5I1.9770500.4290751.8715901.9765700.4333221.8711401.9947500.4338871.8874001.8054500.4277471.718180
0.1526750.0053450.1368220.1438220.0050710.1288880.1472550.0050890.1317790.1431690.0049180.126959
0.1583700.1399250.1583700.1537160.1357490.1537160.1553890.1359380.1552900.1537250.1342380.152880
II2.0536300.4147871.9440802.0507200.4186921.9413302.0660000.4191341.9550101.9033000.4143351.809640
0.1512150.0045970.1355130.1433800.0042800.1284910.1493330.0042770.1335230.1107520.0043210.099826
0.1561240.1323880.1561240.1522550.1277400.1522550.1548420.1276970.1546970.1372370.1283510.137559
III2.0259800.4199551.9179102.0238800.4238421.9159202.0395300.4243081.9299301.8736200.4192511.781670
0.1526220.0048310.1367740.1446470.0045390.1296270.1496860.0045420.1338840.1214500.0045210.108915
0.1570280.1349200.1570280.1530410.1306250.1530410.1552320.1306610.1551070.1430210.1305110.143011
3.0I2.0041000.4230501.8972002.0027000.4267151.8958702.0175000.4271651.9091301.8606200.4222711.768910
0.1281410.0041830.1148350.1218320.0039590.1091820.1255480.0039640.1123190.1089120.0039230.097280
0.1439280.1248850.1439280.1404600.1213050.1404600.1422010.1213660.1421010.1351170.1209240.134821
II2.0552900.4144851.9456602.0523500.4184001.9428702.0676400.4188421.9565701.9046900.4140421.810970
0.1512500.0045990.1355450.1434080.0042790.1285170.1494100.0042760.1335900.1103810.0043230.099510
0.1556560.1319490.1556560.1517950.1272700.1517950.1544060.1272220.1542590.1364860.1279340.136826
III2.0380000.4172411.9292902.0355800.4210561.9270002.0506100.4214981.9404601.8907100.4166971.797580
0.1400650.0043340.1255210.1329270.0040530.1191240.1380940.0040530.1234900.1070590.0040730.096216
0.1497350.1278240.1497350.1460740.1235350.1460740.1484250.1235180.1482920.1341680.1239250.134239
401.5I2.0003400.4231111.8936401.9997900.4259921.8931102.0115000.4263591.9036101.8863600.4223571.791760
0.1110630.0037240.0995300.1068260.0035820.0957330.1088610.0035880.0974510.1007720.0035310.090041
0.1346400.1174330.1346400.1320680.1149180.1320680.1331610.1149930.1330980.1292390.1143570.129013
II2.0077700.4213301.9006802.0071500.4237351.9000902.0167700.4240361.9087001.9133300.4207571.816240
0.1009790.0033100.0904940.0977170.0031940.0875710.0995020.0031970.0890790.0896800.0031680.080385
0.1279330.1109750.1279330.1259030.1089150.1259030.1268380.1089620.1267860.1220310.1085890.121994
III1.9976100.4236651.8910501.9970800.4265121.8905502.0086800.4268761.9009401.8848000.4229101.790210
0.1123490.0037830.1006830.1081060.0036410.0968800.1101060.0036480.0985690.1021320.0035880.091266
0.1354670.1183200.1354670.1329050.1158730.1329050.1339330.1159550.1338740.1300310.1152340.129841
3.0I2.0077400.4207861.9006502.0070500.4231501.8999902.0163600.4234401.9083301.916070.4202751.818680
0.0871400.0028370.0780910.0844240.0027330.0756580.0861300.0027350.0770990.076830.0027230.068861
0.1183210.1025080.1183210.1165130.1005750.1165130.1174550.1006040.1174010.112730.1004220.112671
II2.0260000.4175661.9179302.0249700.4199591.9169602.0342600.4202431.9252701.9340500.4171451.835700
0.0907970.0028650.0813680.0879350.0027440.0788040.0900870.0027430.0806240.0759980.0027550.068332
0.1205310.1034410.1205310.1186910.1012790.1186910.1198340.1012790.1197700.1128210.1014140.112894
III2.0133900.4198331.9059902.0126000.4222171.9052402.0219600.4225071.9136201.9211400.4193441.823510
0.0894420.0028800.0801550.0866250.0027690.0776300.0884830.0027710.0792010.0776210.0027640.069637
0.1197750.1034570.1197750.1179350.1013970.1179350.1189650.1014120.1189070.1131610.1013690.113146
100501.5I2.0058900.4213891.8988902.0054200.4237431.8984502.0148300.4240391.9068801.9135700.4208021.816360
0.0934720.0030870.0837660.0905830.0029870.0811770.0920770.0029910.0824390.0849190.0029580.076017
0.1228680.1067800.1228680.1209760.1048660.1209760.1218500.1049130.1217990.1180390.1045350.117925
II2.0402500.4147561.9314202.0392800.4167271.9305002.0468300.4169571.9372601.9649500.4144501.864060
0.0863600.0026270.0773930.0840860.0025250.0753550.0859720.0025230.0769510.0715260.0025460.064485
0.1154520.0981600.1154520.1140060.0963880.1140060.1149660.0963760.1149130.1081260.0966080.108308
III2.0251500.4175101.9171302.0244100.4195271.9164202.0322400.4197701.9234401.9473900.4171221.847580
0.0854810.0026890.0766050.0831990.0025950.0745600.0848210.0025950.0759320.0736540.0025990.066225
0.1157260.0993100.1157260.1142300.0975810.1142300.1151210.0975860.1150700.1094750.0976380.109552
3.0I2.0089100.4200591.9017502.0084000.4219701.9012702.0158700.4222041.9079601.9350700.4196431.835710
0.0741110.0023950.0664150.0722440.0023220.0647420.0734510.0023230.0657630.0662360.0023170.059421
0.1088380.0941420.1088380.1074970.0927220.1074970.1081930.0927460.1081540.1046600.0925900.104632
II2.0363700.4153531.9277402.0354600.4173131.9268802.0429700.4175421.9336101.9614700.4150361.860750
0.0832290.0025520.0745870.0810560.0024550.0726390.0828360.0024540.0741450.0694970.0024730.062619
0.1132930.0965520.1132930.1118820.0948080.1118820.1128360.0947940.1127830.1062060.0950330.106354
III2.0296300.4164931.9213602.0288200.4184331.9206002.0362800.4186621.9272801.955340.4161551.854910
0.0805080.0025060.0721490.0784380.0024150.0702930.0800720.0024140.0716760.068250.0024280.061435
0.1123630.0961540.1123630.1109760.0944660.1109760.1118860.0944570.1118350.105610.0946400.105746
801.5I2.0082900.4197571.9011702.0080400.4212711.9009302.0139700.4214601.9062401.9496400.4193891.848700
0.0632500.0020670.0566820.0620050.0020210.0555670.0627020.0020230.0561560.0587510.0020120.052666
0.1005230.0871090.1005230.0995410.0861300.0995410.0999750.0861570.0999510.0980020.0859340.097958
II2.0145600.4182591.9071002.0143100.4195011.9068602.0191200.4196541.9111701.9667900.4179771.864350
0.0544460.0017520.0487930.0535580.0017160.0479970.0541410.0017170.0484900.0502040.0017150.045060
0.0929640.0802530.0929640.0922220.0794290.0922220.0926190.0794380.0925960.0902930.0793900.090311
III2.0112400.4191611.9039502.0109600.4206691.9037002.0168400.4208571.9089601.9529700.4188061.851830
0.0618500.0020120.0554280.0606400.0019660.0543430.0613590.0019670.0549520.0571180.0019590.051217
0.0990540.0857370.0990540.0980940.0847190.0980940.0985670.0847370.0985400.0961900.0846030.096170
3.0I2.0160800.4177731.9085402.0157900.4189971.9082602.0204800.4191461.9124701.9693500.4175151.866720
0.0491710.0015760.0440650.0483890.0015400.0433640.0489890.0015400.0438720.0447880.0015440.040222
0.0884580.0762840.0884580.0877700.0754570.0877700.0881980.0754570.0881740.0854730.0755040.085513
II2.0214000.4169101.9135802.0210500.4181201.9132502.0256700.4182661.9173801.9753000.4166721.872320
0.0522280.0016450.0468040.0513960.0016060.0460590.0520830.0016050.0466400.0468770.0016130.042142
0.0897950.0771080.0897950.0891040.0762590.0891040.0895520.0762560.0895270.0866060.0763400.086652
III2.0128300.4183861.9054602.0125600.4196031.9052002.0172400.4197511.9094001.9662700.4181221.863800
0.0496470.0015940.0444920.0488580.0015590.0437850.0494330.0015590.0442710.0454890.0015610.040839
0.0887770.0766310.0887770.0880880.0758390.0880880.0884840.0758440.0884620.0860830.0758400.086101
Table A2. Empirical Bayes estimates of η , S ( x ) , and h ( x ) (at time x = 1.2 ) with their MSEs and RABs.
Empirical Bayes Estimate
BLINEX
BSE c = 0.3 c = 3.0
η ^ ¯ S ^ ¯ ( x ) h ^ ¯ ( x ) η ^ ¯ S ^ ¯ ( x ) h ^ ¯ ( x ) η ^ ¯ S ^ ¯ ( x ) h ^ ¯ ( x )
MSEMSEMSEMSEMSEMSEMSEMSEMSE
n m T CSRABRABRABRABRABRABRABRABRAB
50251.5I1.9450500.4208091.8413001.9327200.3499981.8243401.8342500.4329101.745690
0.1481820.0058970.1327950.1518260.0219810.1363900.1443940.0049540.128605
0.1557800.1444800.1557800.1602340.2919550.1607520.1535210.1361400.153096
II2.0497400.4132191.9404102.0537200.3907171.9419601.9202900.4148911.825760
0.1620710.0045110.1452420.1692360.0068330.1519260.1147080.0046410.103605
0.1587900.1305900.1587900.1622300.1637430.1623410.1393140.1325480.139770
III2.0132500.4163181.9058602.0117400.3792991.9013201.8936100.4212761.800690
0.1594610.0049250.1429030.1650170.0108040.1481560.1248390.0047530.112253
0.1579560.1351530.1579560.1613620.2034280.1615690.1445230.1337670.144703
3.0I1.9424700.4070311.8388601.9005900.2896871.7912601.8946800.4328881.801660
0.1368380.0040680.1226290.1627280.0292030.1486800.1068730.0044870.095823
0.1491410.1235770.1491410.1653430.3486860.1672770.1331330.1299180.133102
II2.0511900.4129021.9417802.0551600.3901351.9433101.9218000.4146151.827200
0.1619750.0045350.1451560.1688700.0070630.1515760.1144270.0046330.103374
0.1581560.1303300.1581560.1614990.1653600.1616030.1386300.1319750.139109
III2.0188600.4119261.9111702.0113600.3649951.9003901.9120600.4198371.817940
0.1485380.0042450.1331150.1580300.0105720.1422380.1094450.0043960.098626
0.1518350.1265630.1518350.1574040.2050680.1578340.1351540.1283300.135446
401.5I1.9480800.4109701.8441701.9179200.3178661.8093401.9120300.4309031.816450
0.1064630.0039990.0954080.1142520.0206140.1032030.1019580.0035940.091374
0.1322500.1218240.1322500.1395960.2990500.1405040.1295340.1159520.129508
II1.9514400.4083801.8473501.9165300.3114341.8079001.9370100.4300891.839100
0.0993830.0034740.0890630.1096230.0196990.0993750.0906620.0033050.081447
0.1274710.1141510.1274710.1366250.2966950.1378000.1222760.1114480.122376
III1.9520300.4131191.8479101.9268300.3308371.8184301.9083400.4303311.812850
0.1080020.0040590.0967880.1138750.0181800.1026370.1036090.0036290.092842
0.1331320.1221870.1331320.1389020.2775860.1395680.1306420.1166460.130627
3.0I1.9219500.4007701.8194301.8622700.2558981.7536301.9469700.4348951.848630
0.0925710.0029590.0829580.1190590.0349490.1099930.0757730.0031700.068102
0.1237890.1061730.1237890.1432700.4001920.1458450.1115130.1090460.111600
II1.9617200.4026721.8570701.9197500.2931531.8101901.9594900.4278881.860300
0.0923560.0029260.0827660.1078480.0216430.0983370.0764620.0030150.068911
0.1227690.1052080.1227690.1352810.3144750.1367930.1125630.1066850.112746
III1.9368700.4019861.8335501.8846700.2721091.7757401.9497600.4323151.851220
0.0936250.0029730.0839030.1156590.0295720.1063170.0771060.0031410.069353
0.1237070.1062450.1237070.1400780.3643420.1422100.1123630.1084300.112510
100501.5I1.9499500.4087531.845941.9160900.3134111.8075901.9366000.4300011.838590
0.0897940.0033100.080470.0981210.0193070.0888640.0859490.0030280.077128
0.1208800.1114380.120880.1286820.2920660.1296860.1184050.1060570.118455
II2.0200400.4101101.9122902.0094900.3719911.8995801.9765300.4177771.875190
0.0897420.0025640.0804240.0938120.0050760.0843860.0728140.0026820.065684
0.1167470.0970450.1167470.1202070.1498870.1205340.1087240.0990200.108925
III1.9955900.4108561.8891401.9792200.3583401.8700301.9615400.4219631.861210
0.0860570.0027130.0771210.0902610.0078860.0812300.0749180.0026910.067435
0.1155490.1000440.1155490.1195220.1845210.1199410.1100660.0993210.110211
3.0I1.9203200.3999551.8178901.8587900.2544451.7504001.9632100.4347031.863090
0.0788490.0025850.0706620.1034820.0340190.0959000.0656750.0027050.059056
0.1145000.0990100.1145000.1342610.3990180.1369370.1036540.1008550.103738
II2.0156100.4106211.9080902.0048100.3718261.8951001.9730600.4184461.871900
0.0860570.0025000.0771210.0899230.0051040.0808770.0707000.0025980.063743
0.1143150.0957070.1143150.1176740.1505100.1179940.1067490.0972450.106935
III1.9942500.4084691.8878701.9730900.3471231.8637101.9705400.4220081.869600
0.0820050.0024940.0734900.0882840.0089960.0796990.0691940.0025630.062350
0.1131450.0962230.1131450.1186520.1979520.1192720.1060200.0972430.106203
801.5I1.9406000.4050311.8370801.8968400.2967411.7887701.9699700.4306351.868500
0.0610650.0023000.0547240.0710520.0199840.0649550.0593690.0020940.053326
0.1003660.0924440.1003660.1106520.3059500.1121010.0980910.0883770.098141
II1.9441500.4030791.8404401.8978400.2921911.7896201.9859700.4297171.883110
0.0534410.0019820.0478920.0641080.0198490.0588490.0507780.0018150.045659
0.0935630.0862090.0935630.1050100.3093140.1066310.0904620.0821790.090554
III1.9514500.4061821.8473601.9134400.3102271.8052401.9714200.4287031.869790
0.0595170.0022070.0533370.0673550.0164710.0613330.0577860.0020180.051912
0.0981840.0904460.0981840.1065010.2755230.1076660.0964250.0862310.096483
3.0I1.9145400.3957291.8124201.8440000.2358231.7356801.9951600.4347261.892020
0.0537500.0019830.0481690.0781870.0379360.0734620.0449120.0018630.040437
0.0949680.0868510.0949680.1171580.4377170.1203600.0851110.0837380.085243
II1.9448700.4002651.8411301.8931700.2795791.7846001.9956500.4295361.892230
0.0538610.0018500.0482680.0683300.0224070.0631170.0471820.0018030.042488
0.0938060.0825460.0938060.1083670.3342360.1103790.0862340.0819910.086343
III1.9225900.3987001.8200401.8602500.2562371.7521201.9896400.4334031.886700
0.0535240.0018830.0479660.0739270.0306940.0690280.0454660.0018430.040903
0.0947280.0841640.0947280.1137370.3893770.1164410.0856190.0833850.085720

References

  1. Ghitany, M.E.; Tuan, V.K.; Balakrishnan, N. Likelihood estimation for a general class of inverse exponentiated distributions based on complete and progressively censored data. J. Stat. Comput. Simul. 2014, 84, 96–106. [Google Scholar] [CrossRef]
  2. Rastogi, M.K.; Tripathi, Y.M. Estimation for an inverted exponentiated Rayleigh distribution under type II progressive censoring. J. Appl. Stat. 2014, 41, 2375–2405. [Google Scholar] [CrossRef]
  3. Kohansal, A. Large Estimation of the stress-strength reliability of progressively censored inverted exponentiated Rayleigh distributions. J. Appl. Math. Inform. 2017, 13, 49–76. [Google Scholar] [CrossRef]
  4. Kayal, T.; Tripathi, Y.M.; Rastogi, M.K. Estimation and prediction for an inverted exponentiated Rayleigh distribution under hybrid censoring. Commun. Stat.-Theory Methods 2018, 47, 1615–1640. [Google Scholar] [CrossRef]
  5. Maurya, R.K.; Tripathi, Y.M.; Rastogi, M.K. Estimation and prediction for a progressively first-failure censored inverted exponentiated Rayleigh distribution. J. Stat. Theory Pract. 2019, 13, 1–48. [Google Scholar] [CrossRef]
  6. Rao, G.S.; Mbwambo, S. Exponentiated inverse Rayleigh distribution and an application to coating weights of iron sheets data. J. Probab. Stat. 2019, 2019, 7519429. [Google Scholar] [CrossRef]
  7. Rao, G.S.; Mbwambo, S.; Josephat, P.K. Estimation of stress–strength reliability from exponentiated inverse Rayleigh distribution. Int. J. Reliab. Qual. Saf. Eng. 2019, 26, 1950005. [Google Scholar] [CrossRef]
  8. Gao, S.; Yu, J.; Gui, W. Pivotal inference for the inverted exponentiated Rayleigh distribution based on progressive type-II censored data. Am. J. Math. Manag. Sci. 2020, 39, 315–328. [Google Scholar] [CrossRef]
  9. Panahi, H.; Moradi, N. Estimation of the inverted exponentiated Rayleigh distribution based on adaptive Type II progressive hybrid censored sample. J. Comput. Appl. Math. 2020, 364, 112–345. [Google Scholar] [CrossRef]
  10. Fan, J.; Gui, W. Statistical inference of inverted exponentiated rayleigh distribution under joint progressively type-II censoring. Entropy 2022, 24, 171. [Google Scholar] [CrossRef]
  11. Anwar, S.; Lone, S.A.; Khan, A.; Almutlak, S. Stress-strength reliability estimation for the inverted exponentiated Rayleigh distribution under unified progressive hybrid censoring with application. Electron. Res. Arch. 2023, 31, 4011–4033. [Google Scholar] [CrossRef]
  12. Chalabi, L. High-resolution sea clutter modelling using compound inverted exponentiated Rayleigh distribution. Remote Sens. Lett. 2023, 14, 33–441. [Google Scholar] [CrossRef]
  13. Epstein, B. Truncated life tests in the exponential case. Ann. Math. Stat. 1954, 25, 555–564. [Google Scholar] [CrossRef]
  14. Kundu, D.; Joarder, A. Analysis of Type-II progressively hybrid censored data. Comput. Stat. Data Anal. 2006, 50, 2509–2528. [Google Scholar] [CrossRef]
  15. Lin, C.T.; Huang, Y.L.; Balakrishnan, N. Exact Bayesian variable sampling plans for the exponential distribution with progressive hybrid censoring. J. Stat. Comput. Simul. 2011, 81, 873–882. [Google Scholar] [CrossRef]
  16. Lin, C.T.; Huang, Y.L. On progressive hybrid censored exponential distribution. J. Stat. Comput. Simul. 2012, 82, 689–709. [Google Scholar] [CrossRef]
  17. Gürünlü Alma, Ö.; Arabi Belaghi, R. On the estimation of the extreme value and normal distribution parameters based on progressive type-II hybrid-censored data. J. Stat. Comput. Simul. 2016, 86, 569–596. [Google Scholar] [CrossRef]
  18. Kayal, T.; Tripathi, Y.M.; Rastogi, M.K.; Asgharzadeh, A. Inference for Burr XII distribution under Type I progressive hybrid censoring. Commun.-Stat.-Simul. Comput. 2017, 46, 7447–7465. [Google Scholar] [CrossRef]
  19. Asl, M.N.; Belaghi, R.A.; Bevrani, H. Classical and Bayesian inferential approaches using Lomax model under progressively type-I hybrid censoring. J. Comput. Appl. Math. 2018, 343, 397–412. [Google Scholar] [CrossRef]
  20. Basu, S.; Singh, S.K.; Singh, U. Bayesian inference using product of spacings function for Progressive hybrid Type-I censoring scheme. Statistics 2018, 52, 345–363. [Google Scholar] [CrossRef]
  21. Goyal, T.; Rai, P.K.; Maurya, S.K. Bayesian estimation for GDUS exponential distribution under type-I progressive hybrid censoring. Ann. Data Sci. 2020, 7, 307–345. [Google Scholar] [CrossRef]
  22. Berger, J.O. Statistical Decision Theory and Bayesian Analysis; Springer: New York, NY, USA, 1985. [Google Scholar]
  23. Wang, F.K.; Keats, J.B.; Zimmer, W.J. Maximum likelihood estimation of the Burr XII parameters with censored and uncensored data. Microelectron. Reliab. 1996, 36, 359–362. [Google Scholar] [CrossRef]
  24. Zimmer, W.J.; Keats, J.B.; Wang, F.K. The Burr XII distribution in reliability analysis. J. Qual. Technol. 1998, 30, 386–394. [Google Scholar] [CrossRef]
  25. Nassar, M.M.; Eissa, F.H. Bayesian estimation for the exponentiated Weibull model. Commun. Stat.-Theory Methods 2005, 33, 2343–2362. [Google Scholar] [CrossRef]
  26. Kim, C.; Jung, J.; Chung, Y. Bayesian estimation for the exponentiated Weibull model under Type II progressive censoring. Stat. Pap. 2011, 52, 53–70. [Google Scholar] [CrossRef]
  27. Calabria, R.; Pulcini, G. Point estimation under asymmetric loss functions for left-truncated exponential samples. Commun. Stat.-Theory Methods 1996, 25, 585–600. [Google Scholar] [CrossRef]
  28. EL-Sagheer, R.M.; Eliwa, M.S.; Alqahtani, K.M.; EL-Morshedy, M. Asymmetric randomly censored mortality distribution: Bayesian framework and parametric bootstrap with application to COVID-19 data. J. Math. 2022, 2022, 1–14. [Google Scholar] [CrossRef]
  29. Zellner, A. Bayesian and Non-Bayesian Estimation Using Balanced Loss Functions; Springer: New York, NY, USA, 1994; pp. 377–390. [Google Scholar]
  30. Ahmadi, J.; Jozani, M.J.; Marchand, É.; Parsian, A. Bayes estimation based on k-record data from a general class of distributions under balanced type loss functions. J. Stat. Plan. Inference 2009, 139, 1180–1189. [Google Scholar] [CrossRef]
  31. Jafari, J.M.; Marchand, É.; Parsian, A. Bayesian and Robust Bayesian analysis under a general class of balanced loss functions. Stat. Pap. 2012, 53, 51–60. [Google Scholar] [CrossRef]
  32. Oksuz, K.; Cam, B.C.; Akbas, E.; Kalkan, S. A ranking-based, balanced loss function unifying classification and localisation in object detection. Adv. Neural Inf. Process. 2020, 33, 15534–15545. [Google Scholar]
  33. Yousef, M.M.; Almetwally, E.M. Multi stress-strength reliability based on progressive first failure for Kumaraswamy model: Bayesian and non-Bayesian estimation. Symmetry 2021, 13, 2120. [Google Scholar] [CrossRef]
  34. Benkhaled, A.; Hamdaoui, A.; Almutiry, W.; Alshahrani, M.; Terbeche, M. A study of minimax shrinkage estimators dominating the James-Stein estimator under the balanced loss function. Open Math. 2022, 20, 1–11. [Google Scholar] [CrossRef]
  35. Xie, Z.; Shu, C.; Fu, Y.; Zhou, J.; Chen, D. Balanced Loss Function for Accurate Surface Defect Segmentation. Appl. Sci. 2023, 13, 826. [Google Scholar] [CrossRef]
  36. Yan, S.; Gendai, G. Bayes estimation for reliability indexes of cold standby system. J. N. China Electr. Power Univ. 2003, 30, 96–99. [Google Scholar]
  37. Shi, Y.; Shi, X.; Xu, Y. Approximate confidence limits of the reliability performances for a cold standby series system. J. Appl. Math. Comput. 2005, 19, 439–445. [Google Scholar] [CrossRef]
  38. Petrone, S.; Rizzelli, S.; Rousseau, J.; Scricciolo, C. Empirical Bayes methods in classical and Bayesian inference. Metron 2014, 72, 201–215. [Google Scholar] [CrossRef]
  39. Gross, A.J.; Clark, V.A. Survival Distributions: Reliability Applications in the Biomedical Sciences; Wiley: New York, NY, USA, 1975; Volume 11. [Google Scholar]
Figure 1. Plots of PDF, CDF, reliability function, and failure rate function of IER distribution for different parameter values.
Axioms 12 00872 g001
Figure 2. The procedure for creating order statistics for Type-I PHCS when X m : m : n < T .
Axioms 12 00872 g002
Figure 3. The procedure for creating order statistics for Type-I PHCS when X k : m : n < T < X k + 1 : m : n .
Axioms 12 00872 g003
Figure 4. Histogram and Empirical CDF (Red color) against PDF and CDF (Blue color) of IER distribution for the above dataset.
Axioms 12 00872 g004
Table 1. Three different CSs.
IIIIII
R 1 = n m , R m = n m , R 1 = = R n m = 1 ,
R 2 = = R m = 0 R 1 = = R m 1 = 0 R n m + 1 = = R m = 0
Table 2. The dataset under Type-I PHCS.
nmTCSCensored Data
20161.75I1.1, 1.5, 1.6, 1.6, 1.7, 1.7, 1.7
II1.1, 1.2, 1.3, 1.4, 1.4, 1.5, 1.6, 1.6, 1.7, 1.7, 1.7
III1.1, 1.3, 1.4, 1.6, 1.7, 1.7, 1.7
2.75I1.1, 1.5, 1.6, 1.6, 1.7, 1.7, 1.7, 1.8, 1.8, 1.9, 2., 2.2, 2.3, 2.7
II1.1, 1.2, 1.3, 1.4, 1.4, 1.5, 1.6, 1.6, 1.7, 1.7, 1.7, 1.8, 1.8, 1.9, 2., 2.2
III1.1, 1.3, 1.4, 1.6, 1.7, 1.7, 1.7, 1.8, 1.8, 1.9, 2., 2.2, 2.3, 2.7
Table 3. Based on the data given in Table 2, MLEs and Bayes estimates of η , S ( x ) , and h ( x ) (at time x = 1.35 ).
Bayes Estimate
BLINEX
MLEBSE c = 0.3 c = 3.0
n m T CS η ^ S ^ ( x ) h ^ ( x ) η ^ S ^ ( x ) h ^ ( x ) η ^ ¯ S ^ ( x ) h ^ ( x ) η ^ S ^ ( x ) h ^ ( x )
20161.75I2.74170.86850.64152.79270.86690.65352.89170.86710.65852.07880.86510.6102
II4.07430.8110.95334.04840.81290.94734.18030.81310.95412.95380.81080.8855
III2.65570.87240.62142.71020.87060.63422.80350.87070.63892.03680.86890.5933
2.75I3.00850.85670.7043.02880.85620.70873.08730.85630.71182.51490.85510.6804
II4.04760.81210.94714.03040.81340.94314.12080.81360.94783.19730.81190.8988
III2.9560.8590.69172.97770.85840.69683.03430.85850.69972.48160.85740.6694
Table 4. Based on the data given in Table 2, empirical Bayes estimates of η , S ( x ) , and h ( x ) (at time x = 1.35 ).
Empirical Bayes Estimate
BLINEX
BSE c = 0.3 c = 3.0
n m T CS η ^ S ^ ( x ) h ^ ( x ) η ^ S ^ ( x ) h ^ ( x ) η ^ S ^ ( x ) h ^ ( x )
20161.75I2.8070.88190.65682.91110.92070.70372.04770.86121.6901
II4.07690.80220.95394.22530.77760.93783.01510.81122.3031
III2.73150.88770.63912.83320.93230.69272.00560.86411.6541
2.75I2.99140.84160.69993.0450.80050.65952.53540.86011.8589
II3.9680.78640.92854.0840.70870.863.27210.81962.3308
III2.93920.84350.68772.98980.80150.64592.50150.86251.8363
Disclaimer/Publisher’s Note: The statements, opinions and data contained in all publications are solely those of the individual author(s) and contributor(s) and not of MDPI and/or the editor(s). MDPI and/or the editor(s) disclaim responsibility for any injury to people or property resulting from any ideas, methods, instructions or products referred to in the content.

