The Prismatic Layer of Pinna: A Showcase of Methodological Problems and Preconceived Hypotheses
by
 , ,
, ,
Yannicke Dauphin
1,* ,
,
Alain Brunelle
2,
Kadda Medjoubi
3,
Andrea Somogyi
3 and
Jean-Pierre Cuif
4 1
Institut de Systématique, Evolution, Biodiversité (ISYEB), UMR 7205 CNRS MNHN Sorbonne Université, EPHE, Muséum National d’Histoire Naturelle, 75005 Paris, France
2
Institut de Chimie des Substances Naturelles, CNRS UPR 2301, Université Paris-Sud, Université Paris-Saclay, Avenue de la Terrasse, 91192 Gif-sur-Yvette, France
3
Nanoscopium Beamline, Synchrotron Soleil, 91192 Gif-sur-Yvette, France
4
Centre de Recherche sur la Paléodiversité et les Paléoenvironnements (CR2P), UMR 7207, Muséum National d’Histoire Naturelle CNRS, Sorbonne Université, 75005 Paris, France
*
Author to whom correspondence should be addressed.
Minerals 2018, 8(9), 365; https://doi.org/10.3390/min8090365
Submission received: 22 June 2018
/
Revised: 10 August 2018
/
Accepted: 14 August 2018
/
Published: 22 August 2018
(This article belongs to the Special Issue Biomineral Crystal Structure)
Abstract
:The prismatic layer of Pinna (Mollusca) is one of the most studied models for the understanding of the biomineralization mechanisms, but our knowledge of the organic components of this layer is limited to the proteins of the soluble organic matrices. The interplay of the mineral and organic matrices is studied using scanning electron and atomic force microscopy, infra-red spectrometry, thermogravimetric analyses, aminoacids analyses, thin layer chromatography (TLC), X-ray fluorescence, X-ray Absorption near Edge Structure (XANES) and time-of-flight secondary ion mass spectrometry (TOF-SIMS). Proteins, polysaccharides and lipids are detected within the prisms and their envelopes. The role of the technical choices to study calcareous biominerals is evidenced, showing that a single analysis is not enough to decipher complex biominerals.
1. Introduction
Mollusk shells are heterogeneous materials at all hierarchical levels of organization. They comprise several layers, the mineralogy and structure of which differ. They are also biocomposites, with mineral (CaCO3) and organic phases [1]. Organic components, known as organic matrices, are extracellular and they are key participants in the control of the biomineralization process. Although only few species are studied from this point of view, data demonstrate that the organic matrix is both structure and species specific. The first comprehensive study of the mineralogy and structure of mollusk shells was done by Boggild [2]. Using the scanning electron microscope, the papers of Taylor et al. [3,4] are focused on Bivalve shells. Now, most studies are still dedicated to the nacro-prismatic bivalve shells (Pinna, Atrina and Pinctada), despite the rarity of this arrangement. Because of the very regular arrangement of the tablets, its iridescence, and its commercial interest in jewelry (natural and cultured pearls), the best-known layer is the aragonite nacreous layer. Moreover, in some taxa (Pinctada), the nacreous layer is very thick and, therefore, easy to extract and to study.
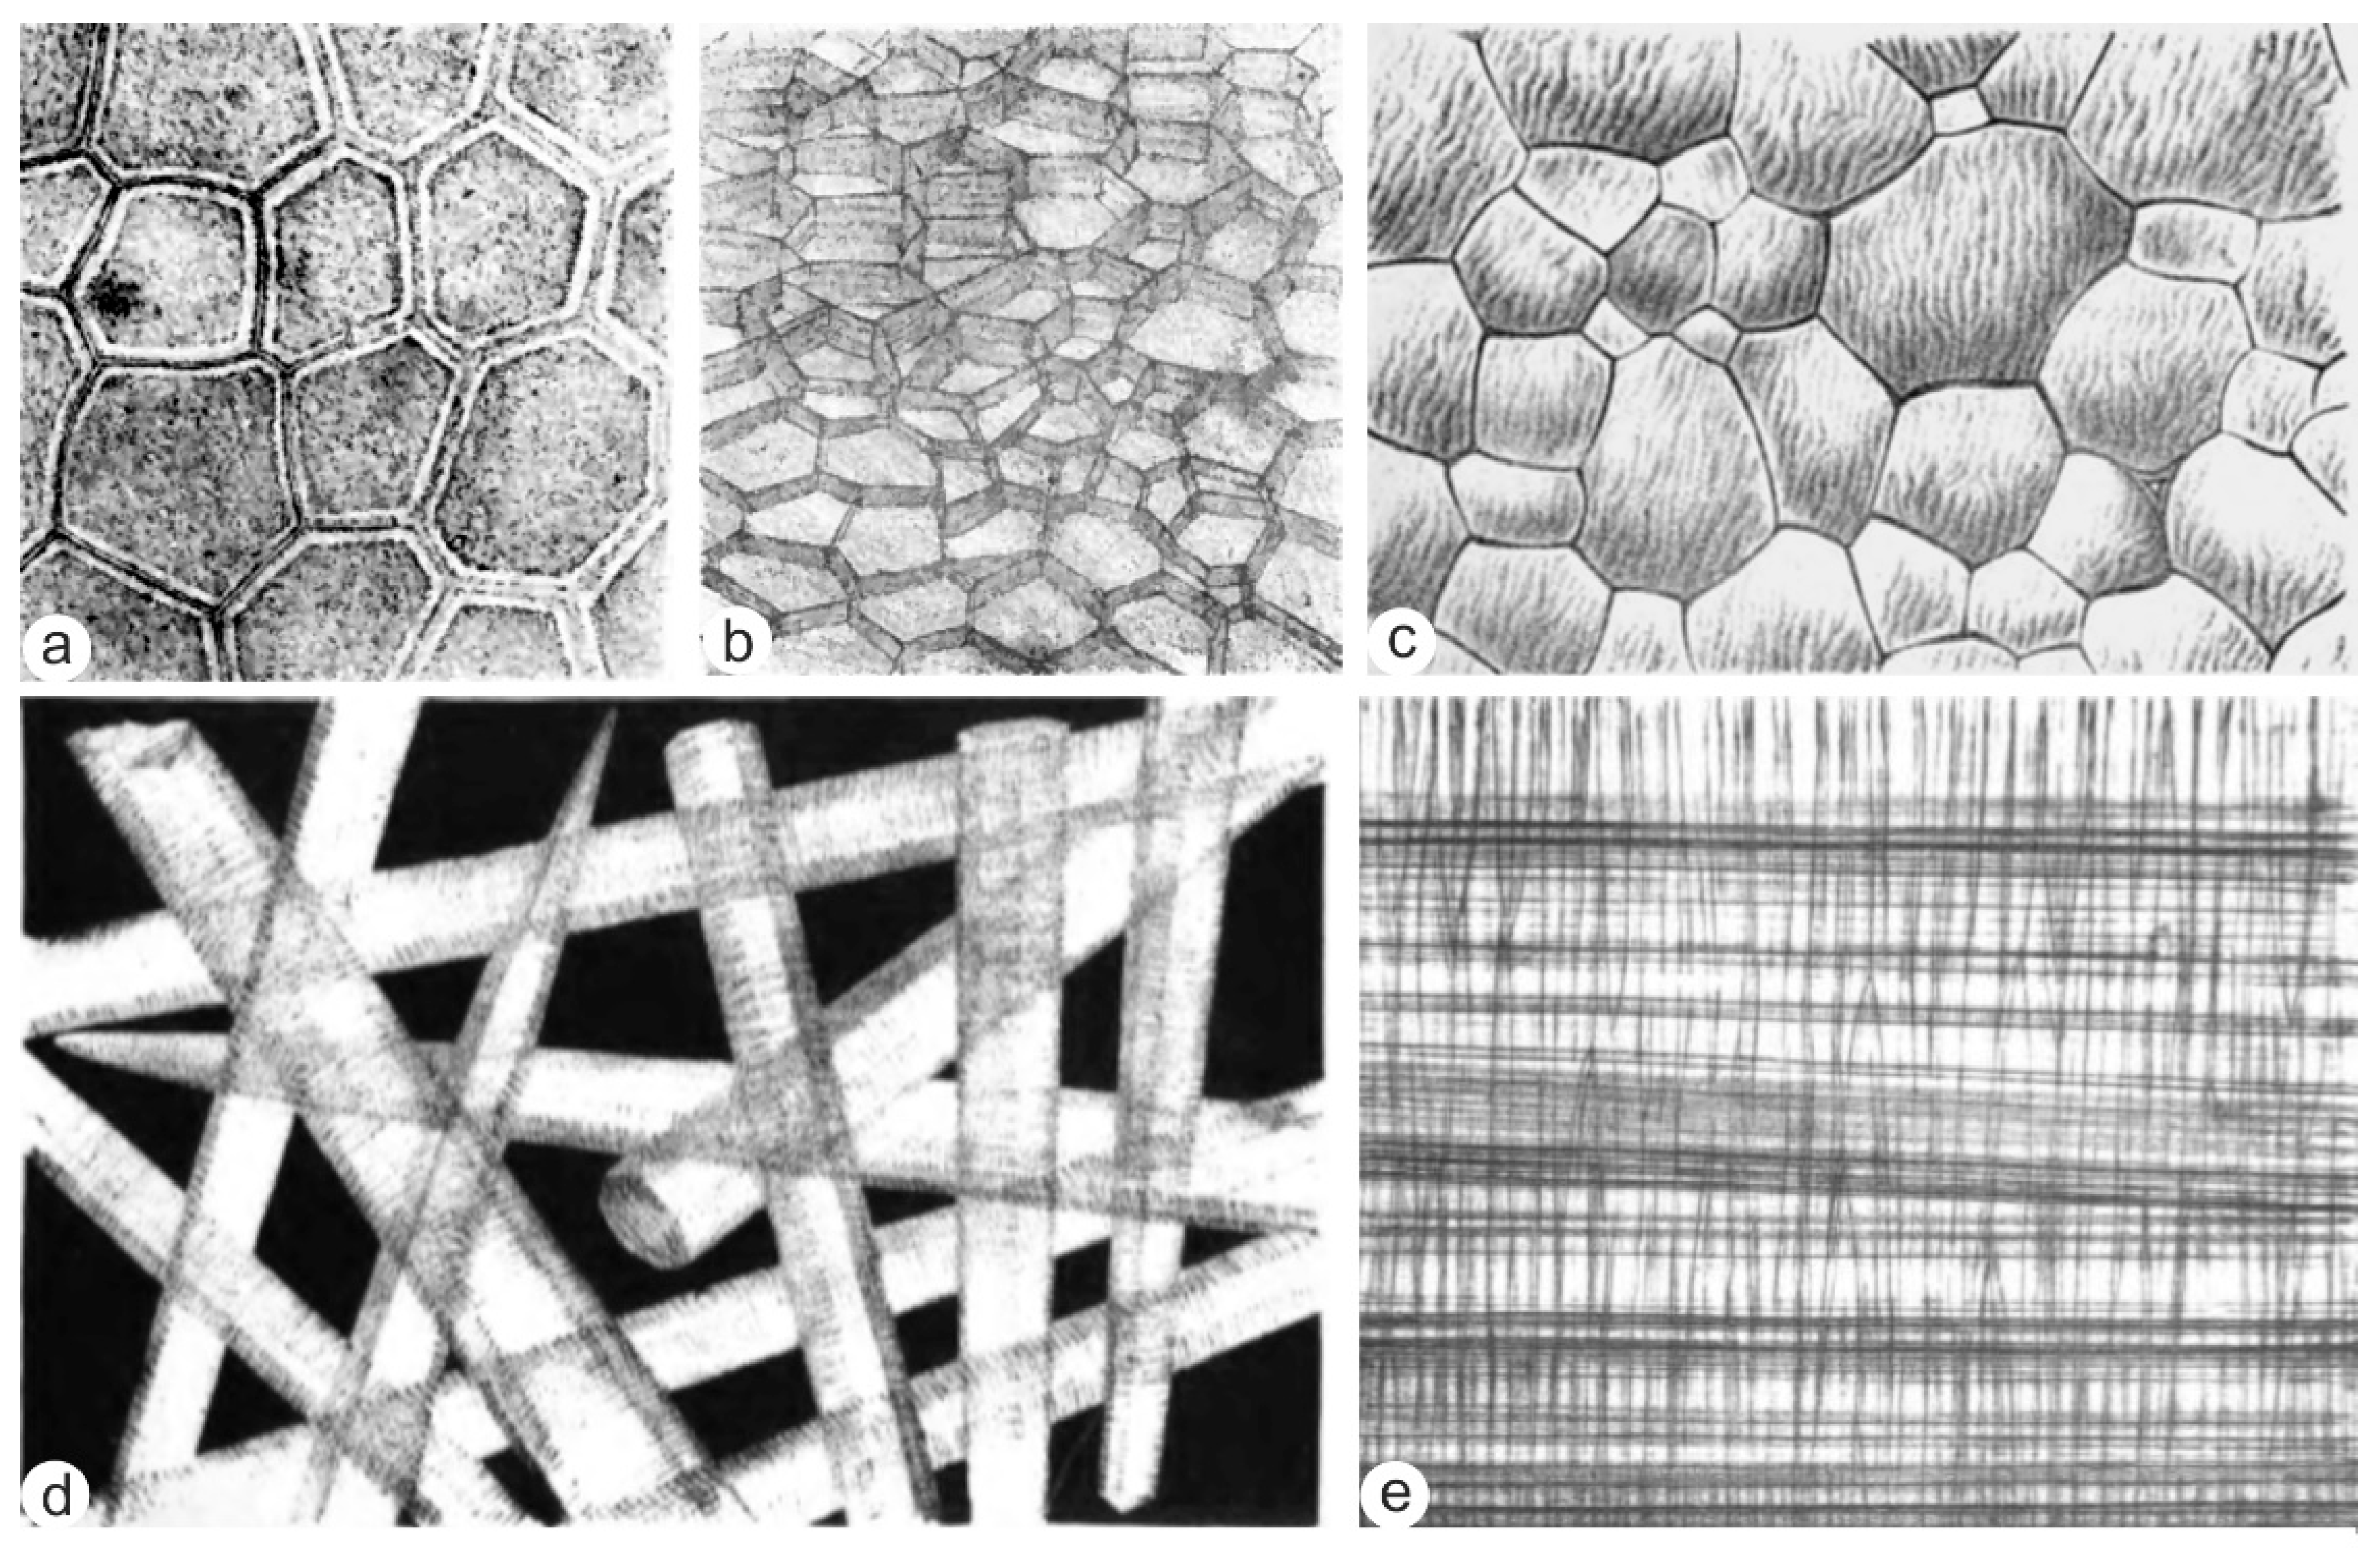
The main part of the shell of Pinna is prismatic. Pinna was abundant in the Mediterranean Sea, and its large shell was among the first to be observed. Moreover, the prisms are large with a simple geometry, and visible with optical microscopes [5,6,7]. Bowerbank [5] has illustrated the thick inter-prismatic membranes (Figure 1a,b). The crests on the outer surface of the prisms of Pinna, the individual shape and the synchronism of the growth layers, were clearly displayed by Carpenter [6] (Figure 1c–e).
Despite the large size of the prismatic layer of Pinna and Atrina (a close relative of Pinna), data on the inner structure and composition of the prisms are still scarce [8,9,10,11,12,13] when compared to the nacreous layer. In Pinna, the most striking evidence of the organic matrix is the inter-prismatic membrane (Figure 1a). These thick membranes are not destroyed by decalcification, so they are said to be the insoluble organic matrix (IOM). The intra-prismatic organic matrix extracted by demineralization of the prismatic layer is usually considered as soluble (SOM), but chitin fibers have been described within the prism of Atrina [14,15]. Using dilute NaOCl, it is easy to destroy the inter-prismatic membranes to obtain isolated prisms of Pinna, and a comparison of the soluble organic matrix with and without the inter-prismatic membranes has shown compositional differences [11]. Thus, the general agreement on what are the IOM and SOM is only a hypothesis, and the definition of soluble and insoluble matrices is not straightforward.
In the present report, we used a series of in situ analyses for a better understanding of the topographical interplay between the mineral and organic matrix in Pinna shell. These analyses were combined with those performed on the organic matrices extracted from the shells, to try to characterize what and where are the soluble and insoluble matrices.
2. Materials and Methods
2.1. Material
Shells of Pinna were collected alive. Pinna nobilis Linnaeus, 1758 (Mollusca, Ostreida, Pinnidae) come from the Mediterranean Sea. The shell is long (up to 1 m), with a red colour (Figure 2a). The outer surface shows undulating growth lamella (Figure 2a, insert). Pinna muricata shells come from Madagascar; they are smaller than P. nobilis, and mostly white. In both species, the inner aragonite nacreous layer is thin and present only in the oldest part of the valve [7] (Figure 2a); the major part of the shell is composed of the calcite prisms.
Standards were commercial analytic grade. A phospholipid mixture was used for polar lipids: l-α-Lysophosphatidylcholine, l-α-Phosphatidylcholine and l-α-Phosphatidylinositol ammonium salt from soybean, and l-α-Phosphatidylethanolamine from Escherichia coli. Cholesterol was used as standard for sterols, triolein for triglycerides, oleic acid for free fatty acids, stearyl oleate for waxes, and cholesteryl oleate for sterol esters. Chitin from crab shells, bovine serum albumin (BSA), collagen, glucose and chondroitin sulphate were obtained from Sigma Aldrich (St. Quentin Fallavier, France). CaCO3 (rectapur quality) was made by Prolabo (Fontenay sous bois, France).
2.2. Methods
Fragments of the prismatic layer were selected in the zone devoid of nacre. Removal of the remaining living tissues and organic contaminants was done by immersion of fragments in 3% NaOCl for 1 h, followed by extensive washing with Milli-Q water. They were air dried. To obtain isolated prisms, without the inter-prismatic membrane, samples were maintained under gentle rocking in 3% NaOCl. Disaggregation of the prisms began after 24 h. Subsequently, samples were washed in Milli-Q water and air dried.
2.2.1. Scanning Electron and Atomic Force Microscopy
Unetched and etched fragments were first observed. Then, polished sections were etched to reveal microstructural features. The detailed procedures of the sample preparations are given in the figure legends. Scanning electron microscope (SEM) observations were conducted using a Philips 505 and a Philips XL30 (Eindhoven, The Netherlands) instrument in secondary electron mode on Au-Pd coated samples. Uncoated preparations were observed using a Phenom ProX in back-scattered electron mode (BSE).
Atomic force microscope (AFM) observations were conducted in air at room temperature using a Nanoscope IIIa Dimension 3100 (Veeco, Plainview, NY, USA). The probe consists of a cantilever with an integrated silicon nitride tip. AFM maps the topography of the surface of the sample with a resolution in the order of a few nm in tapping mode. Tip-sample force interactions cause changes in amplitude, phase and the resonance frequency of the oscillating cantilever. The spatial variation of the change can be presented in height (topography) or interaction (amplitude or phase) images, simultaneously collected. Phase images were generated as a consequence of variations in material properties including composition, friction and adhesion. It is generally admitted that hard materials have a light aspect in AFM, so that the darker regions correspond to soft material, organic matter or amorphous minerals [16,17]. The detailed procedures of the sample preparations are given in the figure captions.
2.2.2. Bulk Composition on Powders (Thermogravimetric Analyses—Infrared Spectrometry)
For both thermogravimetric analyses (TGA) and Fourier transform infrared spectrometer (FTIR) analyses, pieces of the prismatic layer previously cleaned with NaOCl were reduced to a powder by grinding with an electric mortar for 10 min.
The TGA of standards and of the prismatic layer powders were carried out with a TGA 4000 (Perkin-Elmer, Courtaboeuf, France). The sample weight loss was monitored while temperature increases: an isothermal stage at 100 °C for 5 min, followed by a gradient from 100 to 900 °C at a rate of 10 °C/min under nitrogen atmosphere.
All infrared spectra were recorded at 4 cm−1 resolution with 16 scans on a Perkin-Elmer Frontier FTIR, in the wave-number range from 4000 to 450 cm−1. The spectrometer was equipped with a diffuse reflectance accessory which permits DRIFT measurements with high sensitivity on powders. All spectra were corrected by the Kubelka-Munk function. A background spectrum was measured for pure KBr. Sample spectra were automatically ratioed against background to minimize CO2 and H2O bands. Correlation coefficients between two spectra of the same samples were about 99%. All samples and KBr were mixed, and reduced to a powder by grinding with an electric mortar for 10 min to obtain homogeneous granulometry. They were oven-dried at 38 °C overnight. Powdered samples and KBr were mixed (about 5% powdered samples in KBr) and loaded into the sample cup.
2.2.3. TOF-SIMS (Time-of-Flight Secondary Ion Mass Spectrometry)
Images were recorded using a standard commercial TOF-SIMS IV (ION-TOF GmbH, Münster, Germany) reflectron-type TOF mass spectrometer [18]. Bi3+ cluster ions (25 keV) were selected as primary ions from a bismuth liquid metal ion gun. A first setting mode of the primary ion column was used to record a reference mass spectrum and ion images over an area of 500 Φm × 500 Φm with a spatial resolution of 2 Φm (256 × 256 pixels), a mass resolution M/ΔM > 5000 (full-width at half-maximum) at m/z > 500, and a primary ion dose of 3.4 × 10¹¹ ions·cm−2. A second setting mode of the primary ion column was then used to record an image over an area of 100 Φm × 100 Φm with a spatial resolution of 400 nm, but with only a nominal mass resolution. In that case, the primary ion dose was 1.0 × 10¹² ions·cm−2 (a more recent method using a delayed extraction of the secondary ions enables this spatial resolution of 400 nm while keeping a mass resolution of several thousand) [19]. In all cases, a low energy electron flood gun (20 eV) was activated between two pulses of the primary ion beam to neutralize any charge on the surface of the samples. The mass calibration of the spectra was internal, using H+, C+, CH+, CH2+, CH3+ and C3H2+ ion peaks in the positive ion mode. Mass accuracies were always better than a few tens of ppm. Samples were polished with diamond pastes.
2.2.4. EPMA (Electron Probe Micro Analyze)
A CAMECA (Genevilliers, France) SX50 wavelength−dispersive electron microprobe equipped with four wavelength dispersive detectors at the Natural History Museum of London was used to obtain the compositions and elemental maps of the samples. For quantitative analysis, operating conditions were 15-kV accelerating voltage and 20-nA specimen current. For element maps a 100-nA specimen current and a 15-kV accelerating voltage were employed.
2.2.5. XRF (X-ray Fluorescence)
The high analytical sensitivity XRF imaging was performed at the Nanoscopium beamline of SOLEIL Synchrotron (St Aubin, France) [20]. The incident X-ray beam of 10 keV energy was focused by a Kirckpatrick-Baez mirror to 0.3 × 0.3 µm2 size at the sample position. The elemental distribution maps were collected in continuous scanning (FLYSCAN) mode by two Si-drift detectors (Ketek, Munich, Germany) in air. Information on the sample morphology was obtained by scanning transmission X-ray microscopy (STXM) by using a fast XPAD pixel-detector having 120 × 560 pixels of 130 μm pixel-size. Pinna muricata was selected because the shell is thin, meaningthat no preparation was necessary.
2.2.6. XANES Spectroscopy Analyses (X-ray Absorption near Edge Structure)
The work was carried out at the ID21 X-ray micro-spectroscopy beamline of the European Synchrotron Radiation Facility (ESRF, Grenoble, France) using the scanning X-ray microscope. The beam was focused by a fixed-curvature Kirkpatrick-Baez mirrors system down to a submicron X-ray probe. An energy dispersive Ge detector (Gamma-Tech, Princeton, NJ, USA) was mounted in the horizontal plane perpendicular to the beam to collect the fluorescence emission photons. XANES energy scan at the S K-edge (2.472 keV) was achieved using a fixed-exit double-crystal Si(111) monochromator located upstream of the microscope. XANES spectra were acquired between 2.13 keV and 2.2 keV with 0.2 eV steps. This experiment required the X-ray microscope to be operated under vacuum to avoid the strong absorption of the S emission lines by air.
Reference spectra of standard compounds were acquired for energy calibration in unfocused mode (i.e., without the zone plate but with a 200 Φm aperture defining the beam size). For these standards, the HpGe detector was replaced by a Si photodiode to measure the high-intensity fluorescence signal. Standards were finely ground and deposited between two ultralene foils. Energy scans between 2450 and 2540 eV were performed with 0.225 eV increments. In situ XANES spectra were collected in focused mode on selected points of the sample to assess S speciation at high spatial resolution. For in situ punctual analyses, Pinna samples were polished to a mirror finish using a series of diamond pastes. The residue from the diamond paste was removed with a detergent diluted in hot water for 1 min, then rinsed with tap water. Samples were then etched with 1% v/v acetic acid for 5 s to eliminate potential surface contamination.
2.2.7. Extraction of Insoluble Organic Matrix
About 3 g of powdered samples were dispersed in 25 mL of Milli-Q water by magnetic stirring, then decalcified by progressive addition of 50% acetic acid to maintain the pH above 4. The entire extract was centrifuged at 21,000× g for 15 min, which separated the supernatant (SOM: soluble organic matrix) and precipitated (IOM: insoluble organic matrix) fractions. The insoluble fraction was desalted by successive centrifugations in Milli-Q water, and lyophilized. The soluble fraction was desalted by exchange with Milli-Q water on a microconcentrator (Filtron) using a 3-kDa cut-off membrane and lyophilized.
2.2.8. Aminoacid Composition
Freeze-dried soluble organic matrix was hydrolyzed with 6 N HCl for 24 h at 110 °C. During hydrolysis, complete or partial destruction of several aminoacids occurs: tryptophan is destroyed, serine and threonine are partially destroyed, and sulphur aminoacids are altered [21]. Amino acid composition of the hydrolysates was determined by high performance liquid chromatography (HPLC) using pre-column derivatization with ortho-phthalaldehyde (OPA) for primary amines and fluorometric detection. Fluorescence intensity of OPA-derivative aminoacids was monitored with an excitation wavelength of 330 nm and an emission wavelength of 450 nm.
2.2.9. Lipid Extractions and Analyses
Powders of prisms with and without the inter-prismatic membranes were soaked in warm chloroform/methanol (1:1 v/v) for three days, under a mild and constant stirring, and sonicated every day for 5 min. The mixture was then centrifuged at 19,500× g for 5 min to separate the powder and insoluble parts from the solvent-soluble part. The soluble parts (LIP) were finally concentrated by evaporation. It must be noted that we do not expect to recover all the light lipids because evaporation may occur at several preparative stages, mainly during the concentration.
The lipid classes of the soluble parts extracted from prisms with and without the inter-prismatic membranes were analyzed by one-dimensional, thin-layer chromatography (TLC). 100 μL of the concentrated extracts were applied to high performance thin layer chromatography plates (HPTLC). The plates are 10 cm × 10 cm nano-silica gel plates from Machery-Nagel (Hoerdt, France). A three-stage development process was used. They were first developed to their full height with pure n-hexane, then again to full height with pure benzene, and finally to half height with hexane: ether: acetic acid (70:30:1 by vol.). After drying, the plates were immersed in a mixture of phosphoric acid: 33% acetic acid: sulfuric acid: 0.5% copper sulphate (5:5:0.5:90 by vol.) for 40 s, and heated at 110 °C for 15 min. The positions are compared with individual standards and 10 μL of a mixture of the commercial standards.
3. Results
3.1. Structural Data
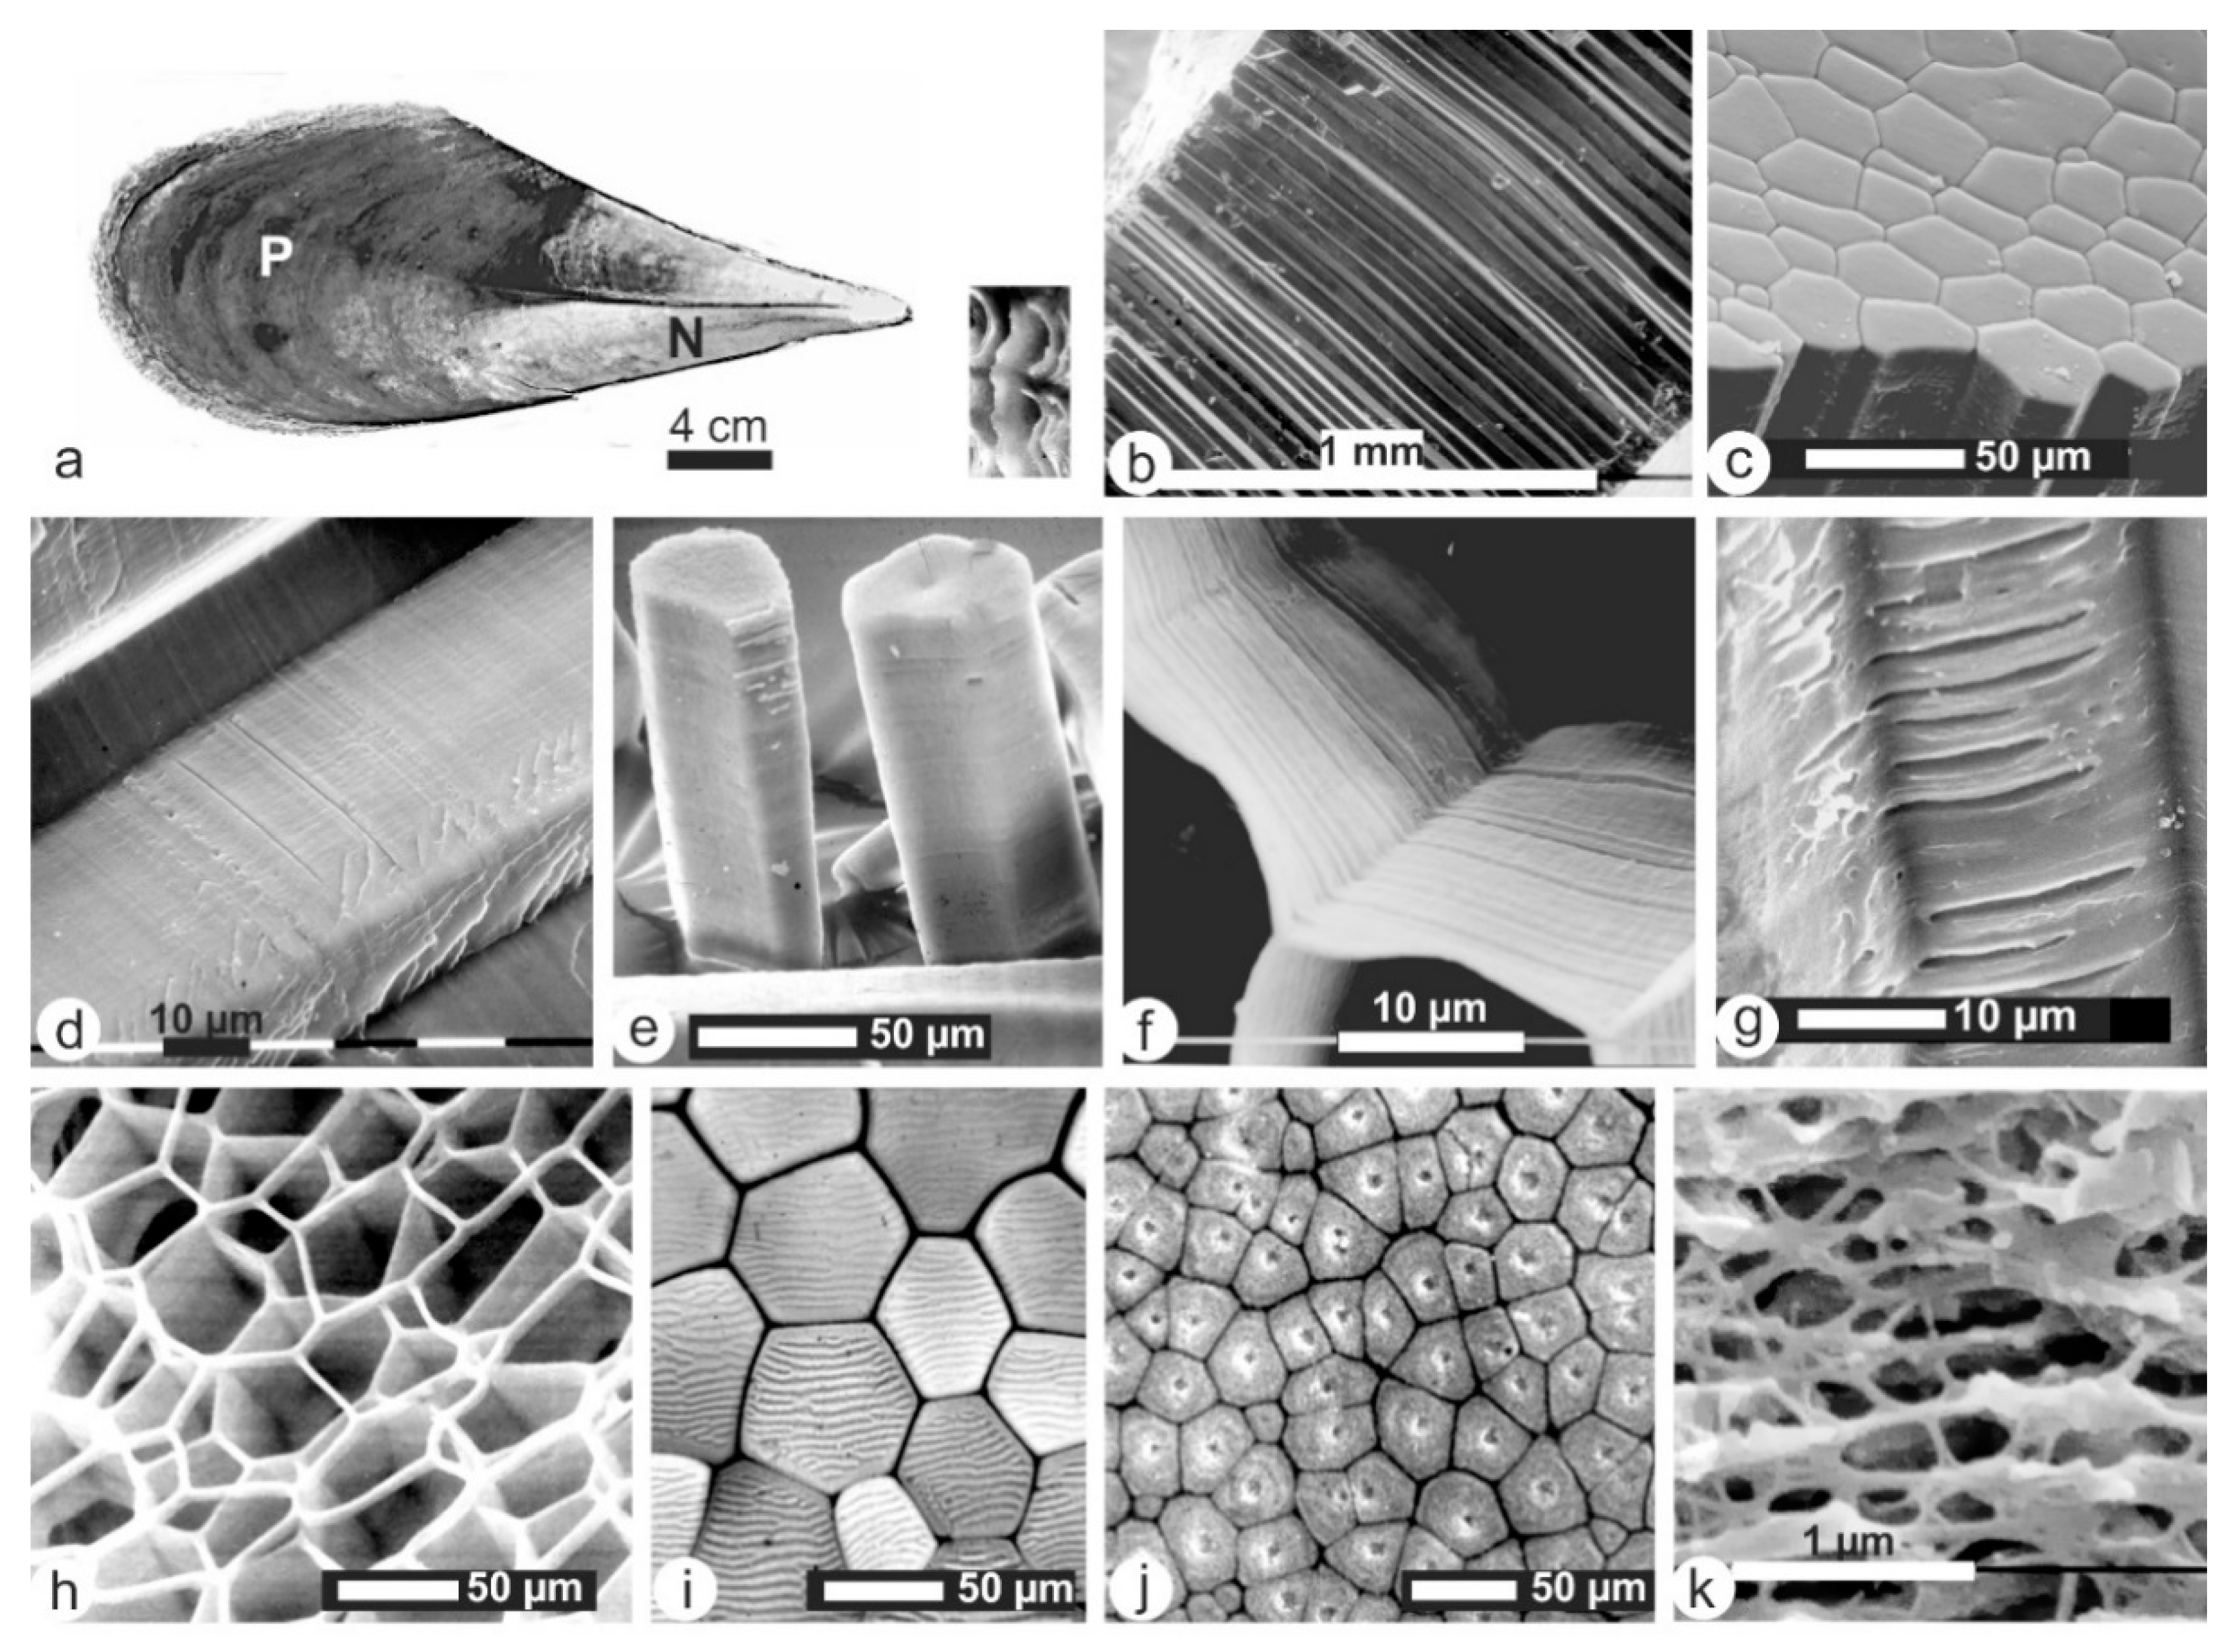
Since the first observations of Bowerbank [5] and Carpenter [6], the shape and size of the prismatic units of Pinna have been repeatedly described, so that only the main microstructural features are briefly shown (Figure 2). The prisms are long, straight, with a polygonal section (Figure 2b,c). Faint growth lines are visible on some fractures (Figure 2d), and on isolated prisms (Figure 2e). When the intra-prismatic material is partly destroyed, major and minor growth layers are displayed on the longitudinal surfaces of the inter-prismatic membranes (Figure 2f). Some subunits of the membranes are dissolved by an organic solvent (chloroform) (Figure 2g). The growth layers building the inter-prismatic membranes are dissociated when the shell is slowly decalcified (Figure 2h). Growing surfaces show the inter-prismatic membranes, the polygonal shape of the prisms and the parallel crests and grooves in every prism (Figure 2i). On the surface of a growth lamellar, a “centre” is visible, probably rich in organic matrix (Figure 2j) [22]. Fixed and decalcified samples show remains of the intra-prismatic organic matrix, mainly the insoluble part (Figure 2k).
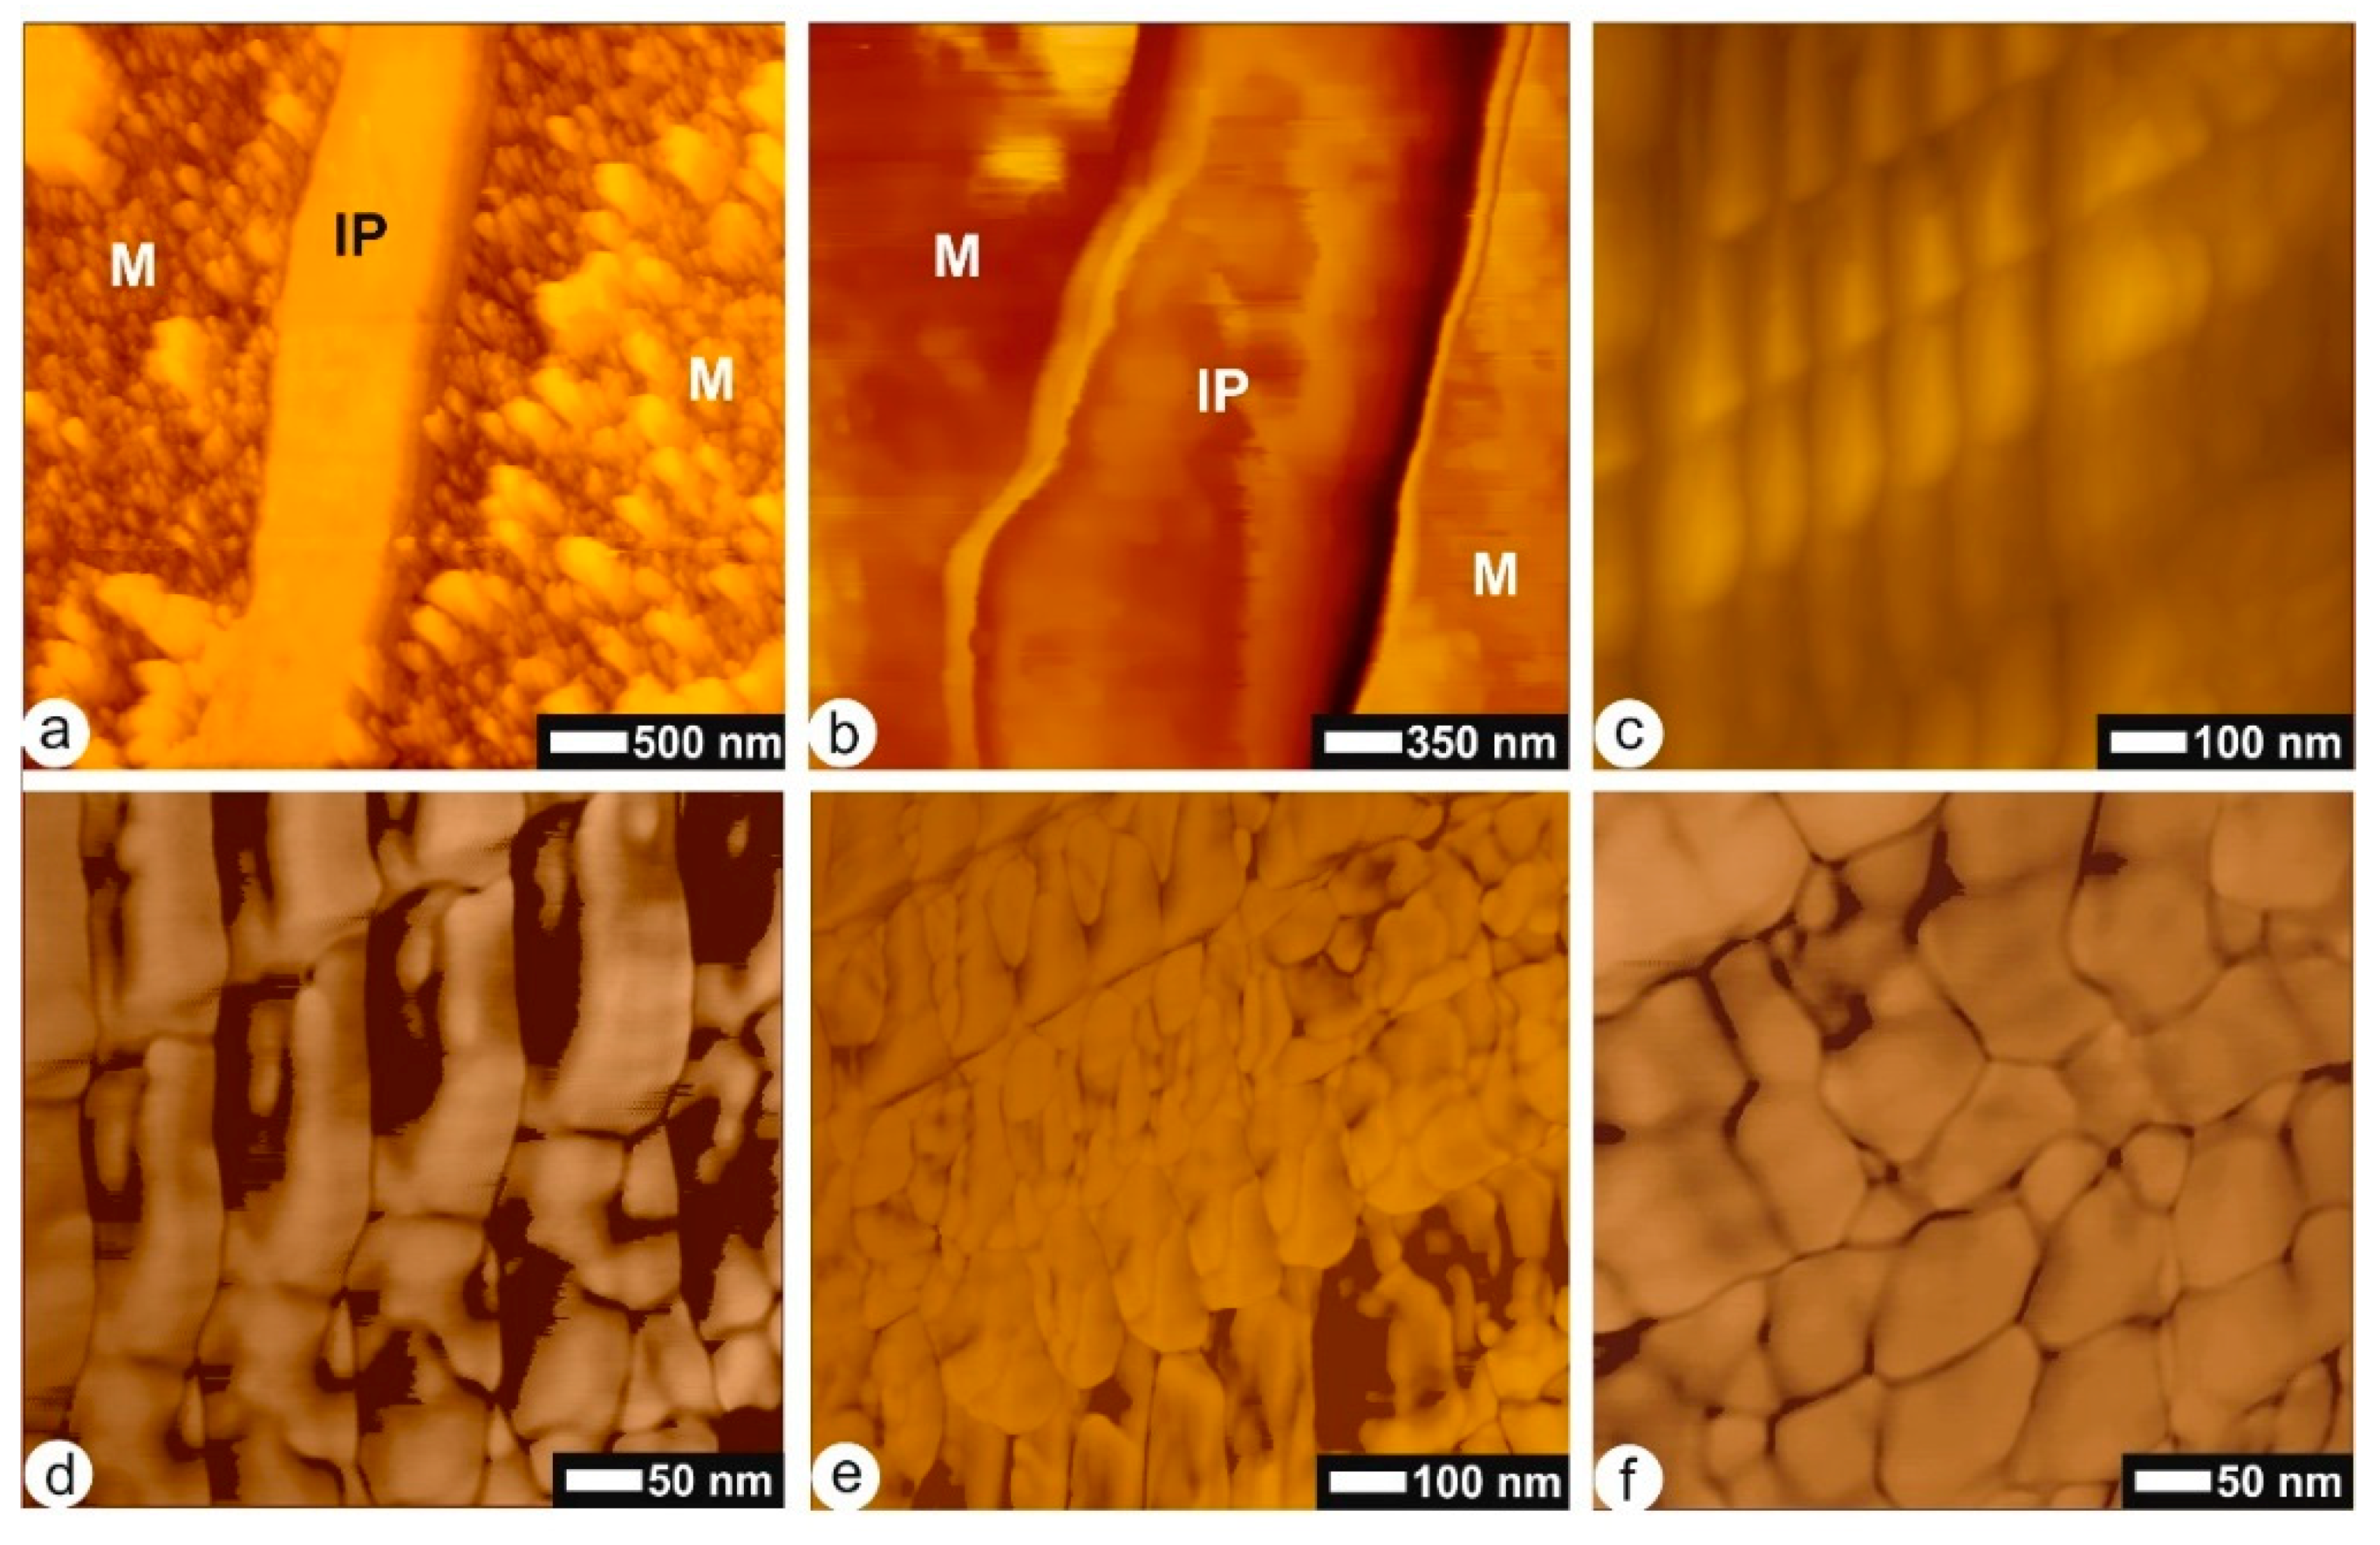
AFM images show the structure of the inter-prismatic membranes (Figure 3a–e). A height image of a polished, fixed and etched longitudinal section shows the difference between the organic membrane and the intra-prismatic zone (Figure 3a). The surface of the membrane seems smooth in height images (topographic image similar to a secondary electron image in SEM), but a phase image reveals the structure of both the main part and the edge of the membrane (Figure 3b). Locally, the surface of the membrane is visible (Figure 3c–d). Regular columns of different shaped corpuscles are arranged in rows or growth layers (Figure 3c). Despite the corpuscles seeming smooth and homogeneous in a height image (Figure 3c), they are not as shown by phase image (Figure 3d). Rows of elongated corpuscles alternate with more rounded corpuscles (Figure 3e). The size of these corpuscles is similar to those observed in the intra-prismatic zones (Figure 3f).
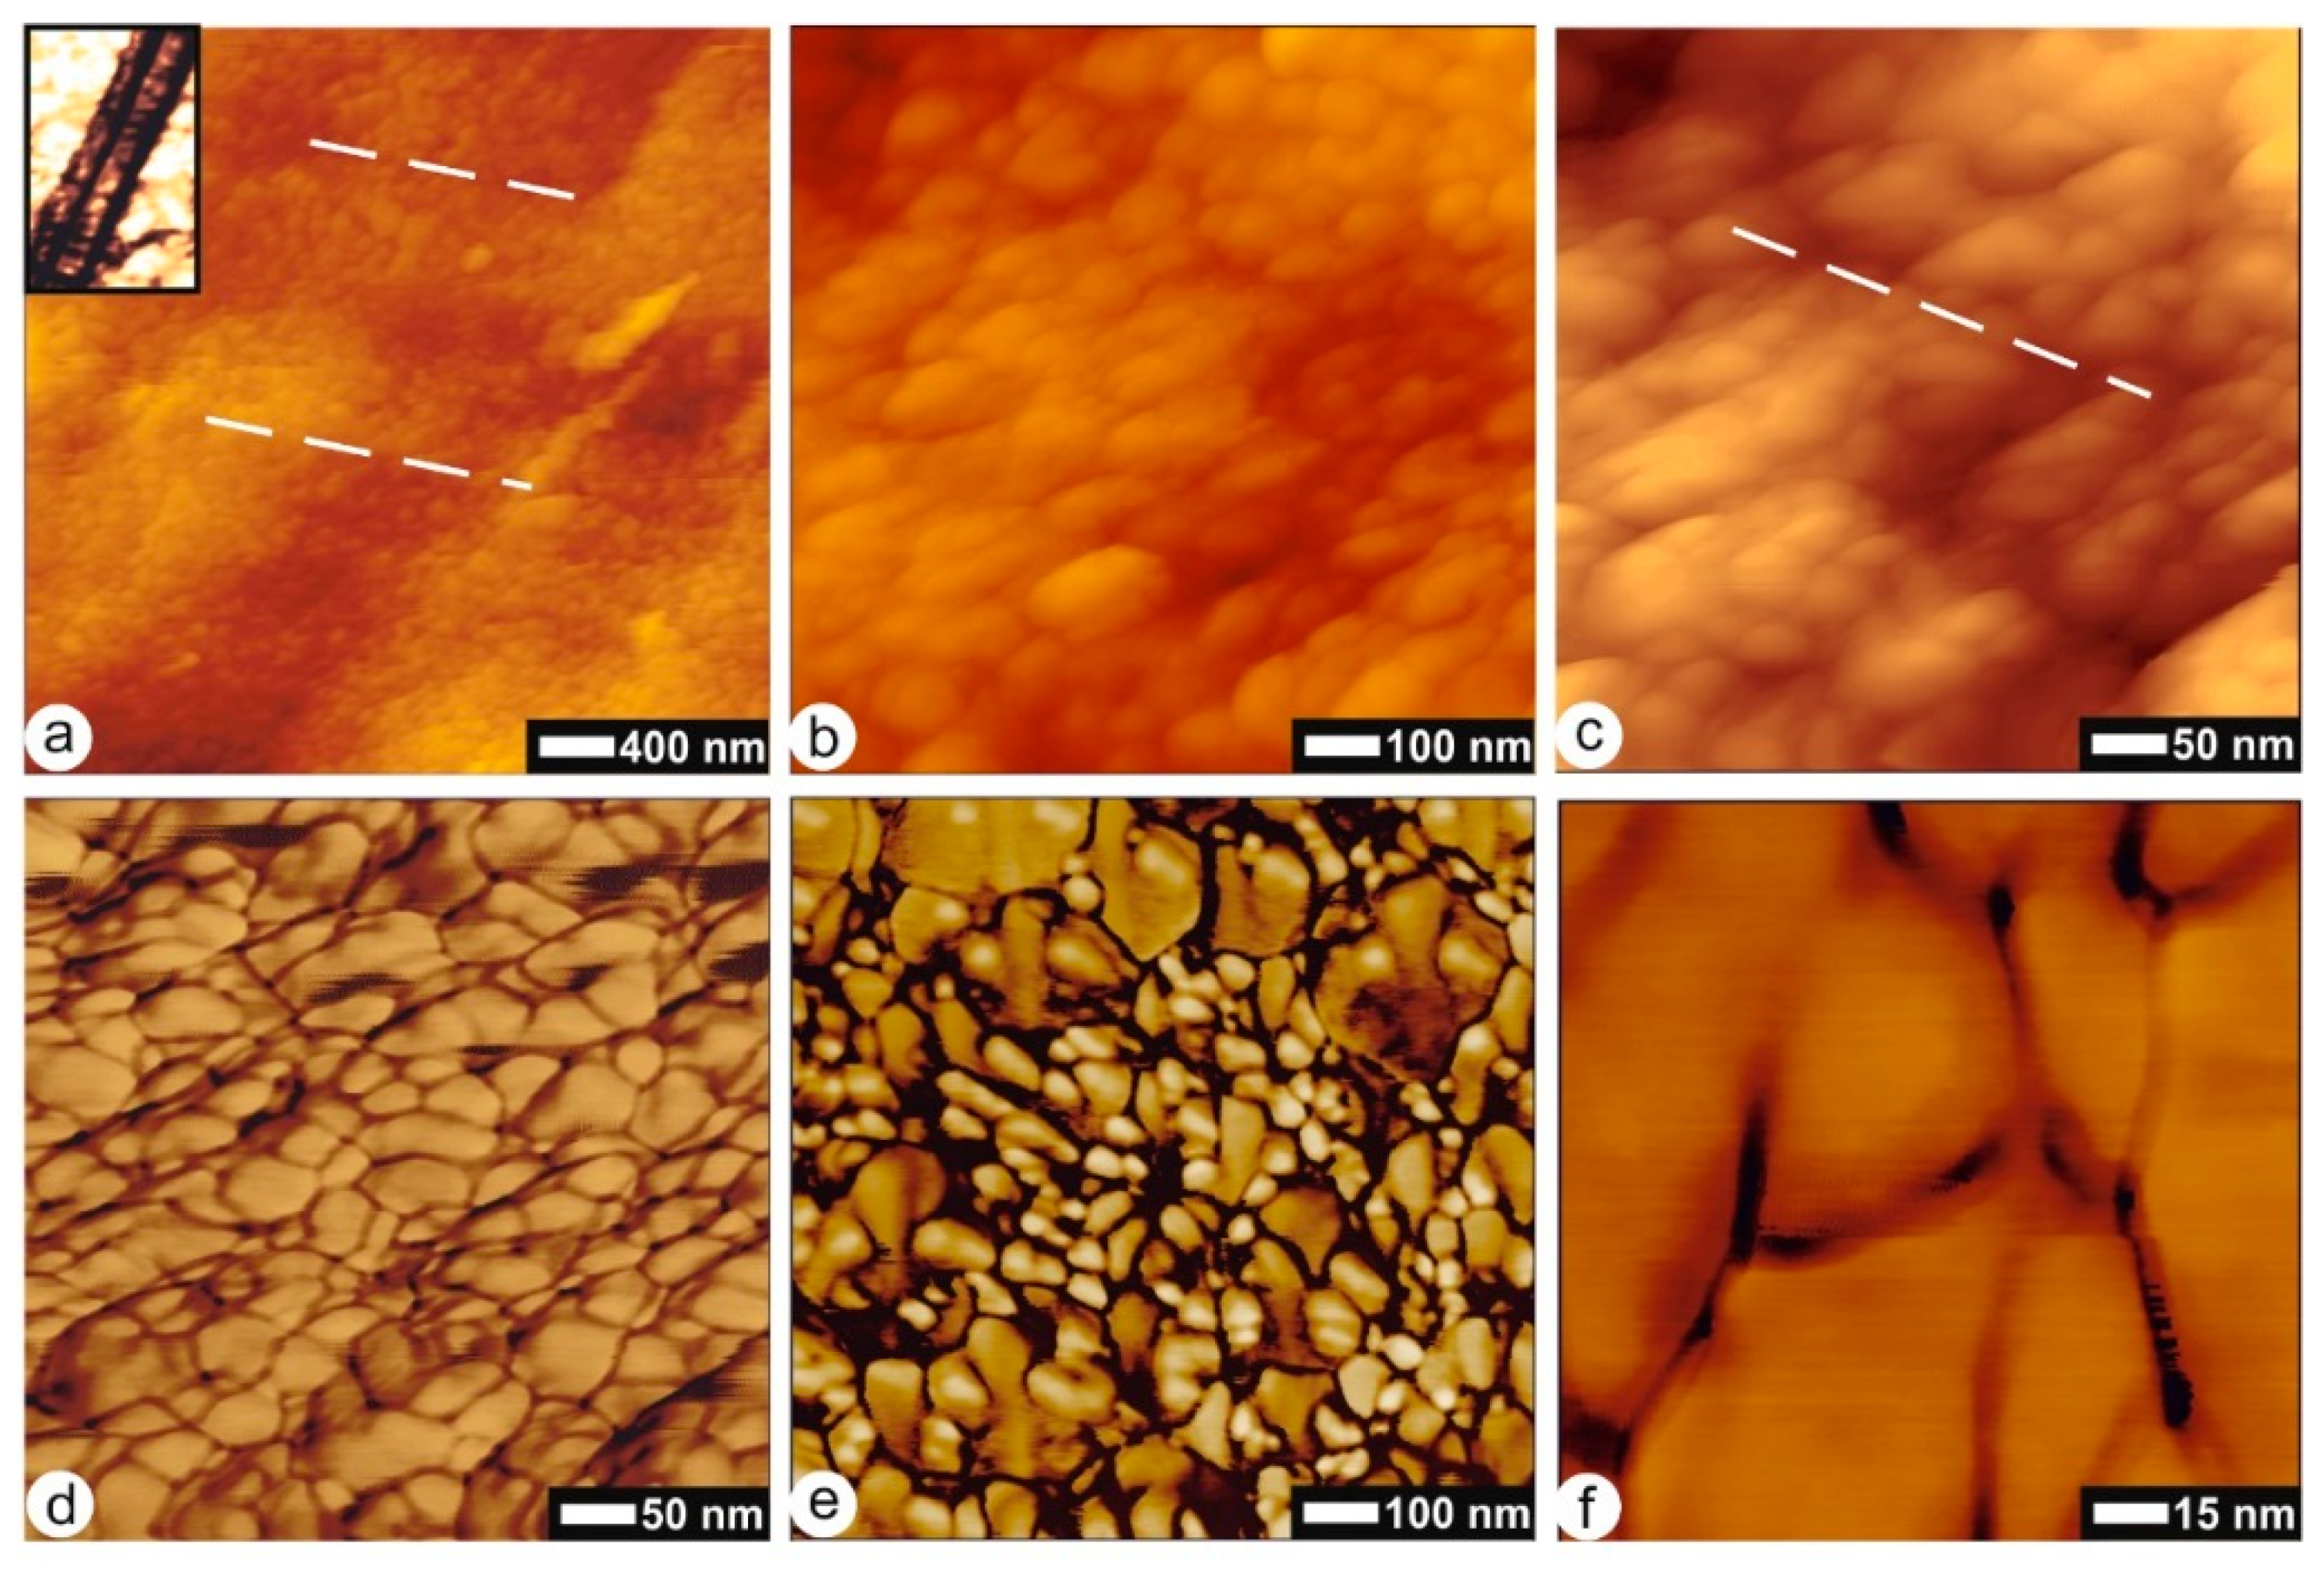
The inter-prismatic membranes of the prisms of Pinna are easily destroyed using NaOCl. Height AFM images of the longitudinal surfaces of the prismatic units are rather smooth, with some faint growth lines (Figure 4a–c). Nevertheless, phase images show the rounded granules and their thin envelopes (Figure 4d–f). The shape and arrangement of the granules within the prism are less regular than those of the membranes.
3.2. Composition of Extracted Components
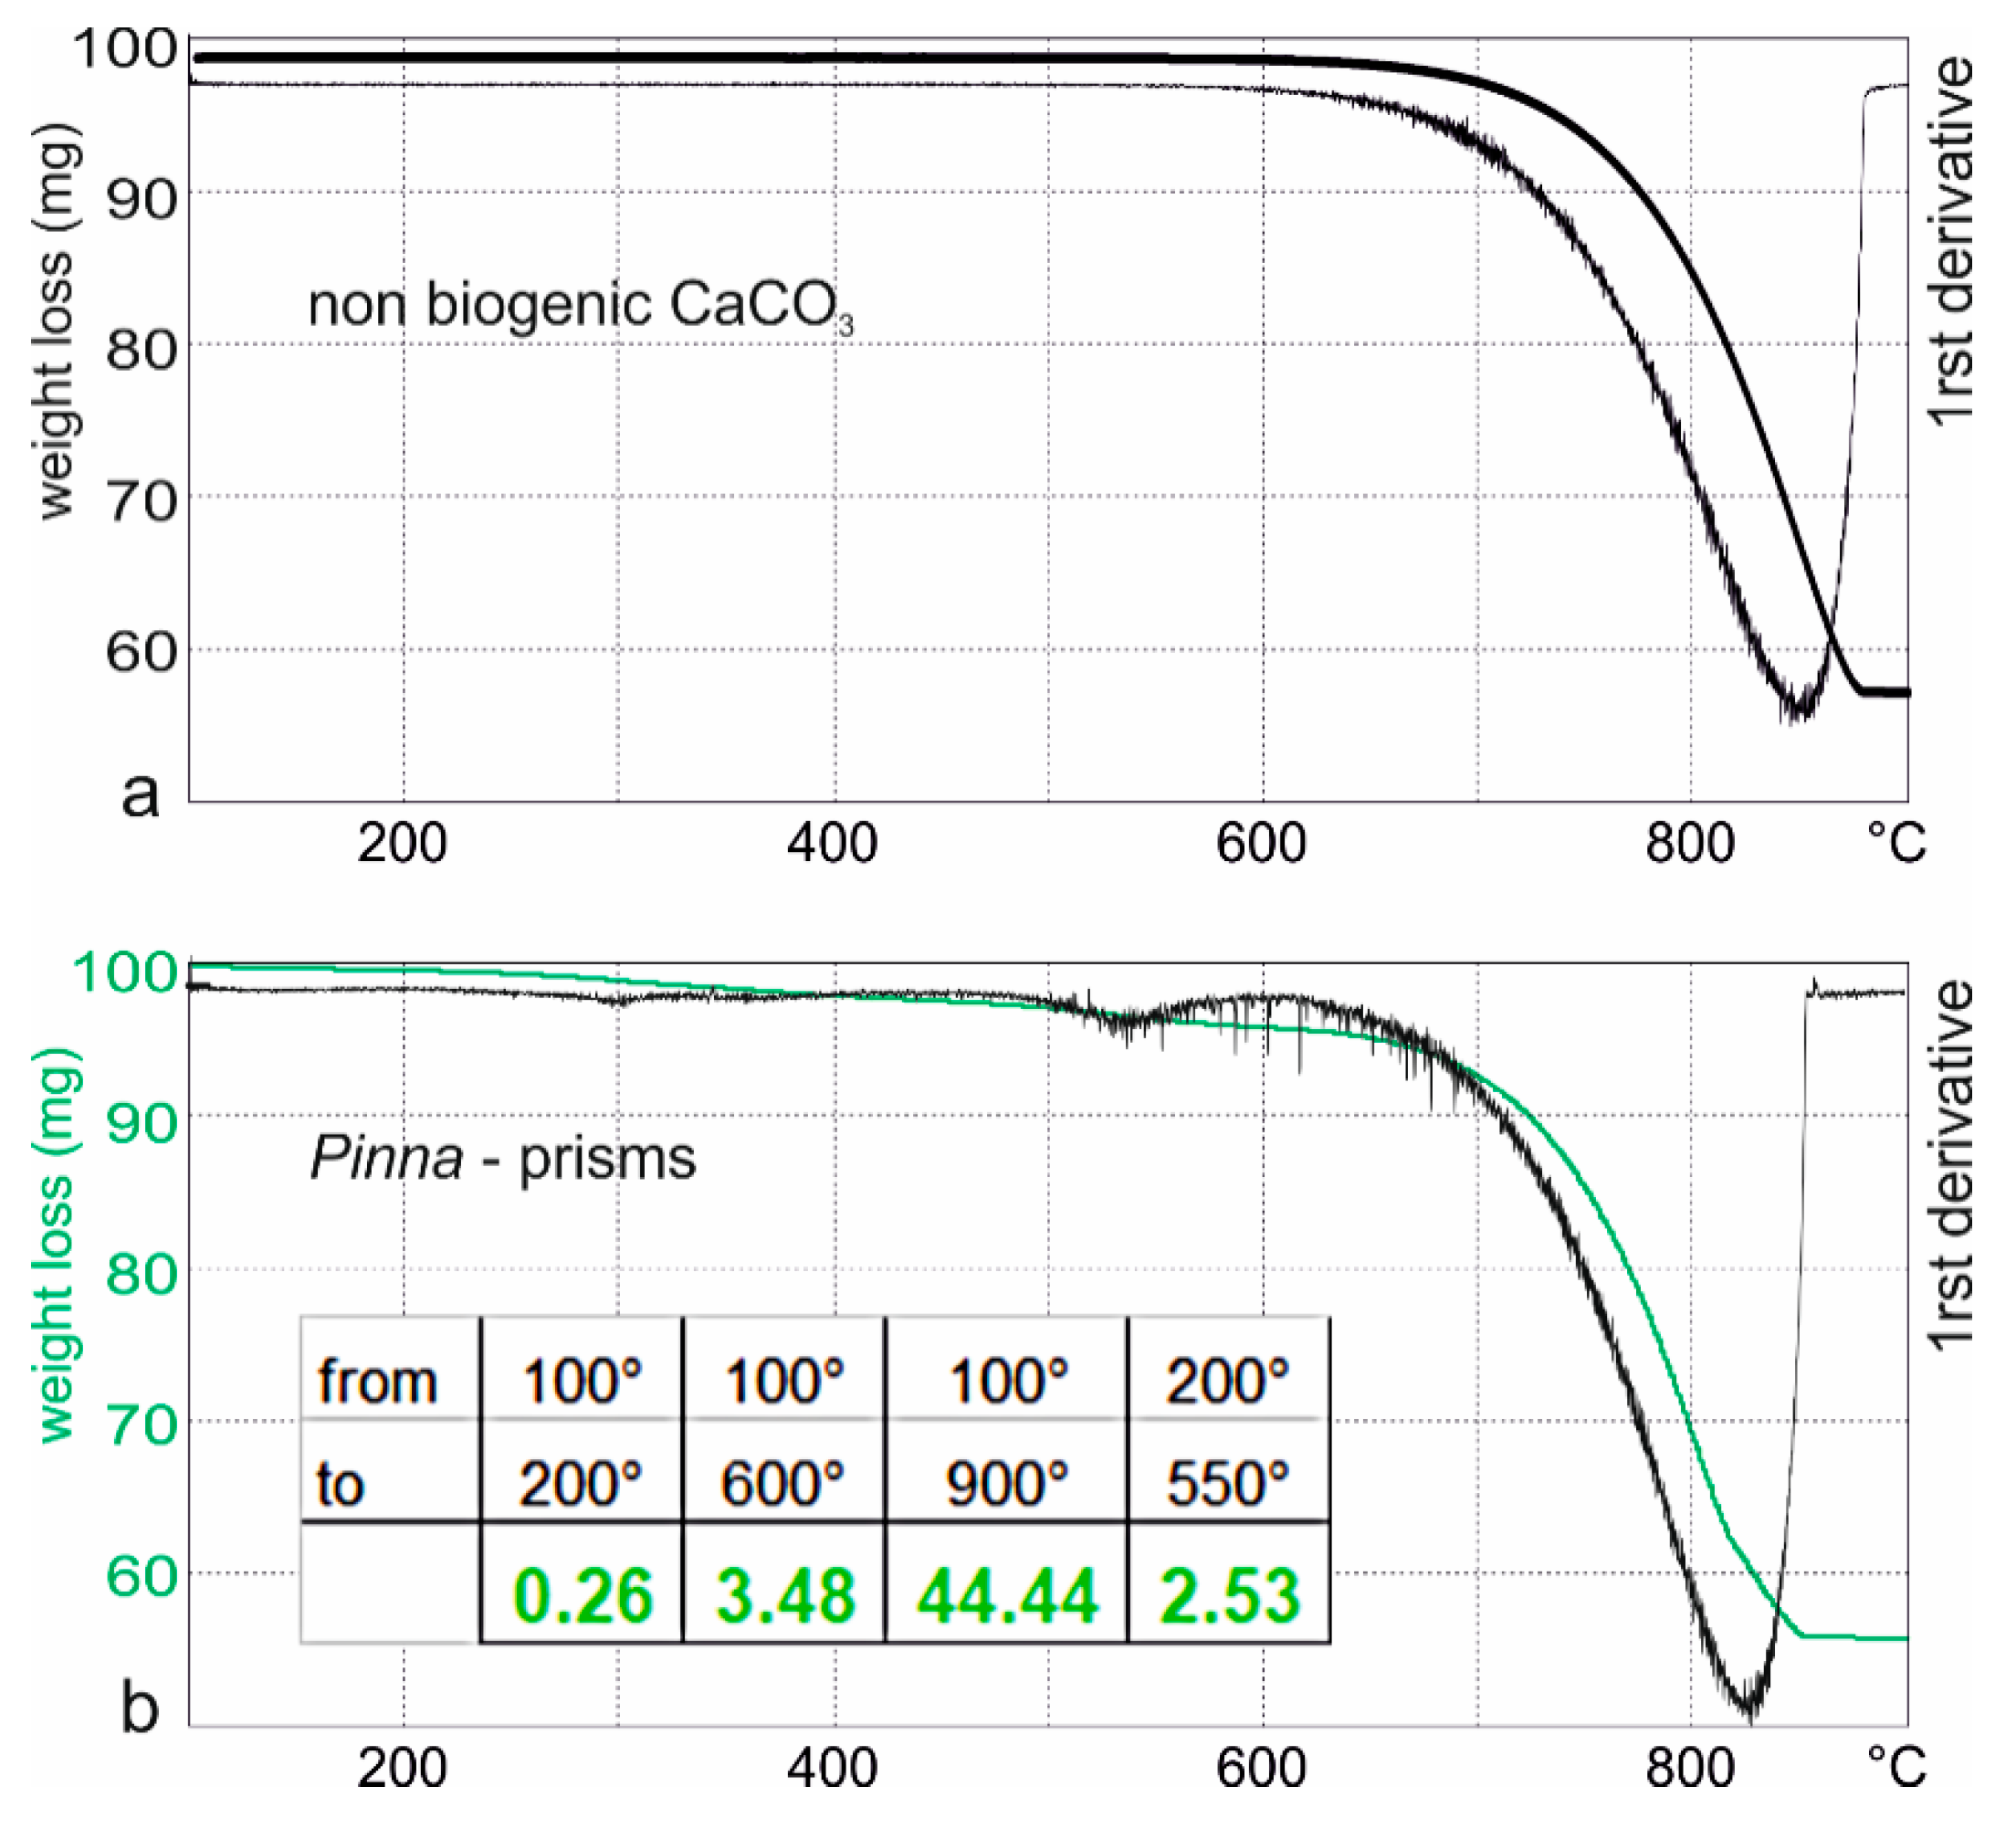
Two proteins (collagen and bovine serum albumin) and one sugar (glucose) have been used as standards for TGA (Figure S1a). The differences among the three components are clearly seen in the first derivative curves (Figure S1b). Glucose has two “peaks” between 200 and 350 °C, whereas collagen has only one peak and appears to be the most resistant of the three compounds. BSA has two peaks, the first one being small. The first peak is similar, in temperature, to the first peak of glucose, the second peak is near that of collagen. Previous analyses of the BSA have shown two bands in electrophoresis or liquid chromatography [11]. The thermogram of a pure CaCO3 (calcite, from FTIR analyses, data not shown) is flat from 200 to 650 °C (Figure 5a), showing the absence of organic components.
In the powdered prisms of Pinna, from 100° to 200°, the main part of the weight loss corresponds to the evaporation of water. From 200 to 550 or 600 °C, two small inflexions are visible in the thermogram and first derivative profiles of the prisms of Pinna. These weight losses correspond to the alteration of the organic components. At this stage, it is not clear whether or not the loss of the structural water of the organic matrices is the only cause of the weight loss. The last peak, the most intense, corresponds to the decomposition of calcite into calcium and carbon dioxides. At 900 °C, Pinna has lost about 45% (Figure 5a, inserted table), and the flat end of the thermogram shows that all components are degraded. The most visible weight loss is at about 820–830 °C.
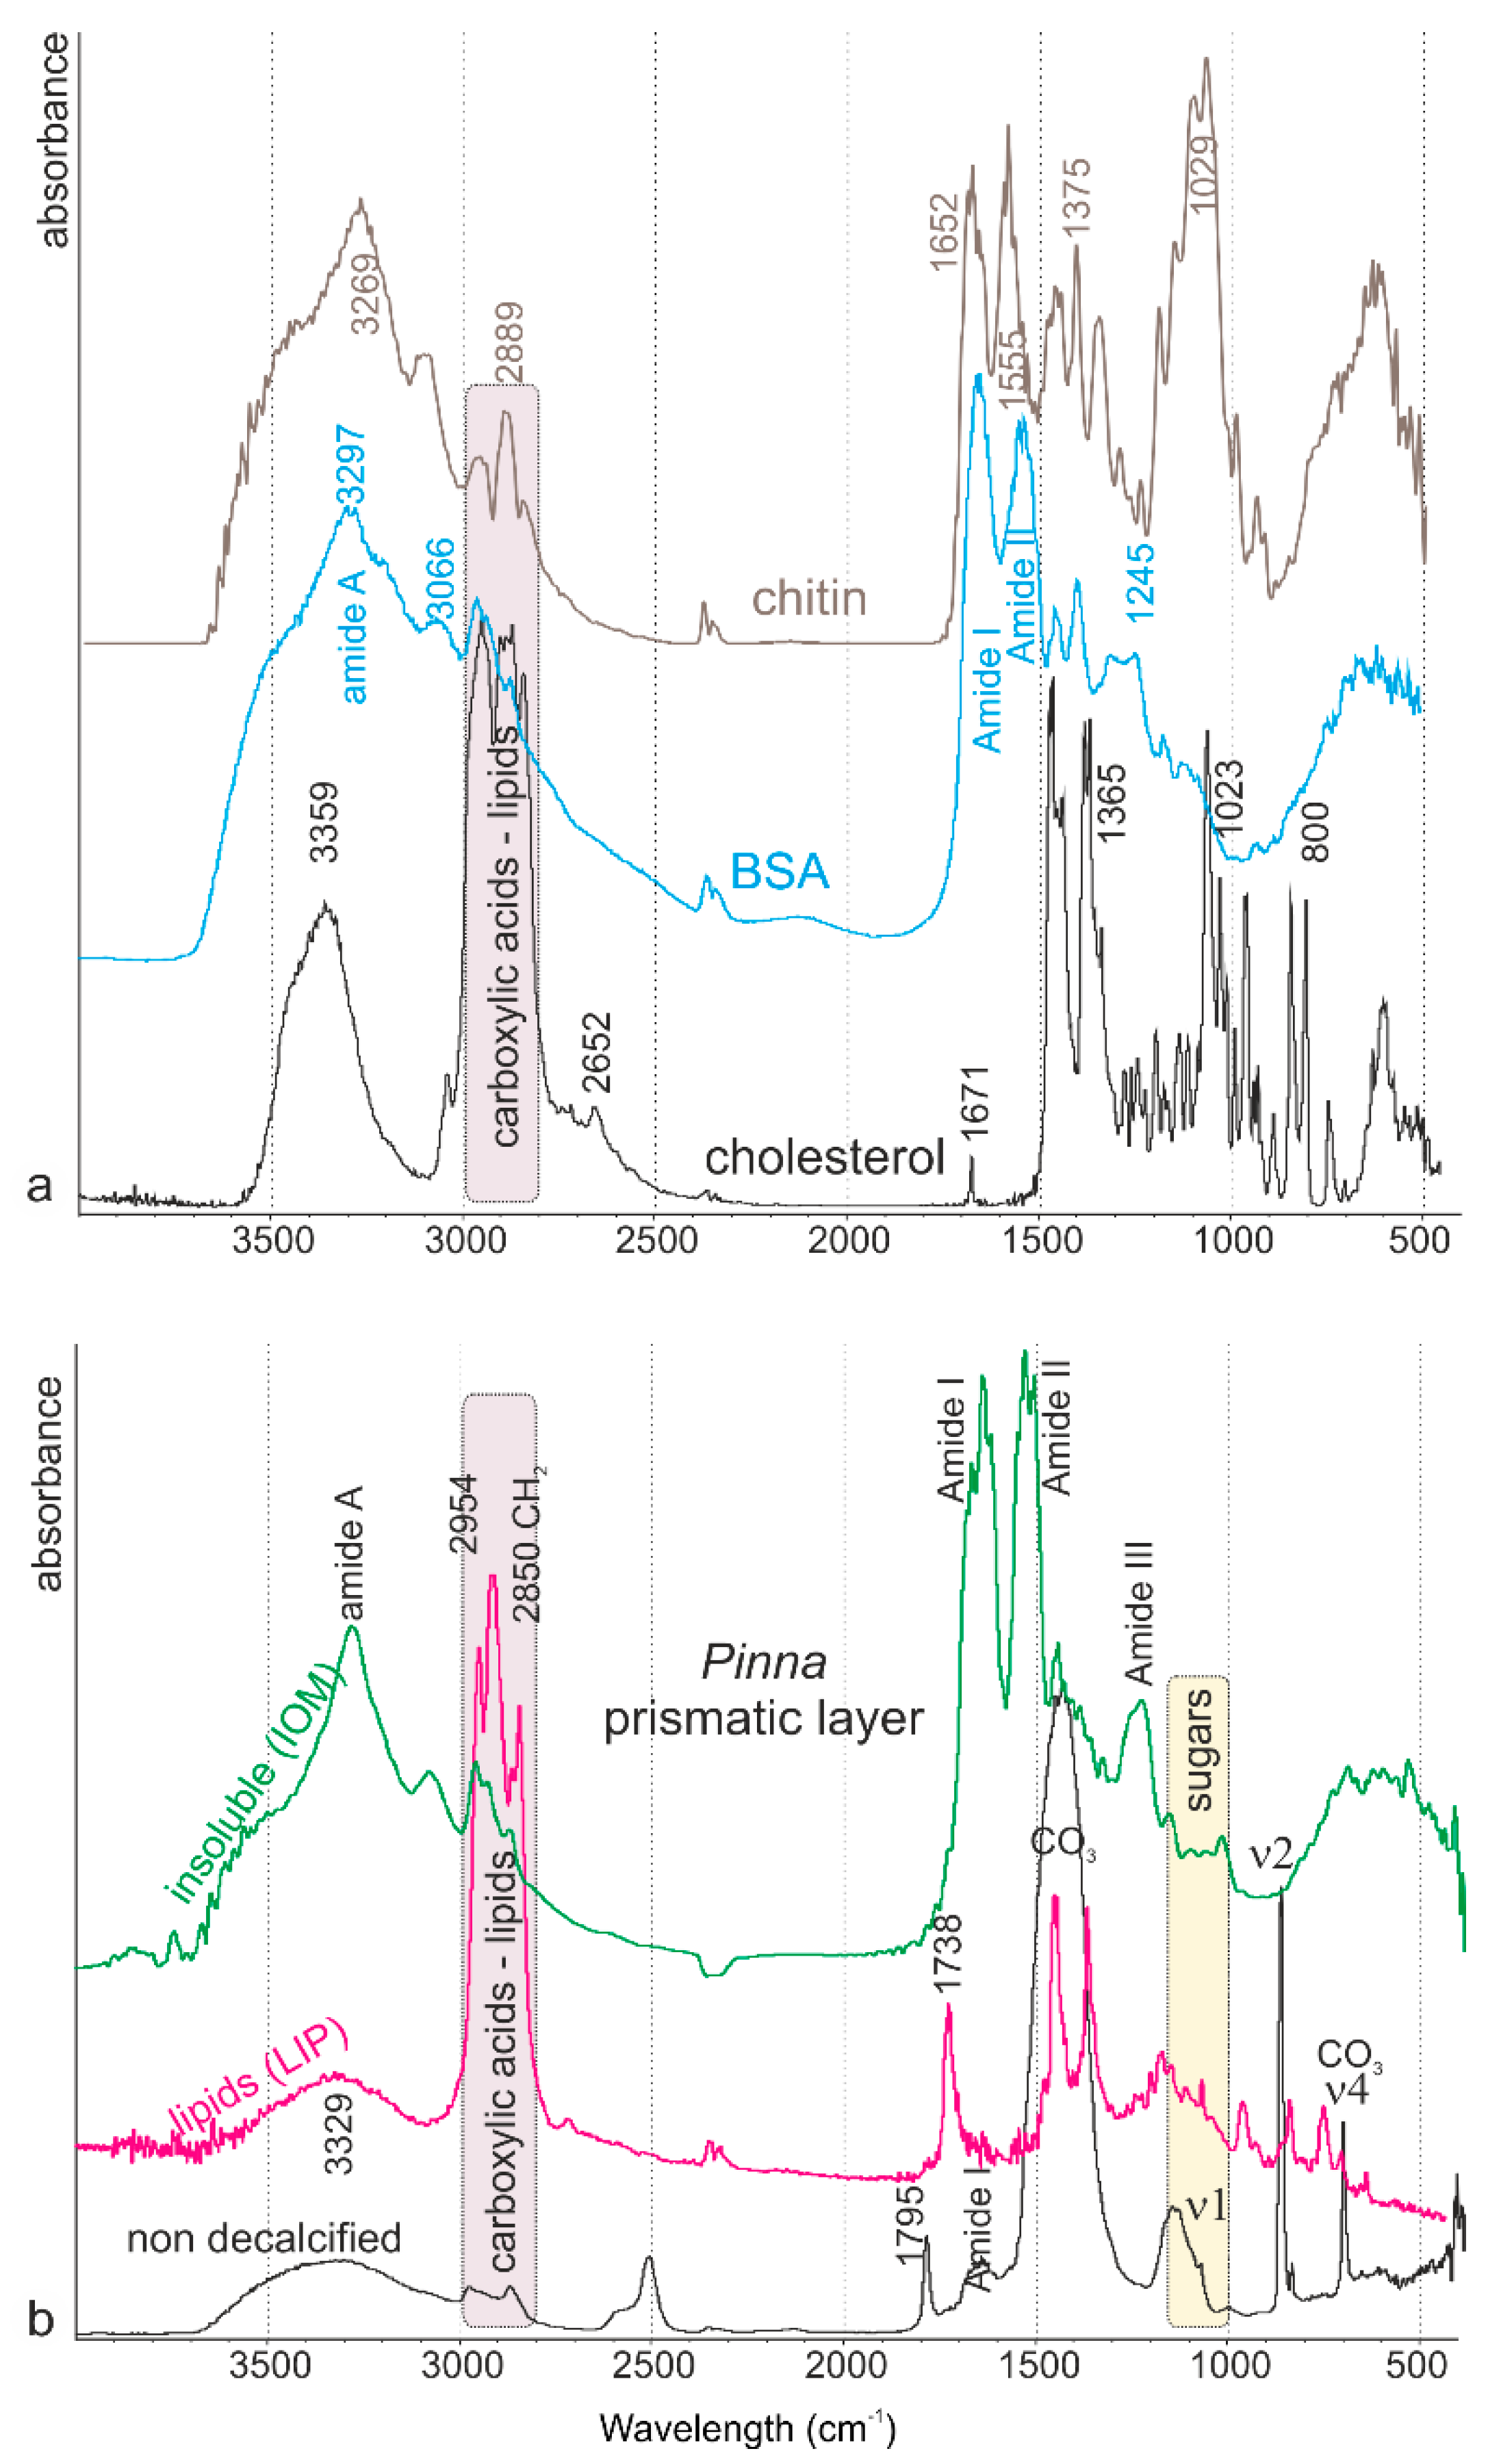
Infrared spectrometry of the standards, BSA as a protein, cholesterol as a lipid, and chitin as a polysaccharide show the main differences in the profiles of these molecular categories. The three samples show strong amide A bands, although at different wavenumbers (Figure 6a). The profiles from 1800 to 700 cm−1 are discriminant: amide I and amide II bands are strong in BSA spectra, whereas only a weak band at 1671 cm−1 is visible in cholesterol; chitin shows a large and intense “sugar” bands at about 1029 cm−1. Bands between 800 and 1100 cm−1 are strong in cholesterol, weak or absent in BSA. On the opposite, bands due to C-H stretching vibrations (2800–3000 cm−1) are strong in cholesterol, weak in BSA and chitin. They are said to be characteristics of lipids. Nevertheless, it must be noted that no band is fully characteristic for a category of product.
Powdered non-decalcified prisms show the strong CO3 bands of calcite, amide I and amide A bands (Figure 6b), as well as the 1795 cm−1 band assigned to C=O in carboxylic acid and its derivatives. The amide bands of the decalcified insoluble matrix (IOM) are sharp and strong. The spectrum of the lipid extract (LIP) differs from that of the insoluble matrix, despite lipids being insoluble in acidic solution. The bands assigned to carboxylic acids and lipids, visible in the insoluble matrix, are the strongest in the lipid extract. The band at 1738 cm−1 is assigned to C=O.
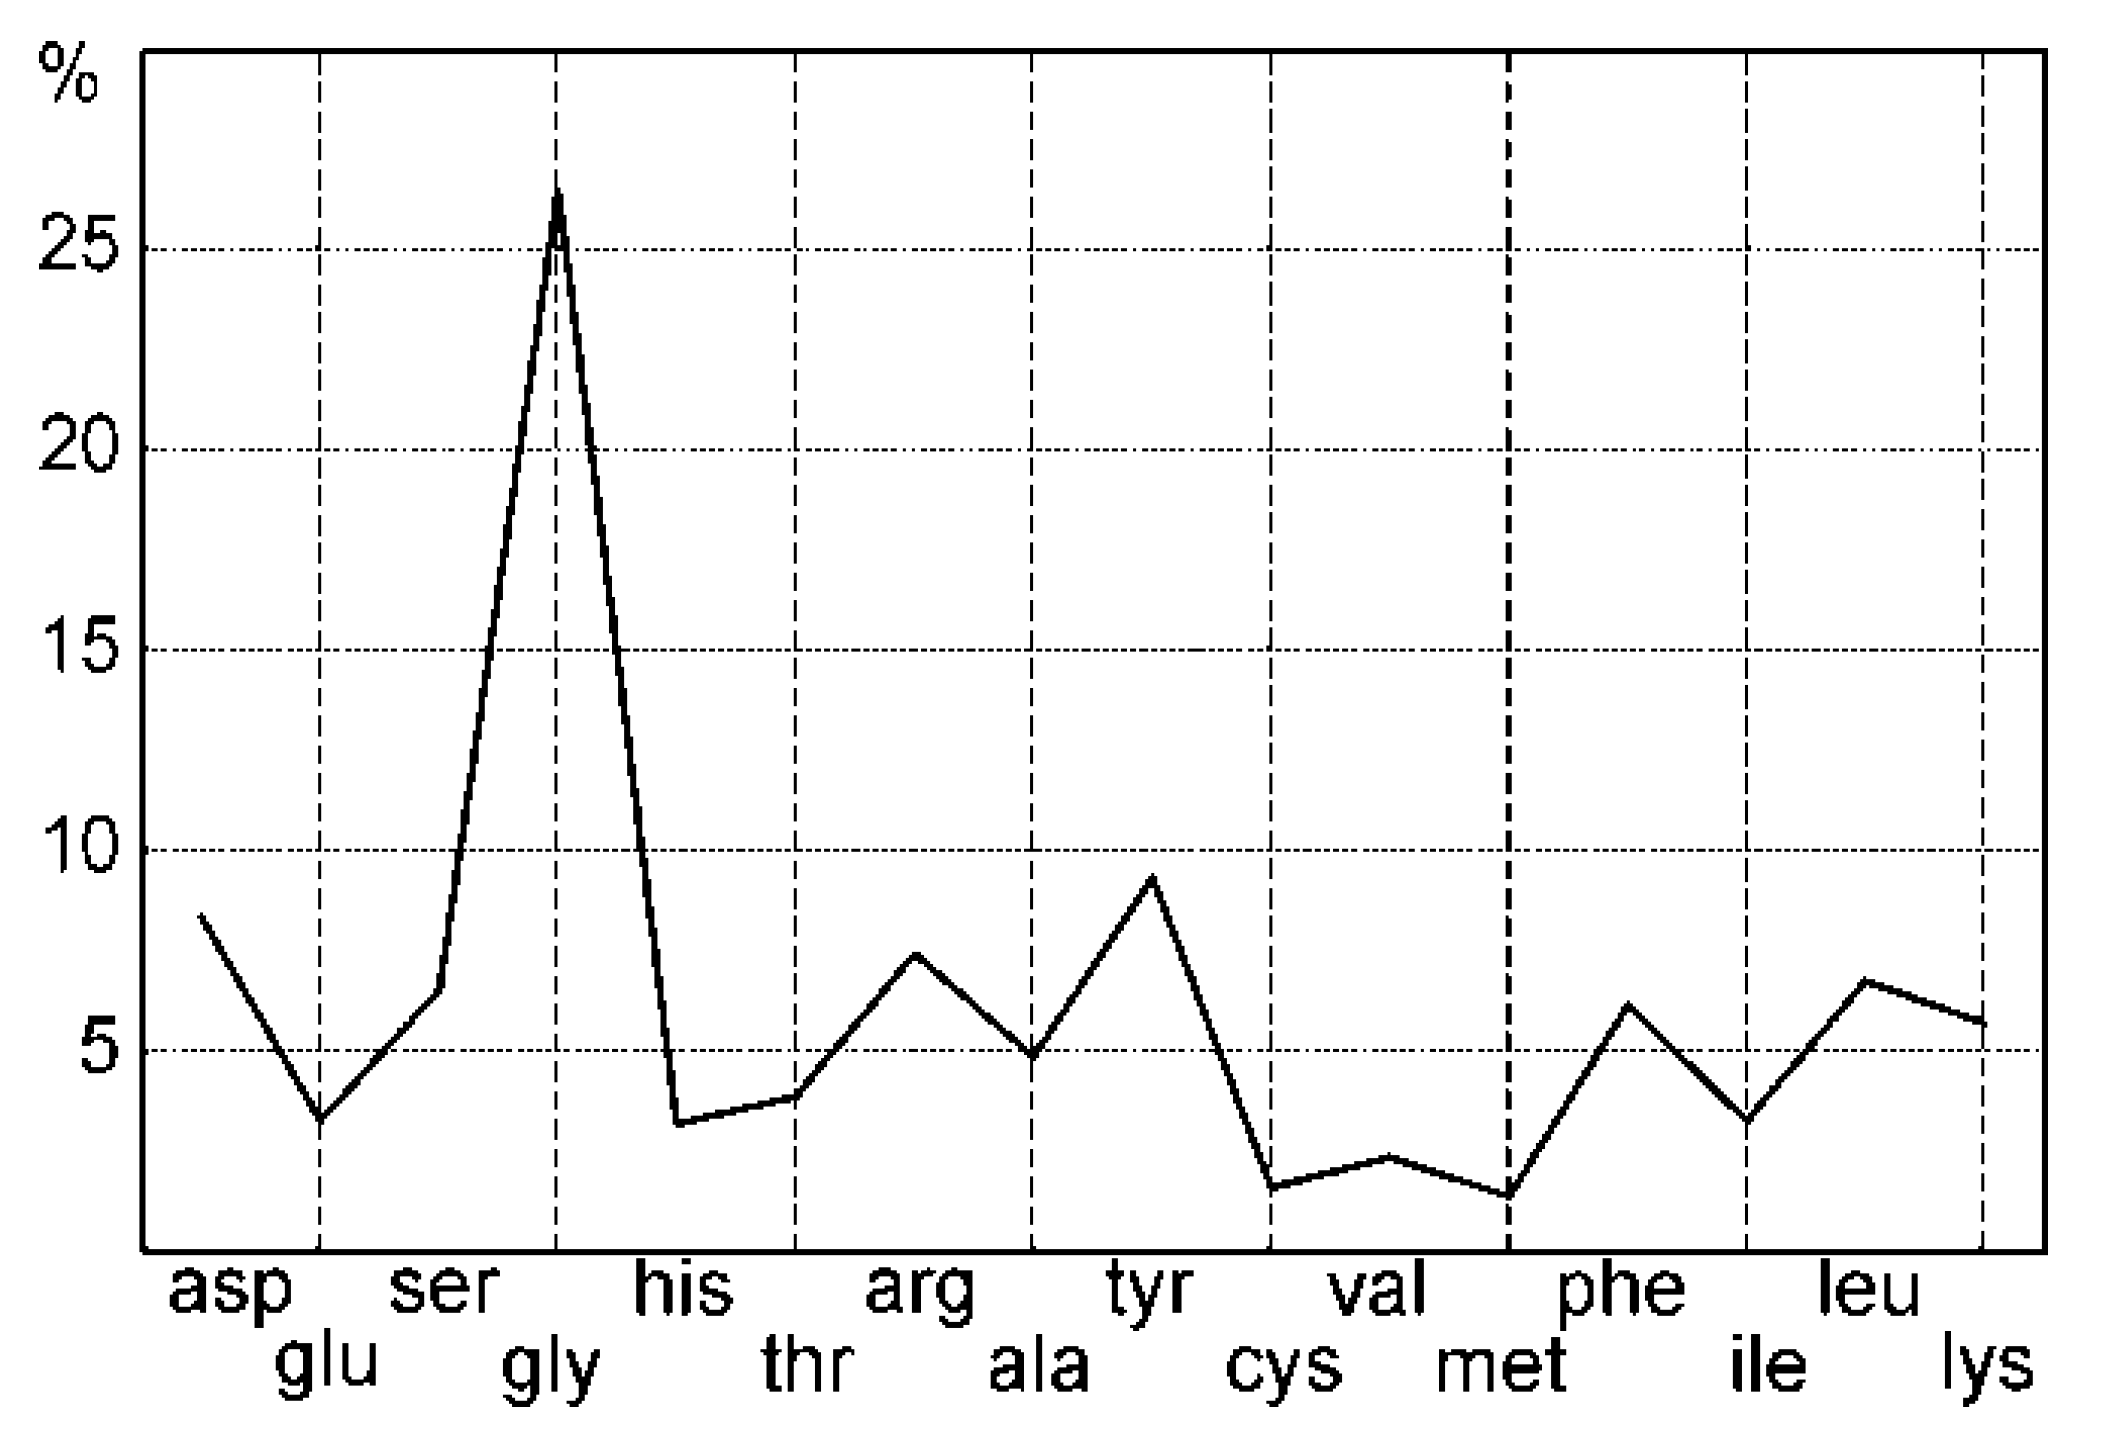
Glycine is the most abundant aminoacid in the insoluble matrix (IOM) of Pinna (Figure 7). Tyrosine and aspartic acid are less than 10%. Cysteine and methionine contents are very low, but data are here only indicative because the special hydrolysis needed to recover S aminoacids has not been performed. The average isoelectric point (pI) calculated from aminoacid composition is acidic (pI = 3.85) [23]. The aliphatic index is linked to the stability of the globular proteins [24]. It reaches 48.67 in Pinna.
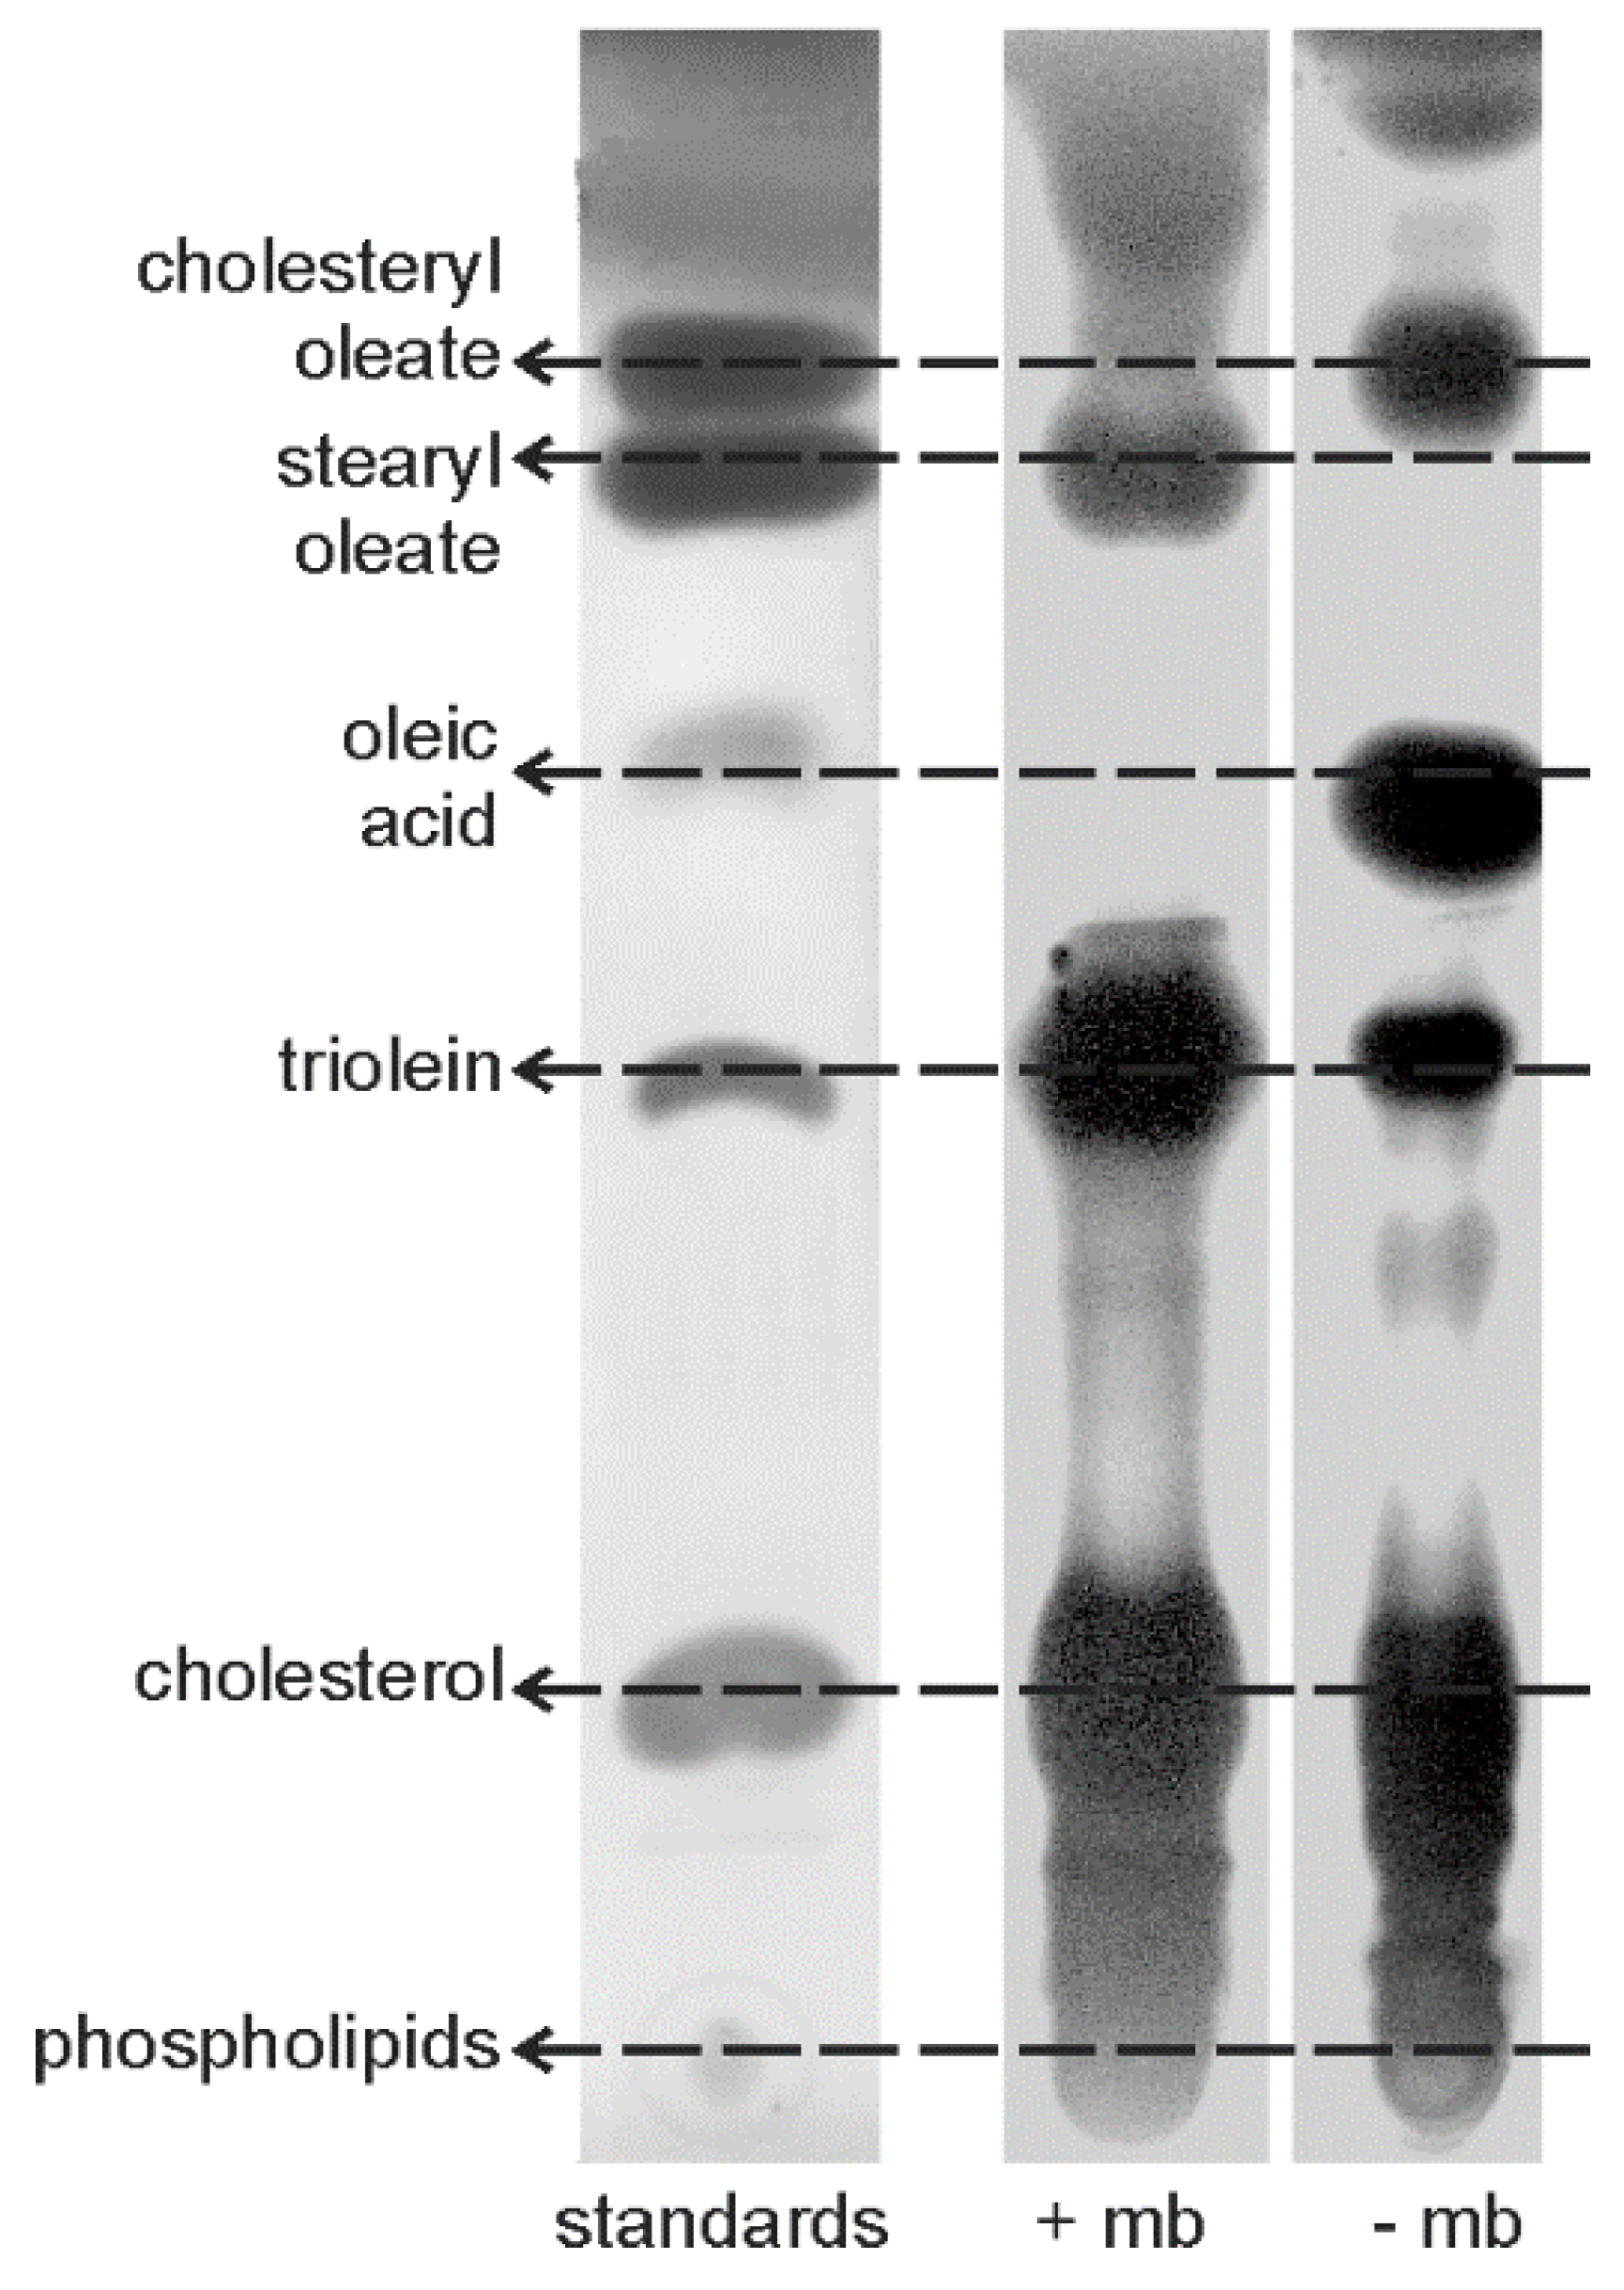
Thin layer chromatography of LIP extracts shows the differences in intensity of the commercial standards. It has been noted that a strong concentration of a standard can prevent the migration of another when several products are mixed in a single solution, so that oleic acid and cholesterol can overlap [25]. Thus, in this mixture of standards, oleic acid and cholesterol were put in a low concentration. Prisms with and without the inter-prismatic membranes show several bands (Figure 8), but the profiles differ. Prisms with the intra-prismatic membranes contain mostly sterids, triglycerides and sterols. Waxes and phospholipids are also present, but free fatty acids are either very scarce or not represented. Surprisingly, the prisms without the membranes show an intense spot for the oleic acid, not visible in the prisms with membranes, despite the membranes being reported to be insoluble.
3.3. In Situ Analyses
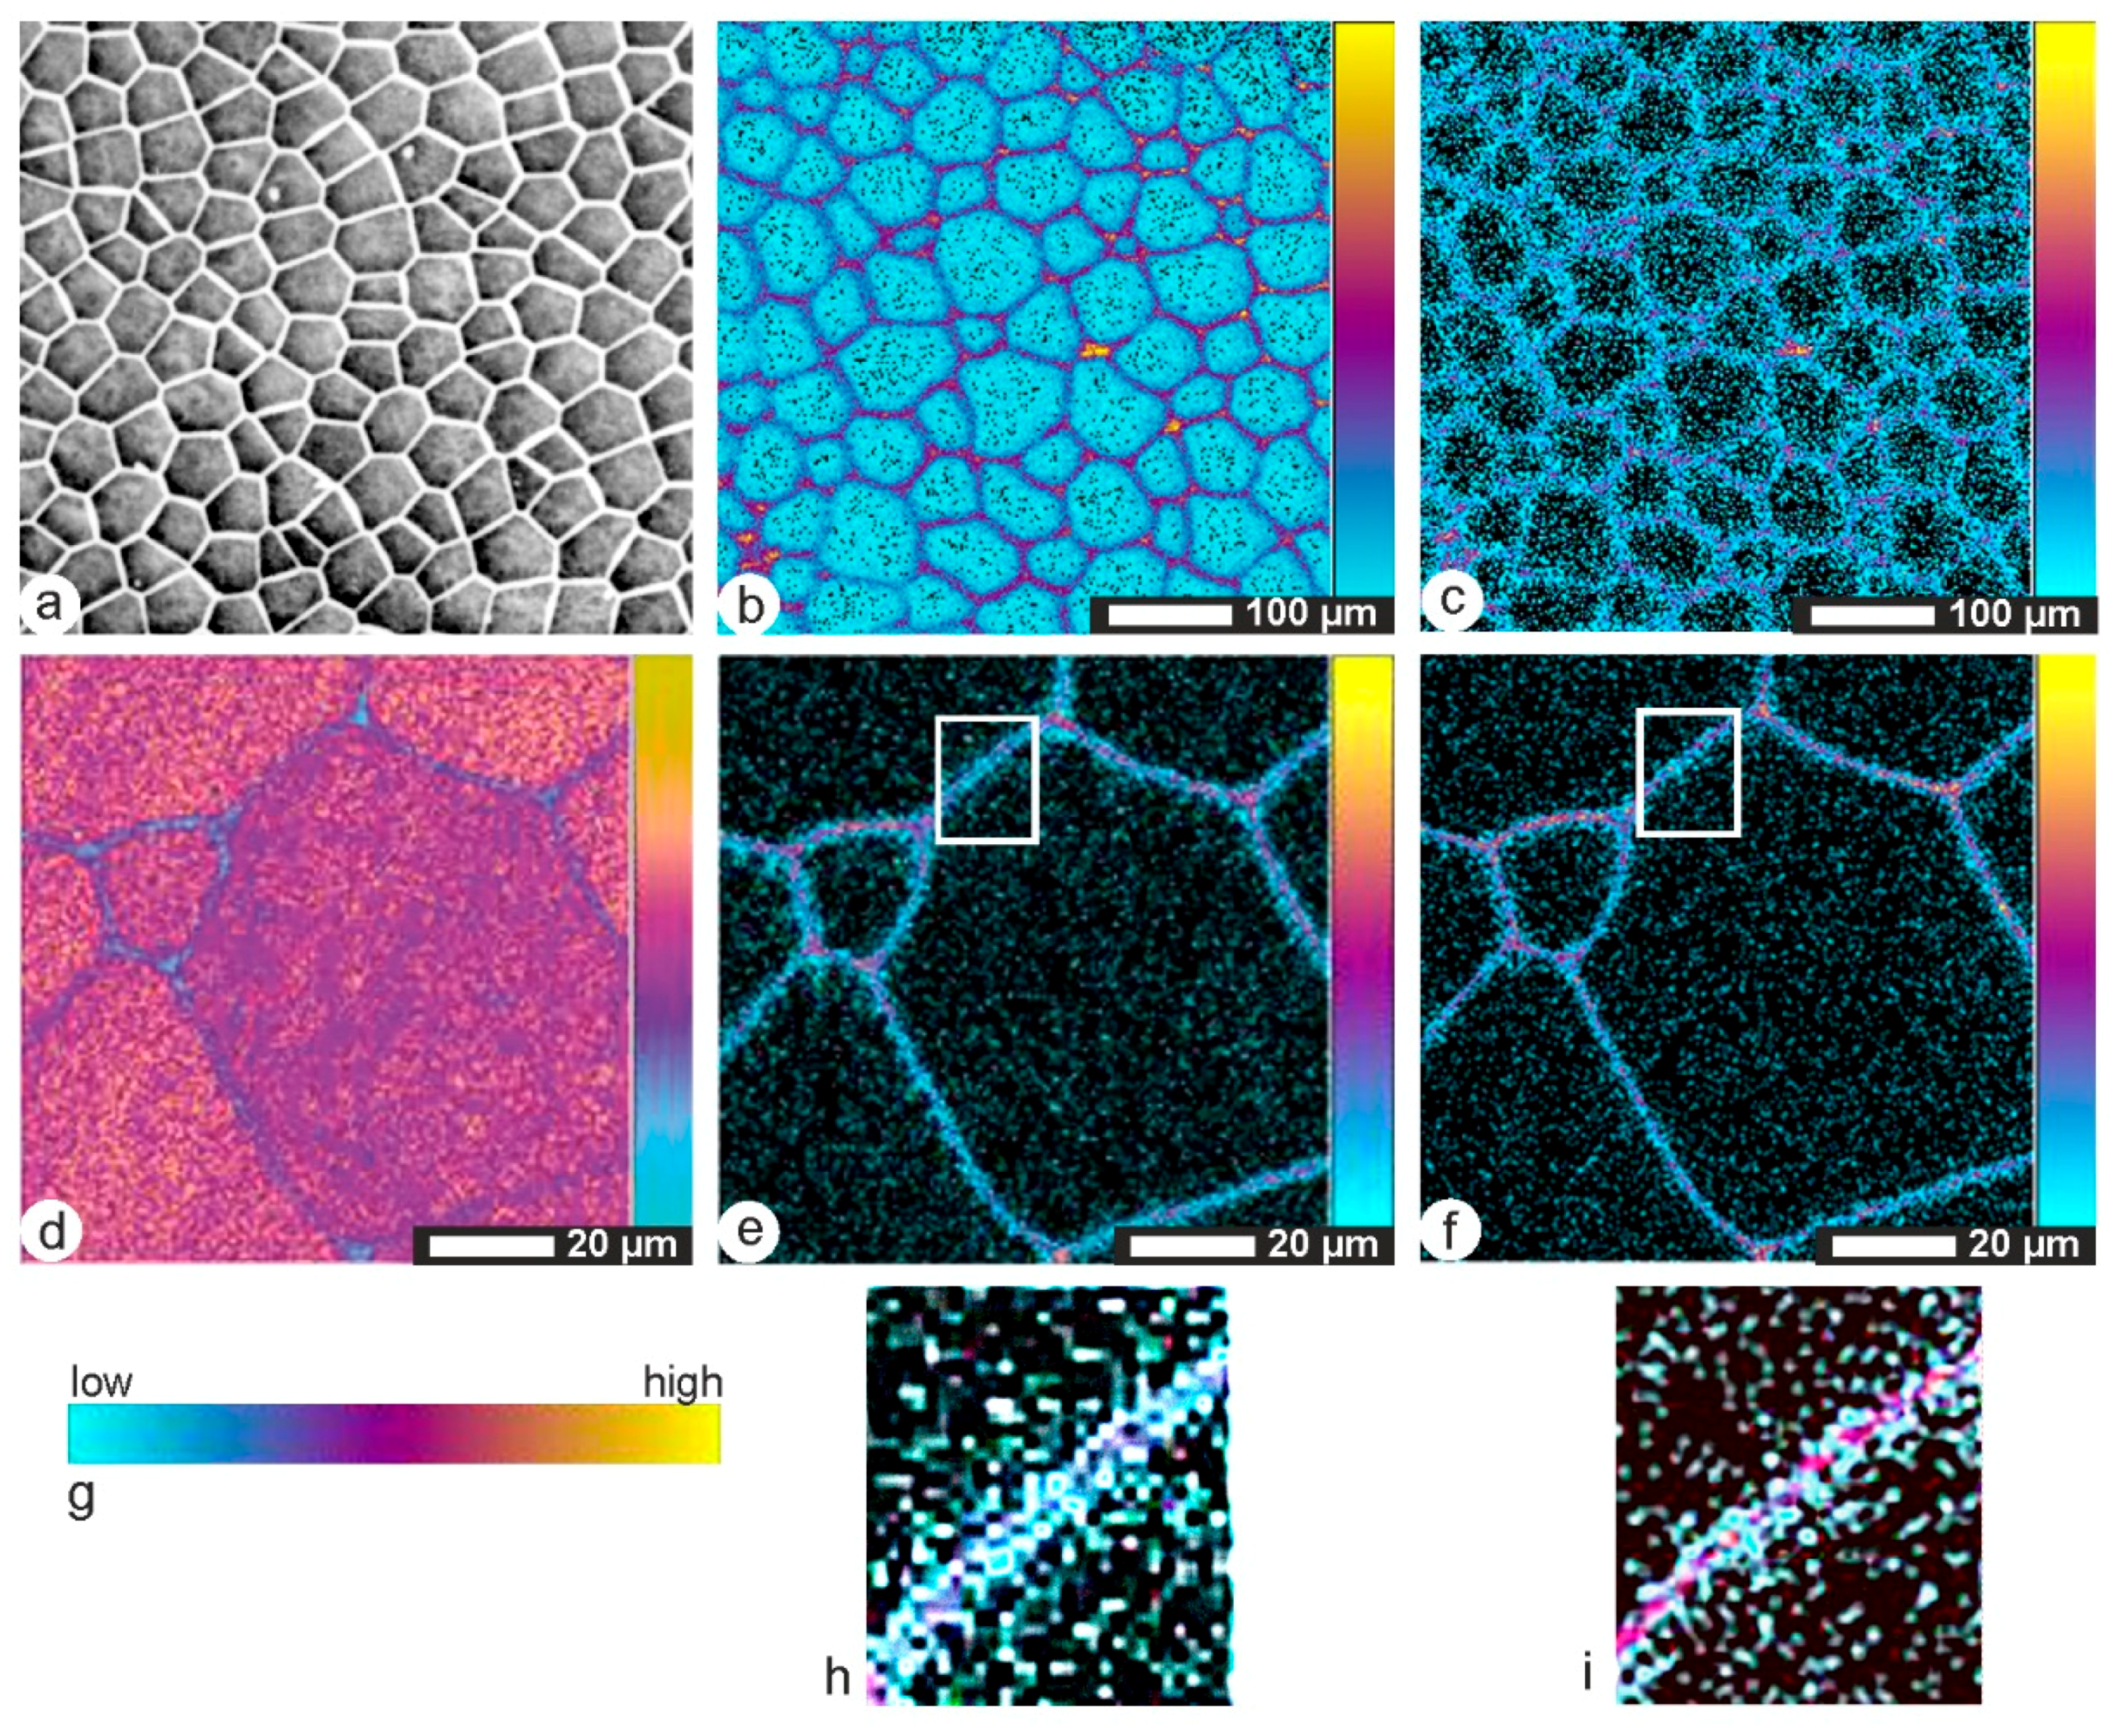
TOF-SIMS maps on transverse sections clearly show the difference between the inter-prismatic membranes (low Ca content) and the intra-prismatic material with a high Ca content (Figure 8). Nevertheless, the blue colour of the intra-prismatic material contains numerous purple small spots, indicative of an organic component (Figure 9b, glycine). The inter-prismatic membranes seem thicker in the phenyl-alanine maps, but a closer examination show that they are not homogeneous (Figure 9c): purple-red spots or segments are visible, and seem to be more abundant in the median part. From some maps, it seems that the Ca content differs in adjacent prisms (Figure 9d); probably these differences are related to the location of the polished surface in the growth layers seen in longitudinal sections. Indeed, SEM observations of acidic and enzymatic etchings clearly show that growth layers correspond to the more or less high contents in organic components. Glycine and proline maps seem identical (Figure 9e,f, respectively), but again, a closer examination shows they are not (Figure 9h,i). Nevertheless, in both maps, the intensity of the signal of the median part and the external parts of the inter-prismatic membranes differs.
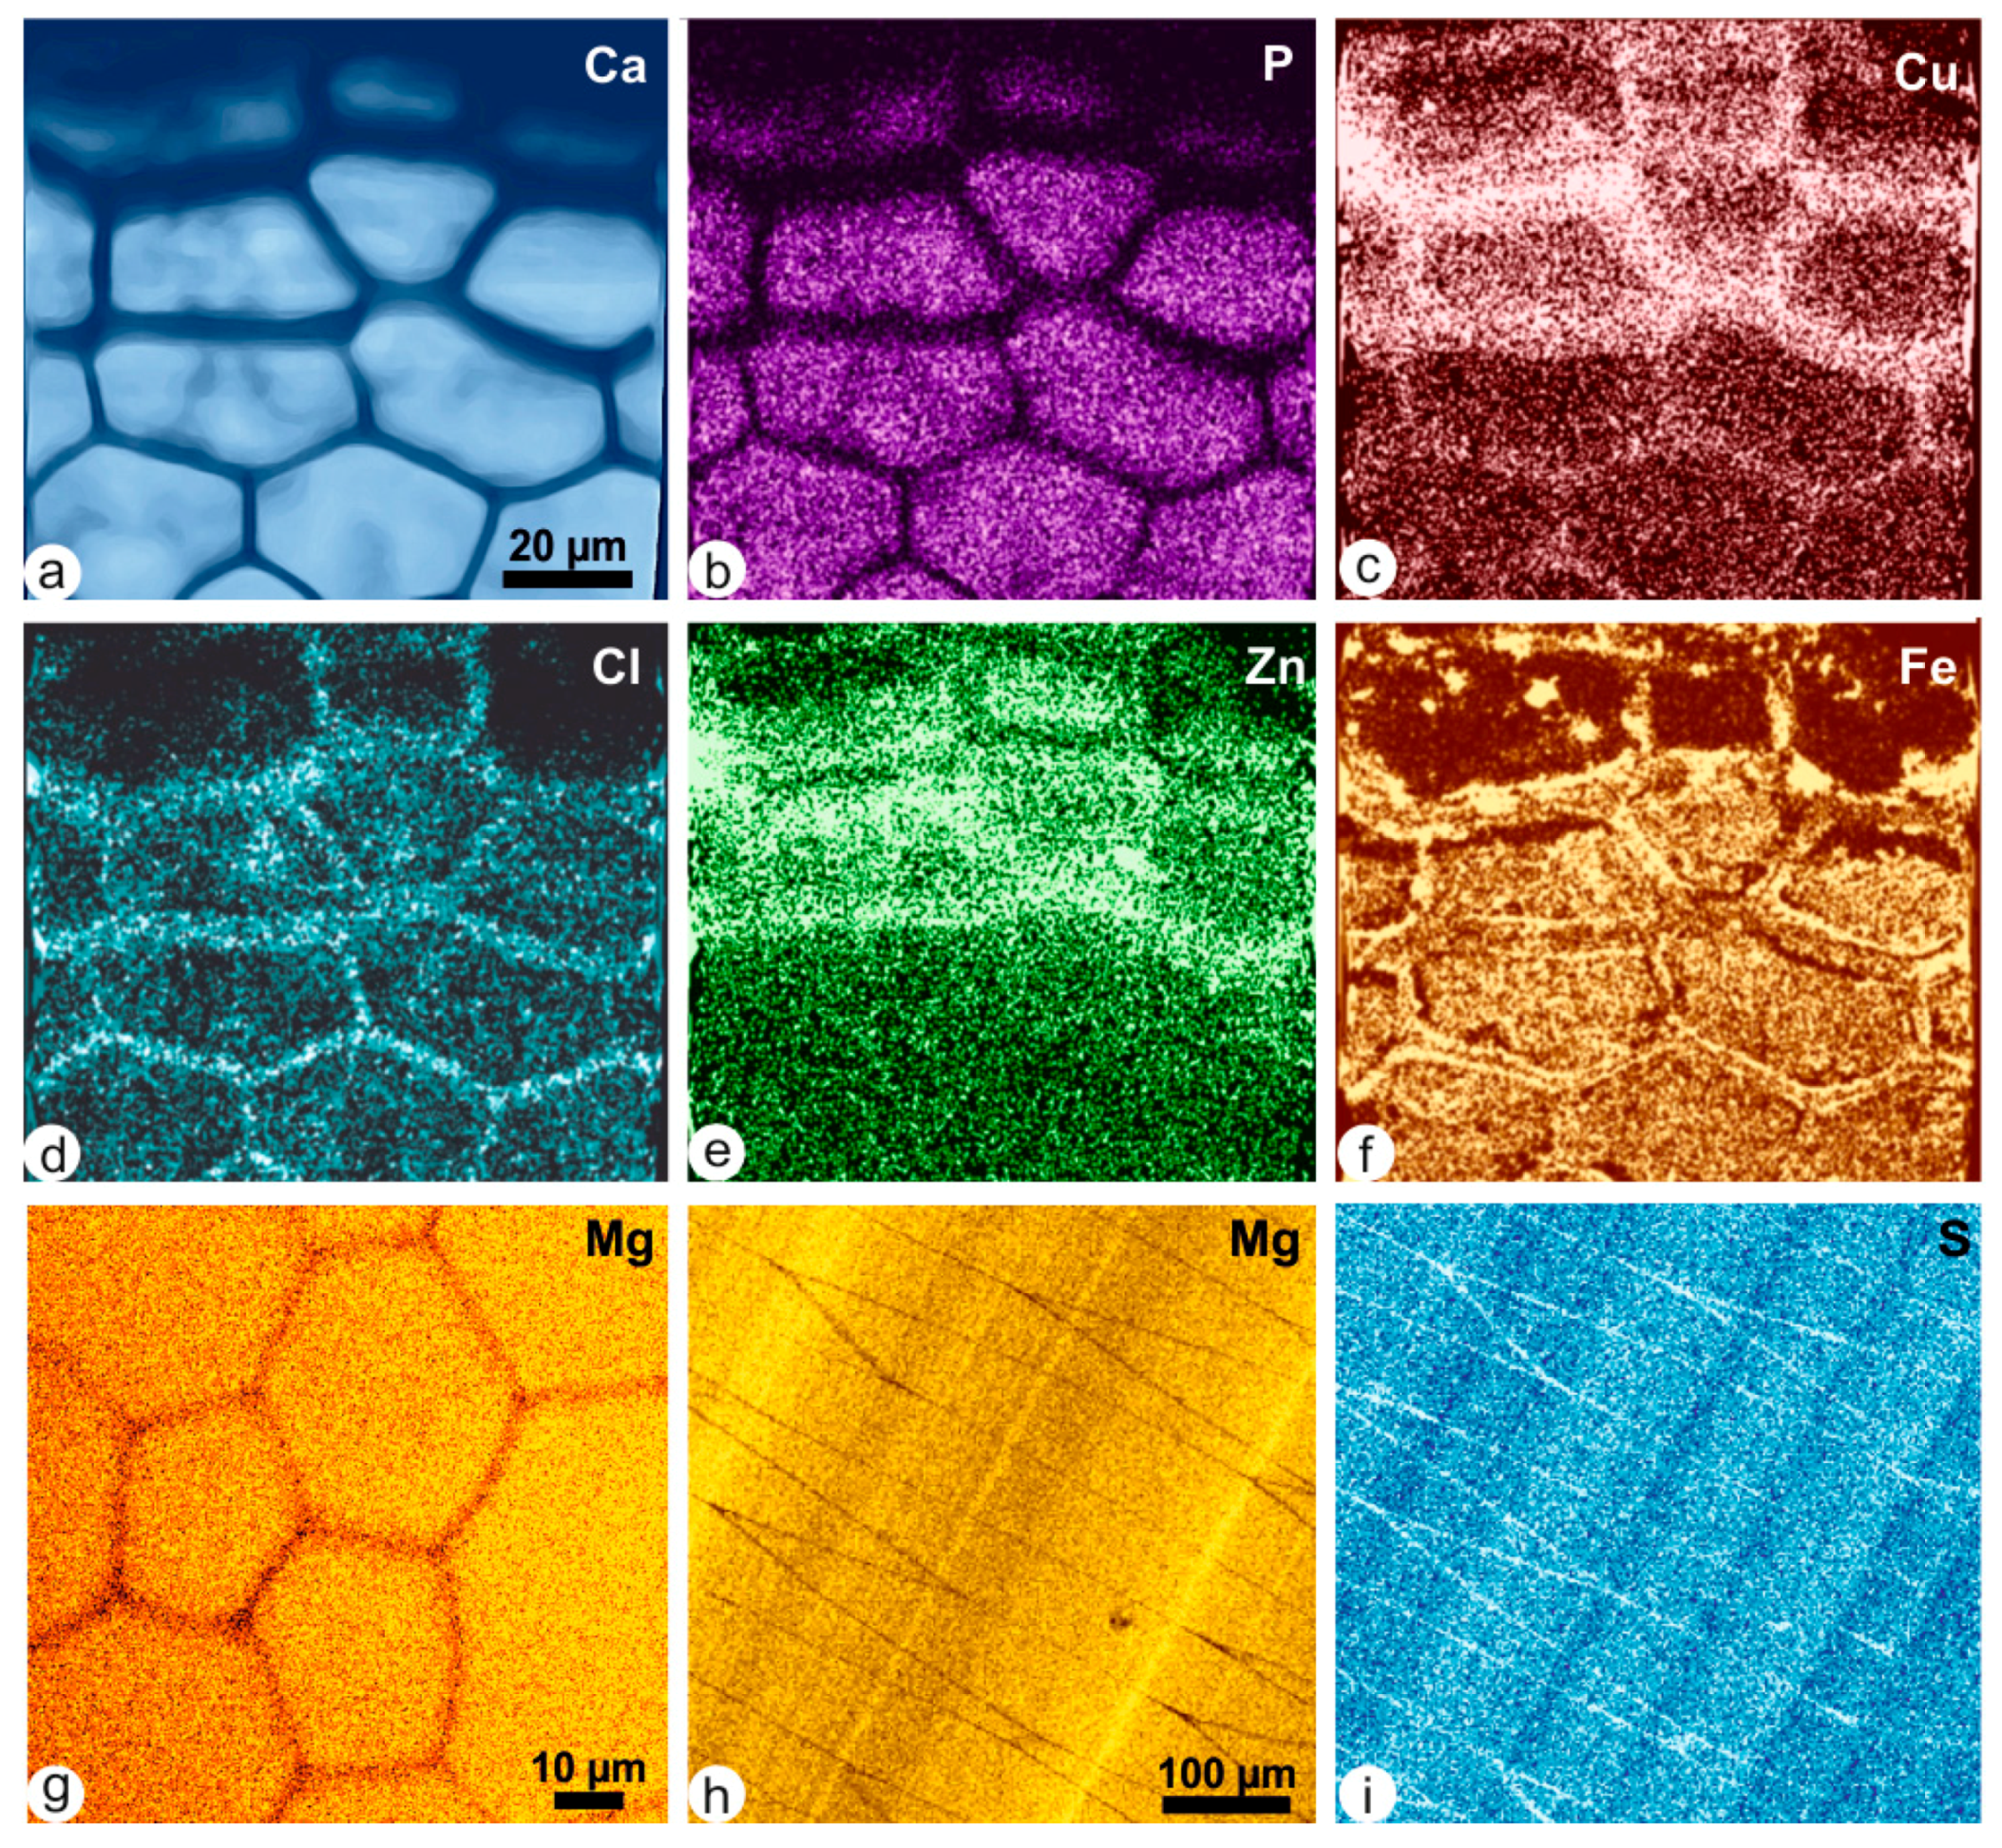
Quantitative analyses of the prisms of Pinna nobilis show that the layer is very rich in S (~5500 ppm) and in Mg, despite it not being a high Mg calcite (Figure S2). P, Sr, Cl and Fe are low. XRF maps of the thin Pinna muricata show that the contents of the inter-prismatic membranes are low for Ca and P, but high for Cu, Cl and Zn and Fe (Figure 10a–f). It must be noted that the irregular colour pattern within the prisms is probably due to the irregular thickness of the shell. The median zone of the inter-prismatic membrane is distinct in the Fe distribution map (Figure 10f). An electron microprobe map of a polished transverse section of Pinna nobilis shows that Mg is low but not absent in the inter-prismatic membranes (Figure 10g). Longitudinal sections of Pinna nobilis give additional precision (Figure 10h,i). Acidic or enzymatic etchings on polished surface have revealed a growth zonation (Figure 2). Distribution maps show that zonation is also present in Mg and S, and that they are not identical.
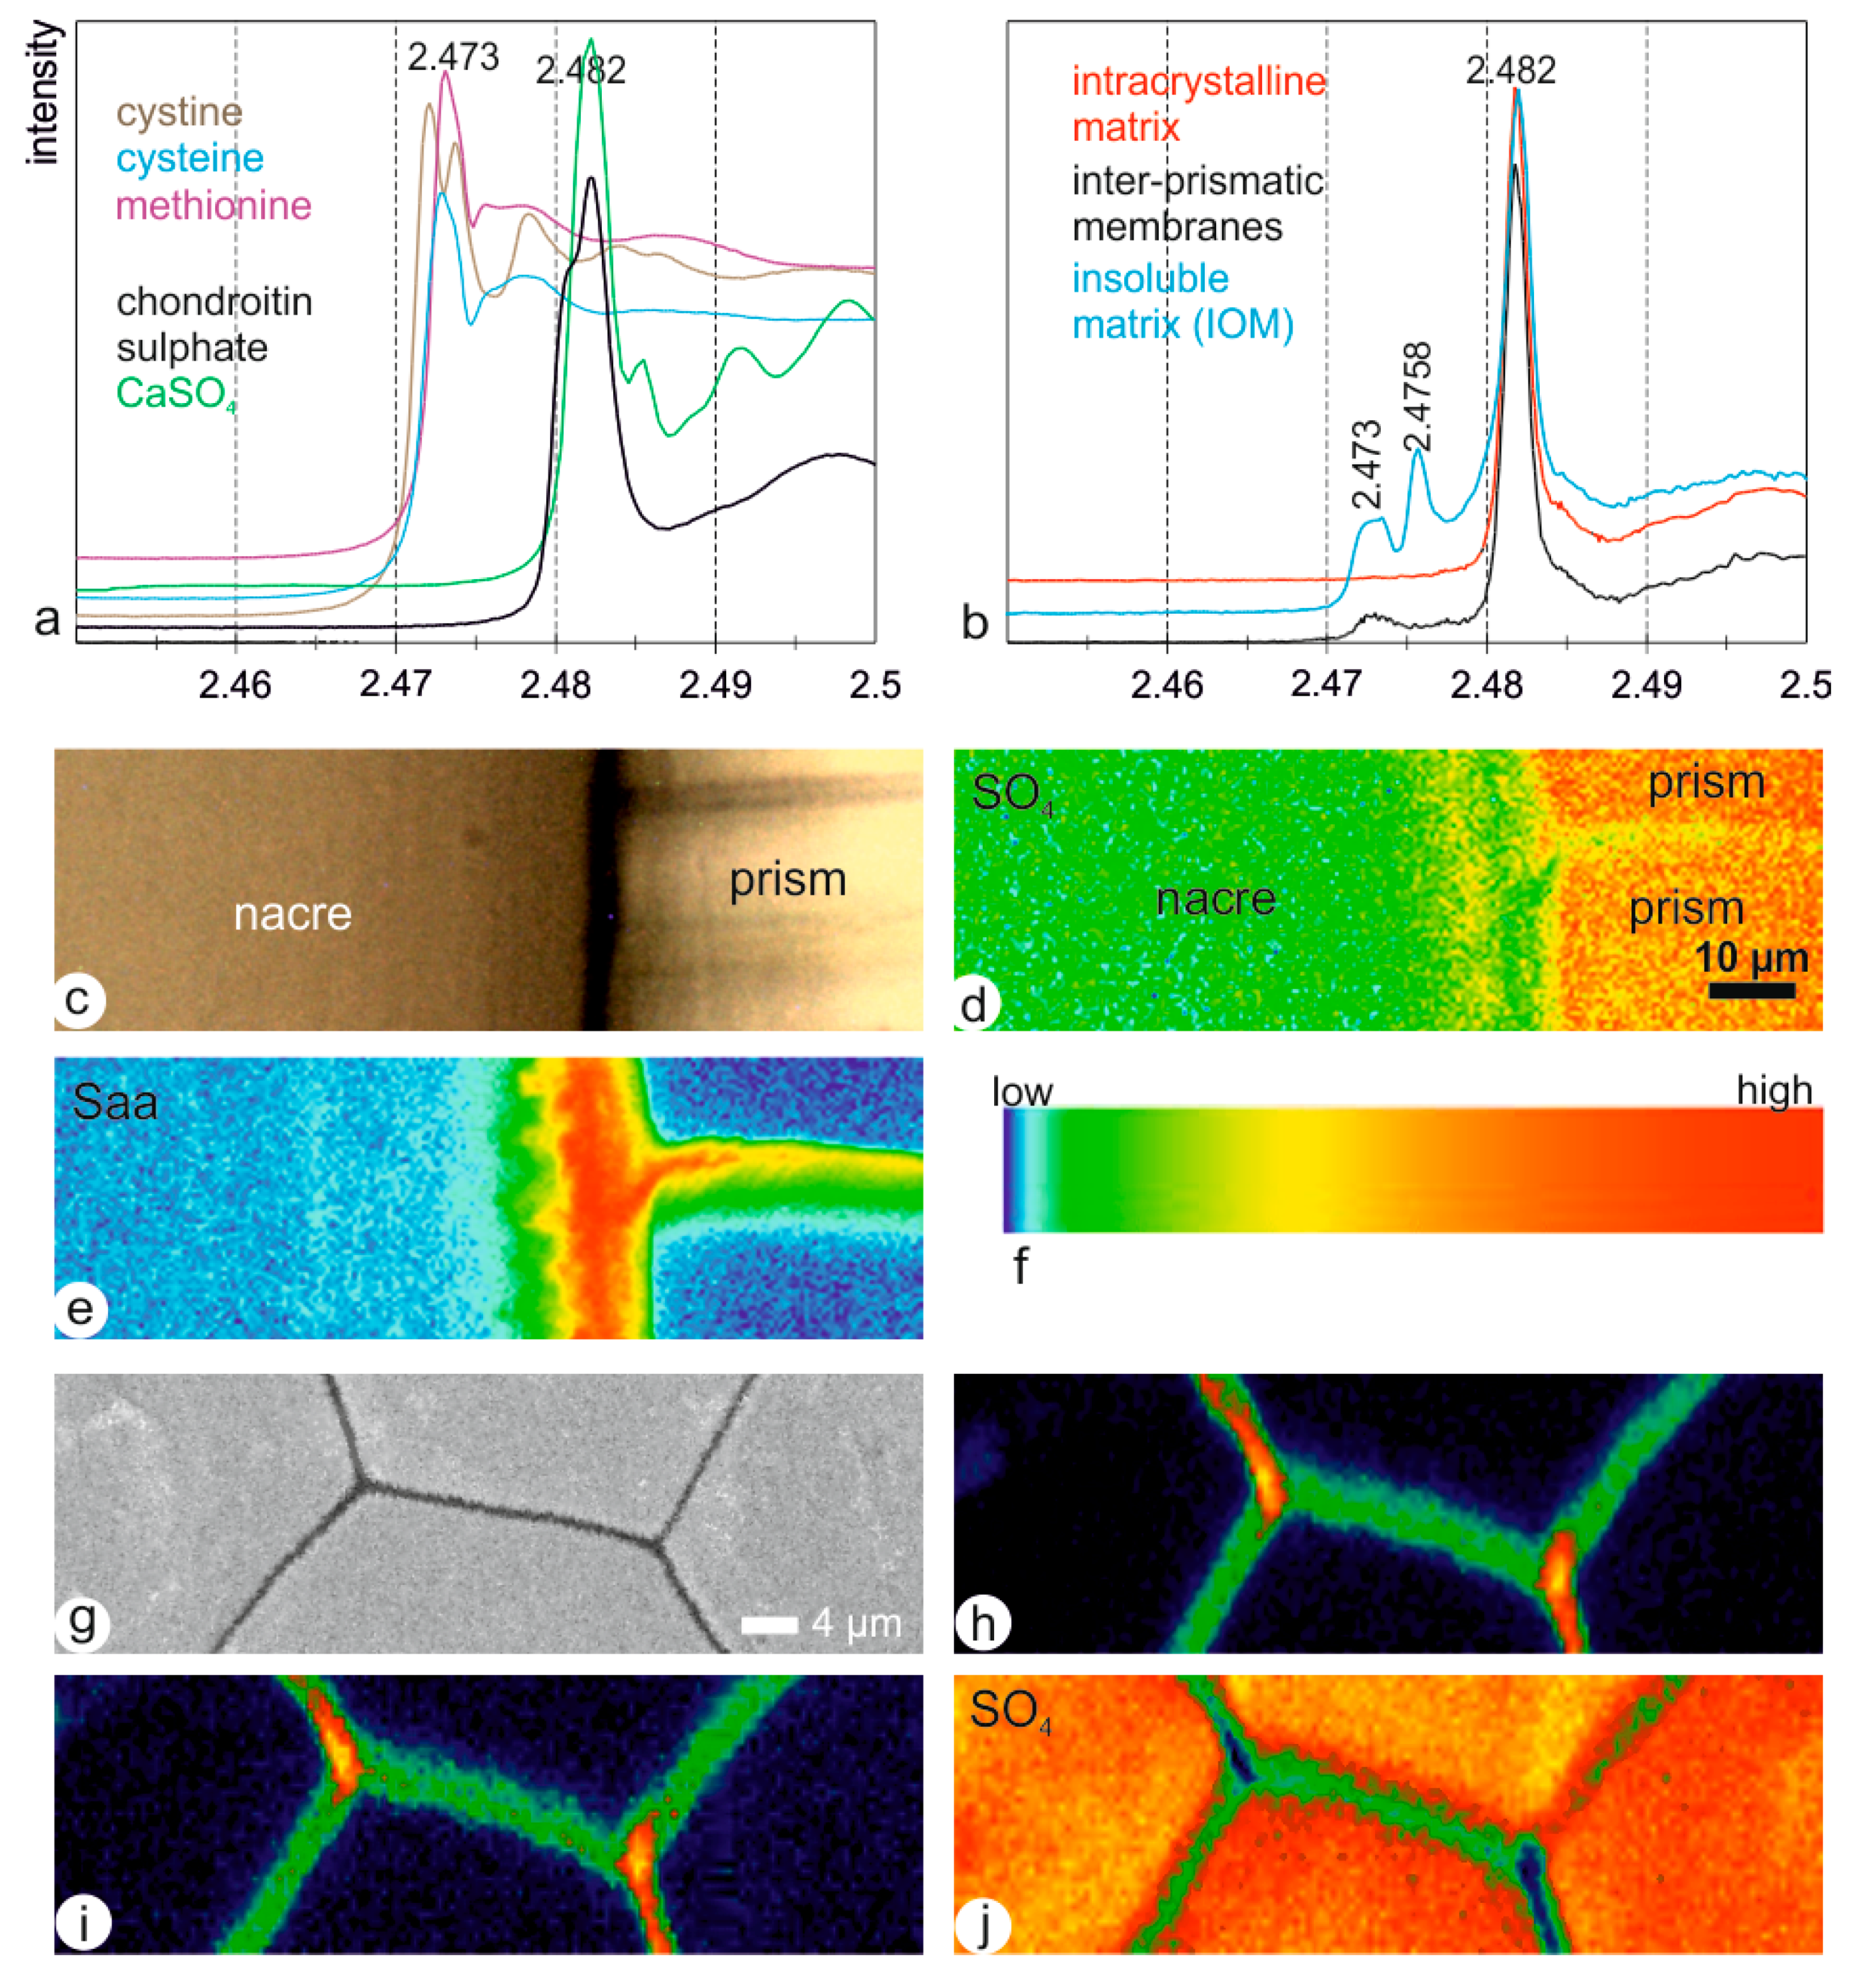
Two aminoacids (cysteine and methionine), and two sulphates (calcium sulphate and chondroitin sulphate) were used as standards for XANES analyses (Figure 11a). Cystine, with a disulphide bond, displays a characteristic double peak near 2.473 keV. Methionine and cysteine have no disulphide bond. Their S K-edge spectra have a main peak at 2.473 keV. The mineral sulphate (CaSO4) and the organic chondroitin sulphate have a main peak at 2.482 keV. However, the chondroitin sulphate has a shoulder in the ascendant (higher energy) slope of the main peak, whereas CaSO4 has a shoulder in the descendant (lower energy) part of the main peak, as well as several additional peaks at energies higher than 2.485 keV.
In situ spectra of the inter-prismatic membranes (usually said to be the insoluble organic matrix) and of the intra-prismatic zone (usually said to be the soluble organic matrix) have a main peak at 2.48 keV, indicative of the predominance of sulphate (Figure 11b). The profiles at energies higher than 2.485 keV show only a large shoulder, as for the organic chondroitin sulphate. Sulphur containing aminoacids isalso present in the inter-prismatic membranes, with the typical peak at 2.47 keV. Distribution maps of sulphur linked to aminoacids and sulphate have been done on a vertical section across the nacreous and prismatic layers (Figure 11c–e). Sulphate is abundant in the prismatic layer (Figure 11d); the inter-prismatic member is not so rich, especially in its middle part, as shown by the green spots. Sulphur aminoacids are abundant in the nacreous layer (Figure 11e). The organic membrane between the aragonite and the prisms is the richest component in sulphur aminoacids (Figure 11e). Maps were also performed on transverse sections at energies corresponding to the three peaks observed in in situ spectra shown in Figure 11b (Figure 11g–i). The maps at 2.473 and 2.4758 keV (known in methionine sulphoxide) are almost identical (Figure 11h,i), but different from the map at the energy of sulphate (2.482 keV). The inter-prismatic membrane is heterogeneous, with a high content of the junctions of the membrane; the middle part is also rich in sulphur, but spotty. Irrespective of the selected energy, the inter-prismatic membranes are rich in sulphur, and heterogeneous.
4. Discussion
4.1. Influence of the Analytical Methods
Two categories of samples have been prepared and studied: (i) the organic components were extracted and (ii) the organic and mineral components were in situ analysed. Both categories have advantages and problems. Extracted components can be analysed using a large diversity of techniques, especially the soluble matrices. Nevertheless, the ratio between proteins, sugars and lipids is lost, as well as the ratio between the insoluble and soluble components. Only the weight ratio of the organic matrices can be obtained from thermogravimetric analyses. Another drawback is induced by the extraction. The usual method is a decalcification in acetic acid; resins are also used [26]. The organic components are then separated in insoluble and soluble organic matrices, using centrifugations. A comparison of the soluble matrices shows that the molecular weights and aminoacid composition are similar in extracts obtained by decalcification or the use of resins. Analytical conditions for aminoacid analyses are diverse. The choice of the hydrolysis (acidic or basic solution, the temperature, etc.) plays a role. The preservation of sulphur containing aminoacids depends on a special hydrolysis, rarely used, so that some apparently incoherent results are reported. The choice of the column, post or pre-column derivatization, eluant, etc., also leads to different results, so that to compare published data is difficult. The use of different techniques to study calcareous biominerals can help to resolve apparent discrepancies. The case of sulphur is typical. EPMA analyses show the high content of the prismatic layer (Figure S2). Nevertheless, aminoacid analyses do not reveal a high content. Therefore, it can be believed that sulphur is not in the organic components, but in CaCO3. No hydrolysis of the organic matrix is necessary for electrophoreses. The usual staining of the gels evidenced the proteins, but using an appropriate dye (Alcian blue or Acridine orange [27]), shows the high content of organic sulphated sugars. These results are confirmed by XANES analyses.
Another example of the interest of the use of multiple techniques is the growth layer. Growth layers are visible in photonic microscopy, and ultraviolet fluorescence and confocal microscopy show they are induced by differences in the organic–mineral ratios [28]. Similar results have been obtained by SEM and AFM observations of samples etched with acidic and enzymatic solutions. However, EPMA maps show that chemical growth layers also exist. Clearly the use of various techniques to check results is time consuming.
Although it is often suggested that the insoluble matrix plays a minor role, the comparison of the preparative processes reveals a complex composition. The main part of the available data on the insoluble matrix comes from the decalcified shell (IOM), and is related to the aminoacid contents and infrared spectra. Nevertheless, the extraction of organic components by organic solvents shows the presence of lipids. Chitin is also often identified. Thus, the insoluble matrices comprise not only proteins, but also polysaccharides and lipids.
It must be added that, whatever the extraction technique, the topographic relationships between the organic and mineral components, a major parameter of the biominerals, is lost. One of the first attempts to display the location of organic and mineral components was done by Crenshaw and Ristedt [29]. They show that the central part of the nacreous tablets is rich in organic matrix (sulphates, carboxylates and Ca-binding sites) in Nautilus. Similar observations were done by Nudelman et al. [30]. These results are in accordance with the SEM observations of the inner structure of the tablets [31], showing that the central region of the tablets of gastropods and cephalopods are mainly organic. In situ maps (infrared and Raman spectrometries) also provide information on the nature of the mineral and organic components, as well as their respective location [32,33]. As for infrared and Raman spectrometry, and TOF-SIMS, both spectra and maps are available in XANES studies. Both SOM (with or without the inter-prismatic membranes) and IOM are rich in sulphur molecules.
4.2. Organic Matrix Composition
As shown by infrared spectrometry of the lipid (LIP) and insoluble (IOM) extracts, the three classes of organic components are present in the prismatic layer: proteins, lipids and sugars. In such complex materials, to assign a band is difficult. It can be said that 1574 cm−1 is often assigned to aspartic acid, and 1610 cm−1 to glutamine. Amide II bands of lysine in H2O are usually noticed at 1524–1526 cm−1, tyrosine at 1518 cm−1 [34,35].
Aminoacid ratios are strongly dependent on the technique. Nevertheless, it can be noted that tyrosine is present in the IOM (from 9.2% to 11.7%) and absent in the SOM. Similarly, lysine content varies from 5.6% to 13% in IOM, and is quasi-absent in SOM. The high glycine content of IOM (this study) and of the SOM [36] is confirmed by the TOF-SIMS map. Similarly, the phenyl-alanine content is higher in the inter-prismatic membrane. Details of the TOF-SIMS maps show that the inter-prismatic membranes are multilayered. Immunogold staining shows that caspartin, a protein rich in proline, is located on the external sides of the inter-prismatic membrane [13].
The presence of sulphur, in the form of sulphate, is demonstrated by XANES spectra performed on the extracted MOI and MOS, and in situ prisms. These results agree with electrophoretic analyses, showing the positive Alcian blue or Acridine orange staining on the SOM extracted from the prismatic layer of Pinna [8,11]. Electron microprobe analyses also show the presence of sulphur in both intra-prismatic material and inter-prismatic membranes [28]. On the contrary, S aminoacids are not detected in aminoacid analyses. But under the usual hydrolysis conditions, aminoacids undergo oxidative deterioration [37]. Thus, there is no contradictory data between XANES and aminoacid analyses.
Previous analyses (liquid chromatography, electrophoresis, etc., [11]) have shown that the inter-prismatic membranes are not only insoluble materials. Structural data and distribution maps show the inter-prismatic organic membranes are multi-layered. Such features are reminiscent of the inter-lamellar membranes of the nacreous layers, despite the inter-lamellar membranes of the nacreous layer seeming to be more regular. Nakahara [38,39] has described the three-layered structure of the membrane on decalcified and fixed and stained shells: “An electron dense central core, about 10 nm in thickness, was observed in each organic sheet (about 40 nm in total thickness)” Black Soudan stain has revealed lipids in the nacre [40]; more recently, lipids were also detected in the nacreous and calcitic prismatic layers of bivalves [25,41]. Nevertheless, this category of organic components has been neglected in most biomineralization studies, despite some biomimetic experiments [42,43].
5. Conclusions
The combination of several independent techniques is time consuming, but very useful to confirm the results. Moreover, structural and compositional analyses, and that of the extracted organic matrices and in situ analyses, allows a better understanding of the biominerals, here exemplified by the case of the historical model: the prismatic layer of Pinna. Such analyses show that the inter-prismatic membranes of Pinna have a complex structure. They comprise several layers with irregular thickness and heterogeneous composition. The comparison of the composition of the soluble matrices extracted from the shell or from isolated prisms demonstrates that the inter-prismatic membranes are not only insoluble; they comprise some soluble components. Thus, the preconceived hypothesis and usual agreement about the intra-prismatic soluble matrices and insoluble inter-prismatic membranes are oversimplified. Similarly, althoughit is known that the organic components are not only proteins, the role of sugars and lipids are not considered in the understanding of the biomineralization process of mollusk shells. Data on the proteins are not sufficient enough to provide a new model of the biomineralization mechanisms. At last, the large diversity of shape, mineralogy and composition of the “prismatic” layers of mollusks does not favor a precise definition.
Supplementary Materials
The following are available online at https://www.mdpi.com/2075-163X/8/9/365/s1, Figure S1: TGA profiles of organic molecules used as standards, Figure S2: Elemental chemical composition of the prisms of Pinna.
Author Contributions
Y.D., J.-P.C. and A.B. conceived, designed and performed the experiments; they also analyzed the data and wrote the paper. K.M. and A.S. performed the XRF maps, analyzed the data and contributed to the manuscript.
Funding
This research was funded by ESRF grant number [CH721, CH948, CH1569, EC24], by ESF under the EUROCORES Programme EuroMinSci (BioCalc project) [ERAS-CT-2003980409 of the European Commission, DG Research, FP6], and ANR [ANR-06-BLAN-0233], and a SOLEIL grant (20170784).
Acknowledgments
We are grateful to Bastien Farre for his help in TOF-SIMS and TLC measurements.
Conflicts of Interest
The authors declare no conflict of interest. The funders had no role in the design of the study, in the collection, analyses, or interpretation of data, in the writing of the manuscript, and in the decision to publish the results.
References
- De Bournon, J.L. Renfermant l′introduction à la minéralogie en général, la théorie de la cristallisation, l′étude de la chaux carbonatée proprement dite, et de l′arragonite, avec application du calcul cristallographique à la détermination des formes cristallines de ces deux substances. In Traité de Minéralogie. Première Partie; William Phillips: London, UK, 1808; p. 432. [Google Scholar]
- Boggild, O.B. The shell structure of the Mollusks. D. Kgl. Danske Vidensk. Selsk. Skr. Nat. Mat. Afd. 1930, 9, 230–326. [Google Scholar]
- Taylor, J.D.; Kennedy, W.J.; Hall, A. The shell structure and mineralogy of the Bivalvia. Introduction. Nuculacae–Trigonacae. Bull. Br. Mus. Nat. Hist. 1969, 3, 1–125. [Google Scholar]
- Taylor, J.; Kennedy, W.J.; Hall, A. The shell structure and mineralogy of the Bivalvia. II. Lucinacea-Clavagellacea, conclusions. Bull. Br. Mus. Nat. Hist. Zool. 1973, 22, 255–294. [Google Scholar]
- Bowerbank, J.S. On the structure of the shells of molluscous and conchiferous animals. Trans. Microsc. Soc. Lond. 1844, 1, 123–153. [Google Scholar] [CrossRef]
- Carpenter, W.B. On the microscopic structure of shells. Rep. Br. Assoc. Adv. Sci. 1844, 1–24. [Google Scholar]
- Réaumur, R.A.F. Sur le coquillage appelé Pinne marine, ou nacre de perle; à l′occasion duquel on explique la formation des perles. Mém. Acad. R. 1717, 177–194. [Google Scholar]
- Dauphin, Y. Soluble organic matrices of the calcitic prismatic shell layers of two pteriomorphid Bivalves: Pinna nobilis and Pinctada margaritifera. J. Biol. Chem. 2003, 278, 15168–15177. [Google Scholar] [CrossRef] [PubMed]
- Suzuki, M.; Murayama, E.; Inoue, H.; Ozaki, N.; Tohse, H.; Kogure, T.; Nagasawa, H. Characterization of prismalin-14, a novel matrix protein from the prismatic layer of the Japanese pearl oyster (Pinctada fucata). Biochem. J. 2004, 382, 205–213. [Google Scholar] [CrossRef] [PubMed]
- Cuif, J.P.; Flamand, D.; Frérotte, B.; Chabin, A.; Raguideau, A. Fractionnement de la matrice protéique intraprismatique chez Pinna nobilis L. et composition en acides aminés des différentes phases. C. R. Acad. Sci. Paris 1987, 304, 475–478. [Google Scholar]
- Dauphin, Y. Comparison of the soluble matrices of the calcitic prismatic layer of Pinna nobilis (Mollusca, Bivalvia, Pteriomorpha). Comp. Biochem. Physiol. 2002, 3, 577–590. [Google Scholar] [CrossRef]
- Gotliv, B.A.; Kessler, N.; Sumerel, J.L.; Morse, D.E.; Tuross, N.; Addadi, L.; Weiner, S. Asprich: A novel aspartic acid-rich protein family from the prismatic shell matrix of the bivalve Atrina rigida. Chembiochem 2005, 6, 304–314. [Google Scholar] [CrossRef] [PubMed]
- Marin, F.; Amons, R.; Guichard, G.; Stigter, M.; Hecker, A.; Luquet, G.; Layrolle, P.; Alcaraz, G.; Riondet, C.; Westbroek, P. Caspartin and calprismin, two proteins of the shell calcitic prisms of the Mediterranean fan mussel Pinna nobilis. J. Biol. Chem. 2005, 280, 33895–33908. [Google Scholar] [CrossRef] [PubMed]
- Addadi, L.; Politi, Y.; Nudelman, F.; Weiner, S. Biomineralization design strategies and mechanisms of mineral formation: operating at the edge of instability. In Engineering of Crystalline Materials Properties; Novoa, J.J., Braga, D., Addadi, L., Eds.; Springer: Dordrecht, The Netherland, 2008; pp. 1–15. [Google Scholar]
- Nudelman, F.; Chen, H.H.; Goldberg, H.A.; Weiner, S.; Addadi, L. Lessons from biomineralization: Comparing the growth strategies of mollusc shell prismatic and nacreous layers in Atrina rigida. Faraday Discuss. 2007, 137. [Google Scholar] [CrossRef]
- Haugstad, G. Atomic Force Microscopy: Understanding Basic Modes and Advanced Applications; John Wiley & Sons: Hoboken, NJ, USA, 2012. [Google Scholar]
- Mittal, V.; Matsko, N.B. Analytical Imaging Techniques for Soft Matter Characterization; Springer Science & Business Media: New York, NY, USA, 2012. [Google Scholar]
- Brunelle, A.; Touboul, D.; Laprévote, O. Biological tissue imaging with time-of-flight secondary ion mass spectrometry and cluster ion sources. J. Mass Spectrom. 2005, 40, 985–999. [Google Scholar] [CrossRef] [PubMed] [Green Version]
- Vanbellingen, Q.P.; Elie, N.; Eller, M.J.; Della-Negra, S.; Touboul, D.; Brunelle, A. Time-of-flight secondary ion mass spectrometry imaging of biological samples with delayed extraction for high mass and high spatial resolutions. Rapid Commun. Mass Spectrom. 2015, 29, 1187–1195. [Google Scholar] [CrossRef] [PubMed] [Green Version]
- Somogyi, A.; Medjoubi, K.; Baranton, G.; Le Roux, V.; Ribbens, M.; Polack, F.; Philippot, P.; Samama, J.P. Optical design and multi-length-scale scanning spectro-microscopy possibilities at the Nanoscopium beamline of Synchrotron Soleil. J. Synchrotron Rad. 2015, 22, 1118–1129. [Google Scholar] [CrossRef] [PubMed]
- Zumwalt, R.W.; Absheer, J.S.; Kaiser, F.E.; Gehrke, C.W. Acid hydrolysis of proteins for chromatographic analysis of amino acids. J. Assoc. Off. Anal. Chem. 1987, 70, 147–151. [Google Scholar] [PubMed]
- Baronnet, A.; Cuif, J.P.; Dauphin, Y.; Farre, B.; Nouet, J. Crystallization of biogenic Ca-carbonate within organo-mineral micro-domains. Structure of the calcite prisms of the pelecypod Pinctada margaritifera (Mollusca) at the submicron to nanometer ranges. Mineral. Mag. 2008, 72, 617–626. [Google Scholar] [CrossRef]
- Sillero, A.; Ribeiro, J.M. Isoelectric points of proteins: Theoretical determination. Anal. Biochem. 1989, 179, 319–325. [Google Scholar] [CrossRef]
- Ikai, A. Thermostability and aliphatic index of globular proteins. J. Biochem. 1980, 88, 1895–1898. [Google Scholar] [PubMed]
- Farre, B.; Dauphin, Y. Lipids from the nacreous and prismatic layers of two Pteriomorpha Mollusc shells. Comp. Biochem. Physiol. 2009, B152, 103–109. [Google Scholar] [CrossRef] [PubMed]
- Albeck, S.; Weiner, S.; Addadi, L. Polysaccharides of intracrystalline glycoproteins modulate calcite crystal growth in vitro. Chem. Eur. J. 1996, 2, 278–284. [Google Scholar] [CrossRef]
- Hayat, M.A. Stains and Cytochemical Methods; Plenum Press: New York, NY, USA; London, UK, 1993. [Google Scholar]
- Cuif, J.P.; Dauphin, Y.; Nehrke, G.; Nouet, J.; Perez-Huerta, A. Layered growth and crystallization in calcareous biominerals: Impact of structural and chemical evidence on two major concepts in invertebrate biomineralization studies. Minerals 2012, 2, 11–39. [Google Scholar] [CrossRef] [Green Version]
- Crenshaw, M.A.; Ristedt, H. The histochemical localization of reactive groups in septal nacre from Nautilus pompilius L. In The Mechanisms of Mineralization in the Invertebrates and Plants; Watabe, N., Wilbur, K.M., Eds.; University of South Carolina Press: Columbia, SC, USA, 1976; Volume 5, pp. 355–367. [Google Scholar]
- Nudelman, F.; Gotliv, B.A.; Addadi, L.; Weiner, S. Mollusk shell formation: mapping the distribution of organic matrix components underlying a single aragonitic tablet in nacre. J. Struct. Biol. 2006, 153, 176–187. [Google Scholar] [CrossRef] [PubMed]
- Mutvei, H. The nacreous layer in molluscan shells. In The Mechanisms of Biomineralization in Animals and Plants; Omori, M., Watabe, N., Eds.; Tokai University Press: Tokyo, Japan, 1980; pp. 49–56. [Google Scholar]
- Stemmer, K.; Nehrke, G. The distribution of polyenes in the shell of Arctica islandica from North Atlantic localities: A confocal Raman microscopy study. J. Moll. Stud. 2014, 80, 365–370. [Google Scholar] [CrossRef]
- Beierlein, L.; Nehrke, G.; Brey, T. Confocal Raman microscopy in sclerochronology: A powerful tool to visualize environmental information in recent and fossil biogenic archives. Geochem. Geophysics Geosyst. 2015, 16, 325–335. [Google Scholar] [CrossRef] [Green Version]
- Venyaminov, S.Y.; Kalnin, N.N. Quantitative IR spectrophotometry of peptide compounds in water (H2O) solutions. I. Spectral parameters of amino acid residue absorption bands. Biopolymers 1990, 30, 1243–1257. [Google Scholar] [CrossRef] [PubMed]
- Barth, A. The infrared absorption of amino acid side chains. Progress Biophys. Mol. Biol. 2000, 74, 141–173. [Google Scholar] [CrossRef]
- Cuif, J.P.; Denis, A.; Flamand, D.; Frérotte, B. Etude ultrastructurale de la transition prismes/nacre dans le test de Pinna nobilis L. (Mollusque, Lamellibranche). Sci. Rep. Port-Cros Natl. Park 1985, 11, 95–107. [Google Scholar]
- Martin, A.J.P.; Synge, R.L.M. Analytical chemistry of the proteins. In Advances in Protein Chemistry; Anson, M.L., Edsall, J.T., Eds.; Academic Press: New York, NY, USA, 1945; Volume 2, pp. 1–83. [Google Scholar]
- Nakahara, H. An electron microscope study of the growing surface of nacre in two Gastropod species, Turbo cornutus and Tegula pfeifferi. Venus 1979, 38, 205–211. [Google Scholar]
- Nakahara, H. The formation and fine structure of the organic phase of the nacreous layer in mollusc shell. In Study of Molluscan Paleobiology; Niigata University: Niigata, Japan, 1981; pp. 21–27. [Google Scholar]
- Crenshaw, M.A.; Heely, J.D. Sudanophilia at sites of mineralization in molluscs. J. Dent. Res. 1967, 49B, 65. [Google Scholar]
- Rousseau, M.; Bédouet, L.; Lati, E.; Gasser, P.; Le Ny, K.; Lopez, E. Restoration of stratum corneum with nacre lipids. Comp. Biochem. Physiol. B 2006, 145, 1–9. [Google Scholar] [CrossRef] [PubMed]
- Buijnsters, P.J.J.A.; Donners, J.J.J.M.; Hill, S.J.; Heywood, B.R.H.; Nolte, R.J.M.; Zwanenburg, B.; Sommerdijk, N.A.J.M. Oriented crystallization of calcium carbonate under self-organized monolayers of amide-containing phospholipids. Langmuir 2001, 17, 3623–3628. [Google Scholar] [CrossRef]
- Sato, K.; Kumagai, Y.; Watari, K.; Tanaka, J. Hierarchical texture of calcium carbonate crystals grown on a polymerized Langmuir-Blodgett film. Langmuir 2004, 20, 2979–2981. [Google Scholar] [CrossRef] [PubMed]
Figure 1.
Historical illustrations of the structure of the prismatic layer of Pinna. (a) Transverse section showing the inter-prismatic organic membranes. (b) Decalcified transverse section showing the inter-prismatic organic membranes. (c) Outer surface of the prismatic layer showing oblique crests. (d) Isolated prisms showing the polygonal sections and faint growth lines. (e) Longitudinal sections showing the synchronic growth lines across adjacent prisms. (a,b) from Bowerbank [5], (c–e) from Carpenter [6].

Figure 2.
Microstructure of the prismatic layer of Pinna. (a) Inner surface of P. nobilis, showing the nacreous (N) and prismatic (P) layers, and corrugated appearance due to the presence of undulating lamella on the outer surface (insert). (b) Vertical fracture showing the straight parallel prismatic units. (c) Inner surface of the shell showing the polygonal shape of the prisms; compare with Figure 1a. (d) Fracture showing faint growth lines on the longitudinal faces of a prism. (e) Isolated prisms; compare with Figure 1d. (f) Detail of the surface of inter-prismatic membranes, showing thin parallel growth layers. (g) The inter-prismatic membrane is partially dissolved using an organic solvent (chloroform). (h) Decalcified prismatic layer showing that the inter-prismatic organic membranes have a layered arrangement, after one week in Milli-Q water. (i) Growing surface showing crests and grooves; compare with Figure 1c. (j) Surface of a growth lamella showing “centres” of calcification. (k) Polished, fixed and decalcified sections showing the organic framework within a prism. Fixation: glutaraldehyde 6% buffered with Na cacodylate (0.4 M) and NaCl (7%); etched by RDO Rapid Decalcifier (Apex Engineering Products, Aurora, CO, USA) for 15 s, washed with Milli-Q water and dehydrated using alcoholic solutions from 30% to 100%.

Figure 3.
Nanostructure of the prismatic layer of Pinna, atomic force microscope (AFM images). (a) Polished, fixed and etched section showing a smooth inter-prismatic membrane (IP) and irregular intra-prismatic zones (M); fixation-etching: formic acid 0.1% and glutaraldehyde 2% for 10 s; dehydrated using alcoholic solutions from 30% to 100%; height image. (b) Etched polished section showing the inter-prismatic membrane; etching and fixing solution: formic acid 0.1% and glutaraldehyde 2% for 10 s; phase image. (c) Polished and etched transverse section showing the lateral surface of the inter-prismatic membrane, showing some growth layers, and the regular arrangements of organic subunits; Mutvei’s solution for 8 min; phase image. (d) Same sample, detail of 3c; height image. (e) Another lateral face of a prism in the same sample; phase image. (f) Detail of the compact arrangement of the molecules; phase image.

Figure 4.
Pinna: Nanostructure of the lateral faces of prisms without the inter-prismatic membranes. (a) AFM height image shows a smooth surface: growth lines and granules are not distinct; insert: the isolated prism showing a striation on the lateral face. NaOCl for 1 h at 20 °C. (b) Detail of 4a, showing granules, the outlines of which are blurred; height image. (c,d) Detail of 4b; outlines are still blurred in height image (4c), but distinct in phase image (4d). (e) Same sample, other location; mineral granules do not show facets; phase image. (f) Granules are surrounded by a thin cortex; phase image.

Figure 5.
Thermogram and first derivative of (a) non biogenic CaCO3 and (b) the prismatic layer of Pinna; insert: Weight loss (in %).
Figure 5.
Thermogram and first derivative of (a) non biogenic CaCO3 and (b) the prismatic layer of Pinna; insert: Weight loss (in %).

Figure 6.
Fourier transform infrared spectrometer (FTIR) spectra. (a) Spectra of standards: chitin for polysaccharides, bovine serum albumin (BSA) for proteins, and cholesterol for lipids. (b) Spectra of the prismatic layer of Pinna; non decalcified profile showing the calcitic composition and organic bands; lipid extracts (LIP): organic matrix obtained using organic solvent; insoluble (IOM): organic matrix obtained after decalcification process.

Figure 7.
Aminoacid composition of the insoluble matrix (IOM) of Pinna nobilis, obtained using a decalcification process, showing the high glycine content.
Figure 7.
Aminoacid composition of the insoluble matrix (IOM) of Pinna nobilis, obtained using a decalcification process, showing the high glycine content.

Figure 8.
Thin layer chromatography profiles of lipid standards, and of the lipid extracts of the prismatic layer of Pinna, with (+mb) and without (−mb) the inter-prismatic membrane.
Figure 8.
Thin layer chromatography profiles of lipid standards, and of the lipid extracts of the prismatic layer of Pinna, with (+mb) and without (−mb) the inter-prismatic membrane.

Figure 9.
Time-of-flight secondary ion mass spectrometry (TOF-SIMS) maps of transverse sections of Pinna prismatic layer. (a) Scanning electron microscope (SEM) image showing the polygonal shape of prisms. (b) Glycine map, showing the high content of the inter-prismatic membranes. (c) Phenyl-alanine map. (d) Ca map, showing that the intra-prismatic zone is not homogeneous. (e,h) Maps showing the heterogeneous distribution of proline in the inter-prismatic membrane. (f,i) Detailed maps showing the irregular content of glycine in the inter-prismatic membrane. (g) Color scale.

Figure 10.
Elemental composition of the prismatic layer. (a–f) X-ray fluorescence maps of Pinna muricata). (g) Electron Probe Micro Analysis map of a polished transverse section showing the inter-prismatic membranes are poor in Mg (Pinna nobilis). (h,i) Longitudinal sections of Pinna nobilis showing that the Mg and S contents of the prisms are not homogeneous, and that chemical growth lines are not superimposed.

Figure 11.
X-ray absorption near edge structure (XANES), Pinna shell. (a) Spectra of organic and mineral standards. (b) In situ spectra of the intra-crystalline part of the prisms and of the inter-prismatic organic membranes, and spectrum on the insoluble organic matrix extracted from the prismatic layer. (c) Longitudinal section showing the prismatic and the nacreous layer, and the inter- and intra-prismatic organic membranes. (d) XANES distribution map of sulphate (SO4) (E = 2.482 keV). (e) XANES distribution map of sulphur rich aminoacid (Saa) (E = 2.473 keV). (f) Color scale of XANES maps. (g) Transversal polished section used for XANES maps. (h) XANES distribution map of sulphur rich aminoacid (E = 2.473 keV). (i) XANES distribution map of sulphur rich aminoacid (E = 2.4758 keV). (j) XANES distribution map of sulphate (SO4) (E = 2.482 keV).

© 2018 by the authors. Licensee MDPI, Basel, Switzerland. This article is an open access article distributed under the terms and conditions of the Creative Commons Attribution (CC BY) license (http://creativecommons.org/licenses/by/4.0/).
Share and Cite
MDPI and ACS Style
Dauphin, Y.; Brunelle, A.; Medjoubi, K.; Somogyi, A.; Cuif, J.-P. The Prismatic Layer of Pinna: A Showcase of Methodological Problems and Preconceived Hypotheses. Minerals 2018, 8, 365. https://doi.org/10.3390/min8090365
AMA Style
Dauphin Y, Brunelle A, Medjoubi K, Somogyi A, Cuif J-P. The Prismatic Layer of Pinna: A Showcase of Methodological Problems and Preconceived Hypotheses. Minerals. 2018; 8(9):365. https://doi.org/10.3390/min8090365
Chicago/Turabian StyleDauphin, Yannicke, Alain Brunelle, Kadda Medjoubi, Andrea Somogyi, and Jean-Pierre Cuif. 2018. "The Prismatic Layer of Pinna: A Showcase of Methodological Problems and Preconceived Hypotheses" Minerals 8, no. 9: 365. https://doi.org/10.3390/min8090365
Note that from the first issue of 2016, this journal uses article numbers instead of page numbers. See further details here.