Preliminary Data on the Nanoscale Chemical Characterization of the Inter-Crystalline Organic Matrix of a Calcium Carbonate Biomineral


Department of Geological Sciences, University of Alabama, Tuscaloosa, AL 35487, USA
*
Author to whom correspondence should be addressed.
Minerals 2018, 8(6), 223; https://doi.org/10.3390/min8060223
Submission received: 27 April 2018
/
Revised: 22 May 2018
/
Accepted: 23 May 2018
/
Published: 25 May 2018
(This article belongs to the Special Issue Biomineral Crystal Structure)
Abstract
:Chemical signatures of carbonate biominerals are important for understanding biomineral formation, and are a subject of great interest in geosciences for applications in paleoclimatology and paleoceanography. A prominent unknown factor is the chemistry of organic matrices, in particular that of the inter-crystalline fraction. Here, we use atom probe tomography (APT) for the nanoscale chemical characterization of the mineral-organic interface in calcite from mussel shells. Our findings indicate that the quality of APT bulk chemistry results is highly dependent on sample preparation, yet data on biogenic calcite could be geochemically interpreted with confidence. Three-dimensional (3D) reconstructions of calcite tip specimens show the presence of organic matrix domains, characterized by the depletion of cations but enrichment in oxygen and carbon, and with at least 1% atomic increase in 16O relative to the surrounding mineral phase. This is the first relative, in-situ quantification of the chemical composition of the inter-crystalline organic matrix (IOM) for a carbonate biomineral, with implications for a better understanding of vital effects, proxy calibration, and the formation of these biocarbonates. Overall, our findings demonstrate the potential of nanoscale characterization of biominerals and their abiogenic counterparts to further advance our understanding of their chemistry.
1. Introduction
The study of calcium carbonate biominerals plays a very important role in the understanding of biomineralization processes (e.g., [1,2]). Despite numerous studies, there are still fundamental aspects about the chemistry of these biominerals that are insufficiently known. The absence of this chemical information has an impact in our knowledge of biomineral formation [3]. Also, this can impact the correct interpretation of chemical proxy data from these biominerals, which is used for reconstructions of past climates, environments, and oceanic conditions [4]. One of those aspects relates to the chemical signature of organic matrices, as these biominerals are composites of mineral and organic phases [3].
Biominerals have two main organic components: an intra-crystalline fraction, inside the mineralized structure (i.e., a prism) and occluded as a consequence of the mineral nucleation and growth; and an inter-crystalline fraction present in between structures that usually serves as scaffold for mineral growth and emplacement, and which determines the final morphology of crystals. The main component studied in the context of biomineralization is the inter-crystalline organic matrix (IOM) because of its relatively easy visualization with microscopy techniques. The in-situ chemical analysis of the IOM, due to the dimensions of its components (often <500 nm in thickness), is mostly conducted by synchrotron-based techniques [1]. However, this characterization often provides an incomplete picture, with only relative abundances of elements and isotopes.
In this study, we attempt the in-situ analysis of the IOM in the calcitic layer of the bimineralic shell of the common blue mussel (Mytilus edulis) using the technique of atom probe tomography (APT). The calcite of the Mytilus shells is chosen as a first approximation to the analysis of biogenic carbonates in the context of biomineralization because of previous studies of the same organism (e.g., [5,6,7]). Also, shells of Mytilus species, in particular those of M. edulis, have been used for proxy calibrations and to further elucidate vital effects [8,9,10,11]. Previous applications of APT to the study of biominerals have provided excellent results in the chemical characterization of interfaces and organic phases [12,13,14]. More recently, this has been further shown for the APT characterization of mineral-organic interfaces in Foraminifera calcite [15]. In parallel to the analysis of the organic matrix of calcite in these mussel shells, an equally important goal is to evaluate the optimization of sample preparation of biocarbonates for APT studies. APT focused ion beam (FIB)-sample preparation and analysis of organic-rich mineral phases is challenging [15], and has so far been reported extensively only for biomagnetite and bioapatite [12,13].
2. Material and Methods
2.1. Materials
Individuals of the common blue mussel (Mytilus edulis) were collected alive in the shoreline close to Praia da Lanzada, near O Grove (Galicia, NW Spain; 42.4512° N, 8.8785° W). After tissue removal, shells were cleaned with NaOCl and distilled water and allowed to dry out at room temperature. The left valve of one shell was sectioned along the length (umbo to posterior region) to expose a section across the shell thickness, with the calcite on the outer part and aragonite nacre on the inside (Figure 1); subsequently, this section was highly polished for focused ion beam milling. From a different individual, a shell section was obtained to expose the {0001} plane of calcite.
2.2. Methods
2.2.1. Selection of Regions of Interest
The polished samples were secured to an aluminum stub using conductive silver liquid paint and sputter-coated with 15 nm of Cu. Several regions of interest were carefully selected to ensure that the specimen tips would enclose a section of the biomineral structure (calcite acicular crystals), as well as a portion of the inter-crystalline organic matrix (Figure 1 and Figure 2). Through polishing and subsequent Cu coating, the difference in relief between both phases (mineral and organic) was apparent under SEM (JEOL, Tokyo, Japan) visualization, albeit more clearly for wedges extracted from the plane ({0001}) containing the c-axis (see Figure 2B).
The specimen tips were extracted from the section containing the calcite across the shell thickness, from a wedge nearly perpendicular (maximum 15° deviation) to the c-axis of calcite (Figure 2A). An additional wedge was extracted from the {0001} plane (Figure 2B). Crystallographic orientations are based on published electron backscatter diffraction (EBSD) results [5].
2.2.2. Focused Ion Beam (FIB) Work
Specimen tips for APT analyses were prepared by focused ion beam (FIB) (Figure 2C,D), using an adapted FIB-based lift-out protocol [16]. A dual beam scanning electron microscope TESCAN LYRA XMU, housed at the Central Analytical Facility (CAF) of the University of Alabama was utilized for this purpose. A rectangle of Pt was deposited on the polished section of the Cu-coated carbonates using a Ga+ ion beam at 30 kV and 7 pA. A wedge of material below the Pt rectangle was then cut using the ion beam (30 kV, 1 nA) on the three sides, and then welded to an in-situ nano-manipulator (SmarAct) using FIB-deposited Pt before cutting the final edge free. Segments 1–2 μm wide were cut from each wedge and sequentially affixed with Pt to the tops of Si posts of a microtip array coupon purchased from CAMECA Scientific Instruments, Inc., Madison, WI, USA. Each tip was shaped and sharpened using annular milling patterns of increasingly smaller inner and outer diameters. Initially, the milling was performed at 30 kV to produce the specimen geometry necessary for APT. Final milling was performed at an accelerating voltage of 5 kV, in order to reduce Ga+ implantation and obtain a consistent tip-to-tip shape. The diameter at the top of the tips varied between 30–50 nm, while the shank angle ranged from 27° to 42°. Eight tips were extracted from each wedge, resulting in a total of 16 specimens.
2.2.3. Scanning Electron Microscopy (SEM) Imaging
After FIB-specimen preparation, the studied shell sections were etched with 2% HCl for high-resolution imaging using a JEOL 7000 FEG-SEM (20 kV, medium (8) spot size, and between ~20–30 mm working distance) (JEOL, Tokyo, Japan), housed at the CAF of the University of Alabama (see Figure 1). Prior to imaging, the samples were gold-coated in a sputter coater for one minute.
2.2.4. Local Electrode Atom Probe (LEAP) Work and Data Analyses
All specimen tips (n =16) were analyzed using a local electrode atom probe LEAP 5000 XS (Madison, WI, USA) equipped with a pico-second 355 nm UV laser from Cameca instruments, housed at the CAF of the University of Alabama. However, only five tips, which did not fracture, generated more than one million ions; these were the ones further evaluated for this study (Table 1 and Table 2). APT data were reconstructed using Integrated Visualization and Analysis Software (IVAS, version 3.6.12) from Cameca Instruments, Inc.
The reconstructions were completed by manually fitting the time-of-flight mass spectrum iteratively, using the voltage and bowl fitting parameters within the IVAS platform. The three-dimensional reconstructions of APT data (total ions and isosurfaces) were performed using the “shank” tip profile method, to determine the reconstructed radius as a function of analyzed depth. Peak ranges were defined as the entire visible peak or adjusted manually when large thermal tails were present (APT raw and bulk ionic data can be found in the Supplementary Materials Tables S1 and S2).
3. Results
3.1. Quality of Atom Probe Tomography Specimens
APT tip specimens were extracted from two shell sections for calcite acicular crystals: (1) on a section nearly perpendicular to the orientation of the c-axis for both minerals (Figure 2C); and (2) on the {0001} planes of calcite (Figure 2B). FIB work was more laborious on the near-perpendicular sections, requiring more time to fabricate the wedges and sharpen the tips, and faster on specimens extracted from sections containing the c-axis for prisms. In contrast, the APT yield was higher for tips generated from these near-perpendicular sections; for example, there was a success rate of 50% of tips run in the LEAP, in comparison to a 25% success rate for tips extracted from the {0001} plane. Besides tip yields, though, the quality of APT data is quite dissimilar. APT analysis of tips from the perpendicular sections provided very good results, with more than 10 million total ions per tip in three tips (Table 1), and interpretable chemical spectra, with low backgrounds and minimal peak overlapping (Figure 3 and Table 1).
3.2. Atom Probe Tomography Chemical Data
Due to differences in the quality of datasets (i.e., yield), bulk chemistry data can only be properly assessed for the tips that provided the highest number of total ions and well-defined peaks. Three calcite tips (268, 269 and 299; Table 1 and Table 2), providing the highest number of counts, were analyzed in detail. Bulk chemistry data from these tips reveal significant differences. For example, the atomic bulk composition of tip 268 is closer to the values reported for abiogenic calcite [17], whereas the composition of tip 269 shows evidence of carbon enrichment and oxygen depletion (Table 2). Independently of the stoichiometry, all tips exhibit “new” peaks on the mass spectra that are associated with biogenic carbonates (Figure 3). Single oxygen peaks were identified for both 16O and 18O, and associated with hydroxyl (OH−) peaks at 17 Da and 19 Da, and carbon also appears as a single ion (12C). These peaks are not present in the APT results of abiogenic calcite [17] (Figure 3B). APT also shows the presence of sodium and nitrogen, but with very low concentrations (Table 2), characteristic of biogenic calcite.
4. Discussion
The optimization of sample preparation protocols for APT analysis of biocarbonates was an important objective of this study, because insulator materials are notoriously challenging to be analyzed by APT. The presence of organics and the typically brittle nature of biogenic carbonates add a higher degree of difficulty to the process of sample preparation. Furthermore, the influence of crystallography on APT analysis has been previously suggested for mineral samples [17]. APT tip samples were extracted from shell sections corresponding to different crystallographic planes, and differences were found with regard to how fast and effective the FIB-SEM work was achieved (Figure 2). Surprisingly, samples that were easier to prepare, from the {0001} planes, provided smaller yields, lower total ion counts, and insufficient bulk chemistry data (Table 2). Although only specific types of biocarbonates were analyzed herein, the influence of crystallography on the quality of APT data may be a recurrent phenomenon for the analysis of biominerals as it is in abiogenic minerals.
Because the IOM between calcite prims was the main target for APT characterization, we expected that the bulk chemistry values for calcite would not be stoichiometrically accurate. Organic components are known to interfere with the local electrode in the LEAP, potentially generating chemical interferences [18]. With the exception of tip 268, this was observed in all calcite tips (Table 2), indicating that part of the IOM was analyzed for most tips. Higher organic content can result in an increased loss of ions, especially those of lower masses, during the field evaporation of tip specimens. Despite these issues with the stoichiometry, APT analysis of calcite reveals the presence of sodium and nitrogen in amounts that represent real chemical signatures (Table 2). The presence of sodium has been previously reported in Mytilus edulis shells by electron probe micro-analysis (EPMA) [5], but its importance and location within the crystal lattice or the organic matrix is open for debate. Meanwhile, the presence of detectable nitrogen could be attributable to the protein fraction of the IOM (e.g., [19,20,21]).
The 3D reconstructions of specimens capture the presence of the IOM, as a result of preparing the tips with both the mineral and IOM phases from the crystals (Figure 4). The presence of this IOM in tip reconstructions is associated with areas of high concentrations of specific ions (Figure 4), which were found in all analyzed calcite tips. To elucidate what ions are predominant in these areas, and whether they correspond to a mineral or organic phase, 3D elemental isoconcentration reconstructions were generated (Figure 4 and Figure 5). Using calcium as a marker for the location of atoms associated to the crystal lattice of the mineral phase, these reconstructions reveal the presence of regions depleted in this element, yet enriched in oxygen and carbon (+1 charge) (Figure 4). In the APT analysis of inorganic calcite, it was found that field evaporation of oxygen occurs as O2, or as part of CO32−, and that carbon also appears as part of the carbonate fraction [17]. This a clear indication that these regions depleted in calcium and enriched in light isotopic elements correspond to the organic phase related to the IOM. Also, these regions contain the lowest concentration of sodium (<0.3%) (Figure 5), indicating that this element may be mainly associated to the mineral phase in calcite or to the intra-crystalline organic fraction. Branson et al. [15] have recently shown the occurrence of high Na concentrations at the atomic scale within the organic fraction of calcite in the Foraminifera Orbulina universa. Also, the role of sodium and other cations was discussed in the context of carbonate nucleation during biomineralization. The finding of a very low Na content in the IOM suggests a different role in the formation of calcite biominerals in mussel shells.
The 3D reconstructions of the calcite tips allow the discussion of the chemical signatures associated to the IOM. The IOM does not contain any major or trace elements in concentrations above a 15 ppm background level, estimated from the average background detection limit for calcite in this study (Table 1). The only previous study that attempted to characterize the elemental component in the IOM of bivalve mollusks suggested high (>100 ppm) amounts of magnesium [22]. However, the analyzed shells were aragonitic, of the bivalve Artica islandica, and indirect methods were applied to determine the potential chemical composition of these organic matrices.
In addition to the elemental composition, APT results provide a powerful insight into the isotope atomic abundances of the IOM in the calcite of Mytilus shells, when one or more matrix-related ions are identified in sufficient concentrations (Supplementary Materials Tables S1 and S2). Specific regions of interest can be isolated, and the chemistry, including isotopes outside and inside those locations, can be further constrained by referring to proxigrams (Figure 5). Concentration profiles (in atomic %) can be drawn across the region of interest, where a distance of 0 nm marks the interface between the mineral and organic rich regions (Figure 5). Because of unresolved problems with APT detecting the absolute concentrations for isotopes of elements with low masses, such as oxygen (for example, there is a difficulty with the decomposition of the hydrogen and oxygen concentration in OH− for peaks at 17 Da and 19 Da), only relative abundances for single oxygen and carbon peaks can be given at this point. In this study, calcite tip 269 showed sufficiently high concentrations of oxygen isotopes to allow a discussion on the isotope chemical signature of the organic matrix. In an isotopic comparison at the mineral-IOM interface of tip 269 (Figure 5), excluding the hydroxide contribution, the 16O content is higher inside the organic matrix (~2 atomic %) than in the mineral phase (0.6–1 atomic %). Given that the OH− content is also higher within the IOM and the oxygen contribution is mainly related to 16O, this further indicates that the 16O concentration in the organic phase could be even higher (Figure 5). This trend is not apparent for 18O, and there are insufficient counts of 12C to evaluate its concentration inside the IOM (Figure 5).
Our results show the first quantification of the chemical composition of the IOM of a carbonate biomineral, and have implications for the understanding of chemical proxies. The lowest estimation reflects that the organic matrix is enriched in 16O by at least 1 atomic percent. If these values can be generalized for calcite biominerals in different organisms, we could potentially define “correction values” that could be used to understand the organic contribution to the isotopic composition of the biomineral. This would be of particular importance for in-situ isotopic techniques (e.g., secondary ion mass spectrometry (SIMS)), for which the organic contribution is a known problem that cannot be resolved without modifying the original biomineral structures by chemical (e.g., bleaching) or physical (e.g., roasting) methods directed to remove the organics [23]. Furthermore, given that APT can detect elemental concentrations higher than 20 ppm in this case, the same approach could be utilized to better understand the organic matrix contribution to elemental concentrations. For example, it would be of great interest to further analyze the organic matrices in aragonitic shells of bivalves and validate whether magnesium is mainly bounded to organics in these shells [22].
The use of APT in the study of biominerals is still emerging, yet our study illustrates the usefulness of this technique in the analysis of carbonate biominerals. Overall, our findings demonstrate the potential of nanoscale chemical characterization of the organic matrices, for a better understanding of biomineral information and the correct interpretation of proxies, which are of great importance in paleoclimatology and paleoceanography.
Supplementary Materials
The following are available online at https://www.mdpi.com/2075-163X/8/6/223/s1. Table S1: APT Raw Chemistry Data, Table S2: APT Bulk Ionic Chemistry Data.
Author Contributions
A.P.-H. developed the concept of this study. F.L. conducted sample preparation and analysis. A.P.-H. and F.L. interpreted the data and wrote the paper.
Acknowledgments
This work was supported by funding from the National Science Foundation (NSF), through grants EAR-1402912 and EAR-150779, the Office of the Vice President for Research and Economic Development, the College of Arts & Sciences, and the Department of Geological Sciences at the University of Alabama. The authors thank two anonymous reviewers, and the assistant editor Queenie Wang, for their useful comments, and also acknowledge Rich Martens and Johnny Goodwin at the University of Alabama’s Central Analytical Facility for technical assistance.
Conflicts of Interest
The authors declare no conflict of interest.
References
- Cuif, J.-P.; Dauphin, Y.; Sorauf, J.E. Biominerals and Fossils through Time; Cambridge University Press: Cambridge, UK, 2011; p. ix + 490. [Google Scholar]
- Pérez-Huerta, A.; Coronado, I.; Hegna, T. Understanding biomineralization in the fossil record. Earth Sci. Rev. 2018, 179, 95–122. [Google Scholar] [CrossRef]
- Lowenstam, H.A.; Weiner, S. On Biomineralization; Oxford University Press: Oxford, UK, 1989; 324p. [Google Scholar]
- Weiner, S.; Dove, P.M. An overview of biomineralization processes and the problem of the vital effect. Rev. Mineral. Geochem. 2003, 54, 1–29. [Google Scholar] [CrossRef]
- Dalbeck, P.; England, J.; Cusack, M.; Lee, M.R.; Fallick, A.E. Crystallography and chemistry of the calcium carbonate polymorph switch in M. edulis shell. Eur. J. Mineral. 2006, 18, 601–609. [Google Scholar] [CrossRef]
- Arivalagan, J.; Yarra, T.; Marie, B.; Sleight, V.A.; Duvernois-Berthet, E.; Clark, M.S.; Marie, A.; Berland, S. Insights from the shell proteome: Biomineralization to adaptation. Mol. Biol. Evol. 2017, 34, 66–77. [Google Scholar] [CrossRef] [PubMed]
- Hüning, A.K.; Lange, S.M.; Ramesh, K.; Jacob, D.E.; Jackson, D.J.; Panknin, U.; Gutowska, M.A.; Philipp, E.E.R.; Rosentiel, P.; Lucasson, M.; et al. A shell regeneration assay to identify biomineralization candidate genes in mytilid mussels. Mar. Genom. 2016, 27, 57–67. [Google Scholar] [CrossRef] [PubMed]
- Vander Putten, E.; Dehairs, F.; Keppens, E.; Baeyens, W. High resolution distribution of trace elements in the calcite shell layer of modern Mytilus edulis: Environmental and biological controls. Geochim. Cosmochim. Acta 2000, 64, 997–1011. [Google Scholar] [CrossRef]
- Gillikin, D.P.; Dehairs, F.; Lorrain, A.; Steenmans, D.; Baeyens, W.; André, L. Barium uptake into the shells of the common blue mussel (Mytilus edulis) and the potential for estuarine paleo-chemistry reconstruction. Geochim. Cosmochim. Acta 2006, 70, 395–407. [Google Scholar] [CrossRef]
- Wanamaker, A.D., Jr.; Kreutz, K.J.; Borns, H.W., Jr.; Introne, D.S.; Feindel, S.; Funder, S.; Rawson, P.D.; Barber, B.J. Experimental determination of salinity, temperature, growth, and metabolic effects on shell isotope chemistry of Mytilus edulis collected from Maine and Greenland. Paleoceanography 2007, 22, PA2217. [Google Scholar] [CrossRef]
- Freitas, P.S.; Clarke, L.J.; Kennedy, H.; Richardson, C.A. Ion microprobe assessment of the heterogeneity of Mg/Ca, Sr/Ca, and Mn/Ca ratios in Pecten maximus and Mytilus edulis (bivalvia) shell calcite precipitated at constant temperature. Biogeosciences 2009, 6, 1209–1227. [Google Scholar] [CrossRef]
- Gordon, L.M.; Joester, D. Nanoscale chemical tomography of buried organic-inorganic interfaces in the chiton tooth. Nature 2011, 469, 194–197. [Google Scholar] [CrossRef] [PubMed]
- Gordon, L.M.; Tran, L.; Joester, D. Atom probe tomography of apatites and bone-type mineralized tissues. ACS Nano 2012, 6, 10667–10675. [Google Scholar] [CrossRef] [PubMed]
- Gordon, L.M.; Cohen, M.J.; MacRenaris, K.W.; Pasteris, J.D.; Seda, T.; Joester, D. Amorphous intergranular phases control the properties of rodent tooth enamel. Science 2015, 347, 746–750. [Google Scholar] [CrossRef] [PubMed]
- Branson, O.; Bonnin, E.A.; Perea, D.E.; Spero, H.J.; Zhu, Z.; Winters, M.; Hönisch, B.; Russell, A.D.; Fehrenbacher, J.S.; Gagnon, A.C. Nanometer-scale chemistry of calcite biomineralization template: Implications for skeletal composition and nucleation. Proc. Natl. Acad. Sci. USA 2016, 113, 12934–12939. [Google Scholar] [CrossRef] [PubMed]
- Thompson, K.; Lawrence, D.; Larson, D.J.; Olson, J.D.; Kelly, T.F.; Gorman, B. In situ site-specific specimen preparation for atom probe tomography. Ultramicroscopy 2007, 107, 131–139. [Google Scholar] [CrossRef] [PubMed]
- Pérez-Huerta, A.; Laiginhas, F.; Reinhard, D.A.; Prosa, T.J.; Martens, R.L. Atom probe tomography (APT) of carbonate minerals. Micron 2016, 80, 83–89. [Google Scholar] [CrossRef] [PubMed]
- Perea, D.E.; Liu, J.; Bartrand, J.; Dicken, Q.; Thevuthasan, S.T.; Browning, N.D.; Evans, J.E. Atom probe tomography mapping directly reveals the atomic distribution of phosphorous in resin embedded ferritin. Sci. Rep. 2016, 6, 22321. [Google Scholar] [CrossRef] [PubMed]
- Hare, P.E. Amino acids in the proteins from aragonite and calcite in the shells of Mytilus californianus. Science 1963, 139, 216–217. [Google Scholar] [CrossRef] [PubMed]
- Addadi, L.; Joester, D.; Nudelman, F.; Weiner, S. Mollusk shell formation: A source of new concepts for understanding biomineralization processes. Chem. Eur. J. 2006, 12, 980–987. [Google Scholar] [CrossRef] [PubMed]
- Gao, P.; Liao, Z.; Wang, X.-X.; Bao, L.-F.; Fan, M.-H.; Li, X.-M.; Wu, C.-W.; Xia, S.-W. Layer-by-layer proteomic analysis of Mytilus gallopronvincialis shells. PLoS ONE 2015, 10, e0133913. [Google Scholar] [CrossRef] [PubMed]
- Schöne, B.R.; Zhang, Z.; Jacob, D.E.; Gillikin, D.P.; Tütken, T.; Garbe-Schönberg, D.; McConnaughey, T.; Soldati, A. Effect of organic matrices on the determination of the trace element chemistry (Mg, Sr, Mg/Ca, Sr/Ca) of aragonitic bivalve shells (Artica islandica)—Comparison of ICP-OES and LA-ICP-MS data. Geochem. J. 2010, 44, 23–37. [Google Scholar]
- Rollion-Bard, C.; Mangin, D.; Champenois, M. Development and application of oxygen and carbon isotopic measurements of biogenic carbonates by ion probe. Geostand. Geoanal. Res. 2007, 31, 39–50. [Google Scholar] [CrossRef]
Figure 1.
Mytilus edulis shell components. (A) Shell section across the thickness, with calcite (blue) in the outer region and aragonite nacre (white) in the inner region; from a similar sample, specimens were extracted from a section nearly perpendicular to the c-axis of both calcite and aragonite; (B) SEM image of an etched region of the calcite layer, showing a general view of acicular calcite crystals [dashed red square corresponds to the image shown in (C); scale bar = 1 μm. (C) Detail image of (B), showing calcite crystals with the inter-crystalline organic matrix (IOM) (red arrows) in between (scale bar = 1 μm).
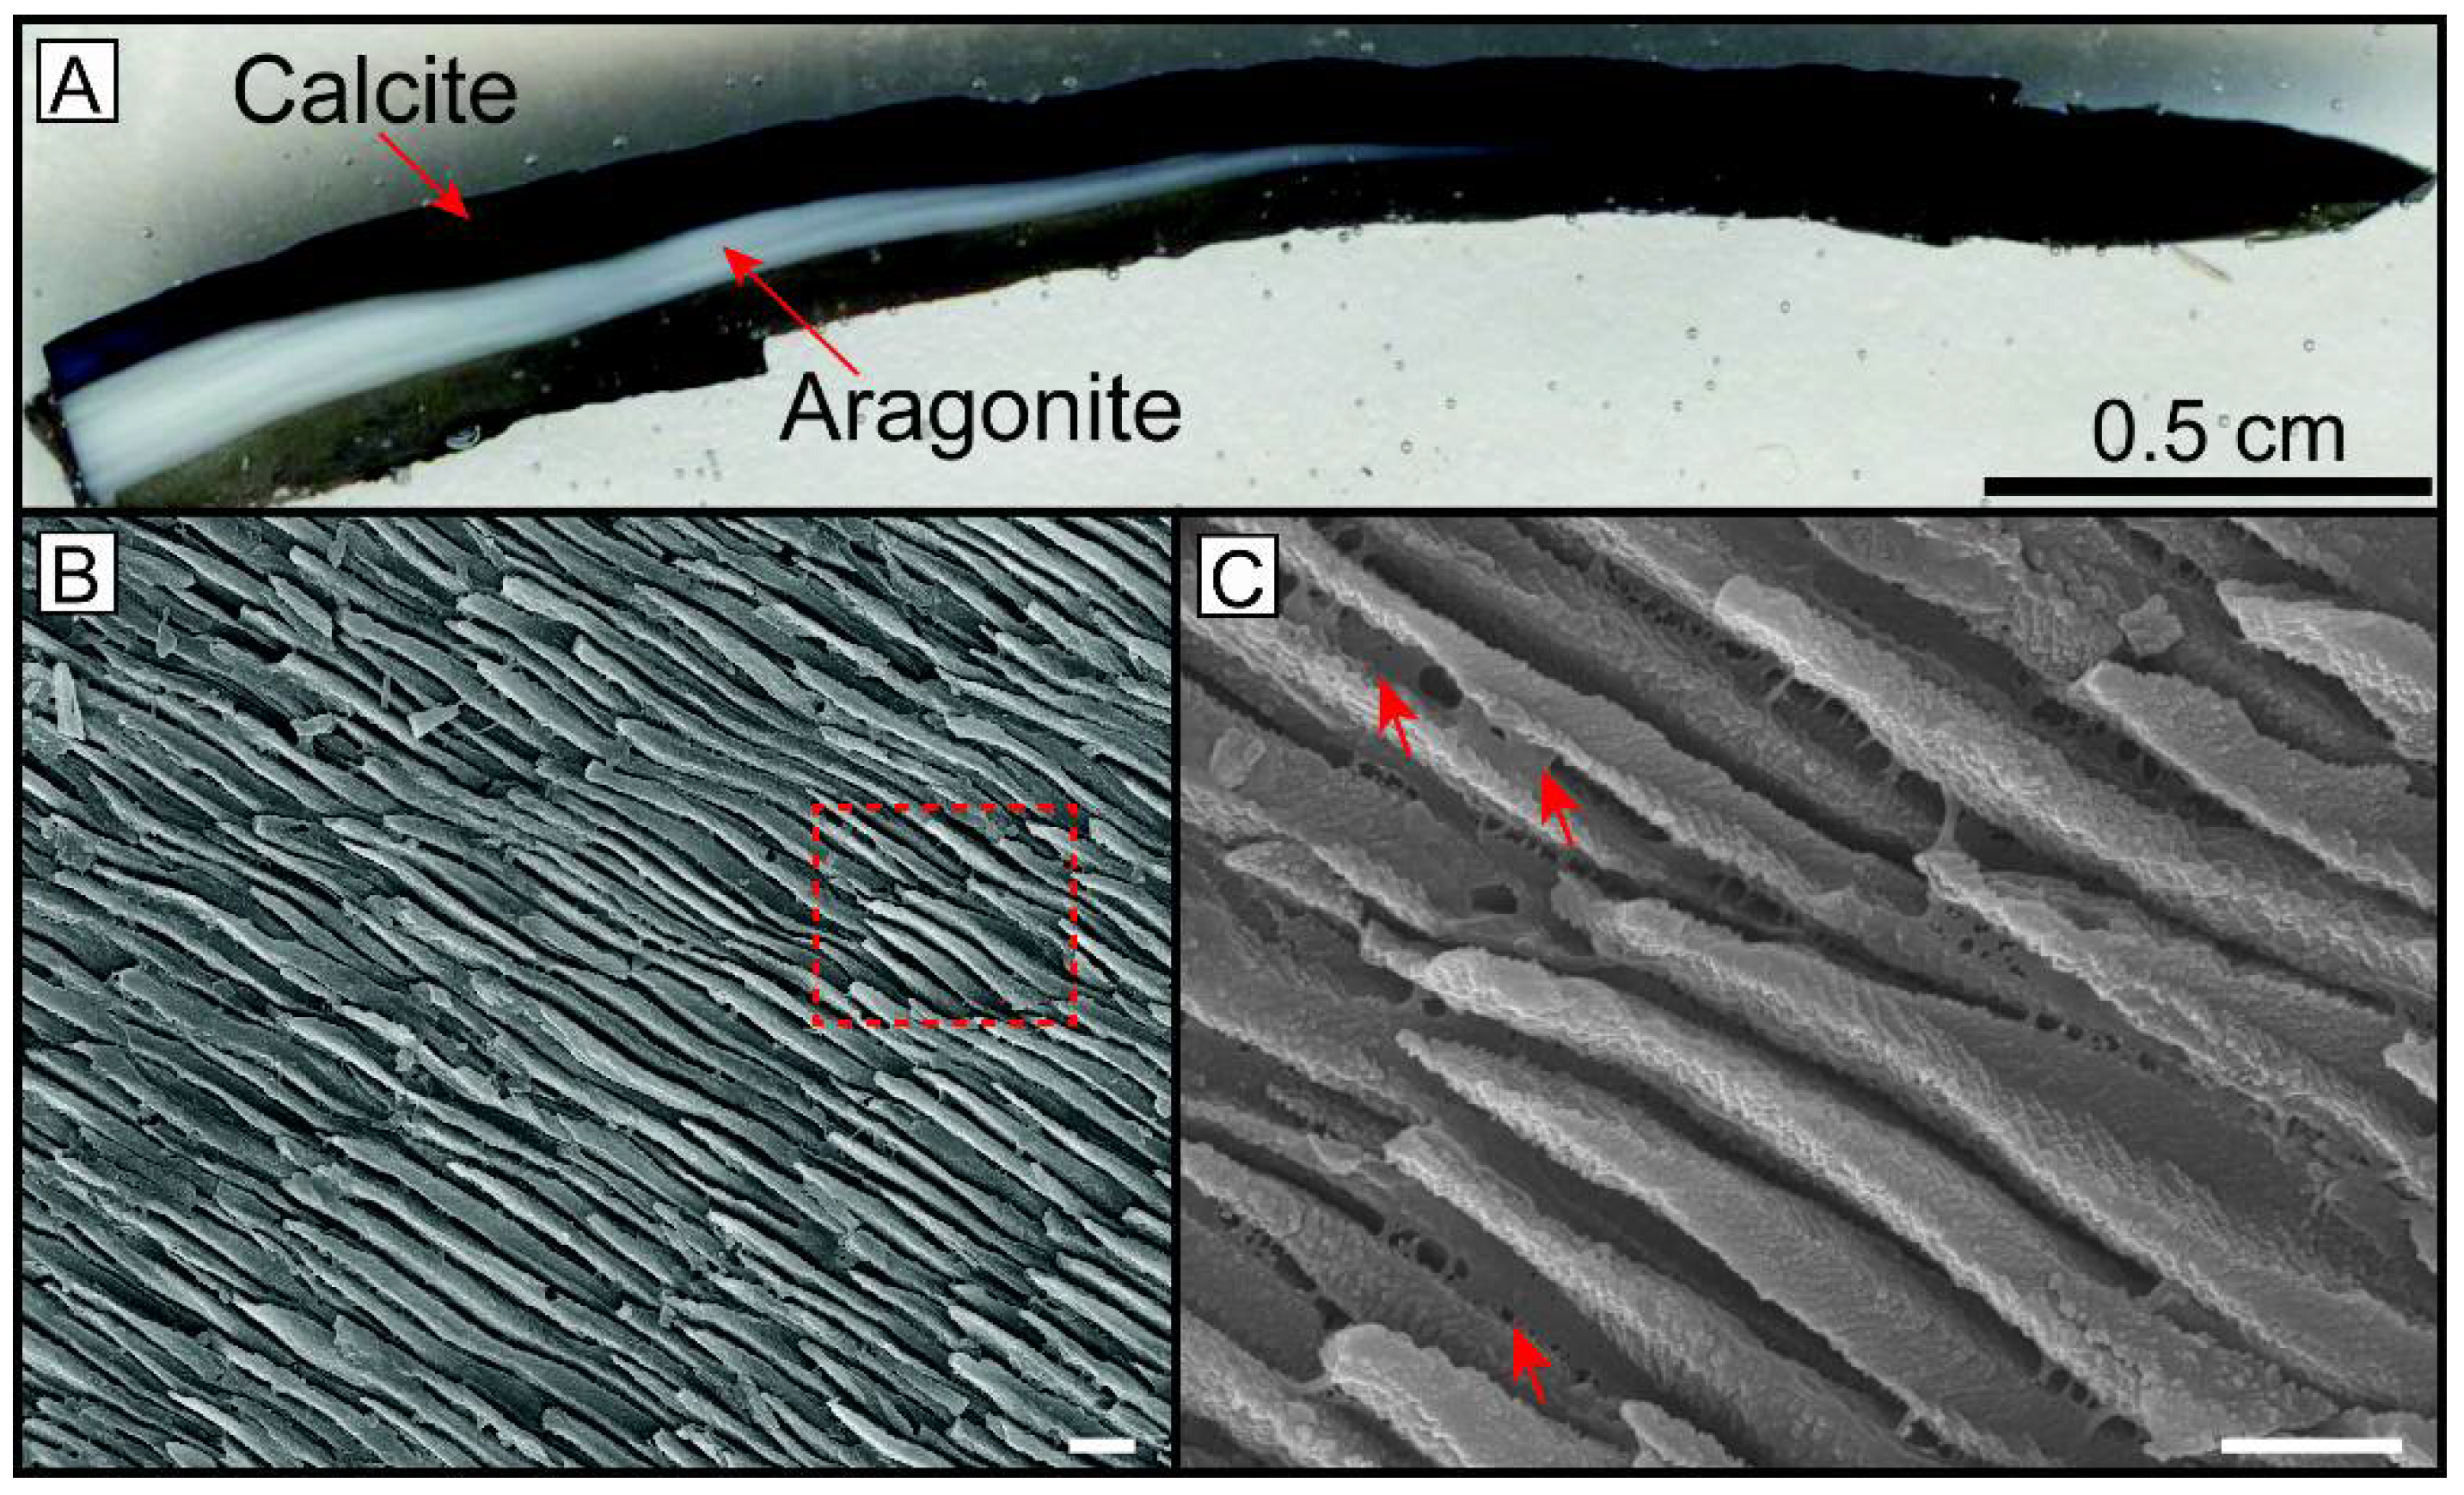
Figure 2.
Example of focused ion beam (FIB)-SEM specimen preparation of calcite. (A,B) Sample wedges on a section nearly perpendicular (A) and almost parallel (B) to the {0001} plane, containing the c-axis of calcite; wire frame cartoons indicate the orientation of the calcite c-axis relatively to the position of the wedge, and red lines represent the orientation an d thickness (to scale) of the IOM; (C,D) Examples of atom probe tomography (APT) tip specimens fabricated from the sections extracted from wedges on A and B, respectively.
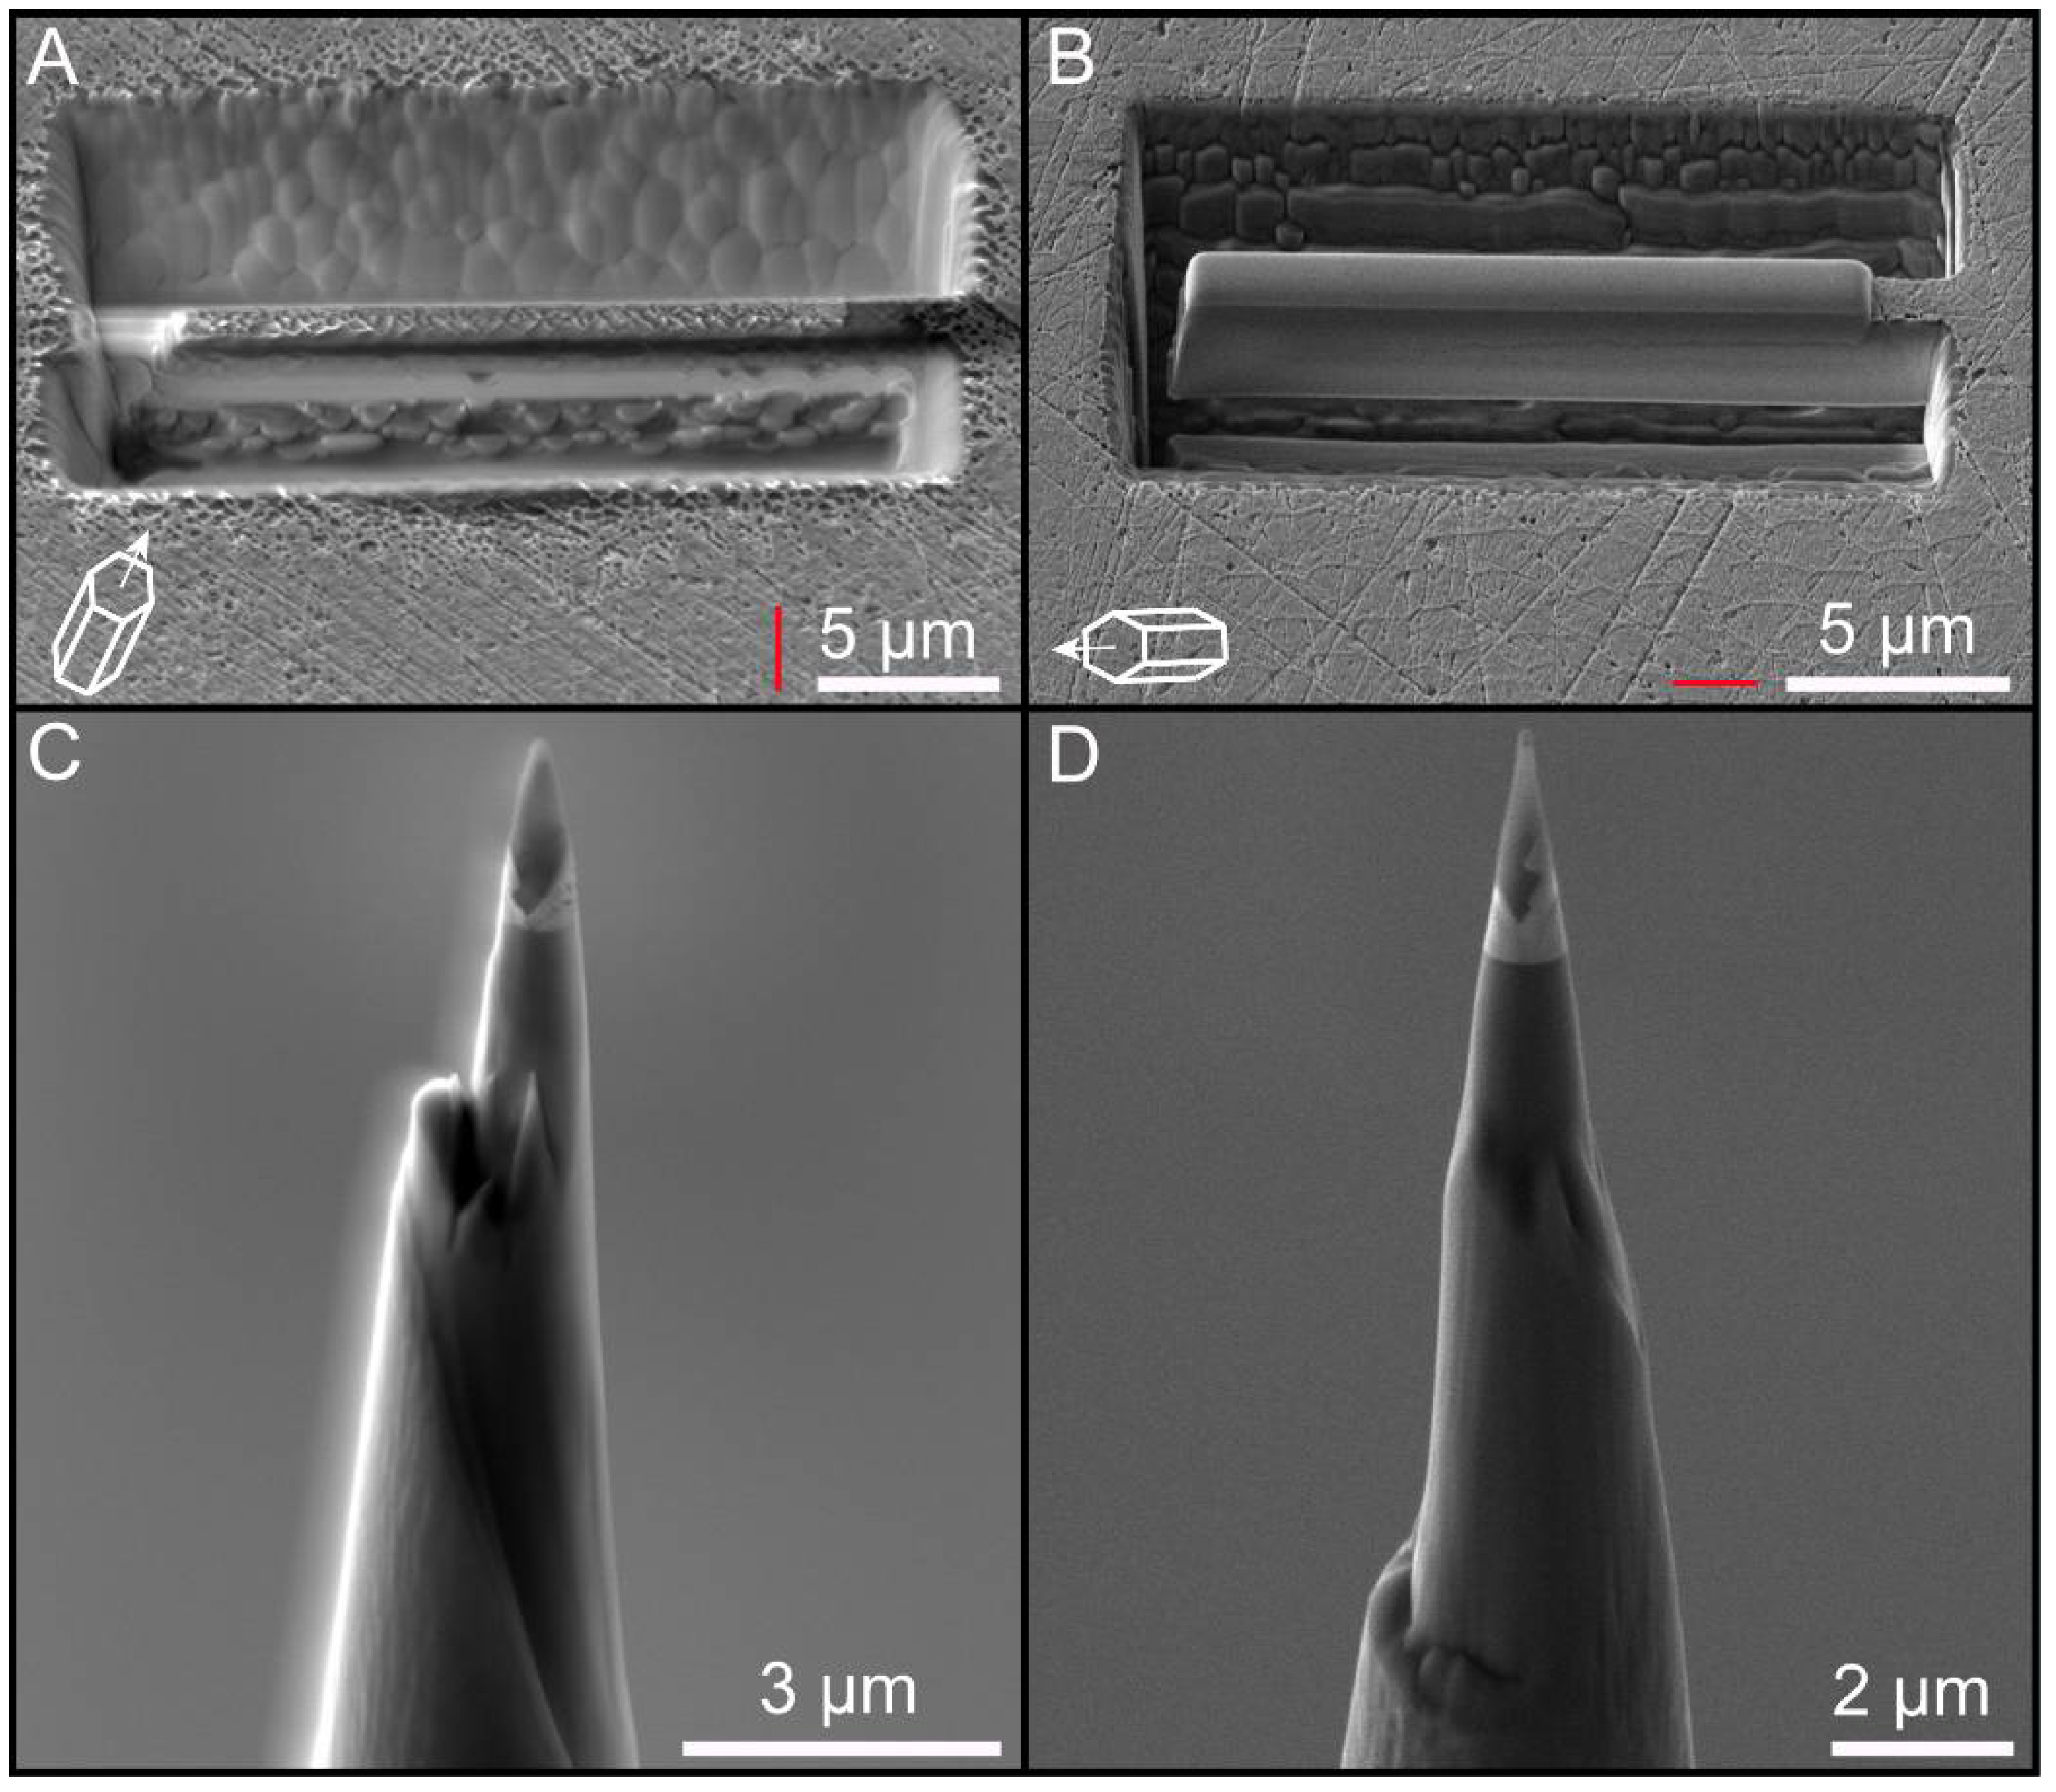
Figure 3.
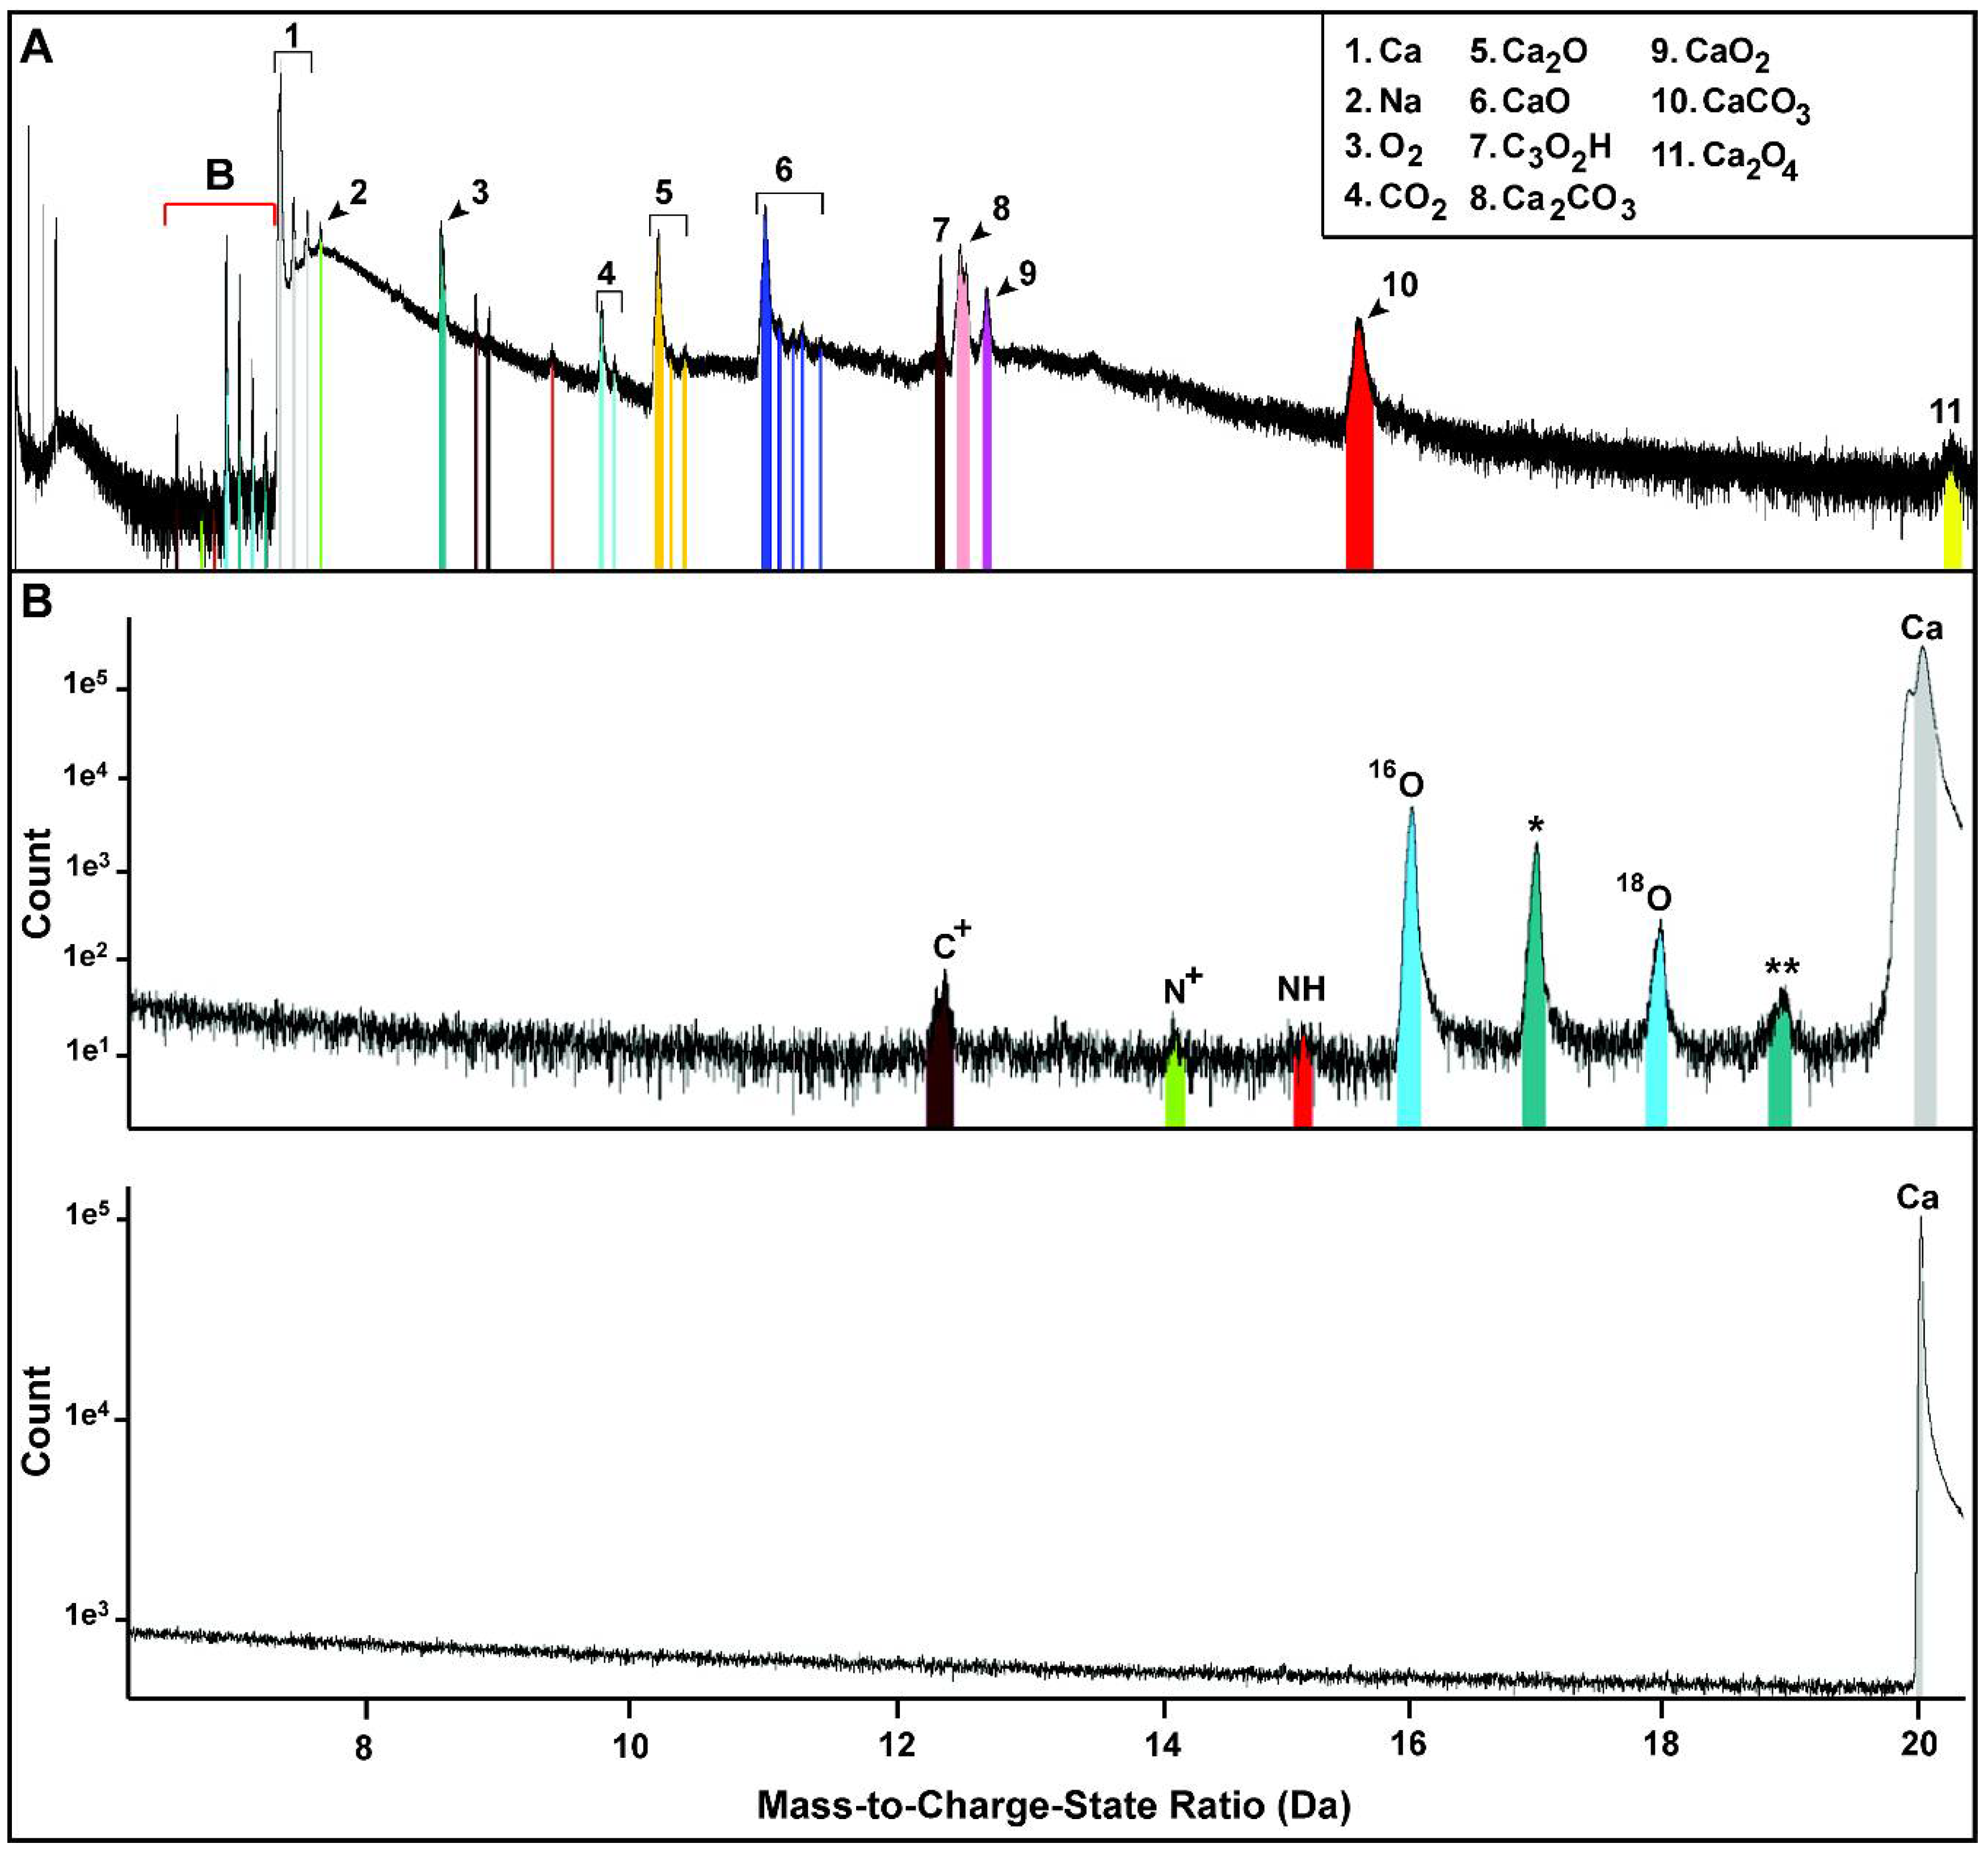
APT mass-to-charge ratio spectra chemical data. (A) Example of a mass spectrum (x-axis: mass-to-charge ratio and y-axis: ion count—please note that units are not relevant in this case and have been deleted for figure clarity) corresponding to tip 269 (see Table 1), with the identification of major peaks; (B) Comparison of the partial spectrum (between 11 Da and 21 Da) for tip 269 (region B in top figure) and abiogenic calcite (bottom figure; adapted from Pérez-Huerta et al., [17]). Note the presence of single ion peaks for 12C (12 Da), 16O (16 Da), 16O + H+ (*; 17 Da), 18O (18 Da), and 18O + H+ (**; 19 Da) specific to the biogenic calcite.
Figure 3.
APT mass-to-charge ratio spectra chemical data. (A) Example of a mass spectrum (x-axis: mass-to-charge ratio and y-axis: ion count—please note that units are not relevant in this case and have been deleted for figure clarity) corresponding to tip 269 (see Table 1), with the identification of major peaks; (B) Comparison of the partial spectrum (between 11 Da and 21 Da) for tip 269 (region B in top figure) and abiogenic calcite (bottom figure; adapted from Pérez-Huerta et al., [17]). Note the presence of single ion peaks for 12C (12 Da), 16O (16 Da), 16O + H+ (*; 17 Da), 18O (18 Da), and 18O + H+ (**; 19 Da) specific to the biogenic calcite.

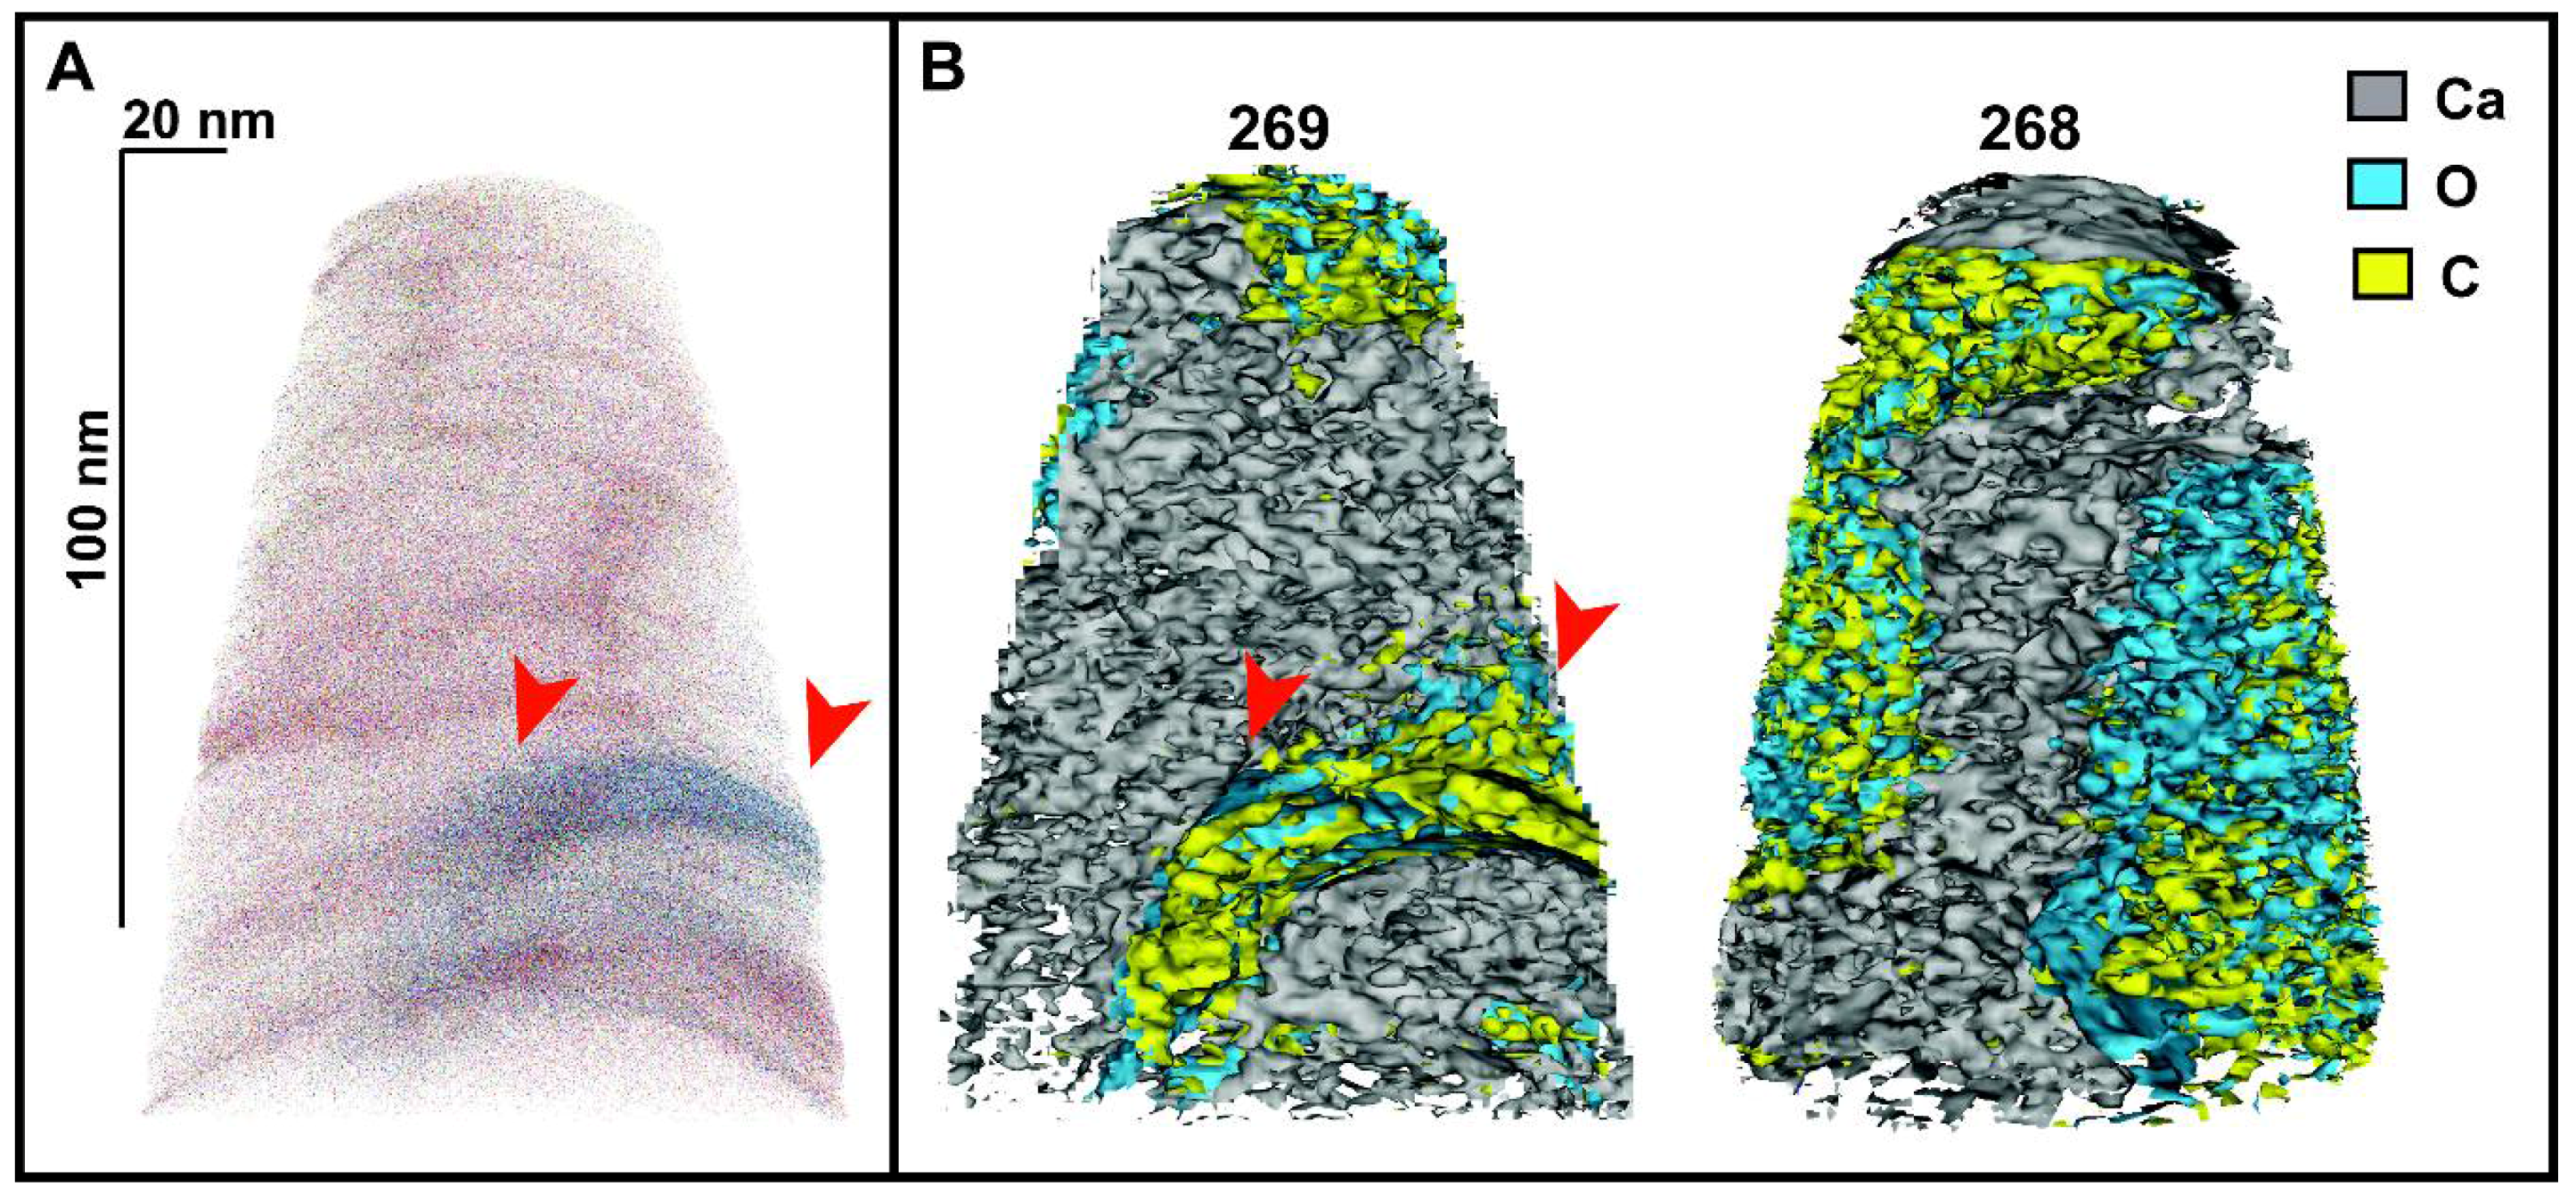
Figure 4.
Example of 3D atomic (A) and elemental isosurface (B) tip reconstructions for calcite (tips 269 and 268), showing regions of higher concentrations of elements (for calcite, we identify the mineral phase with Ca >41% and the IOM with O+ (>43%) and C+ (>15%)). Note that all five tips that provided the best data (Table 1 and Table 2) show similar characteristics to those illustrated here.

Figure 5.
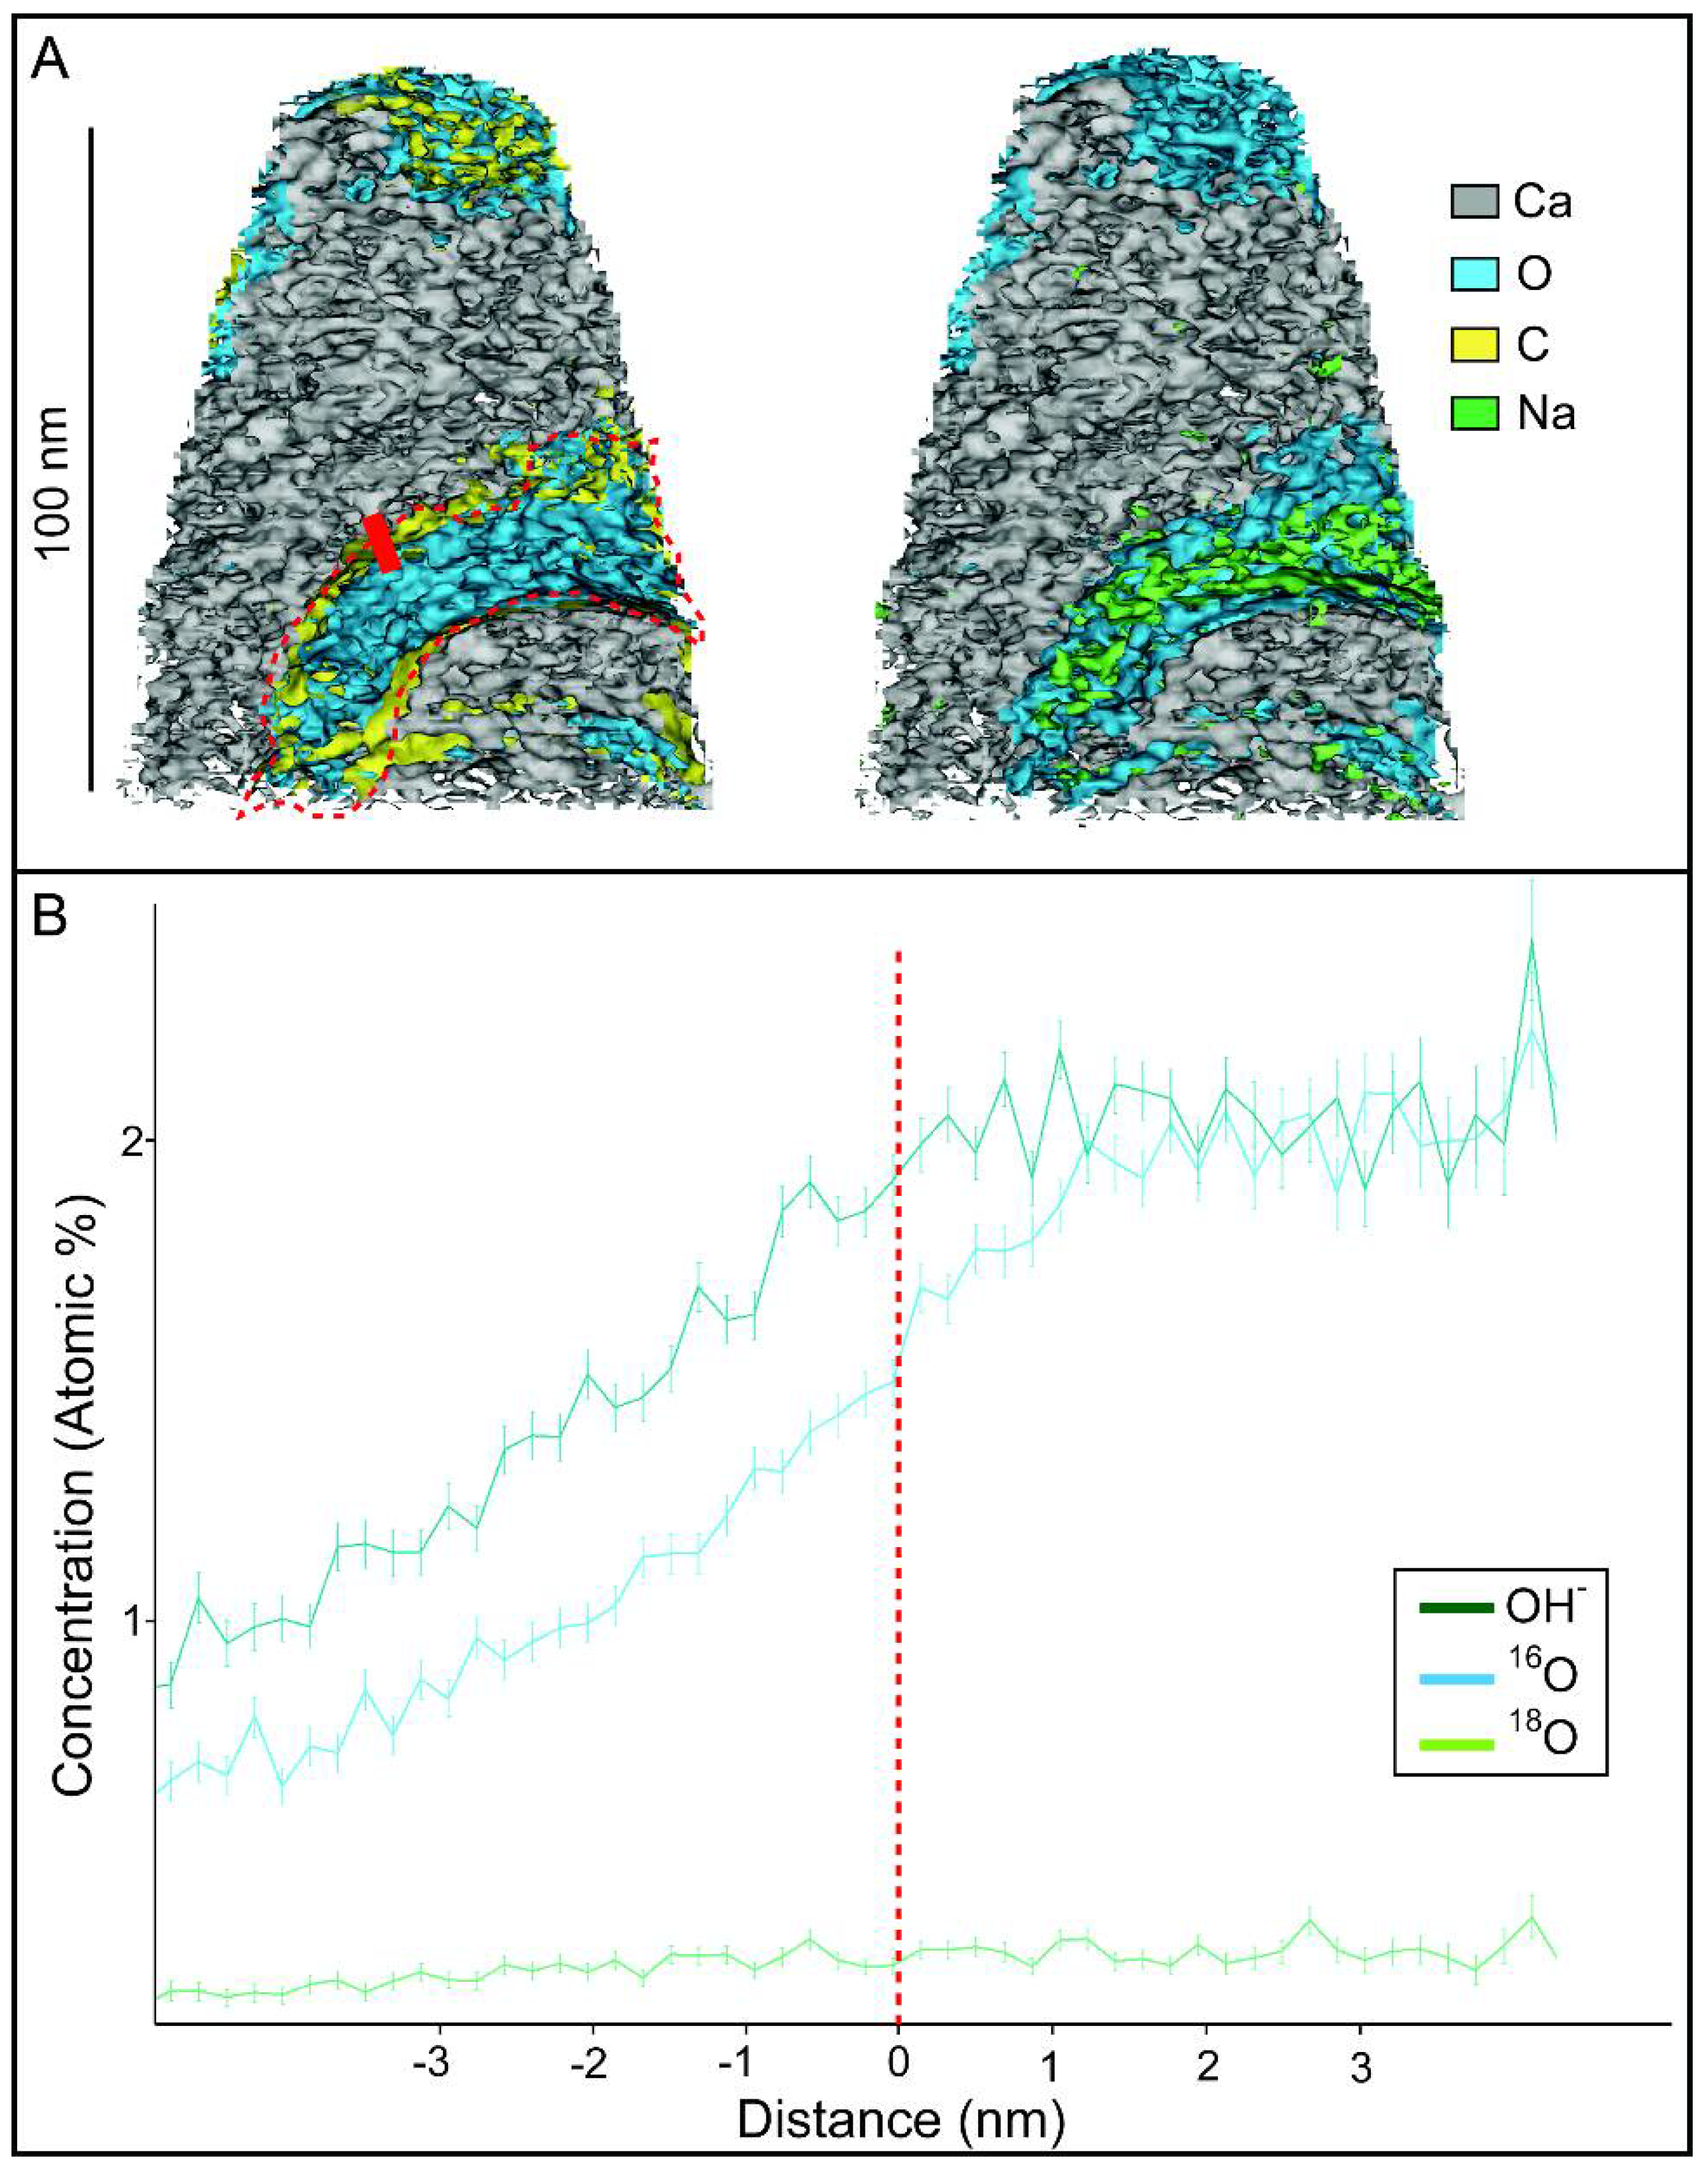
Chemical composition of the IOM from the calcitic layer. (A) 3D elemental isoconcentration reconstructions of a calcite tip (specimen 269), indicating the presence of regions enriched in oxygen (16O) and carbon (12C) (blue-yellow), and depleted in calcium, corresponding to the organic fraction. The central region (within the dashed red line) is also sodium-depleted (green; on right image; Na <0.3%); (B) Proxigram of the concentrations (in atomic %), across the mineral-organic interface (thick red line in (A)) for the region highlighted by the dashed red line in (A), with zero marking the interface (mineral on the left, organic on the right; IOM region inside dashed red line in (A) for reference). Note the increase in 16O and OH− concentrations inside the organic phase.
Figure 5.
Chemical composition of the IOM from the calcitic layer. (A) 3D elemental isoconcentration reconstructions of a calcite tip (specimen 269), indicating the presence of regions enriched in oxygen (16O) and carbon (12C) (blue-yellow), and depleted in calcium, corresponding to the organic fraction. The central region (within the dashed red line) is also sodium-depleted (green; on right image; Na <0.3%); (B) Proxigram of the concentrations (in atomic %), across the mineral-organic interface (thick red line in (A)) for the region highlighted by the dashed red line in (A), with zero marking the interface (mineral on the left, organic on the right; IOM region inside dashed red line in (A) for reference). Note the increase in 16O and OH− concentrations inside the organic phase.

Table 1.
Atom probe tomography data acquisition settings and run summary.
| Specimen/Data Set | M26_268 | M27_269 | M30_299 | M24_742 | M14_744 |
|---|---|---|---|---|---|
| Sample Description | Mussel Calcite Prism | Mussel Calcite Prism | Mussel Calcite Prism | Mussel Calcite Prism_90 | Mussel Calcite Prism_90 |
| Instrument Model | LEAP 5000 XS | LEAP 5000 XS | LEAP 5000 XS | LEAP 5000 XS | LEAP 5000 XS |
| Instrument Settings | |||||
| Laser Wavelength (nm) | 355 | 355 | 355 | 355 | 355 |
| Laser Pulse Rate (pJ) | 50 | 50 | 50 | 500 | 500 |
| Laser Pulse Energy (kHz) | 200 | 200 | 200 | 200 | 200 |
| Evaporation Control | Detection Rate | Detection Rate | Detection Rate | Detection Rate | Detection Rate |
| Target Detection Rate (%) | 0.2 | 0.3 | 0.2 | 0.5 | 0.5 |
| Nominal Flight Path (mm) | 100 | 100 | 100 | 100 | 100 |
| Temperature (K) | 40 | 40 | 40 | 50 | 50 |
| Pressure (torr) | 5.4 × 10⁻¹¹ | 6.2 × 10⁻¹¹ | 6.3 × 10⁻¹¹ | 5.0 × 10⁻¹¹ | 5.1 × 10⁻¹¹ |
| ToF offset, to (ns) | 279.94 | 279.94 | 279.94 | 279.94 | 279.94 |
| Data Analysis | |||||
| Software | IVAS 3.6.12 | IVAS 3.6.12 | IVAS 3.6.12 | IVAS 3.6.12 | IVAS 3.6.12 |
| Total Ions: | 17,353,786 | 19,344,916 | 14,354,477 | 5,949,513 | 2,638,187 |
| Single | 12,422,920 | 13,540,671 | 10,277,531 | 4,582,591 | 1,977,676 |
| Multiple | 4,795,460 | 5,640,146 | 3,954,829 | 1,253,233 | 587,989 |
| Partial | 135,406 | 164,099 | 122,117 | 113,689 | 72,522 |
| Reconstructed Ions: | 15,845,723 | 14,964,253 | 12,423,780 | 3,371,329 | 1,447,152 |
| Ranged | 2,613,374 | 3,505,144 | 2,154,459 | 1,223,980 | 355,479 |
| Unranged | 13,232,349 | 11,459,109 | 10,269,321 | 2,147,349 | 1,091,673 |
| Background (ppm/nsec) | 12 | 26 | 9 | 43 | 17 |
| Reconstruction | |||||
| Final tip state | Fractured | Fractured | Fractured | Fractured | Fractured |
| Pre-/Post-analysis Imaging | SEM/n.a. | SEM/n.a. | SEM/n.a. | SEM/n.a. | SEM/n.a. |
| Radius Evolution Model | “shank” | “shank” | “shank” | “shank” | “shank” |
| Vinitial; Vfinal | 2382 V; 5104 V | 2134 V; 6029 V | 1537 V; 4085 V | 2651 V; 5069 V | 3527 V; 3986 V |
Table 2.
Decomposed element tip composition (% atomic).
| Specimen | 268 | ||
| Element | Atom Count | Atomic % | 1s error |
| Ca | 1,009,230 | 39.59 | 0.0466 |
| O | 1,228,475 | 48.19 | 0.0529 |
| C | 301,983 | 11.85 | 0.0228 |
| Na | 5585 | 0.22 | 0.0029 |
| H | 3277 | 0.13 | 0.0022 |
| N | 711 | 0.03 | 0.0010 |
| Total | 2,549,261 | 100 | 0.13 |
| Specimen | 269 | ||
| Ion Type | Atom Count | Atomic % | 1s error |
| Ca | 1,837,349 | 39.76 | 0.0347 |
| O | 1,915,350 | 41.45 | 0.0356 |
| C | 675,984 | 14.63 | 0.0190 |
| Na | 22,001 | 0.48 | 0.0032 |
| H | 170,212 | 3.68 | 0.0091 |
| N | 575 | 0.01 | 0.0005 |
| Total | 4,621,471 | 100 | 0.10 |
| Specimen | 299 | ||
| Ion Type | Atom Count | Atomic % | 1s error |
| Ca | 1,210,035 | 49.63 | 0.0552 |
| O | 980,140 | 40.20 | 0.0481 |
| C | 224,252 | 9.20 | 0.0203 |
| Na | 8043 | 0.33 | 0.0037 |
| H | 15,268 | 0.63 | 0.0051 |
| N | 568 | 0.02 | 0.0010 |
| Total | 2,438,305 | 100 | 0.13 |
| Specimen | 742 | ||
| Ion Type | Atom Count | Atomic % | 1s error |
| Ca | 1,140,973 | 60.20 | 0.0713 |
| O | 639,550 | 33.75 | 0.0488 |
| C | 107,881 | 5.69 | 0.0178 |
| Na | 6806 | 0.36 | 0.0044 |
| Total | 1,895,210 | 100 | 0.14 |
| Specimen | 744 | ||
| Ion Type | Atom Count | Atomic % | 1s error |
| Ca | 321,589 | 60.66 | 0.1356 |
| O | 177,418 | 33.47 | 0.0918 |
| C | 30,081 | 5.67 | 0.0336 |
| Na | 1059 | 0.20 | 0.0061 |
| Total | 530,147 | 100 | 0.27 |
© 2018 by the authors. Licensee MDPI, Basel, Switzerland. This article is an open access article distributed under the terms and conditions of the Creative Commons Attribution (CC BY) license (http://creativecommons.org/licenses/by/4.0/).
Share and Cite
MDPI and ACS Style
Pérez-Huerta, A.; Laiginhas, F. Preliminary Data on the Nanoscale Chemical Characterization of the Inter-Crystalline Organic Matrix of a Calcium Carbonate Biomineral. Minerals 2018, 8, 223. https://doi.org/10.3390/min8060223
AMA Style
Pérez-Huerta A, Laiginhas F. Preliminary Data on the Nanoscale Chemical Characterization of the Inter-Crystalline Organic Matrix of a Calcium Carbonate Biomineral. Minerals. 2018; 8(6):223. https://doi.org/10.3390/min8060223
Chicago/Turabian StylePérez-Huerta, Alberto, and Fernando Laiginhas. 2018. "Preliminary Data on the Nanoscale Chemical Characterization of the Inter-Crystalline Organic Matrix of a Calcium Carbonate Biomineral" Minerals 8, no. 6: 223. https://doi.org/10.3390/min8060223
Note that from the first issue of 2016, this journal uses article numbers instead of page numbers. See further details here.