Article

Carbonation-Induced Mineralogical Changes in Coal Mining Waste Blended Cement Pastes and Their Influence on Mechanical and Microporosity Properties

by
Moisés Frías
1,*,
Raquel Vigil De la Villa
2,
Rosario García
3,
Olga Rodríguez
1,
Lucía Fernández-Carrasco
3 and
Sagrario Martínez-Ramírez
4
1
Eduardo Torroja Institute for Construction Sciences (IETcc-CSIC), 28033 Madrid, Spain
2
Department of Geology and Geochemistry, Universidad Autónoma de Madrid, CSIC-UAM Associated Unit (Unidad Asociada CSIC-UAM), 28049 Madrid, Spain
3
Architectural Technology Department, Universitat Politècnica de Catalunya—Barcelona TECH, 08028 Barcelona, Spain
4
Institute for the Structure of Matter (IEM-CSIC), 28006 Madrid, Spain
*
Author to whom correspondence should be addressed.
Minerals 2018, 8(4), 169; https://doi.org/10.3390/min8040169
Submission received: 12 February 2018 / Revised: 16 April 2018 / Accepted: 17 April 2018 / Published: 20 April 2018

Abstract

:
The worldwide pursuit of new eco-efficient pozzolans is ongoing. Kaolinite-based waste is an eco-friendly source of recycled metakaolinite, a highly pozzolanic product. In this study, a blended cement paste containing 20% activated coal waste (ACW) was exposed to a 100% CO2 atmosphere at 65% RH for 7 days. The variations in its phase composition and strength were studied and compared to an OPC control. Both pastes were cured for 28 days prior to the carbonation test. Reaction kinetics were assessed using XRD, SEM/EDX, TG/DTG, FT-IR, Micro-Raman spectroscopy, pore solution pH and the cumulative carbonated fraction. The blended cement carbonated 68% faster than the control. While portlandite carbonation was the main reaction in both cements, decalcification was also observed (more intensely in the 20% ACW paste) in other hydraulic calcium phases (C-S-H gel, monocarboaluminate (C4AcH12), ettringite and tetracalcium aluminate (C4AH13). The end product of this reaction was calcium carbonate, mainly in the form of calcite, although traces of aragonite and amorphous carbonate were also detected. Compressive strength values rose with accelerated carbonation time and pore size reduction in both cement pastes.

1. Introduction

Ordinary Portland cements (OPCs) are known to be scantly resistant to aggressive agents such as chlorides, sea water, sulfates and CO2, which, when reacting with the hydrated phases in cement, induce expansion, cracking, strength loss, a decline in stiffness, and disintegration [1,2,3]. Active additions are known to raise the durability of Portland cements. These additions, characterised by their ability to convert portlandite into hydraulic phases similar to the ones obtained during Portland cement hydration, improve the microstructure and performance of blended cements [4,5,6,7,8,9,10,11,12,13].
According to Younsi et al. [14], the mechanism governing cement matrix carbonation is affected by a number of properties of the material as well as by the surrounding environment. In particular, carbonation is governed by CO2 diffusivity in concrete and the chemical reactions between CO2 and carbonatable phases. Carbon dioxide dissolves in water to form H2CO3, which reacts with the Ca2+ sourced primarily from portlandite dissolution and C-S-H gel decalcification [15,16]. To date most studies on cementitious material carbonation have focused on the effect of permeability, the hydration chemistry of carbonated structural concrete and changes in porosity [17], or on the use of cellulose fibres as reinforcement in composite manufacture to enhance durability [18].
General studies on the effect of CO2 on cements have shown that OPCs exhibit higher carbonation resistance than pozzolan-bearing blended cements [19]. Castellote et al. [20] observed that the main effect of carbonation on concrete is the reduction of the pH in its pore solution, which in turn induces reinforcing steel depassivation and corrosion. They found that the carbonation rate in cement depends on the w/c ratio, composition, pore structure, curing conditions, internal moisture, hydrated phase solubility and kinetic or thermodynamic factors [21]. Goñi et al. [22] reported that the alkaline content in two OPCs (with equivalent Na2O values of 1.03 and 0.43%) had a scant effect on carbonation kinetics in accelerated carbonation testing. Xu et al. [23] observed similar concrete behaviour in a 100% CO2 atmosphere.
The transformation of a kaolinite based industrial waste into a metakaolinite base pozzolan, is one of the main lines of research worldwide, due to its environmental and social interest. This study forms part of a broader research project on the development of blended cements made with activated material from coal mining waste with a view to obtaining innovative eco-efficient cements. Earlier studies [24,25,26,27,28,29,30] showed that it is scientifically and technically feasible to convert this inert pollutant waste into a supplementary cementitious material. Their findings have charted a promising alternative route for obtaining recycled metakaolinite, a pozzolan listed in the existing legislation on cement [31].
The dearth of research on the durability of cements bearing activated coal mining waste prompted this study on the behaviour of blended cement pastes (0 and 20% ACW replacement) during accelerated carbonation in a 100% CO2 and 65% RH atmosphere. The variations in the mineralogical phases during carbonation and reaction kinetics, determined by CaCO3 content and pore solution pH, are reported.

2. Materials and Methods

2.1. Materials

The coal mining waste used was supplied by Hullera Vasco-Leonesa, Sociedad Anónima, miners operating out of Santa Lucía in the Spanish province of León. This waste was activated in a laboratory furnace for 2 h at 600 °C, the optimal temperature from the standpoint of both pozzolanicity and economic and energy efficiency [27,28]. The material obtained was substantially more reactive with portlandite than other types of inorganic waste [32]. The activated waste (ACW) was ground with an agate mortar and pestle to a size of under 70 μm, i.e., similar to the size of the particles in the OPC Spanish commercial cement used (classified as CEM I 52.5 N) [31]. The Bogue [33] mineral composition of the OPC cement was: C3S = 41.04%; C2S = 30.00%; C3A = 11.54%; and C4AF = 9.70%.
The chemical compositions of the two starting materials are given in Table 1.

2.2. Paste Preparation

The blended cement was prepared by blending 20% ACW with the OPC for 20 min in a mechanical mixer at 100 rpm. The OPC and the 20% ACW-containing cement were mixed with demineralised water at a w/c ratio of 0.5, after which the resulting pastes were poured into 1 × 1 × 6 cm3 prismatic moulds, vibration-compacted and stored in a curing chamber at 100% RH for 1 day, further to the methodology described by Koch-Steinegeer [34]. The samples were subsequently removed from the moulds and cured by soaking in demineralised water for 28 days at 19 °C. This curing procedure was followed by 15 days storage at 65% RH. Accelerated carbonation was conducted in a semi-dynamic, 100% CO2 atmosphere (injecting the gas into the chamber at 12 h intervals to ensure saturation) at 20 ± 1 °C for 7 days. After each exposure period, cement samples were vacuum-dried for 2 days (at 320 mbar) prior to conducting the porosimetry test. For the other analyses, the samples were immersed in acetone for 1 day and then vacuum-dried for another 24 h.

2.3. Methods and Test Techniques

Chemical composition was determined on a Philips PW 1404 X-ray fluorescence spectrometer fitted with a Sc-Mo X-ray tube (Philips, Amsterdam, The Netherlands).
The carbonation front was visualized with phenolphthalein as described in Spanish standards [35]. Carbonation depth was measured in terms of declining alkalinity, using a 1% phenolphthalein solution dissolved in 70% ethyl alcohol as a pH indicator. This indicator is colourless for values of under 8.0, pinkish-purple for values from 8.0 to 9.8 and reddish-purple for values of over 9.8. As the pore solution could not be collected directly due to the low relative humidity prevailing during carbonation and the small amount of sample available, it was simulated by dissolving 0.5 g of the ground bulk sample in 3 mL of de-ionised water. The solid was subsequently filtered and the liquid was analysed for pH in the 0, 1, 3, 4 and 7 days carbonated OPC and 20% ACW specimens.
The mineralogical composition of the bulk samples was determined by random powder X-ray diffraction (XRD) on a Siemens D-5000 X-ray diffractometer fitted with a Cu anode (Siemens, Munich, Germany). The operating conditions were 30 mA and 40 kV with a 2 mm divergence and a 0.6 mm receiving slit. Qualitative interpretation of the powder diffraction spectra was found with X’Pert High Score Plus 4.1 software running with database PDF-2 (release 2008, International Centre for Diffraction Data, Newtown Square, PA, USA). Rietveld-refined semi-quantification of the phases was performed with Match 3.5.2 software, using rutile as the internal standard to quantify the amorphous phase. The χ2 (weighted profile R factor) values fluctuated from 5 to 20 [36,37].
Cement paste microstructure was analysed under an Inspect FEI Company scanning electron microscope (FEI Company, Hillsboro, OR, USA), equipped with an energy dispersive X-ray analyser (W source, DX4i analyser and Si/Li detector).
The sections were scanned sequentially from the rim to the centre using a 552 µm high, 470 µm wide window. Around 40 fields at a radiation exposure time were needed for the transverse scan of half of the section, equivalent to analysing a section around 18.8 mm wide. All the samples were gold-sputtered to enhance image resolution and high vacuum-scanned on a back scattering electron detector (BSED) at a resolution of 4.0 nm at 30 kV and on an Everhart-Thornley (ETD) secondary electron detector at resolutions of 3.0 nm at 30 kV and 10 nm at 3 kV. The accelerating voltage was 26 kV to 30 kV and the working height and distance, 10 nm. The samples were analysed on an Oxford Instruments INA Energy 200 energy dispersive X-ray spectrometer (EDS) operating at 20 kV. The analyser was pre-calibrated using internal standards to improve the ZAF correction procedure.
Thermogravimetric readings (TG/DTG) were taken on a Stanton STA 781 analyser using 12 mg to 16 mg powder samples, heated at a rate of 10 °C/min in an N2 atmosphere.
A Nicolet 6700 FT-IR spectroscope was used for the Fourier transform infrared analyses, conducted in a spectral region of 400 cm−1 to 4000 cm−1. Specimens were prepared by pressing 1.3 mg of sample into 300 mg of KBr.
Dispersive micro-Raman spectra were recorded on a Renishaw Invia system fitted with a Leica confocal Raman microscope and electrically cooled CCD camera. The excitation source was a Renishaw Nd: YAG 532-nm laser. The samples were analysed with a 5 mW laser beam. The spectral resolution was set at 4 cm−1. Spectra were recorded in triplicate using a 50× objective lens over a wavenumber range of 4000 cm−1 to 100 cm−1. The exposure time was 10 s and each spectrum was accumulated 10 times at ten separate points.
A set of five 1 × 1 × 6 cm3 prismatic specimens for each type of cement paste (0 or 20% ACW) and curing age was tested to failure to determine compressive strength on an Ibertex Autotest 200/105 W frame fitted with an adapter for this type of specimens.
Mercury intrusion porosimetry was used to ascertain the effect of ACW on the mean pore size of blended cements. The analyses were performed 1 × 1 × 1 cm3 samples using a Micromeritics 9500 pore sizer.

3. Results and Discussion

3.1. Carbonation Depth

Figure 1 shows that the carbonation front was more sharply defined and deeper in the 20% ACW than in the OPC paste. Replacing 20% of the cement with ACW increased the carbonation rate after the first 24 h of exposure. The blended cement carbonated for 7 days was completely colourless, while the OPC paste had pink edges and a reddish-purple core with uneven borders.
The depth of the carbonation front plotted against the square root of time in Figure 2 shows the differences in behaviour between the two cements. The variation in the OPC paste was linear during the 7 days of the trial, with carbonation depth rising slightly (with R2 values of nearly 0.99 in both cases, denoting a high correlation between the two variables). The carbonation front for the 20% ACW paste, in contrast, fit a second-degree polynomial curve, clearly indicating that after the first day, penetration depth grew rapidly with exposure time due to the presence of the thermally activated waste. That finding was attributable to the reduction in the amount of carbonatable material, primarily from portlandite and C-S-H gels, with the addition of the replacement.
The differences in the carbonation rates for the two materials can be deduced from the slope of the regression lines. These values, at 0.91 and 0.29 for the 20% ACW and OPC pastes, respectively, denoted a 78% higher rate in the former than in the latter. The inference is that the addition of pozzolans (alone or blended) had an adverse effect on the carbonation rate. This pattern is wholly consistent with other authors’ reports on the effect of carbonation on ternary blended cements (fly ash, fly ash-metakaolin, fly ash + activated paper sludge) [38,39,40].
The scientific explanation generally put forward for the lower resistance to carbonation in pozzolan-bearing blended cements is two-pronged. Firstly, the higher alkaline content in these additions would lower portlandite solubility [22]. However, the slight difference between the Na2O equivalent (Na2O + 0.658 K2O) recorded for the 20% blended cement, namely 2.02, and the 1.96 observed for the OPC paste (Table 1) would not appear to justify such a significant divide in their respective carbonation rates.
Secondly, researchers such as Van Balen and Van Gemert [41] reported a relationship with the volume of carbonatable material (calcium hydrate phases).

3.2. Simulated Pore Solution pH

The difference in the pH variation patterns in the two cements is shown in Figure 3. The values declined across the 7 days of CO2 exposure, more steeply in the 20% ACW paste, where it dropped from 12.6 to 11.2, whereas in the OPC paste it dipped by only 0.3 points, primarily after the first 24 h. Due to the brief duration of the carbonation test (7 days), the pattern observed differed from the findings for ternary Portland cement (with 21% activated paper sludge + fly ash) reported by Frías and Goñi [40], where the pH fell to values of under 10. Two plateaus were identified in this decline, the first, at 12.5, attributed to the dissolution of portlandite, with the precipitation of calcite, and C-S-H gel with a high Ca/Si ratio; the second, at 11 to 11.2, possibly related to the pH equilibrium between AFt (ettringite) and AFm (monosulfoaluminate). These same authors reported that carbonation-induced neutralisation of alkalinity was the root cause of C-S-H gel decalcification, a finding likewise consistent with the decline in pore solution pH observed here (from 12.5 to 11.2).
The present findings showed that the pH decreased more sharply in the 20% ACW than in the ordinary Portland cement, despite their similar NaO2 equivalents (1.97 and 2.02, respectively), apparently suggesting that the C-S-H gel generated (by the pozzolanic reaction) in the blended cement had a lower Ca/Si ratio than the gel in the OPC paste [42]. The higher carbonation rate in blended cements in general and in the 20% ACW paste studied in particular, would be attributable to such circumstances (Figure 1).

3.3. Variation in Mineralogical Phases

3.3.1. XRD and SEM Findings

The mineralogical composition of the crystalline phases of the starting CW and ACW materials is shown in Table 2.
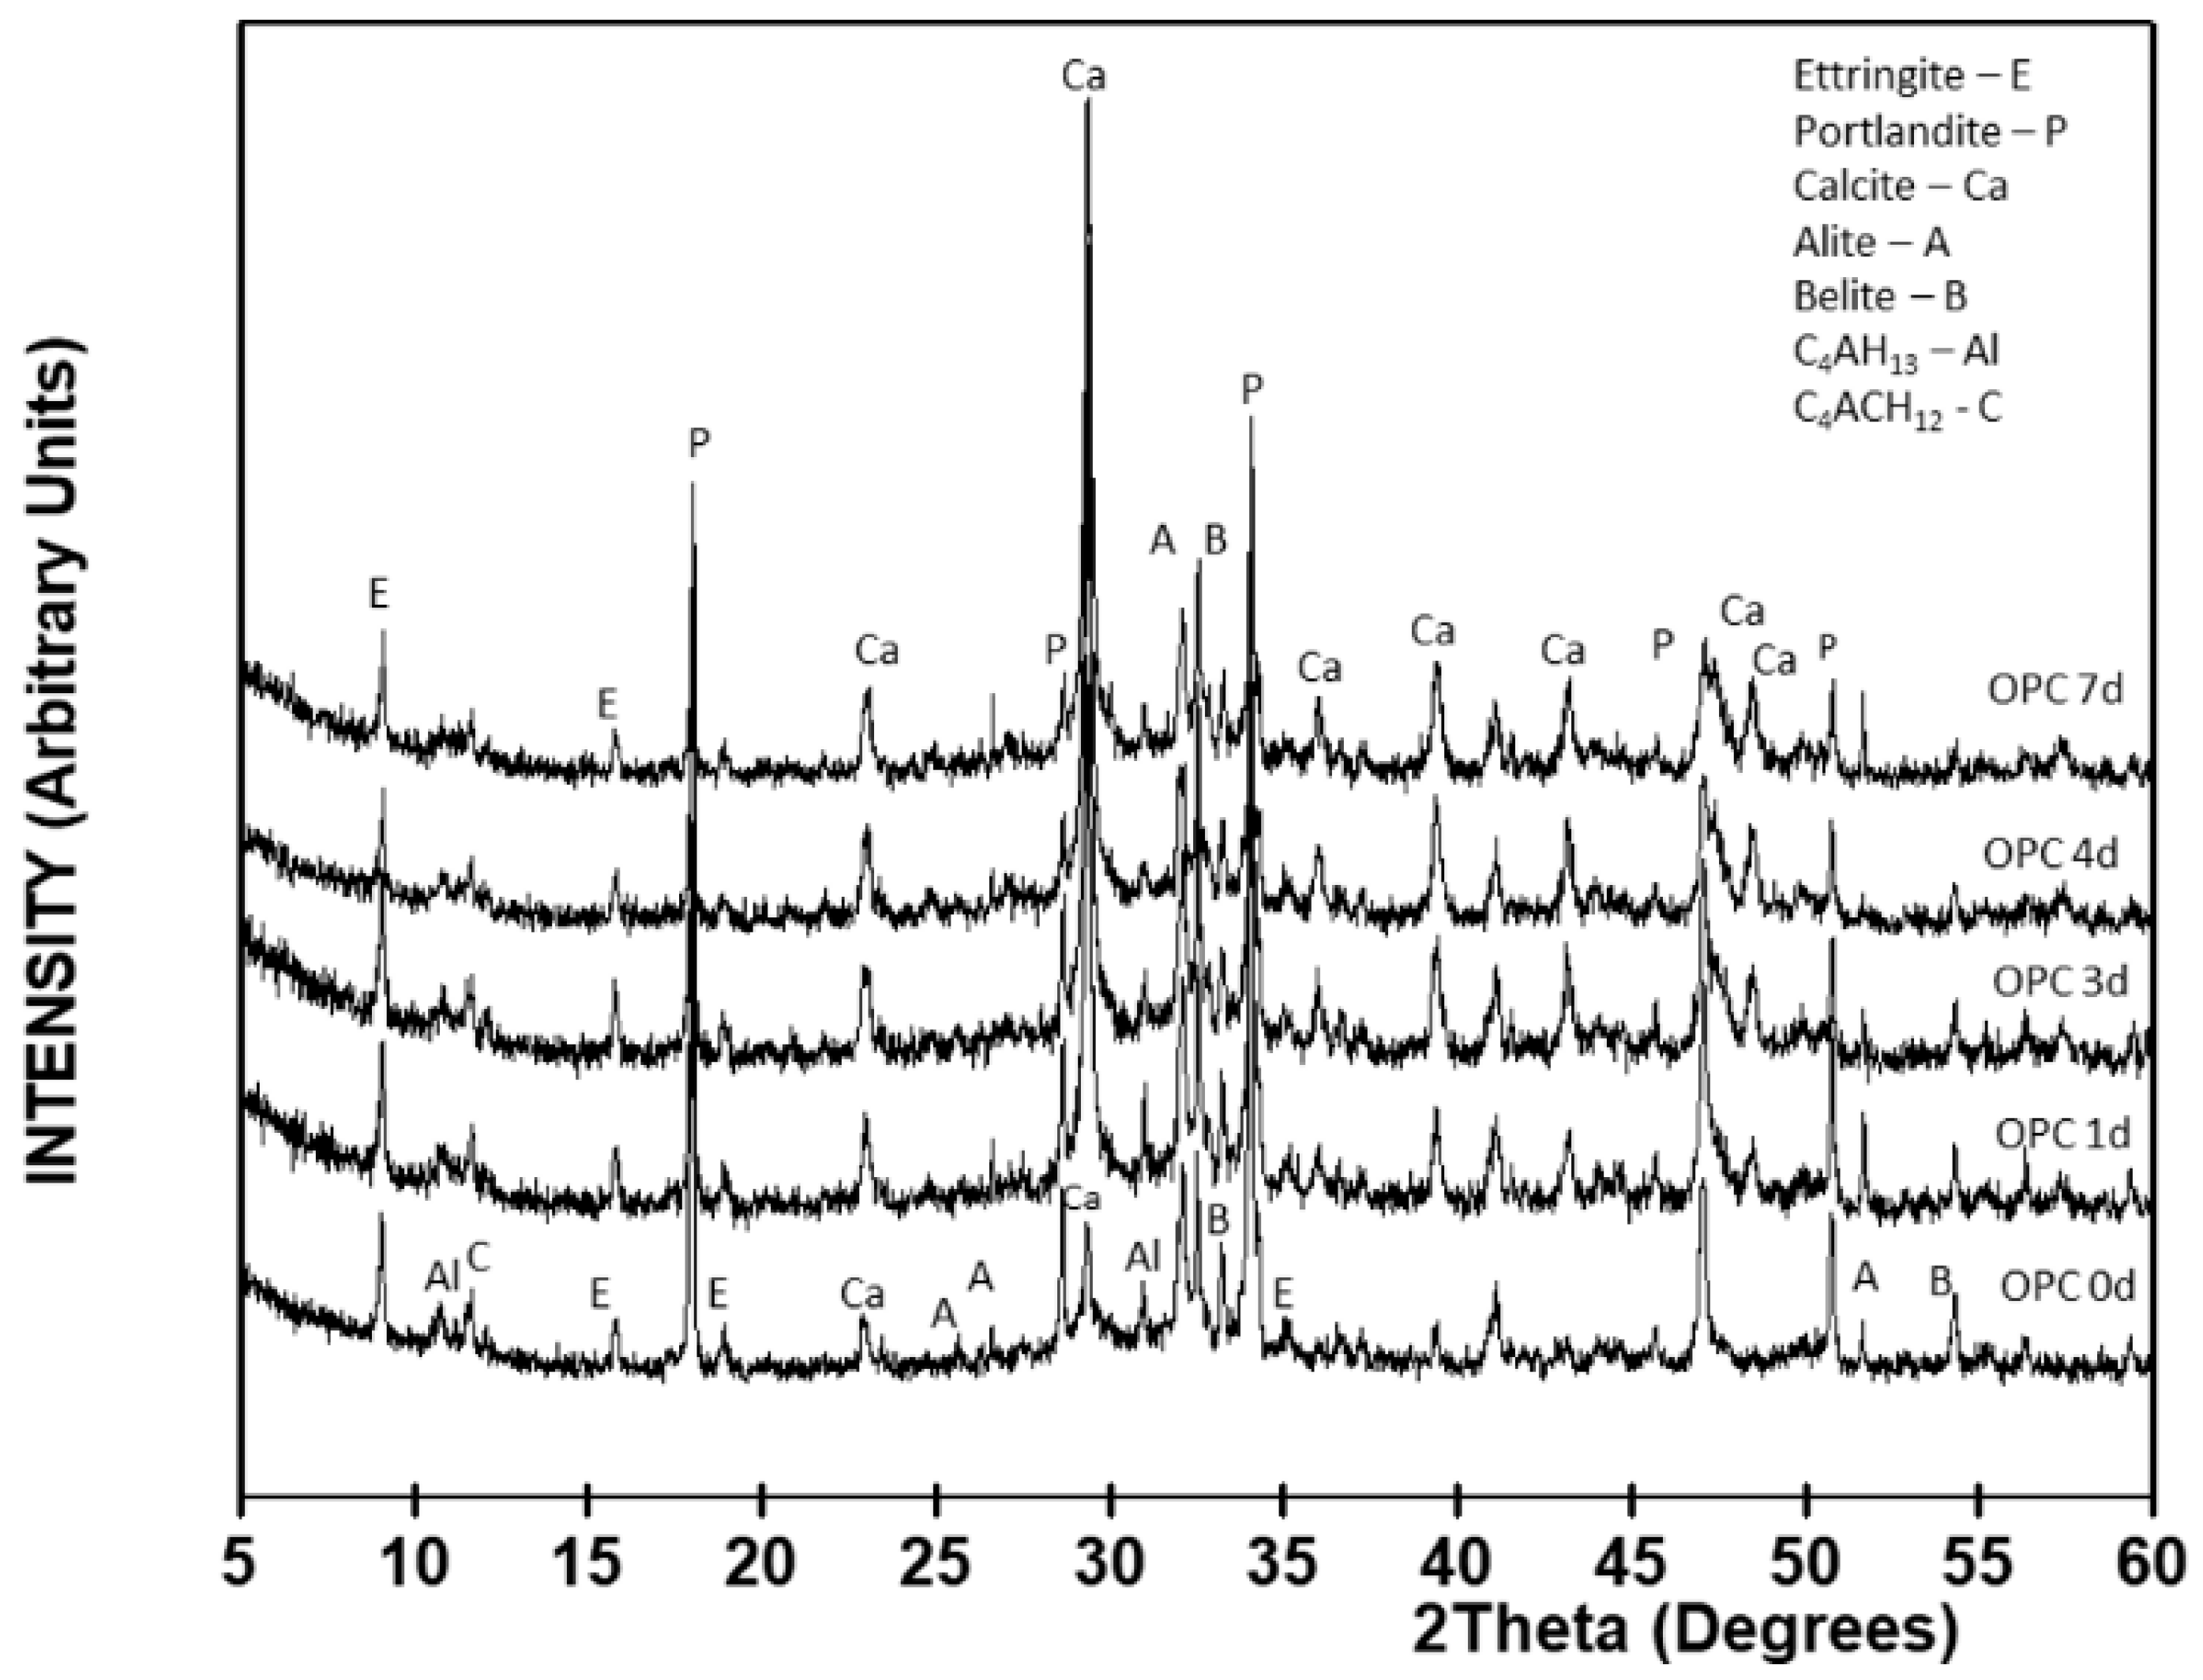
The crystalline mineralogical phases observed in the 28 days cured (t = 0) OPC paste shown in Figure 4 included alite (C3S, A), belite (C2S, B), calcite (Ca), portlandite (P), ettringite (E), tetracalcium aluminate hydrate (C4AH13, Al), and monocarboaluminate hydrate (C4AcH12, C).
The semi-quantitative XRD findings (Table 3) for the crystalline phases in the OPC paste denoted a clear change in the mineralogical phases from the third day of carbonation. In the first 24 h of accelerated carbonation, the content of all the phases except calcite declined and remained flat until the end of day 3. At that time calcite, the main mineralogical phase, accounted for 56% of the total, portlandite for 14% and C2S for 11%. From the fourth to the seventh day, none of the crystalline phases was affected by CO2, an indication that the carbonation front had stabilized in the cement matrix.
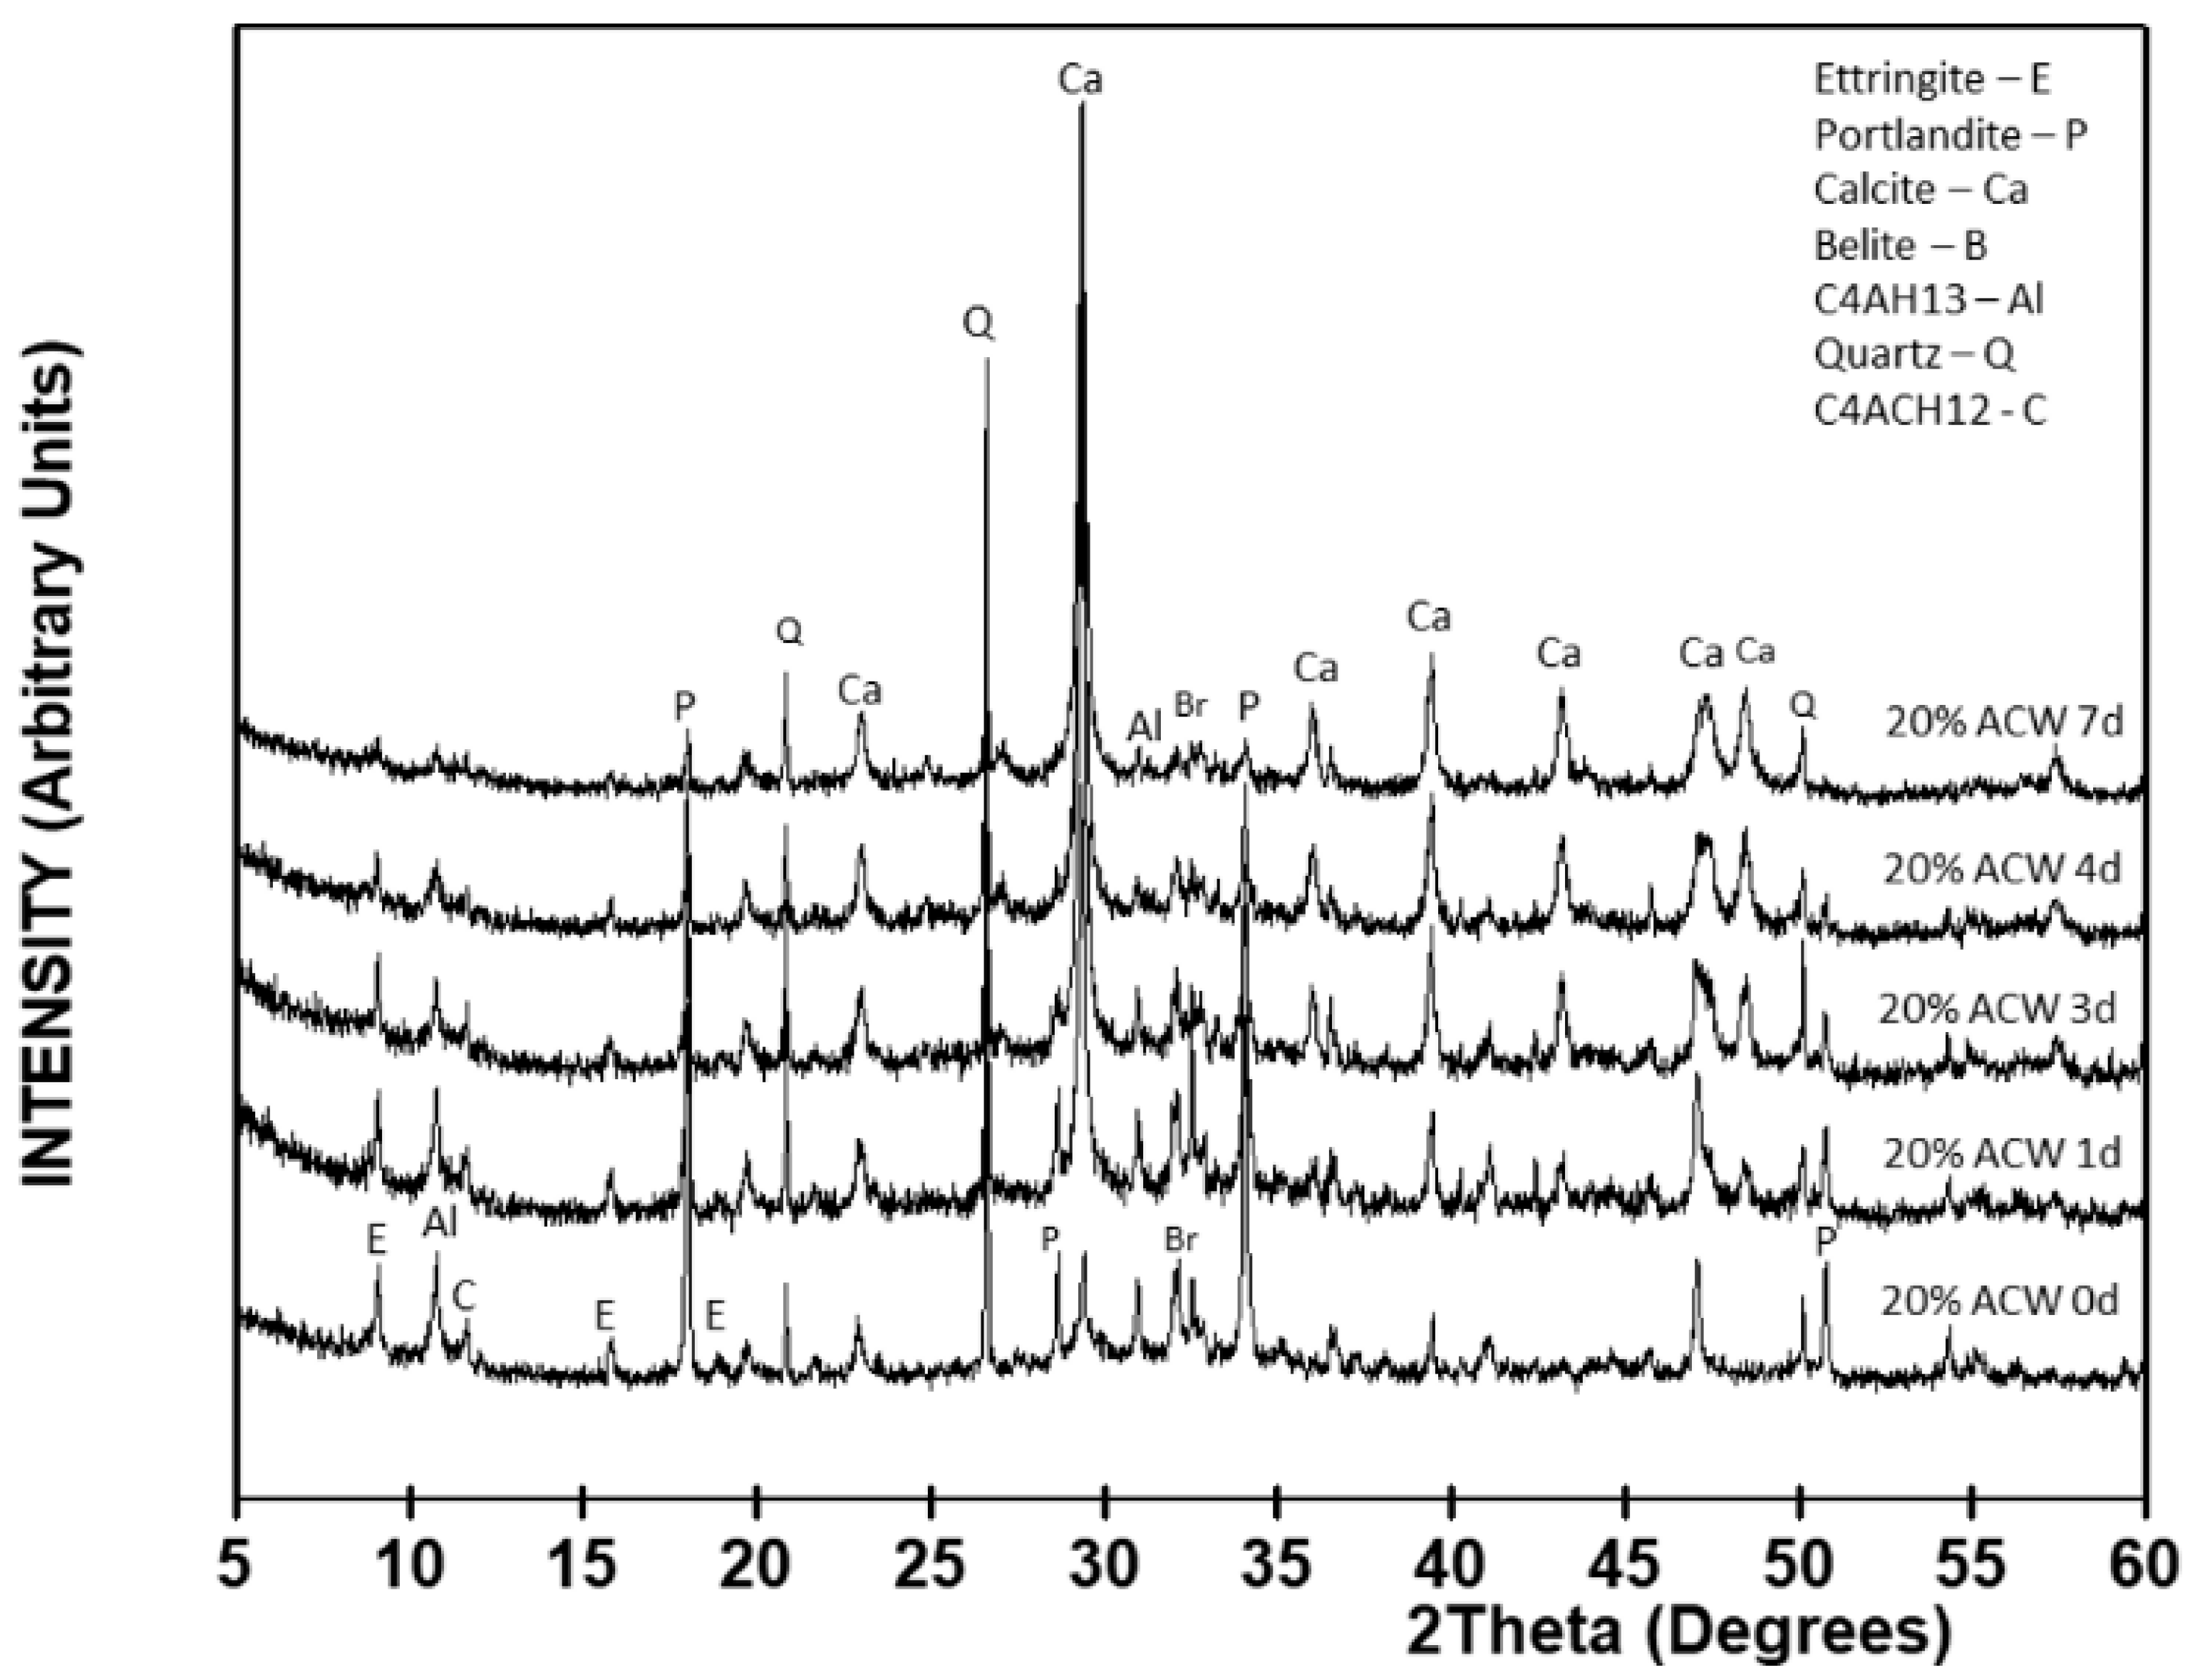
With the addition of 20% ACW to the OPC (Figure 5 and Table 4), the intensity patterns varied from the findings for the control in all the reflections except in the line attributed to quartz, which appeared in the 20% ACW only. Excepting calcite and quartz, content declined gradually in all the crystalline mineralogical phases to practically disappear after 7 days of exposure. At 84% of the total 7 day crystalline phases, calcite content was 59% greater in the blended cement paste than in the OPC paste. This finding clearly shows that the presence of 20% ACW hastened the decomposition of these hydrated phases, as they had been identified in the OPC.
These findings are consistent with reports by Pizzol et al. [43] for hybrid fibre cement composites exposed to accelerated carbonation for 10 h at 60 °C and 90% RH, in which no crystalline ettringite, monosulfate or monocarboaluminate was identified in the carbonated composite.
The present findings show that the addition of 20% ACW to OPC hastens carbonation. They attest not only to portlandite carbonation but also to the decalcification of calcium-bearing phases such as ettringite, monocarboaluminate, tetracalcium aluminate and even dicalcium silicate (C2S) as a result of their reaction with CO2.
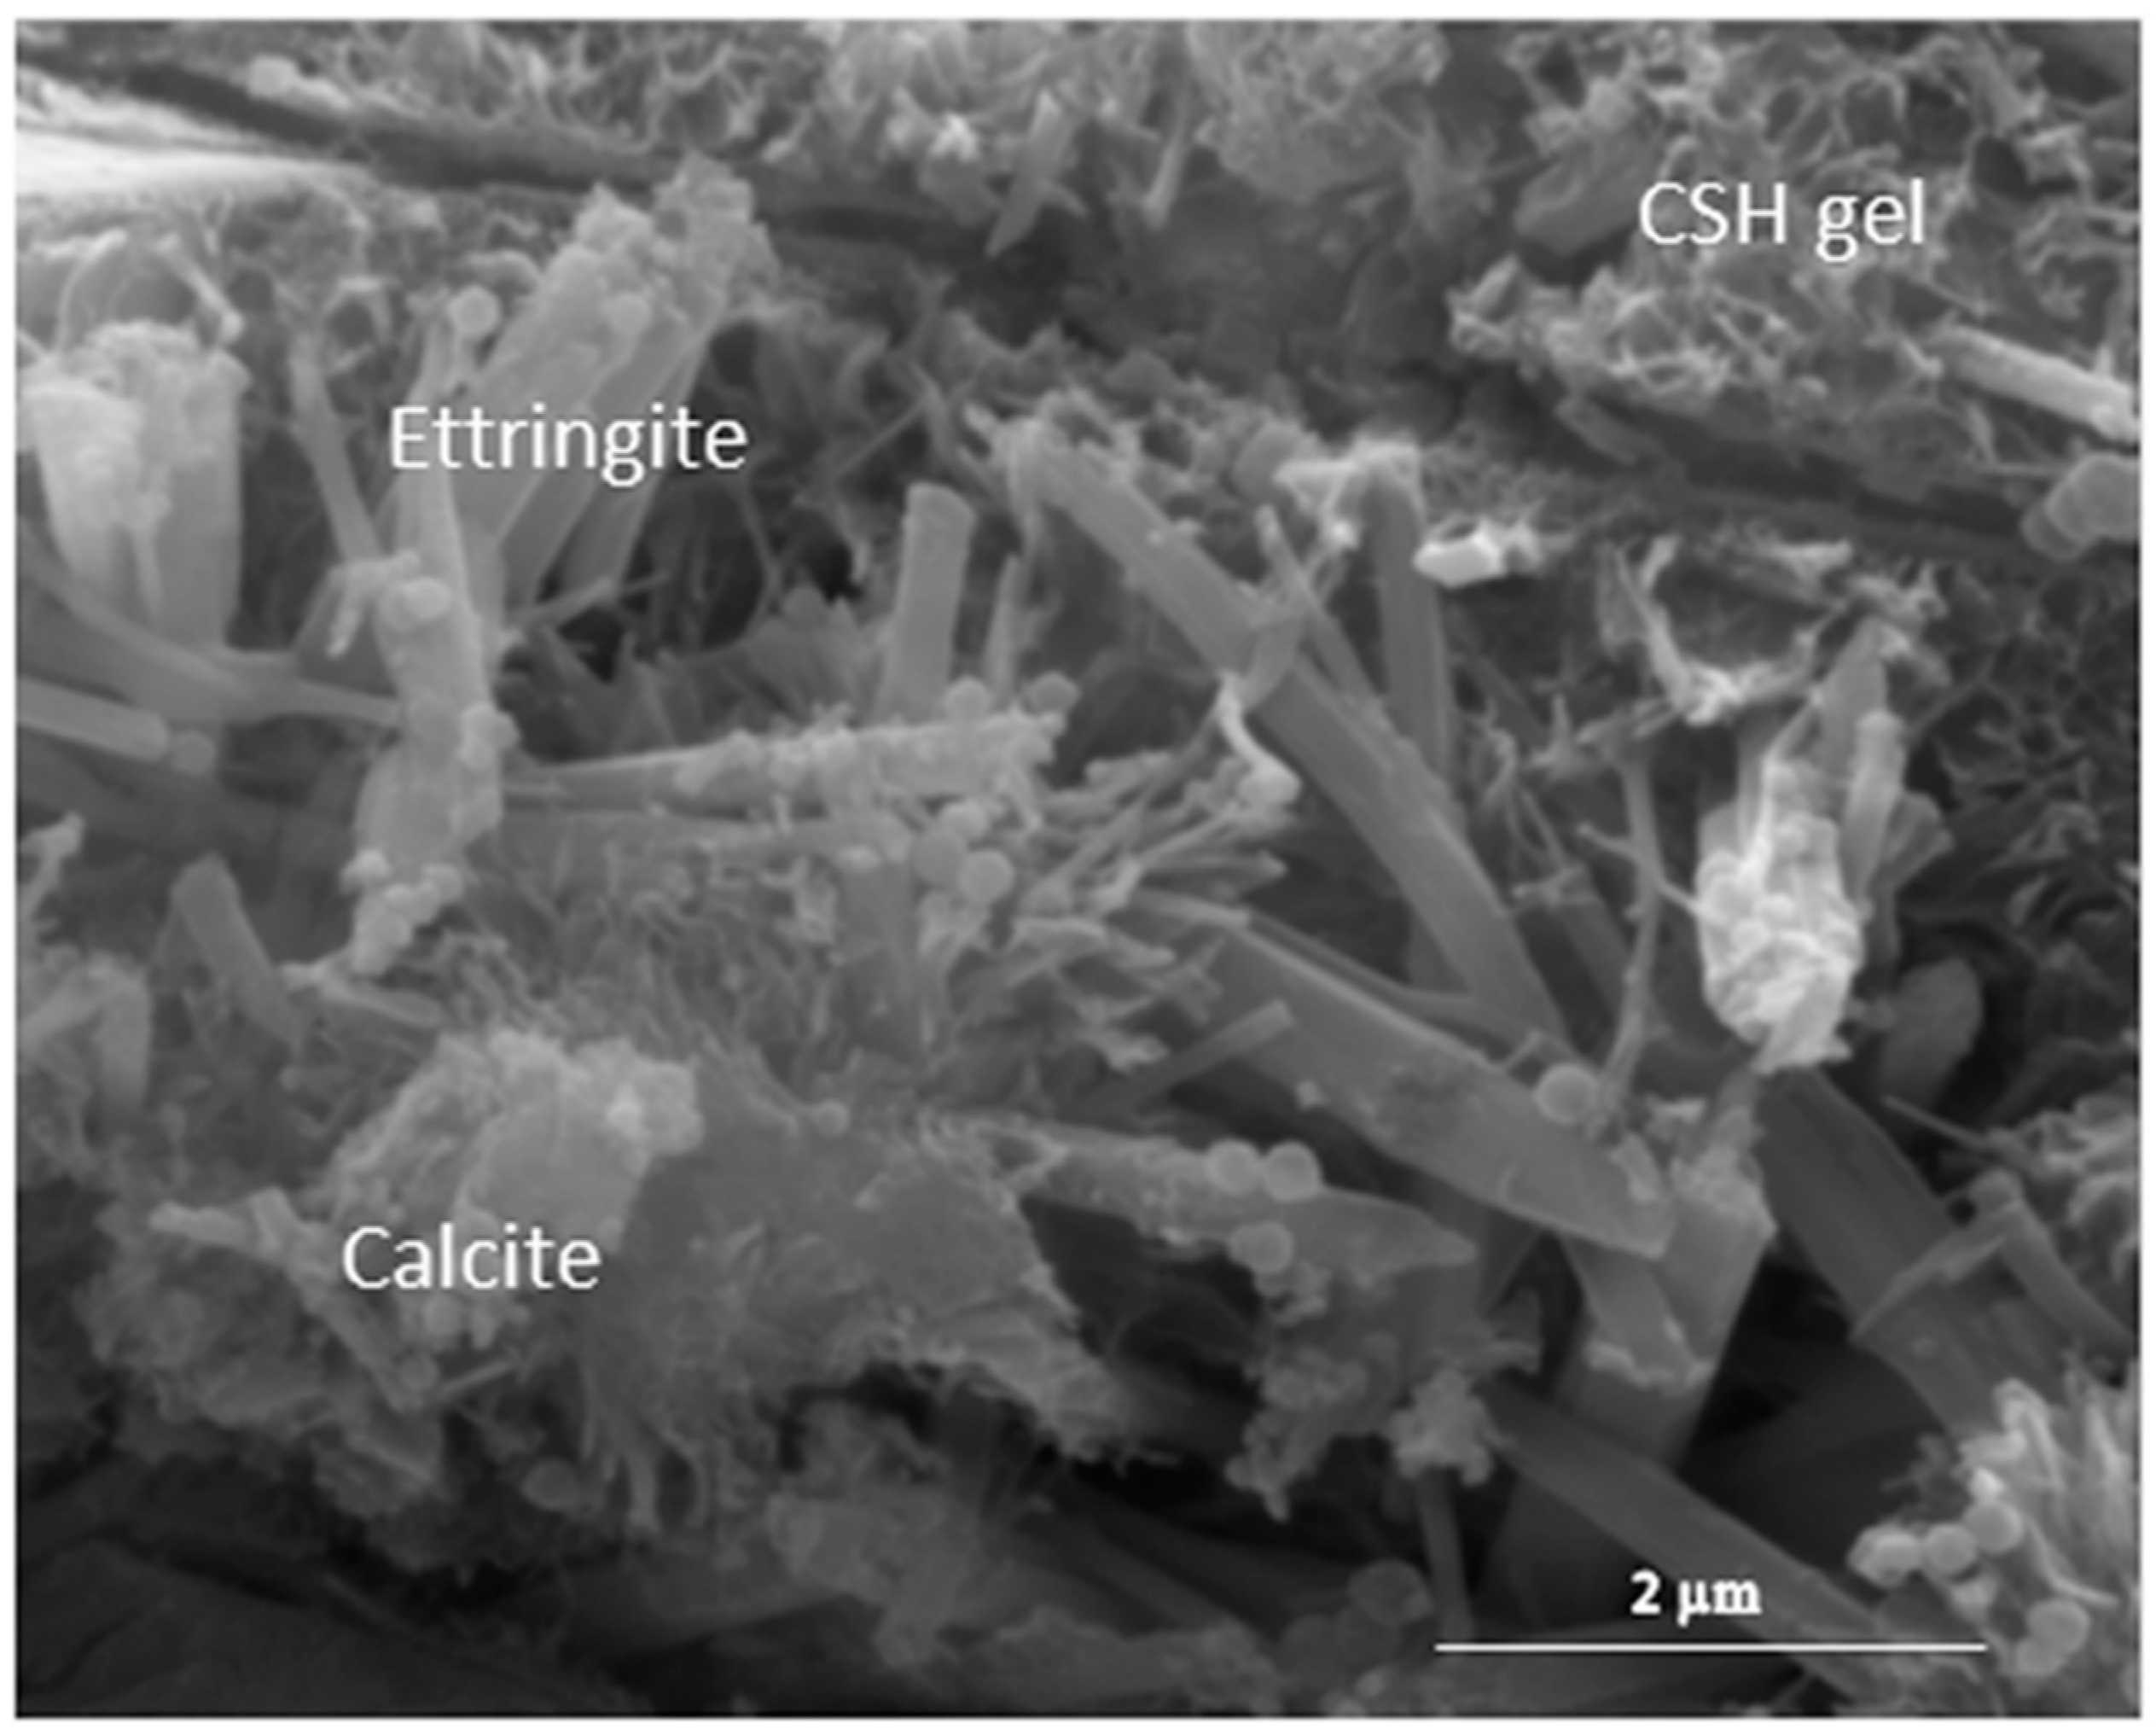
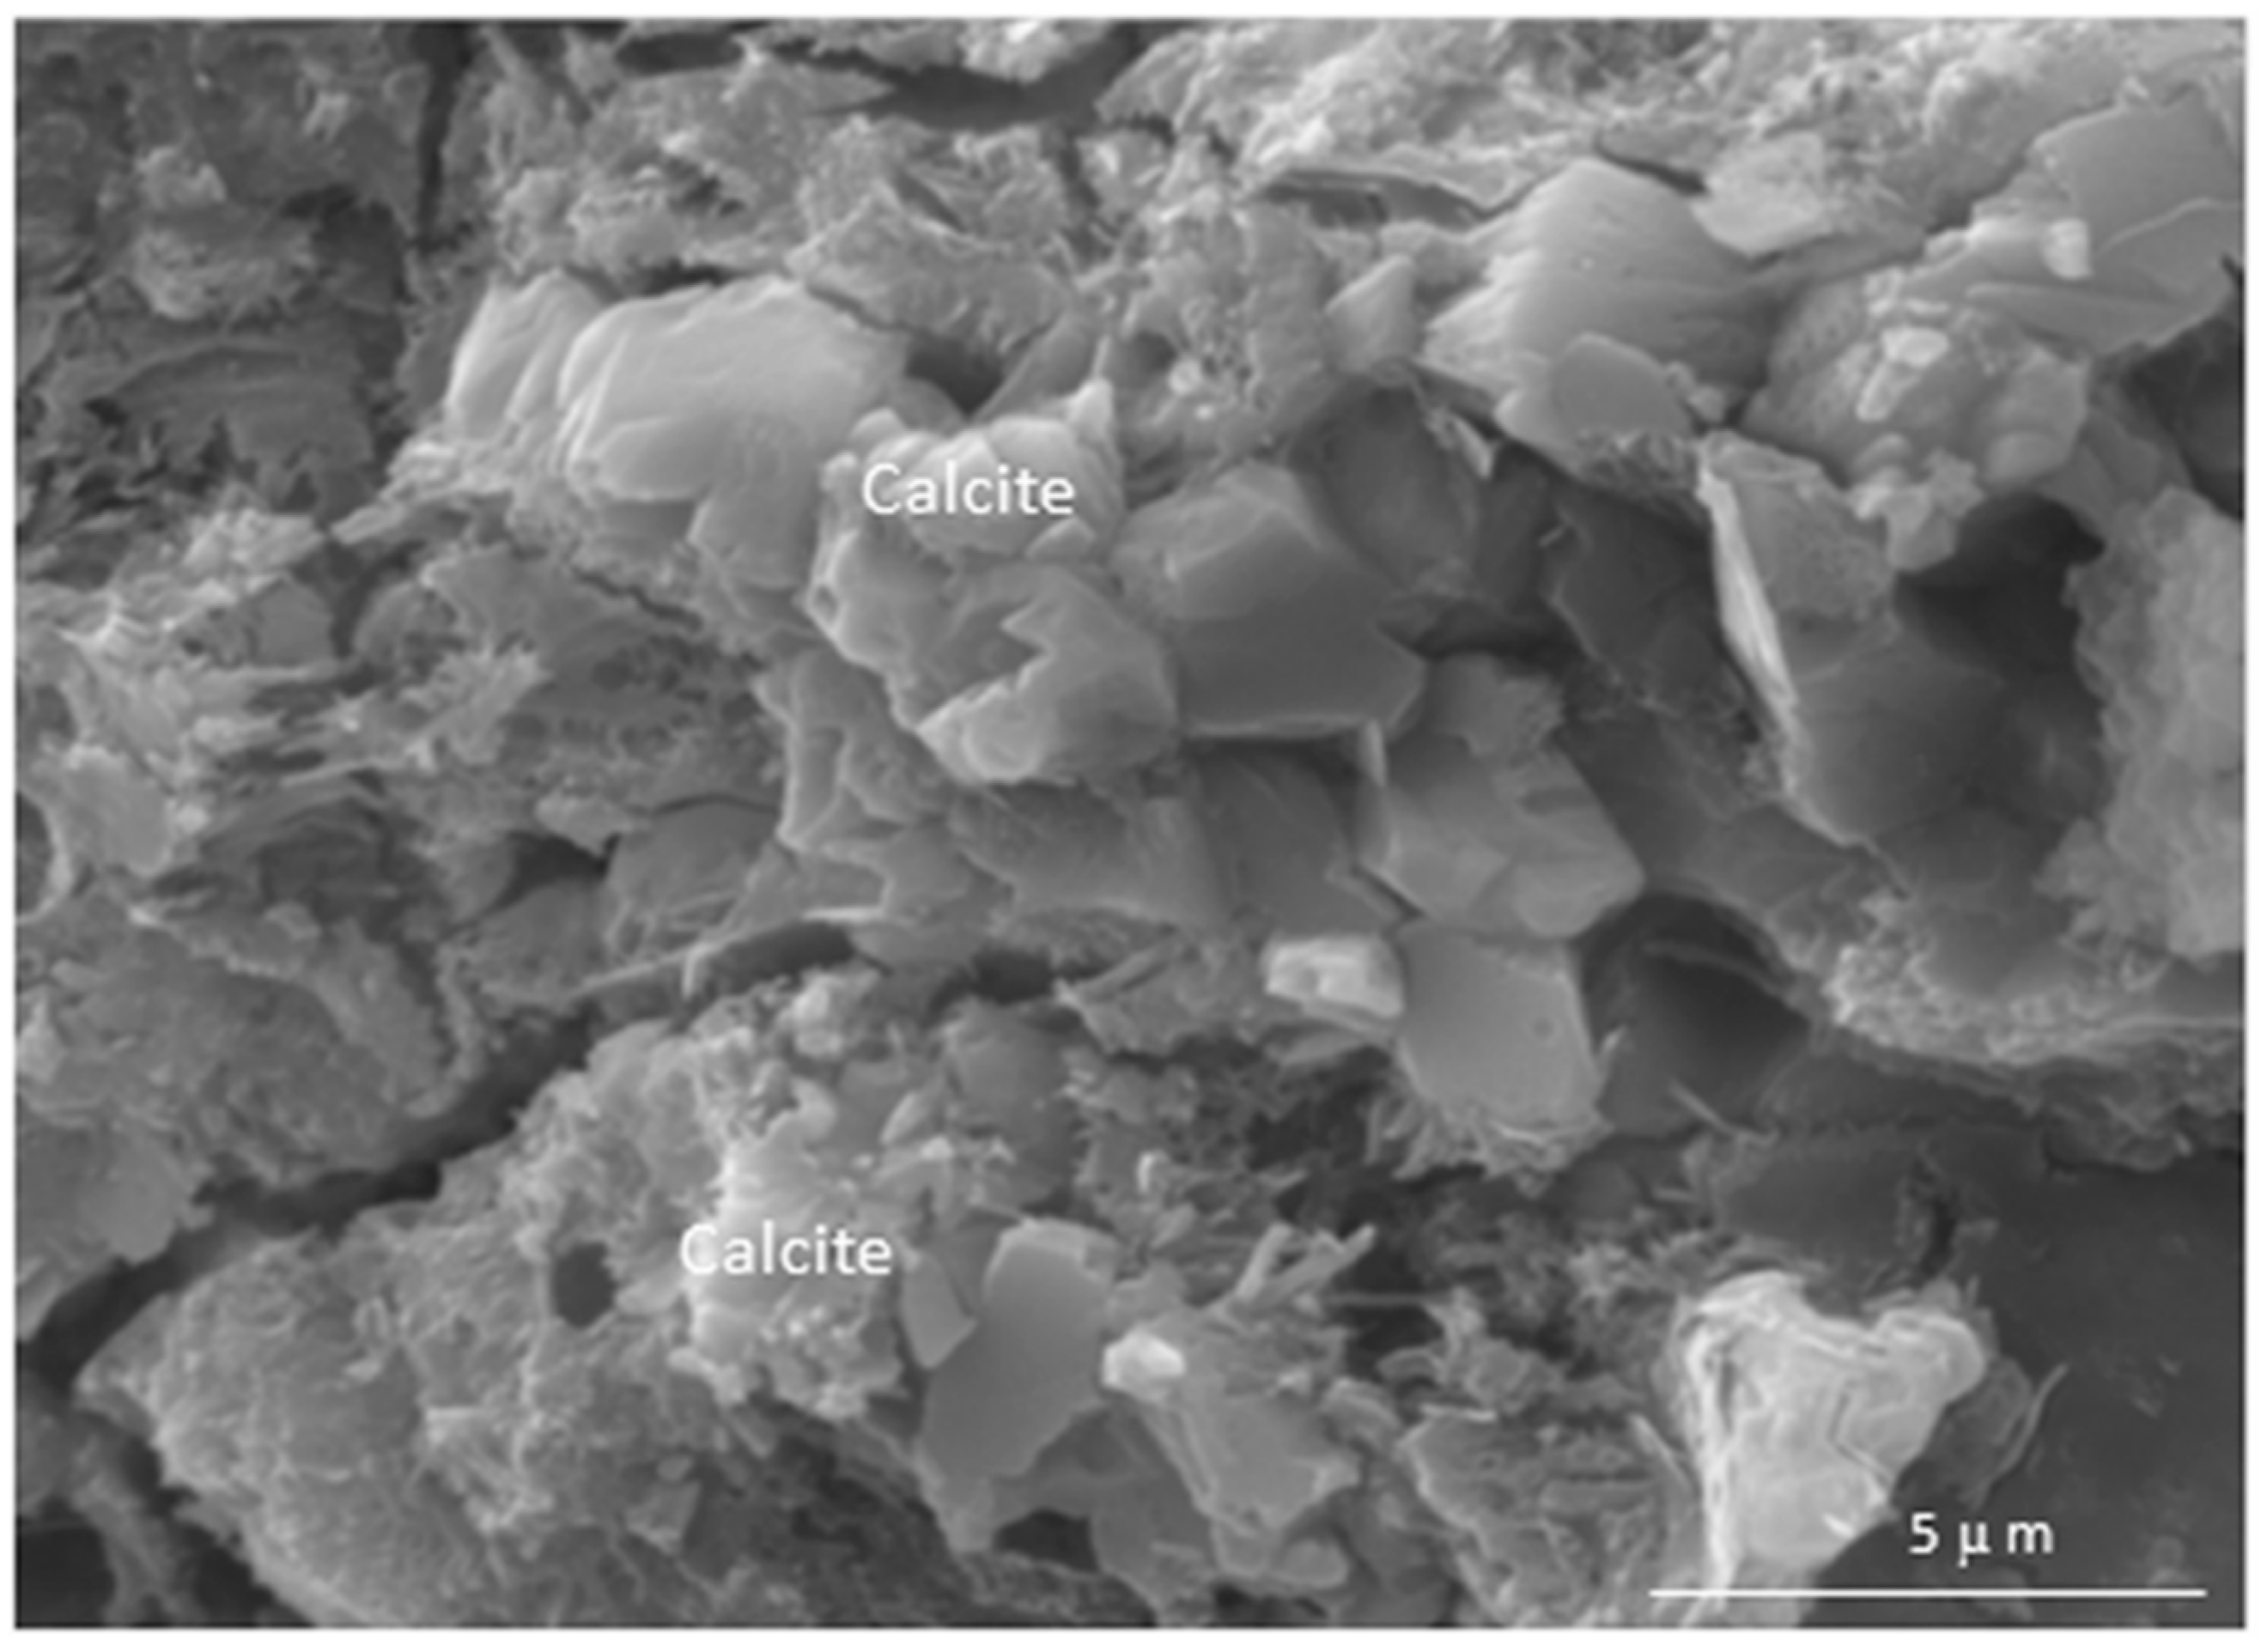
SEM analysis of the OPC pastes carbonated for 4 days revealed the formation of incipient calcite rhombohedral crystals along the edges of the ettringite prisms and (primarily) in the voids and cavities in the C-S-H gels (Figure 6). The EDX chemical microanalysis findings for the mineralogical phases are given in Table 5.
The 20% replacement favoured the generation of calcite rhombohedral crystals, which formed massively on the surface and in the voids in the material carbonated for 4 days, although the crystal size was smaller in the latter (Figure 7).
Very small calcium and calcite deposits were observed on the surface in the non-carbonated area of the 7 days OPC paste, while calcite crystals less than 2 μm in size clustered on both the surface and in the voids in the carbonated zone. The 20% replacement favoured the formation of calcite rhombi that accumulated profusely on the surface of the carbonated area of the specimen.

3.3.2. TG/DTG Analysis

The DTG analyses conducted identified hydrated phase decomposition during the 7 days accelerated carbonation trial. The following processes were clearly observed in both the OPC and the 20% ACW pastes: ettringite (Ett), C-S-H gel and aluminate hydrate (C4AH13) dehydroxylation, which respectively induced peaks at around 51 °C, 92 °C and 145 °C in a broad band spanning from 40 °C to 200 °C; and the loss of interlayer water in hydrated monocarboaluminate (C4AcH12), generating a weak band at 255 °C. The intensities of the main decomposition bands for the C-S-H gels, ettringite and C4AH13 declined with carbonation time, more notably in the 20% ACW blended cement. That finding ratified the effect of carbonation (decalcification) not only on portlandite, but also on other hydrated phases [14,44,45]. The intensity of the peak centred over 435 °C generated by portlandite decomposition declined as decarbonation advanced, with only traces of the mineral appearing in the 7 days 20% ACW paste. A band at 650 °C to 750 °C, peaking at 733 °C and increasing in intensity with time, was attributed to carbonate decomposition.
Whilst both carbonated cements underwent gradual weight loss between 450 °C and 650 °C, this loss was much more significant in the cement containing the 20% replacement. Further to findings reported by Black et al. [16], this observation might be associated with the formation of an amorphous calcium carbonate hydrate generated by the decalcification of the calcium hydrate phases, primarily C-S-H gels (the majority phase in cement hydration).
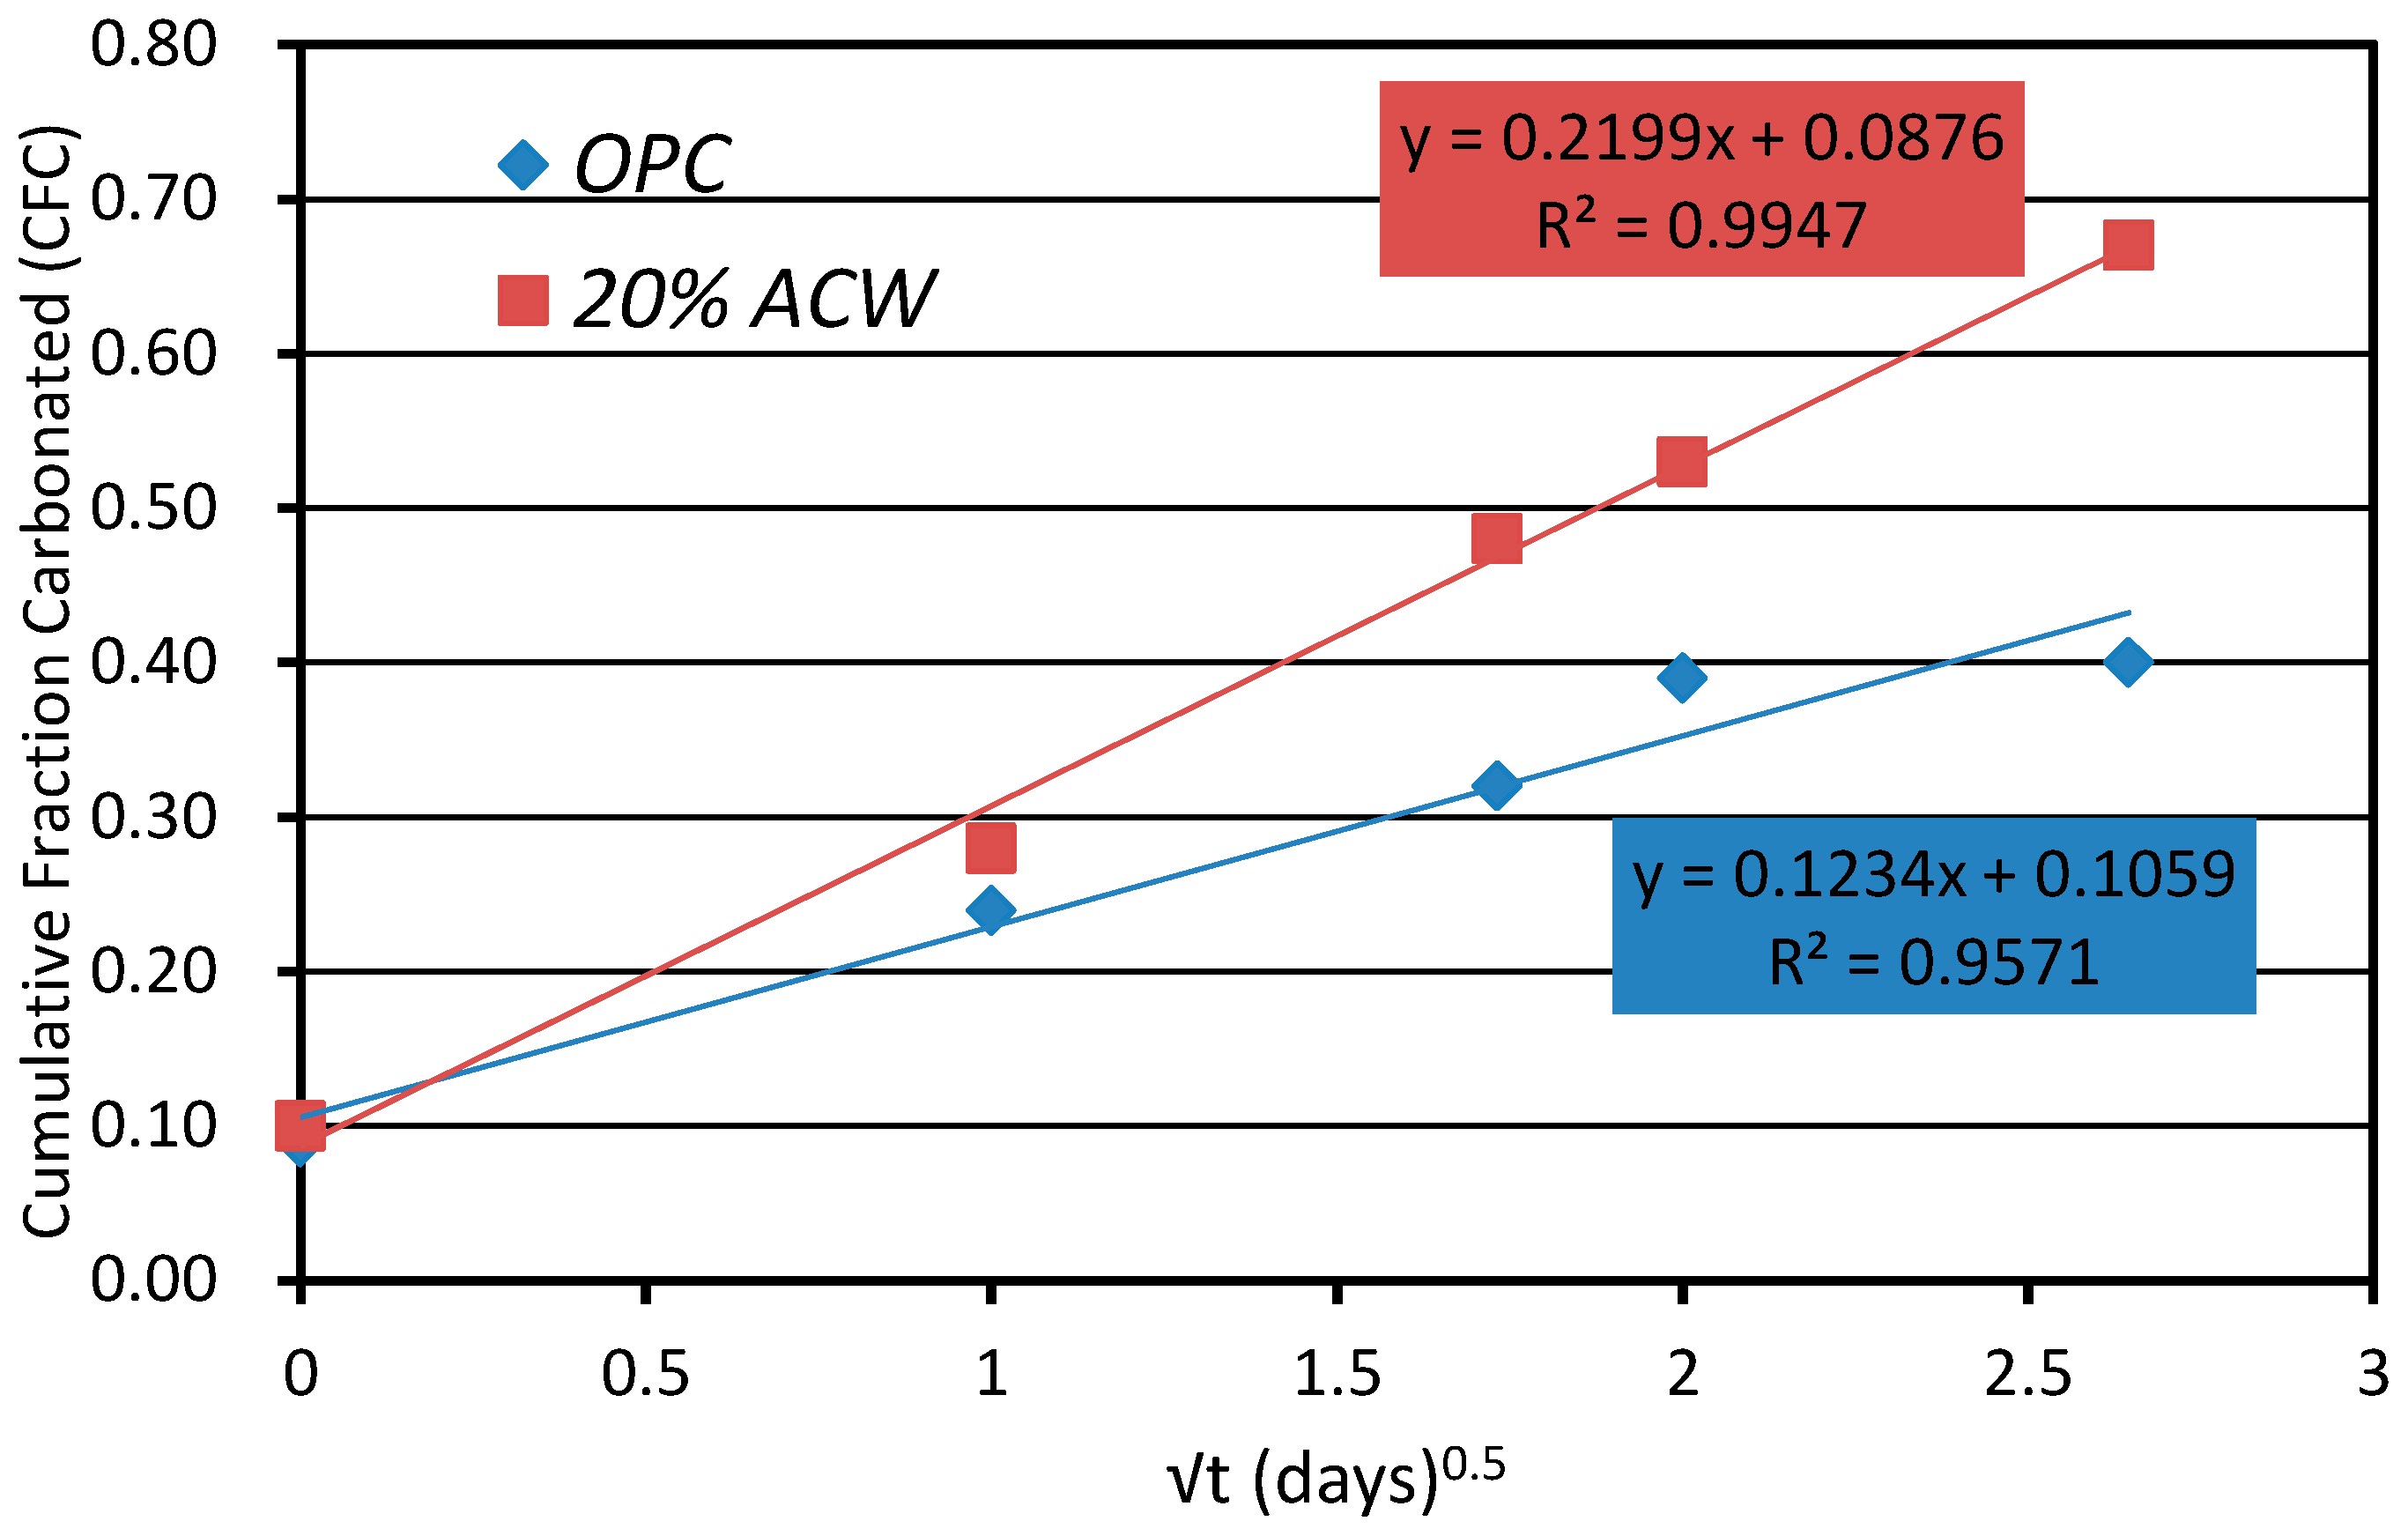
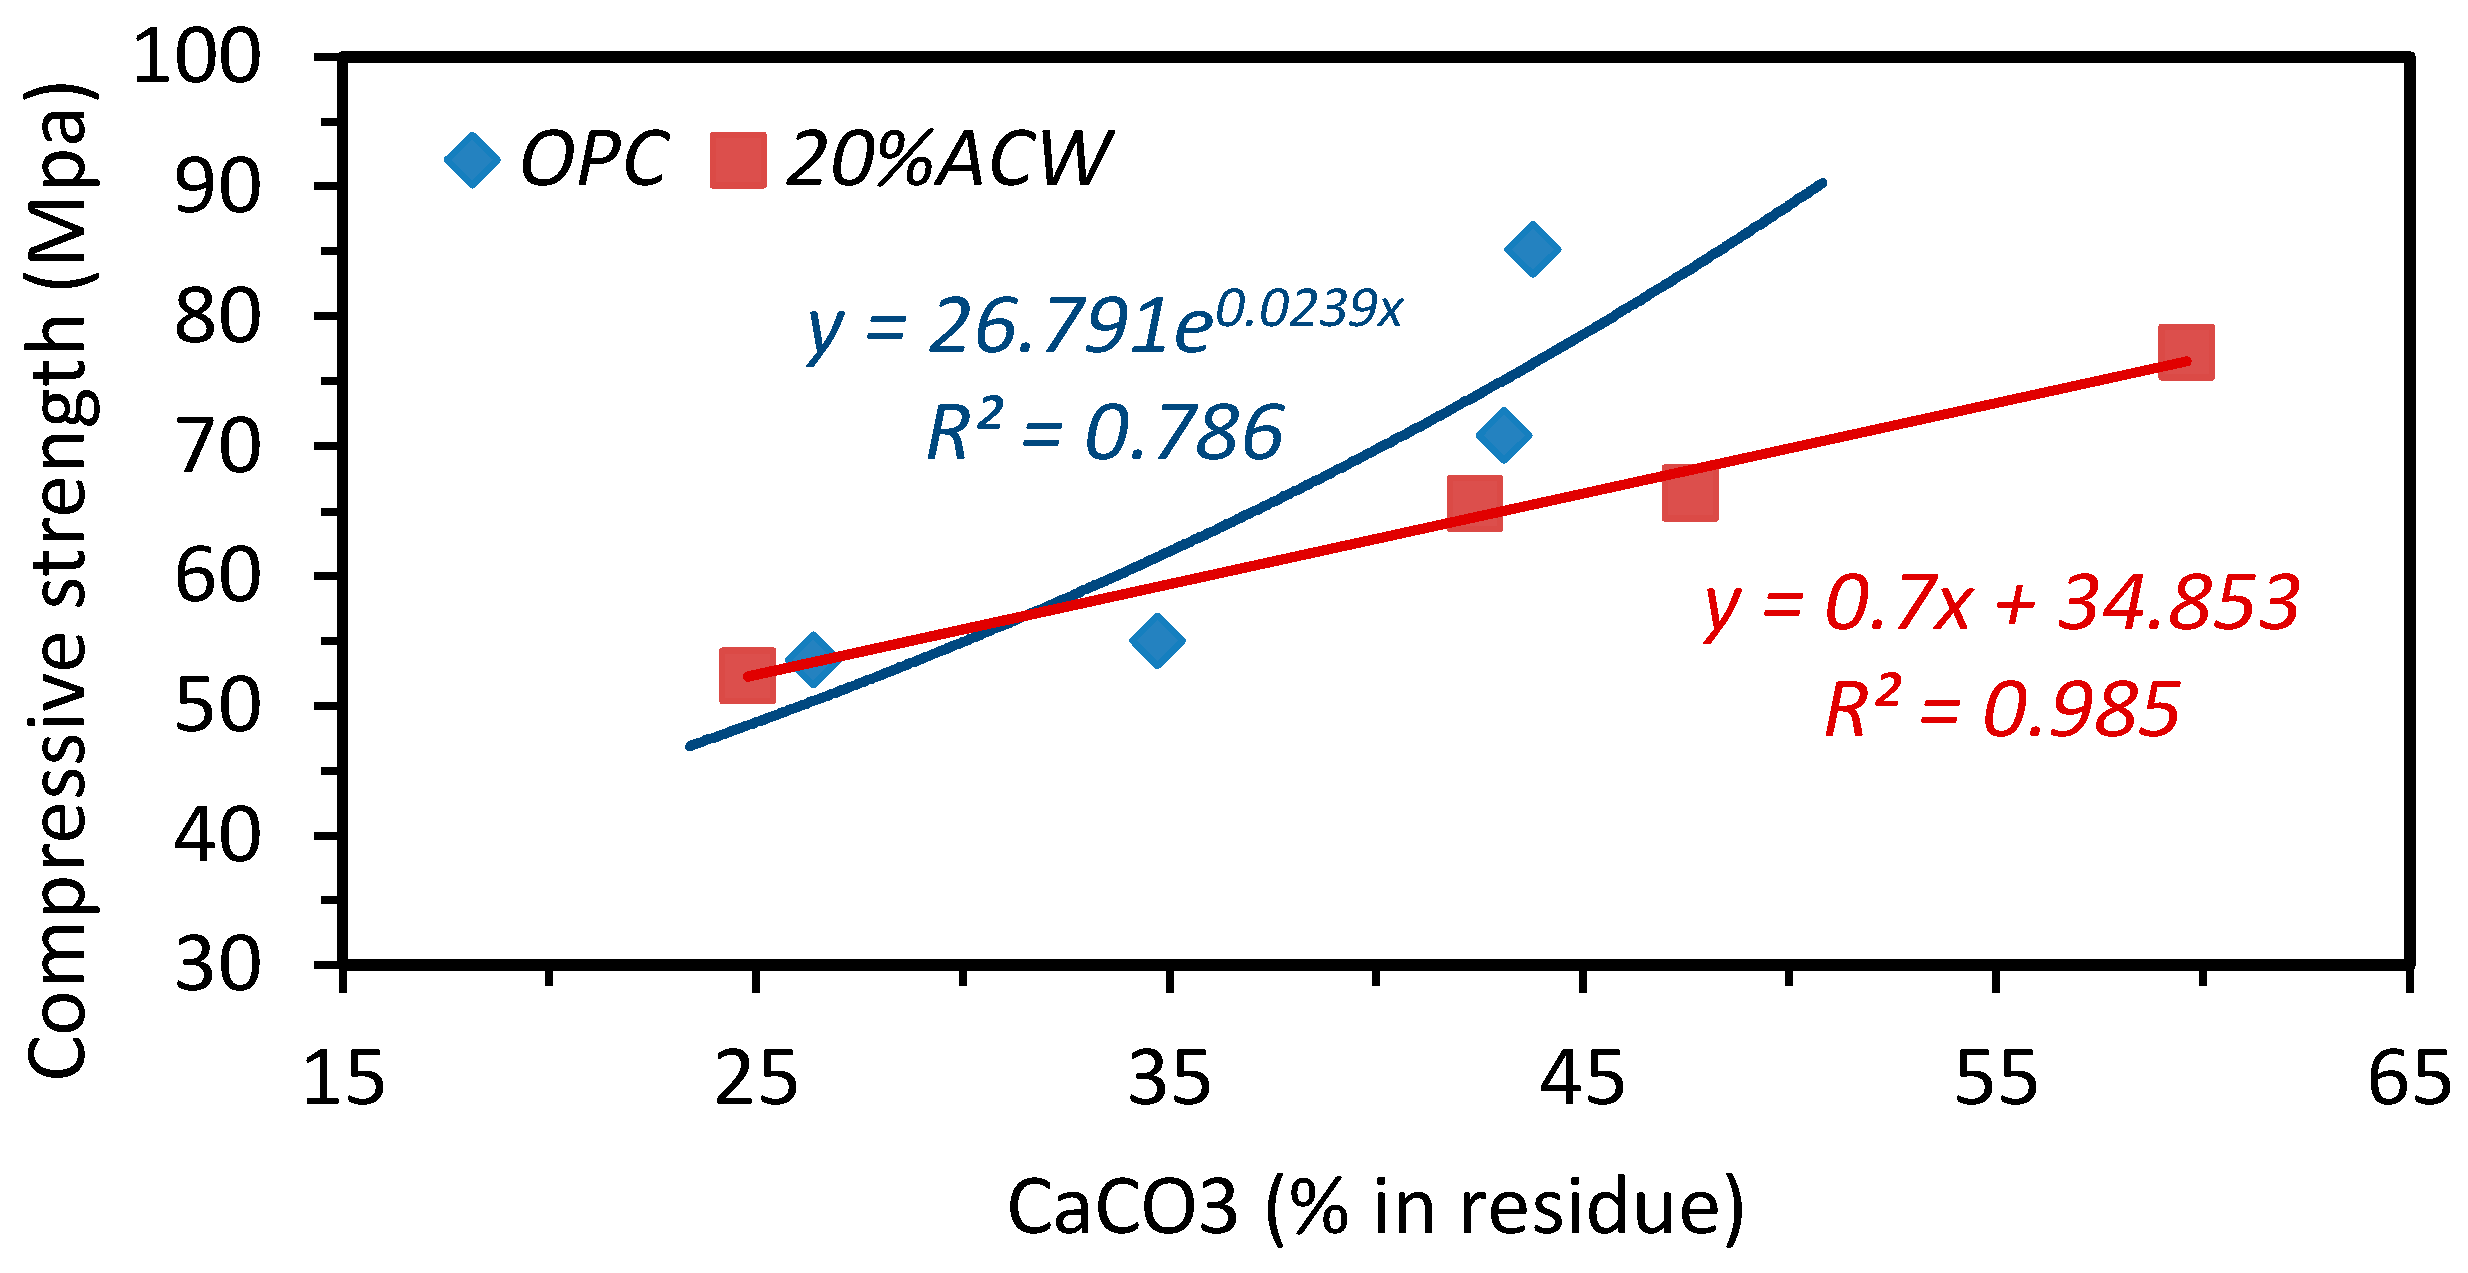
Table 6 gives the Ca(OH)2, CaCO3, cumulative fraction carbonated (CFC) and chemically combined water contents calculated from the weight loss detected in the TG analyses (of the residue). The CFC was estimated by dividing the respective carbonate content (expressed as CaO) by the CaO in the anhydrous cement and the pozzolan [
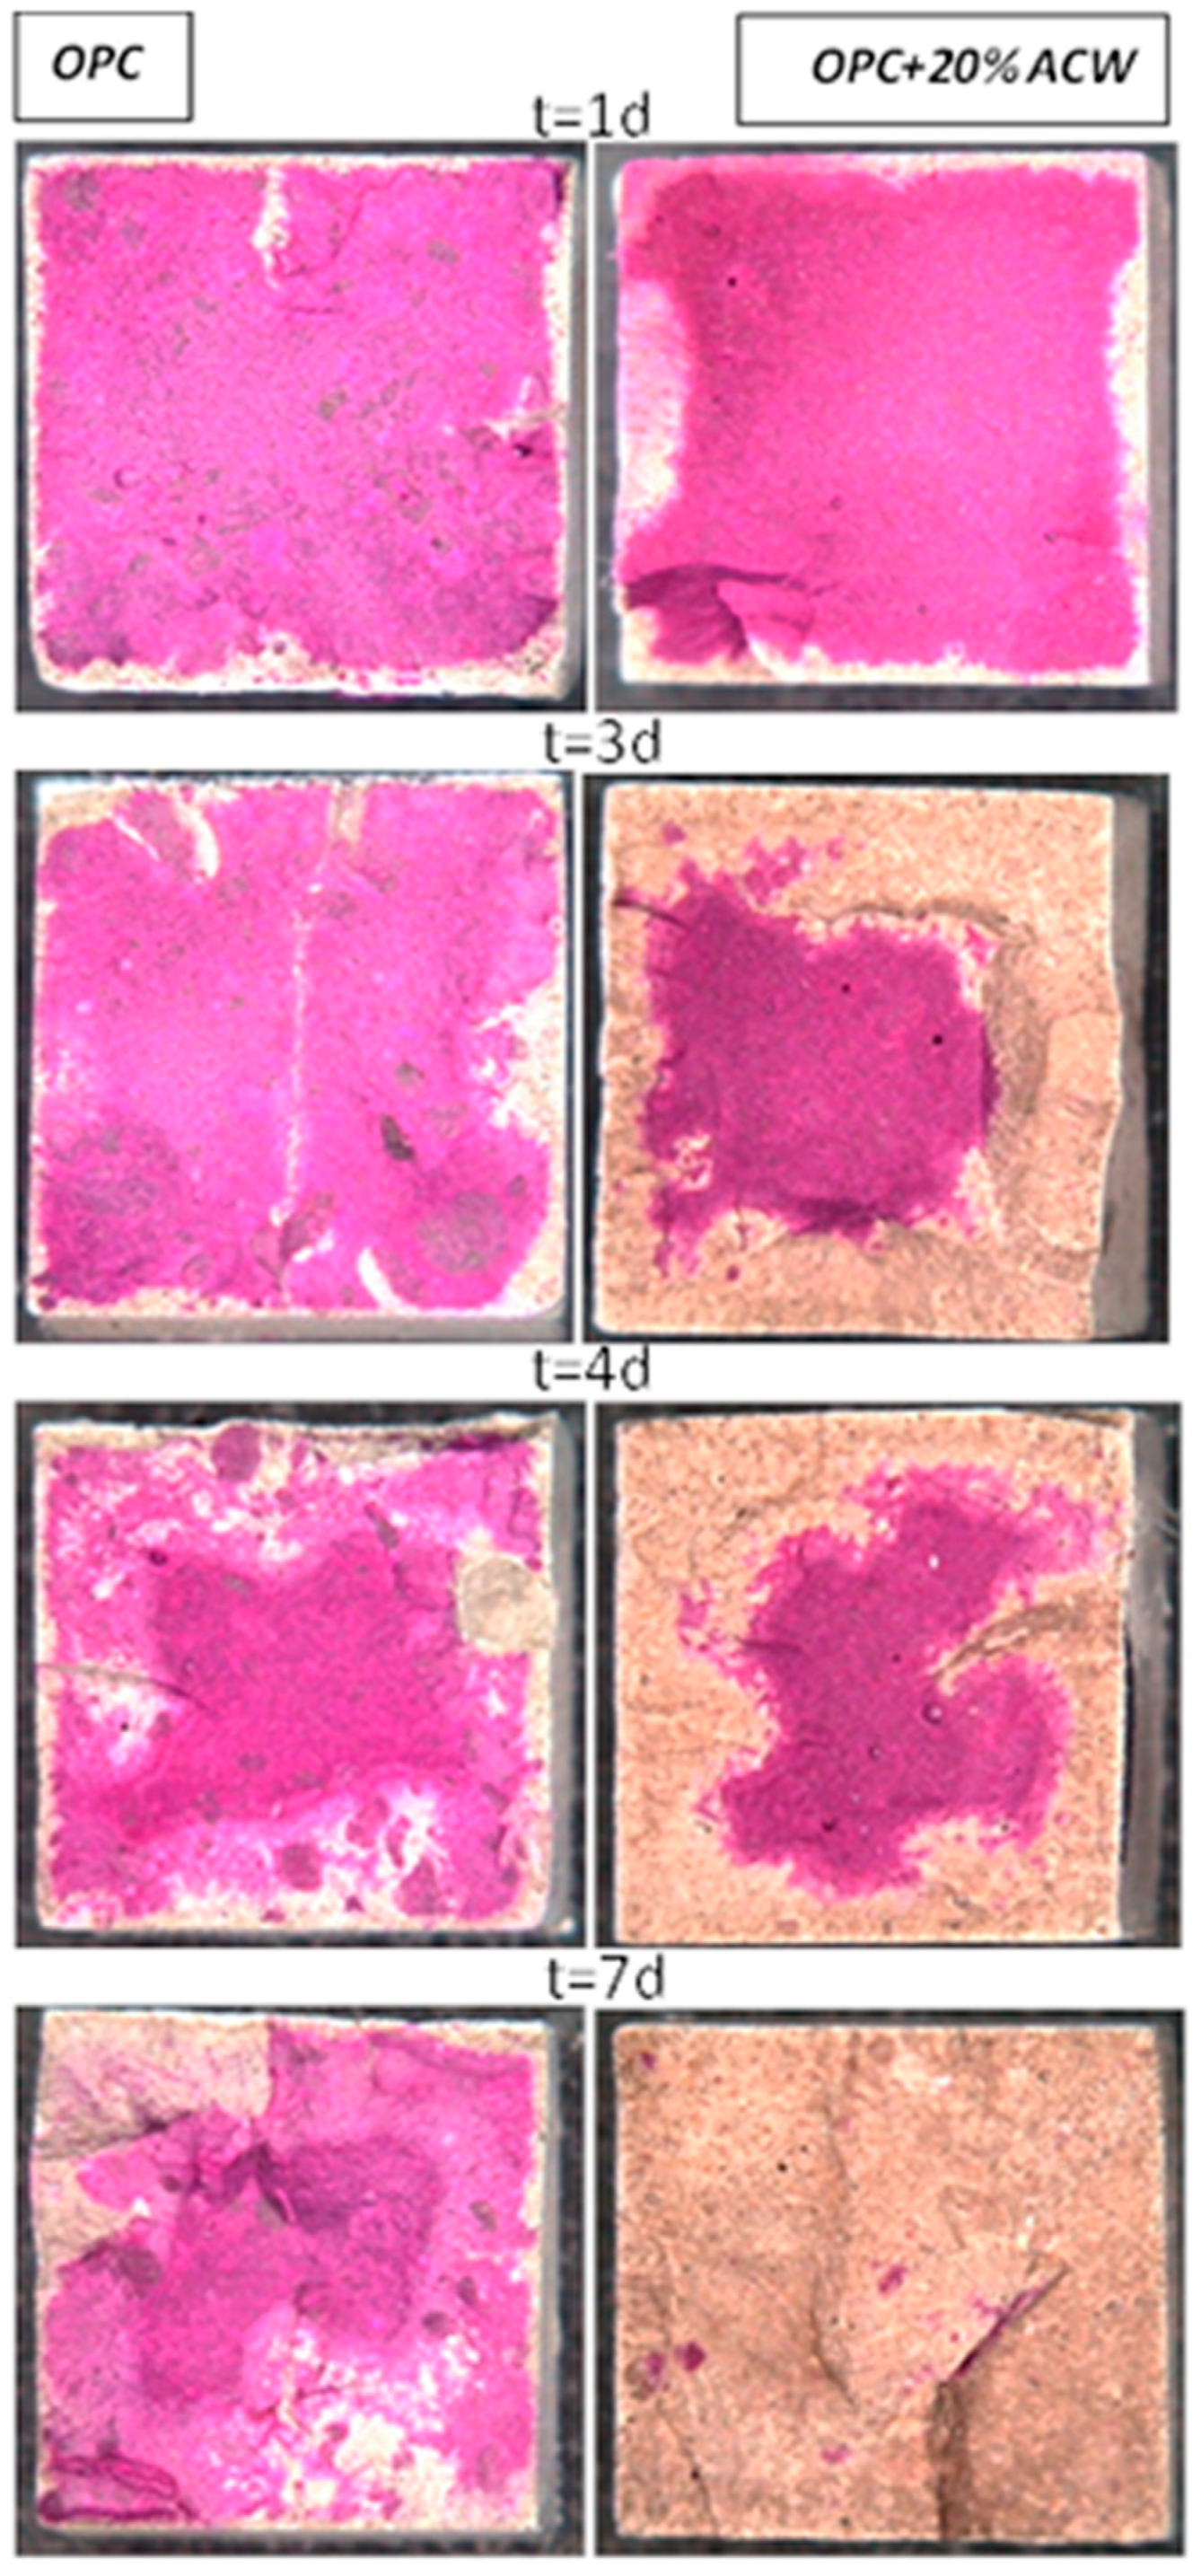
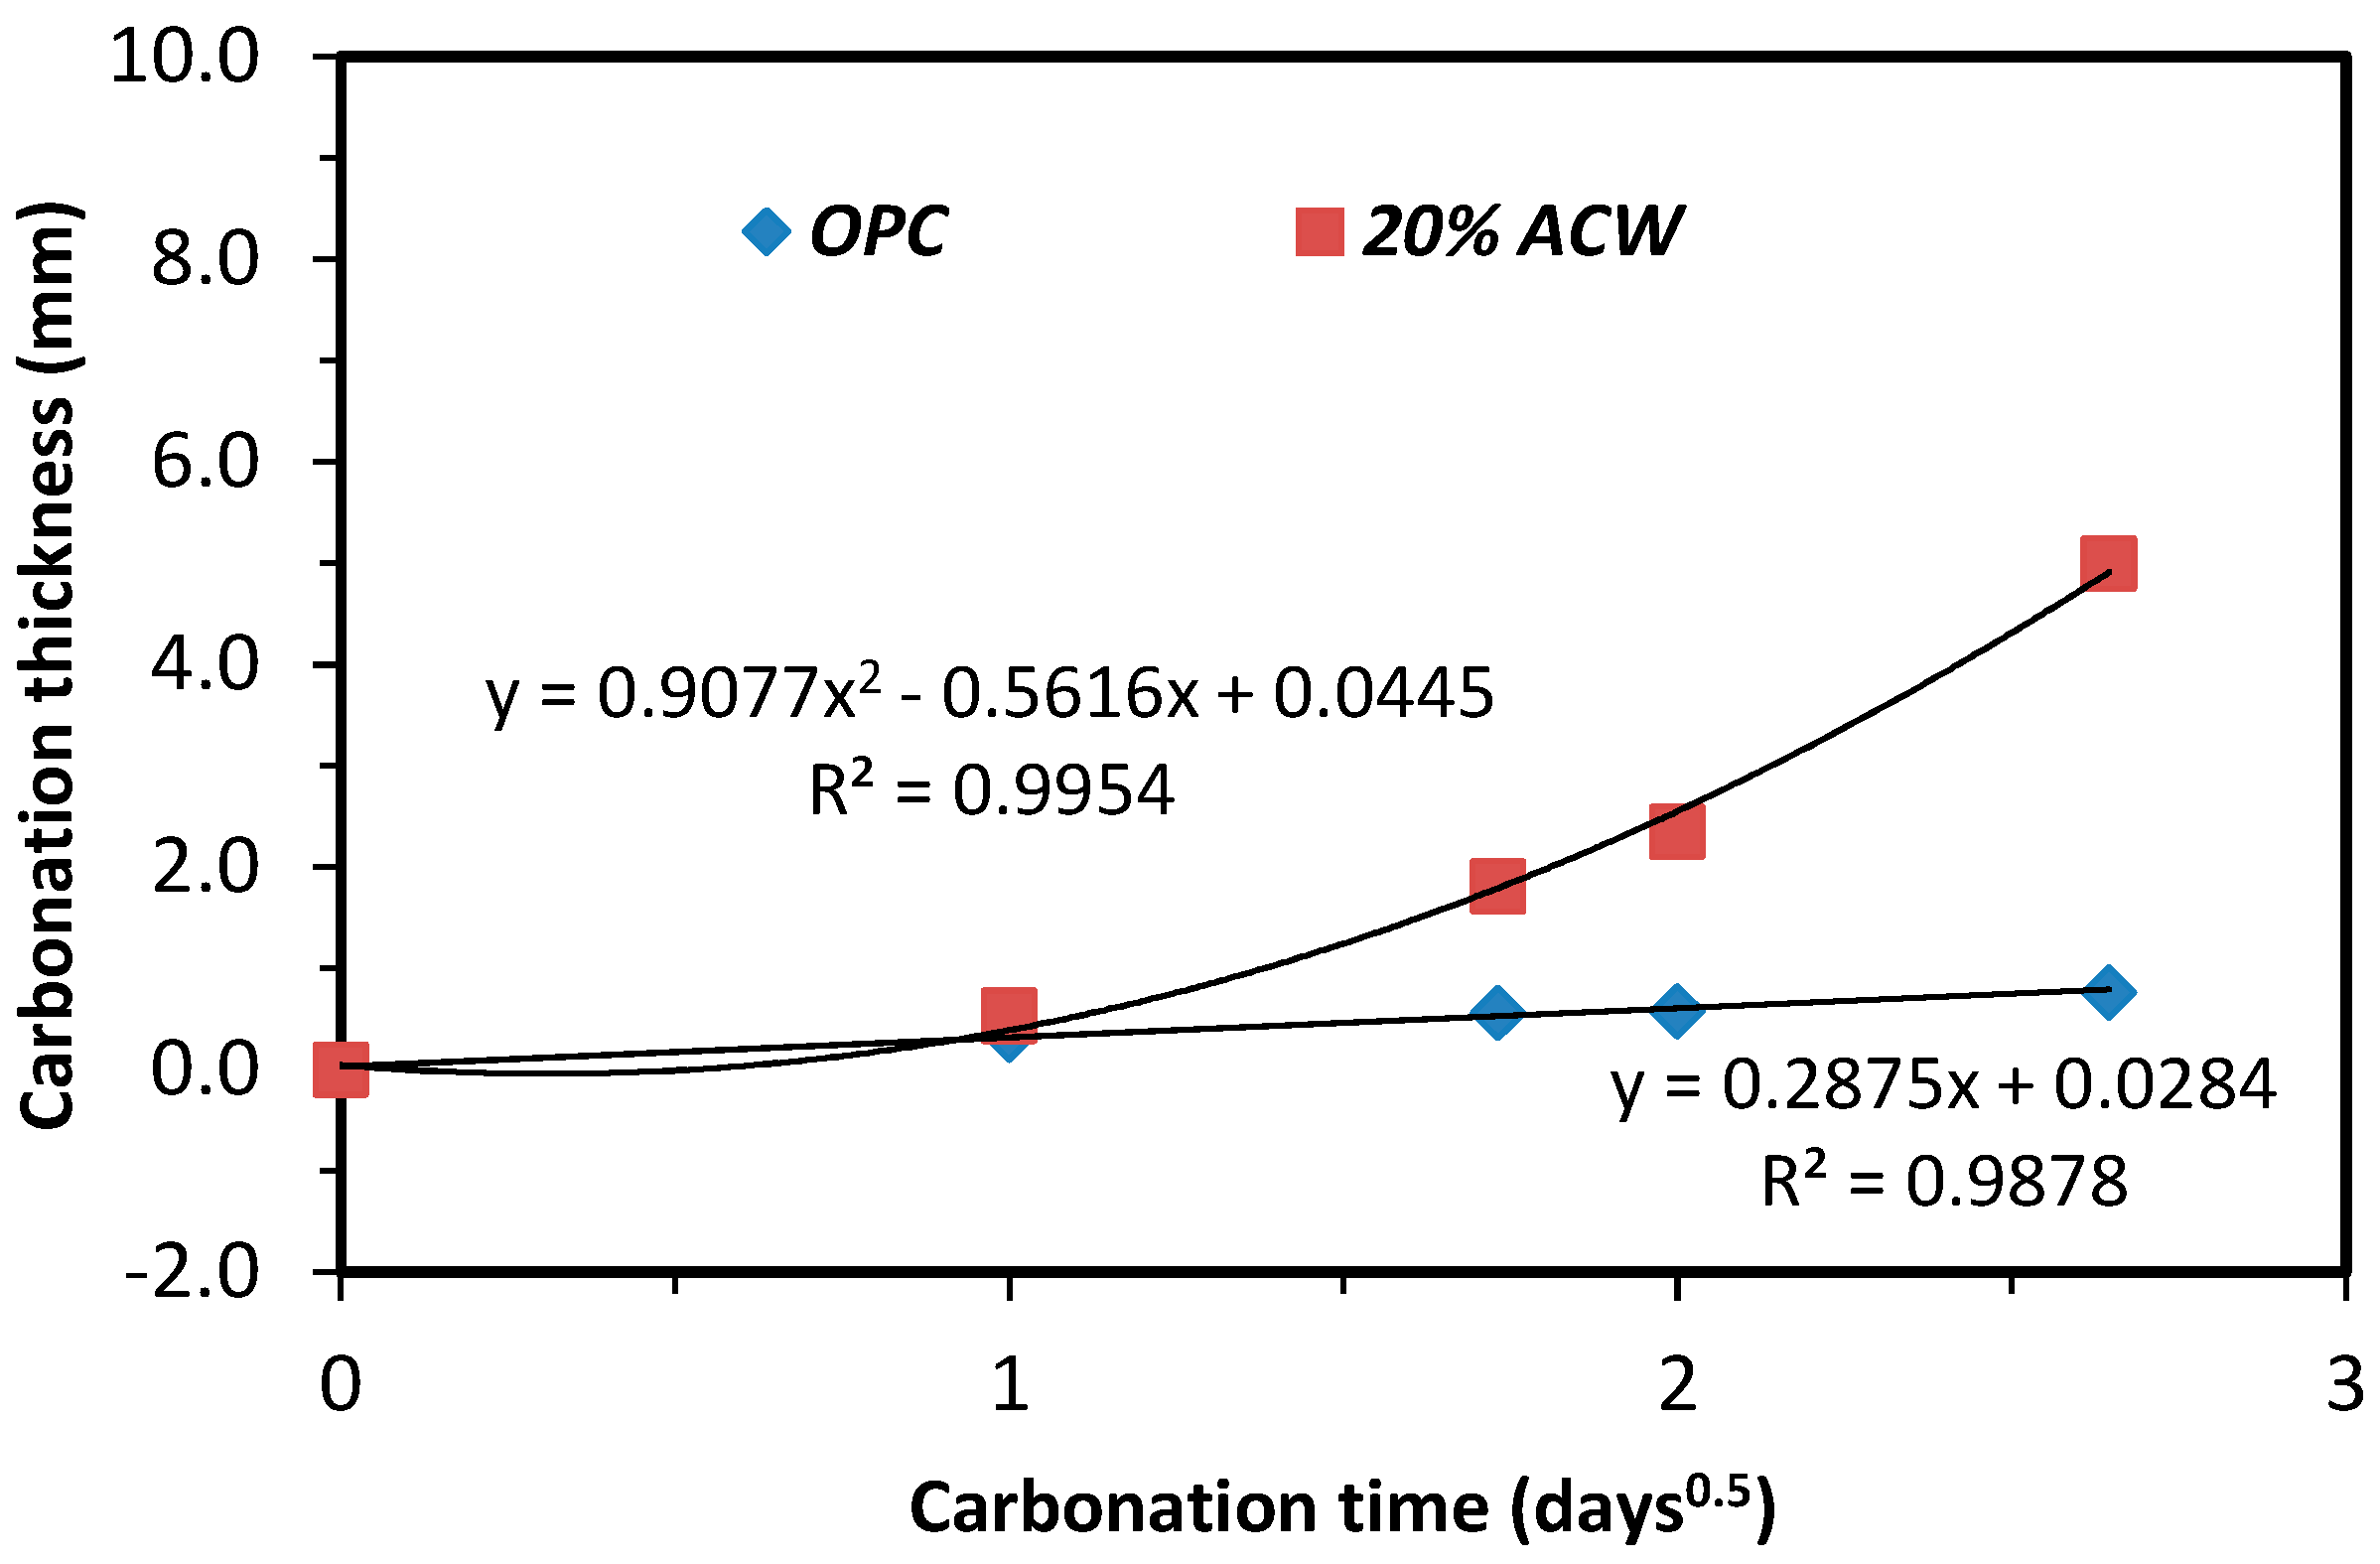
40]. The plot of this parameter against the square root of time (up to 7 days) proved to be linear (Figure 8). Based on the slopes of these lines, the 20% ACW cement carbonated at a 78% higher rate than the OPC paste, concurring with the trend illustrated in Figure 2.

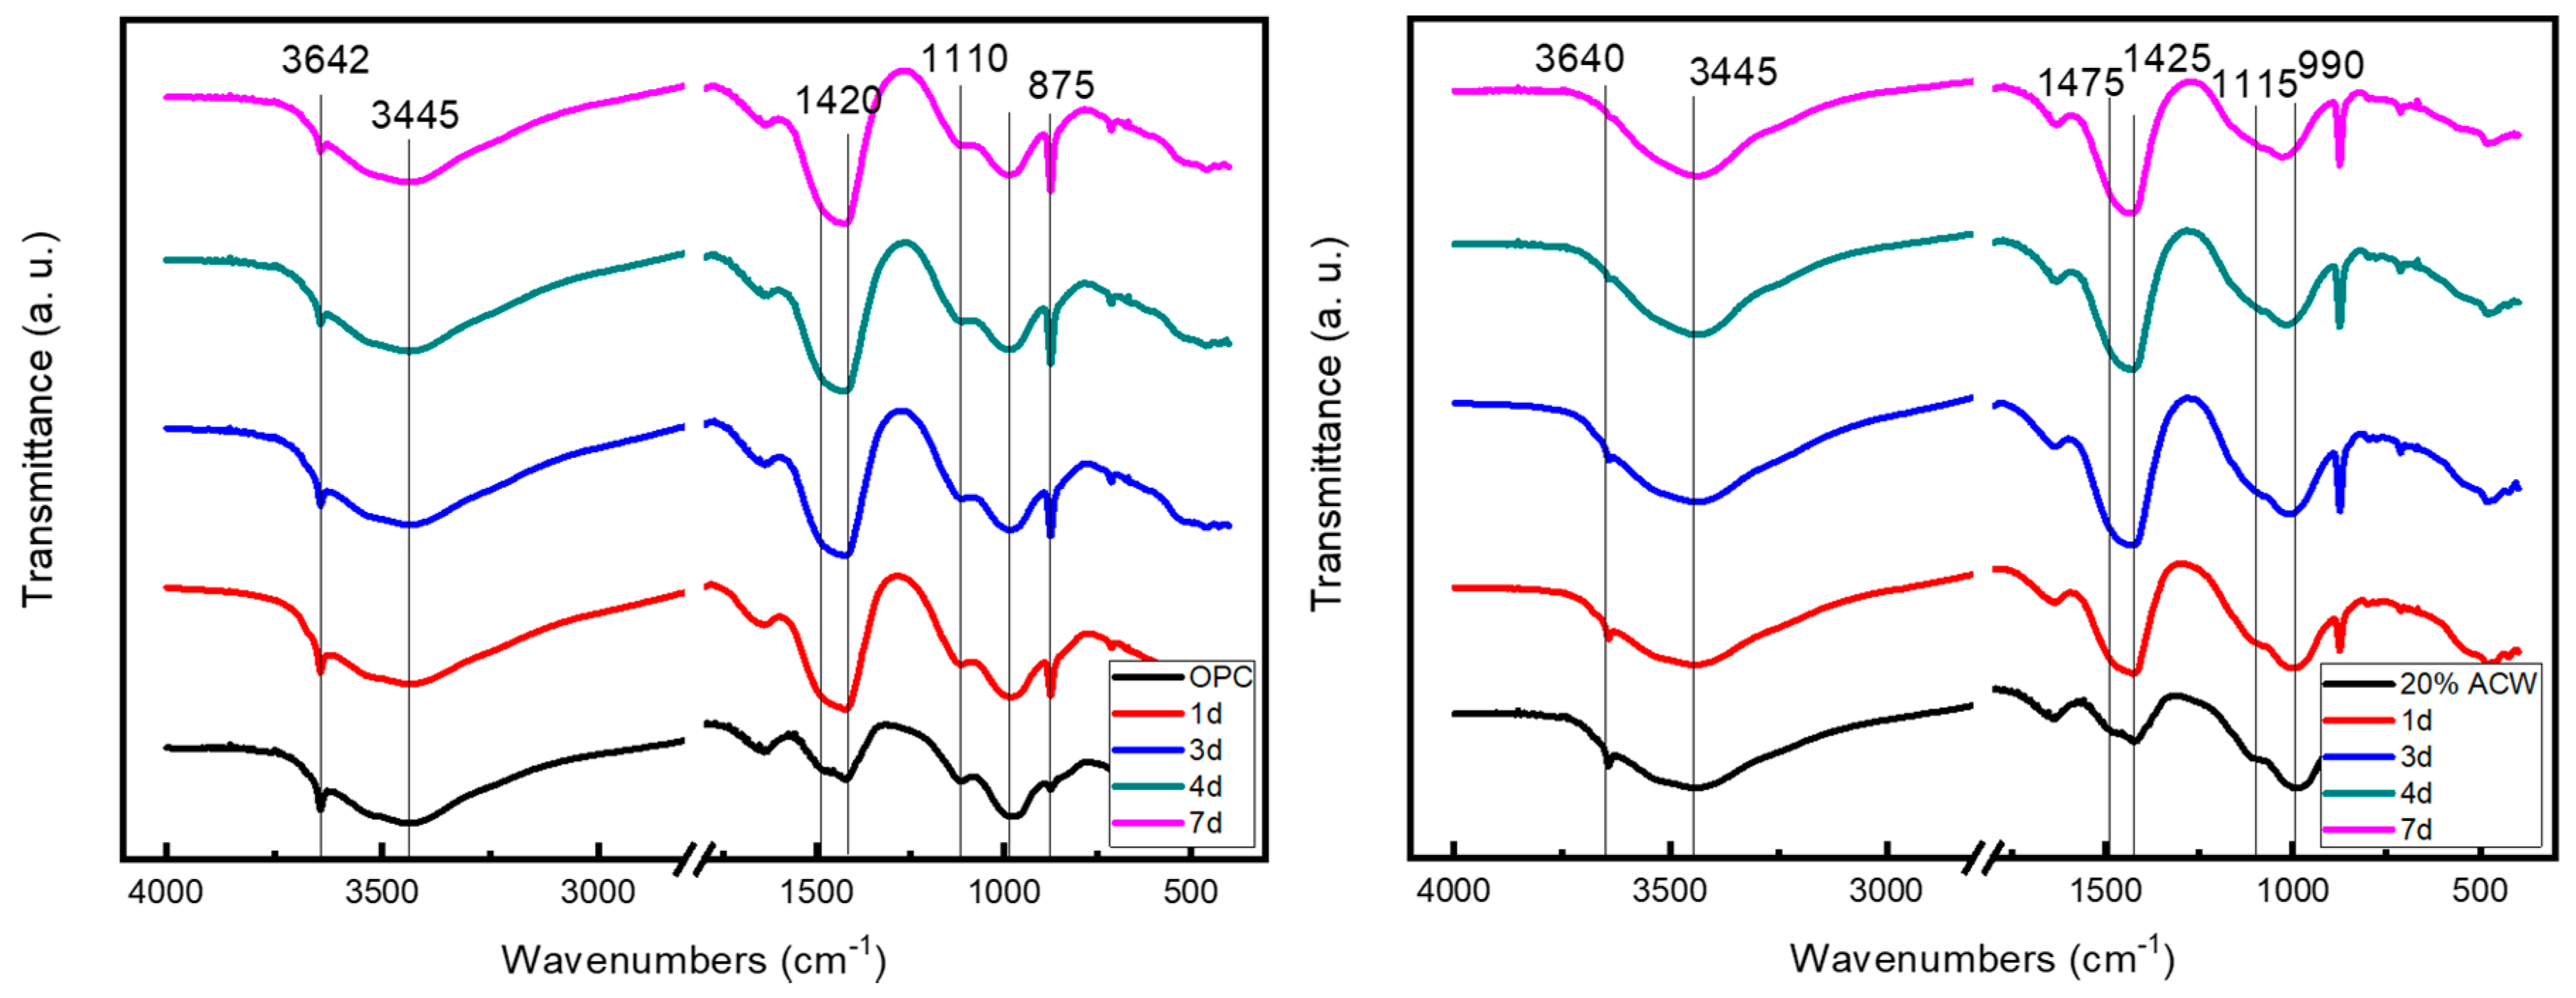
3.3.3. FT-IR and Micro-Raman Findings

The FT-IR spectrum for the non-carbonated OPC specimen exhibited a sharply defined absorption band at 3644 cm−1, denoting the presence of portlandite and/or ettringite; a shoulder at 3520 cm−1, the region corresponding to OH vibrations in aluminates; and a band at 3440 cm−1 associated with OH vibrations in the C-S-H gel. At lower frequencies, an incipient absorption band near 1420 cm−1 was attributable to carbonates. The sulfate bands at 1115 cm−1 (ν S-O) and the Si-O vibration bands at around 975 cm−1 were typical of hydrated OPC paste. The band assigned to portlandite was present through the seventh day of hydration, despite the progressive rise in the intensity of the bands attributed to carbonates (compare to DTG results in Table 5). The FT-IR spectra for the two cement pastes are shown in Figure 9 by time of exposure to CO2.
The O-H bands attributable to portlandite and/or ettringite on the spectrum for the cured, non-carbonated 20% ACW cement were less intense than the analogous bands on the spectrum for OPC paste at t = 0 (which is consistent with the DTG results: Table 6). The S-O vibration-induced absorption band was broader and located at a lower frequency (1100 cm−1) on the 20% ACW than on the OPC paste spectrum. In contrast, the Si-O group absorption band appeared at a higher frequency, around 990 cm−1. This finding may be an indication of C-S-H gel decalcification [46].
The absorption band attributable to the OH present in portlandite and ettringite was less intense on FT-IR spectra for the 1 day OPC and 20% ACW carbonated samples and in general declined proportionally with carbonation time.
The intensity of the bands at around 3520 cm−1 (sh) and 3440 cm−1 also waned with carbonation time. At lower frequencies, a very intense band at around 1420 cm−1 generated by CO32− groups denoted the presence of calcium carbonate, primarily as calcite, although a shoulder at 1470 cm−1 attested to the existence of aragonite. The absorption bands at around 875 cm−1, assigned to calcite, and 850 cm−1, to aragonite, supported this interpretation.
The effect of CO2 on the 20% ACW paste was less straightforward. The OH absorption band at 3644 cm−1 dropped significantly with carbonation time, disappearing altogether from spectrum on day 7. Band intensity at 3520 (cm−1) (sh) and 3440 cm−1 also declined with carbonation time; the shoulder, specifically, was absent from the 4 days spectrum.
As in the OPC samples, intense absorption bands generated by carbonated compounds appeared on the first day of carbonation. Their position (1420 cm−1) was indicative of calcite, an inference supported by the existence of a band at 875 cm−1. Shoulders at 1845 cm−1 and 850 cm−1 denoted the presence of small amounts of aragonite.
The absorption bands at 1100 cm−1 (ν Si-O) and 990 cm−1 (Si-O) clearly varied with carbonation time, respectively shifting to lower (1080 cm−1) and higher (1030 cm−1) frequencies and declining in intensity.
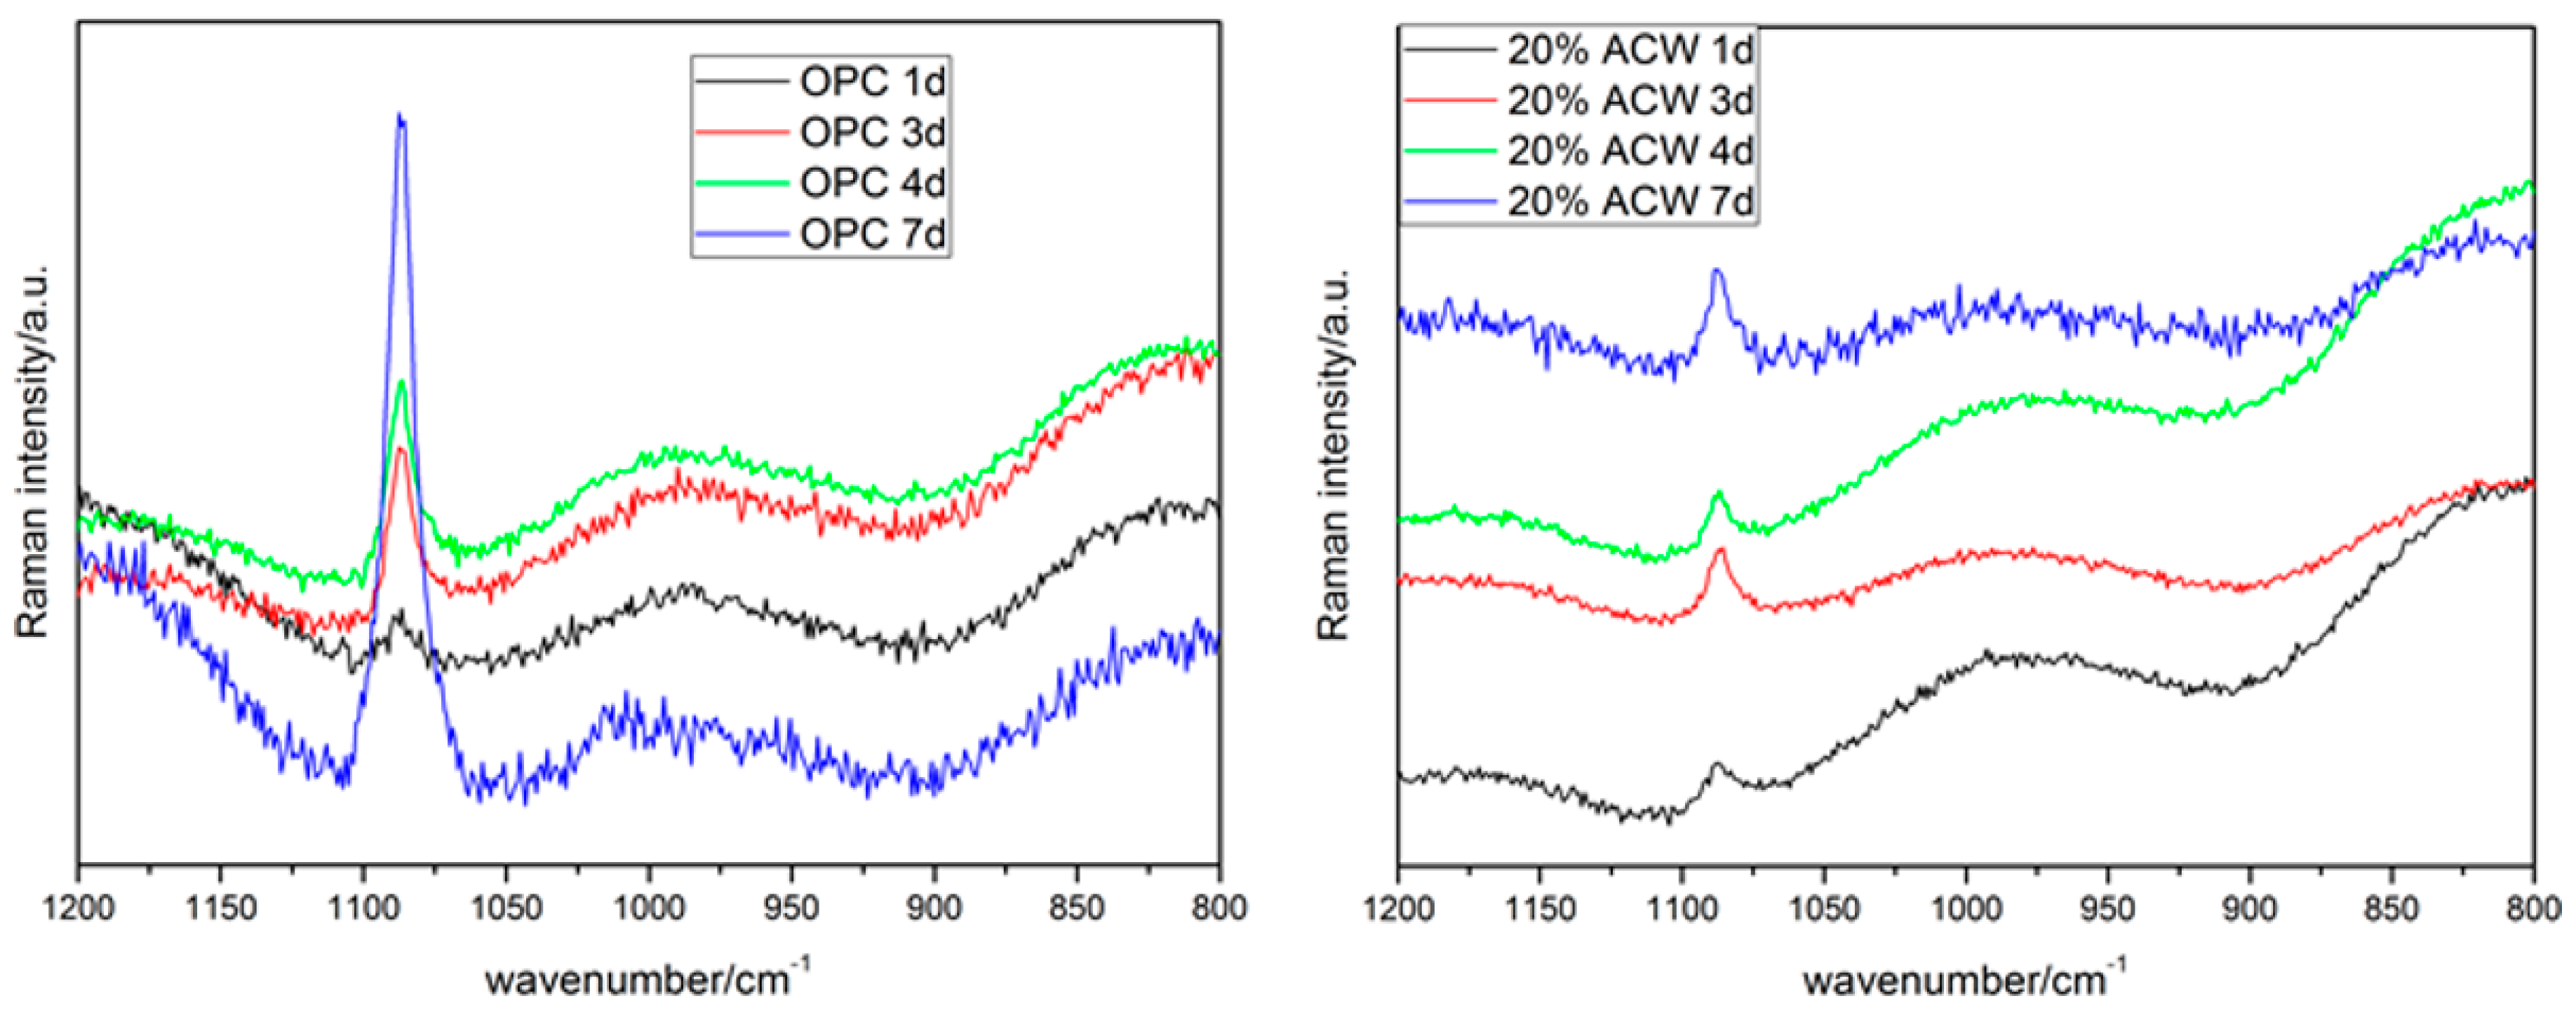
By way of summary, the FT-IR spectra showed that carbonation induced a decline in the portlandite and ettringite bands, an effect that was more visible in the 20% ACW paste. They also confirmed that calcite was the majority carbonation product. That finding was consistent with the micro-Raman results, which identified only the CaCO3 vibration band (ν1 at 1084 cm−1) from calcite and/or aragonite and none of the other phases detected with XRD, such as carboaluminates. Due to the intensity of sample fluorescence, no C-S-H gel signals were observed on these spectra (Figure 10).

3.4. Mechanical Strength and Microporosity

The data in Table 7 denote the fluctuation in cement paste compressive strength. Strength rose with exposure time to CO2 in both the control and the experimental pastes, although their behaviour patterns differed. After 1 day of exposure, the two cements exhibited similar strength values, whereas strength was greater in the 3 days 20% ACW blended cement than in the OPC paste. At longer carbonation times, the contrary was observed; strength was lower in the blended cement paste than in the OPC paste.
The abundance of calcite as the majority reaction product in accelerated carbonation had a heavy impact on mechanical behaviour and microporosity, as shown in Figure 11 where the carbonate content is plotted against compressive strength. Strength in the 20% ACW cement rose linearly with increasing carbonate content, whereas the OPC paste followed an exponential pattern, with strength climbing steeply at carbonate percentages of over 35%. The correlation between the two variables was high for both materials, with R2 values of 0.99 for ACW and 0.79 for OPC.
The increases in strength would be explained by the decline in total porosity (Table 8), which was steeper for the blended paste, and by the drop in the mean pore size (4 V/A) observed in mercury porosimetry tests: from 0.32 µm at t = 0 day to 0.018 µm at t = 7 days in OPC paste and from 0.025 µm at t = 0 day to 0.020 µm at t = 7 days in 20% ACW.
Those findings are related to pore network refinement in the carbonated cement pastes which, as the density curves in Figure 12 show, had no adverse effect on strength.

4. Conclusions

The conclusions drawn from the experimental results are as follows:
  • The results showed that after 7 days of accelerated carbonation the 20% ACW cement paste pH was 11.2, whereas the OPC pastes exhibited a large non-carbonated core (pH = 12.5). The 20% blended pastes carbonated faster than the control.
  • Carbonation lowered the pH of the simulated pore solution, with values on day 7 of 11.2 in 20% ACW and 12.4 in OPC pastes, although neither dipped below the pH that induces depassivation in reinforcing steel (pH < 10).
  • Calcite was the only carbonated crystalline phase detected by XRD, which identified no vaterite or aragonite, typically observed in natural carbonation processes. Traces of aragonite and amorphous phase were detected with FT-IR, however.
  • XRD semi-quantitative analysis showed that the inclusion of 20% activated coal waste in OPC paste hastened decalcification in the hydrated calcium phases identified (some as traces only) after the first 24 h of exposure to accelerated carbonation (100% CO2).
  • Calcite, the final (7 days) majority product of carbonation in both cements, had a 50% higher content in the 20% ACW than in OPC pastes. These findings were confirmed by FT-IR and micro-Raman analysis.
  • The variation in DTG values with exposure time attested to portlandite decalcification while also denoting less intense decalcification in C-S-H gels and C4AH13.
  • Accelerated carbonation induced a rise in compressive strength and pore size refinement in both cement pastes. Strength values in the 20% ACW cement pastes rose linearly with increasing carbonate content, whereas the OPC paste followed an exponential pattern.

Acknowledgments

This research was funded by the Spanish Ministry of Economy and Competitiveness (Project Refs. MAT2012-37005-CO3-01/02/03) and MINECO/FEDER (BIA2015-65558-C3-1/2/3-R). The authors wish to thank the Sociedad Anónima Hullera Vasco-Leonesa (León, Spain), Sika (Madrid, Spain) and the Spanish Cement Institute (IECA) for their support in this research.

Author Contributions

Raquel Vigil and Rosario García analysed the XRD and SEM data; Olga Rodríguez performed the experiments; Lucía Fernández analysed the FT-IR data; Sagrario Martínez analysed the TG/DTA data; Moisés Frías designed the study and wrote the paper.

Conflicts of Interest

The authors declare no conflict of interest.

References

  1. Dong, B.; Qieu, Q.; Gu, Z.; Xiang, J.; Huang, C.; Fang, Y.; Xing, F.; Liu, W. Charactarization of carbonation behaviour of fly ash blended cement materials by the electrochemical impedance spectroscopy. Cem. Concr. Compos. 2016, 65, 118–127. [Google Scholar] [CrossRef]
  2. Mehta, P.K. Mechanism of sulfate attack on Portland cement Concrete-Another look. Cem. Concr. Res. 1983, 13, 401–406. [Google Scholar] [CrossRef]
  3. Medina, G.; Sáez del Bosuqe, I.F.; Frías, M.; Sánchez de Rojas, M.I.; Medina, C. Granite quarry waste as a future eco-efficient supplementary cementititous materials: Scientific and technical considerations. J. Clean. Prod. 2017, 148, 467–476. [Google Scholar] [CrossRef]
  4. Frías, M.; Goñi, S.; García, R.; Vigil, R. Seawater effect on durability of ternary cements. Synergy of chloride and sulphate ions. Compos. Part B Eng. 2013, 46, 173–178. [Google Scholar] [CrossRef]
  5. Bahurudeen, A.; Kanraj, D.; Gokul, V.; Santhanam, M. Performance Evaluation of sugarcane bagasse ash blended cement in concrete. Cem. Concr. Res. 2015, 59, 77–88. [Google Scholar] [CrossRef]
  6. Fausto, P.; Chastre, C.; Numes, A. Carbonation service life modelling of RC structures for concrte with Portland and blended cements. Cem. Concr. Compos. 2013, 37, 171–184. [Google Scholar]
  7. Andrade, C.; Bujak, R. Effect of some mineral additions to Portland cement on reinforcement corrosion. Cem. Concr. Res. 2013, 53, 59–67. [Google Scholar] [CrossRef]
  8. Ahmed, D.A.; Ragai, S.M. Retardation effect and corrosion detection of blended cement pastes. Hous. Build. Natl. Res. Cent. 2013, 9, 22–26. [Google Scholar] [CrossRef]
  9. Medina, C.; Sáez del Bosque, I.F.; Asensio, E.; Frías, M.; Sánchez de Rojas, M.I. New additions for eco-efficient cement design. Impact on calorimetric behaviour and comparison of test methods. Mater. Struct. 2016, 49, 4595–4607. [Google Scholar] [CrossRef]
  10. Vegas, I.; Gaitero, J.J.; Urreta, J.; García, R.; Frías, M. Aging and durability of ternary cements containing fly ash and activated paper sludge. Constr. Build. Mater. 2014, 52, 253–260. [Google Scholar] [CrossRef]
  11. Frías, M.; Vigil, R.; García, R.; de Soto, I.; Medina, C.; Sánchez de Rojas, M.I. Scientific and technical aspects of blended cement matrices containing activated slate wastes. Cem. Concr. Compos. 2014, 48, 19–25. [Google Scholar] [CrossRef]
  12. Goñi, S.; Frías, M.; Vigil, R.; Vegas, I. Decalcification of activated paper sludge-fly ash Portland cement blended pastes in pure water. Cem. Concr. Comp. 2013, 40, 1–6. [Google Scholar] [CrossRef]
  13. Nakanishi, E.; Frías, M.; Santos, S.F.; Rodrigues, M.S.; Vigil, R.; Rodriguez, O.; Savastano, H. Investigating the posible usage of elephant grass ash to manufacture the eco-friendly binary cements. J. Clean. Prod. 2016, 116, 236–243. [Google Scholar] [CrossRef]
  14. Younsi, A.; Turcy, P.; Ait-Mokhtar, A.; Staquet, S. Accelerated carbonation of concrete with high content of mineral additions: Effect of interactions between hydration and drying. Cem. Concr. Res. 2013, 43, 25–33. [Google Scholar] [CrossRef]
  15. Groves, G.W.; Brough, A.; Richardson, I.G.; Dobsont, C.M. Progressive changes in the structure of hardened C3S cement pastes due to carbonation. J. Am. Ceram. Soc. 1991, 74, 2891–2896. [Google Scholar] [CrossRef]
  16. Black, L.; Breen, C.; Yarwood, J. Structural features of CSH (I) and its carbonation in air—A Raman spectroscopy study. Part II: Carbonated phases. J. Am. Ceram. Soc. 2007, 90, 908–917. [Google Scholar] [CrossRef]
  17. Martínez, S.; Fernández, L. Carbonation of ternary cement systems. Constr. Build. Mater. 2012, 27, 313–318. [Google Scholar] [CrossRef]
  18. Tonoli, G.H.D.; Pizzol, V.D.; Urrea, G.; Santos, S.F.; Mendes, L.M.; Santos, V.; John, V.M.; Frías, M.; Savastano, H. Rationalizing the impact of aging on fiber matrix interfase and stability of cement based composites submitted to carbonation at early ages. J. Mater. Sci. 2016, 51, 7929–7943. [Google Scholar] [CrossRef]
  19. Kurdowski, W. Cement and Concrete Chemistry; Springer: London, UK, 2014. [Google Scholar]
  20. Castellote, M.; Fernández, L.; Andrade, C.; Alonso, M.C. Chemical changes and phase analysis of OPC pastes carbonated at different CO2 concentrations. Mater. Struct. 2009, 42, 515–525. [Google Scholar] [CrossRef]
  21. Arandigoyen, M.; Bicer-Simsir, B.; Alvarez, J.I.; Lange, D.A. Variation of microstructure with carbonation in lime and blended pastes. Appl. Surf. Sci. 2006, 252, 7562–7571. [Google Scholar] [CrossRef]
  22. Goñi, S.; Gaztañaga, M.T.; Guerrero, A. Role of cement type on carbonation attack. J. Mater. Res. 2002, 17, 1834–1842. [Google Scholar] [CrossRef]
  23. Xu, A.; Chandra, S.; Rodhhe, M. Influence of alkali on carbonation of concrete. In Third CANMET/ACI International Conference on Durability of Concrete; Malhotra, V.M., Ed.; CANMET/ACI: Nice, France, 1994. [Google Scholar]
  24. Frías, M.; Vigil de la Villa, R.; Sánchez de Rojas, M.I.; Medina, C.; Valdés, A.J. Scientific aspects of kaolinite coal mining wastes in pozzolan/Ca(OH)2 system. J. Am. Ceram. Soc. 2012, 95, 386–391. [Google Scholar] [CrossRef]
  25. Frías, M.; Sánchez de Rojas, M.I.; García, R.; Valdés, A.J.; Medina, C. Effect of activated coal mining wastes on the properties of blended cement. Cem. Concr. Compos. 2012, 34, 678–683. [Google Scholar] [CrossRef]
  26. Frías, M.; Rodriguez, O.; Vigil de la Villa, R.; García, R.; Martínez-Ramírez, S.; Fernández-Carrasco, L.; Vegas, I. The influence of activated coal mining wastes on the mineralogy of blended cement pastes. J. Am. Ceram. Soc. 2016, 99, 300–307. [Google Scholar] [CrossRef]
  27. Vigil de la Villa, R.; Frías, M.; García, R.; Martínez-Ramírez, S.; Fernández-Carrasco, L. Chemical and mineral transformations that occur in mine waste and washery rejects during pre-utilization calcination. Int. J. Coal Geol. 2014, 132, 123–130. [Google Scholar] [CrossRef]
  28. García, R.; Vigil de la Villa, R.; Frías, M.; Rodríguez, O.; Martínez-Ramírez, S.; Fernández-Carrasco, L.; de Soto, I.S.; Villar, E. Mineralogical study of calcined coal waste in a pozzolan/Ca(OH)2 system. Appl. Clay Sci. 2015, 108, 45–54. [Google Scholar] [CrossRef]
  29. García, R.; Vigil de la Villa, R.; Rubio, V.; Frías, M. The transformation of coal mining waste minerals in the pozzolanic reaction of cements. Minerals 2016, 6, 64. [Google Scholar] [CrossRef]
  30. Yague, S.; Sánchez, I.; Vigil de la Villa, R.; García, R.; Zapardial, A.; Frías, M. Coal mining tailings as a pozzolanic material in cements industry. Minerals 2018, 8, 46. [Google Scholar] [CrossRef]
  31. European Commission for Standardization. Cement Part 1: Compositions, Specifications and Conformity Criteria for Common Cement; UNE EN 197-1; Asociacion Espanola de Normalizacion: Madrid, Spain, 2011. [Google Scholar]
  32. Frías, M.; Sánchez de Rojas, M.I.; Medina, C.; Villar, E. New trends for nonconventional cement-based materials: Industrial and agricultural waste. In Sustainable and Nonconventional Contruction Materials Using Inorganic Bonded Fiber Composites; Savstano, H., Fiorelli, J., dos Santos, S.F., Eds.; Woodhead Publishing: Duxford, UK, 2017; pp. 165–184. [Google Scholar]
  33. Spanish Standard Institution. Métodos de ensayo de cementos. Determinación Cuantitativa De Los Componentes; UNE 80216-2010; Asociacion Espanola de Normalizacion: Madrid, Spain, 2010. (In Spanish) [Google Scholar]
  34. Koch, A.; Steinegeer, H. A raspid method for testing the ressitance of cements to sulphate attack. Zem. KalK Gips 1960, 13, 317–324. [Google Scholar]
  35. Spanish Standard Institution. Corrosión En Armaduras: Determinación De La Profundidad De Carbonatación En Hormigones Endurecidos y Puestos En Servicio; UNE 112-011-94; Asociacion Espanola de Normalizacion: Madrid, Spain, 1994. (In Spanish) [Google Scholar]
  36. Rietveld, H.M. A profile refinement method for nuclear and magnetic structures. J. Appl. Crystallogr. 1969, 2, 65–71. [Google Scholar] [CrossRef]
  37. Ruan, C.D.; Ward, C.R. Quantitative X-ray powder diffraction analysis of clay minerals in Australian coals using Rietveld methods. Appl. Clay Sci. 2002, 21, 227–240. [Google Scholar] [CrossRef]
  38. Bai, J.; Wild, S.; Sabir, B.B. Sorptivity and strength of air cured and water cured PC-PFA-MK concrete and sthe influence of binder composition on carbonation depth. Cem. Concr. Res. 2002, 32, 1813–1821. [Google Scholar] [CrossRef]
  39. Sisomphon, K.; Franke, L. Carbonation rates of concretes containing high volume of pozzolanic materials. Cem. Concr. Res. 2007, 37, 1647–1653. [Google Scholar] [CrossRef]
  40. Frías, M.; Goñi, S. Accelerated carbonation effect on behaviour of ternary portland cements. Compos. Part B Eng. 2013, 48, 122–128. [Google Scholar] [CrossRef]
  41. Van Balen, K.; Van Gemert, D. Modelling lime mortar carbonation. Mater. Struct. 1994, 27, 393–398. [Google Scholar] [CrossRef]
  42. Taylor, H.F.W. Cement Chemistry, 2nd ed.; Thomas Telford Publishing: London, UK, 1997. [Google Scholar]
  43. Pizzol, V.D.; Mendes, L.M.; Savastano, H.; Frías, M.; Davila, F.J.; Cobcotto, M.A.; John, V.M.; Tonoli, G.H.D. Mineralogical and microstructural changes promoted by accelerated carbonation and ageing cycles of hybrid fiber cement composites. Constr. Build. Mater. 2014, 68, 750–756. [Google Scholar] [CrossRef]
  44. Fernández, M.; Simons, S.J.R.; Hills, C.D.; Carey, P.J. A review of accelerated carbonation technology in the treatment of cement-based materials and sequestration of CO2. J. Hazard. Mater. 2004, 112, 193–205. [Google Scholar] [CrossRef] [PubMed]
  45. Ngala, V.T.; Page, C.L. Effects of carbonation on pore structure and diffusional properties of hydration cement pastes. Cem. Concr. Res. 1997, 27, 995–1007. [Google Scholar] [CrossRef]
  46. Puertas, F.; Goñi, S.; Hernández, M.S.; Varga, C.; Guerrero, A. Comparative study of accelerated decalcification process among C3S, grey and white cement pastes. Cem. Concr. Compos. 2012, 34, 384–391. [Google Scholar] [CrossRef]
Figure 1. Variation in carbonation front with exposure time.
Minerals 08 00169 g001
Figure 2. Depth of carbonation front vs. square root of exposure time.
Minerals 08 00169 g002
Figure 3. pH vs. square root of exposure time.
Minerals 08 00169 g003
Figure 4. XRD spectra for 0, 1, 3, 4 and 7 days carbonated ordinary Portland cements (OPC) paste.
Minerals 08 00169 g004
Figure 5. XRD spectra for 0, 1, 3, 4 and 7 days carbonated 20% ACW.
Minerals 08 00169 g005
Figure 6. Morphology of compounds in 4 days carbonated OPC paste.
Minerals 08 00169 g006
Figure 7. Morphology of compounds in 4 days carbonated 20% ACW.
Minerals 08 00169 g007
Figure 8. Cumulative fraction carbonated (CFC) content vs. square root of time.
Minerals 08 00169 g008
Figure 9. FT-IR spectra by exposure time for OPC (left) and 20% ACW (right) pastes.
Minerals 08 00169 g009
Figure 10. Raman spectra by exposure time for OPC (left) and 20% ACW (right) pastes.
Minerals 08 00169 g010
Figure 11. Carbonate content vs. compressive strength.
Minerals 08 00169 g011
Figure 12. Density curves by exposure time.
Minerals 08 00169 g012
Table 1. Chemical composition of starting materials.
Majority Oxides (%)
SampleSiO2Al2O3Fe2O3CaOK2OTiO2MgOSO3Na2OP2O5MnOLOI
OPC21.226.393.1961.381.670.171.970.420.870.200.042.49
ACW52.6325.294.644.203.091.170.770.270.170.140.083.09
Minor Elements (ppm)
SampleCuNiCrVZnPbClCoFSrYMoAs
OPC11776149543614237199293926--
ACW-652101622544624---212
Table 2. Rietveld-refined mineralogical composition of crystalline phases.
Mineral (%)CWACW
Mica2520
Quartz2935
Kaolinite14-
Calcite1510
C4AF--
Bassanite--
C3A--
C3S--
C2S--
Amorphous M1735
X25.76.9
Total100100
X2: Weighted profile R factor.
Table 3. Rietveld-refined mineralogical composition of 28 days cured OPC paste by time of exposure to accelerated carbonation.
Mineral (%)OPC1 Day3 Days4 Days7 Days
C3S1----
C2S1715111111
C4AcH121410999
C4AH1375222
C3A.3SO4Ca.H321513888
Ca(OH)2259888
CaCO31142565656
Amorphous M106666
X27.66.87.37.37.3
Total100100100100100
Table 4. Rietveld-refined mineralogical composition of 28 days cured 20% ACW by time of exposure to accelerated carbonation.
Mineral (%)20% ACW1 Day3 Days4 Days7 Days
C2S7732-
Mica3----
SiO299999
C4AcH121132--
C4AH1320943-
C3A.3SO4Ca.H32910421
Ca(OH)22351--
CaCO3945657381
Amorphous M91212119
X24.56.87.28.46.3
Total100100100100100
Table 5. EDX chemical analysis of the hydrated phases.
Oxide (%)C-S-H GelEttringiteCaCO3
Na2O0.94 ± 0.27--
MgO1.88 ± 0.52--
Al2O33.97 ± 0.8925.76 ± 2.68-
SiO231.54 ± 1.275.35 ± 1.39-
SO31.10 ± 0.5510.07 ± 0.96-
CaO59.65 ± 2.3158.82 ± 2.12100
Fe2O30.92 ± 0.24--
Table 6. Thermogravimetric findings on compounds in cement (%).
CementTime (Days)Ca(OH)2CaCO3Cumulative Fraction Carbonated (CFC)Comb. Water
OPC026.34 9.40 0.09 20.51
116.00 26.37 0.24 19.67
314.40 34.73 0.32 20.31
413.86 43.11 0.39 20.06
712.44 43.79 0.40 19.82
20% ACW015.75 9.33 0.10 21.04
113.69 24.76 0.28 18.97
311.14 42.41 0.48 18.09
46.26 47.59 0.53 18.34
70.53 59.61 0.67 18.18
Table 7. Compressive strength (MPa) in 0–7 days carbonated cement pastes.
0 Day1 Day3 Days4 Days7 Days
OPC52.4 (1.1)53.5 (4.55)55 (3.6)70.8 (5.1)85.2 (2.9)
20% ACW50.6 (1.5)52.3 (3.8)65.6 (4.4)66.4 (3.5)77.2 (5.0)
Table 8. Total porosity (%) in OPC and 20% ACW pastes by carbonation age.
0 Day1 Day3 Days4 Days7 Days
OPC21.217.1815.1714.2512.48
20% ACW23.2218.3316.9414.5512.84

