Article

Breakage Function for HPGR: Mineral and Mechanical Characterization of Tantalum and Tungsten Ores

1
Departament d’Enginyeria Minera, Industrial i TIC, Universitat Politècnica de Catalunya Barcelona Tech, Av. Bases de Manresa 61–63, Manresa, 08242 Barcelona, Spain
2
Departament de Mineralogia, Petrologia i Geologia Aplicada, Universitat de Barcelona, C/Martí i Franquès s/n., 08028 Barcelona, Spain
*
Author to whom correspondence should be addressed.
Minerals 2018, 8(4), 170; https://doi.org/10.3390/min8040170
Submission received: 1 March 2018 / Revised: 13 April 2018 / Accepted: 17 April 2018 / Published: 20 April 2018
(This article belongs to the Special Issue Process Mineralogy of Critical Metals)

Abstract

:
The modelling of high pressure grinding rolls is described by the population balance model, a mass balance which includes several functions that are related to the mineral characteristics, material kinetics and operative conditions of the device. The breakage distribution function is one of these functions and refers to the way in which the daughter particles are generated by the process of comminution. The piston-die press is presented as a methodology to determine the breakage distribution function of two different materials, from the mechanical response point of view: altered granite and a cal-silicate material. The aim is to determine the relation between the operative conditions and the mineral characteristics in order to explain and predict the breakage function parameters. The materials were characterised using XRD and single compression strength tests. The altered granite is a brittle material, which generates more fines under single compression conditions compared to bed compression conditions, mainly due to the mineral composition and the response of the material to the breakage action. The cal-silicate material shows a normal trend in its breakage behaviour. As is expected, the mineralogical characterisation is a useful tool to predict the values of the parameters of the breakage distribution function.

Graphical Abstract

1. Introduction

Comminution processes are mainly described on the widespread population balance model (PBM), in which particles are transformed from different parent size ranges into smaller daughter particles. The mass balance with a resulting size reduction includes several functions as the specific rate of breakage, selection function and breakage distribution function [1]. When the process is carried out in a so called comminution reactor such as a ball or rod mill, the solution to the PBM approach implies several assumptions, e.g., that a perfect mixed mill is employed, in which all material that enter to the device are milled immediately, and that the product has the same characteristics as the pulp inside [2]. However, the piston flow approach seems to be more realistic [3] because the material is progressively broken down as it passes through the reactor.
The PBM is also applied in other types of grinding devices, such as crushers and high pressure grinding rolls (HPGR) [4]. The HPGR is considered as a mill or crusher, depending on the flowsheet needs or the nature of the material. The mass balance in this type of comminution device is simple, requiring only a breakage function and a selection function to describe it. Nevertheless, all models include a material properties description function, which is the denominated distribution breakage function. Authors in [5,6] present the PBM criteria for HPGR as two differentiated processes, with a pre-crushing zone followed by a bed compression zone. In the pre-crushing zone, particles large enough to be nipped are individually crushed due to roll compression, usually in two directions of the plane. This sub-process is defined as single compression. The bed compression zone is constituted as a pack of multi-granular particles being compressed by the horizontal forces produced by the rolls. The pressure on the material is applied from all directions of the space. It should be noted that the same breakage distribution function is also used, with the same parameters for both sub-processes.
A widespread tendency in modelling is to adjust the parameters of these functions with experimental results [6]. Unlike in mills, where there are experimental methodologies to find and scale-up the breakage and kinetic functions [7,8,9], there is not a single methodology to determine the function parameters for processes using HPGR. Some authors used a piston compression test to study the breakage behaviour under a pressure environment [10,11]. Meanwhile, Tavares [12] used an ultra-fast load cell to determine the particle fracture energy. Further studies on single particle crushing, energy input required for crushing a single grain and crack generation modelling have been performed [13].
The hypothesis that the breakage distribution function is not parent size-dependant, which means it could be normalised by the typical Austin and Luckie [8] form, implies that this function characterises the material itself [14]. Thus, its rupture should not depend on the process to which it is subjected, and in that case, the function should have the same values for both single compression and bed compression. However, comminution in HPGR takes place as a compression effect instead of an effect of impact and abrasion, as it occurs in tumbling mills. Therefore, the way in which the particles are broken can be differentiated [15], since in single compression, two contact points are needed, while during the bed compression action the particles are confined in a material-pack, where multiples crushing spots act together. Another difference is that the phenomenon of comminution in a HPGR is independent of the residence time; it is instantaneous, and so the duration of the material in the reactor is irrelevant to the grinding process. However, it may, for capacity purposes, be affected by the rotational speed of the rolls which generates a surface velocity and subsequently varying the process throughput.
The breakage of particle correlates well with the characteristics of their grains, such as size, shape, and mineralogy [16]. However, in terms of mineral characteristics, only a few studies have described this breakage distribution function in terms of its qualitative or quantitative relationships with the mineralogy of a given material [17,18], in which the breakage parameters in different minerals are established. However, not only the type of mineral has an influence, but also textures play a valuable role in the breakage results [19]. The components of the function are defined as a coarse or fine phase generator, mainly related to the grade of each material of interest and the fracture mechanism such as cleavage, shatter, abrasion or shipping [2,20]. All minerals have a characteristic response to external forces; as such the mechanical behaviour of ores should be closely related to their mineralogy.
This work investigates the breakage distribution function, as well as its dependency on the operative conditions and mineralogy of the material. Different methodologies to determine the function parameters are presented as the basis to model the particle size distribution predication in a high-pressure environment. These values can be used for the current HPGR models.

2. Materials and Methods

2.1. Materials

Two different lithologies were used for piston tests. One of them is a tantalum ore, constituted by altered granite obtained directly from the exploitation front of a Sn, Ta mine located in the north-west of Spain. The other one is a calc-silicate scheelite ore from a tungsten underground mine in Austria. The main reason for using these different samples is to test materials of different natures, from the mechanical response outlook. The comparison of materials of varied mineralogical composition allows us to generate a generic model of the rupture behaviour according to the particularities of each material. The texture of the minerals can also indicate a mechanical response to and external force relevant to their rupture.

2.2. Mineral Characterization

The mineralogy of different samples from the piston die test product were determined so as to observe the link between size range and composition, in order to establish a relation between the mechanical responses of the tested material and the mineral characteristics.
The mineralogy of the samples was determined by X-ray powder diffraction (XRD). The spectra were measured from powdered samples in a Bragg-Brentano PANAnalyticalX’Pert Diffractometer system located at the Centres Cientifics I Tecnològics de la Universitat de Barcelona, Barcelona, Spain (graphite mono-chromator, automatic gap, Kα-radiation of Cu at λ = 1.54061 Å, powered at 45 kV and 40 mA, scanning range 4–100° with a 0.017° 2θ step scan and a 50 s measuring time). Identification and semi-quantitative evaluation of phases was made on PANanalyticalX’Pert High-Score software.
Textures were observed by optical and electronic microscopy. The equipment was a Hitachi 1000 tabletop electron microscope with an energy-dispersive X-ray spectrometer (EDS) provided by the Hitachi company. This equipment is located at the Departament d’Enginyeria Minera, Industrial I TIC, Universitat Politècnica de Catalunya, Barcelona, Spain. The semi-quantitative determination was based on the Rietvel method [21].

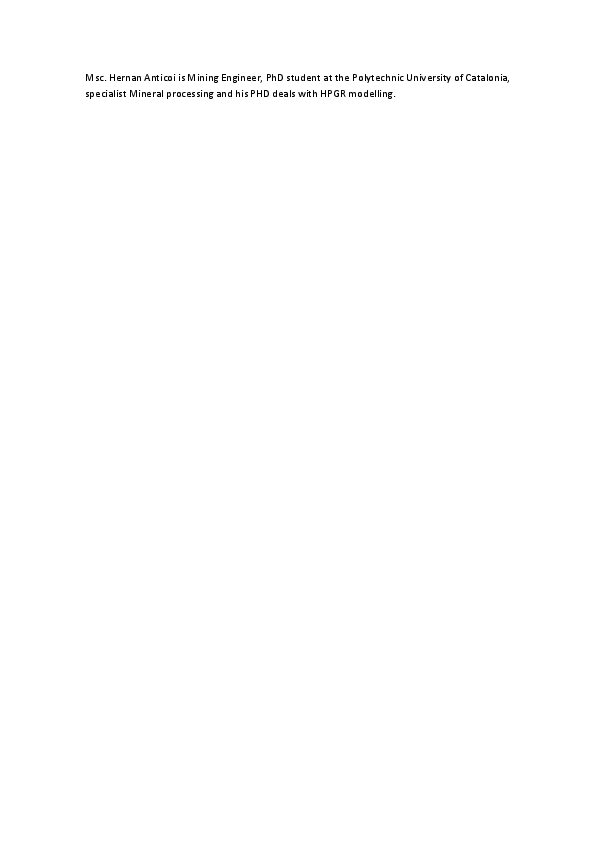
2.3. Piston Press Test

The comminution in rolls pressure environment mainly occurs in compression conditions. Thus, the breakage function should be related to the mechanical response of the material under pressurised conditions. It is also relevant to test the samples in two different operative forms; single compression and bed compression.
Samples were compressed using a hydraulic piston die which runs in a pressure range of 0–12 tonnes. The force was applied on a surface that corresponds to a 40-mm diameter piston (Figure 1). For the single compression test, the particle was placed under pressure at two or few contact points between piston’s surface. Thus, different mono-sizes particles were used. Each particle was placed one to one inside the piston chamber (Table 1), where a force was applied progressively up to reaching a first fracture, indicated by the abrupt fall of the hydraulic oil pressure gauge. The quantity of particles used for the test is presented as a total mass in grams, and represents the moment when the trend of the rupture function stabilizes, so that no more material is needed to obtain this function. For each test carried out under single compression, about 400 particles were used. For the bed compression test, the particles were confined in the piston chamber with several inter-contact points between the particles and the piston surface. For this reason, a set of mono-size particles ranging from 0.71 to 4.8 mm were used in the bed compression configuration (Table 1). Based on the lab-test work in which the HPGR was set with a specific pressure around 0.9 N/mm2, bed compression tests were performed with the same pressure range.
The comminuited material was sieved and the cumulative particle size distribution was plotted against the relative size reduction ratio dpi/dpj, where dpi is the daughter particle and dpj is the parent particle. The plotted points were normalised in order to determine the breakage function parameters using the referenced Equations (1) and (2) [2]. The hypothesis presented in this work indicates the differences in breakage function parameters values depending on operative conditions. Thus, to compare single and bed compression distribution, two tests with same particle top-size were conducted in both conditions.
B i j = k ( d p i d p j ) n 1 + ( 1 k ) ( d p i d p j ) n 2                    for   d p i y 0
B i j = k ( d p i Y 0 ) n 3 ( d p i d p j ) n 1 + ( 1 k ) ( d p i d p j ) n 2       for   d p i < y 0
where Y0 is the largest chip size which must be smaller than the parent size dpj. It usually takes values of 0.05 m to achieve the ball mill breakage function [2].

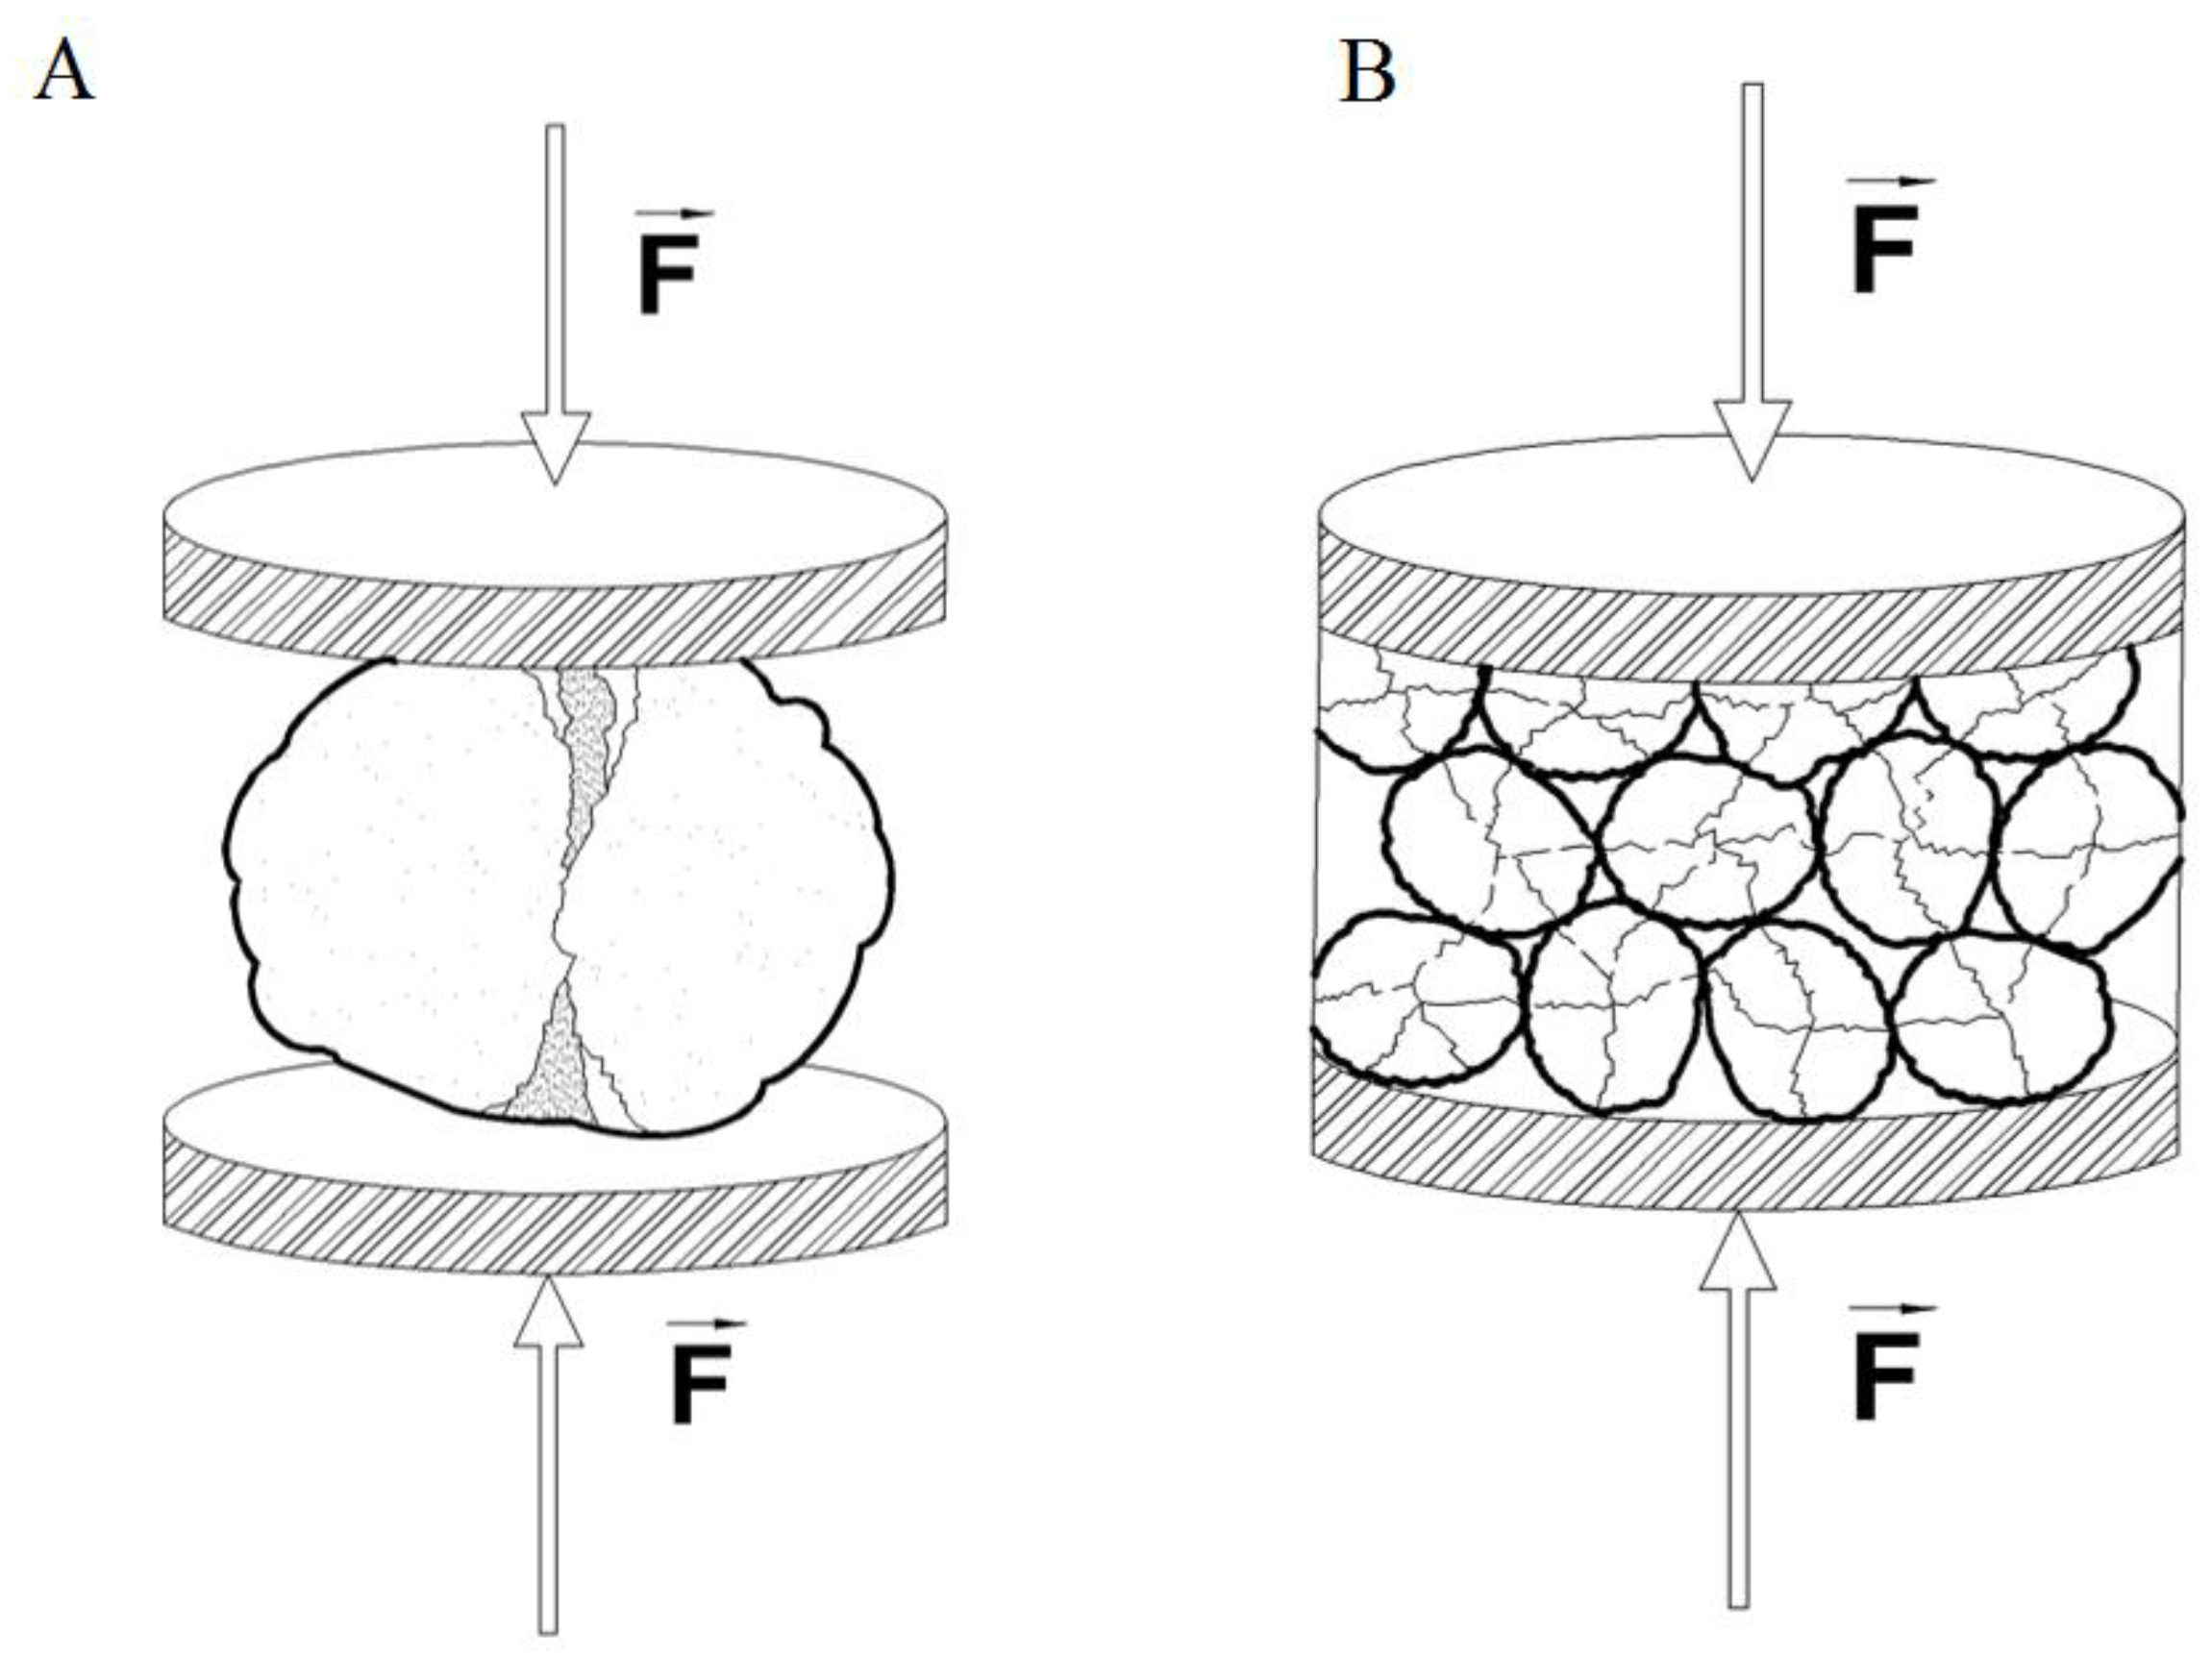
2.4. Single Compression Strength Tests

The accurate identification of certain parameters is quite difficult mainly due the heterogeneous nature of the raw materials. The simple compression strength is one of these mechanical parameters, where the standard test is commonly used for geo-mechanical purposes. In this case, it provides us an overview of the degree of fragility of the material, and allows the quantification of this property in relation to the fracture parameters. The test was conducted according to the standard UNE-EN 1926 [22] method. The results are compared with the referenced values for the studied material.

2.5. Back-Calculation

For fitting the parameters, a generic objective function is usually designed. The objective function measured the agreement between the data and the model with particular selected parameters. The parameters of the model were then adjusted to achieve a minimum in the objective function, yielding the best-fit parameters. The adjustment process is, thus, a problem in minimisation in many dimensions. The objective function used to find the solution of the set of parameters is also employed to minimise the root mean square error (RMSE):
R M S E = 1 N i = 1 N ( p i y i ) 2
where N is the length of the input vector and p is the experimental values of the vector.
The breakage distribution function has several boundary conditions. These restrictions are related to the function parameters (Equation (4)).
0 < k < 1
0 < n 1 < n 2
All values are dimensionless; the value n1 usually reaches a maxim value of 1.5 and n2 of 6.

3. Results

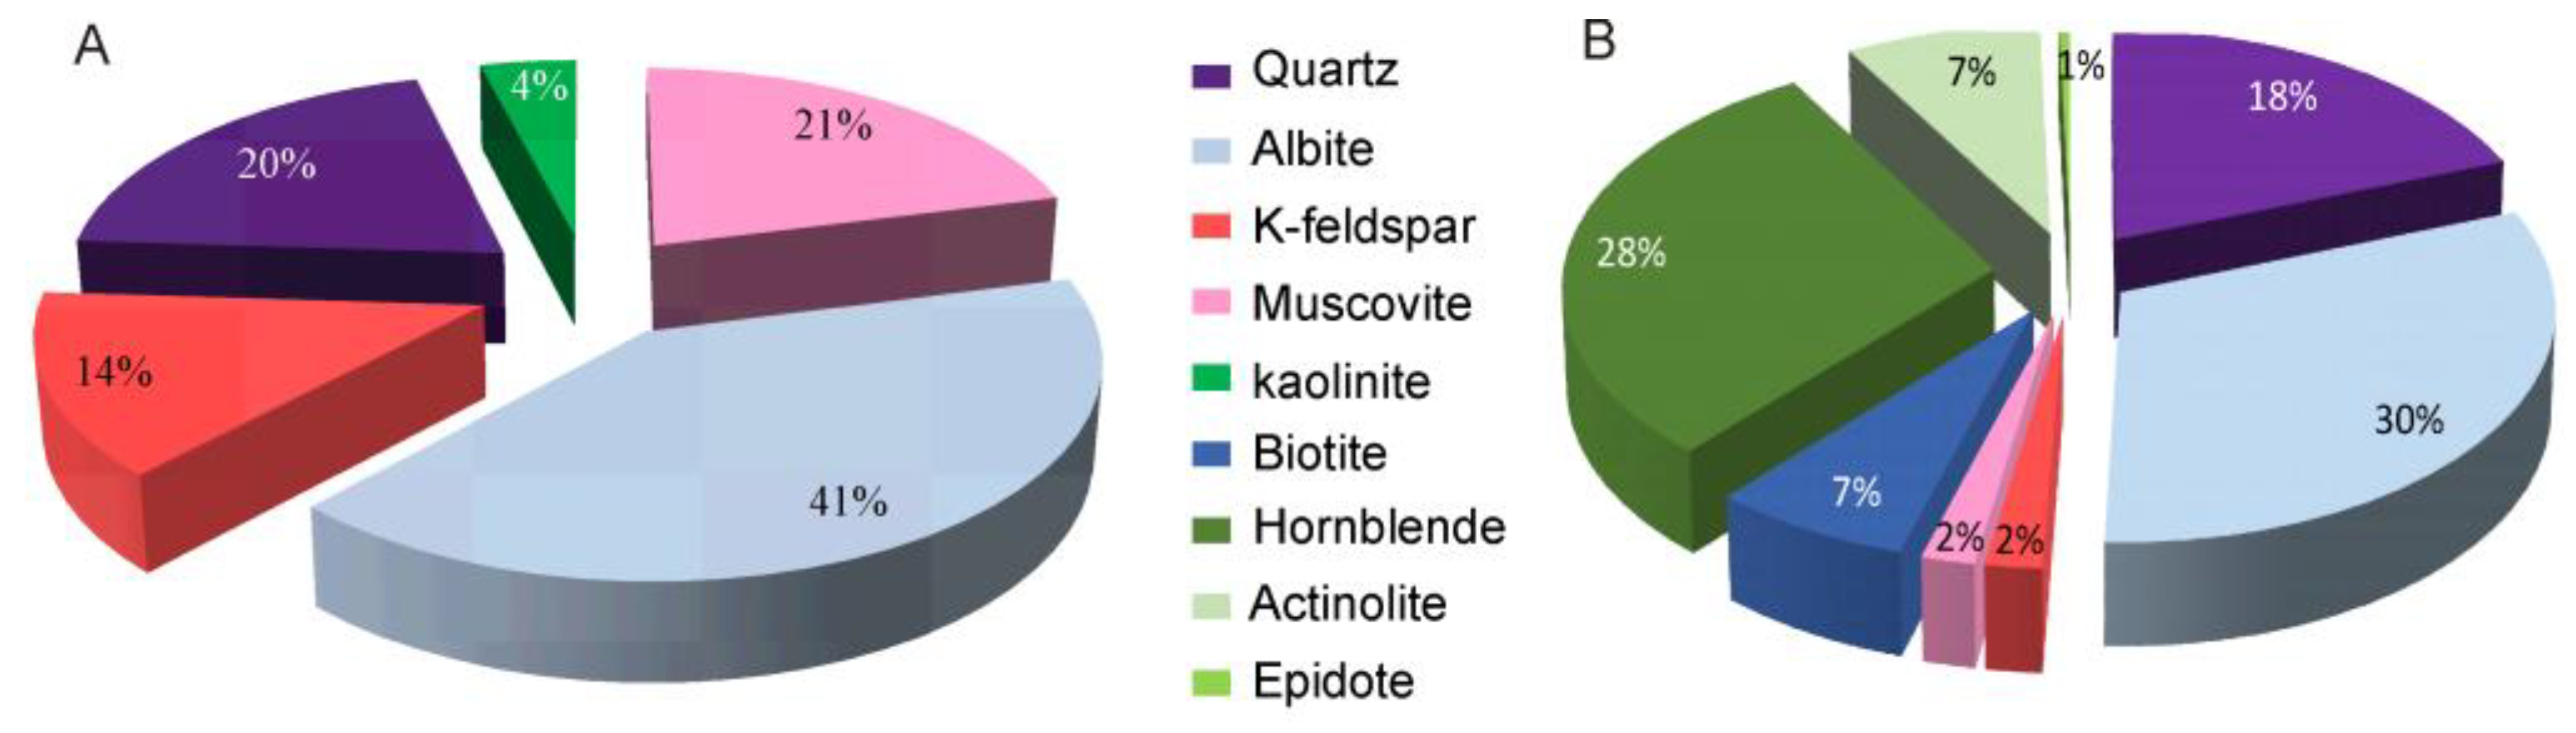
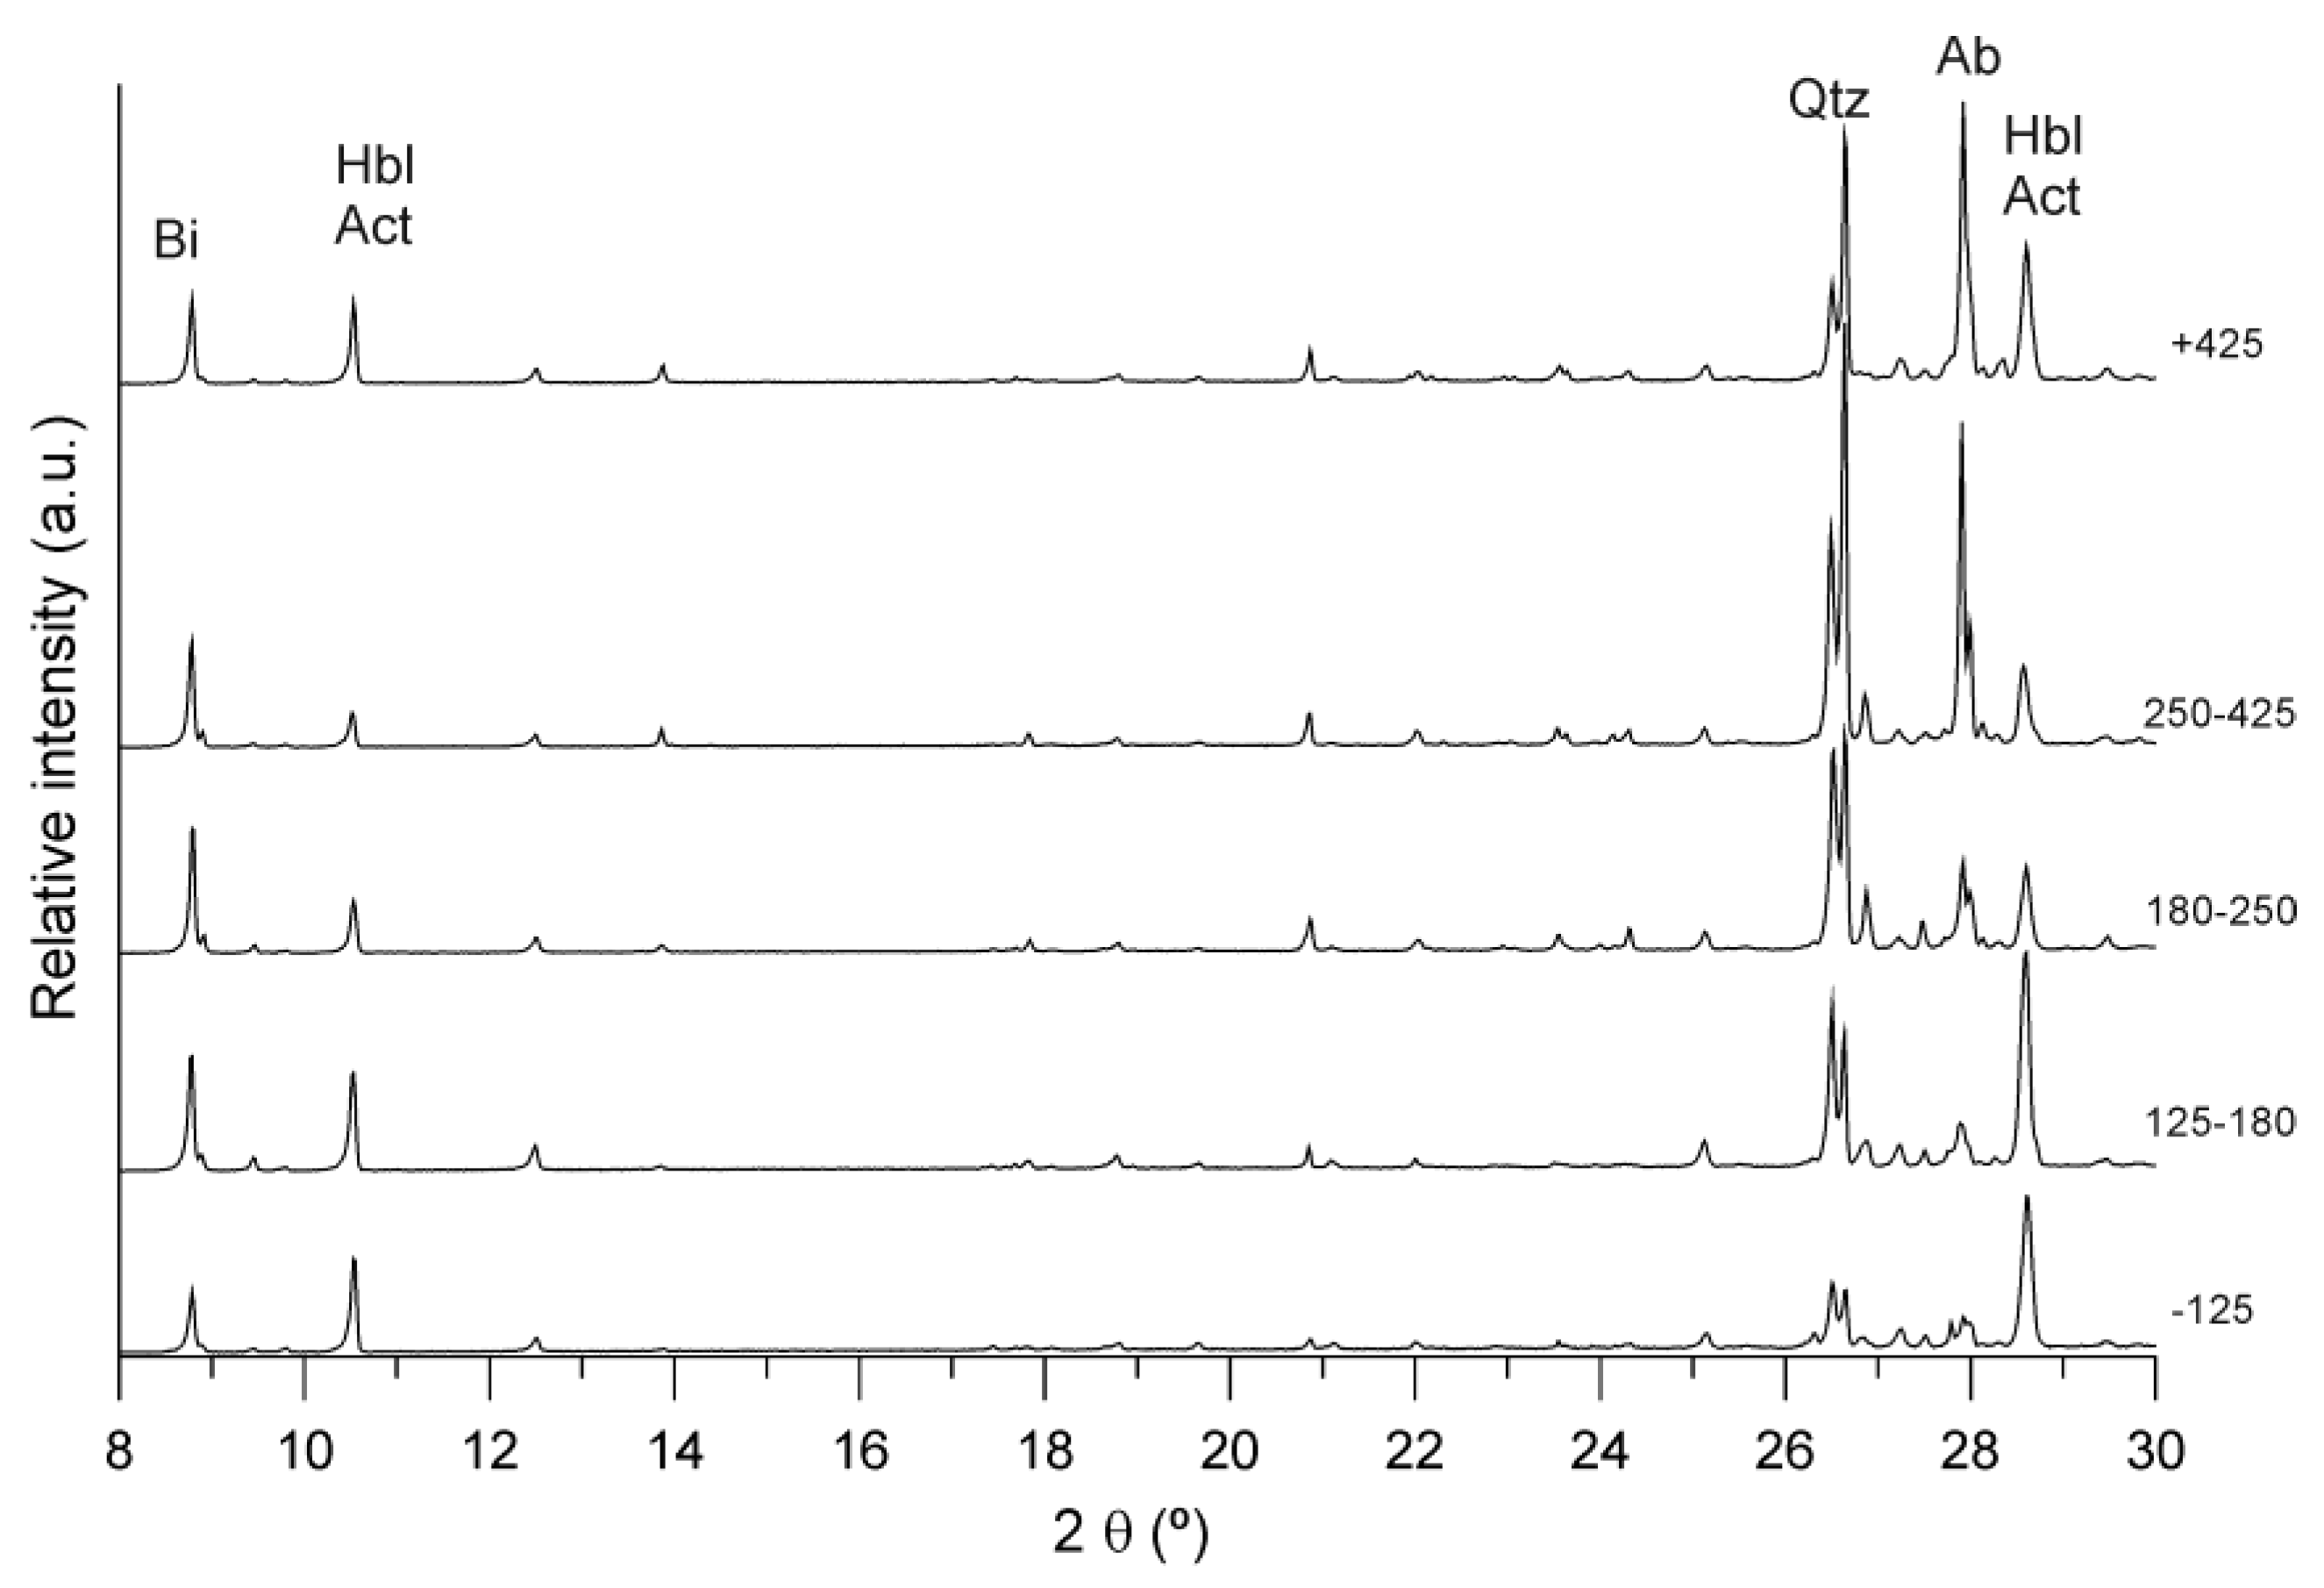
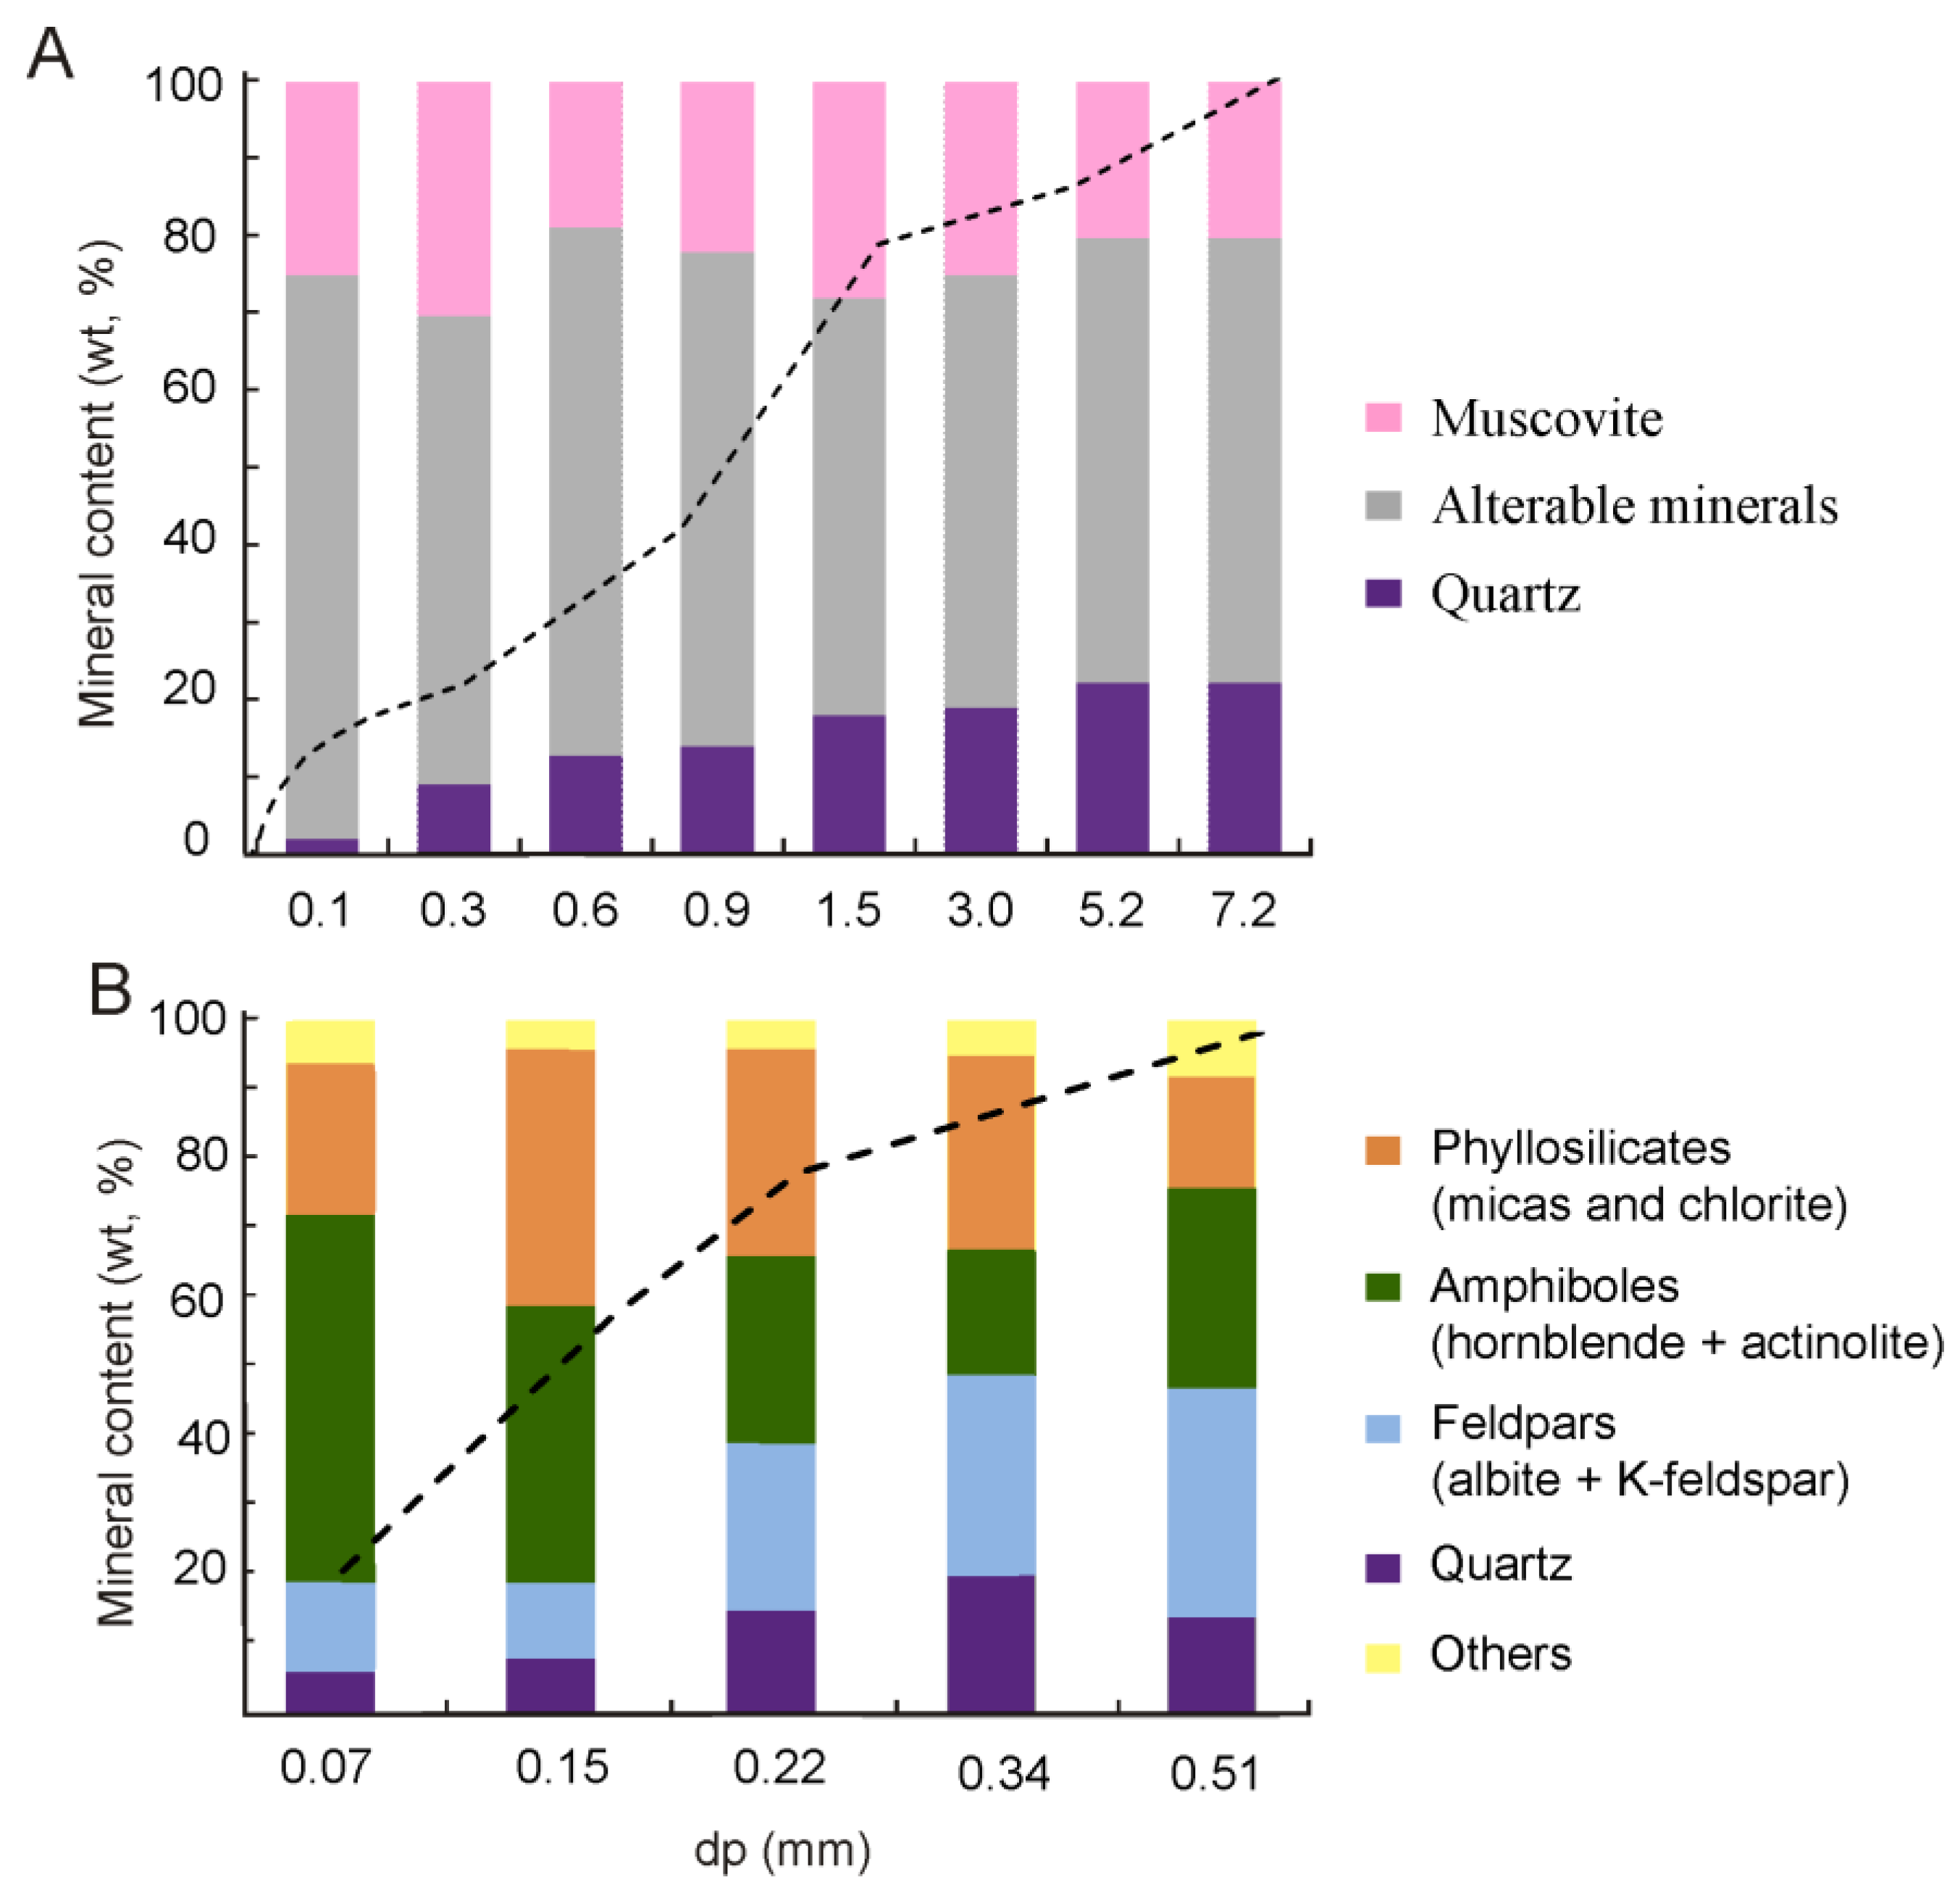
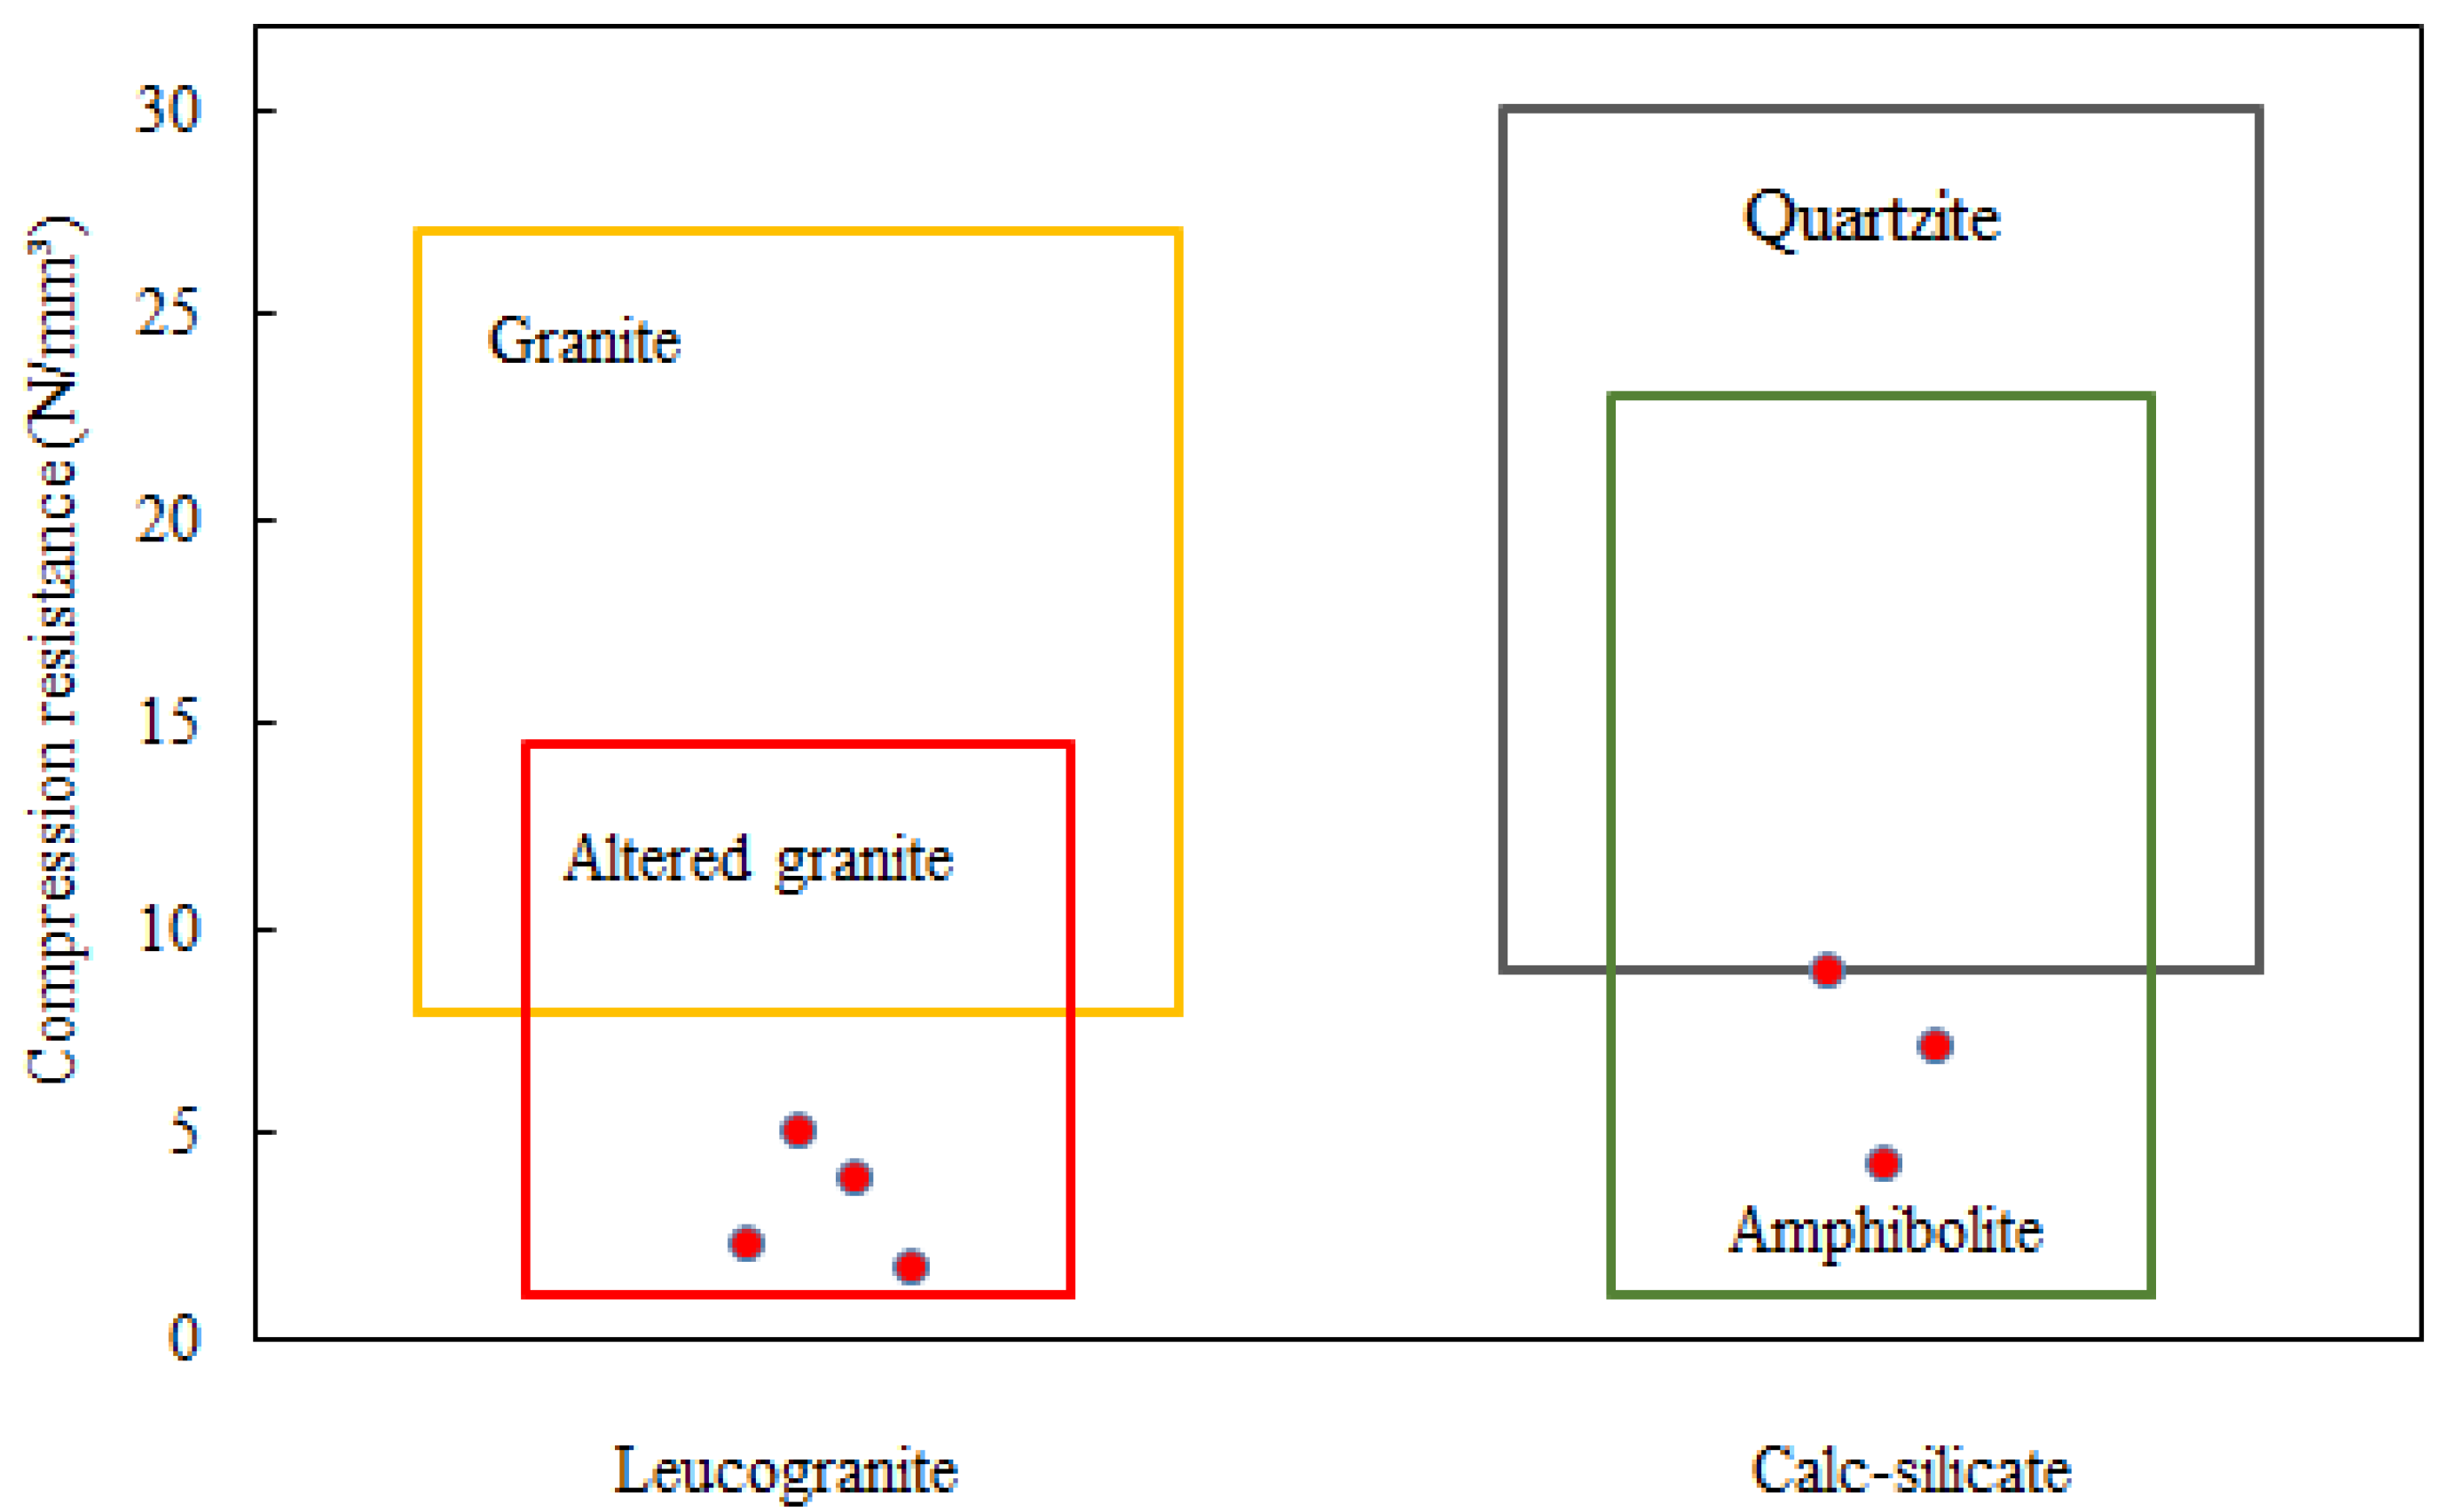
3.1. Mineralogical Characteristics

The mineralogy of the tantalum ore was presented in References [23,24]. The altered granite host of the tantalum ore is mainly constituted by quartz, albite, K-feldspar (microcline), muscovite and kaolinite. The ore minerals are cassiterite and columbite-group minerals, with minor microlite and wodginite contents. Regarding its texture, remarkable sized quartz grains of 1 mm and even 3 mm diameters were found surrounded by a matrix of micas and the altered feldspars (Figure 2). Quartz was also found in fine gains (fewer than 500 µm) but its content was less than that observed in the large grains. The quantitative composition of the minerals present indicated the high content of easily alterable minerals, such as albite and the occurrence of kaolinite, which represents the altered product (Figure 3).
The calc-silicate ore is an amphibolite rock mainly composed of quartz, plagioclase of albite type, hornblende, actinolite, K-feldspar, and biotite, as well as muscovite and epidote in minor amounts. The ore is scheelita with about 2000 ppm W.
From the mechanical point of view, some considerations about the mineralogy are necessary. Quartz is the only major mineral from both tested materials that is resistant to alteration. It also has the highest hardness (7 in the Mohs scale). Plagioclase and K-feldspar (Mohs hardness 6) can be easily altered to sericite and kaolinite, as occurs in the granite tested ore, whereas in the calc-silicate ore plagioclase appears without alteration.
Biotite and muscovite (hardness 2–2.5) are micas with a sheet structure and perfect cleavage. Hornblende and actinolite (hardness 5–6) are amphiboles of columnar habit and cleavage in two directions.

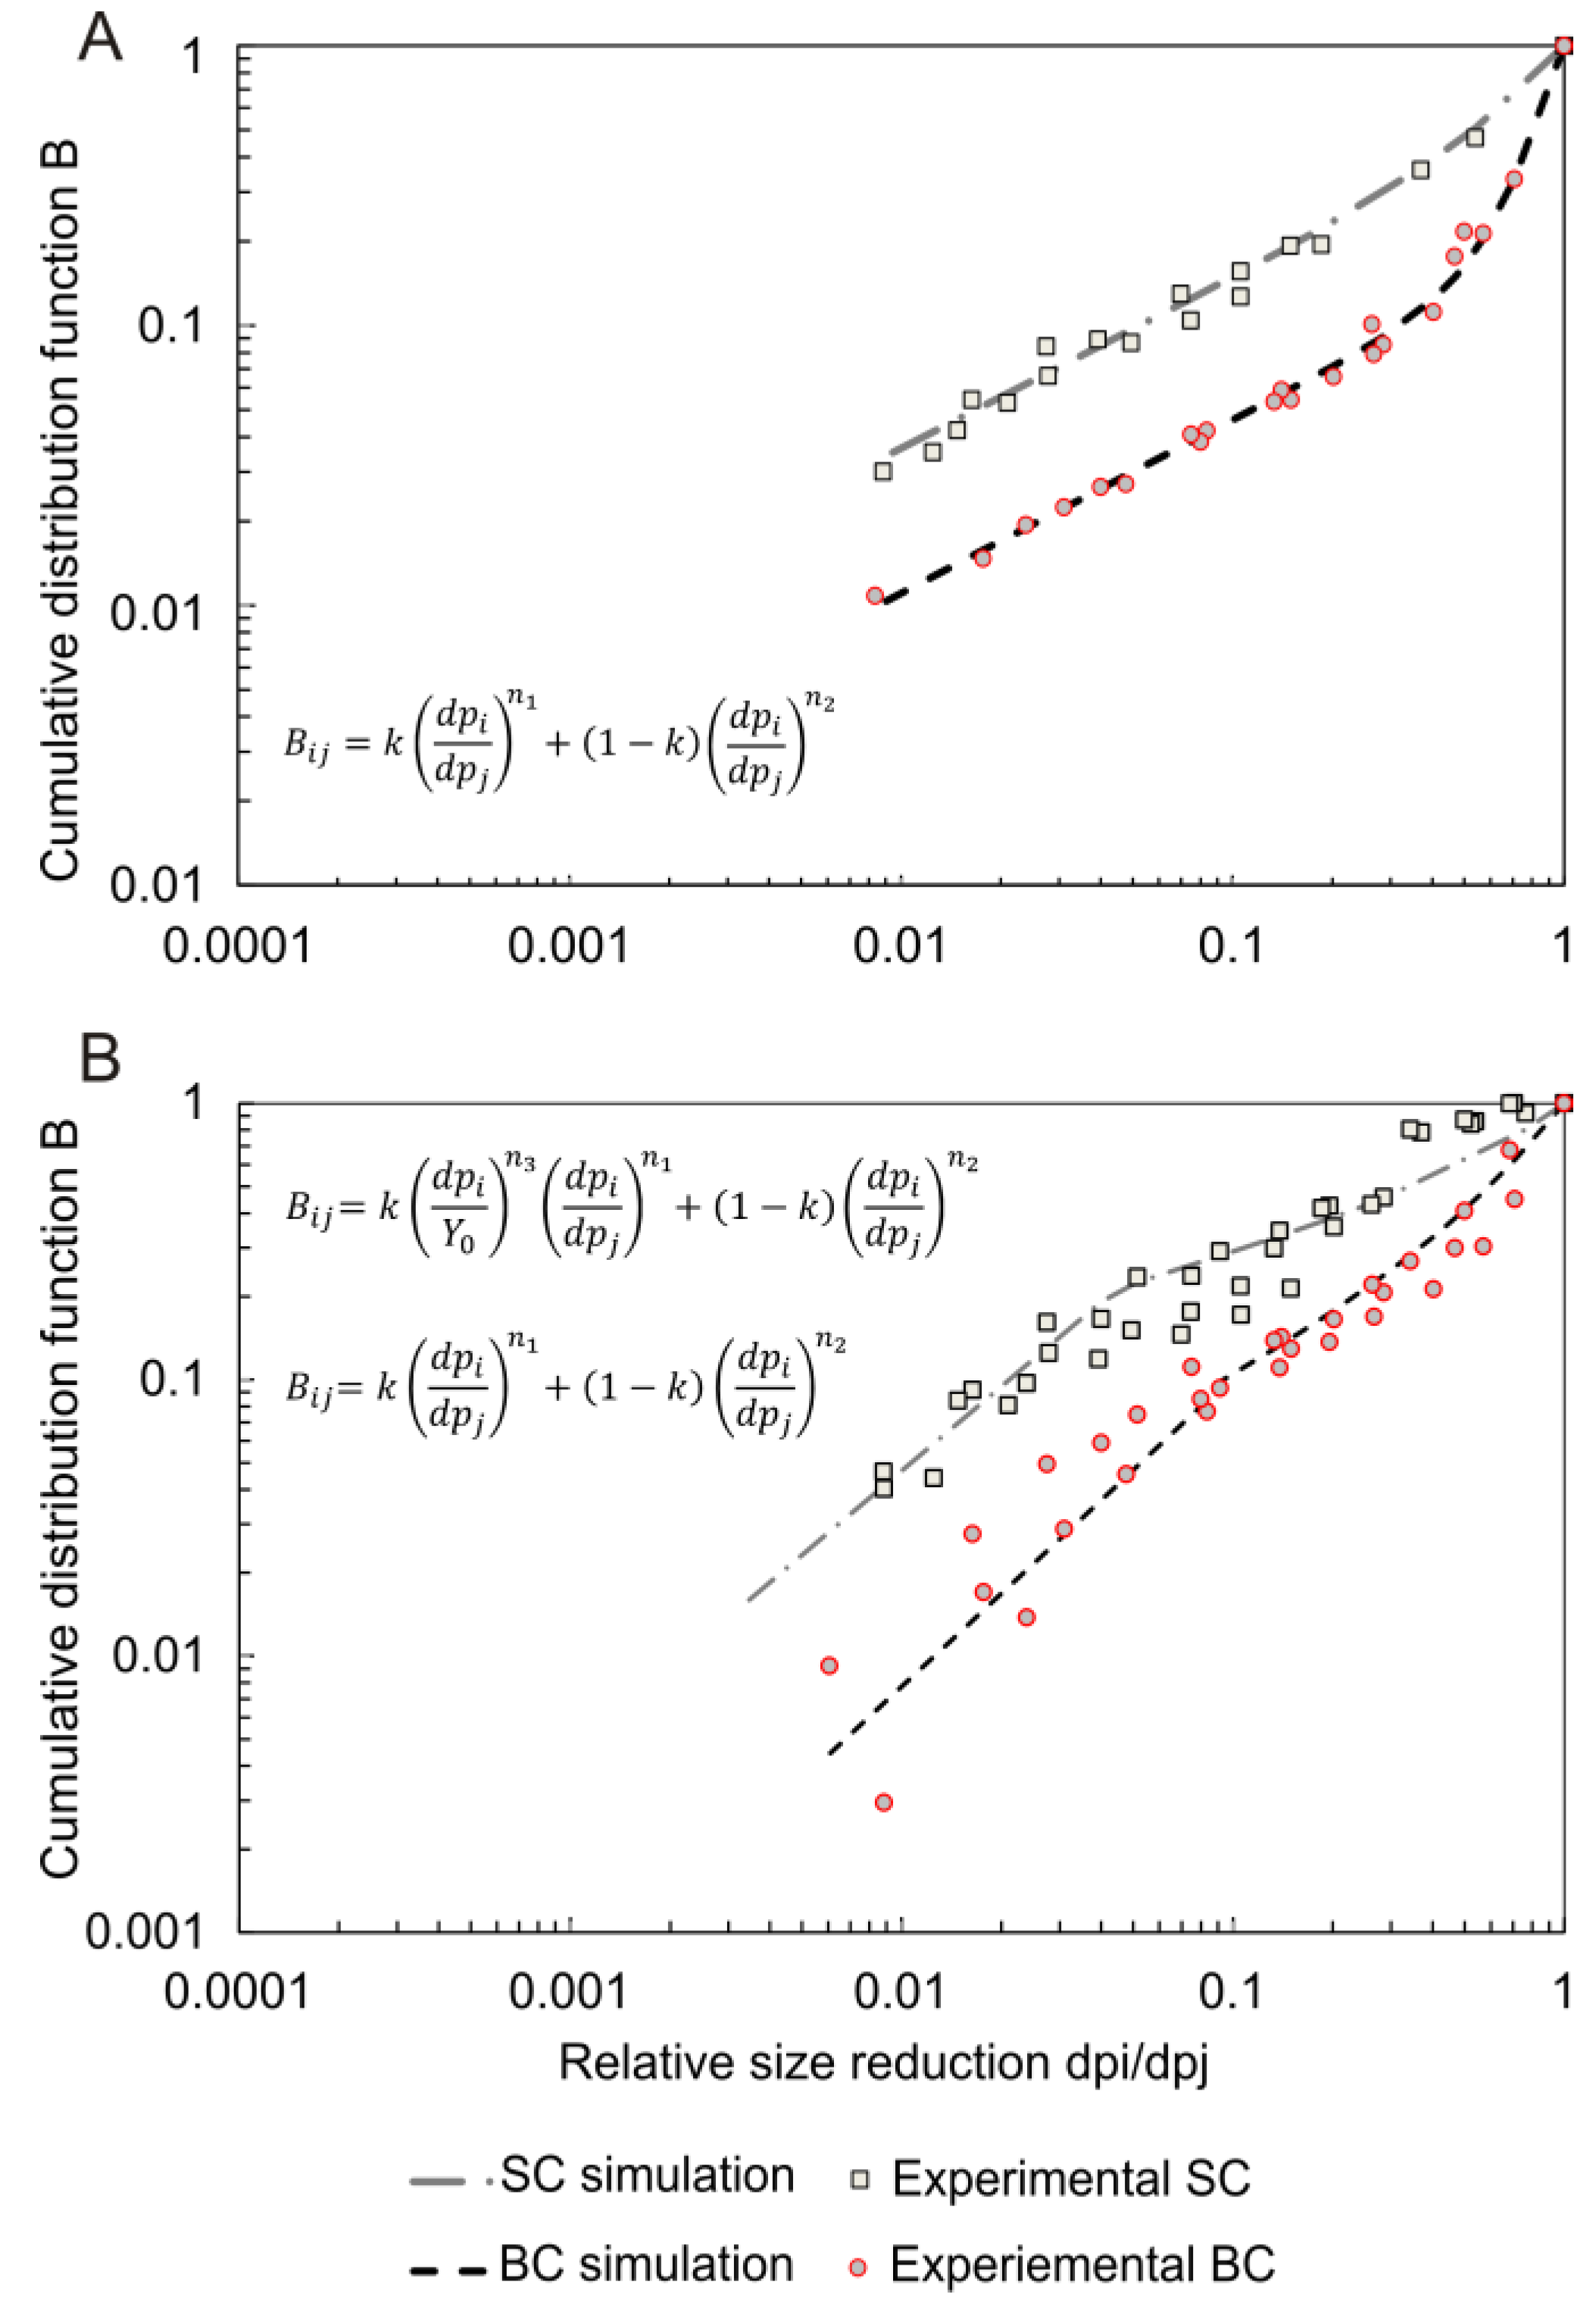
3.2. Breakage Function

The abundance of altered minerals in the granitic ore results in a soft inconsistent material with a difficult characterisation from a rupture point of view. On the other hand, the calc-silicate rock that hosts the tungsten ore is formed by less hard minerals which are less altered, and make it more resistant under compression action, and thus, is expected to present a normal distribution in its mechanical characterisation. Then, the different piston test results were processed and sorted by cumulative mass distribution against the reduction ratio dpi/dpj, where dpj is the parent particle and dpi is its progeny. The data are presented in a log/log plot for the calc-silicate material (Figure 4A) and for the altered leucogranite (Figure 4B). The same plots show the distribution normalisation where the differences between the single compression condition and bed compression condition can be observed. The calc-silicate material tests were normalised by means of the classical Austin and Luckie [8] B distribution form (Figure 4A, Equation (1)) for all dpi/dpj. This form has three normal parameters: k, n1 and n2 (Table 2). On the other hand, the altered granite material is described as a bi-modal function (Figure 4B, Equations (1) and (2)) were modelled with the k, n1 and n2, respectively, plus the additional Y0 and n3 parameters which characterise the bi-modal function. Both cases (calc-silicate and granite) show the same patterns but with a smooth displacement along their curve vertical shaft, which is the bed compression curve over the single compression curve.
The same parameters were determined using back-calculation techniques on all the tests (Table 3). Clear differences between experimental results obtained with the piston press test were observed. First, the back-calculations cannot define whether the function is normal or bimodal; the regression algorithm does not discriminate the type of the function, and thus, it has to be set previously. In fact, the program can adjust and find solutions for both situations. Secondly, the boundary conditions have to be set, so that a predetermined manipulation of the values that will be obtained is already done. To fit the function with the parameter, some of them are simply 0, which is the case of n1 in bed compression for the calc-silicate material. Thus, without a physical meaning, there is no way to establish a relationship between the breakage function and the operative parameters.
The single compression test was performed on both materials. Although granites are strong rocks with high resistance to the compression strength, this resistance is considerably reduced when the material is altered [25]. As expected, the tested granite had low resistance to compression. However, its behaviour was so heterogeneous, that its resistance can vary, even to be as high close as normal granite. On the other hand, the calk-silicate is much more stable, and always remains within the threshold corresponding to an amphibolite rock (Figure 5).
The relation between the particle size distribution for single and bed compression tests was determined in order to establish the link in the evolution of the particle composition and size range, which should also be related to the distribution of daughter particles after a breakage event and should also depend on the rupture mechanism. In the particle size distribution (PSD) plot overlapping the composition (Figure 6), the graph presents some differences in both composition and curve behaviour.
The mineralogy of the calc-silicate rock is also highly dependent on the size class, with quartz and albite being dominant in the coarsest fractions, and hornblende being dominant in the finest fraction (Figure 7).

4. Discussion

The breakage distribution function is characteristic of each mineral composition of the materials and shows different normalisation for the altered granite and the calc-silicate. The determined parameters for each material distribution present differences based on the operative conditions in which the tests were conducted. Thus, bed compression and single compression present the same pattern but distinct curve behaviour. This could be attributed to the fracture mechanism when the test is run with only one particle or with a packet of particles. In single particle compression, the pressure abruptly drops when the particle suffers a structural crack, producing the denominated cleavage effect (Figure 8). Meanwhile, when this occurs in bed compression conditions, where multiple contact points of pressure are applied around the particles, producing localised stress on the particles surface, it is an indication of the effect of abrasion. Obviously, the compression cleavage effect also occurs, but complete fracturing is not always present in this case.
Now, the link between the parameters of the breakage distribution function and mineralogy is established. For the granite, three main types of minerals, in terms of mechanical response under compression, can be observed; in this case, the strongest material, quartz; the altered phase minerals include Albite, microcline and kaolinite; and in the third group are the micas, which have special behaviour due to their structure and morphology. To distinguish these categories, the compositions of theses minerals were regrouped for the different size classes (Figure 9). At first glance, a correlation can be observed among compositions of the particles for each size. As explained in the mineralogical characterisation section, quartz is present in two main phases: grains with a size of 2 mm, and other phases of grains with sizes below 300 µm (Figure 2). In a simple fracture, larger quartz grains would maintain their size and they can be associated with the remaining altered material attached to these grains. However, there is also a smaller amount of quartz that will feed the fine fractions, but this occurs to a lesser extent. An inflexion point occurred at a size range of 1.5 mm. From the size range of 7.2–1.5 mm, the altered minerals are in the same proportion. However, from the size range of 1.5–0.1 mm, the content of the altered minerals considerably increases (Figure 9A), which affects the particle size distribution with a remarkable change in the slope of the curve.
For the cal-silicate material (Figure 9B), the minerals have been grouped into four types, according to their cleavage characteristics: (1) quartz, which showed no cleavage; (2) phyllosilicate minerals, mainly constituted by micas (biotite) and chlorite (chamosite) with perfect cleavage; (3) feldspars, constituted by albite and K-feldspar with good cleavage in two orthogonal directions; and (4) amphiboles (hornblende + actinolite) with good cleavage in two directions at 180°. The size distribution of the particles is related to the mechanical response of their minerals. In the coarse size class fraction, the slope of the particle size distribution curve is smoother than the finest particles. This can be attributed to the hardness of the main minerals present in these size fractions, represented by quartz and feldspars. In the finest size fractions, amphiboles and phyllosilicates are the most abundant minerals.
Under the effect of single compression, the evolution of the particles in composition compared with their particle size was studied (Figure 10). This progression can be divided into two categories; when the particles are larger than 1.5 mm and those smaller than 1.5 mm. For the first category (Figure 10A), the altered phases and the quartz grade decreased at the same rate, given by the slope of the trend-lines, with both being at a similar order of magnitude (between 0.5 and 0.7). The decrease of these minerals was compensated proportionally with muscovite following the opposite slope progression. For particles under 1.5 mm (Figure 10B), the altered material increased at the same rate as the quartz decreased, where the slopes were almost the same but with opposite signs, one negative and the other positive. The quantity of muscovite was maintained at a constant value.
The mineral composition of the different size ranges of the particle under bed compression can be differentiated into two types: In the first category, for coarse particles, the quantity of altered material decreases at the same rate as quartz (Figure 10C), while the muscovite content exhibits a positive slope, which indicates an increase proportional to the other minerals. When the particles are less than 1.5 mm, the fines particles have a lower quartz content compared with the same plot under single compression (Figure 10A,B). Bed compression is a condition in which the full fracture is not necessary to happen. Instead, the increase in density is given by the internal structure collapse, producing micro-cracks that are not visible to the naked eye. So, the remaining particles under bed compression should have less fine proportions compared with those under single compression (Figure 10C,D).
Regarding micas, in this case, muscovite has a similar content for the different size ranges. This mineral has a sheet structure and forms flat and thin grains, being brittle in the cleavage direction. Perpendicular to the cleavage direction, the sheets can break more or less uniformly, achieving an acceptable degree of comminution. However, when pressure is exerted parallel to the cleavage, only the cleavage process is accelerated, maintaining the original size of the laminate components. Thus, the daughter generation of micas would depend on the compression contact points.
In terms of breakage function parameters, the referenced literature [2] discriminates two main parts of this function (Figure 11): The one responsible for the fines daughter particles generation and the other is responsible for coarse daughter particles generation.
Since ( d p i d p j ) is a relation between daughter and parent particles, the parameters that characterise the mineral are: k, n1, and n2. The factor k has a greater ponderation when it comes to the generation of daughter fines, while n1 is a moderator of this fine generator. Thus, as values of k increase, the fine generation should increase and vice versa for low values of k. As the generation of fines daughter particles is relatively lower for bed compression compared to single compression, the values of the k factor should be slightly higher for single compared to bed compression.
Regarding parent particle composition, a significant part of the primary quartz should remain as a coarse component, and the altered phase should generate fine daughter particles. Since the percentage of the altered phase is significantly more than 50% of the whole material, this could suggest that the value of k should be greater than 0.5. It is also noticeable that the fines generation is also supported by the quartz breakage. Therefore, it is possible that this value could be between 0.5 and 1. Since the same value of k must be a little lower when it is under bed compression conditions, the experimentally found values seem to indicate this criterion (Table 3).
The calc-silicate material corresponds to an amphibolite rock. It is a more competent and stable type of rock compared to the granite, with no strong alteration. Silicates with different cleavage planes were observed, which can explain the mechanical behaviour during the compression action. In terms of composition changes for coarse phases, the contents of all minerals show small changes (Figure 12A). The inflection point occurred at approximately 400 µm; when the particle size decreases, the quartz content abruptly dropped at the same time that the amphibole content increased considerably (Figure 12B). Phyllosilicates and feldspars content varied heterogeneously with no clear pattern, despite the fact that under 400 µm, some compositional exchanges are observed (Figure 12C,D).
Amphibolite seemed to be more stable when responsible for daughter particles generation. The breakage distribution function curve was typical to this material. Under single compression, the internal fracture should release the minerals with a certain degree of cleavage. Quartz is hard under comminution, but it is also brittle, which means that when it reaches the collapse point, it breaks into multiple size ranges, similar to the shatter effect (Figure 8C). The composition of the particles up to 400 µm remained constant. The rock matrix does not change composition until it reaches below 400 µm, when the fines particles generation finally occurred, due to the cleavage type of the different minerals. The breakage function parameter k could reach medium values when under single compression, but under bed compression conditions should be lesser than under single compression one, generating more internal micro-cracks instead of full fractured material.

5. Conclusions

Granite from a tantalum ore and calc-silicate rock from a tungsten ore material were characterised from a mechanical point of view. The breakage distribution function was found to be normalised in terms of non-dependency in the parent particle size. Using the referenced back-calculation techniques, the distribution parameters were determined. It is said that the value of the k parameter of the function is related to the fine phase generation, but the high value of n2 represents a significate coarse generation in the case of the granite. The normalization is not applicable when the operative conditions change from single compression to the bed compression; thus, different values of the distribution function for the different conditions were found. The breakage function parameters determination by means of piston-die test and bac-calculation techniques highlight the fact that the numerical algorithms, often used in mineral modelling, do not represent the best alternative to find these parameters.

Acknowledgments

This work is part of the OptimOre project, which received funding from the European Union’s Horizon 2020 research and innovation programme under grant agreement No 642201. The Strategic Minerals Spain enterprise helped with sampling in the Penouta mine.

Author Contributions

Hernan Anticoi designed and performed the experiments, analysed the data, and wrote the paper; Pura Alfonso designed the mineralogical analyses and wrote part of the paper, Jose Juan De Felipe has performed the mechanisation of the new piston-die device, Eduard Guasch and Sarbast Ahmad Hamid helped in the lab experimental and manuscript writing review, Josep Oliva, critically reviewed the experimental design, the analysis of the results and conclusions; Maite Garcia-Valles, performed and interpreted the XRD data, Marc Bascompta helped in the writing of the manuscript and Lluis Sanmiquel performed the sampling managing and reviewing final version of the manuscript. Teresa Escobet, Rosa Argelaguet and Antoni Escobet helped in the script and algorithm for Matlab program, David Parcerisa help in the geo-mechanical characterization of the samples and Esteban Peña establish the base model for experimental design.

Conflicts of Interest

The authors declare no conflict of interest.

References

  1. Lee, H.; Kim, K.; Kim, J.; You, K.; Lee, H. Breakage characteristic of heat-treated limestone determined via kinetic modeling. Minerals 2018, 8, 18. [Google Scholar] [CrossRef]
  2. King, R.P. Modelling and Simulation of Mineral Processing Systems; Butterworth-Heinemann: Oxford, UK, 2001. [Google Scholar]
  3. Guasch, E.; Anticoi, H.; Hamid, S.A.; Alfonso, P.; Oliva, J.; Escobet, T. New approach to ball mill modelling as a piston flow. Miner. Eng. 2018, 116, 82–87. [Google Scholar] [CrossRef]
  4. Esnault, V.P.B.; Zhou, H.; Heitzmann, D. New population balance model for predicting particle size evolution in compression grinding. Miner. Eng. 2015, 73, 7–15. [Google Scholar] [CrossRef]
  5. Austin, L.G.; Weller, K.R.; Lim, I.L. Phenomenological Modelling of the High Pressure Grinding Rolls. In Proceedings of the XVIII International Mineral Processing Congress, Sydney, Australia, 23–28 May 1993; pp. 87–95. [Google Scholar]
  6. Torres, M.; Casali, A. A novel approach for the modelling of high-pressure grinding rolls. Miner. Eng. 2009, 22, 1137–1146. [Google Scholar] [CrossRef]
  7. Austin, L.G.; Luckie, P.T. The estimation of Non-normalized breakage distribution parameters from batch grinding test. Powder Technol. 1971, 5, 267–271. [Google Scholar] [CrossRef]
  8. Austin, L.G.; Luckie, P.T. Methods for determination of breakage distribution parameters. Powder Technol. 1972, 5, 215–222. [Google Scholar] [CrossRef]
  9. Austin, L.G.; Concha, L. Diseño de Simulación de Circuitos de Molienda y Clasificación; Programa Iberoamericano de Ciencia y Tecnología Para el Desarrollo; CYTED: Concepción, Chile, 1994. (In Spanish) [Google Scholar]
  10. Benzer, H.; Aydogan, N.; Dundar, H. Investigation of the breakage of hard and soft components under high compression: HPGR application. Miner. Eng. 2011, 22, 303–307. [Google Scholar] [CrossRef]
  11. Dundar, H.; Benzer, H.; Aydogan, N. Application of population balance model to HPGR crushing. Miner. Eng. 2013, 50–51, 114–120. [Google Scholar] [CrossRef]
  12. Tavares, L. Particle weakening in high-pressure roll grinding. Miner. Eng. 2005, 18, 651–657. [Google Scholar] [CrossRef]
  13. Zhang, Y.D.; Buscanera, G.; Einav, I. Grain size dependence of yielding in granular soils interpreted using fracture mechanics, breakage mechanics and Weibull statistics. Géotechnique 2016, 66, 149–160. [Google Scholar] [CrossRef]
  14. Chimwani, N.; Glasser, D.; Hildebrandt, D.; Metzger, M.J.; Mulenga, F.K. Determination of the milling parameters of a platinum group minerals ore to optimize product size distribution for flotation purposes. Miner. Eng. 2013, 43–44, 67–78. [Google Scholar] [CrossRef]
  15. Hasanzadeh, V.; Farzanegan, A. Robust HPGR model calibration using genetic algorithms. Miner. Eng. 2011, 24, 424–432. [Google Scholar] [CrossRef]
  16. Sohn, C.; Zhang, Y.D.; Cil, M.; Buscarnera, G. Experimental assessment of continuum breakage models accounting for mechanical interactions at particle contacts. Granul. Matter 2017, 19, 67. [Google Scholar] [CrossRef]
  17. Petrakis, E.; Komnitsas, K. Improved modelling of the grinding process through the combined use of matrix and population balance models. Minerals 2017, 7, 67. [Google Scholar] [CrossRef]
  18. Petrakis, E.; Komnitsas, K. Correlation between Material Properties and Breakage Rate Parameters Determined from Grinding Tests. Appl. Sci. 2018, 8, 220. [Google Scholar] [CrossRef]
  19. Parian, M.; Mwanga, A.; Lamberg, P.; Rosenkranz, J. Ore texture breakage characterization and fragmentation into multiphase particles. Powder Technol. 2018, 327, 57–69. [Google Scholar] [CrossRef]
  20. Kelly, E.G.; Spottiswood, D.J. The breakage function; what is it really? Miner. Eng. 1990, 3, 405–414. [Google Scholar] [CrossRef]
  21. Rietveld, H.M. A profile refinement method for nuclear and magnetic structures. J. Appl. Crystallogr. 1969, 2, 65–71. [Google Scholar] [CrossRef]
  22. UNE-EN 1926. Métodos de Ensayo Para Piedra Natural: Determinación de la Resistencia a la Compresión; AENOR: Madrid, Spain, 1999. [Google Scholar]
  23. Alfonso, P.; Hamid, S.A.; Garcia-Valles, M.; Llorens, T.; Tomasa, O.; Calvo, D.; Guasch, E.; Anticoi, H.; Oliva, J.; López Moro, J.; et al. Nb-Ta mineralization from the rare element granite from Penouta, Galicia, Spain. Miner. Mag. 2018, accepted. [Google Scholar]
  24. Hamid, S.A.; Alfonso, P.; Anticoi, H.; Guasch, E.; Oliva, J.; Garcia-Valles, M. Quantitative mineralogical comparison between HPGR and ball mill products of a Sn-Ta ore. Minerals 2018, 8, 151. [Google Scholar] [CrossRef]
  25. Gupta, A.S.; Rao, K.S. Weathering effects on the strength and deformational behaviour of crystalline rocks under uniaxial compression state. Eng. Geol. 2000, 56, 257–274. [Google Scholar] [CrossRef]
  26. Chang, C.; Hairnson, B. True triaxial strength and deformability of the German Continental Deep Drilling Program (KTB) deep hole amphibolite. J. Geophys. Res. 2000, 105, 18999–19013. [Google Scholar] [CrossRef]
  27. Souček, K.; Vavro, M.; Staš, L.; Vavro, L.; Waclawik, P.; Konicek, P.; Ptáček, J.; Vondrovic, L. Geotechnical Characterization of Bukov Underground Research Facility. Procedia Eng. 2017, 191, 711–718. [Google Scholar] [CrossRef]
  28. Bowers, L.R.; Broaddus, W.R.; Dwyer, J.; Hines, J.; Stansell, R. Processing Plant Principles. In The Aggregate Handbook, 3rd ed.; Barksdale, R., Ed.; National Stone Association: Washington, DC, USA, 1996; pp. 81–84. [Google Scholar]
Figure 1. Single compression (A) and bed compression (B) piston-die test.
Minerals 08 00170 g001
Figure 2. Optical micrographs showing the mineralogy of the altered granite, where the largest grains are quartz (Qtz) surrounded by micas and albite with kaolinite. (A) Quartz with mineral inclusions, (B) Muscovite (colourful) surrounds quartz grey grains.
Minerals 08 00170 g002
Figure 3. Mineral composition of the material used in the experiments determined by XRD. (A) granite, (B) calc-silicate.
Minerals 08 00170 g003
Figure 4. Experimental and normalised distribution function B for SC is single compression and BC is bed compression for (A) the calc-silicate material and (B) the altered granite.
Minerals 08 00170 g004
Figure 5. Simple compression test for the materials, where the red points are the granite and the black point is the calc-silicate. The boxes indicate the usual values for granite and amphibolite [26,27].
Minerals 08 00170 g005
Figure 6. PSD curves compared with the mineral composition of each size class (A) single compression; (B) bed compression.
Minerals 08 00170 g006
Figure 7. XRD diagrams of the calc-silicate material for different size classes. Bi, biotite; Hbl, hornblende; Act, actinolite; Qtz, quartz.
Minerals 08 00170 g007
Figure 8. Fracture mechanism of the particles. The type of daughter generation depends on the breakage nature [28].
Minerals 08 00170 g008
Figure 9. (A) Mineralogy of the granite divided in three main groups of minerals according to their consistency in front of compression; alterable minerals, quartz and muscovite. (B) The calc-silicate was also divided but according mineral cleavage characteristics: quartz, horblende + actinolite, albite + k-feldspar, phyllosilicates.
Minerals 08 00170 g009
Figure 10. Minerals composition according particle size classes: (A,B) are related to the single compression test, (C,D) are related to the bed compression test.
Minerals 08 00170 g010
Figure 11. Breakage function distribution parameters roles in terms of daughter particle size.
Minerals 08 00170 g011
Figure 12. Mineral compositions by particle size of the calc-silicate. Am, amphibole; Qtz, quartz. (A), content of amphiboles and quartz in coarse size fractions; (B), content of amphiboles and quartz in fine size fractions; (C), content of phyllosilicates and feldspar in coarse size fractions; (D), content of phyllosilicates and feldspar in fine size fractions.
Minerals 08 00170 g012
Table 1. Content of material (g) distributed in particle sizes for each single compression Test (SC) and bed compression Test (BC).
ConditionsMesh Size (mm)GraniteCalc-Silicate
SC2.0–4.042.239.4
4.0–4.850.269.9
4.8–6.781.711.32
6.7–9.588.238.5
9.5–11.2141.349.2
11.2–12.5194.058.3
12.5–14.0257.963.4
14.0–16.0343.893.7
16.0–19.0489.8-
BC0.71–1.073.035.6
1.0–2.088.188.3
2.0–4.0101.743.3
4.0–4.886.933.0
Table 2. Breakage distribution parameters obtained by the piston-die methodology. k, n1, n2 and n3 are dimensionless. Y0 is in m.
MaterialConditionkn1n2n3Y0
GraniteSC0.680.371.950.640.0036
BC0.470.662.160.450.0045
Calc-silicateSC0.600.612.32--
BC0.190.624.37--
Table 3. Breakage distribution parameters using back-calculations techniques. k, n1, n2 and n3 are dimensionless. Y0 is in m.
MaterialConditionkn1n2n3Y
Altered graniteSC0.990.922.531.000.21
BC0.890.002.280.430.50
Calc-silicateSC0.600.825.00--
BC0.340.005.00--

