Article

Analysis of Potential for Critical Metal Resource Constraints in the International Energy Agency’s Long-Term Low-Carbon Energy Scenarios

Graduate School of Energy Science, Kyoto University, Yoshida Honmachi, Sakyo-ku, Kyoto 606-8501, Japan
*
Author to whom correspondence should be addressed.
Minerals 2018, 8(4), 156; https://doi.org/10.3390/min8040156
Submission received: 27 December 2017 / Revised: 28 March 2018 / Accepted: 10 April 2018 / Published: 12 April 2018
(This article belongs to the Special Issue Critical Minerals: Methodologies and Case Studies)

Abstract

:
As environmental problems associated with energy systems become more serious, it is necessary to address them with consideration of their interconnections—for example, the energy-mineral nexus. Specifically, it is unclear whether long-term energy scenarios assuming the expansion of low carbon energy technology are sustainable in terms of resource constraints. However, there are few studies that comprehensively analyze the possibility of resource constraints in the process of introducing low carbon energy technology from a long-term perspective. Hence, to provide guidelines for technological development and policy-making toward realizing the low carbon society, this paper undertakes the following: (1) Estimation of the impact of the expansion of low carbon energy technology on future metal demand based, on the International Energy Agency (IEA)’s scenarios; (2) estimation of the potential effects of low carbon energy technology recycling on the future supply-demand balance; (3) identification of critical metals that require priority measures. Results indicated that the introduction of solar power and next-generation vehicles may be hindered by resource depletion. Among the metals examined, indium, tellurium, silver, lithium, nickel and platinum were identified as critical metals that require specific measures. As recycling can reduce primary demand by 20%~70% for low carbon energy technology, countermeasures including recycling need to be considered.

Graphical Abstract

1. Introduction

1.1. Background

Environmental problems at the global level, including climate change and resource depletion, are some of the most challenging problems that humankind faces and will become even more important in the future with the global growth in population and economic activity. It is an important goal of all governments to achieve sustainable economic development while minimizing adverse environmental impacts. To this end, it is necessary to simultaneously address complex environmental problems that are increasingly interconnected. One such issue is the energy-mineral nexus [1]. For example, low carbon energy technology, which is key to mitigating global warming, could rapidly increase demand for specific metal resources and make resource depletion a real concern—not just locally but potentially on a global scale. This is because various rare metals (e.g., indium, gallium, tellurium, neodymium, dysprosium), which have been in low demand until now, are vital for the functionality of solar power, wind power and electric vehicles. There has been concern that the reserves of these rare metals may not be sufficient for future demand increases implied by high diffusion rates of these low carbon technologies to meet the mitigation challenge. Moreover, since these metals are often by-products of base metal ores such as copper and zinc, it is difficult to increase production independently to meet the rapid increase in demand. Additionally, it is not only rare metals but a variety of more common metals that are needed—for example, solar power requires more copper than thermal power [2] and 3 times the amount of copper is necessary for electric vehicles compared with conventional gasoline vehicles [3], thus the widespread introduction of low carbon energy technology can have a significant impact on existing material flows and create pressure on production capacity as well as reserves.
Despite the importance of mineral components to these technologies, long-term energy scenarios presented by several organizations such as the International Energy Agency (IEA) do not consider the potentially significant metal demand increases due to the expansion of low carbon energy technology [4]. However, if supply constraints occur in the future, it can be expected that the introduction of these technologies may be greatly restricted in comparison to the level of infrastructure required by these scenarios. This would have a significant negative impact on all sectors. Hence, in order to realize a low carbon society by introducing low carbon energy technology, a comprehensive consideration including recycling and reuse for multiple technologies and metals needs to be conducted from a long-term perspective and it is necessary to answer the following questions; (1) What are the metals that are likely to cause resource constraint concerns under the expansion of low carbon energy technology? (2) What are the metals that have a particularly important role in the creation of a low carbon society? By answering the above questions, it will be possible to provide information to decision-makers and the industry as to what metal resources should be focused-on and to advance appropriate technological development and policy-making reflecting the results.

1.2. Related Work

Based on the concerns described above, a growing number of studies have examined the potential constraints on metal resources related to energy technology in recent years. Most commonly these have been related to thin film type solar panels [5,6,7,8,9,10,11,12,13,14], permanent magnets used in wind power generation and next-generation vehicles [15,16,17,18,19,20,21] and secondary batteries or fuel cells for next-generation vehicles [22,23,24,25,26,27,28,29,30,31,32,33,34,35]. However, most of these studies focus on specific technologies or metals and few studies have comprehensively analyzed the possibility of resource constraints in the introduction process of low carbon energy technology for multiple technologies and metals [36,37]. Therefore, these studies only discussed the resource constraints potential of specific metals or technologies, no mention has been made as to which metal/technology is more “critical”. Although defining “critical” metals is not straightforward, one of the definitions is that critical metals have high supply risk and high importance to industry or economy.
Criticality analysis methods have been developed to evaluate which metals are more critical. Criticality of metal resources is usually evaluated on the basis of “supply risk” which uses many factors to estimate how likely it is that a metal might become physically or economically unavailable and “vulnerability to supply constraint” which estimates how a nation or economy would be impacted by the unavailability of a metal. This study correlates these components of criticality (supply risk and vulnerability to supply constraint) with the above questions (1) and (2) respectively and seeks to evaluate which metals require priority measures.
As a forerunner of criticality analysis, in 2008 the U.S. National Research Council proposed a “Criticality Matrix” with supply risk on the horizontal axis and vulnerability to supply constraint on the vertical axis and identified the critical metals in the U.S. economy [38]. Furthermore, in 2010, the European Commission evaluated the critical metals for the E.U. with the horizontal axis as “economic importance” and the vertical axis as “supply risk” [39], in which was revised in 2014 by extending the target metals [40]. The project group at Yale University, directed by Graedel, has published many papers on metal criticality [41,42,43,44,45,46,47,48,49,50,51] and one of the features of their approach has been the “Criticality Space”, which also evaluated “environmental impact” in addition to supply risk and vulnerability. Yale University has developed a model for evaluating criticality at enterprise, nation and world level respectively and a large number of factors are taken into consideration. However, these studies do not take into consideration the expansion of low carbon energy technologies which would greatly change the future metal supply-demand balance. In addition, these studies evaluated the criticality of metals at only one point in time without consideration of long-term perspectives. The study on criticality of metals used for energy technology by the Department of Energy, United States of America (USDOE) [52] is one example aimed to consider these aspects. This study focused heavily on rare earths and demand forecasts were conducted for the USA up to 2025 with consideration of the diffusion of energy technologies. Rare earth elements such as dysprosium were evaluated as being particularly critical, which is reflective of the rare earth price spike caused by Chinese supply restrictions at that time [53]. Another study, by the European Commission Joint Research Center (JRC), analyzed the supply-demand balance of various metals related to energy technology up to 2030, based on the EU energy roadmap [54]. As a result, in addition to rare earth elements such as dysprosium and yttrium, gallium and tellurium were specified as critical metals with a high level of risk.
However, these studies are limited to mid-term analysis targeting specific nations or regions. Since the transition to a low carbon society that requires the introduction of completely new technologies will take place over several decades, it is expected that the criticality, including the supply-demand balance and the impact to society of related metals would change in time. Therefore, when evaluating metal criticality in the transition process to a low carbon society, dynamic analysis is desirable from a long-term perspective considering the relevance to the long-term energy scenario. However, in the past, attempts to conduct dynamic criticality analysis were limited to targeted metals, such as Neodymium [18] and those metals critical to wind power [55], or focused on analyzing past trends and not mentioning future trends [56]. Furthermore, all of these studies have identified critical metals in specific regions such as the US and Europe and metal criticality at the global level for a variety of low-carbon energy technologies has not been effectively addressed. However, creation of a low-carbon society is not just an issue for specific regions, it is a challenge that each country should cooperate with. Therefore, it is necessary to consider the added pressure of a low carbon transition on metal supply at the global level. In particular, it is important that the IEA’s energy scenarios be evaluated, as they are widely cited, well-researched and regularly updated.

1.3. Research Objectives and Steps

As described above, although there are several studies that have focused on the energy-mineral nexus and examined the availability of critical metals for multiple technologies and metals, there is no study that dynamically and comprehensively analyzes the criticality of metals used for low carbon energy technology at a global level. Moreover, among various energy scenarios, there has not been an examination of whether the long-term energy scenarios periodically released by the IEA [4] are sustainable in terms of resource constraints. However, since the IEA energy scenario is a major scenario that many policymakers refer to, it is necessary to analyze the impact of expansion of low carbon energy technology on material flows and examine whether these scenarios are sustainable in terms of resource constraints. Furthermore, it is necessary to identify critical metals that require special measures and to advance the necessary technological development and policy reflecting the results.
In addition, recycling of end-of life products as a mitigation strategy for resource constraints has drawn much attention in terms of the creation of a recycling-oriented society, or circular economy. In addition to its natural resource consumption-reducing effect, however the potential effects of low carbon energy technology recycling on future supply-demand balance have not been as widely examined as compared with mobile phones or personal computers that are frequently discussed [57,58,59,60,61].
Therefore, in this paper, in order to provide guidelines for technological development and policy-making, the following research steps were undertaken:
  • Development of low carbon energy technology introduction scenarios based on the IEA’s long-term energy scenarios.
  • Quantification of the impact of expansion of low carbon energy technology on future metal demand based on the developed scenarios.
  • Supply balance analysis comparing estimated future metal demand with reserves, resources and current production.
  • Estimation of future end-of-life low carbon energy technology and potential change in supply-demand balance based on changing in recycling rate.
  • Identification of critical metals that require priority measures from among the low carbon energy technology related metals.
The low carbon energy technologies considered in this paper are solar power, wind power and next-generation vehicles (Hybrid electric vehicles, Plug-in hybrid electric vehicles, Electric vehicles, Hydrogen fuel-cell vehicles), among the metals used in these technologies, 15 metals were analyzed as shown in Table 1. In this case, among the metals used for solar power, indium, gallium and selenium are used for CIGS solar panels and tellurium and cadmium are used for CdTe solar panels, respectively. In addition, dysprosium and neodymium are used for permanent magnets generator of wind power and next-generation vehicle, lithium, cobalt and nickel are used for secondary batteries and platinum is used for fuel cells for next-generation vehicles respectively. Steel, aluminum and copper requirements were also considered in cases where there was an anticipated change in requirement over business-as-usual (BAU).

2. Methodology

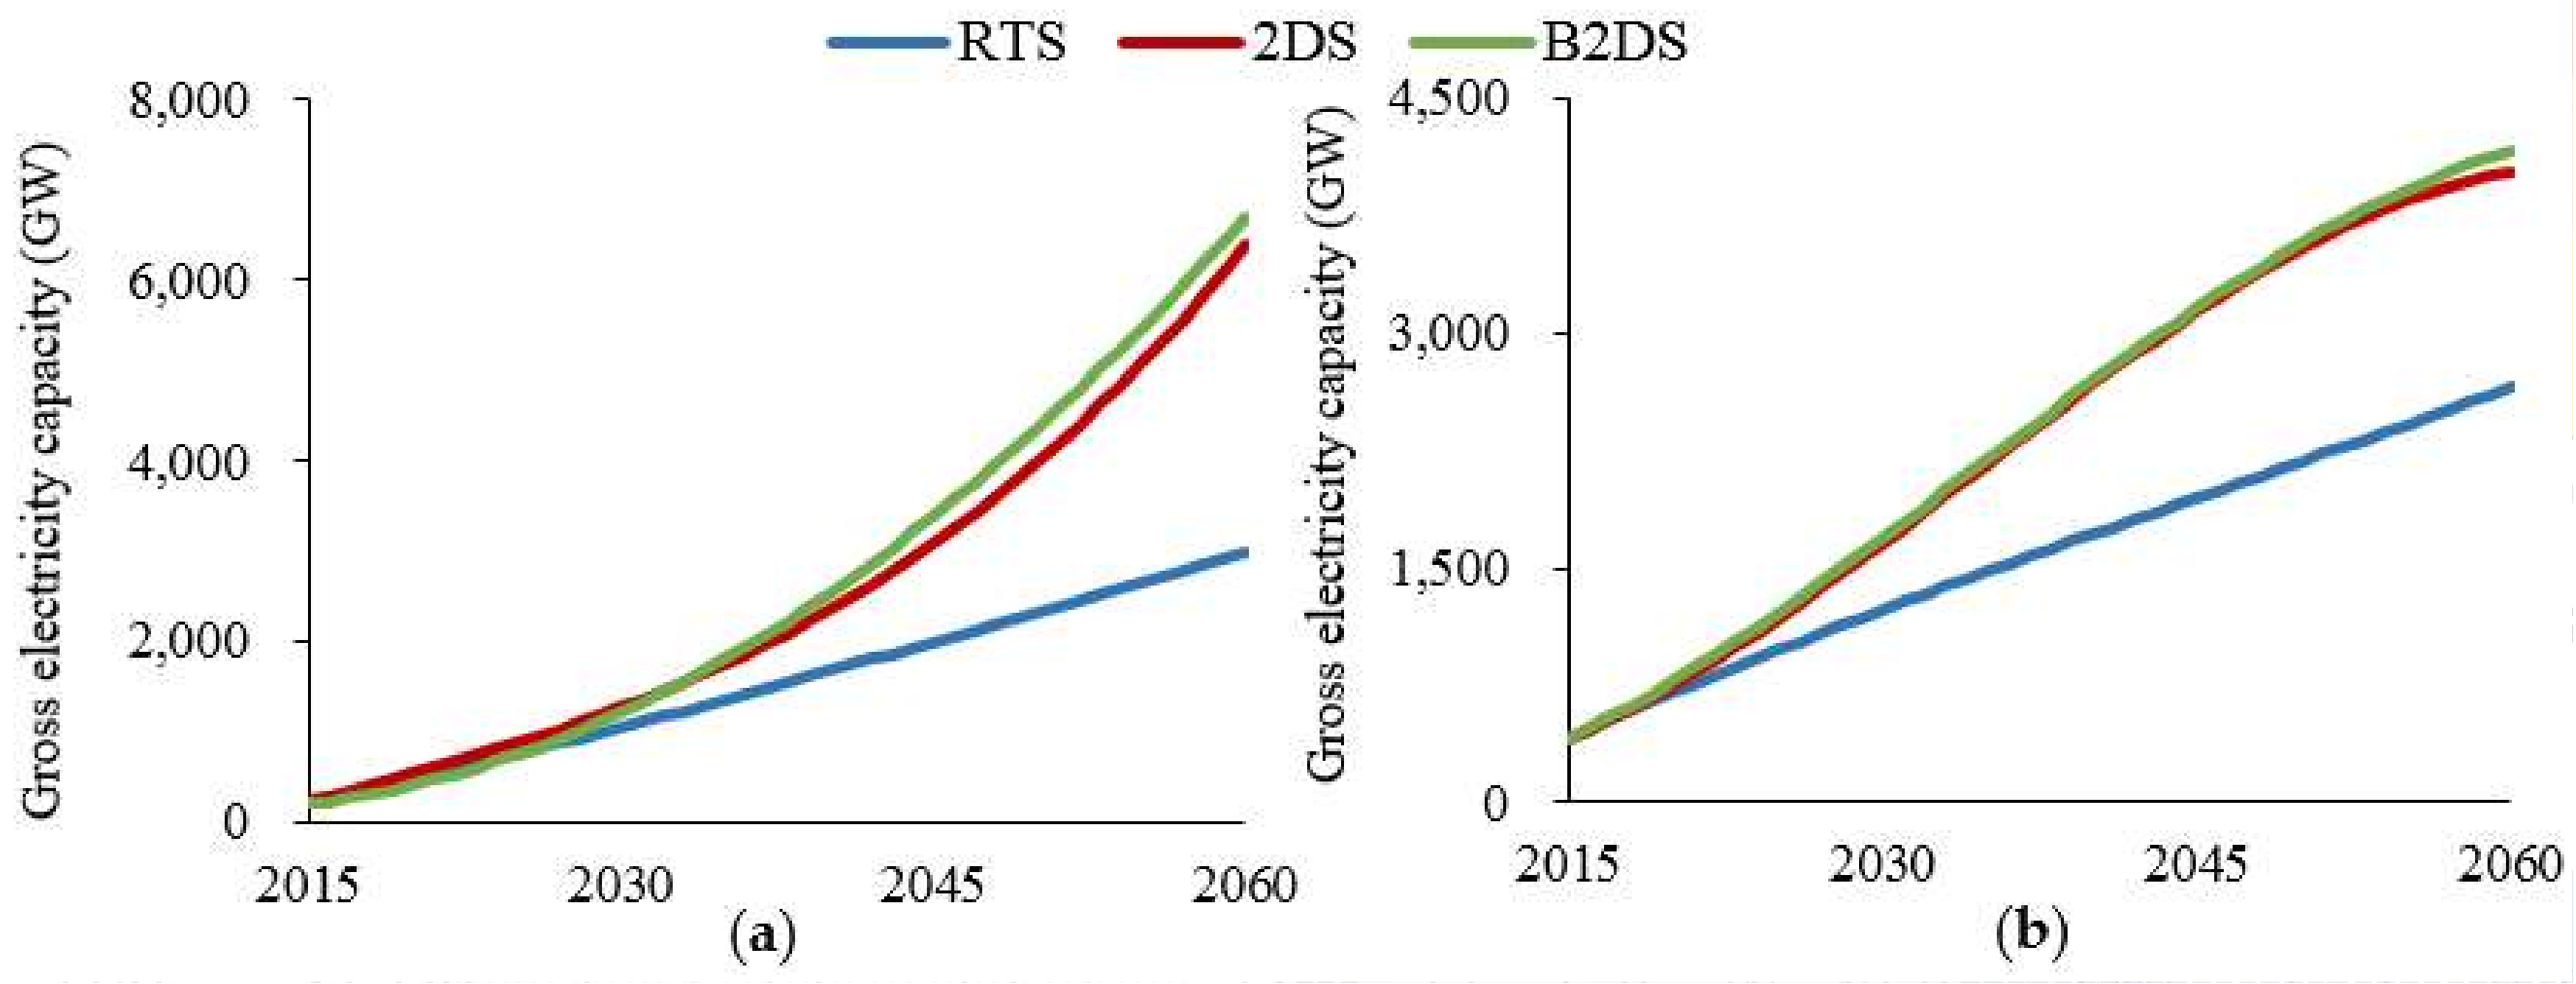
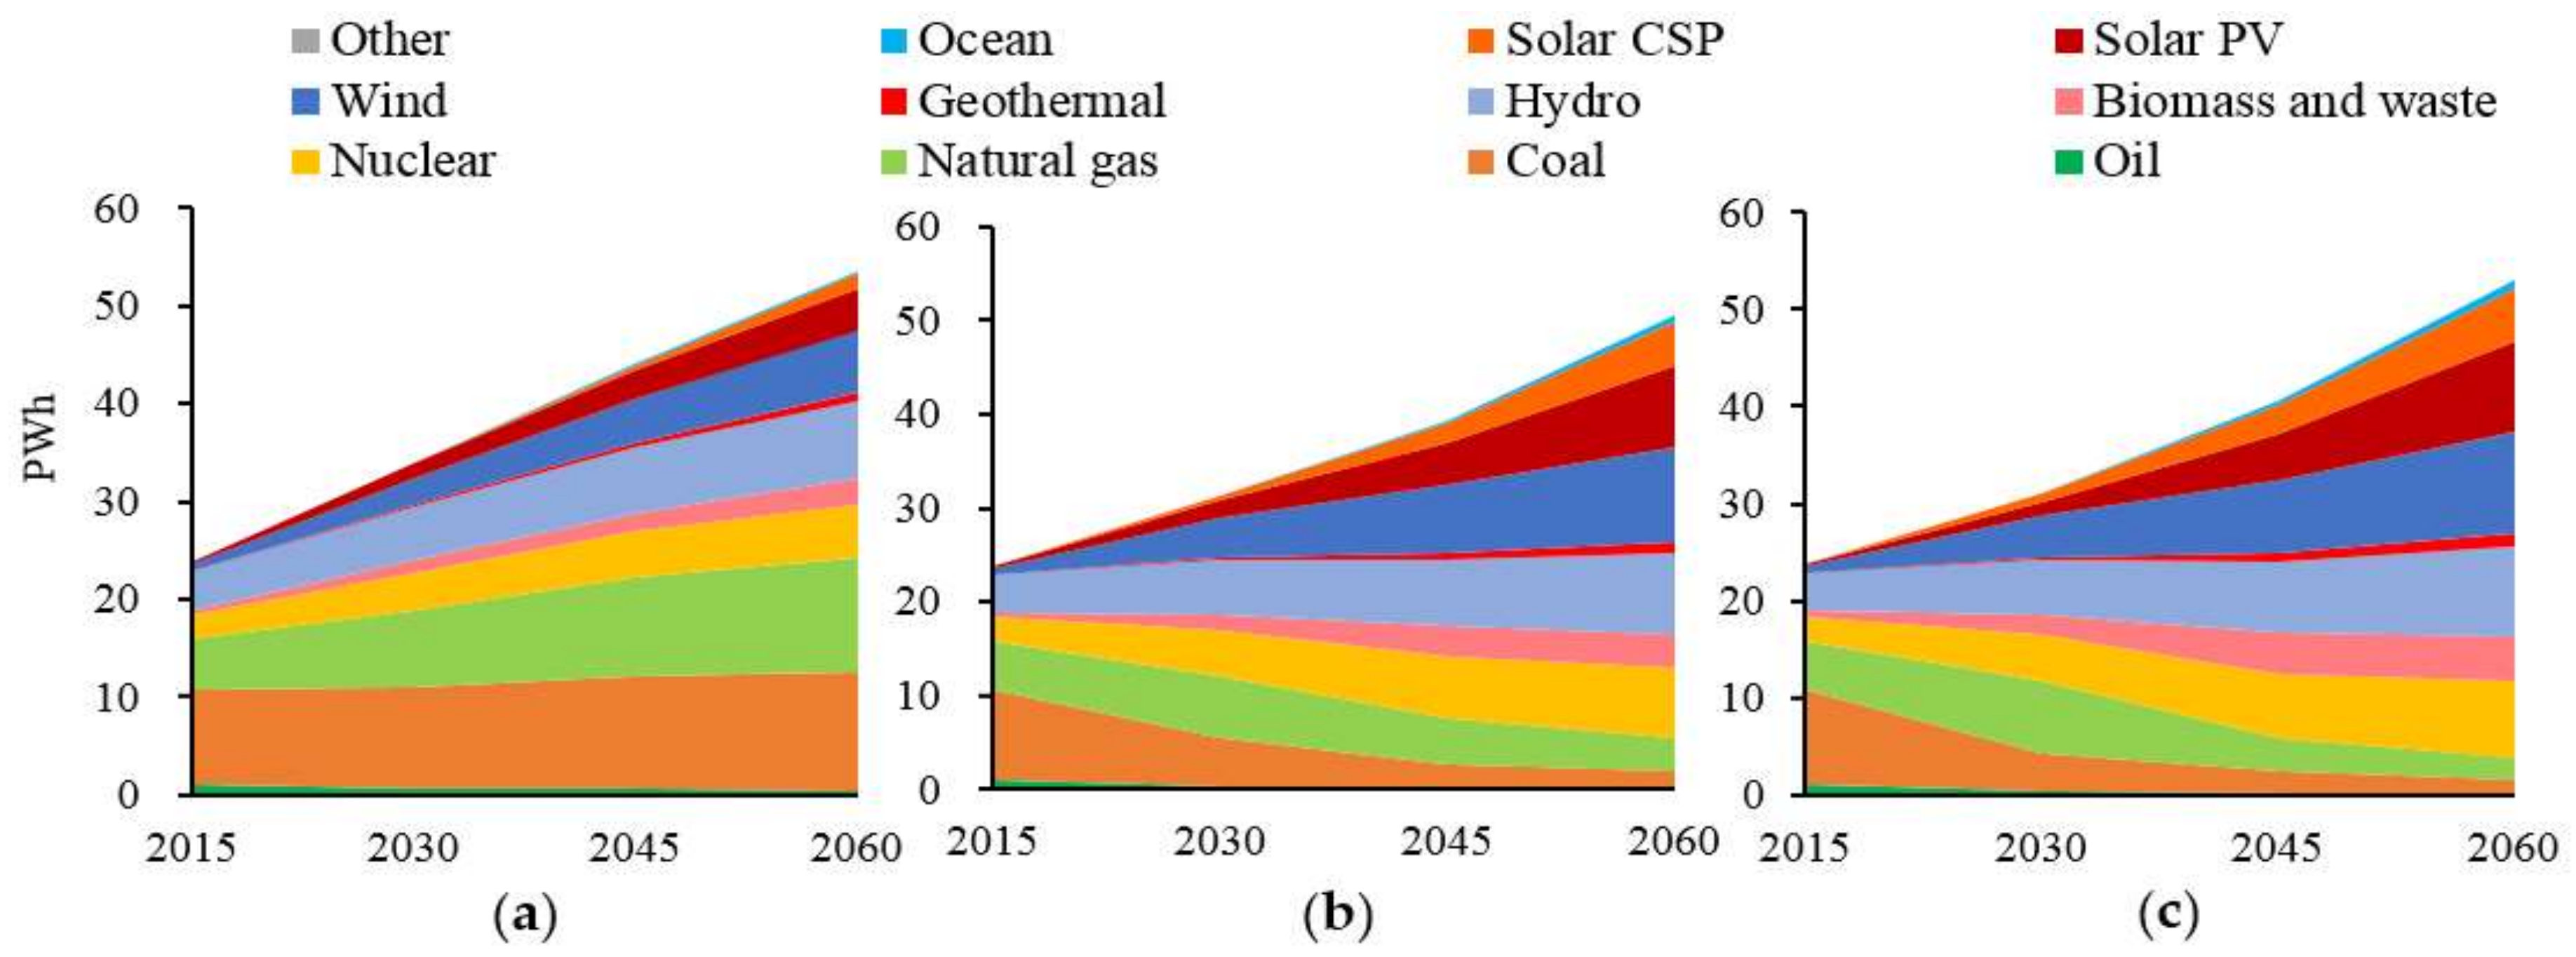
2.1. Scenario Development

The diffusion scenarios for each technology were set as per the Reference Technology Scenario (RTS), 2 °C Scenario (2DS) and Beyond 2 °C Scenario (B2DS) from the Energy Technology Perspectives 2017 [4] published by the IEA. The RTS is a baseline scenario that takes into consideration the existing energy system and voluntary targets of each country pledged in the Paris Agreement, which will lead to a temperature rise of 2.7 °C by 2100. On the contrary, the 2DS is a major climate change mitigation scenario from the IEA, delineating a path to keep global temperature rise below 2 °C in 2100. Furthermore, the B2DS depicts a scenario that achieves 1.75 °C and is more ambitious than the 2DS. Figure 1 shows the transition of solar power and wind power generation capacity in each scenario and Figure 2 shows the transition of in-use stock of next-generation vehicles in the society. Compared to RTS, 2DS is expected to introduce a large amount of solar power and wind power and next-generation vehicles account for a large share of vehicle stock. On the other hand, in B2DS, there is no big difference in generation capacity of solar power and wind power compared with 2DS, however, there is a big difference in the ratio of next-generation vehicles.
In this case, when we look at the power generation mix in each scenario shown in Figure 3, it shows that the supply ratio of solar power and wind power to the total demand is not so large. Even in the most innovative B2DS, the solar power and wind power account for 17% and 20% of the total respectively in 2060.
In this paper, based on the cumulative generation capacity and in-use stock shown in the diffusion scenario, the introduced amount (GW or number of vehicles) in each year was estimated by Equation (1).
I t = S t S t 1 + a = 0 a m a x I t a g ( a )
where: I t is the introduced amount (which accounts for retirement of end-of-life capacity or product), S t is the accumulated stock amount in year t, a is the number of years of use of the product and g ( a ) is the product life distribution (which is being used here to estimate the retirement of end-of-life product in any given year).
The average lifetime of each technology and the shape parameter α which determines the shape of the lifetime distribution curve are set as shown in Table 2. First, the amount of discarded or retired capacity in each year is estimated by the Weibull distribution and then the annual introduced capacity is estimated by Equation (1). At this time, three scenarios (reference scenario, high scenario and low scenario) were set for the market share of CIGS solar panels and CdTe solar panels and wind power using permanent magnet type generators (PMG) as shown in Table 3 by referring to the literature [13,20]. This market share is important, because there are various technology alternatives within the sub-sectors that could be used.
Figure 4, Figure 5 and Figure 6 show the estimated annual introduced capacity for each technology. In this case, although 9 scenarios are calculated (because there are three scenarios for CIGS/CdTe and PMG share ratios in addition to the three diffusion scenarios of each technology), the selected figures show the representative range of scenarios: the combination of 2DS-Ref is the base scenario, the combination of RTS-Low is the minimum value and the B2DS-High is maximum value.

2.2. Forecasting Metal Demand Considering Expansion of Low Carbon Energy Technology

Typical methods for estimating future metal demand are called stock flow analysis (SFA) or material flow analysis (MFA). In these analytical methods, inputs to society by end-use and product lifetime are typically used and outputs from society are calculated on as outflows at a given time. Products (and their contained materials) become productive stock within society for the given lifetime and may further experience a period of non-productive lag time before becoming outputs. Outputs may ultimately be disposed of or recovered for recycling. Then, the future demand is estimated from the difference between the input, the output and the stock as shown in Equation (1). As most materials will be utilized in a variety of end-use products, each of which has its own lifetime distribution (which is ideally estimated from empirical data), the stocks and flows of materials can be broken-down on the basis of each product or product type.
There have been many studies applying SFA or MFA, not only for the analysis of resource requirements. Müller et al. [65], Creast et al. [66] and Hatayama et al. [67] estimated the future demand for steel, copper and aluminum under long-term economic development at the global level by using this method. However, these estimates did not take into consideration the diffusion of low carbon energy technology that could greatly change future resource supply-demand balance. This approach could be considered to be similar to our top-down model, described below.
On the other hand, Elshkaki et al. [68] and Busch et al. [21,69] estimated future demand for metal resources used in solar power, wind power and next-generation vehicle and so forth. By using low carbon scenarios. Busch et al. [21,69] applied a SFA with a detailed examination of the components of low carbon technologies and an assessment of their recyclability or reusability. However, demand used for other uses such as buildings and mobile phones were outside of the scope. In the current study, a similar approach for estimating required materials for low carbon technologies is taken in our bottom-up model.
When evaluating resource constraints in low-carbon scenarios, it is desirable to take into consideration two factors of demand increase: (1) the global growth in population and economic activity; (2) the spread of low carbon energy technology. Therefore, in this paper, a top-down model for evaluating (1); a bottom-up model for evaluating (2) and an integrated model in consideration of both of these component models were developed. The detailed descriptions follow.

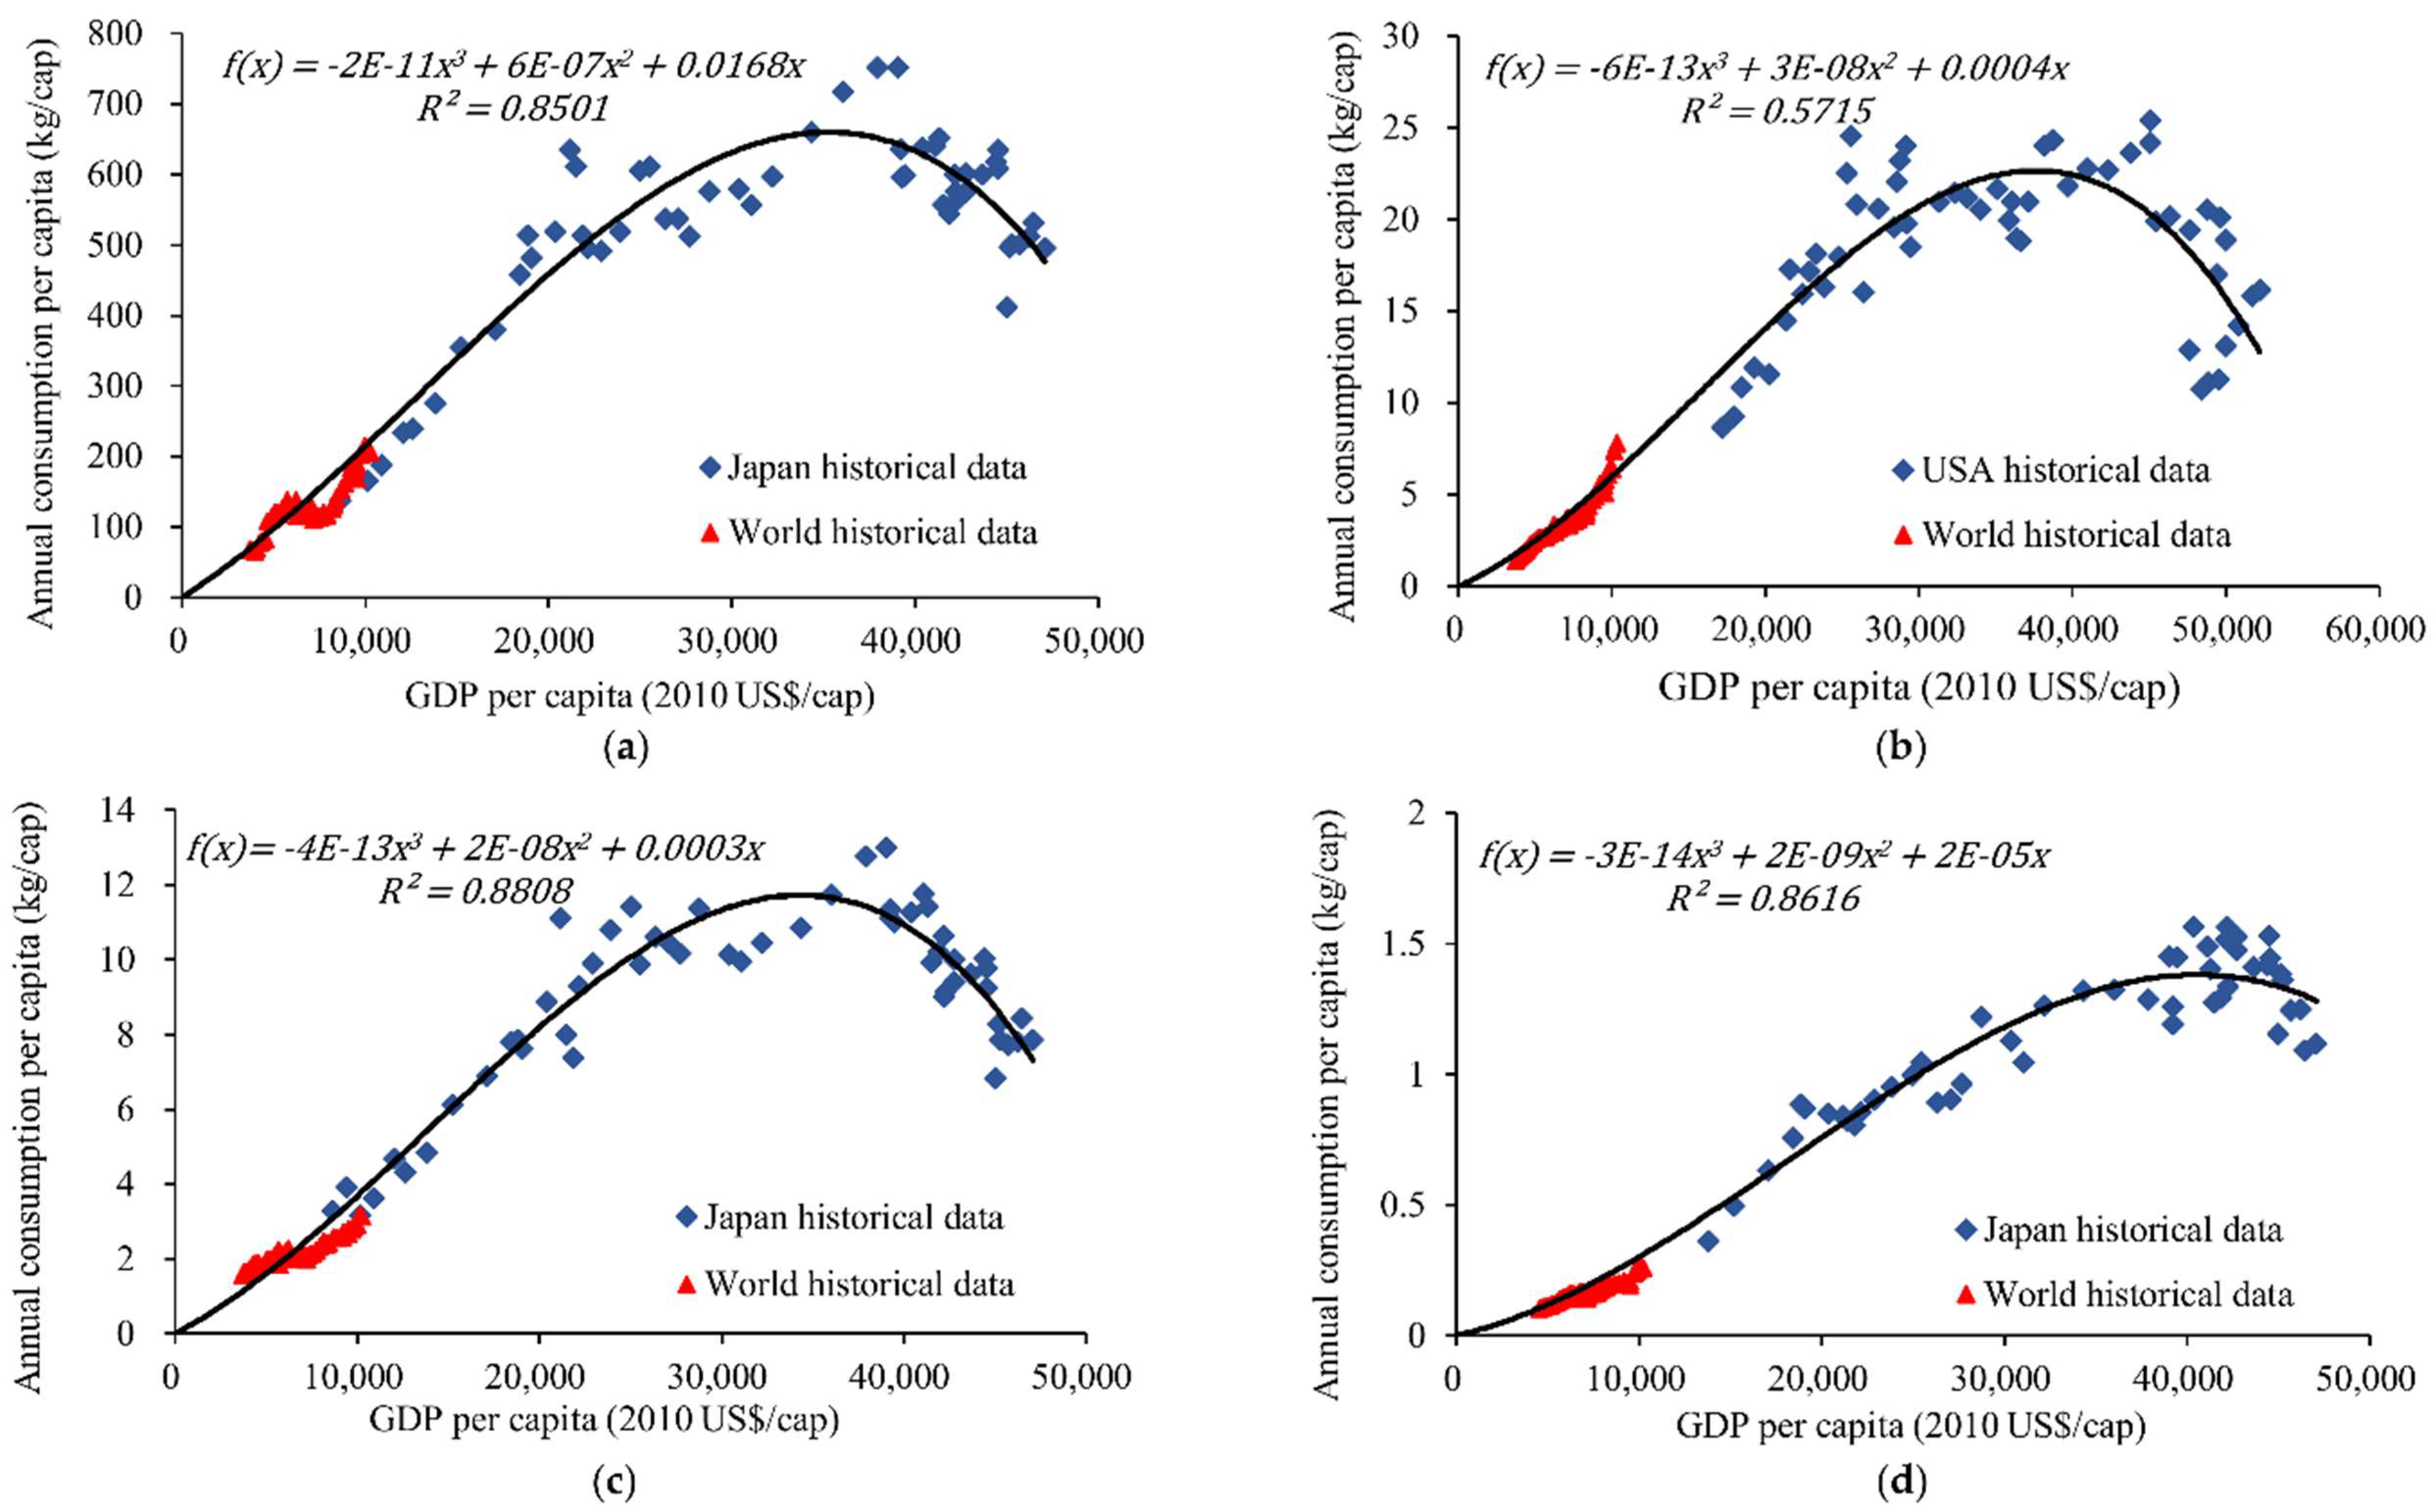
2.2.1. Top-Down Model

In the top-down model, future metal demand is estimated by correlation between metal consumption per capita and GDP per capita. It has been pointed out previously that the metal consumption in developed countries such as Japan and the United States may be observed to have reached a peak of intensity and to subsequently decouple from economic growth [70]. In terms of copper, Figure 7a shows that GDP/cap has continued to increase while consumption per capita has decreased since around 1990. This can be explained with reference to Figure 7b, as follows. In the early years of economic growth, metal consumption will sharply increase due to the increase of buildings and industrialization but gradually the rate of increase will decline due to the increase of the service economy and saturation of major infrastructure and as economic growth further progresses, alternative materials are developed and utilization efficiency is improved, therefore metal consumption per capita will decrease.
In the top-down model, the correlation between metal consumption per capita and GDP per capita is expressed by a cubic Equation (2) based on this characteristic.
f ( x ) = α x 3 + β x 2 + γ x + δ
where f ( x ) is the metal consumption per capita, x is GDP per cap and it is considered that no metal resources are consumed at the stage when the economy is not developing at all in this paper, therefore the intercept δ is assumed to be zero.
Historical GDP and population data was obtained from the World Bank [71] and future GDP growth rate and population were based on data used by the IEA [4]. In this case, we used the data of Japan, United States and Europe, as developed countries where data was readily obtained, to fit the historical data and determine the values of the parameters in the equation. It was further assumed that the overall world trend would develop in line with the best fit country data. Here, metal consumption was obtained from various sources [48,49], however we could only obtain the data for steel, aluminum, copper and nickel—the bulk commodity metals. Therefore, other metals whose consumption data are not readily accessible were estimated by subtracting low carbon energy uses from total production in 2015 (data is from [74]) and assuming that the diffusion growth rate of other uses is comparable to the GDP growth rate. This growth rate was therefore set as 4.2% for 2016–2030, 3.5% for 2031–2040 and 2.2% for 2041–2060 referring to the literature [4].
As outlined in the previous section, other authors have used similar techniques to estimate future demand for metals. The important concern in this paper is that the focus is on low carbon technologies specifically, so the top-down model is not able to adequately deal with advances in low carbon technology directly.

2.2.2. Bottom-Up Model

The bottom-up model estimates the influence of the introduction of specific new technologies on metal demand. Assuming that a specific product p is input into society with the amount I in year t, the demand M p , t of the metal resource used in the year t is expressed by Equation (3).
M p , t = I p , t · W p , t
where W p , t is the content of the target metal contained in the product p. As an example of new products, electric vehicles are expected to replace existing gasoline vehicles and spread widely throughout society. However, the top-down model estimates the future metal demand without consideration of these changes, therefore the change in the metal demand due to the spread of the new product p is expressed by Equation (4) in consideration of the decrease of the old product q simultaneous with the increase in the new product.
Δ M p , t = I p , t · W p , t I q , t · W q , t
As described earlier, a number of SFA models have been used to examine low carbon energy scenarios. In the current model, similar techniques are used, while the bottom-up model focuses only on the low carbon technologies, not considering other products in society. The combination with the top-down model is described below, which is aimed to overcome the constraints of both models.

2.2.3. Integrated Model

The integrated model estimates future metal demand in consideration of two macroeconomic factors of metal demand in the form of global growth in the economy and population, as well as the expansion of low carbon energy technology. In this case, the cumulative demand C t n t 1 from the starting year t 1 to the year t n is estimated by Equation (5) that is an integrated model combining the top-down and bottom-up models.
C t n t 1 = x t 1 x t n f ( x ) d x + t = 1 n p P Δ M p , t
where p represents a set of target products.
Metal intensity of each technology was set as shown in Table 4, Table 5 and Table 6 and each metal price also indicated to express the price importance of different metals for different technologies. Metal prices vary with demand across all sectors, as well as speculative investment and it is likewise expected that there would be some increase in price associated with scarcity of minerals, that would ultimately impact their usage within technologies. For the sake of this study, prices were considered to be constant, as their prediction is not currently feasible.

2.3. Sustainability Analysis

The various approaches to criticality assessment typically involve both supply risk and vulnerability to supply risk, using a variety of indicators. Rather than take on the full suite of indicators, in this study a set of simplified indicators crucial to the context of the issue being evaluated (low carbon energy) were utilized. The components used for supply risk (potential for physical depletion or scarcity), the vulnerability of these technologies (price relevance of metals) and the importance of these technologies to achieving the low carbon future were considered factors of supply vulnerability, while environmental impact was also considered.
The possibility of physical depletion as a factor causing a supply shortage of metals was focused on in this study and sustainability was evaluated by comparing the estimated future cumulative demand with reserves and resources. When the estimated cumulative demand exceeds the reserves or resources, the technology becomes economically or physically unusable and it is determined to be unsustainable. The values of reserves and resources were set as shown in Table 7 by referring to various sources. Regarding the amount of resources, it is important to note that the estimated value varies depending on the literature and it may change greatly depending on future surveys, while it is well-understood that reserves will change by definition as cost of extraction, price of metal and technologies change over time. In addition, supply restrictions become obvious not only when exhaustion occurs but when supply cannot keep up with demand increase. Therefore, we compared the estimated annual demand for low carbon energy technology with production in 2015 (Data various [74,79]) in order to take a first-order examination of the feasibility of the pace of expansion required.

2.4. Estimation of Recycling Effect on Future Metal Demand

Effective measures for sustainable use of metal resources would be anticipated to incorporate effective treatment of waste streams through a strategy of reduction, reuse and recycling. Each of these management strategies has the opportunity to reduce primary metal consumption in the product life cycle as shown in Figure 8. Substitution of metals or the use of alternative technologies is another factor that is likely to be important in the evaluation of criticality of minerals, particularly as the effects of scarcity could make minerals financially unavailable. In this study substitution was not considered, as the aim was to examine known technologies and key minerals utilized in them, although this may ultimately lead to policy suggestions including promotion of alternatives.
Among the considered strategies, it is expected that the metal intensity of low carbon energy technology will be reduced by future technological development. At the same time, it is desirable to construct a recycling-oriented society by using waste as resources rather than disposing of it. However, compared with mobile phones and personal computers, little consideration has been given to how much the recycling of low carbon energy technology will affect future metal demand [21,69]. Therefore, in this paper, we estimated the future discarded low carbon energy technologies and the potential change in future primary demand by comparing each of the scenarios shown in Table 8. At this time, future primary metal demand M p , t with consideration of recycling is calculated by Equation (6).
M p , t = M p , t D i s c a r d p , t · R e c y c l i n g   r a t e p
where D i s c a r d p , t is the amount of product p discarded in year t and was estimated by the Weibull distribution. R e c y c l i n g   r a t e p is the recycling rate of discarded materials, shown in Table 8.
In this case, it should be noted that the technological hurdles of recycling vary depending on each metal or product. For example, it is relatively simple to recycle large permanent magnets from wind turbines, as well as copper and steel, while recycling a tiny amount of platinum from a fuel cell or indium from a solar panel could be more problematic due to the quantities and the difficulty in separating fine layers of material. However, in this study, the same recycling and reduction rate was given to all metals without considering these differences, in order to simply estimate the potential change in future primary metal demand.

2.5. Identifying Critical Metals That Require Priority Measures

In order to utilize metal resources on a sustainable basis and to introduce low carbon energy technology according to the scenarios, we must identify the critical metals that require priority measures and develop the necessary technologies and system design to manage them. Therefore, in this research, critical metals that require priority measures were identified by creating a bubble diagram that shows “the depletion potential” or “the ratio of demand increase” on the horizontal axis, “the importance for decarbonization” on the vertical axis, and expresses “the environmental impact” by the size of the bubble.

2.5.1. Depletion Potential and Ratio of Demand Increase

Resource depletion problems are frequently discussed—especially for rare metals. In this paper, as mentioned briefly in Section 2.3, this was evaluated by Equations (7) and (8) to identify whether there will be sufficient reserves or resources for future demand.
D e p l e t i o n   p o t e n t i a l   ( r e s e r v e s   b a s e d ) = C u m u l a t i v e   d e m a n d t n t 1 R e s e r v e s t 1
D e p l e t i o n   p o t e n t i a l   ( r e s o u r c e s   b a s e d ) = C u m u l a t i v e   d e m a n d t n t 1 R e s o u r c e s t 1
In this study, the current reserves and resources are considered to be static and to have been used up when the depletion potential value exceeds 100%. The larger the value, the more metal demand will be consumed compared to current reserves and resources. In the various criticality studies described above, other indicators such as concentration of producing countries and political stability were considered as factors of supply constraint. However, this study referred to criticality evaluation at a global level in the literature [41,50] and embraced the factor of depletion potential as a basic and fundamental risk to evaluate at a global level from a long-term perspective.
In addition, the ratio of demand increase was evaluated by Equation (9). This is because supply restrictions may arise when supply cannot keep up with rapid demand increases as described in Section 2.3.
R a t i o   o f   d e m a n d   i n c r e a s e = C u m u l a t i v e   d e m a n d t n t 1 P r o d u c t i o n t 1

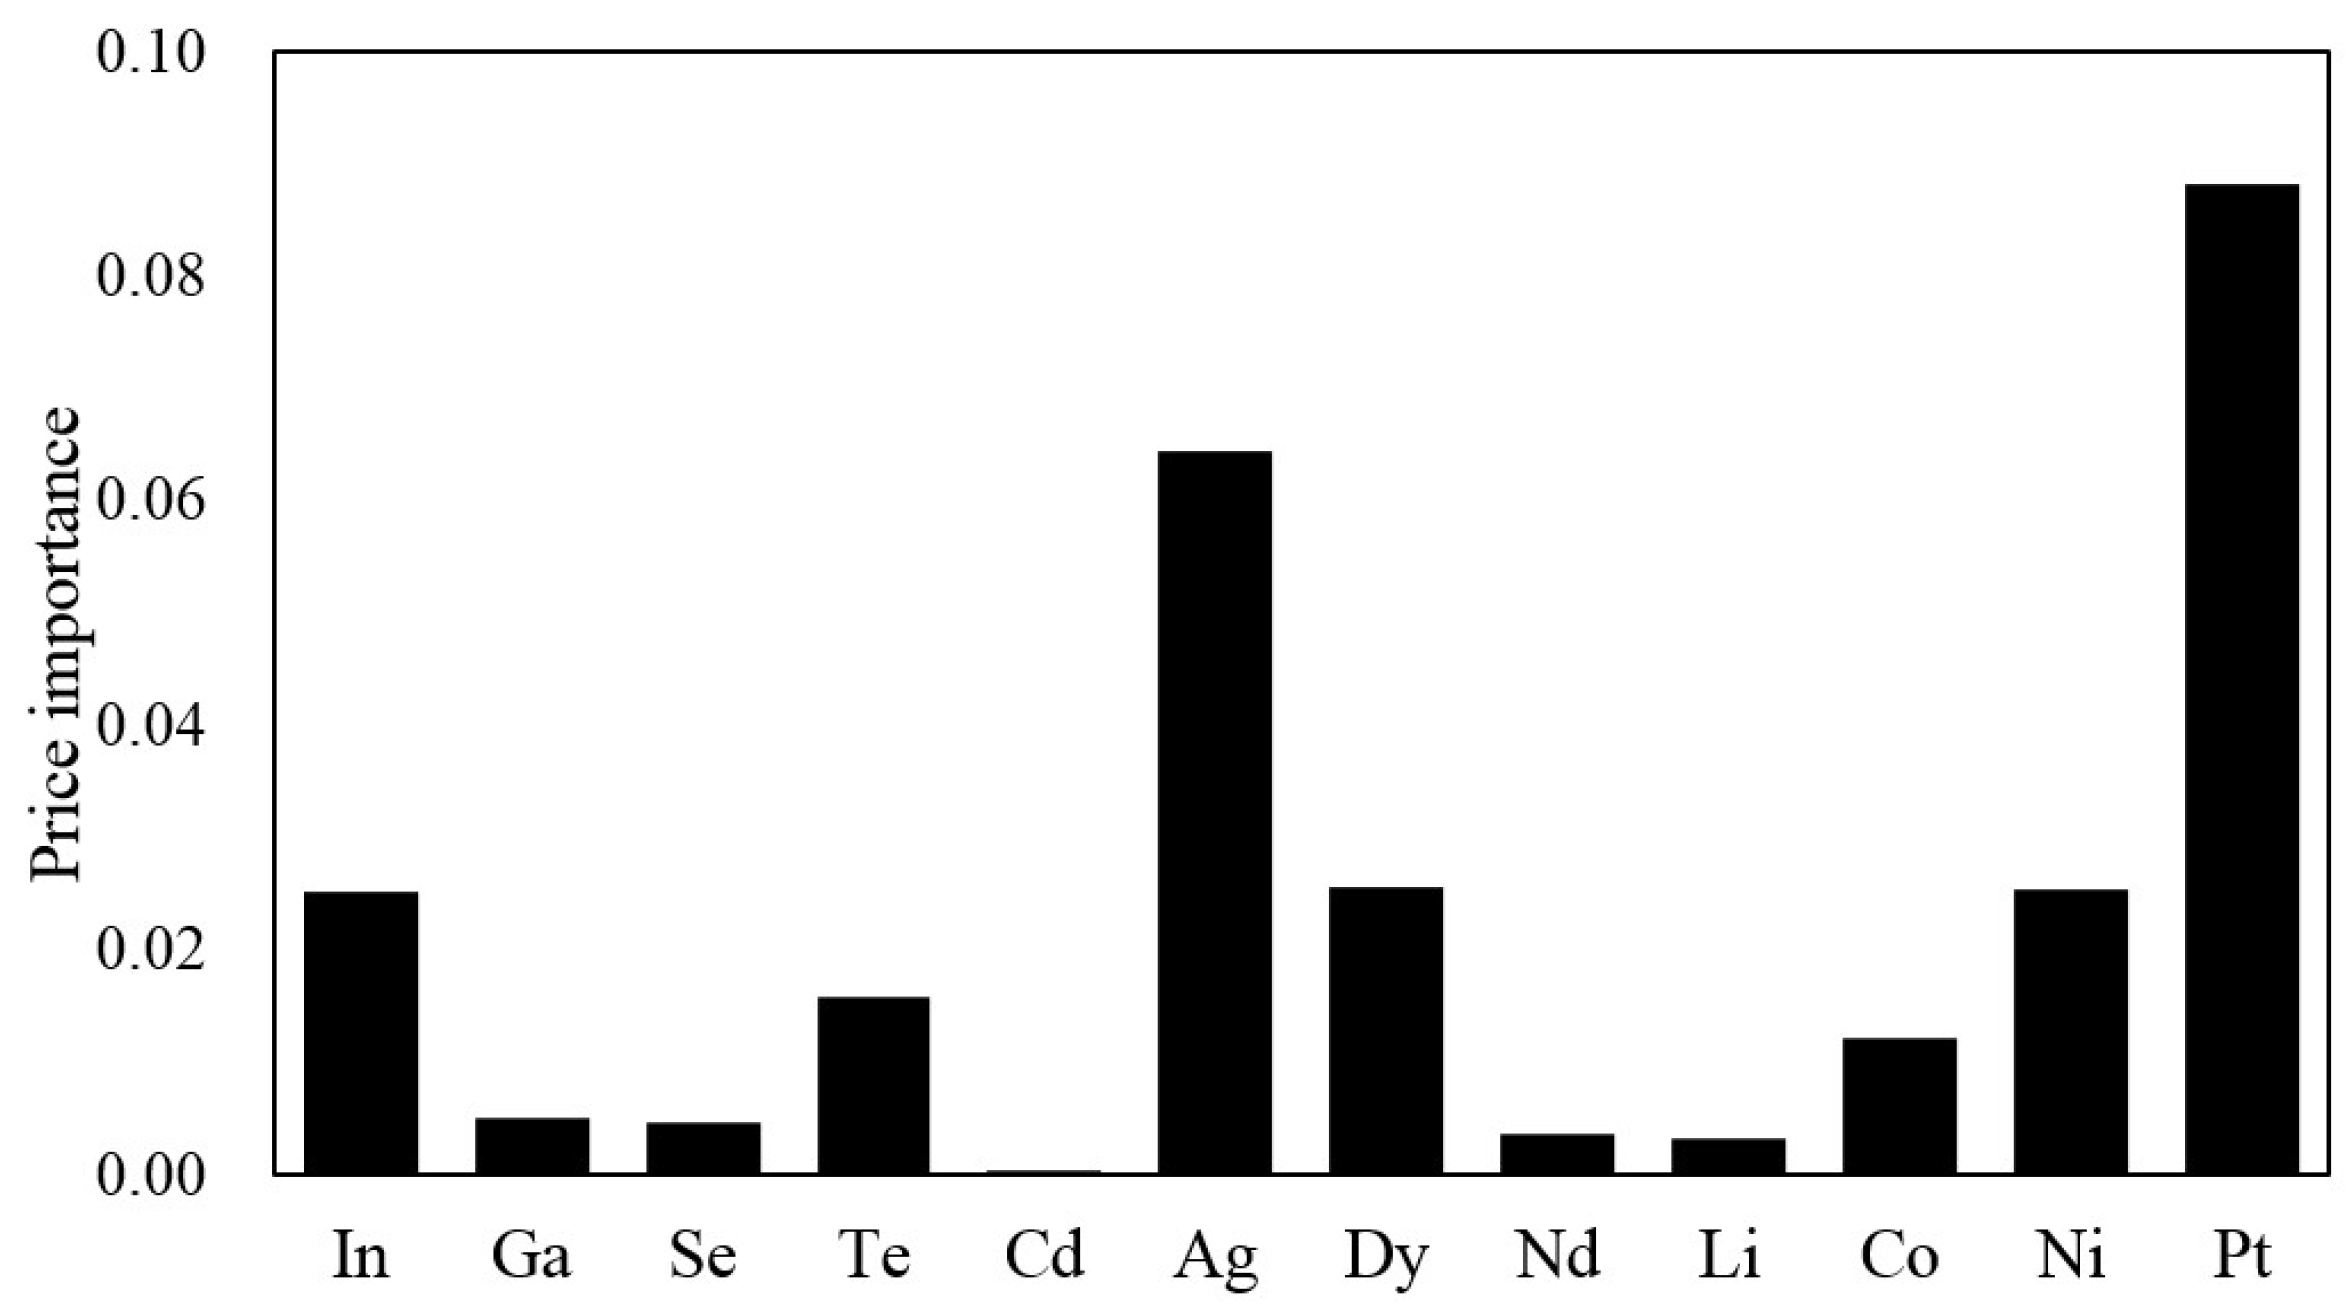
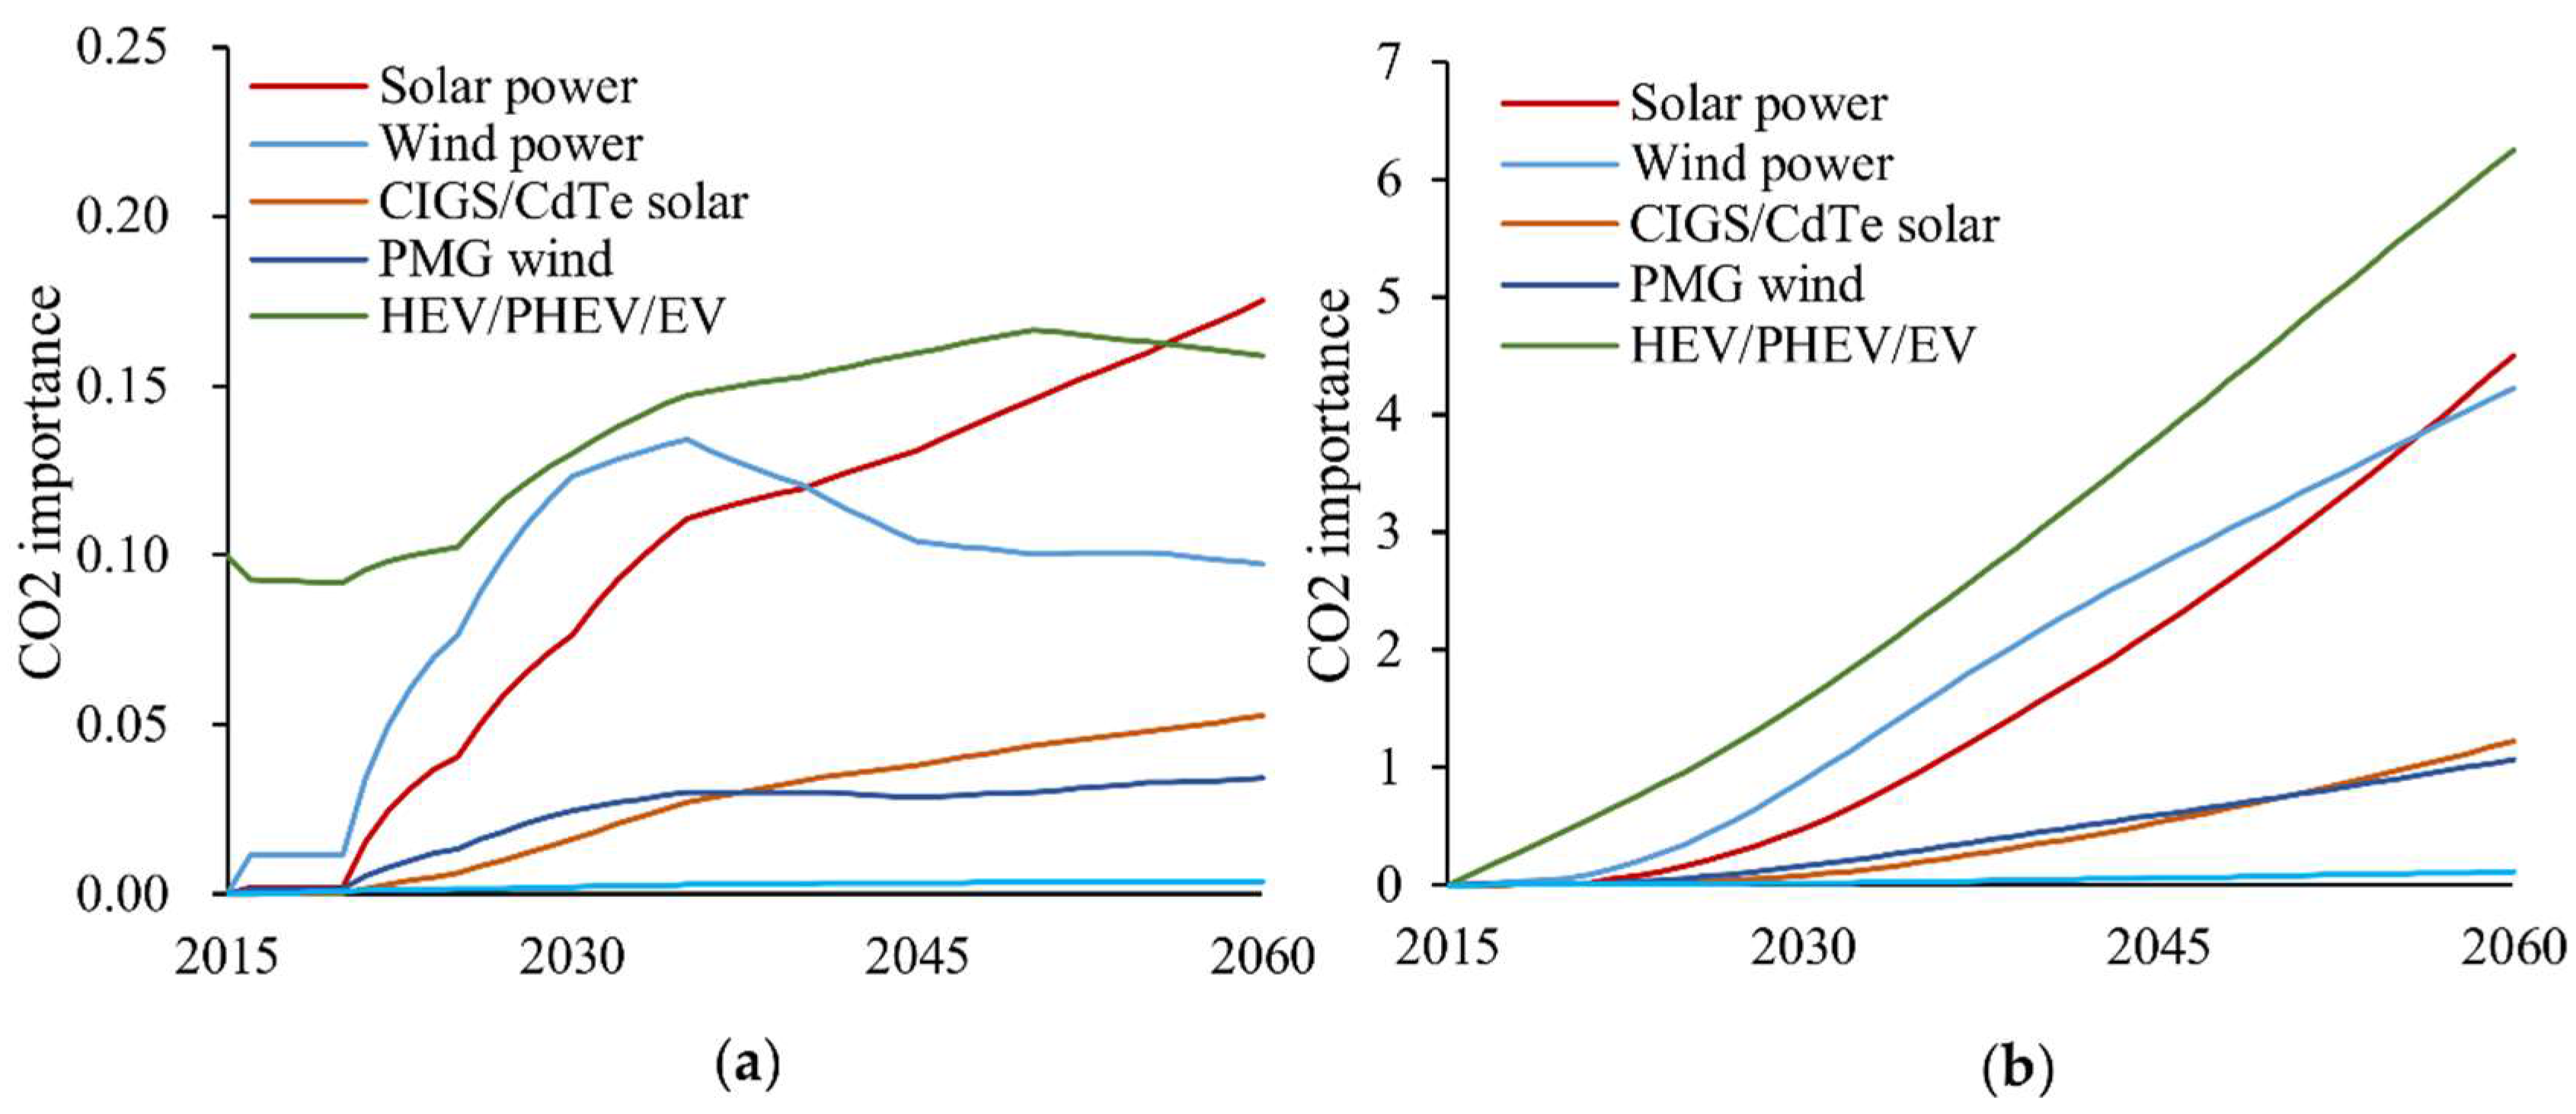
2.5.2. Importance for Decarbonization

The importance for decarbonization attempts to quantify the potential impact on the construction of a low-carbon society if supply constraints occur and consists of “CO2 importance” and “price importance”.
Firstly, CO2 importance shows how much CO2 reduction as indicated in the diffusion scenario of low carbon energy technology would be impacted by a decline in diffusion of product p due to resource constraint. It was estimated by Equation (10).
C O 2   i m p o r t a n c e = C p t n t 1 C t o t a l t n t 1
where C p is the CO2 reduction amount attributable to the spread of product p and C t o t a l is the CO2 reduction across the whole low carbon society in the scenario. The amount of CO2 reduction was cited from the report as shown in Figure 9 [4]. In this case, the amount of CO2 reduction has been calculated by comparing RTS and 2DS. It should be emphasized that C t o t a l includes not only the technology that was analyzed in this paper but also the effect of reducing Carbon Capture and Storage (CCS) and efficiency improvement and so forth. A high value of CO2 importance indicates that the decline of product p due to resource constraints has a large negative impact on the realization of the low carbon society. A low value of CO2 importance indicates that the role of product p using the targeted metal in the construction of low carbon society is relatively small.
Secondly, regarding the price importance, concerns about supply shortages in the face of demand growth could cause metal prices to rise. In this case, if the metal costs account for most of the technology costs, the metal price rises could become a serious obstacle to the introduction of the low carbon energy technology. Therefore, this paper proposes the price importance as an index showing how much influence resource constraint has on technology price. Price importance of product p is given by Equation (11).
P r i c e   i m p o r t a n c e = Q m e t a l Q p
where Q m e t a l is the metal price used for product p and Q p is the price of product p itself. In this case, the metal price referred to the USGS database [78] as shown in Table 4, Table 5 and Table 6 and the technology price referred to the IRENA database [85] as shown in appendix as Table A1. A high value of price importance indicates that the technology price depends greatly on the metal price, which means that there is a high possibility that the transition to the low carbon society will be inhibited by metal price fluctuations due to supply shortages. A low value of price importance indicates that the dependency of the technology price on the metal price is low and implies that the influence of metal price fluctuation on technology introduction is relatively small.
Finally, the importance for decarbonization was calculated by Equation (12).
I m p o r t a n c e   t o   d e c a r b o n i z a t i o n =   C O 2   i m p o r t a n c e + P r i c e   i m p o r t a n c e 2
At this time, CO2 importance and price importance were normalized in the range 0–1 and given equal weight.

2.5.3. Environmental Impact

Although constraints due to environmental impacts tend to be ignored in the evaluation of supply potential of metal resources, it is a crucial issue. This is because the greater the environmental destruction associated with the refining process of metals, the greater the possibility that supply will be difficult due to future environmental regulations. Accordingly, the magnitude of the environmental impact was set by referring to values from the literature [50]. The value utilized is an inclusive indicator of the influence of various discharges, harmful outflows, land use and so forth. in the metal refining process using the ReCiPe impact assessment method.

3. Results

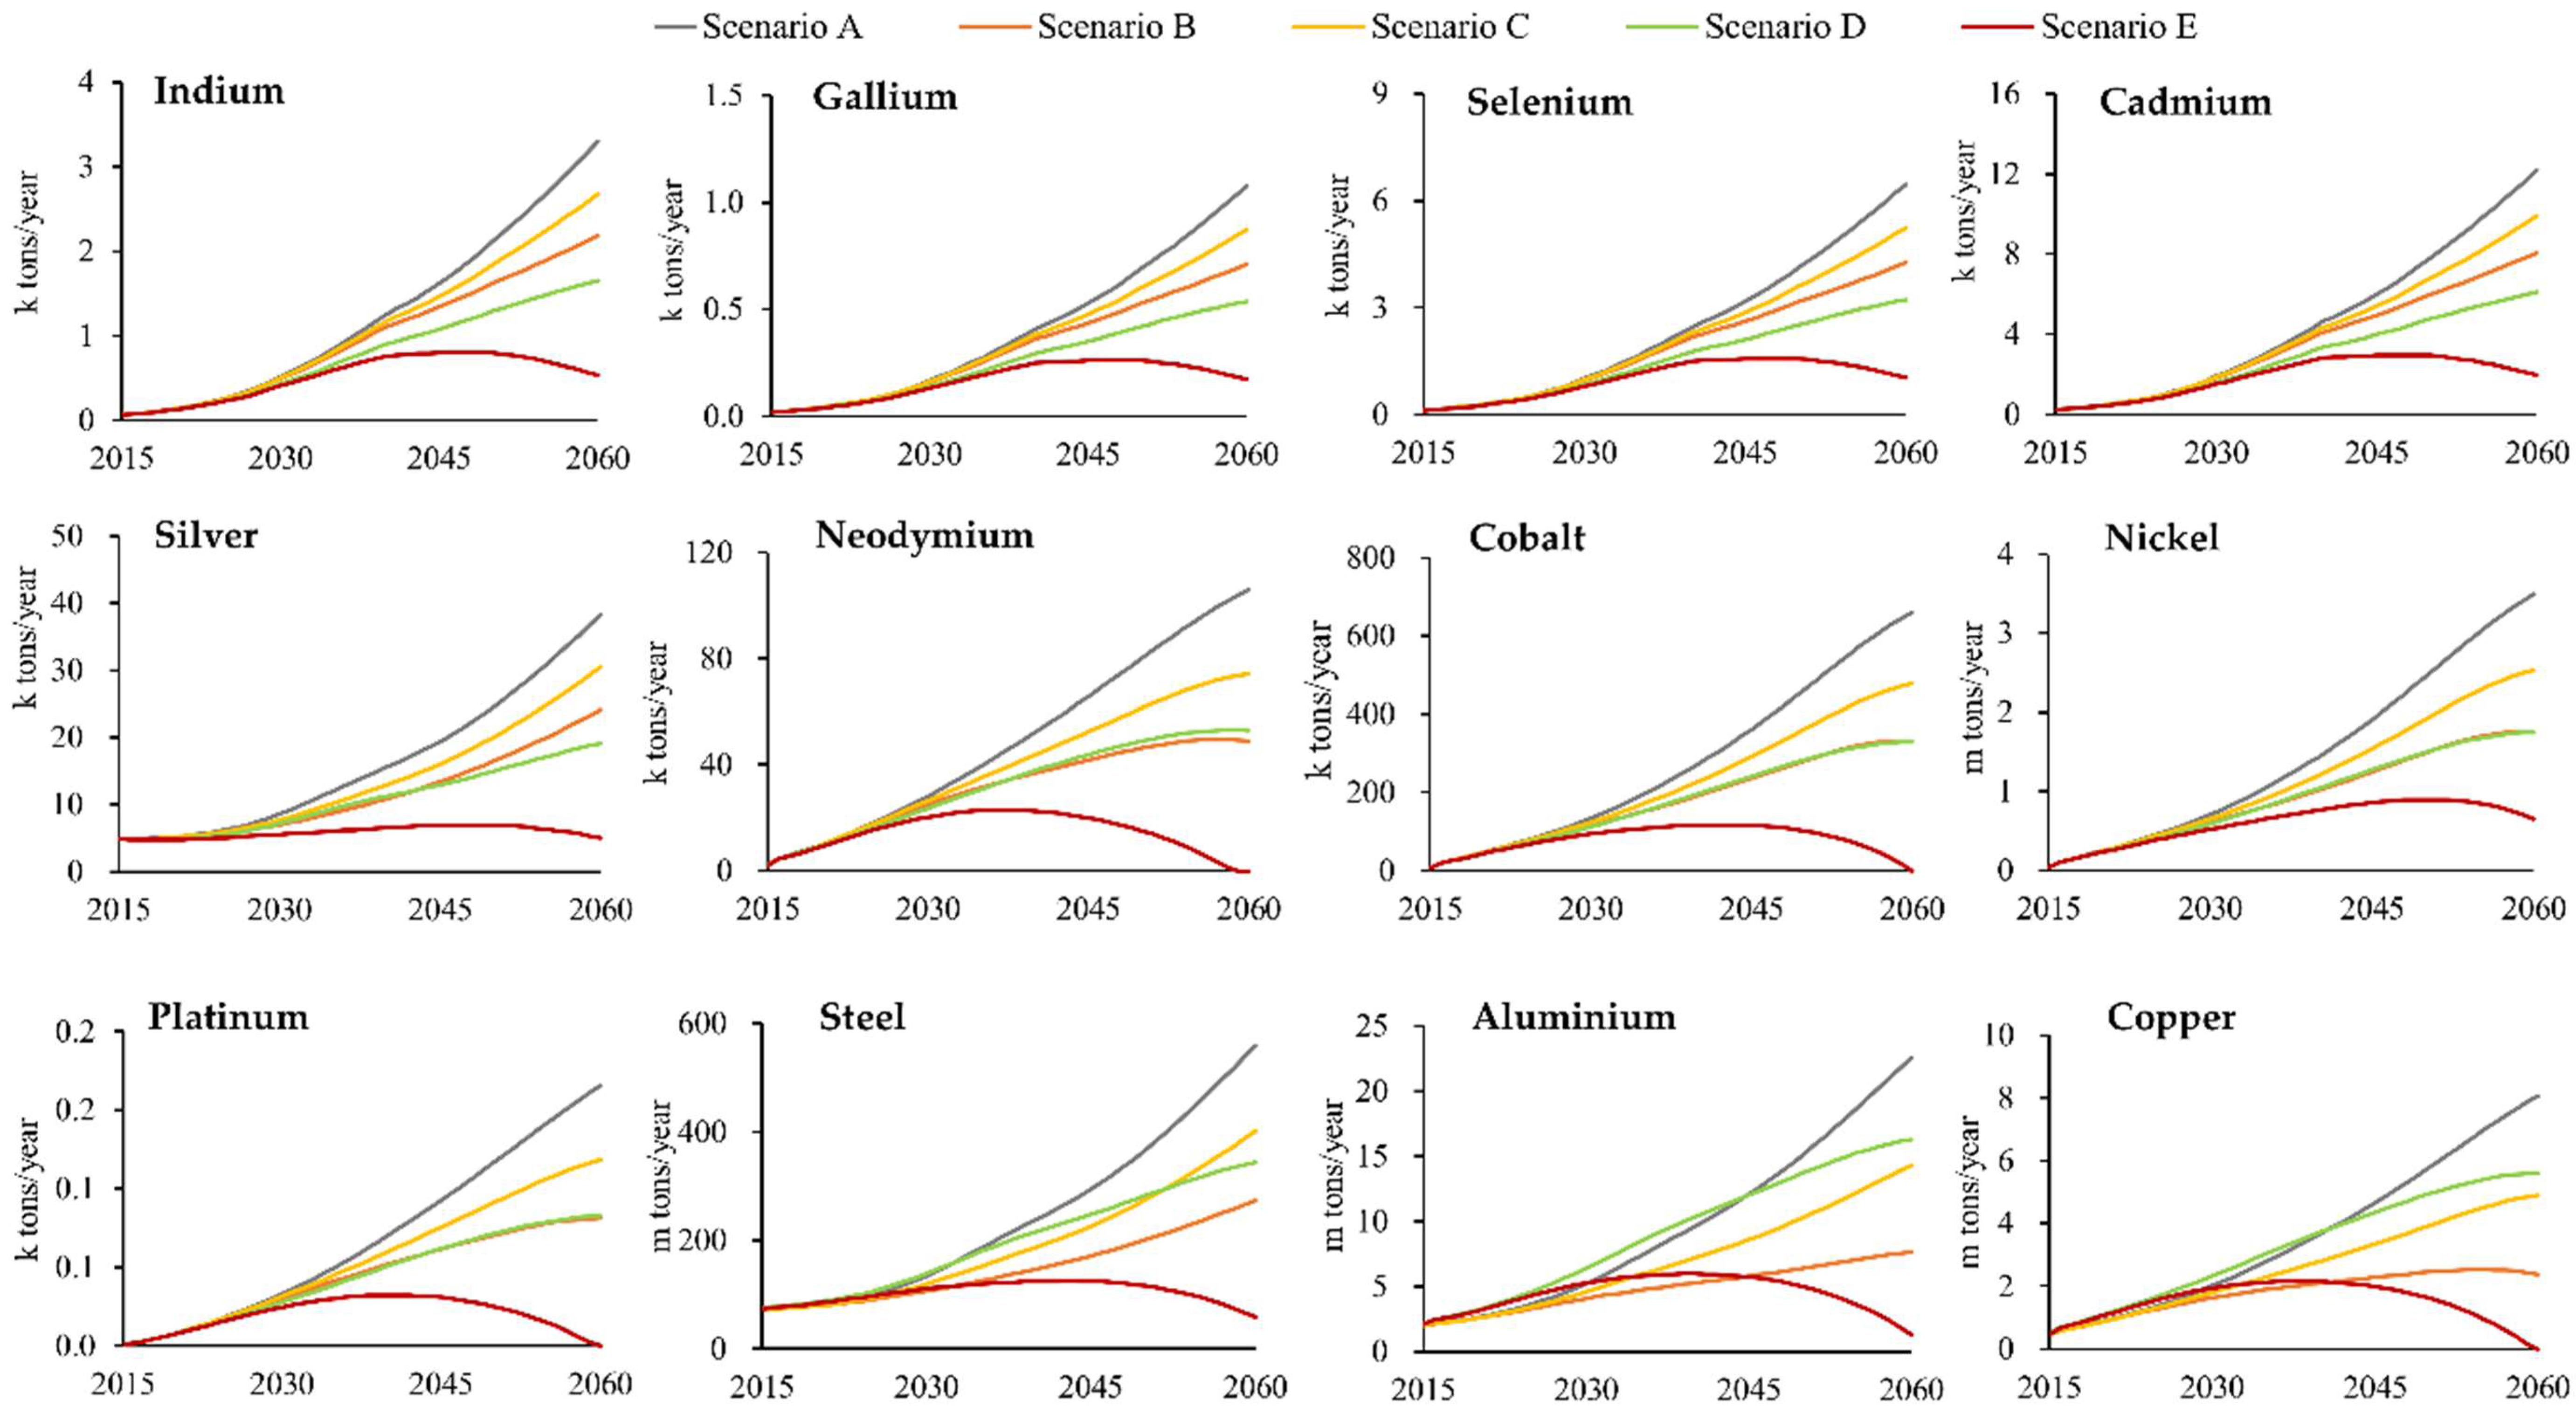
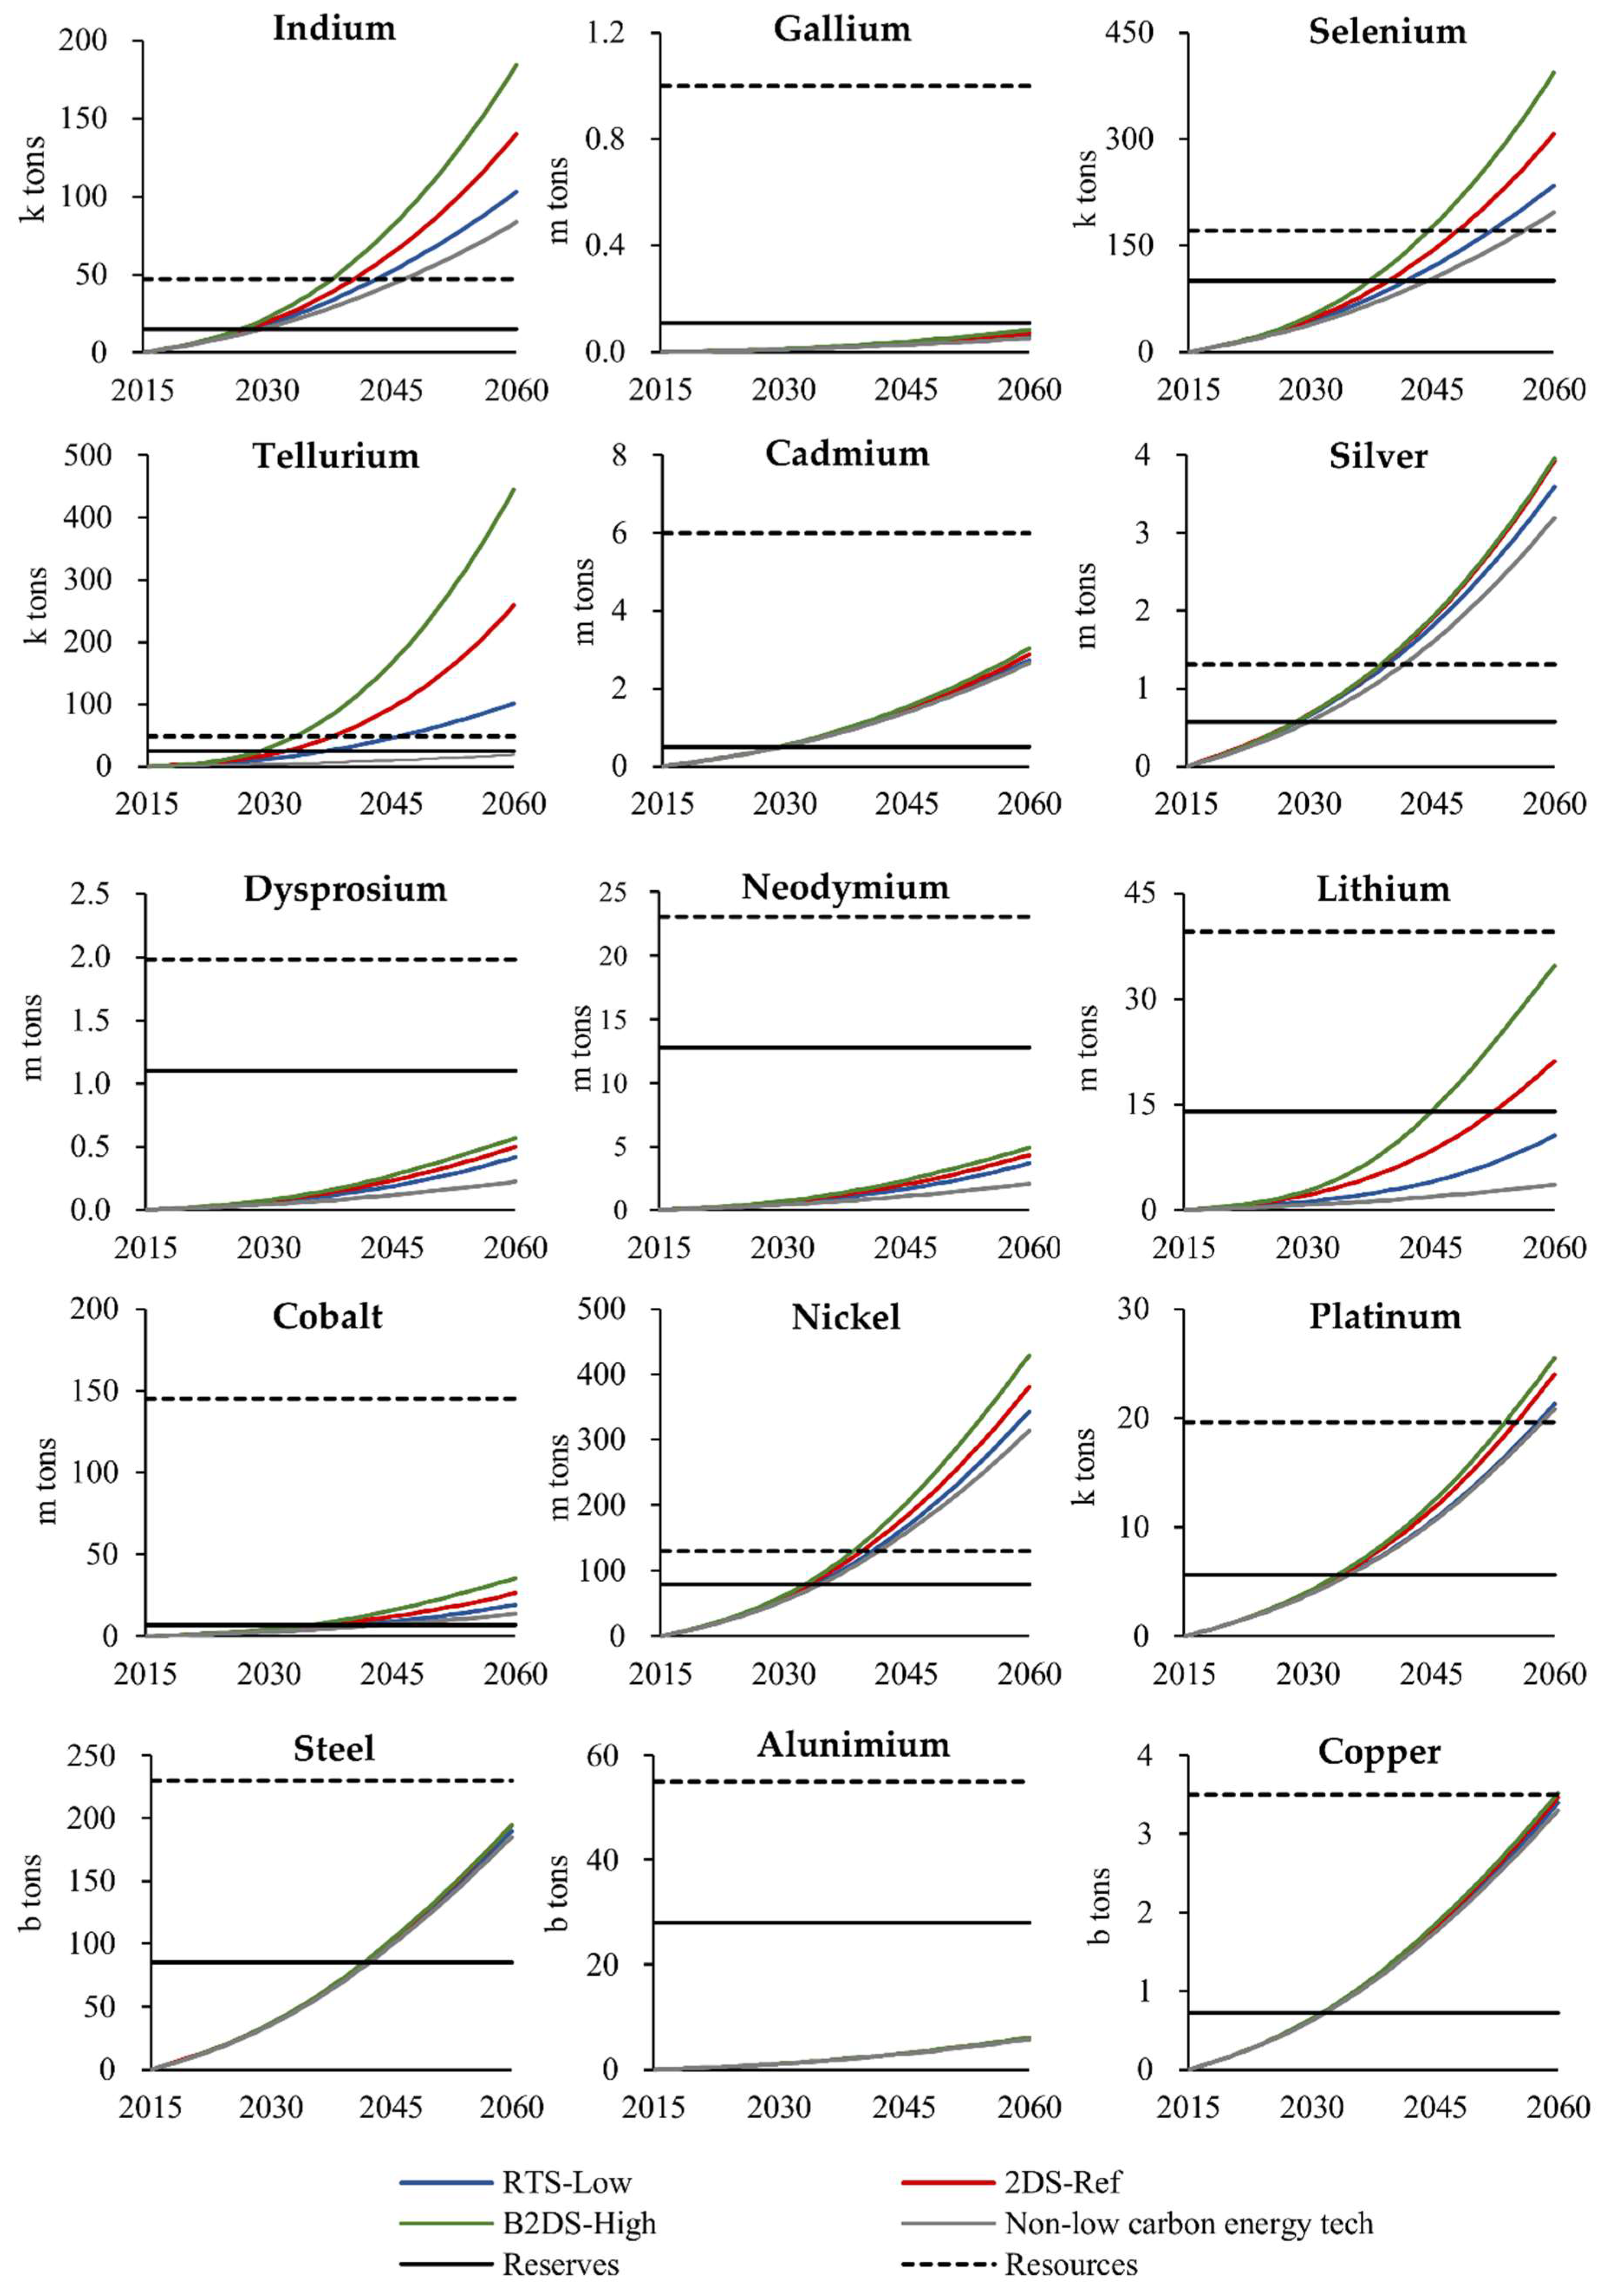
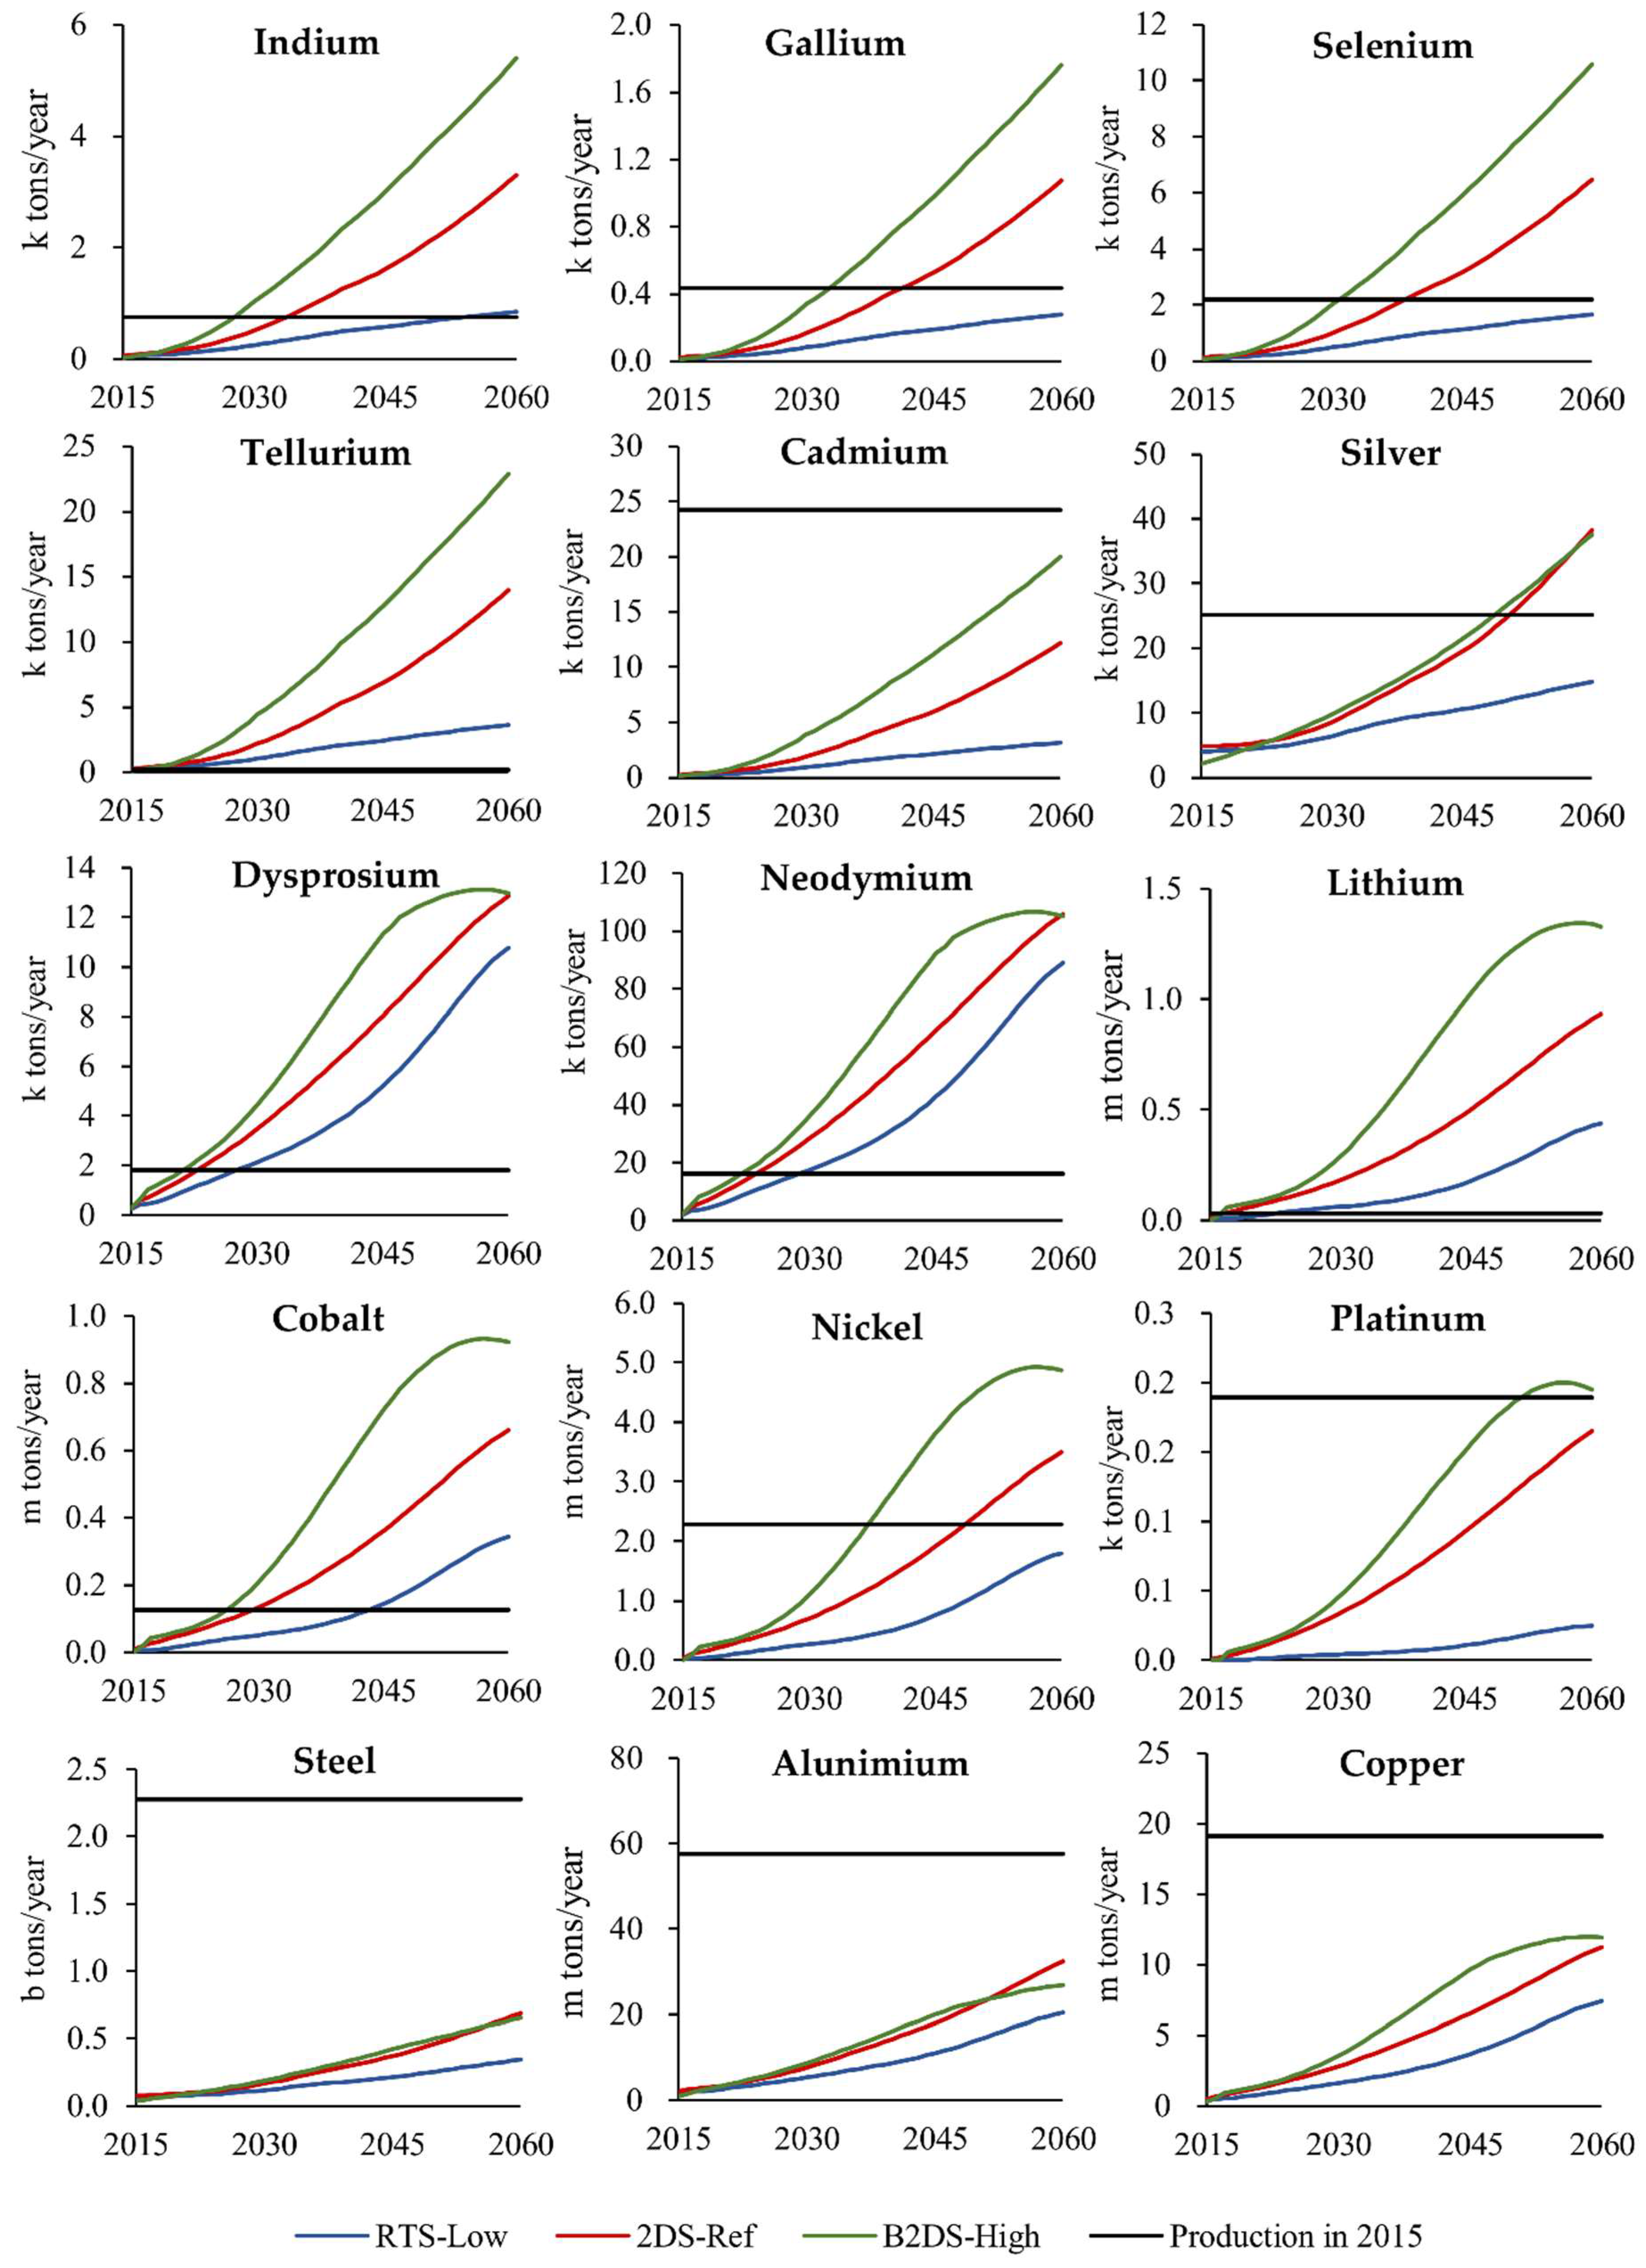
3.1. Future Metal Demand and Sustainability

Figure 10 shows the results of the top-down model, taking copper as an example (the full set of estimates is shown in the appendix as Figure A1). Since the Japanese historical data fitted most in the case of copper, an approximate equation prepared using Japanese data. In addition, Figure 11 shows the cumulative demand for all uses based on the integrated model in the case of metal whose data could be obtained and the bottom-up model in the case of other metals from 2016 to 2060 and Figure 12 shows annual demand estimates for various metals up to 2060.
From Figure 10 it can be seen that world historical copper consumption data is broadly consistent with the approximate expression based on detailed Japanese data. While there will be specific national trends and differences, for lack of more disaggregated data, we assumed that the world data will develop in line with the Japanese model in the case of copper. In addition, other metals were also considered to develop with same growth pattern with the best fitting country.
Figure 11 and Figure 12 show the impact of low carbon energy technology expansion on future metal demand, suggesting that it may significantly change the future supply-demand balance. Here it is estimated that cumulative demand exceeding the current reserves will occur by 2060 for all metals except for gallium, dysprosium, neodymium and aluminum. This implies economic resource depletion. In particular, in Figure 13 that shows estimated cumulative demand and reserves/resources ratio in the case of 2DS (the full set of estimates is shown in the appendix as Figure A2), demand for indium, tellurium and silver used for solar panels is estimated to be several times more than current reserves. Furthermore, compared with the much larger figure of available resources, the possibility of physical depletion of indium, selenium, tellurium, silver, nickel and platinum is also indicated. Potential depletion of reserves of some metals could be within the period 2030–2040, although breaching current resource limits is only likely beyond 2040. The implications of this are that the introduction of solar power and next-generation vehicles may potentially be hindered by resource depletion. On the other hand, with regard to dysprosium and neodymium, the cumulative demand up to 2060 is estimated to be only about half of the existing reserves and the possibility of constraints due to depletion of resources of these metals will be low.
Moreover, from the examination of annual demand for low carbon energy technology and current production shown in Figure 12, it is indicated that annual demand will exceed current production for all metals except for cadmium, steel, aluminum and copper by 2060. This means that these metals’ future production may not keep up with future demand due to rapid growth. Therefore, although there may be no problem with reserves/resources for minerals such as dysprosium and neodymium, supply shortages may arise due to rapid demand increase.
Figure 14 shows the breakdown of cumulative demand in the case of the 2DS (the full set of estimates is shown in the appendix as Figure A2). In this case, the demand for low carbon energy technology was estimated by using the bottom-up model and other uses was estimated by using the top-down model. As shown in Figure 14, demand drivers of bulk metals such as steel or base metals such as copper are dominated by economic and population growth of emerging countries. On the other hand, the demand increase for many rare metals is caused by the expansion of low carbon energy technology. That is, in order to maintain supplies of the many rare metals that have been shown to have the possibility of depletion, it is necessary to conduct appropriate management, such as recycling and reduction activities in this growth sector as the primary focus.

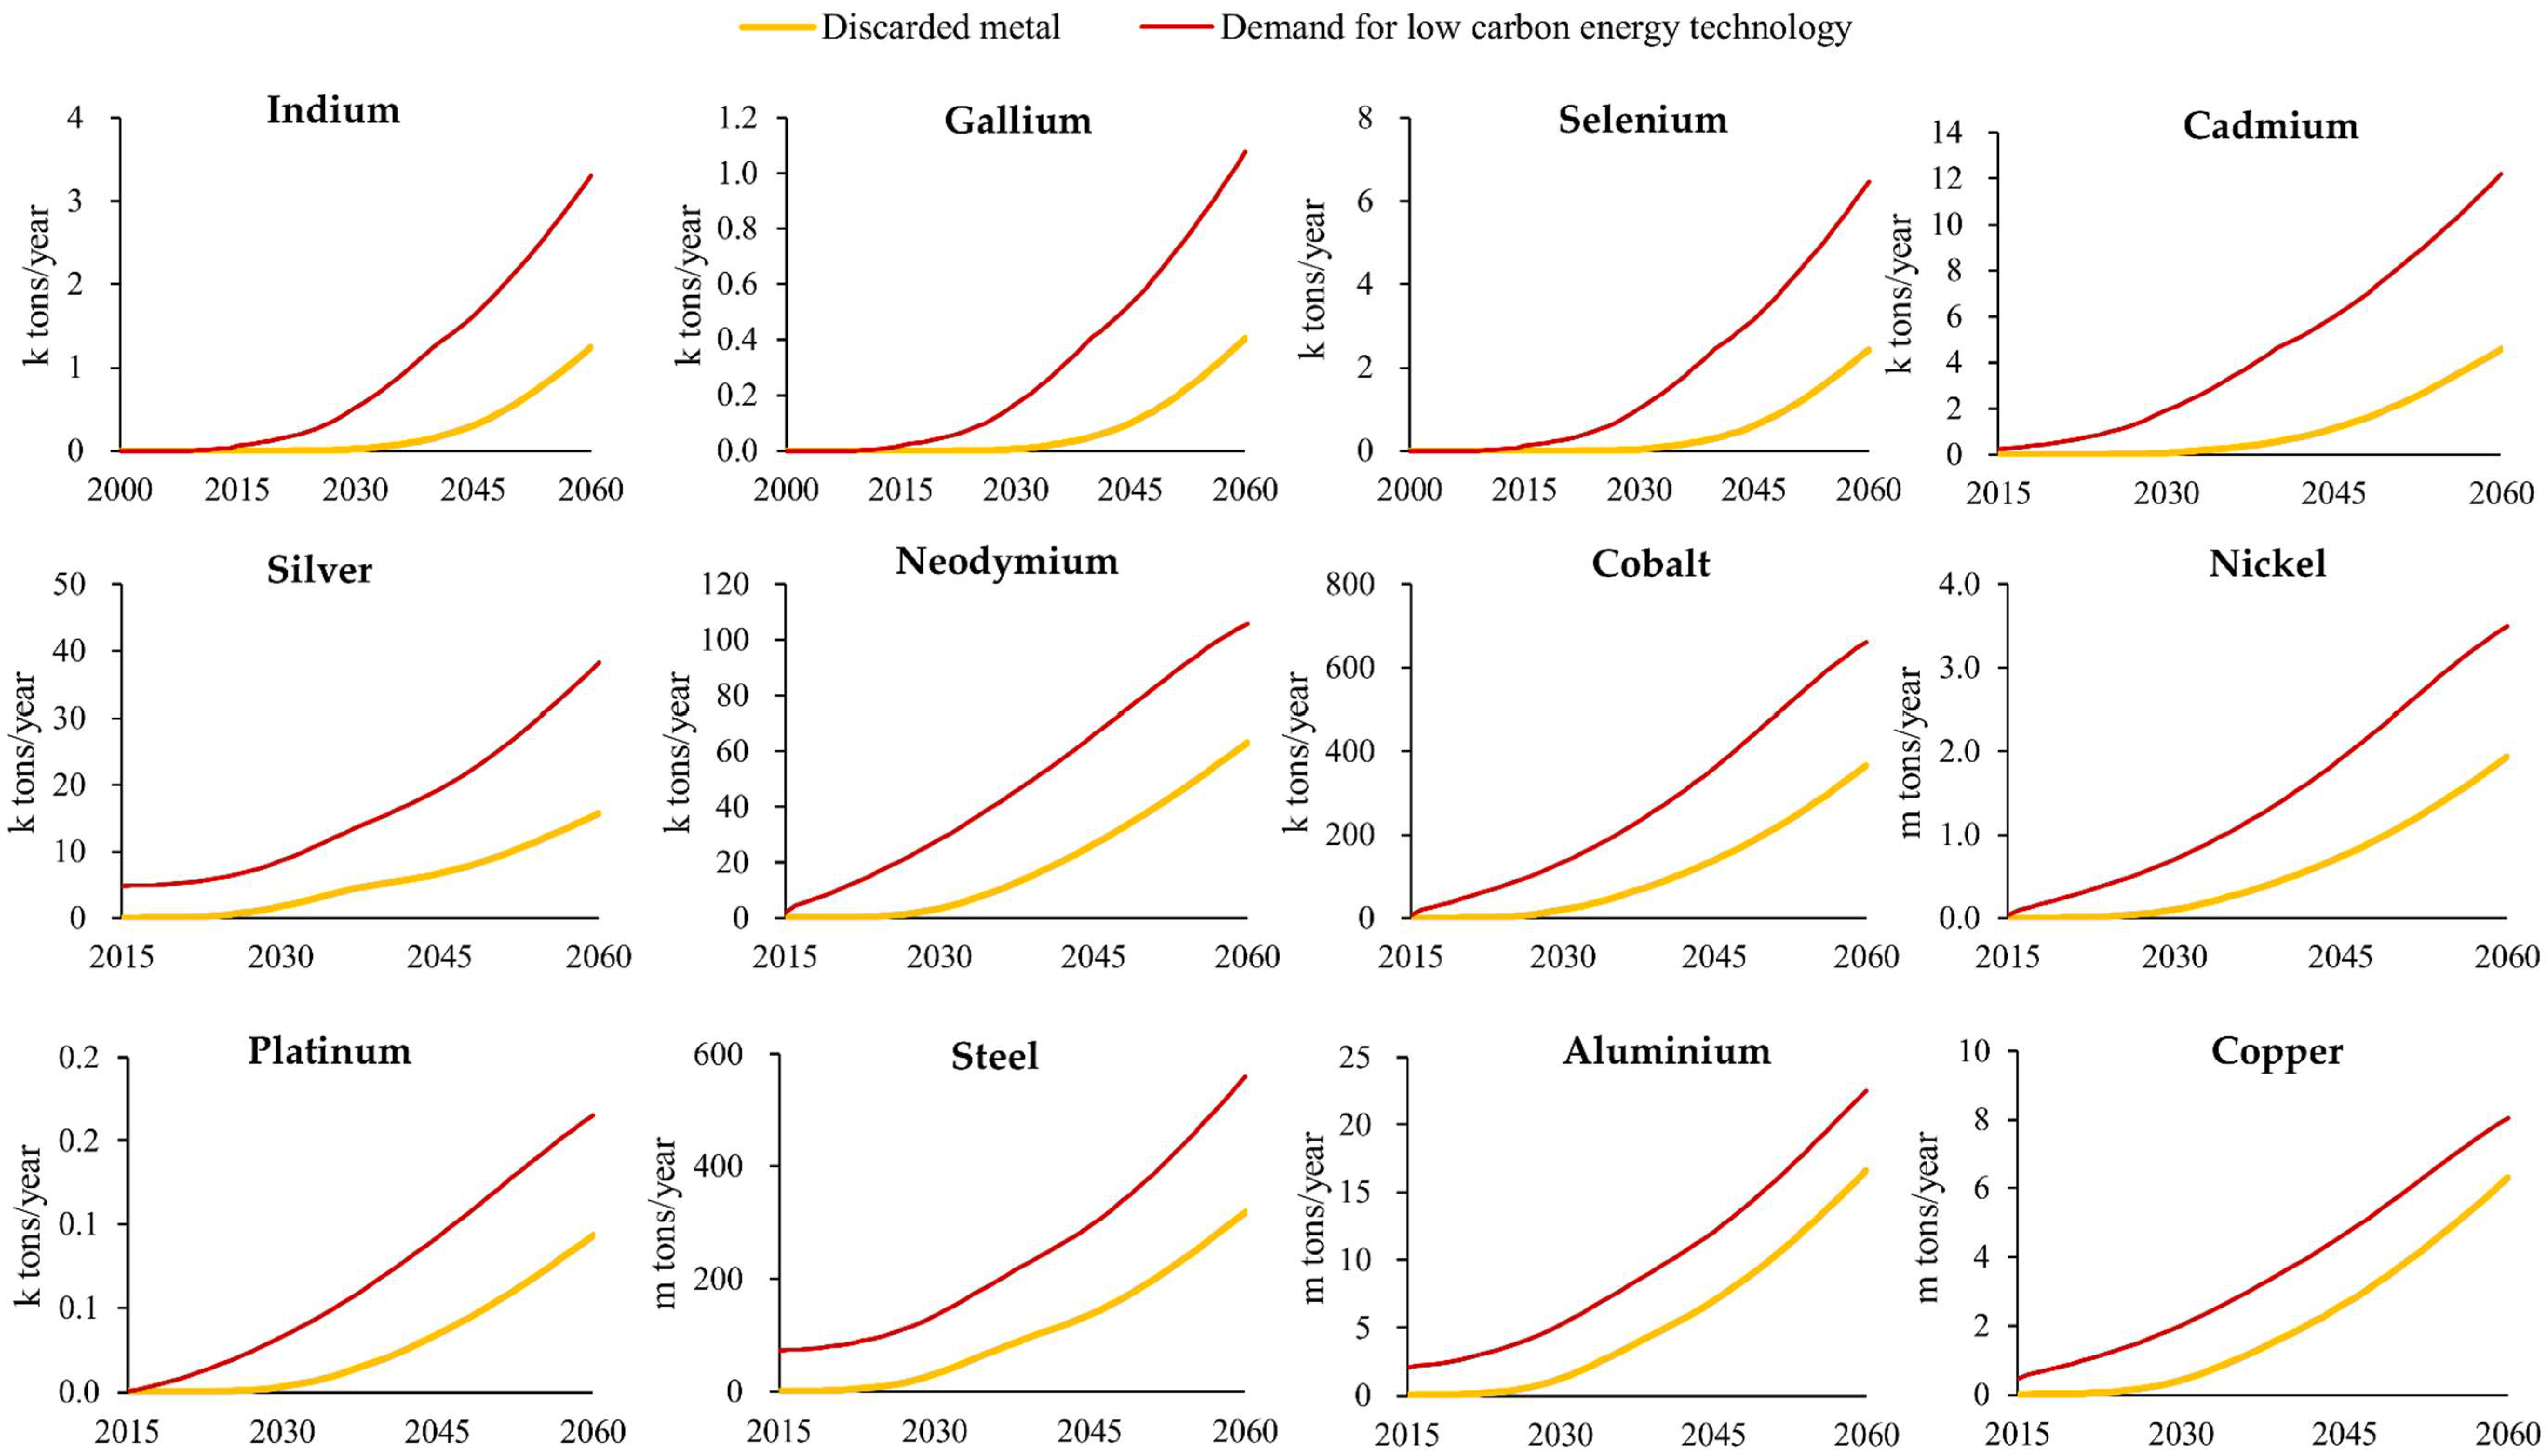
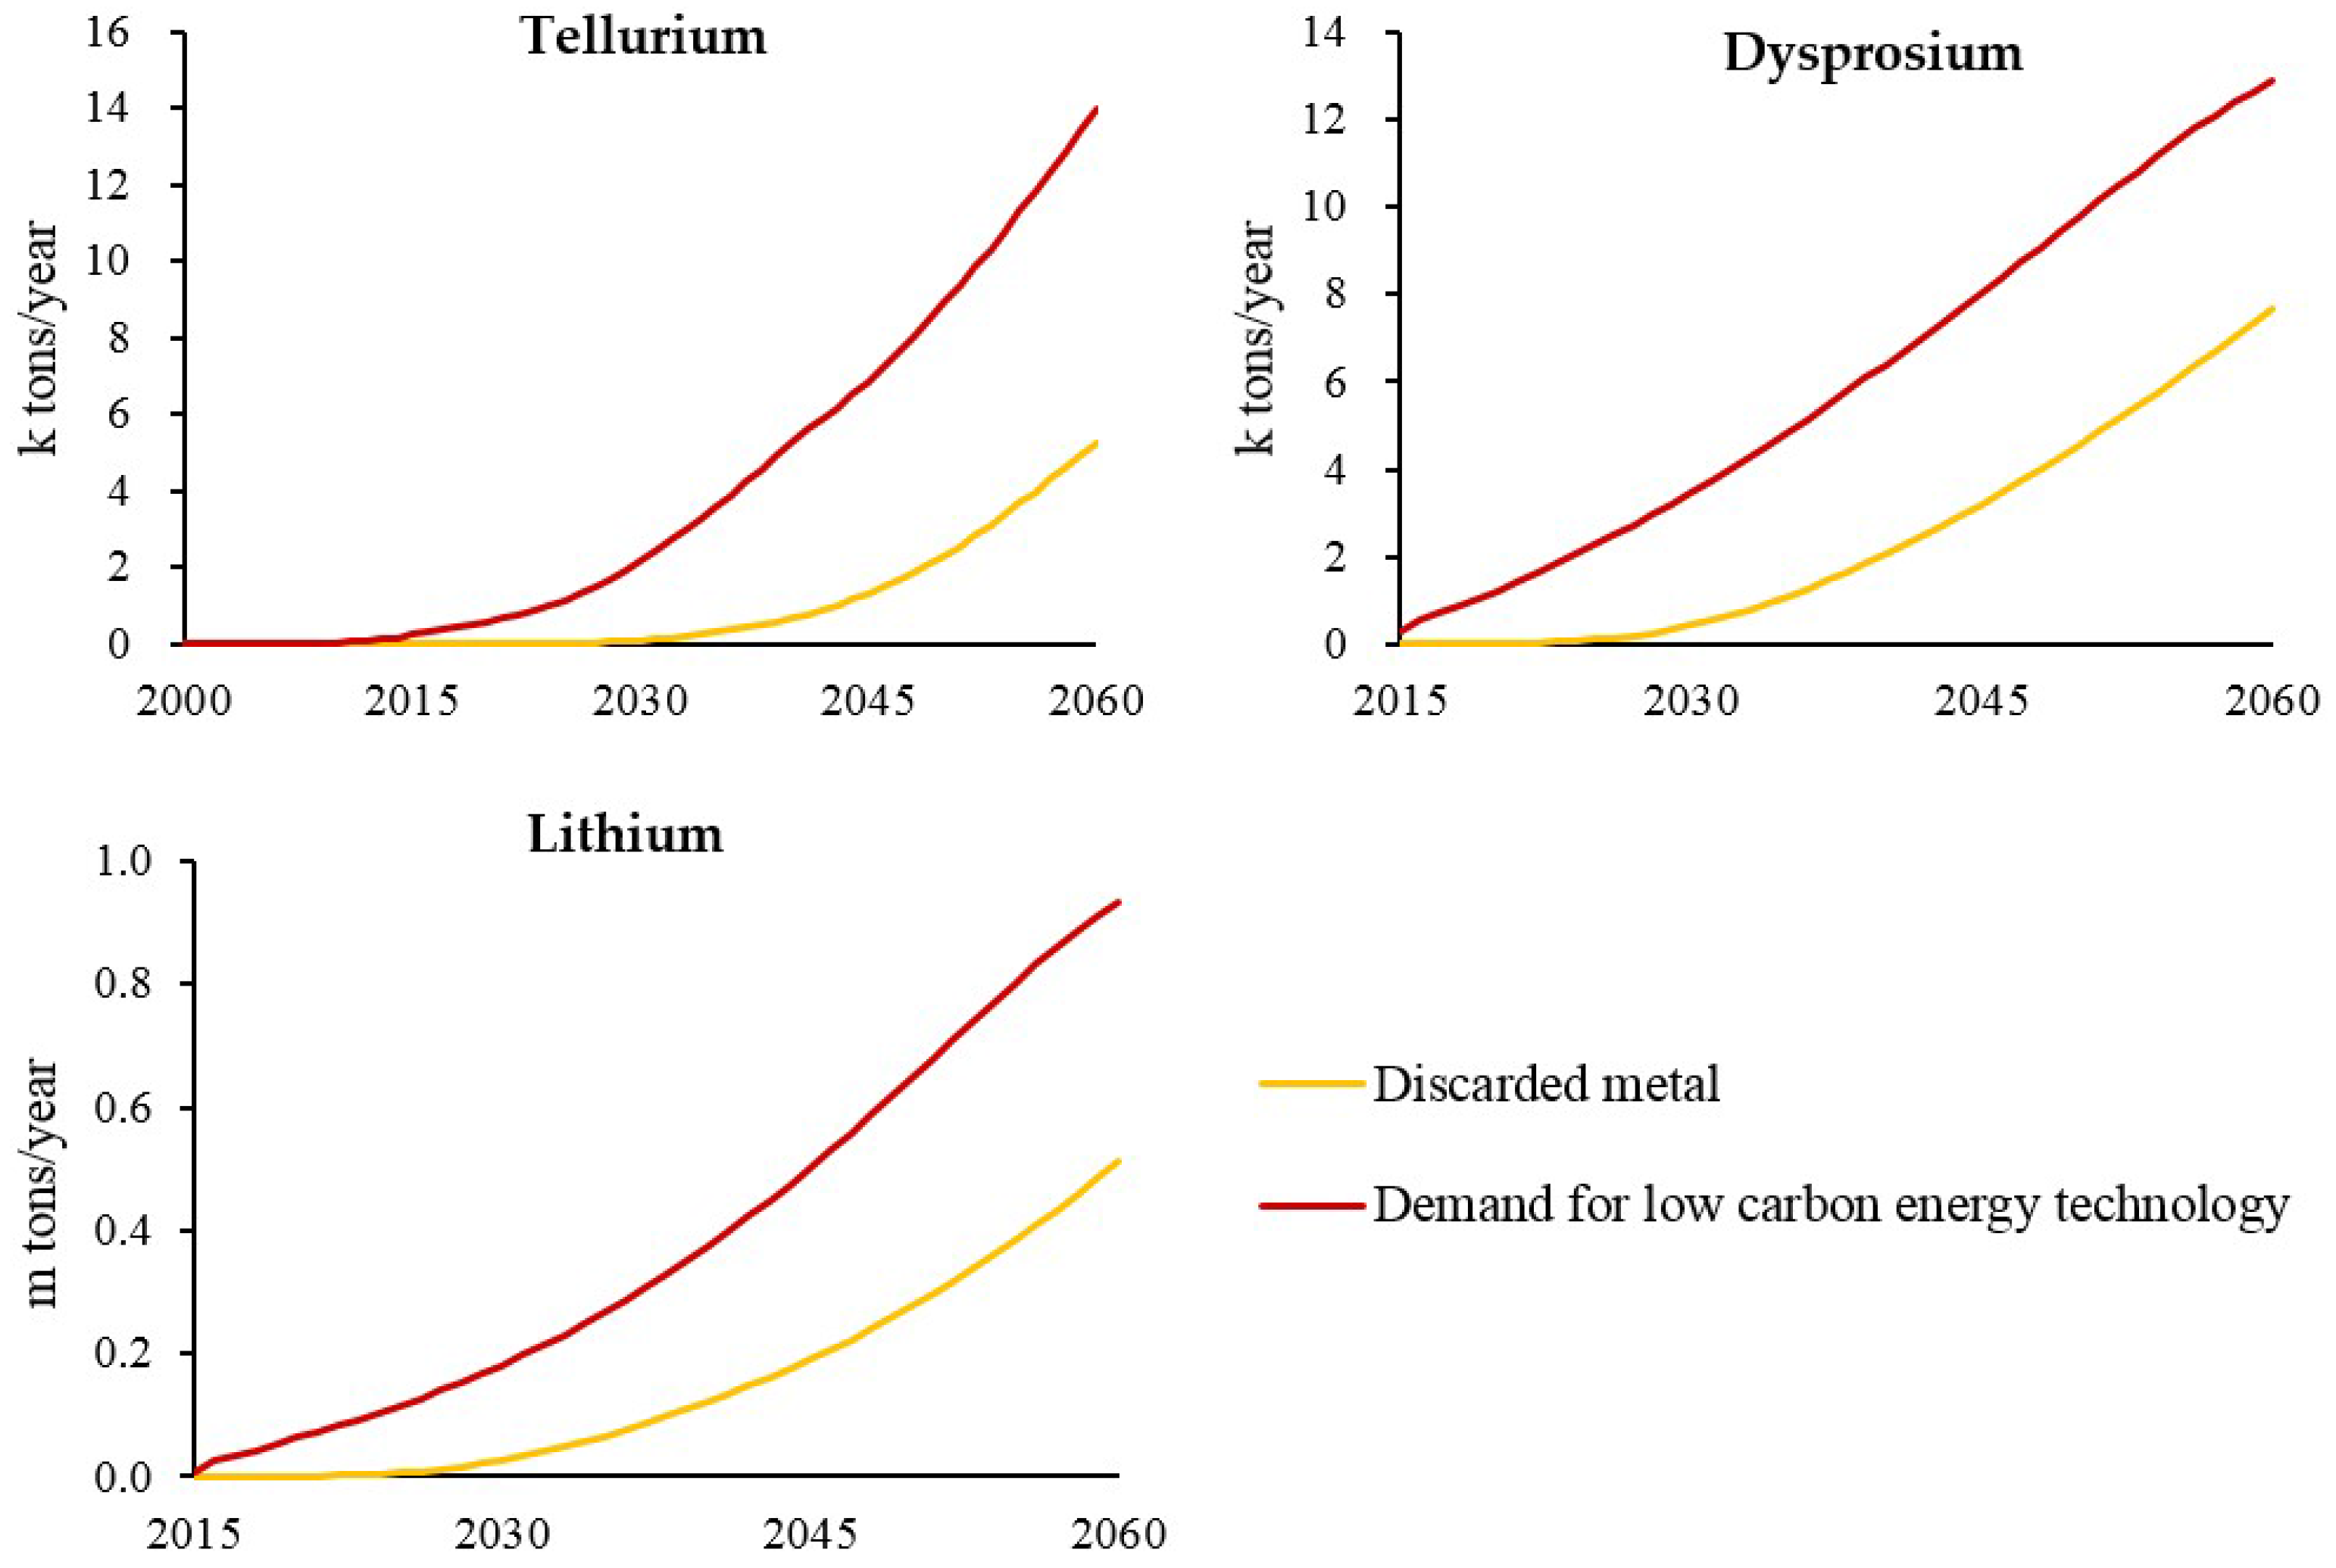
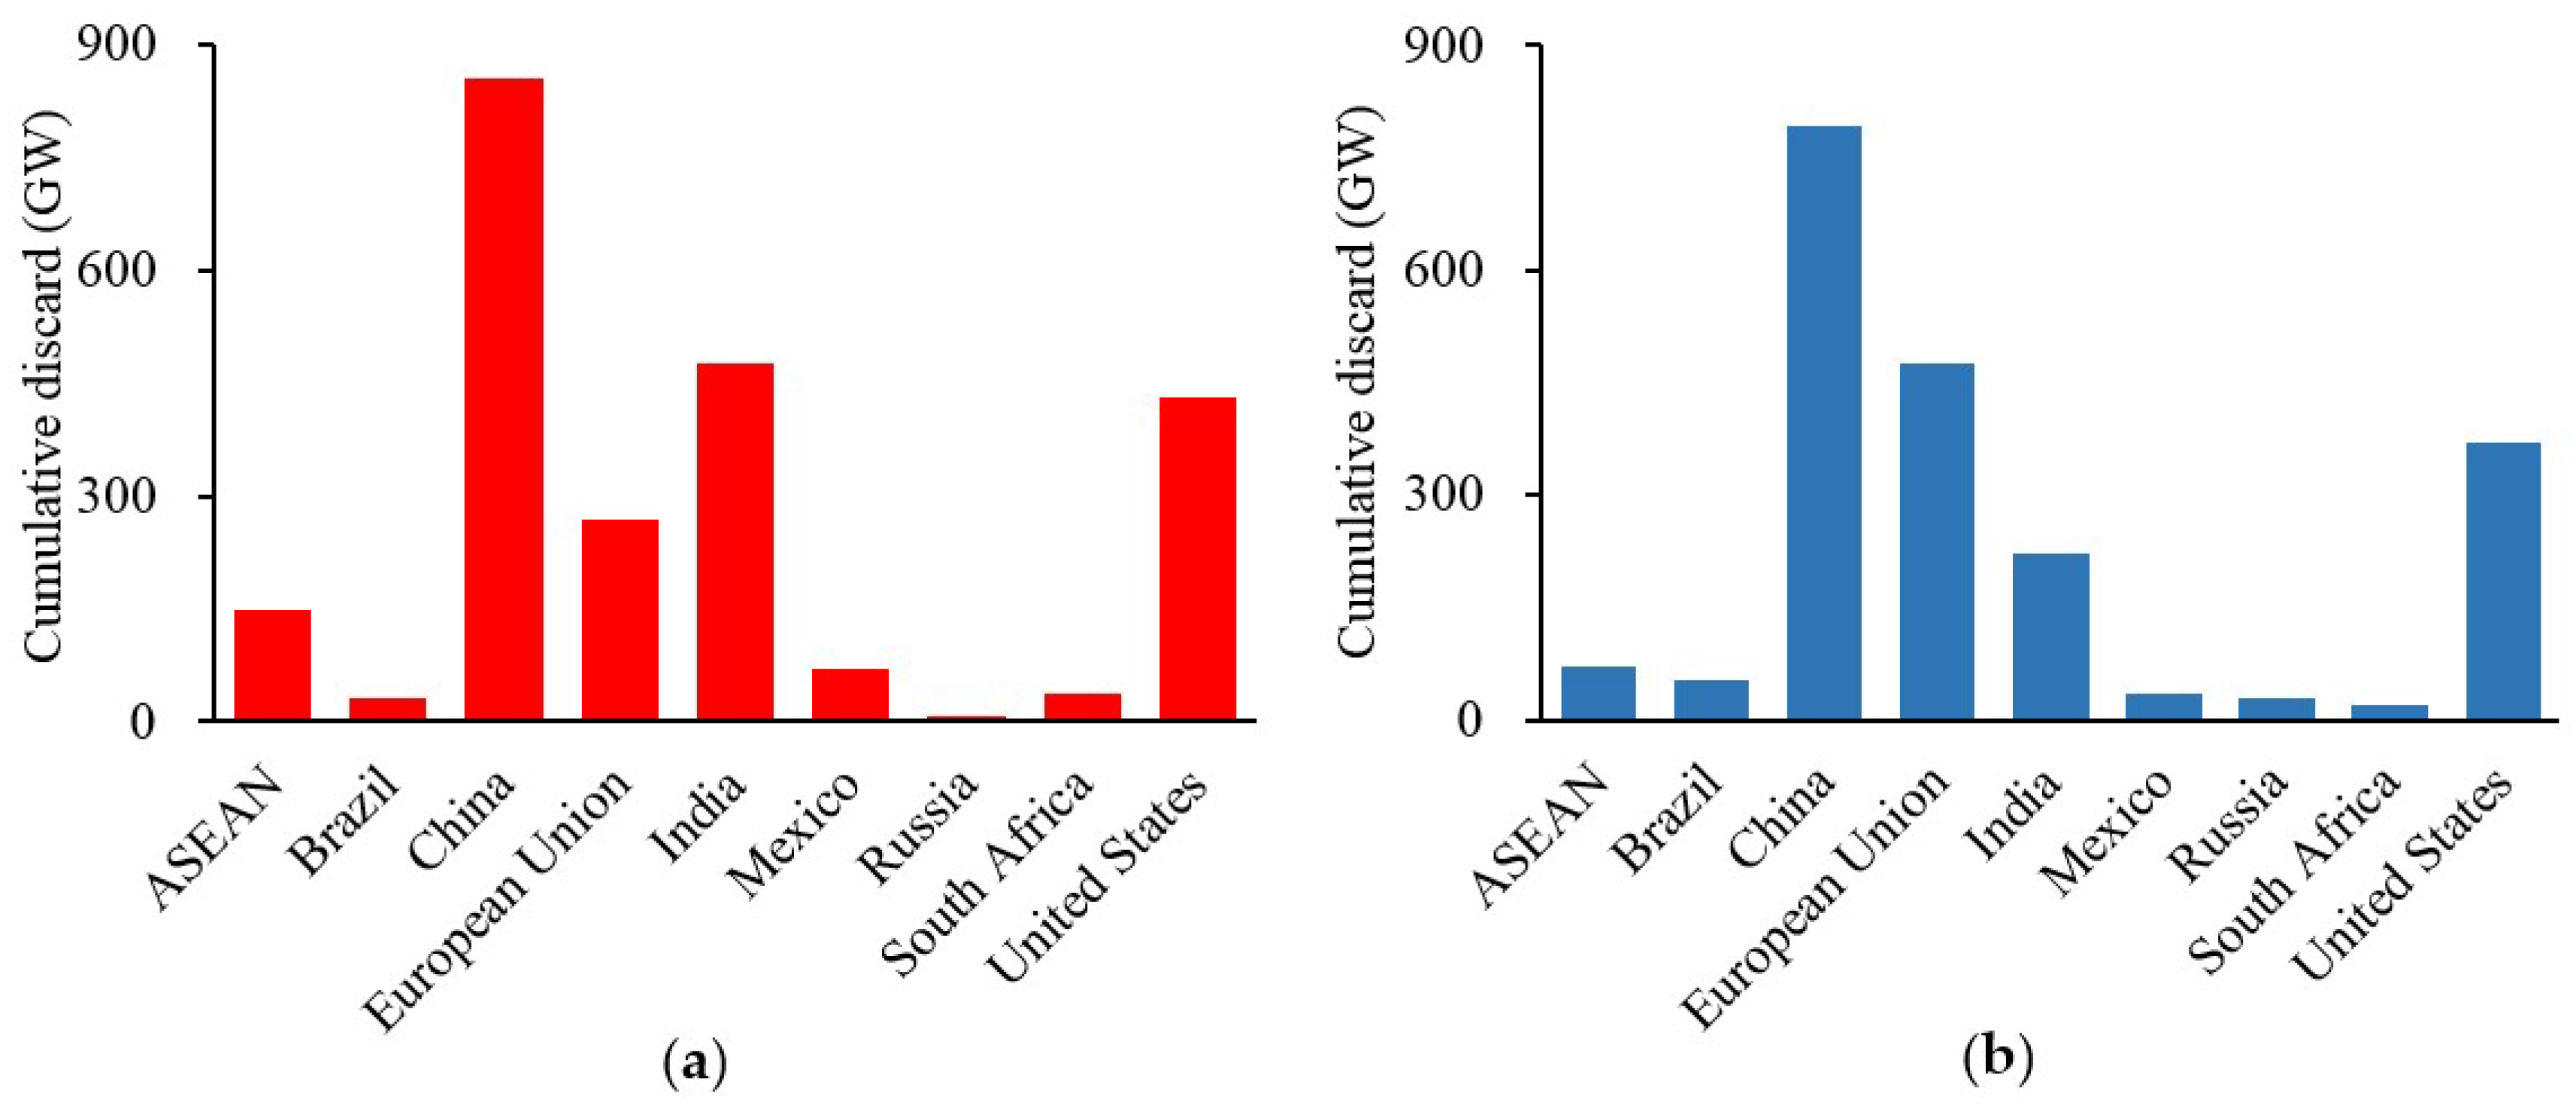
3.2. Potential Change in Supply-Demand Balance Based on Changes in Recycling Rate

The estimates of metal discarded from each low carbon energy technology at the end of its lifetime in the 2DS are shown in Figure 15. This estimation was based on the Weibull distribution as indicated in Section 2.4. Here, the results only show tellurium as representative of solar power, dysprosium as representative of wind power and lithium as representative of next generation vehicles (the full set of graphs is shown in the appendix as Figure A3). The figures show that this waste stream will increase sharply up to 2060 in accordance with the demand increase. In addition, the discard of solar power and wind power end-of-life products by region shown in Figure 16 was estimated based on regional future scenarios presented by the IEA [4]. These suggest that China has a very large recycling potential in the near future, therefore it can be said that the establishment of a recycling system in China is particularly desirable.
Figure 17 shows the change of primary metal demand when recycling the above discarded material is incorporated according to the scenarios shown in the Table 8 (the full set of graphs is shown in the appendix as Figure A4).
In scenarios B and C, which show the effect of reducing metal demand by recycling alone, it is shown that the primary metal demand for low carbon energy technology in 2060 can be reduced by 20% to 70% compared to scenario A which is a scenario with no resource recovery measures. Furthermore, in scenario D assuming a case where the reduction of metal intensity is also advanced by technological development, it is possible to bring the net annual primary demand in 2060 closer to zero.
Additionally, in terms of a cumulative reduction to 2060, about 150 kt can be reduced in the case of tellurium, which is equivalent to solar capacity of 1400 GW. Similarly, it is estimated that 200 kt of dysprosium equivalent to about 1000 GW of wind power generators or about 2 billion next-generation vehicles and 100 Mt of lithium equivalent to about 1 billion electric vehicles can be reduced respectively.
Among these metals, Figure 18 shows the cumulative primary demand for tellurium and lithium in each scenario from 2016 to 2060. From this, it can be seen that lithium can avoid depletion of reserves by tackling recycling and reduction of intensity but tellurium depletion is only delayed by 3 years. Therefore, metals with an early anticipated depletion, including tellurium and metals with a high share of demand for uses other than low carbon energy technologies, can be considered high risk metals for which resource constraints may occur unless fundamental measures such as substitution or recycling from other uses, in addition to recycling of low carbon energy technology, are taken.

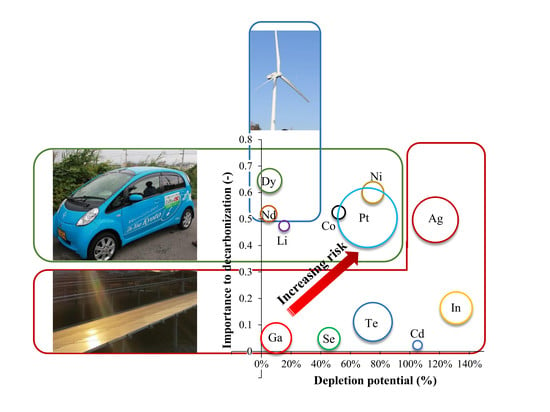
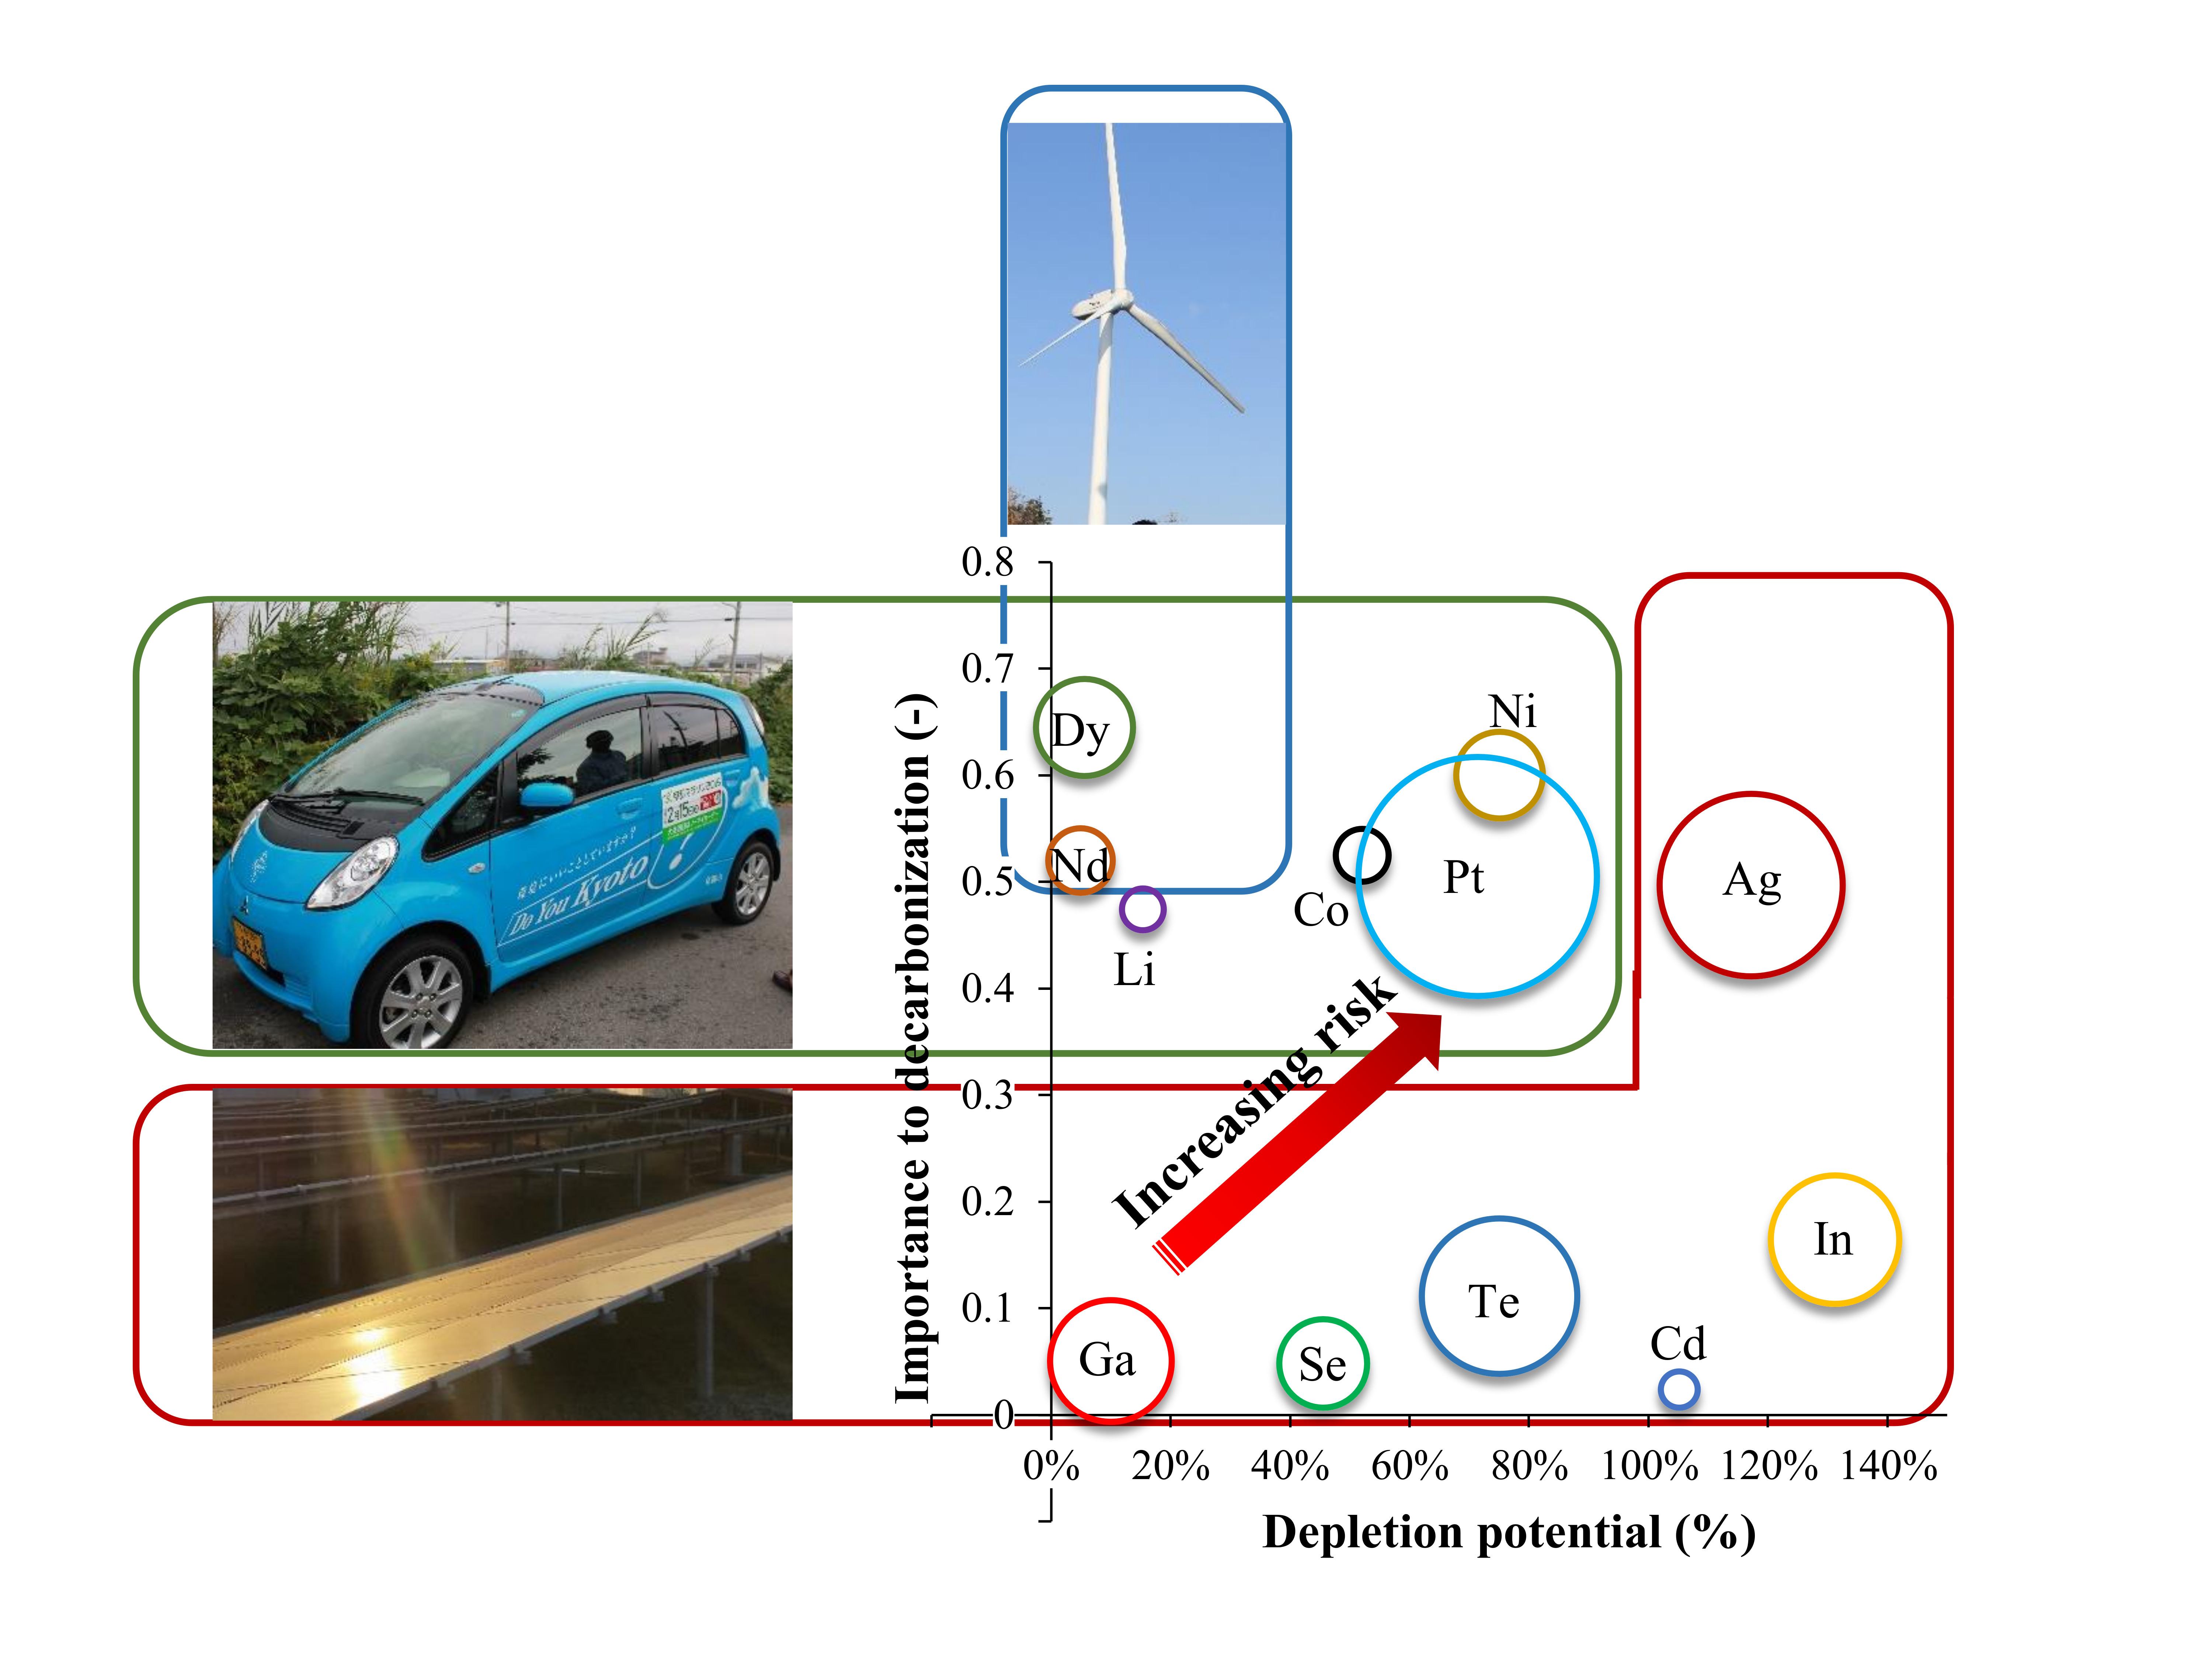
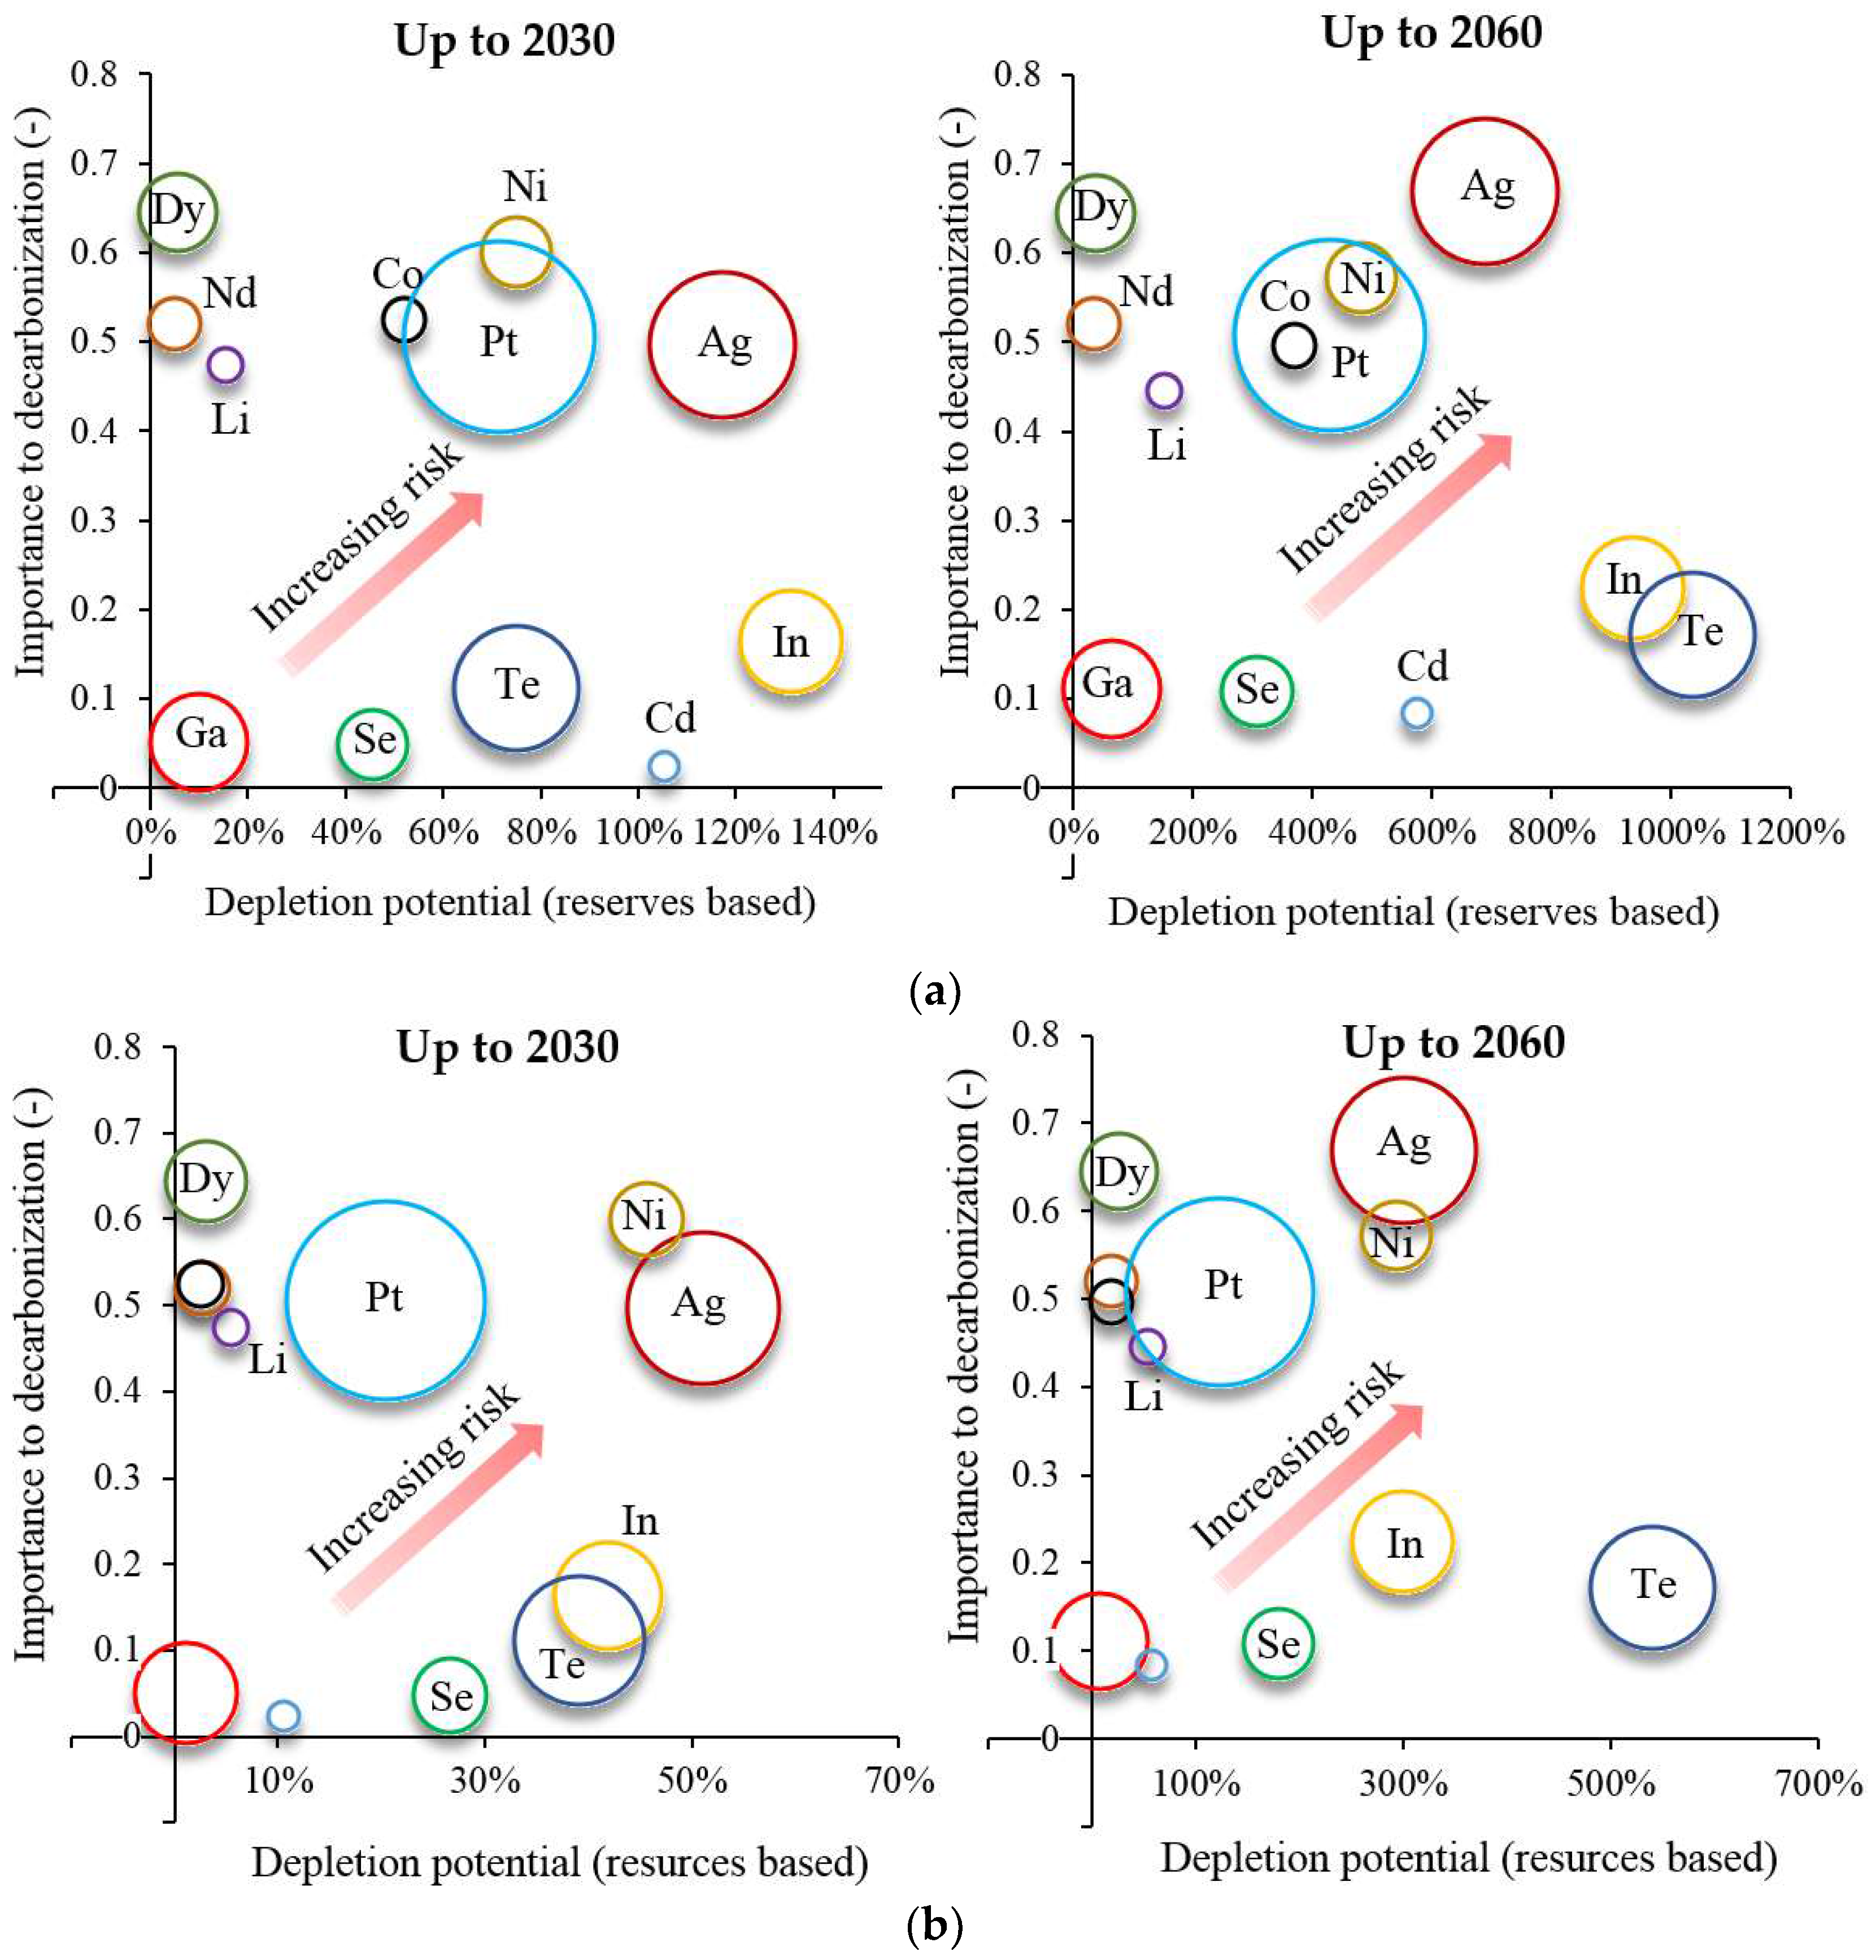
3.3. Critical Metals That Require Priority Measures

Figure 19 shows the results for the depletion potential of critical metals and their influence on decarbonization (disaggregated results of “CO2 importance” and “Price importance”, which are the two indicators constituting importance for decarbonization, and are shown in the appendix as Figure A5 and Figure A6). Silver and nickel were identified as critical metals that require intensive measures based on their depletion potential, importance of decarbonization and environmental impact. Since silver and nickel play an important role in the creation of a low carbon society in addition to the insufficient reserves for future demand, it is necessary to prioritize countermeasures for ensuring stable supplies. Similarly, it can be said that platinum needs to have attention paid to it, because the reserves are not sufficient and its importance for decarbonization and environmental impact are both large. For indium and tellurium, although the importance for decarbonization is not as high, the depletion potential and environmental impact are very large. Moreover, the ratio of demand increase is also quite large in the case of tellurium, therefore it is necessary to consider countermeasures. In addition, when looking at lithium, while there is no problem from the perspective of reserves and resources because of their abundance but future demand increase is rapid comparing with current production, hence, future supply may not keep up with demand.
Since recycling and reducing can greatly reduce future primary demand as indicated in Section 3.2, it is necessary to promptly develop recycling and reducing technologies to increase the ability to obtain these metals in a stable manner and introduce them in parallel with the introduction of low carbon energy technology.

4. Discussion

4.1. Comparison with Previous Studies

In this section, the results obtained in this paper are compared with some previous studies as shown in Table 9 and Table 10. In this case, please note that there has not been an exactly similar study in the past and there are many differences in target technology and metal as well as target region and period. Here, a bottleneck metal means any metal that could restrict low carbon energy technology introduction in the future due to supply constraints, as evaluated by the future supply-demand balance. On the other hand, a critical metal is a metal that is evaluated as having a high risk taking into consideration not only the supply-demand balance but also the impact of supply constraints.
Firstly, when we look at Table 9, whereas previous studies evaluated bottlenecks by comparing with reserves or current production respectively, this study also considered resources. Through this, it is revealed that although demand for dysprosium and neodymium would rapidly increase, long-term depletion problems would not occur.
Secondly, in the case of criticality analysis in Table 10, it can be considered whether taking geopolitical factors into account made a significant difference in the results. While gallium and rare earths with high geopolitical risk were considered to be critical in previous studies, this study evaluated these metals as not critical. This may also be because of the difference of whether the analysis target was at global level or at specific national level.
It should be noted that there are more issues of scope and methodology that must also be considered in comparing the results. Firstly, there is a difference in the target year—it would be expected that longer-term analyses would be more likely to indicate resource restrictions when measured against static reserves. On the other hand, production constraints are likely to be more apparent on a short-term basis, that may be hidden in longer term extrapolations. Another important factor is that the methods of estimation of both supply and demand vary across studies. In the current case, demand is estimated using both a bottom-up material intensity approach to consider the target technologies, combined with top-down approaches to consider the bulk mineral commodities and the influence of macroeconomic growth factors on the non-target sectors. On the other hand, ref. [36] considered demand for clean energy only, using a material intensity model and extrapolated different growth rates of energy demand and the clean energy sub-sectors from recent historical trends. In Reference [37], a material intensity approach was used but overall demand was extracted using a macroeconomic systems model. In the current study, supply has been assumed to keep pace with demand except where cumulative demand exceeds resources or reserves. In the case of Reference [36], the supply was estimated separately, with various supply scenarios from historical data, including potential rates of recycling. In the latter study, supply was considered as a limitation to clean energy roll-out.
With regards to criticality, there are many alternative, though largely related, approaches. There are, of course, simple differences such as the metals considered in the study—the compared studies in Table 10 all investigate energy technologies, so they show a certain amount of overlap but the metals considered critical are not consistent. Partly, this is due to the national/regional level scope of the compared studies (versus global in this study), while the factors of criticality examined here may be considered a subset of those considered in the other studies.

4.2. Uncertainties of Estimation Method

The forecasting of metal demand, the analysis of supply balance and the critical metal identification method carried out in this paper include the following uncertainties, which are considerations for future work.
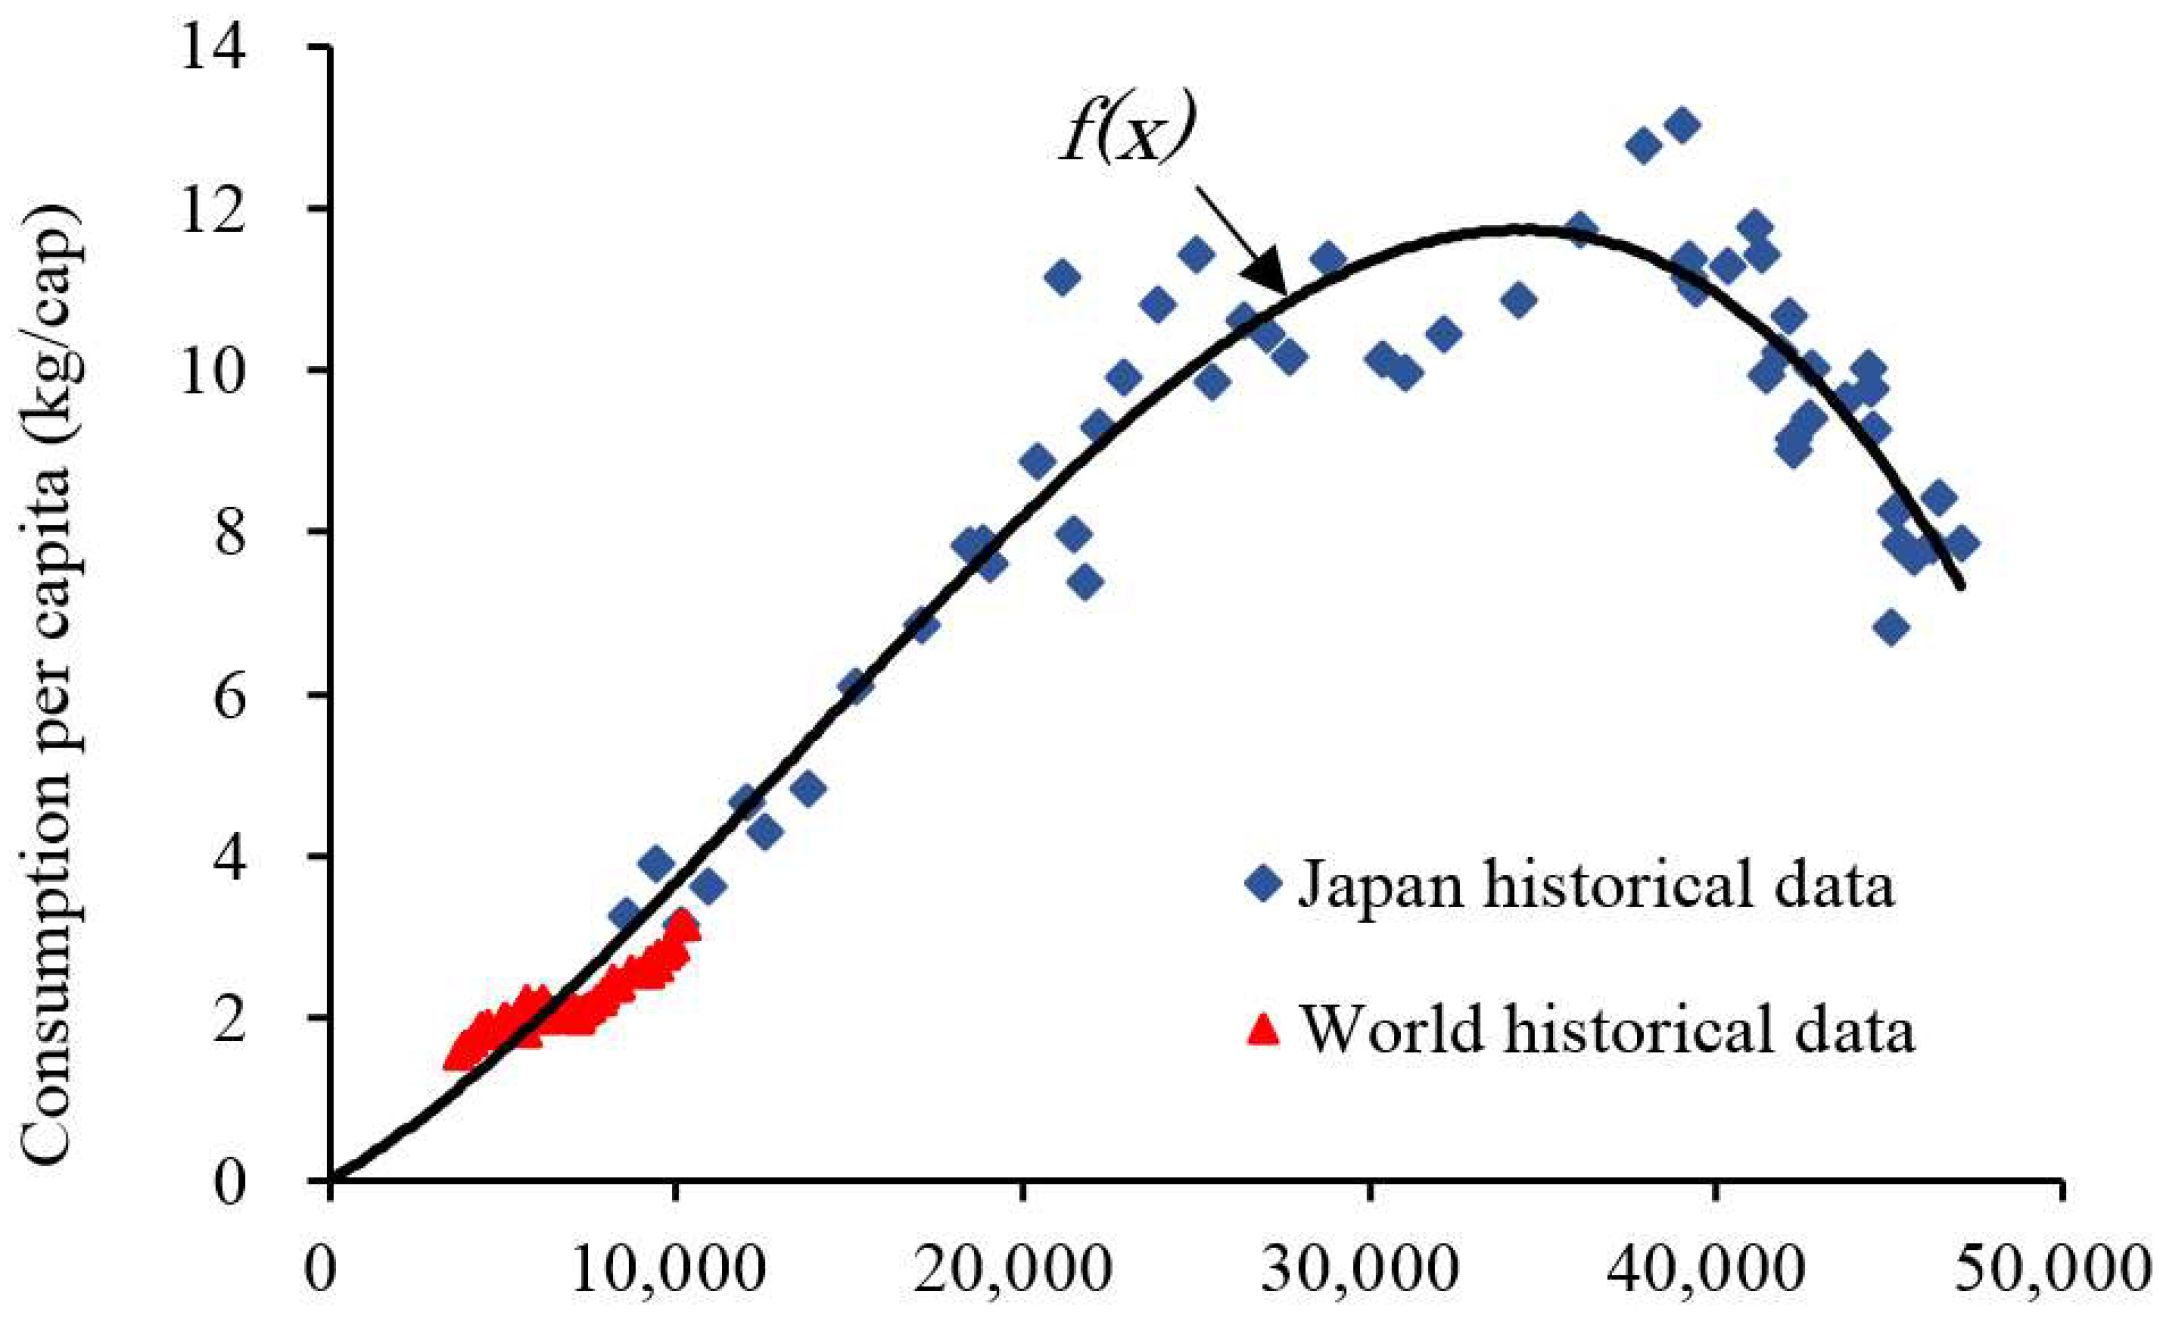
  • In the top-down model, since the world future demand was estimated based only on Japan and USA historical data, differences in characteristics between countries were not sufficiently considered. Therefore, it is desirable to undertake the same type of regression for more countries, so that the applicability of the approach for each country or region can be better justified.
  • In the bottom-up model, since the diffusion growth rate of uses other than low carbon energy technology was considered to be about the same as GDP growth rate, differences between products are not considered. For other uses, the breakdown should be analyzed in more detail and the diffusion growth rate should be given according to the product characteristics.
  • In the supply balance analysis, the current recycling rate for uses other than low carbon energy technology was ignored. The recycling rate varies greatly for each metal and product and the higher the rate of the secondary resource supply of demand is, the lower the possibility of depletion. Therefore, for other uses, it is necessary to estimate the secondary resource supply by giving the average lifetime and recycling rate for each product.
  • There is a possibility that reserves and resources will change significantly in the future. Especially if the price of metals and therefore the incentive for mining development, rises as demand increases there is a high possibility that format least some of what is currently considered uneconomic resources will be transferred to the class of reserves. This may also occur due to the improvement of mining technology. Therefore, there is a need for ongoing data collection and updating of the assessment.
  • In the critical metal identification method, this paper considered only the possibility of physical depletion, the ratio of demand increase, the importance for decarbonization and the magnitude of environmental impact, however there are various other potential indicators of criticality, such as price volatility, concentration of producing countries and by-product ratio, that could also be applied. Hence, it is desirable to carefully examine these factors and incorporate them into the identification method appropriately.
  • The substitution potential was not considered in this analysis. For example, REE permanent magnets could be replaced by electromagnets, CIGS and CdTe solar panel could be replaced by Si based solar panels and cobalt content of Li-ion batteries has been reduced significantly in the past decade and alternatives are being developed. This means that resource constraints may not have as significant an impact on the creation of a low-carbon society. Therefore, although it is difficult to quantify the substitution potential, it should be considered as an indicator of importance for decarbonization.

5. Conclusions

In this paper, to provide guidelines for technological development and policy-making to introduce low carbon energy technology by avoiding resource constraints, the impact of the expansion of low carbon energy technology on future metal demand based on the IEA’s scenarios was examined quantitatively. In addition, we estimated the future discarded low carbon energy technology and the potential effect of reducing primary metal demand based on changes in recycling rate which were not widely conducted in the past. Moreover, this paper identified critical metals that require special measures. The main findings obtained from the above are as follows:
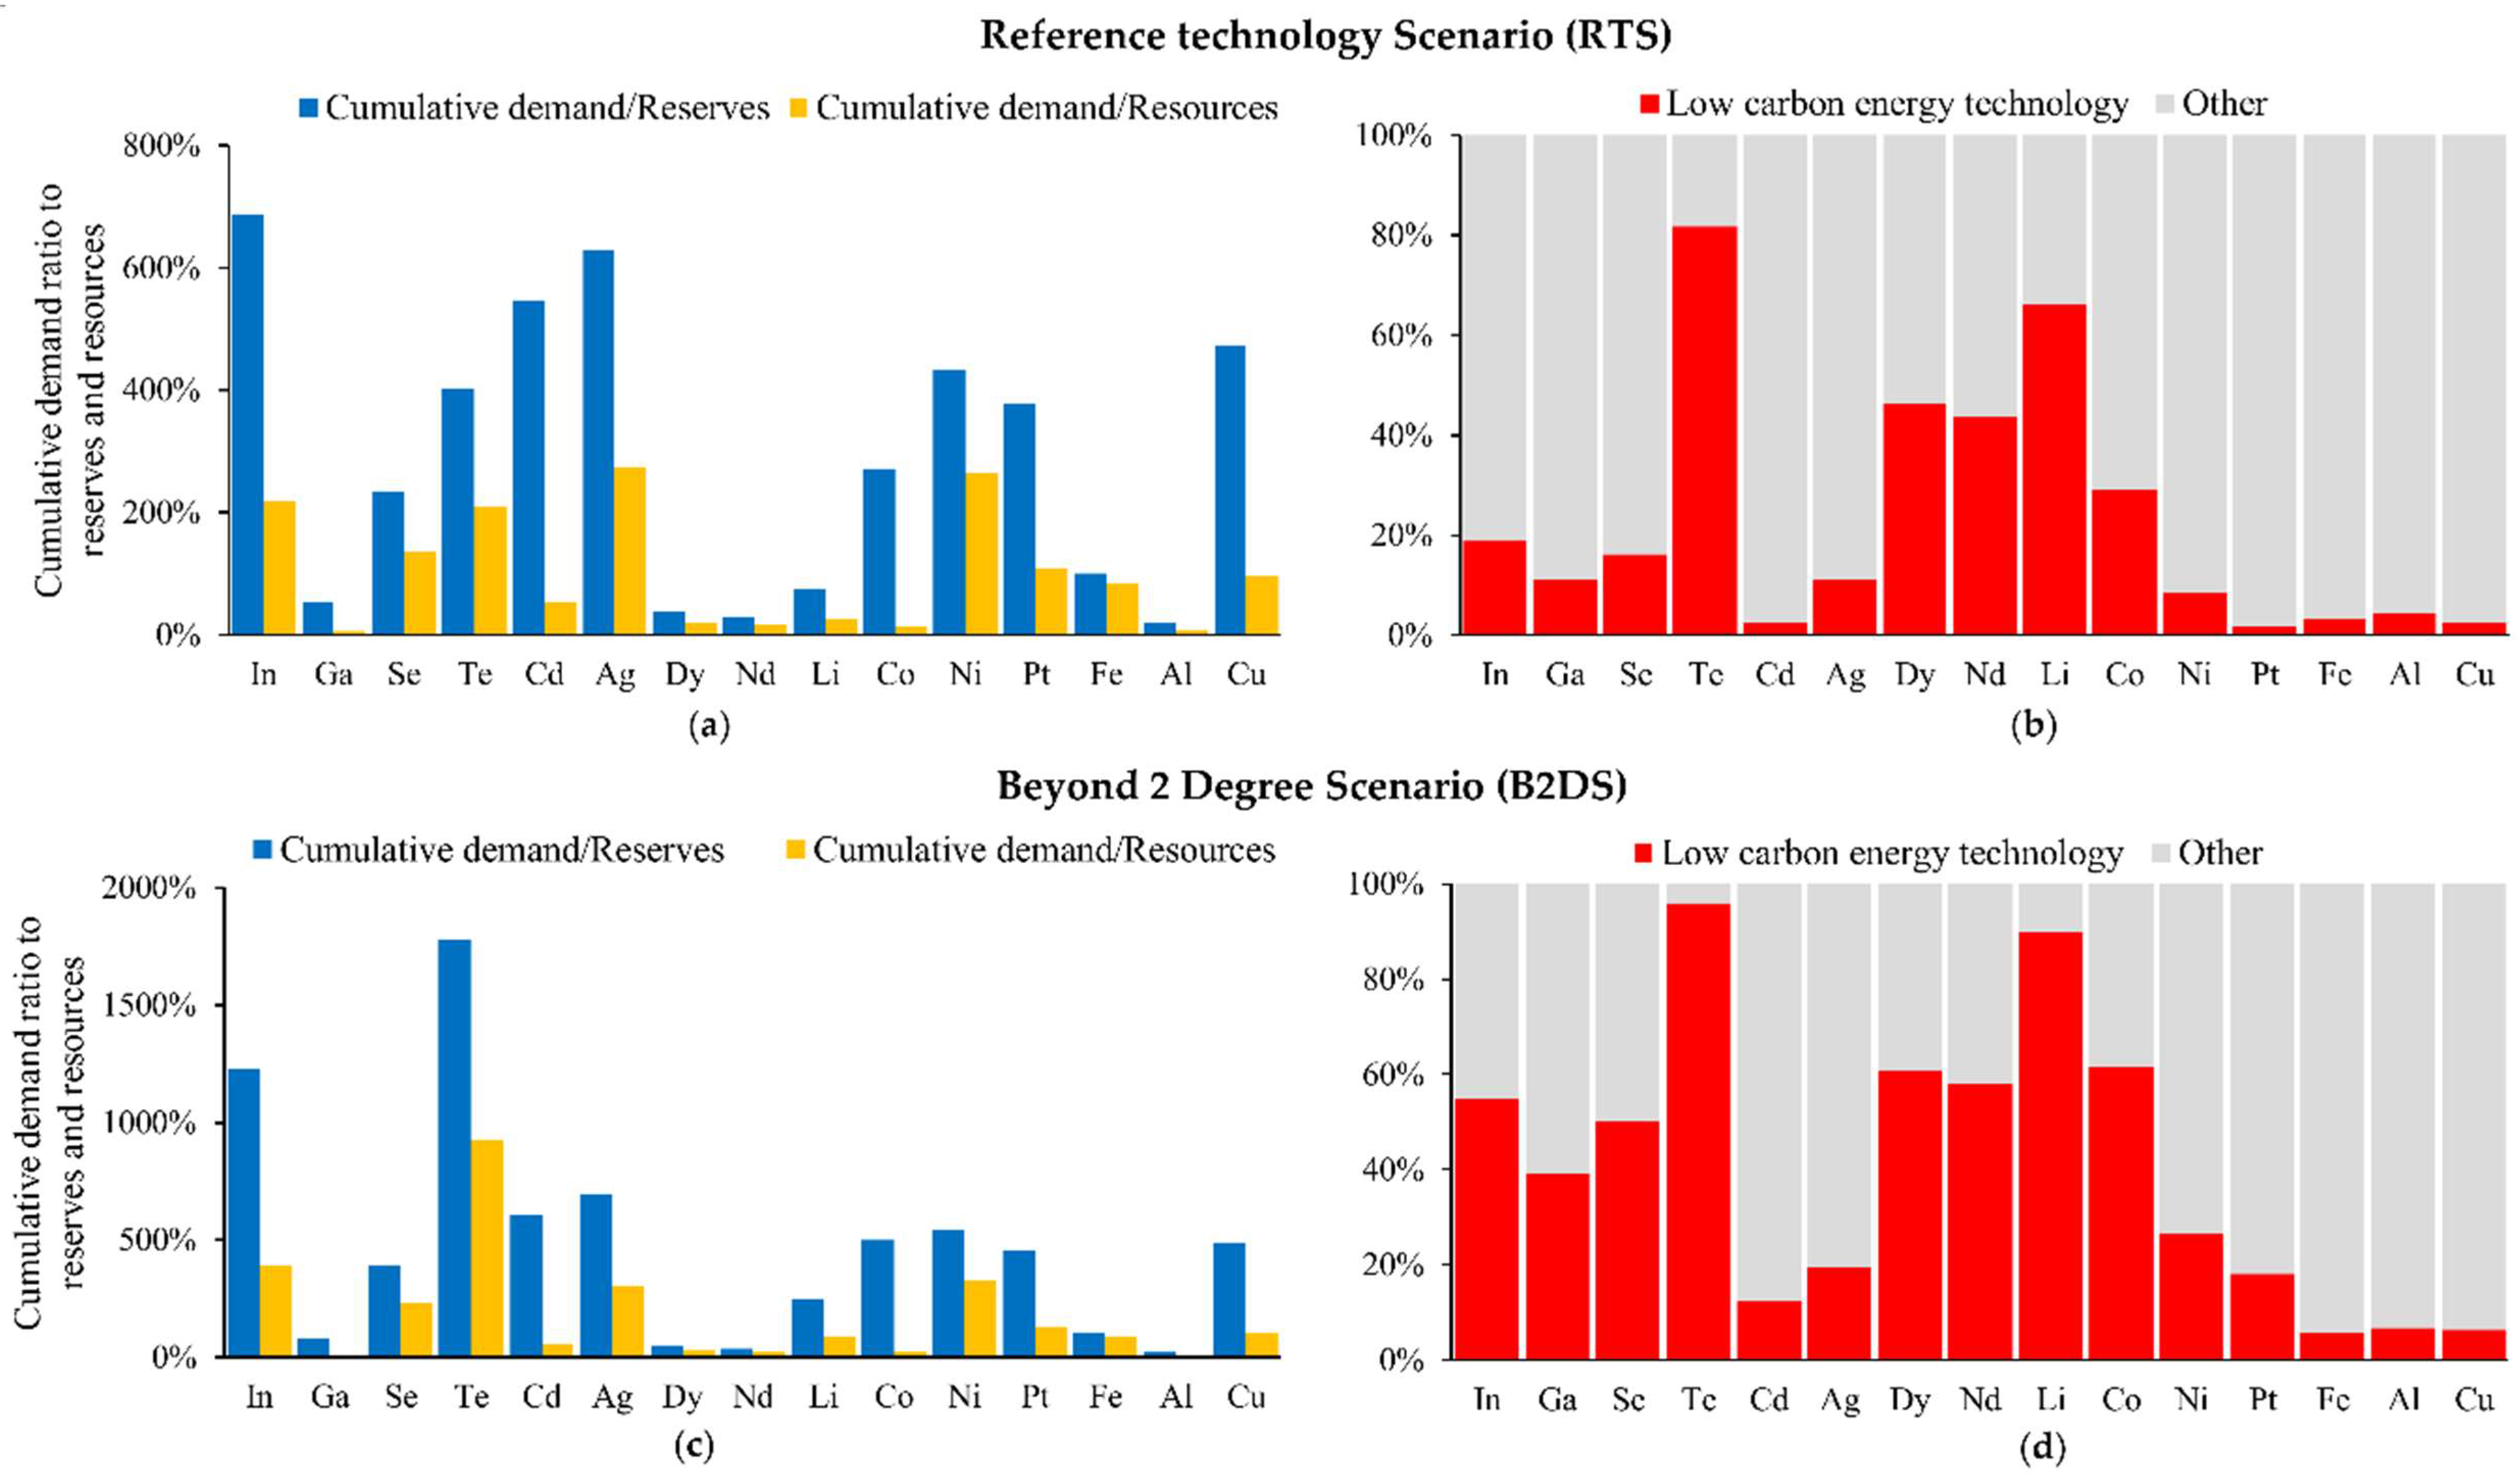
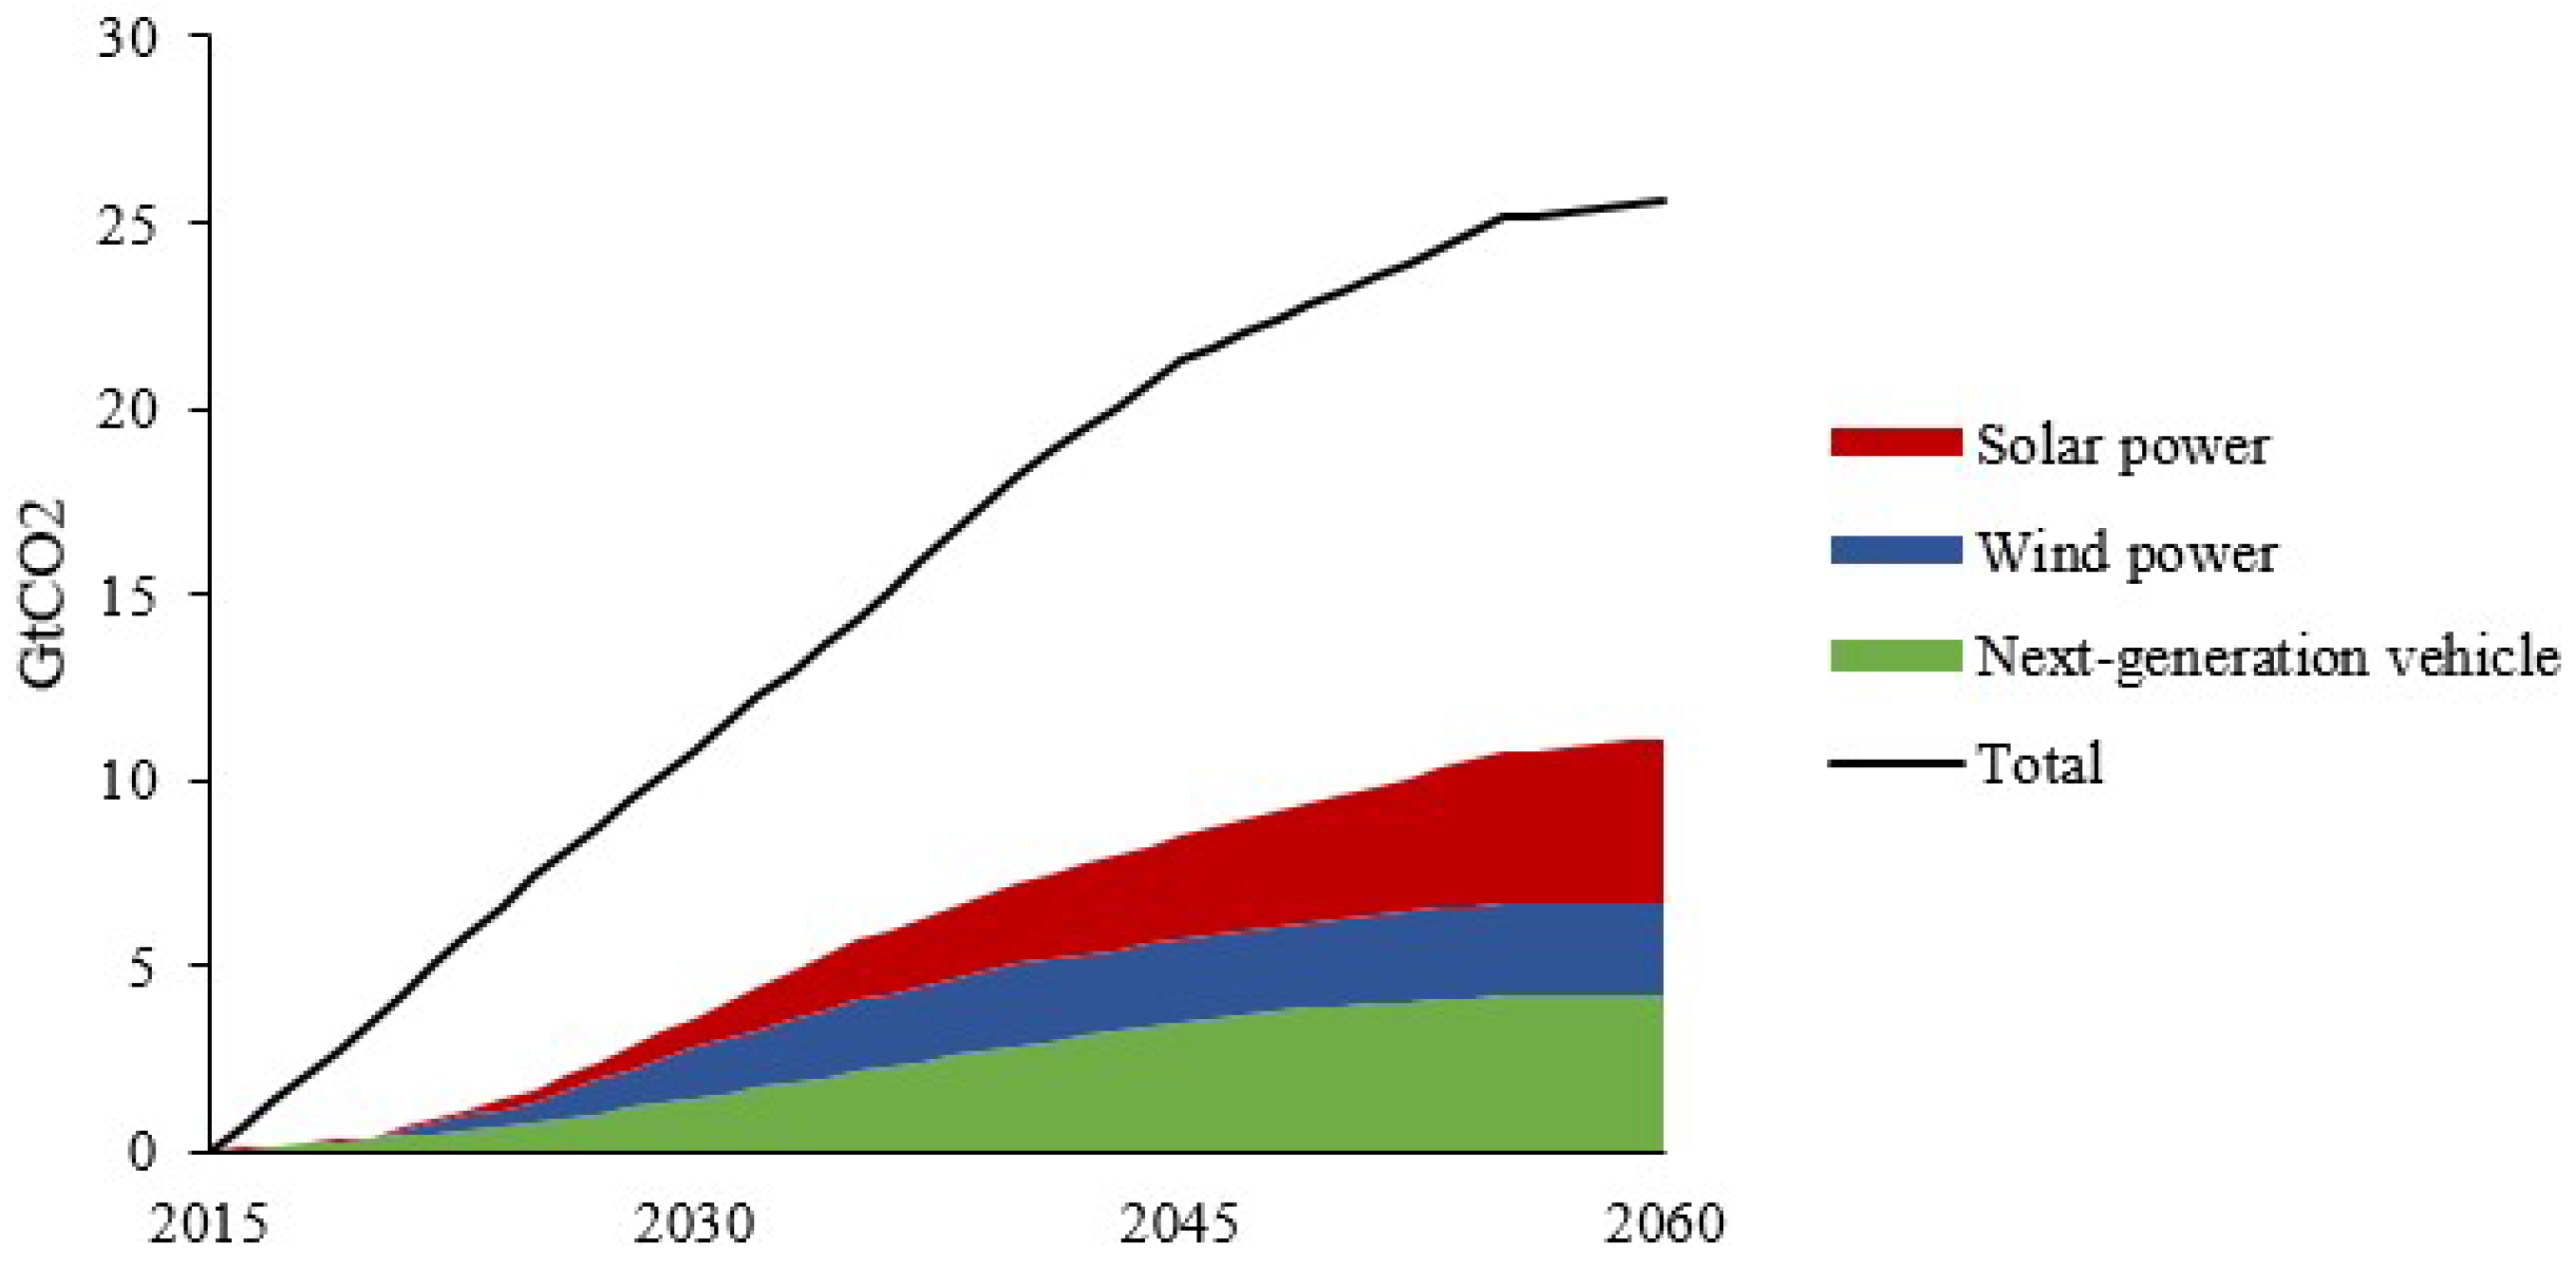
  • The diffusion of solar power and next-generation vehicles may be hindered by resource depletion.
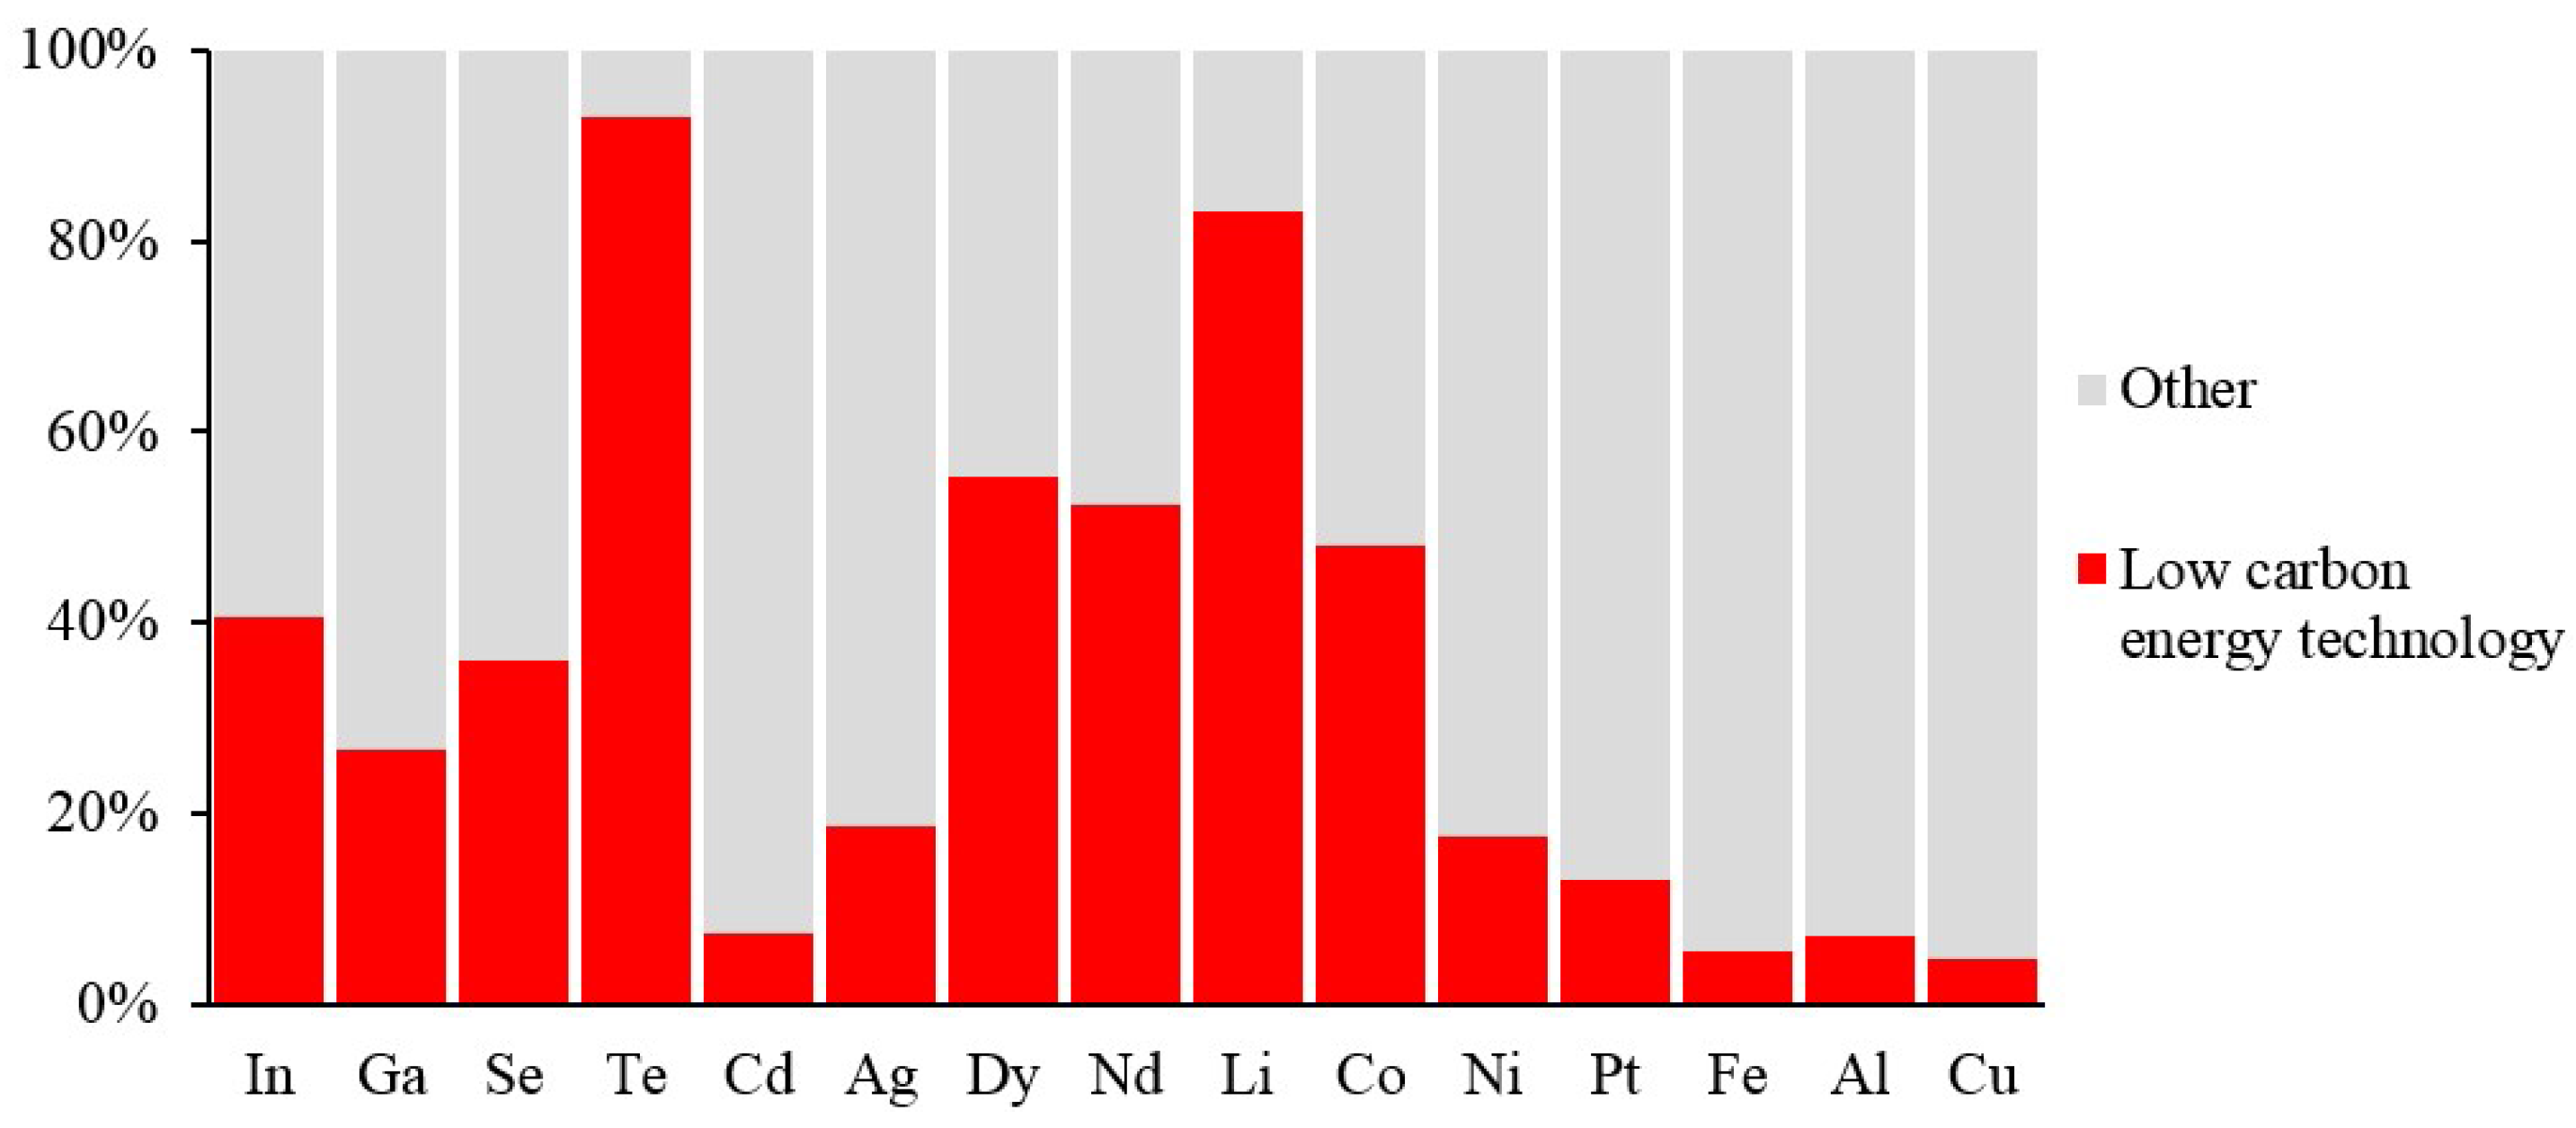
  • The demand increase factor of common metals is dominated by economic and population growth in emerging countries, on the contrary, many rare metals are largely influenced by the expansion of low carbon energy technology.
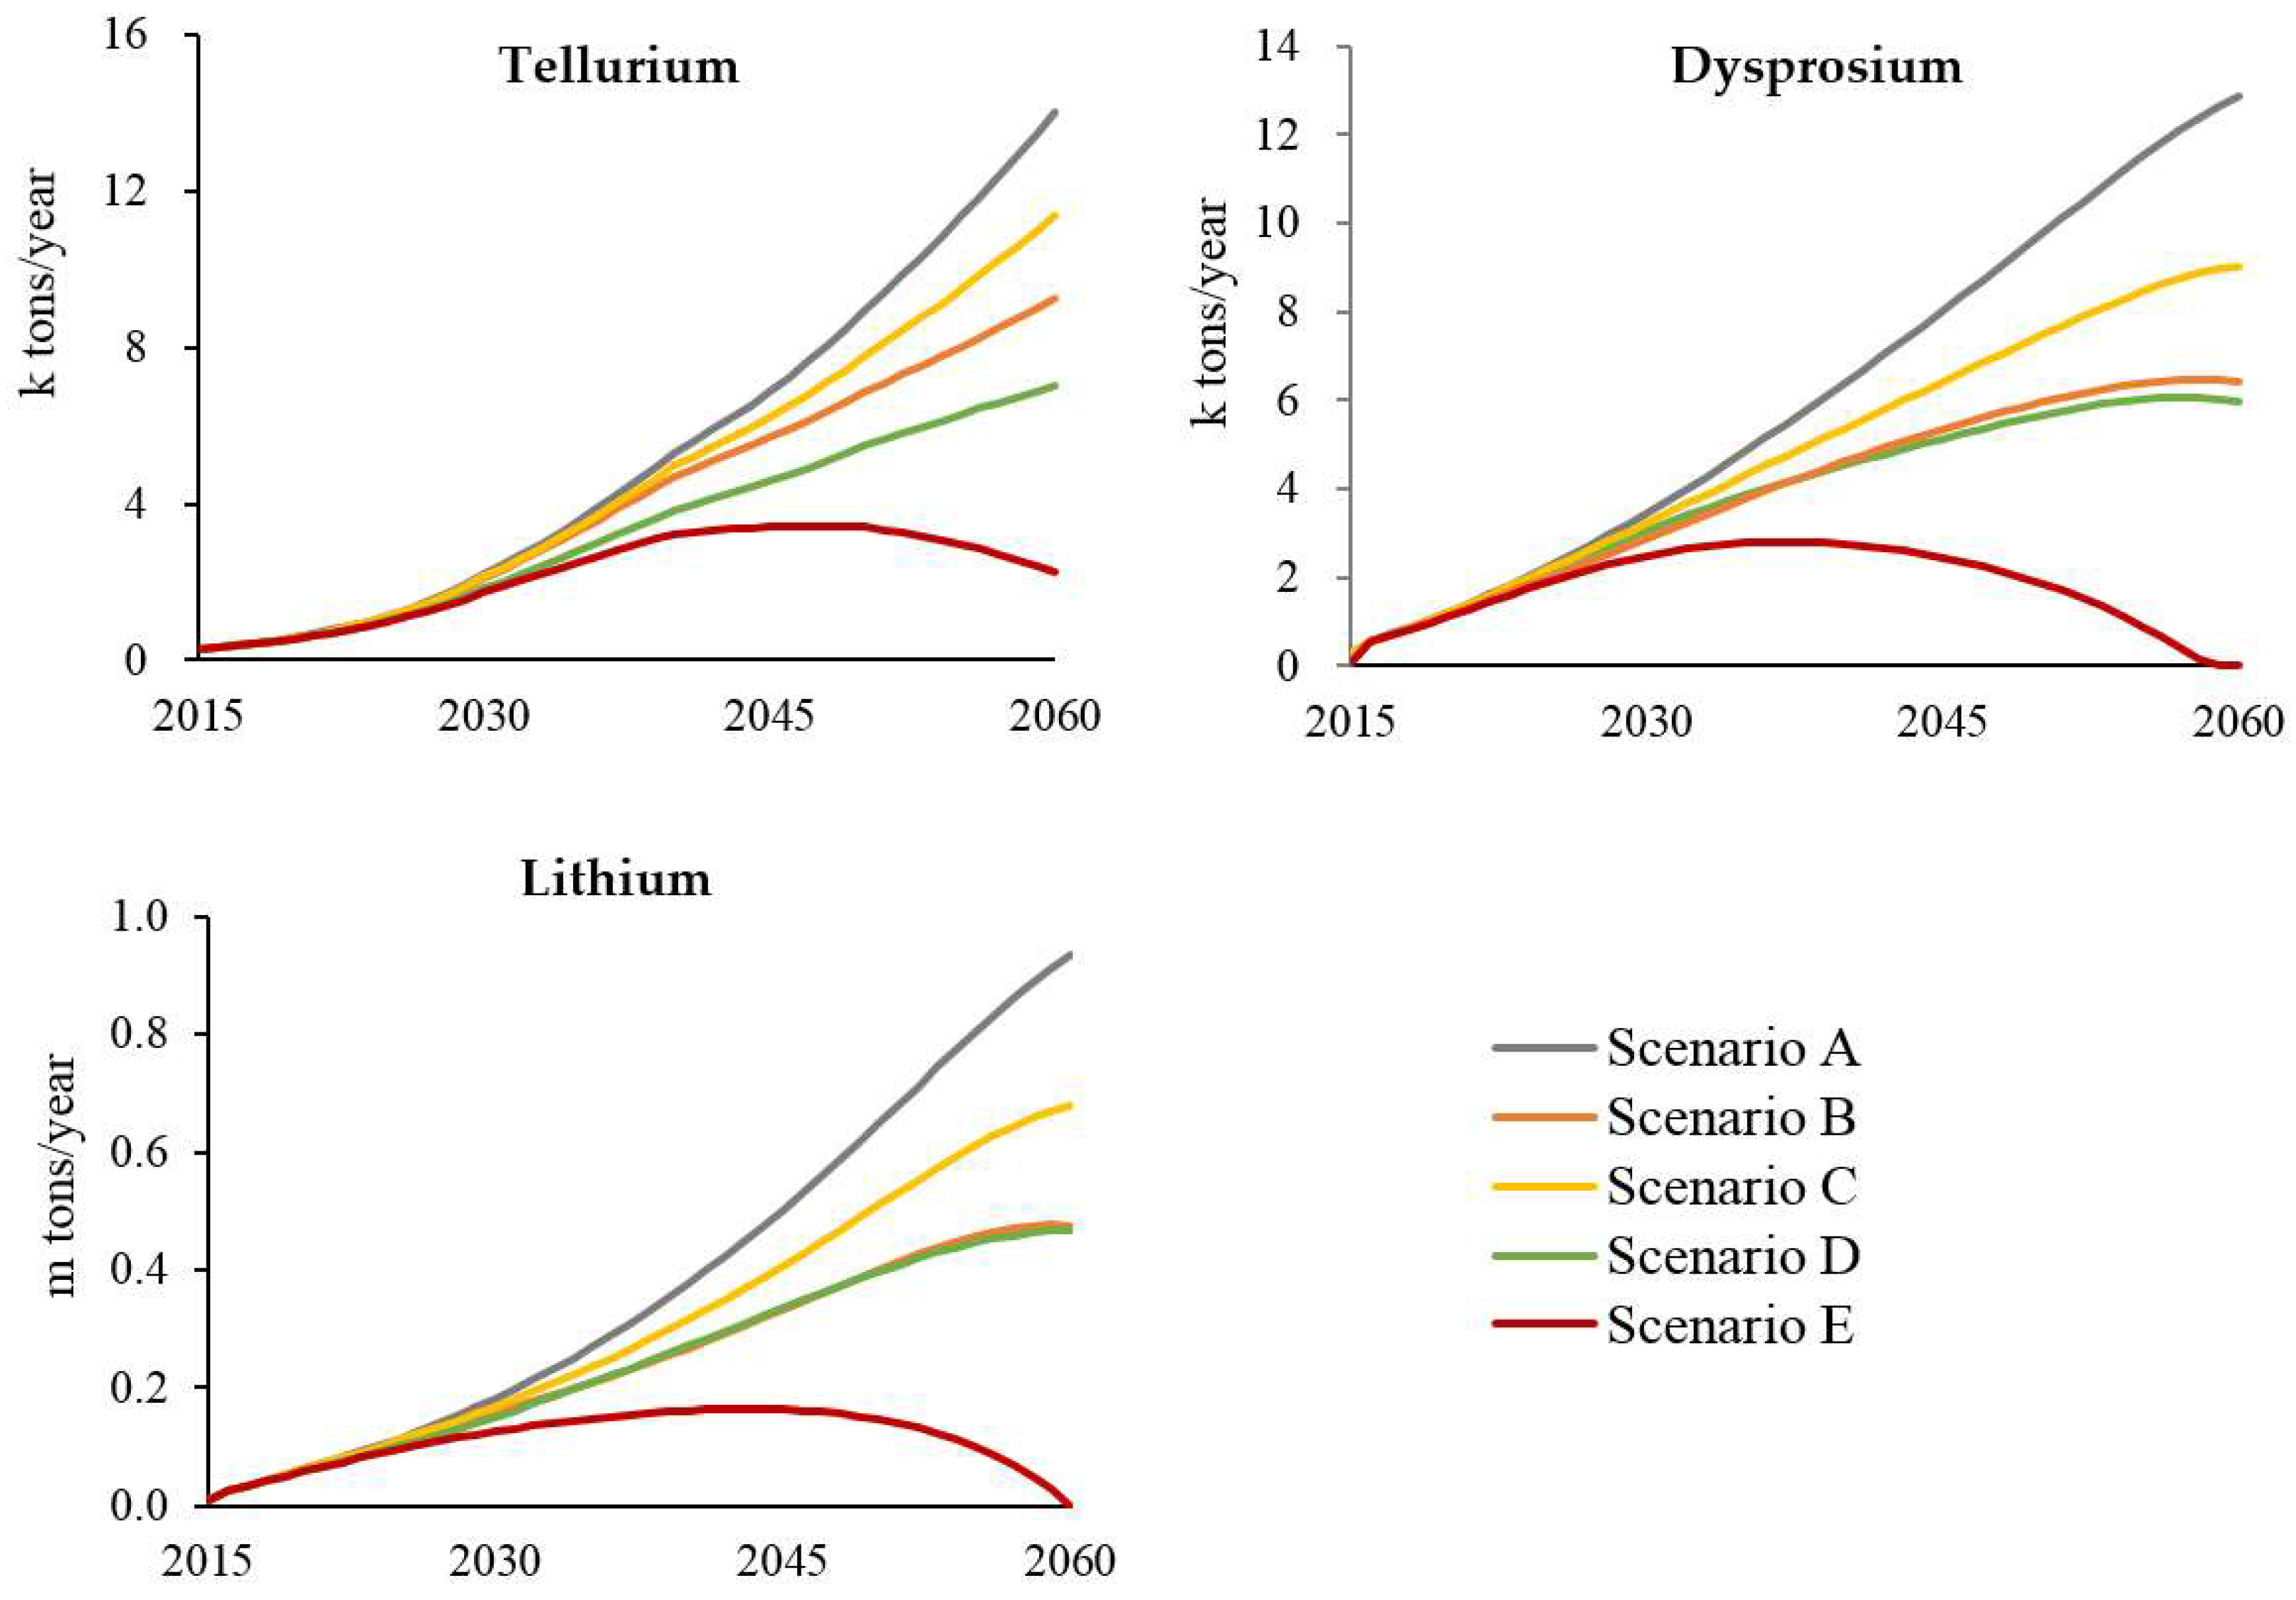
  • By establishing a recycling system, annual primary metal demand for low carbon energy technology in 2060 can be reduced by from 20% to 70% and it is possible to bring the net demand to approximately zero if reduction of material intensity is also undertaken.
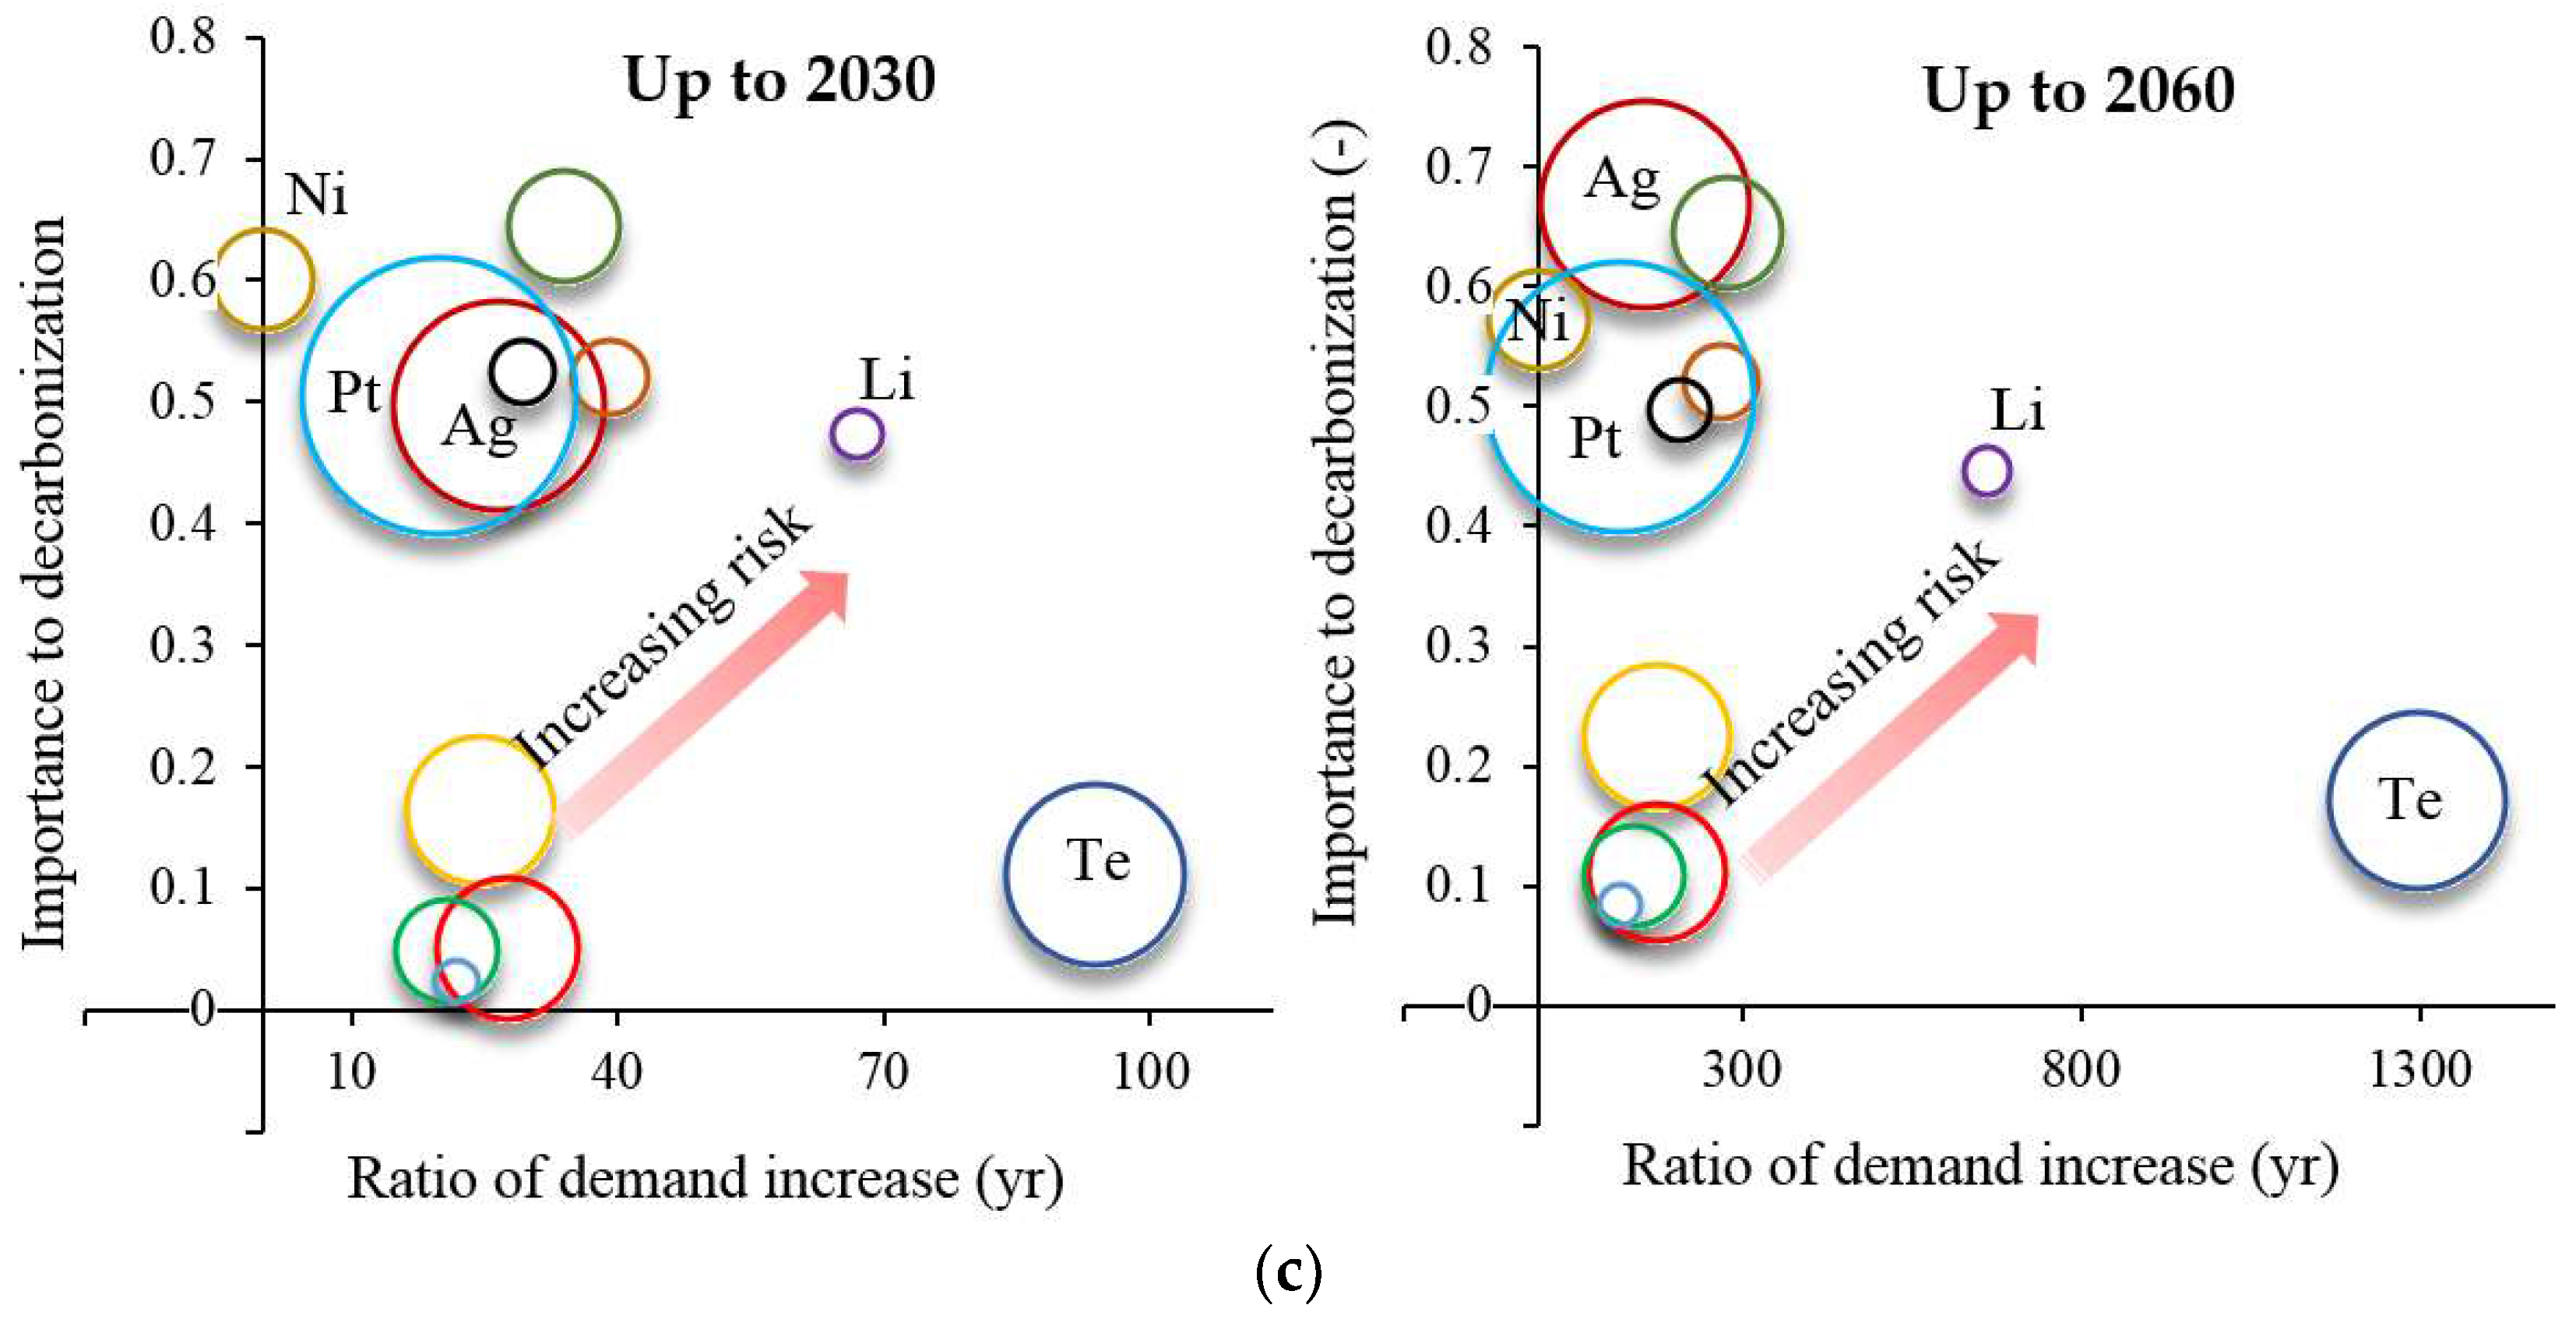
  • Critical metals that require special measures were identified as indium, tellurium, silver, lithium, nickel and platinum from the viewpoints of physical depletion potential, ratio of demand increase, importance for low carbonization and magnitude of environmental impact in the production process.
In order to realize a sustainable society, it is necessary to sufficiently understand the energy-metal nexus and tackle resource constraints in order to achieve sustainability on both sides. It is definitely unsustainable if resource depletion occurs by introducing low carbon energy technology without considering the influence on metals. Therefore, it is necessary to consider all related problems comprehensively and work on solving the problems that emerge from the nexus appropriately, not from a single viewpoint. In this respect, the results clarified by this paper can help in understanding the energy-metal nexus and achieving a sustainable society. Appropriate technological development and policy-making should be carried out reflecting these results.

Author Contributions

The manuscript was prepared and written by Takuma Watari, under the supervision of Tetsuo Tezuka, Benjamin McLellan and Seiichi Ogata, who assisted with improving and co-authoring the paper.

Conflicts of Interest

The authors declare no conflict of interest.

Appendix A

Figure A1. Approximation results of top-down model, where steel, copper and nickel were calculated using Japan data and aluminum was calculated using USA data to estimate future metal demand. (a) Steel (b) Aluminum (c) Copper (d) Nickel.
Minerals 08 00156 g0a1
Figure A2. Complete estimated results in each scenario. (a,c) Cumulative demand from 2016 to 2060 compared to the reserves and resources; (b,d) Breakdown of end-uses of cumulative demand from 2016 to 2060.
Minerals 08 00156 g0a2
Figure A3. Complete Annual discards of end-of-life material and annual demand for low carbon energy technology (except Te, Dy, Li).
Minerals 08 00156 g0a3
Figure A4. Complete Annual demand for low carbon energy technology considering recycling and reducing (except Te, Dy, Li).
Minerals 08 00156 g0a4
Table A1. Technology price in 2015.
TechnologyPrice (USD/kW)TechnologyPrice (USD/Vehicle)
CIGS PV module478HEV battery2240
CdTe PV module478PHEV battery10,880
Average PV module628EV battery14,100
Wind turbine1013HFV fuel cell9200
Figure A5. Estimated CO2 importance in each technology in 2DS (a) annual (b) cumulative.
Minerals 08 00156 g0a5
Figure A6. Estimated Price importance in each metal in 2015.
Minerals 08 00156 g0a6

References

  1. Giurco, D.; McLellan, B.; Franks, D.M.; Nansai, K.; Prior, T. Responsible mineral and energy futures: Views at the nexus. J. Clean. Prod. 2014, 84, 322–338. [Google Scholar] [CrossRef] [Green Version]
  2. The Warren Centre. The Copper Technology Roadmap 2030 Asia’s Growing Appetite for Copper; The Warren Centre: Sydney, Australia, 2016. [Google Scholar]
  3. International Copper Association. The Electric Vehicle Market and Copper Demand; International Copper Association: New York, NY, USA, 2017. [Google Scholar]
  4. International Energy Agency (IEA). Energy Technology Perspectives 2017: Catalysing Energy Technology Transformations; International Energy Agency: Paris, France, 2017; ISBN 978-92-64-27597-3. [Google Scholar]
  5. Goe, M.; Gaustad, G. Identifying critical materials for photovoltaics in the US: A multi-metric approach. Appl. Energy 2014, 123, 387–396. [Google Scholar] [CrossRef]
  6. Weiser, A.; Lang, D.J.; Schomerus, T.; Stamp, A. Understanding the modes of use and availability of critical metals—An expert-based scenario analysis for the case of indium. J. Clean. Prod. 2015, 94, 376–393. [Google Scholar] [CrossRef]
  7. Woodhouse, M.; Goodrich, A.; Margolis, R.; James, T.L.; Lokanc, M.; Eggert, R. Supply-Chain Dynamics of Tellurium, Indium, Manufacturing Costs. IEEE J. Photovolt. 2013, 3, 833–837. [Google Scholar] [CrossRef]
  8. Andersson, B.A. Materials availability for large-scale thin-film photovoltaics. Prog. Photovolt. Res. Appl. 2000, 8, 61–76. [Google Scholar] [CrossRef]
  9. Andersson, B.A.; Azar, C.; Holmberg, J.; Karlsson, S. Material constraints for thin-film solar cells. Energy 1998, 23, 407–411. [Google Scholar] [CrossRef]
  10. Candelise, C.; Spiers, J.F.; Gross, R.J.K. Materials availability for thin film (TF) PV technologies development: A real concern? Renew. Sustain. Energy Rev. 2011, 15, 4972–4981. [Google Scholar] [CrossRef]
  11. Fthenakis, V. Sustainability metrics for extending thin-film photovoltaics to terawatt levels. MRS Bull. 2012, 37, 425–430. [Google Scholar] [CrossRef]
  12. Redlinger, M.; Eggert, R.; Woodhouse, M. Evaluating the Availability of Gallium, Indium, and Tellurium from Recycled Photovoltaic Modules. Sol. Energy Mater. Sol. Cells 2014, 138, 58–71. [Google Scholar] [CrossRef]
  13. Stamp, A.; Wäger, P.A.; Hellweg, S. Linking energy scenarios with metal demand modeling-The case of indium in CIGS solar cells. Resour. Conserv. Recycl. 2014, 93, 156–167. [Google Scholar] [CrossRef]
  14. Choi, C.H.; Cao, J.; Zhao, F. System Dynamics Modeling of Indium Material Flows under Wide Deployment of Clean Energy Technologies. Resour. Conserv. Recycl. 2016, 114, 59–71. [Google Scholar] [CrossRef]
  15. Kim, J.; Guillaume, B.; Chung, J.; Hwang, Y. Critical and precious materials consumption and requirement in wind energy system in the EU 27. Appl. Energy 2015. [Google Scholar] [CrossRef]
  16. Nansai, K.; Nakajima, K.; Kagawa, S.; Kondo, Y.; Suh, S.; Shigetomi, Y.; Oshita, Y. Global Flows of Critical Metals Necessary for Low-Carbon Technologies: The Case of Neodymium, Cobalt, and Platinum. Environ. Sci. Technol. 2014, 48, 1391–1400. [Google Scholar] [CrossRef] [PubMed]
  17. Hoenderdaal, S.; Tercero Espinoza, L.; Marscheider-Weidemann, F.; Graus, W. Can a dysprosium shortage threaten green energy technologies? Energy 2013, 49, 344–355. [Google Scholar] [CrossRef]
  18. Roelich, K.; Dawson, D.A.; Purnell, P.; Knoeri, C.; Revell, R.; Busch, J.; Steinberger, J.K. Assessing the dynamic material criticality of infrastructure transitions: A case of low carbon electricity. Appl. Energy 2014, 123, 378–386. [Google Scholar] [CrossRef]
  19. Wilburn, D.R. Wind Energy in the United States and Materials Required for the Land-Based Wind Turbine Industry From 2010 Through 2030. 2011. Available online: http://pubs.usgs.gov/sir/2011/5036 (accessed on 1 October 2017).
  20. Habib, K.; Wenzel, H. Exploring rare earths supply constraints for the emerging clean energy technologies and the role of recycling. J. Clean. Prod. 2014, 84, 348–359. [Google Scholar] [CrossRef]
  21. Busch, J.; Dawson, D.; Roelich, K. Closing the low-carbon material loop using a dynamic whole system approach. J. Clean. Prod. 2017, 149, 751–761. [Google Scholar] [CrossRef]
  22. Glaister, B.J.; Mudd, G.M. The environmental costs of platinum-PGM mining and sustainability: Is the glass half-full or half-empty? Miner. Eng. 2010, 23, 438–450. [Google Scholar] [CrossRef]
  23. Alonso, E.; Field, F.R.; Kirchain, R.E. Platinum availability for future automotive technologies. Environ. Sci. Technol. 2012, 46, 12986–12993. [Google Scholar] [CrossRef] [PubMed]
  24. Borgwardt, R.H. Platinum, fuel cells, and future US road transport. Transp. Res. Part D Transp. Environ. 2001, 6, 199–207. [Google Scholar] [CrossRef]
  25. Kromer, M.A.; Joseck, F.; Rhodes, T.; Guernsey, M.; Marcinkoski, J. Evaluation of a platinum leasing program for fuel cell vehicles. Int. J. Hydrogen Energy 2009, 34, 8276–8288. [Google Scholar] [CrossRef]
  26. Yang, C.J. An impending platinum crisis and its implications for the future of the automobile. Energy Policy 2009, 37, 1805–1808. [Google Scholar] [CrossRef]
  27. Spiegel, R.J. Platinum and fuel cells. Transp. Res. Part D Transp. Environ. 2004, 9, 357–371. [Google Scholar] [CrossRef]
  28. Saurat, M.; Bringezu, S. Platinum group metal flows of Europe, part II exploring the technological and institutional potential for reducing environmental impacts. J. Ind. Ecol. 2009, 13, 406–421. [Google Scholar] [CrossRef]
  29. Mohr, S.H.; Mudd, G.; Giurco, D. Lithium Resources and Production: Critical Assessment and Global Projections. Minerals 2012, 2, 65–84. [Google Scholar] [CrossRef]
  30. Grosjean, C.; Herrera Miranda, P.; Perrin, M.; Poggi, P. Assessment of world lithium resources and consequences of their geographic distribution on the expected development of the electric vehicle industry. Renew. Sustain. Energy Rev. 2012, 16, 1735–1744. [Google Scholar] [CrossRef]
  31. Kushnir, D.; Sandén, B.A. The time dimension and lithium resource constraints for electric vehicles. Resour. Policy 2012, 37, 93–103. [Google Scholar] [CrossRef]
  32. Prior, T.; Wäger, P.A.; Stamp, A.; Widmer, R.; Giurco, D. Sustainable governance of scarce metals: The case of lithium. Sci. Total Environ. 2013, 461–462, 785–791. [Google Scholar] [CrossRef] [PubMed]
  33. Speirs, J.; Contestabile, M.; Houari, Y.; Gross, R. The future of lithium availability for electric vehicle batteries. Renew. Sustain. Energy Rev. 2014, 35, 183–193. [Google Scholar] [CrossRef]
  34. Forster, J.; Rutherford, T.F. A Lithium Shortage: Are Electric Vehicles Under Threat? Swiss Federal Institute of Technology Zurich: Zurich, Switzerland, 2011. [Google Scholar]
  35. Fishman, T.; Myers, R.; Rios, O.; Graedel, T.E. Implications of Emerging Vehicle Technologies on Rare Earth Supply and Demand in the United States. Resources 2018, 7, 9. [Google Scholar] [CrossRef]
  36. Mclellan, B.C.; Yamasue, E.; Tezuka, T.; Corder, G.; Golev, A.; Giurco, D. Critical Minerals and Energy—Impacts and Limitations of Moving to Unconventional Resources. Resources 2016, 5, 19. [Google Scholar] [CrossRef]
  37. Tokimatsu, K.; Wachtmeister, H.; McLellan, B.; Davidsson, S.; Murakami, S.; Höök, M.; Yasuoka, R.; Nishio, M. Energy modeling approach to the global energy-mineral nexus: A first look at metal requirements and the 2 °C target. Appl. Energy 2017, 1–16. [Google Scholar] [CrossRef]
  38. National Research Council (NRC). Minerals, Critical Minerals, and the U.S. Economy; Committee on Critical Mineral Impacts of the U.S. Economy: Washington, DC, USA, 2008. [Google Scholar]
  39. European Commission. Critical Raw Materials for the EU, Report of the Ad-Hoc Working Group on Defining Critical Raw Materials; European Commission: Brussels, Belgium, 2010; Volume 39. [Google Scholar]
  40. European Commission. Report on Critical Raw Materials for the EU, Report of the Ad Hoc Working Group on Defining Critical Raw Materials; European Commission: Brussels, Belgium, 2014. [Google Scholar]
  41. Graedel, T.E.; Barr, R.; Chandler, C.; Chase, T.; Choi, J.; Christoffersen, L.; Friedlander, E.; Henly, C.; Jun, C.; Nassar, N.T.; et al. Methodology of metal criticality determination. Environ. Sci. Technol. 2012, 46, 1063–1070. [Google Scholar] [CrossRef] [PubMed]
  42. Nassar, N.T.; Barr, R.; Browning, M.; Diao, Z.; Friedlander, E.; Harper, E.M.; Henly, C.; Kavlak, G.; Kwatra, S.; Jun, C.; et al. Criticality of the geological copper family. Environ. Sci. Technol. 2012, 46, 1071–1078. [Google Scholar] [CrossRef] [PubMed]
  43. Graedel, T.E.; Nassar, N.T. The criticality of metals: A perspective for geologists. Geol. Soc. Spec. Publ. 2015, 393, 291–302. [Google Scholar] [CrossRef]
  44. Nuss, P.; Harper, E.M.; Nassar, N.T.; Reck, B.K.; Graedel, T.E. Criticality of iron and its principal alloying elements. Environ. Sci. Technol. 2014, 48, 4171–4177. [Google Scholar] [CrossRef] [PubMed]
  45. Harper, E.M.; Kavlak, G.; Burmeister, L.; Eckelman, M.J.; Erbis, S.; Sebastian Espinoza, V.; Nuss, P.; Graedel, T.E. Criticality of the Geological Zinc, Tin, and Lead Family. J. Ind. Ecol. 2015, 19, 628–644. [Google Scholar] [CrossRef]
  46. Nassar, N.T.; Graedel, T.E.; Harper, E.M. By-product metals are technologically essential but have problematic supply. Sci. Adv. 2015, 1, e1400180. [Google Scholar] [CrossRef] [PubMed]
  47. Nassar, N.T.; Du, X.; Graedel, T.E. Criticality of the Rare Earth Elements. J. Ind. Ecol. 2015, 19, 1044–1054. [Google Scholar] [CrossRef]
  48. Harper, E.M.; Diao, Z.; Panousi, S.; Nuss, P.; Eckelman, M.J.; Graedel, T.E. The criticality of four nuclear energy metals. Resour. Conserv. Recycl. 2015, 95, 193–201. [Google Scholar] [CrossRef]
  49. Panousi, S.; Harper, E.M.; Nuss, P.; Eckelman, M.J.; Hakimian, A.; Graedel, T.E. Criticality of Seven Specialty Metals. J. Ind. Ecol. 2016, 20, 837–853. [Google Scholar] [CrossRef]
  50. Graedel, T.E.; Harper, E.M.; Nassar, N.T.; Nuss, P.; Reck, B.K. Criticality of metals and metalloids. Proc. Natl. Acad. Sci. USA 2015, 112, 4257–4262. [Google Scholar] [CrossRef] [PubMed]
  51. Ciacci, L.; Nuss, P.; Reck, B.; Werner, T.; Graedel, T. Metal Criticality Determination for Australia, the US, and the Planet—Comparing 2008 and 2012 Results. Resources 2016, 5, 29. [Google Scholar] [CrossRef]
  52. U.S. Department of Energy. Critical Materials Strategy: 2011; U.S. Department of Energy: Washington, DC, USA, 2011.
  53. McLellan, B.; Corder, G.; Ali, S. Sustainability of Rare Earths—An Overview of the State of Knowledge. Minerals 2013, 3, 304–317. [Google Scholar] [CrossRef]
  54. Moss, R.L.; Tzimas, E.; Willis, P.; Arendorf, J. Critical Metals in the Path towards the Decarbonisation of the EU Energy Sector; Publications Office of the European Union: Brussels, Belgium, 2013. [Google Scholar]
  55. Habib, K.; Wenzel, H. Reviewing resource criticality assessment from a dynamic and technology specific perspective—Using the case of direct-drive wind turbines. J. Clean. Prod. 2016, 112, 3852–3863. [Google Scholar] [CrossRef]
  56. Glöser-Chahoud, S.; Tercero Espinoza, L.; Walz, R.; Faulstich, M. Taking the Step towards a More Dynamic View on Raw Material Criticality: An Indicator Based Analysis for Germany and Japan. Resources 2016, 5, 45. [Google Scholar] [CrossRef]
  57. Sugiyama, K.; Honma, O.; Mishima, N. Quantitative Analysis of Material Flow of Used Mobile Phones in Japan. Procedia CIRP 2016, 40, 79–84. [Google Scholar] [CrossRef]
  58. Xu, C.; Zhang, W.; He, W.; Li, G.; Huang, J. The situation of waste mobile phone management in developed countries and development status in China. Waste Manag. 2016, 58, 341–347. [Google Scholar] [CrossRef] [PubMed]
  59. Li, B.; Yang, J.; Lu, B.; Song, X. Estimation of retired mobile phones generation in China: A comparative study on methodology. Waste Manag. 2015, 35, 247–254. [Google Scholar] [CrossRef] [PubMed]
  60. Sarath, P.; Bonda, S.; Mohanty, S.; Nayak, S.K. Mobile phone waste management and recycling: Views and trends. Waste Manag. 2015, 46, 536–545. [Google Scholar] [CrossRef] [PubMed]
  61. Yokoyama, K.; Nakano, K.; Nagasaka, T.; Nakajima, K. Substance Flow Analysis of Indium for Flat Panel Displays in Japan. Mater. Trans. 2008, 48, 99–104. [Google Scholar]
  62. Ashby, M.F. Materials for low-carbon power. In Materials and the Environment; Elsevier: New York, NY, USA, 2013; pp. 349–413. ISBN 978-0-12-385971-6. [Google Scholar]
  63. Weckend, S.; Wade, A.; Heath, G. End-of-Life Management Solar Photovoltaic Panels; International Renewable Energy Agency and International Energy Agency Photovoltaic Power Systems: Paris, France, 2016. [Google Scholar]
  64. Hatayama, H.; Daigo, I.; Matsuno, Y.; Adachi, Y. Evolution of aluminum recycling initiated by the introduction of next-generation vehicles and scrap sorting technology. Resour. Conserv. Recycl. 2012, 66, 8–14. [Google Scholar] [CrossRef]
  65. Müller, D.B. Stock dynamics for forecasting material flows—Case study for housing in The Netherlands Daniel. Ecol. Econ. 2005, 59, 82–93. [Google Scholar] [CrossRef]
  66. Gerst, M.D. Linking material flow analysis and resource policy via future scenarios of in-use stock: An example for copper. Environ. Sci. Technol. 2009, 43, 6320–6325. [Google Scholar] [CrossRef] [PubMed]
  67. Hatayama, H.; Daigo, I.; Matsuno, Y.; Adachi, Y. Outlook of the World Steel Cycle Based on the Stock and Flow Dynamics. Environ. Sci. Technol. 2010, 44, 6457–6463. [Google Scholar] [CrossRef] [PubMed]
  68. Elshkaki, A.; Graedel, T.E. Dynamic analysis of the global metals flows and stocks in electricity generation technologies. J. Clean. Prod. 2013, 59, 260–273. [Google Scholar] [CrossRef]
  69. Busch, J.; Steinberger, J.K.; Dawson, D.A.; Purnell, P.; Roelich, K. Managing critical materials with a technology-specific stocks and flows model. Environ. Sci. Technol. 2014, 48, 1298–1305. [Google Scholar] [CrossRef] [PubMed]
  70. Halada, K.; Shimada, M.; Ijima, K. Decoupling Status of Metal Consumption from Economic Growth. J. Jpn. Inst. Met. 2007, 71, 823–830. [Google Scholar] [CrossRef]
  71. The World Bank World Development Indicators. Available online: https://data.worldbank.org/data-catalog (accessed on 1 July 2017).
  72. World Bureau of Metal Statistics. World Metal Statistics Yearbook; World Bureau of Metal Statistics: Ware, UK, 2016. [Google Scholar]
  73. Sigen Sozai Gakkai. Koubutsu Shigen Data Book, 2nd ed.; Ohmusha: Tokyo, Japan, 2006. [Google Scholar]
  74. U.S. Geological Survey (USGS). Commodity Statistics and Information. Available online: https://minerals.usgs.gov/minerals/pubs/mcs/ (accessed on 1 October 2017).
  75. Bleiwas, D.I. Byproduct Mineral Commodities Used for the Production of Photovoltaic Cells; USGS Publications Team: Reston, VA, USA, 2010; Volume 1365.
  76. Berry, C. Case Study of a Growth Driver—Silver Use in Solar. Available online: https://www.pv-tech.org/guest-blog/case_study_of_a_growth_driver_silver_use_in_solar (accessed on 1 October 2017).
  77. Bödeker, J.M.; Bauer, M.; Pehnt, M. Aluminium and Renewable Energy Systems—Prospects for the Sustainable Generation of Electricity and Heat; Institut für Energie und Umweltforschung Heidelberg GmbH: Heidelberg, Germany, 2010. [Google Scholar]
  78. U.S. Geological Survey (USGS). Historical Statistics for Mineral and Material Commodities in the United States. Available online: https://minerals.usgs.gov/minerals/pubs/historical-statistics/ (accessed on 1 October 2017).
  79. BGS Minerals UK. World Mineral Statistics Data. Available online: https://www.bgs.ac.uk/mineralsuk/statistics/wms.cfc?method=searchWMS (accessed on 1 October 2017).
  80. Lokanc, M.; Eggert, R.; Redlinger, M.; Lokanc, M.; Eggert, R. The Availability of Indium : The Present, Medium Term, and Long Term; National Renewable Energy Laboratory (NREL): Golden, CO, USA, 2015.
  81. Sverdrup, H.; Ragnarsdóttir, K.V. Natural Resources in a Planetary Perspective. Geochem. Perspect. 2014, 3, 129–341. [Google Scholar] [CrossRef]
  82. Kleijn, R.; Van Der Voet, E. Resource constraints in a hydrogen economy based on renewable energy sources: An exploration. Renew. Sustain. Energy Rev. 2010, 14, 2784–2795. [Google Scholar] [CrossRef]
  83. United States Geological Survey (USGS). Commodity Statistics and Information. Available online: https://minerals.usgs.gov/minerals/pubs/commodity/ (accessed on 1 January 2017).
  84. Kondo, S.; Takeyama, A.; Okura, T. A study on the Forecasts of Supply and Demand of Platinum Group Metals. Shigen-to-Sozai 2006, 122, 386–395. [Google Scholar] [CrossRef]
  85. International Renewable Energy Agency (IRENA). Data & Statistics. Available online: http://www.irena.org/ourwork/Knowledge-Data-Statistics/Data-Statistics (accessed on 1 October 2014).
Figure 1. Cumulative electricity capacity in each scenario. (a) Solar power (b) Wind power (after International Energy Agency (IEA) [4]).
Minerals 08 00156 g001
Figure 2. In-use stock of next-generation vehicles in each scenario (after IEA [4]). (a) Reference Technology Scenario (RTS) (b) 2 °C Scenario (2DS) (c) Beyond 2 °C Scenario (B2DS). (ICEV: internal combustion engine vehicles, HEV: hybrid electric vehicles, PHEV: plug-in hybrid electric vehicles, EV: electric vehicles, HFV: hydrogen fuel-cell vehicles).
Minerals 08 00156 g002
Figure 3. Global electricity generation in each scenario (after IEA [4]). (a) RTS (b) 2DS (c) B2DS.
Minerals 08 00156 g003
Figure 4. Annual Solar power installation. (a) RTS (b) 2DS (c) B2DS.
Minerals 08 00156 g004
Figure 5. Annual Wind power installation. (a) RTS (b) 2DS (c) B2DS.
Minerals 08 00156 g005
Figure 6. Annual Next-generation vehicle sales. (a) RTS (b) 2DS (c) B2DS.
Minerals 08 00156 g006
Figure 7. (a) The relationship between copper consumption per capita and GDP per capita in Japan (Data: various References [71,72,73]); (b) Conceptual diagram of decoupling.
Minerals 08 00156 g007
Figure 8. Process flow diagram of the life cycle stages for low carbon energy technology and resulting opportunities for reducing, reusing, or recycling (after [63]).
Minerals 08 00156 g008
Figure 9. CO2 emissions reductions by technology in the 2DS relative to RTS. (Data: [4]).
Minerals 08 00156 g009
Figure 10. Approximation result of top-down model for copper.
Minerals 08 00156 g010
Figure 11. Estimated cumulative demand for all uses from 2016 to 2060.
Minerals 08 00156 g011
Figure 12. Estimated annual demand for low carbon energy technology up to 2060.
Minerals 08 00156 g012
Figure 13. Cumulative demand from 2016 to 2060 compared to the reserves and resources in the case of 2DS-Ref.
Minerals 08 00156 g013
Figure 14. Breakdown of end-uses of cumulative demand from 2016 to 2060 in the case of 2DS-Ref.
Minerals 08 00156 g014
Figure 15. Annual discards of end-of-life material and annual demand for low carbon energy technology. In this case, tellurium discards from CdTe solar panels, Dysprosium discards from wind power using permanent magnets and next-generation vehicles and lithium discards from next-generation vehicles.
Minerals 08 00156 g015
Figure 16. Cumulative discards by region from 2016 to 2060. (a) solar power (b) wind power.
Minerals 08 00156 g016
Figure 17. Annual primary demand for low carbon energy technology considering recycling and reduction of material intensity.
Minerals 08 00156 g017
Figure 18. Cumulative primary demand from 2016 to 2060 considering recycling and reducing.
Minerals 08 00156 g018
Figure 19. Criticality analysis results expressing the depletion potential or the ratio of demand increase on the horizontal axis and the importance for decarbonization on the vertical axis; bubble size expresses the size of the environmental impact. (a) The horizontal axis is the depletion potential (reserves based) (b) The horizontal axis is the depletion potential (resources based) (c) The horizontal axis is the ratio of demand increase.
Minerals 08 00156 g019aMinerals 08 00156 g019b
Table 1. Low carbon energy technology and required metals.
Required MetalsSolar PowerWind PowerNext-Generation Vehicle
Indium
Gallium
Selenium
Tellurium
Cadmium
Silver
Dysprosium
Neodymium
Lithium
Cobalt
Nickel
Platinum
Steel
Aluminum
Copper
Table 2. Average lifetime of low carbon technology.
TechnologyDistribution FunctionAverage Lifetime (Year)Shape Parameter αRef.
Solar powerWeibull205.38[62,63]
Wind power255.38[62,63]
Next-generation vehicle153.50[64]
Table 3. Share of CIGS/CdTe type photovoltaic (PV) panels within the PV market and Permanent Magnet type Generator (PMG) type wind power generator within the wind power market [13,20].
TypeScenario201020202030204020502060
CIGS/CdTeLow2%7%14%18%20%20%
Ref2%9%21%28%30%30%
High2%13%37%48%50%50%
PMGLow10%14%18%21%25%25%
Ref10%15%20%25%30%30%
High10%20%30%40%50%50%
Table 4. Metal intensity in solar power.
MetalTypeMetal Intensity (t/GW)Ref.Price (USD/t) 1
IndiumCIGS23[12]520,000
GalliumCIGS7.5[12]317,000
SeleniumCIGS45[36]48,700
TelluriumCdTe97.5[75]77,000
CadmiumCdTe85[75]1470
SilverAll80[76]505,000
SteelAll1,100,000[62]81
AluminumAll32,000[77]1940
CopperAll4000[2]5650
Note: 1 Metal price is for 2015 from USGS database [78].
Table 5. Metal intensity in wind power.
MetalTypeMetal Intensity (t/GW)Ref.Price (USD/t) 1
DysprosiumPMG27.7[17]240,000
NeodymiumPMG198[17]42,000
SteelAll103,000[19]81
AluminumAll1060[77]1940
CopperAll3000[19]5560
Note: 1 Metal price is for 2015 from USGS database [78].
Table 6. Metal intensity in next-generation vehicles (Unit: g/vehicle).
MetalICEVHEVPHEVEVHFVRef.Price (USD/t) 1
Dysprosium08383830[17]240,000
Neodymium06956956950[17]42,000
Lithium00510012,7000[52]4540
Cobalt0660350088000[52]29,200
Nickel0320018,60046,5000[52]11,800
Platinum000060[28]13,500,000
Steel921,9001,056,2001,185,900909,500911,800[35]81
Aluminum71,300114,500162,40078,60065,000[35]1940
Copper23,00040,00060,00083,00023,000[3]5650
Note: 1 Metal price is for 2015 from USGS database [78].
Table 7. Reserves and Resources used in this paper (Unit: kt).
MetalReservesResourcesProductionRef.
Indium15470.8[80,81]
Gallium11010000.4[82,83]
Selenium1001712.2[74,81]
Tellurium25480.2[74]
Cadmium500600024[74]
Silver570130825[74,81]
Dysprosium 1110019801.8[20,81]
Neodymium 112,80023,04016[20,81]
Lithium14,00039,50032[74]
Cobalt7100145,000126[74]
Nickel79,000130,0002280[74]
Platinum6200.2[84]
Steel85,000,000230,000,0002,280,000[74]
Aluminum28,000,00055,000,00057,500[74]
Copper720,0003,500,00019,100[74]
Note: 1 Calculated from rare earths resources using the elemental ratio of known reserves.
Table 8. Recycling and Reducing scenarios.
ScenarioCharacteristics
ANo management measures
B90% recycling for end-of-life low carbon energy technology
C50% recycling for end-of-life low carbon energy technology
DReducing metal intensity by 50% by 2060 (Linearly)
ERecycle + Reduce (Scenario B + Scenario D)
Table 9. Comparison of this study to previous studies which evaluated bottleneck metals.
StudyRegionPeriodComparison withBottleneck Metal
This studyWorld2060Reserves/Resources/ProductionIn, Se, Te, Ag, Li, Ni, Pt,
McLellan et al. [36]World2050ReservesIn, Se, Te, Dy, Nd
Tokimatsu et al. [37]World2100ProductionIn, Se, Te, Li, Co, Ni, Mn
Table 10. Comparison of this study to previous studies which evaluated critical metals.
StudyRegionPeriodCriteriaCritical Metal
This studyWorld2060Depletion/Importance for decarbonization/EnvironmentalIn, Te, Ag, Li, Ni, Pt
USDOE [52] USA2025Supply risk/Importance to clean energyDy, Nd, Eu, Tb, Y
JRC [54] EU2030Market factors/Geopolitical factorsGa, Te, Dy, Nd, Eu, Tb, Y, Pr

