2.1.1. General Microstructural Organization
Polarized and analyzed Light Microscopy (PLM) and Scanning Electron Microscopy (SEM) were used for general orientation and shell microstructure characterization (
Figure 1). As shown in
Figure 1a,b crossed-lamellar layer is found to be precisely ordered, with straight and long 1st order lamellae that present the alternate orientation, so typical of this microstructural organization (
Figure 1b). The shift from calcite outer layer to aragonite inner layer appears to be fine and sharp at low magnification, and straight along the shell section (
Figure 1b). The calcite prisms, however, are found to be highly irregular, grouped in wavy fagots with distinct orientations. This layer is said to be “very irregularly prismatic; the prisms, ... are mostly very fine and undulating in a peculiar manner” [
1,]. SEM observations of the preparation presenting both radial and transverse sections (
Figure 1c,d), cut close to the beginning of crossed-lamellar deposition, highlight the regular 3D arrangement of 1st order lamellae and the alternate orientation of the 2nd order lamellae, with an angle fitting with other taxa [
13].
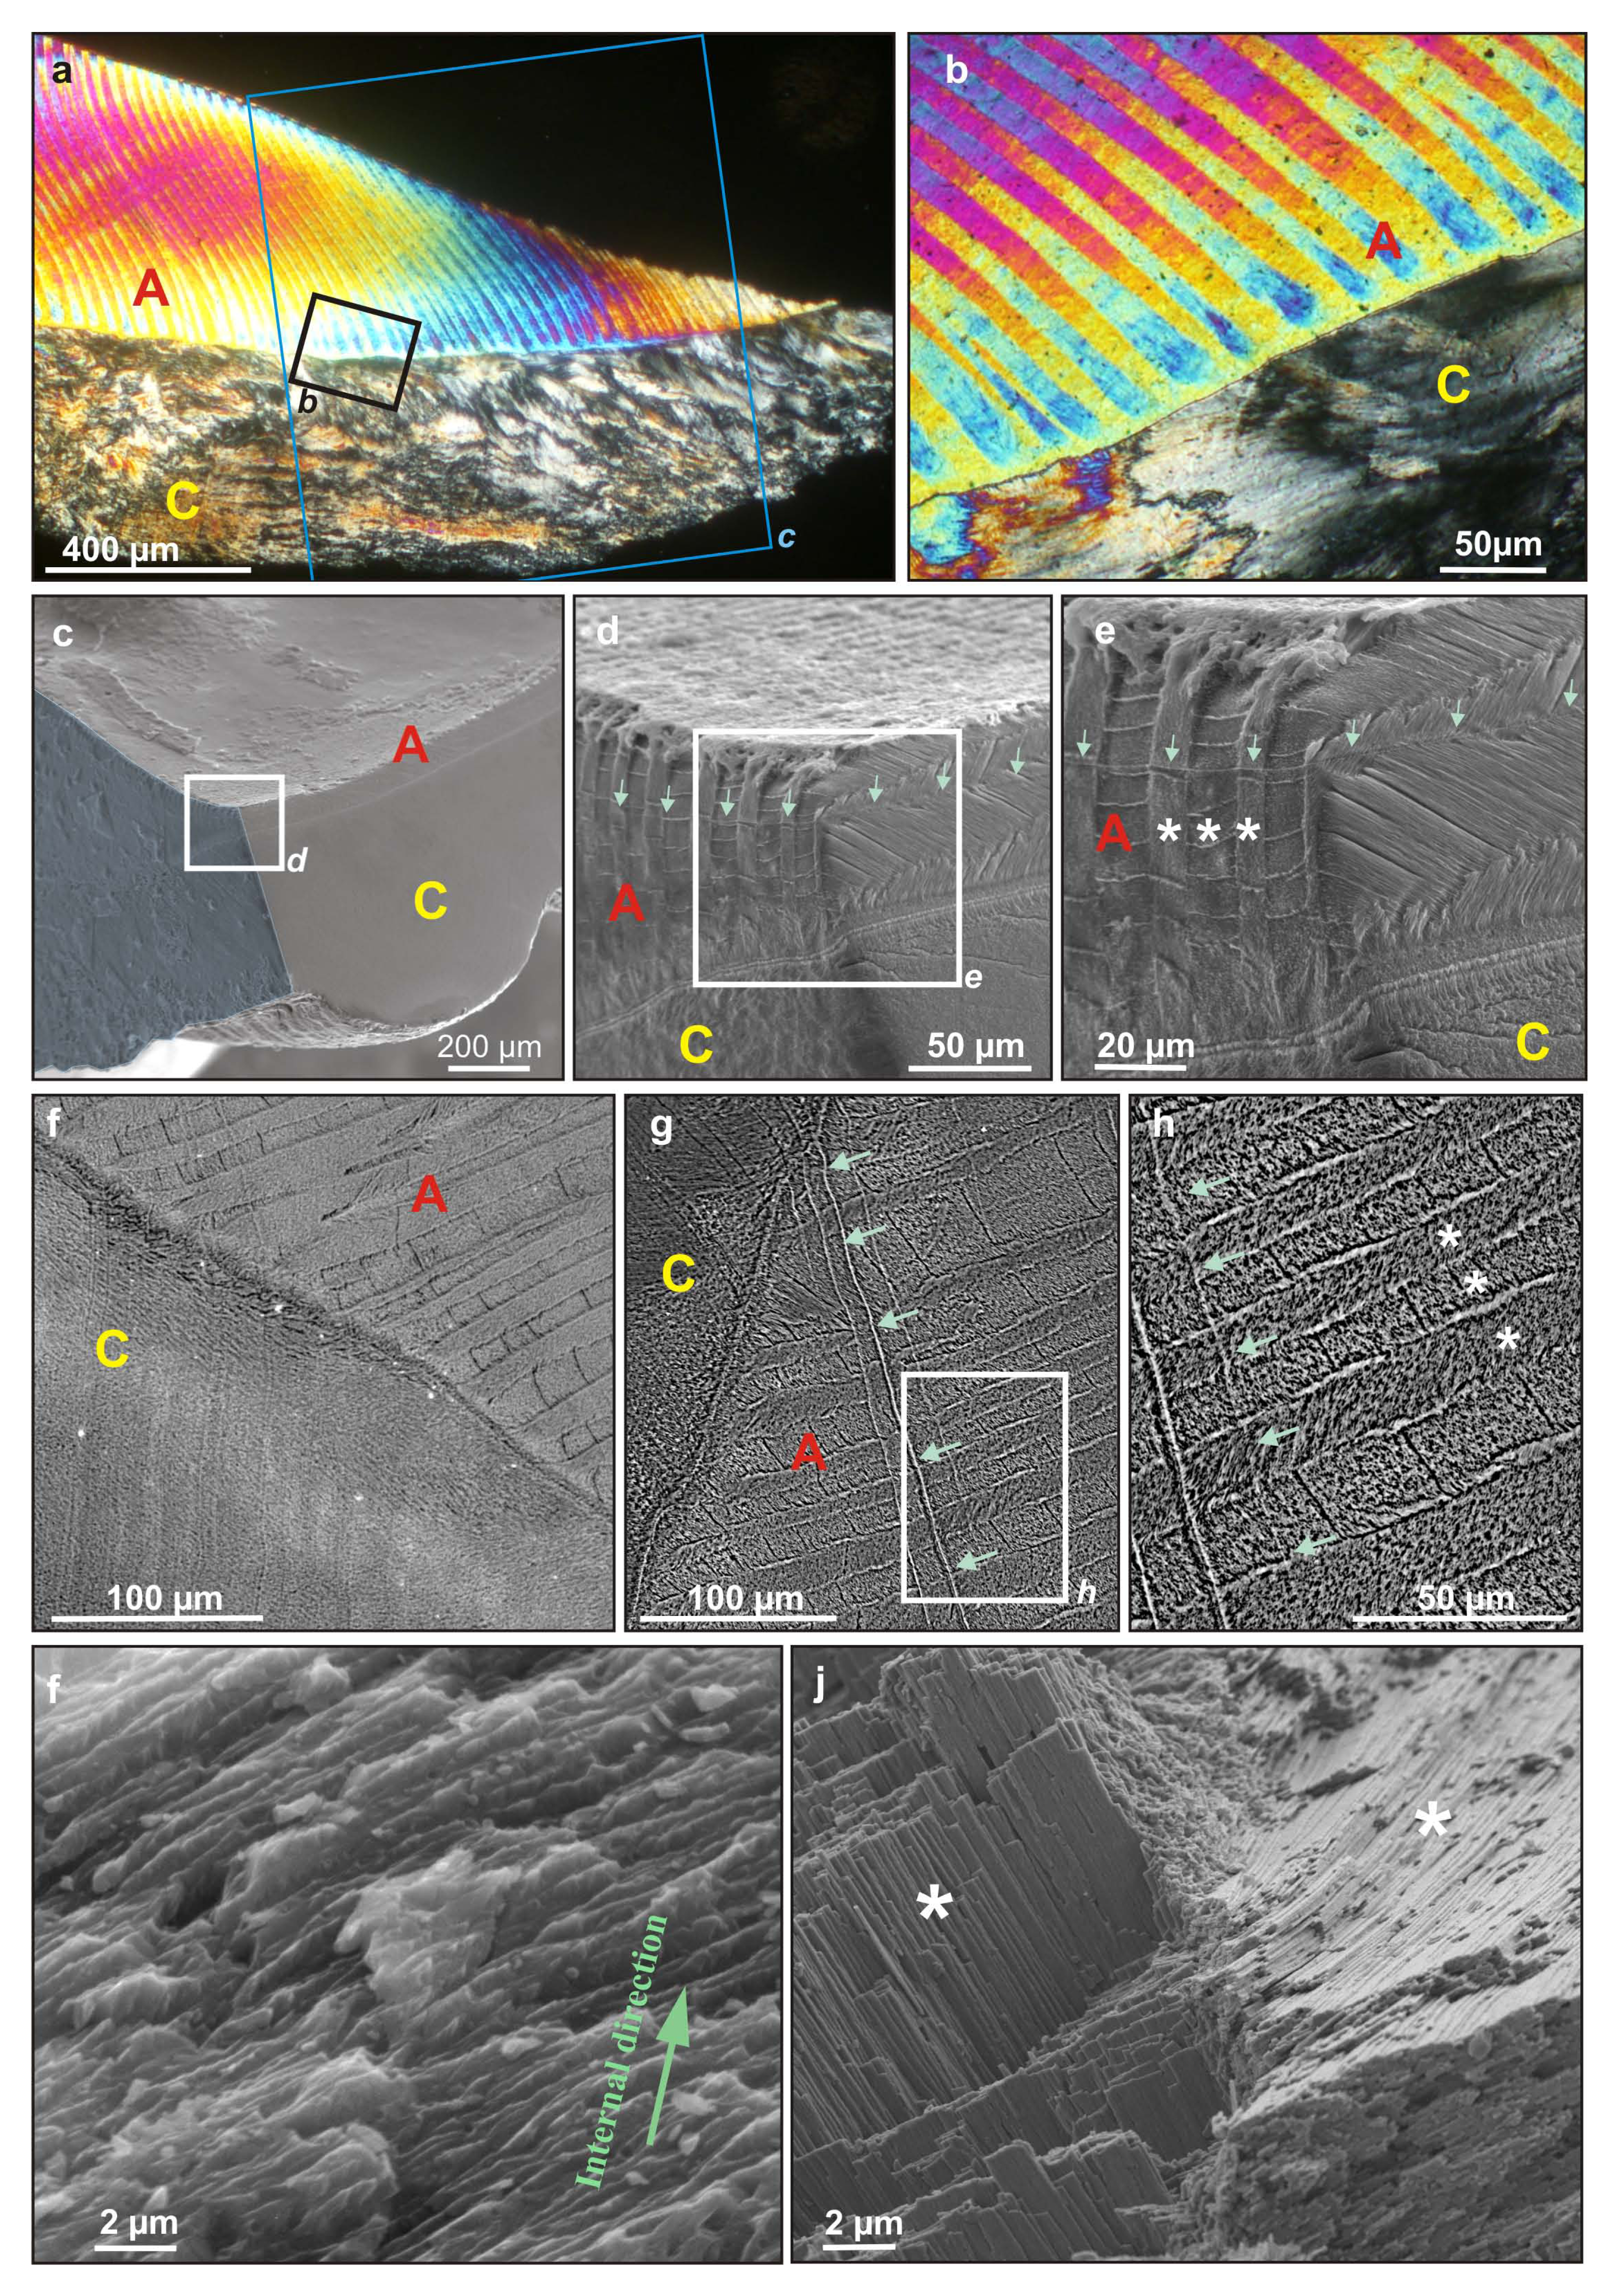
Figure 1.
Microstructural organization of a
Nerita shell. (
a) PLM view of an ultra-thin radial section of the outer lip of the peristome of the shell, showing the outer calcite prisms layer (bottom) and inner aragonite crossed-lamellar (top). Black square marks the localization of
Figure 1b. Blue square corresponds to the approximate location of the radial cut, which is colored in blue in
Figure 1c; (
b) PLM view of the shift from the calcite prisms layer (C) to the aragonite crossed-lamellar layer (A), which presents a conserved crystal orientation one lamella over two; (
c) SEM image of a fragment of the peristome, cut along both radial and transverse sections, each side polished and etched to reveal calcite (C) and aragonite (A) microstructural patterns. White square marks the localization of Figure 1d; (
d) SEM image of same fragment at the shift from the outer calcite layer (C) to the inner aragonite layer (A). White square marks the localization of
Figure 1e. Green arrows mark a growth layer; (
e) SEM image of the aragonite crossed-lamellar inner layer (A) of the same fragment. Green arrows mark a growth layer. Stars mark individual 1st order lamellae; (
f) and (
g) SEM (BSE detector) images of a radial polished section at the shift from calcite (C) to aragonite (A) layer, stained with Pb citrate and uranyl acetate. Green arrows mark a growth layer. White square marks the localization of Figure 1h; (
h) SEM (BSE detector) images of a radial polished section of aragonite crossed-lamellar layer. Stars mark individual 1st order lamellae. Arrows mark a growth layer; (
i,
j) SEM image of a broken, unetched fragment showing (
i) the irregular, fiber-like shape of the calcite prisms forming the outer layer, (
j) the sheet-like arrangement (2nd order lamellae) of 3rd order rods that form two adjacent 1st order lamellae (white stars).
![Minerals 02 00085 g001]()
SEM heavy metals staining procedure used for observations with Back Scattered Electrons (BSE) detector is found to enhance organic/mineral contrast, and therefore microstructural patterns (
Figure 1f–h). Growth lines, perpendicular to 1st order rods, are thus clearly marked (
Figure 1g,h) when they could only be faintly distinguished in
Figure 1e. Some areas locally enriched in organic compounds (white contrast) can also be evidenced, forming a fine layer at the shift from calcite to aragonite (
Figure 1g), or localized between each 1st order lamellae in crossed-lamellar (
Figure 1h).
At higher magnification, the traditional sheet-like arrangement (2nd order lamellae) of 3rd order rods, the orientation of which shifts between each 1st order lamella, can easily be identified (
Figure 1j). The inner structure of the “prismatic” calcite layer is very different from the calcite prisms of
Pinna and
Atrina that are often used as a reference for this kind of structure: it is indeed composed of fiber-like, ∼1
µm thick and undulating units (
Figure 1i). For consistency with the literature, they will still be called “prism” from now on.
2.1.2. XANES—Sulfur Speciations and Elemental Compositions Distributions
µ-XANES can be used to map the distribution of sulfur species and some elements content at high spatial resolution [
14,
15,
16,
17,
18].
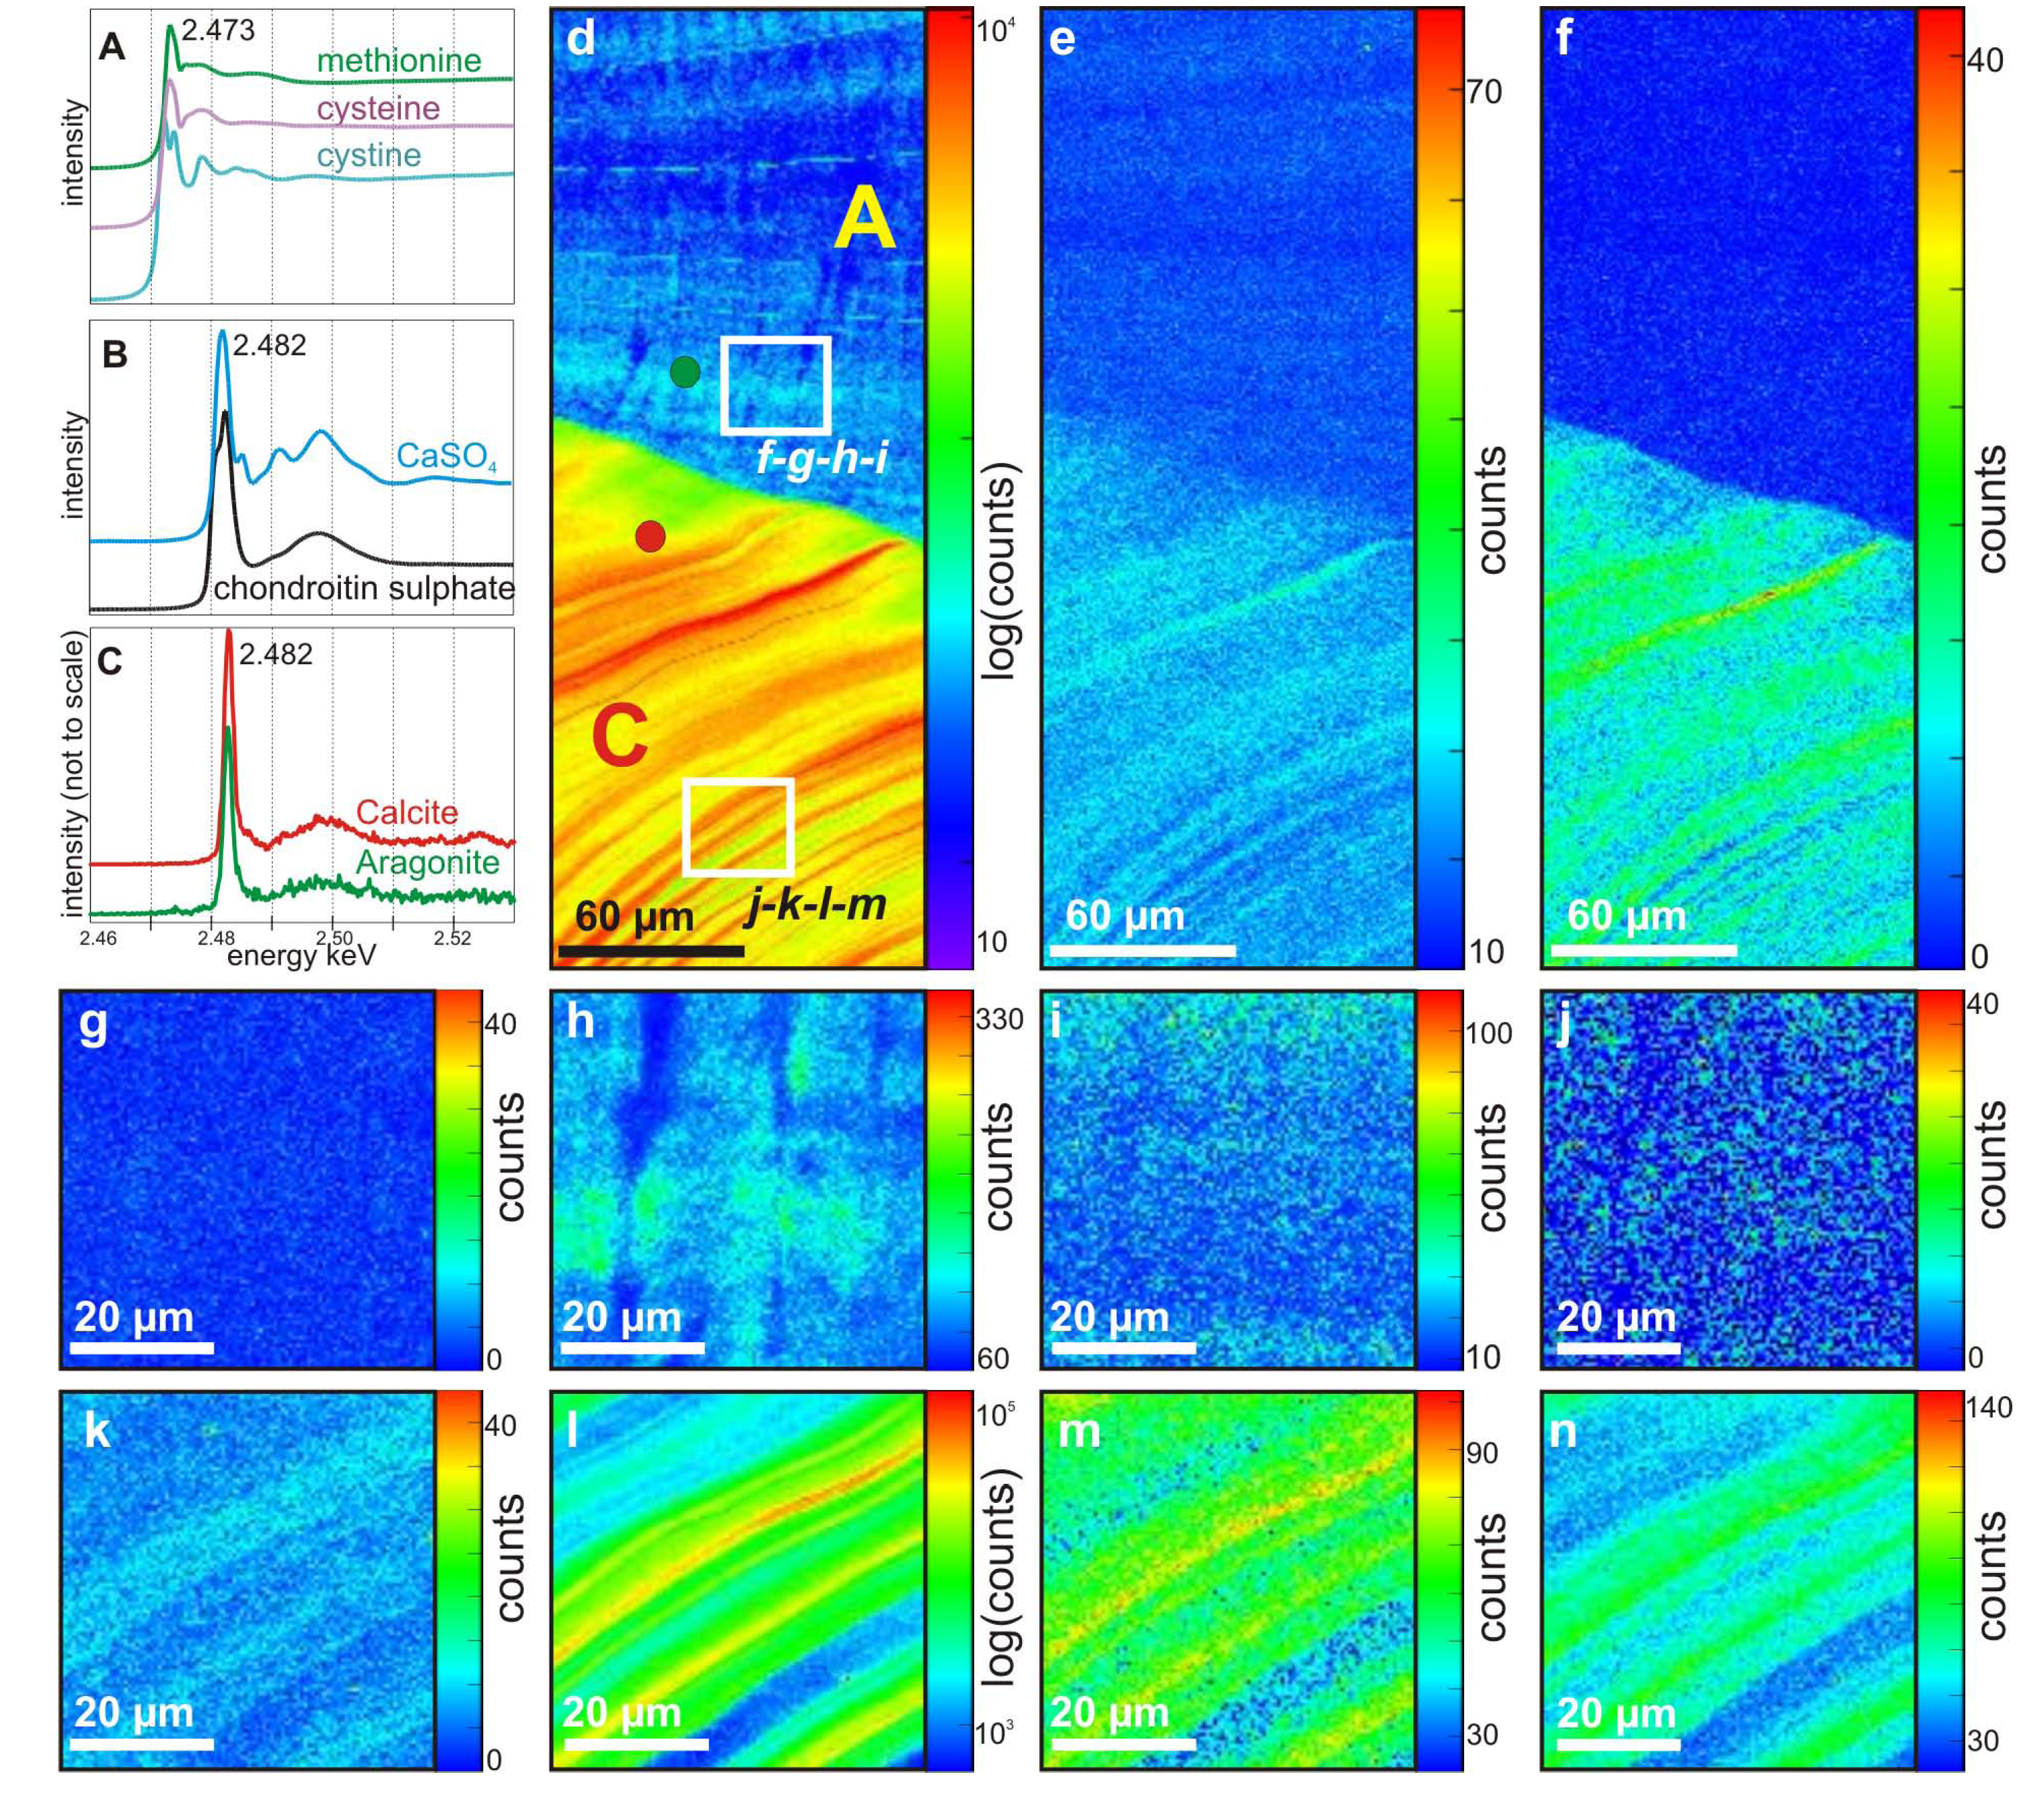
Herein, standards compounds rich in sulfur were scanned around S-K absorption edge between 2,450 and 2,540 eV, in unfocused mode, to provide reference spectra for later maps. Chondroitin sulfate was used as a standard for S-containing polysaccharides and gypsum as a standard for inorganic sulfates; methionine, cysteine and cystine were used as standards for S-containing amino acids. The S K-edge spectra of methionine, cysteine and cystine show a main peak at 2,473 eV (
Figure 2a). Both spectra of chondroitin sulfate and gypsum (
Figure 2b) present a main absorption peak at 2,482 eV, but display specific EXAFS profiles. Spectra from inner and outer layers of the shell (
Figure 2c) both display a profile, which is matching EXAFS spectrum for chondroitin sulfate standard, but not for inorganic sulfate standard: this reveals that the S present in both layers of the shell is associated to organic molecules, mostly organic sulfates. Energies at 2,482 and 2,473 eV were therefore selected to map the repartition of S-containing organic compounds within the following 2D scans.
The map for S-polysaccharides at low magnification (energy = 2,482 eV) presents much higher intensities in the calcite layer (bottom) than in the aragonite layer (top) (
Figure 2d). Fluorescence maps acquired simultaneously show that the calcite layer is also richer in Sr and P contents (
Figure 2e,f). Maps for the distribution of S containing amino acids (energy = 2,473 eV) also present lowered intensities within the aragonite layer (
Figure 2g) compared to calcite layer (
Figure 2k).
Within the calcite layer, the distributions of S-polysaccharides (
Figure 2d,i), Sr (
Figure 2e,m), P (
Figure 2f,n) and S-amino acids (
Figure 2k) present marked bands, corresponding to the growth layering of the shell. Within the aragonite layer, growth layering is more faintly marked but can still be distinguished on S-polysaccharides maps (
Figure 2d,h) and Sr (
Figure 2e,i), whereas it remains unseen on P (
Figure 2f,j) and S-amino acids maps (
Figure 2g). The aragonite layer also presents an heterogeneous distribution of S-polysaccharides following the crossed-lamellar microstructure, the 1
st order lamellae being richer at heart than on their respective boundaries (
Figure 2h).
Figure 2.
Sulfur speciations and elemental maps. (a) and (b) XANES spectra of S reference compounds. (a) Methionine, cysteine and cystine amino acids spectra all display a main peak at 2,473 eV; (b) Chondroitin sulfate and CaSO4 display a main peak at 2,482 eV, with specific EXAFS patterns; (c) Spectra extracted from calcite and aragonite layers, matching chondroitin sulfate EXAFS pattern; (d–f) Maps of the transition between inner calcite (bottom) and outer aragonite (top) layers; (d) S-polysaccharides map, performed at 2,482 eV, showing a higher intensity within the calcite layer, as well as marked growth layering. Red and green circles mark the locations, from which Figure 2c spectra were extracted; (e) Sr map performed at 2,482 eV; (f) P map performed at 2,482 eV; (g–j) Maps of the aragonite crossed-lamellar layer; (g) Amino acids-linked S map, performed at 2,473 eV; (h) S-polysaccharides map, performed at 2,482 eV; (i) Sr map performed at 2,482 eV; (j)P map performed at 2,482 eV; (k–n) Maps of the calcite layer, all displaying marked growth layering and higher intensities than maps 2g–j; (k) Amino acids-linked S map, performed at 2,473 eV; (l) S-polysaccharides map, performed at 2,482 eV; (m) Sr map performed at 2,482 eV; (n) P map performed at 2,482 eV.
![Minerals 02 00085 g002]()
2.1.3. FT-IR Maps—Distribution of Organic and Mineral Bands
Calcite and aragonite FT-IR spectra present characteristic bands, attributed to CO
32− group vibrations:
ν3 band at ∼1,428 cm
−1, the
ν2 doublet at 877–848 cm
−1 ,
ν4 band at 713 cm
−1 are specific for calcite, whereas
ν3 band at ∼1,471 cm
−1 and the two doublets,
ν2 at 858–844 cm
−1 and
ν4 at 713–700 cm
−1 , are specific for aragonite [
19].
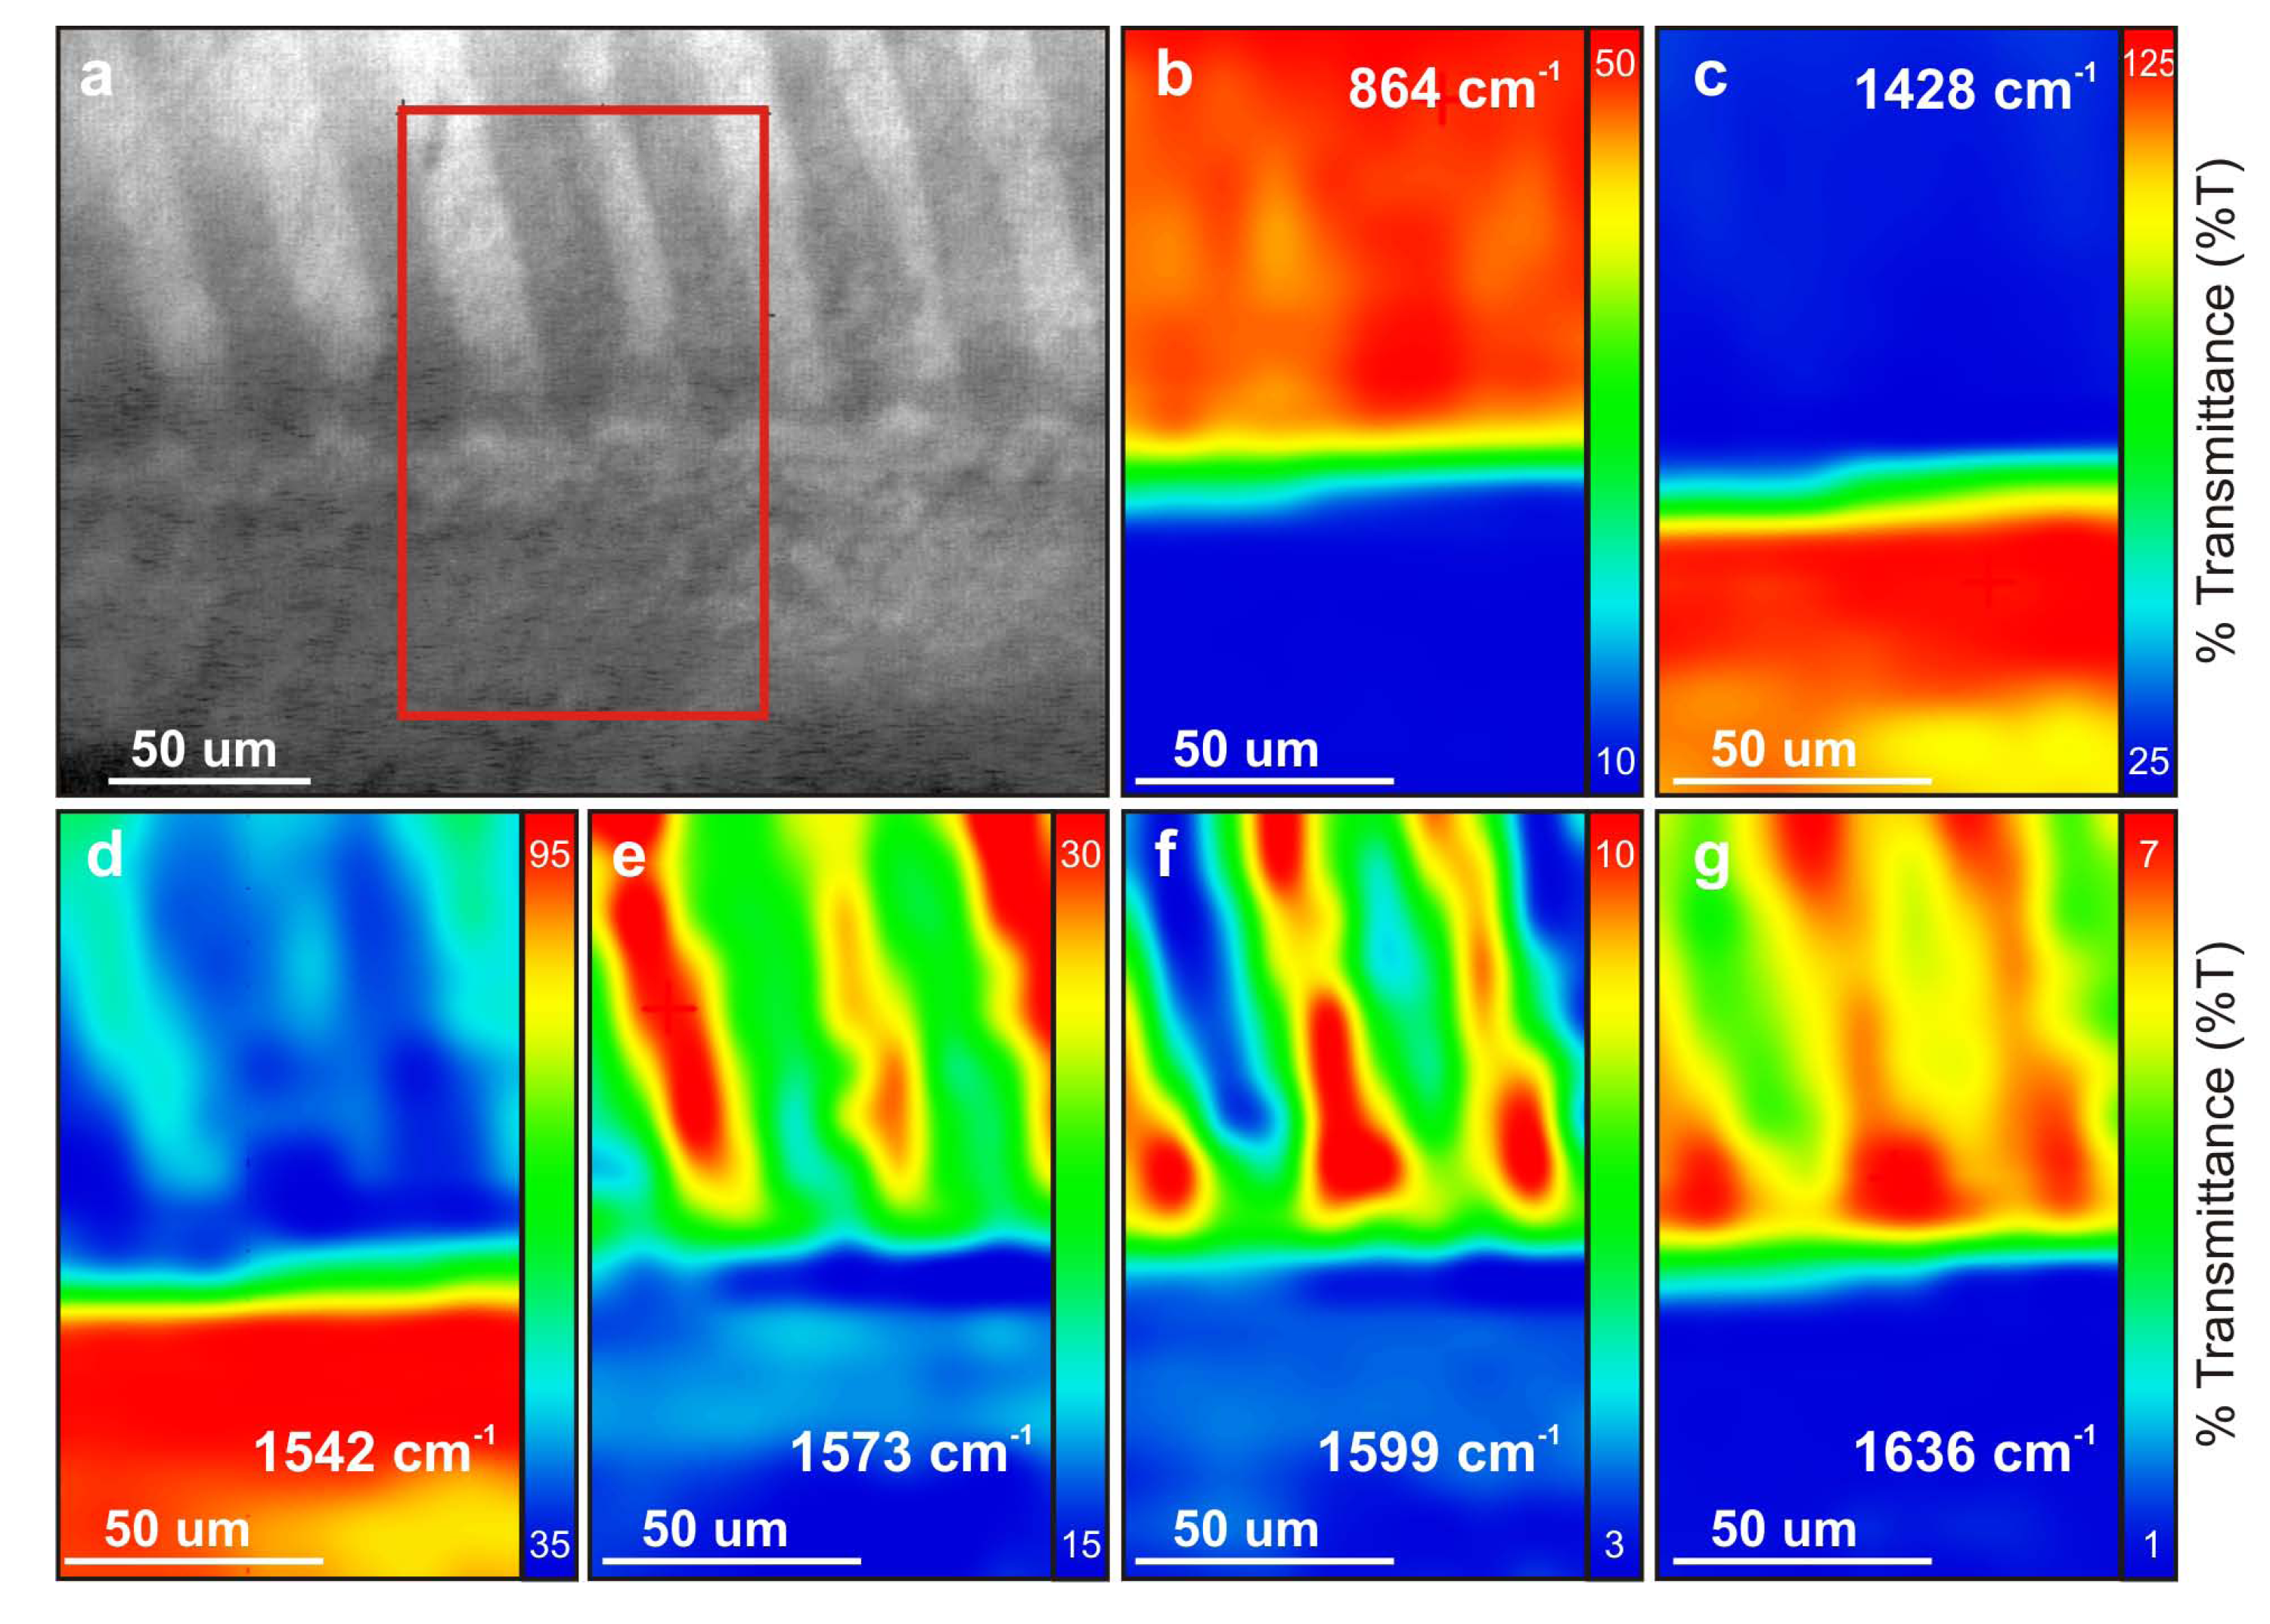
Figure 3.
FT-IR maps. (a) Localization of the 2D scan on a polished radial section, at the transition between the outer calcite prisms layer (bottom) and the inner aragonite crossed-lamellar (top); (b) IR map of the ν2 band of aragonite at 864 cm−1; (c) IR map of the ν3 band of calcite at 1,428 cm−1; (d) IR map of the amide II band at 1,542 cm−1 , which is enriched in calcite layer; (e) IR map of the amide II band at 1,573 cm−1, which is enriched in aragonite layer, one 1st order lamella on two; (f and g) IR maps of amide I bands at (f) 1,599 cm−1 and (g) 1,636 cm−1, both enriched in the same 1st order lamellae (each one of two), but anti-correlated to the distribution of map 3e.
FT-IR scan was performed at the limit between inner and outer layer (
Figure 3a). A band is found at 864 cm
−1 within the inner layer (
Figure 3b), which is compatible with the mean position of the
ν2 band in molluscan aragonite presenting low Sr content [
20,
21]. Map at 1,428 cm
−1 confirms that the outer layer is calcitic (
Figure 3c). To note, the lowered intensities recorded at the shift from calcite to aragonite reflect a mixed signal (most probably caused by the tilt of this boundary, combined with the unknown depth of IR response).
A response for N-containing organic compounds is also recorded within the range for amide I (1,597–1,695 cm
−1) and amide II (1,515–1,580 cm
−1) bands. In particular, map at 1,542 cm
−1 shows that calcite layer is richer than aragonite layer in amide II bands (
Figure 3d), whereas maps at 1,599 and 1,636 cm
−1 (
Figure 3f,g) show that amide I bands are richer in aragonite layer: those results confirm a shift of organic composition, simultaneously to the calcite/aragonite transition.
Most interesting feature is observed within aragonite layer, where an alternate distribution of several organic bands (at 1,573, 1,599 and 1,636 cm
−1) exactly match inter-crossed orientation of 1st order lamellae (
Figure 3e–g). Band at 1,573 cm
−1 is within amide II range, and might be assigned to aspartic acid (COOH) [
22]; amide I vibrations between 1,640 and 1,620 cm
−1 are usually ascribed to
β-sheet conformation [
23,
24]. This alternate distribution of organic bands is seen one every two lamellae for those three wavenumbers, but is anti-correlated between amide I bands and the band at 1,573 cm
−1: the lamellae, the richer at 1,573 cm
−1 are also the poorer at 1,599 and 1,636 cm
−1, and vice versa.
2.1.4. Setting-up of Crossed-Lamellar Pattern
A closer look was given to the boundary between outer and inner layers, revealing a rather complex mechanism before the setting-up of a regular crossed-lamellar pattern. The calcite prisms are delimited by a seemingly continuous layer, which displays a strong autofluorescence signal under laser confocal microscope (
Figure 4c,d). The latter indicates that this layer is highly enriched in autofluorescent organic compounds, which probably form an organic mesh or membrane. As seen in thin section in PLM (
Figure 4b), this sheet appears rather slim.
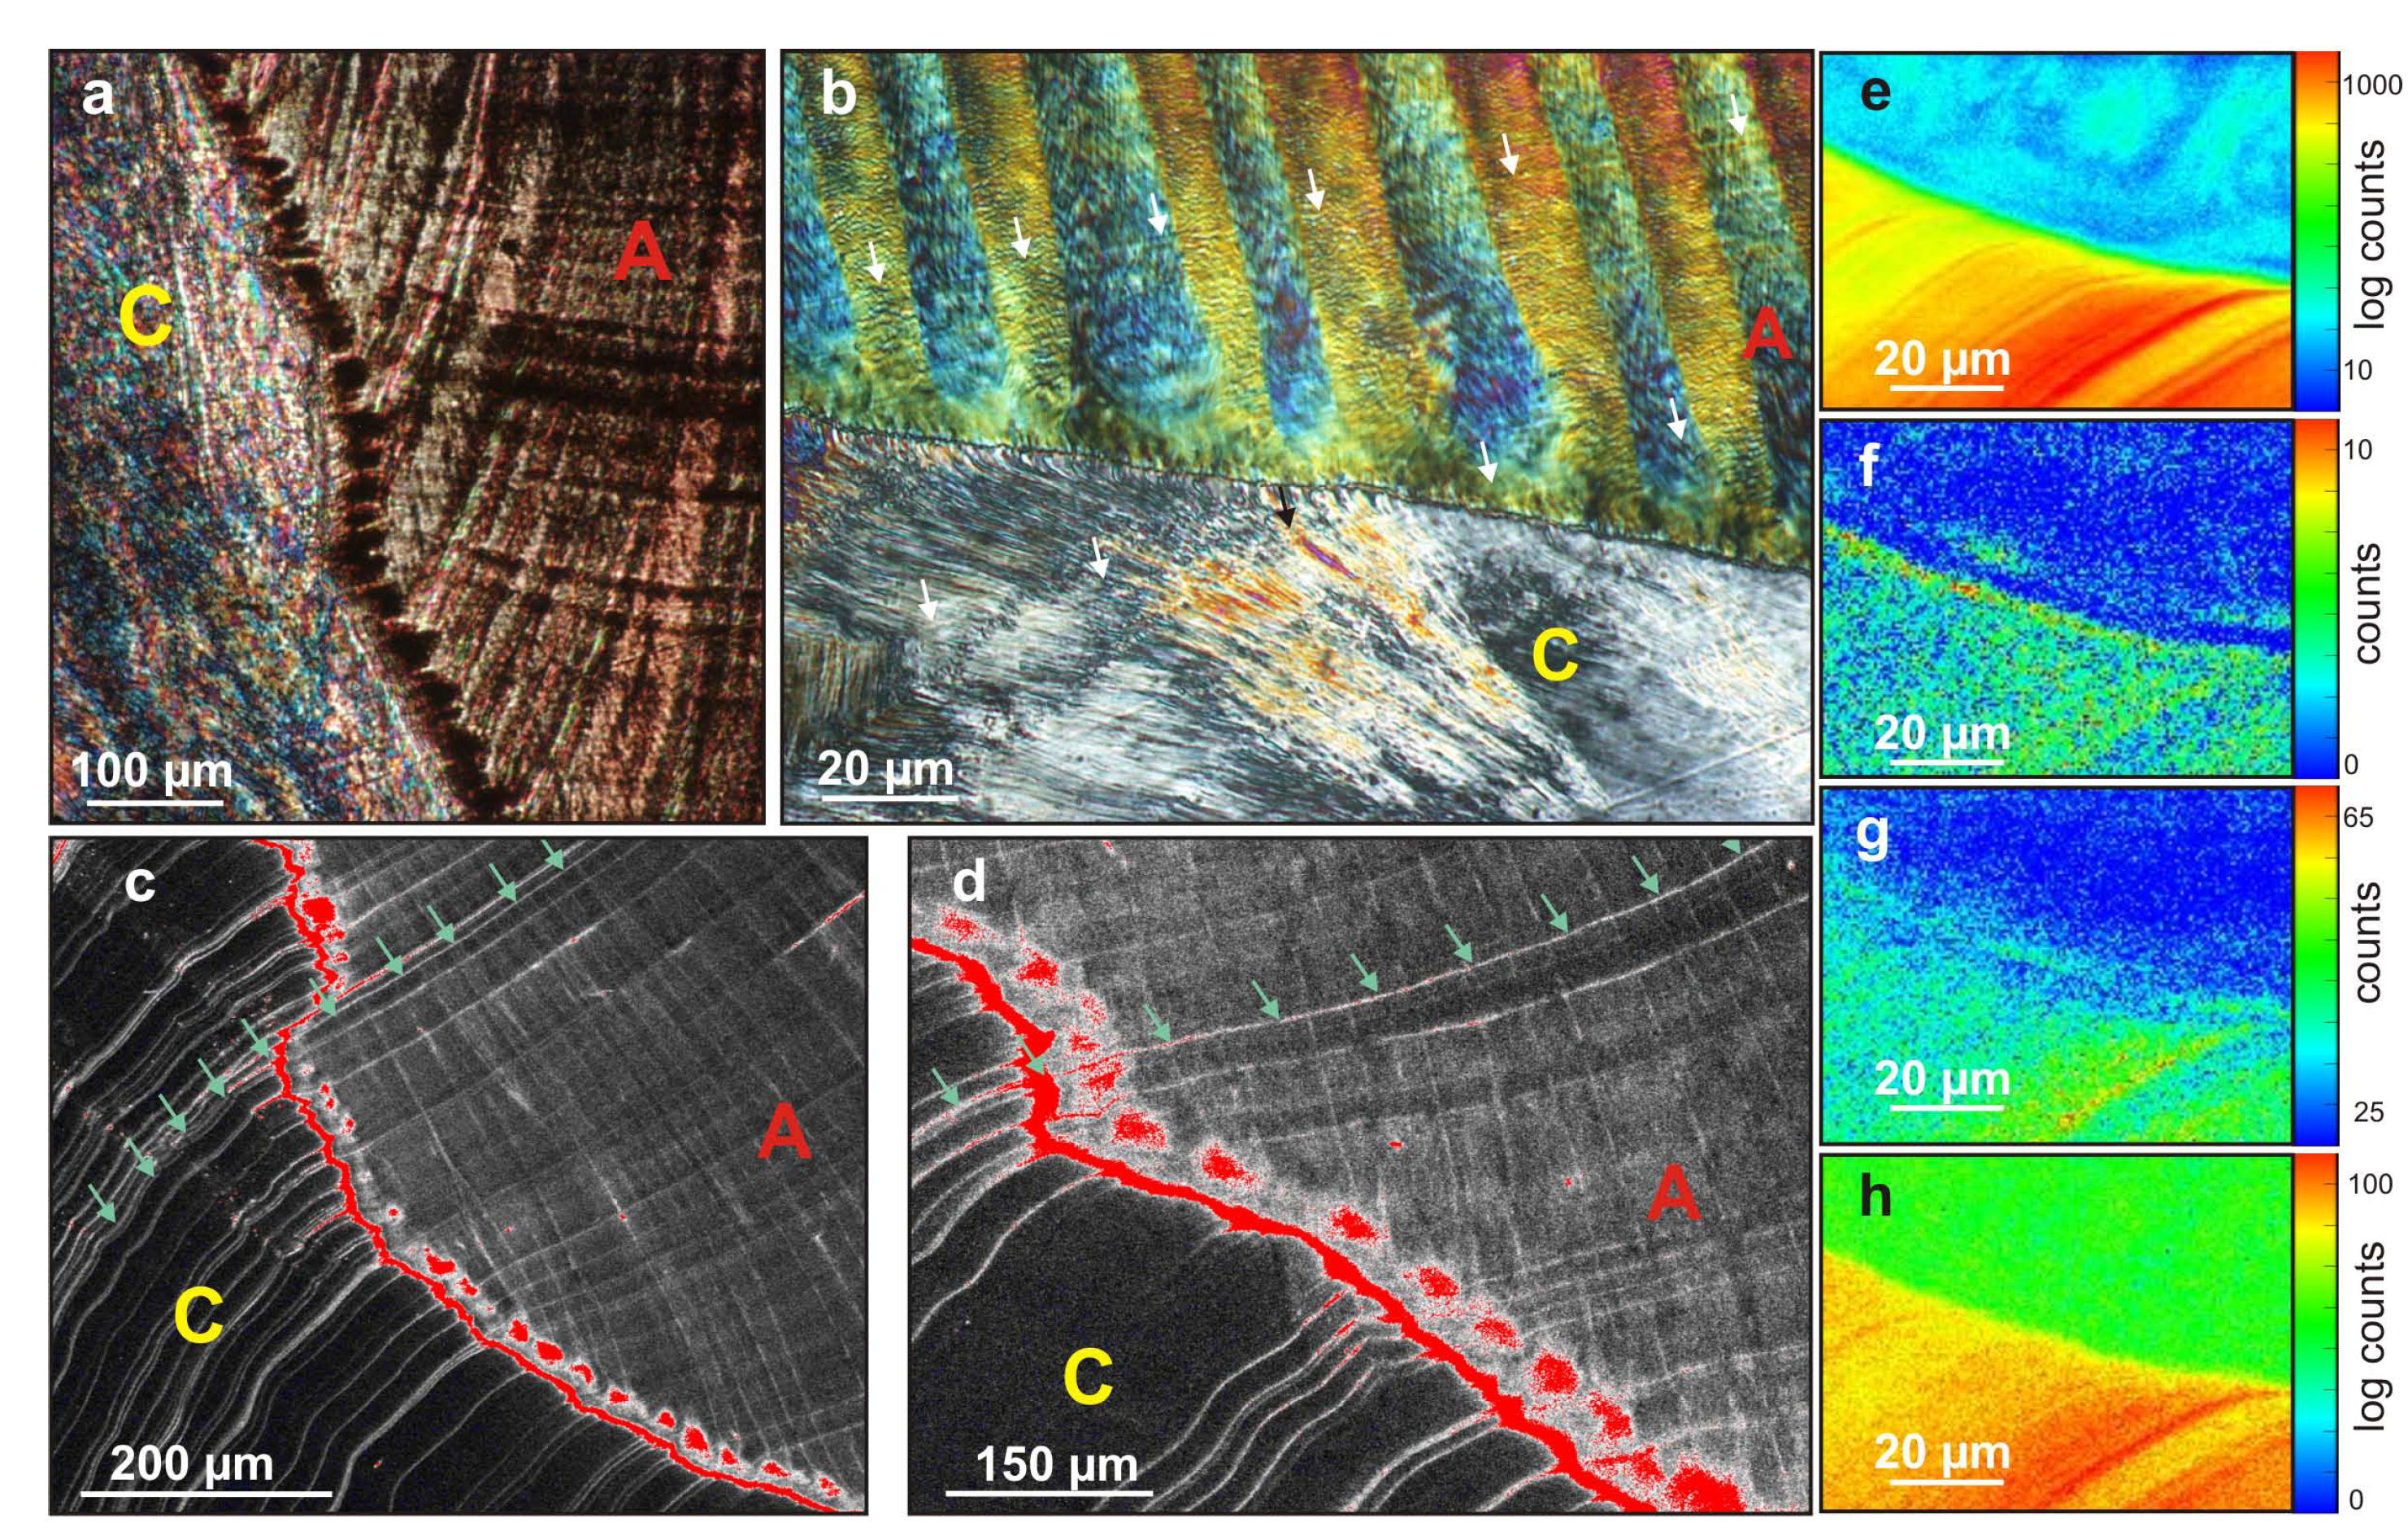
Figure 4.
Setting-up of crossed-lamellar pattern. (a) PLM view of a thick radial section of the outer lip of the shell. A brownish, always extinct contrast, corresponding to areas enriched in organics, marks the growth layering, the limits between 1st order lamellae and a punctuated line at the transition between the calcite (C) and aragonite (A) layer; (b) Higher magnification PLM view of a thin section (5–10 µm thick) of the transition between calcite prisms or fibers (C) and crossed-lamellar (A). Colors of polarization highlight the alternate orientation of 1st order lamellae, and 2nd/3rd order patterns can be distinguished. A very thin membrane can be seen at the transition from calcite to aragonite, followed by a layer of homogeneous greenish polarization color. Arrows mark growth layers; (c and d) Confocal laser microscopy image of the transition between the calcite (C) and aragonite (A) layers. A false color red LUT is used to highlight the high fluorescence contrast correlated to strong organic content; it reveals a continuous line, followed by a punctuated line at the transition. Green arrows mark a growth layer; (e–h) XRF maps of the intermediate area between inner calcite (bottom) and outer aragonite (top) layers; (e) S-polysaccharides map, performed at 2,482 eV; (f) Amino acids-linked S map, performed at 2,473 eV, showing a depleted content in the intermediate layer; (g) Sr map performed at 2,482 eV, showing a slightly enriched rim in the intermediate layer; (h) P map performed at 2,482 eV.
![Minerals 02 00085 g004]()
A dotted-pattern is also clearly visible under laser confocal microscope, and there seems to be a good correspondence between these “dots” richer in organics and the initiation of crossed-lamellar alternate orientation (
Figure 4d). These dots are also visible, as well as growth layering, on the thick section under PLM (
Figure 4a): they display a brownish, always extinct contrast, coherent with the presence of organic patches in these areas. This contrast is lost on the thinner section (
Figure 4b), but on the other hand the morphology of the very beginning of 1st order lamellae is nicely highlighted, and displays an ovoid configuration every one lamella over two.
In between the thin membrane marking the shift from calcite to aragonite and the beginning of inter-crossed 1st order lamellae, an intermediate area less than 10
µm thick is observed that does not display the sharp changes of crystallographic orientation so characteristic of crossed-lamellar layer in PLM (a continuous, greenish contrast is observed in
Figure 4b). The 1st order lamellae displaying an alternate orientation, exactly conserved every two 1st order lamellae (blue contrast in
Figure 4b), do only appear within the aragonite layer that is deposited just over this intermediate layer. The sheet-like arrangement (2nd order lamellae) of elongated 3rd order rods appears concurrently, and is afterward conserved through each growth increment of the shell, such as seen in
Figure 4b.
Some punctuated structures might be discerned on XANES maps of the intermediate area for organic sulfates (
Figure 4e), but are wanting for S-containing amino acids (
Figure 4f); those are likely to correspond to the dotted pattern highlighted in
Figure 4c,d that would therefore be faintly enriched in S-polysaccharides. The organic mesh over the calcite is not specifically enriched in S-polysaccharides (a thin, homogeneous rim of intermediate value between calcite and aragonite may still be visible), and might be faintly enriched in S-containing amino acids, which is hard to determine due to low count at 2,473 eV (
Figure 4f). However, the intermediate layer on top of it is indubitably poorer in S containing amino acids (
Figure 4f), it is slightly enriched in Sr compared to the aragonite crossed-lamellar layer (
Figure 4g) and already displays the same intensity for P as aragonite crossed-lamellar (
Figure 4h).
