Article

Pore Structure and Migration Ability of Deep Shale Reservoirs in the Southern Sichuan Basin

1
Shale Gas Research Institution, PetroChina Southwest Oil & Gasfield Company, Chengdu 610051, China
2
National Key Laboratory of Petroleum Resources and Engineering, China University of Petroleum (Beijing), Beijing 102249, China
3
Unconventional Petroleum Research Institute, China University of Petroleum (Beijing), Beijing 102249, China
*
Authors to whom correspondence should be addressed.
Minerals 2024, 14(1), 100; https://doi.org/10.3390/min14010100
Submission received: 12 October 2023 / Revised: 4 December 2023 / Accepted: 10 January 2024 / Published: 16 January 2024

Abstract

:
The migration phenomenon of deep shale gas is a subject that has yet to be fully comprehended, specifically regarding the migration ability of deep shale gas. This study focuses on the Longmaxi Formation in the southern Sichuan Basin, utilizing it as an example. Various experimental techniques, such as temperature-driven nitrogen and carbon dioxide adsorption, high-pressure mercury intrusion, XRD, and TOC analysis, are employed. The goal is to analyze the pore structure and fractal characteristics of the Longmaxi Formation shale. Additionally, the study aims to calculate its Knudsen number based on parameters like temperature gradient and pressure coefficient. The migration ability of the Longmaxi Formation shale in southern Sichuan Basin is also discussed. The results show the following: (1) The pore volume distribution of the Longmaxi Formation shale in the study area ranges from 0.0131 to 0.0364 cm3/g. Mesopores contribute approximately 56% of the pore volume, followed by micropores with a contribution rate of about 26%, and macropores contributing approximately 18%. Additionally, the Longmaxi Formation shale exhibits strong heterogeneity, with the fractal dimension (D1) of mesopores ranging from 2.452 to 2.8548, with an average of 2.6833, and the fractal dimension (D2) of macropores ranging from 2.9626 to 2.9786, averaging 2.9707. (2) The fractal dimensions of shale were significantly influenced by organic matter, inorganic minerals, and pore structure parameters. D1 and D2 were positively correlated with TOC, clay mineral content, and specific surface area, while exhibiting negative correlation with quartz. However, the correlations with calcite content, pore volume, and average pore size were not significant. (3) The proportion of pores satisfying Darcy flow in the Longmaxi Formation shale was approximately 3.7%–11.8%, with an average of 6.6%. Consequently, the migration capability of shale gas can be calculated using Darcy’s law. Furthermore, the migration capability of shale gas is controlled by D2, specifically the surface area, and the connectivity of macropores.

1. Introduction

Shale gas, an essential unconventional natural gas resource, has gained global prominence following the shale gas revolution in North America [1,2,3]. Continuous exploration and evaluation, spanning over a decade, have led to a steady increase in the production of marine shale gas in southern China. In 2022, China achieved a shale gas production milestone of 24 billion cubic meters [4]. Notably, the majority of this output is produced from the Upper Ordovician Wufeng Formation and the Lower Silurian Longmaxi Formation shale, situated at depths ranging from 2000 to 3500 m in the Sichuan Basin. This indicates the enormous exploration and development potential of shale gas in the Sichuan Basin [5,6]. With the development of exploration technology and theory, attention in China is gradually shifting towards deep shale gas, characterized by distinct occurrences and enrichment mechanisms compared to shallow shale gas [7,8,9]. Understanding the enrichment mechanism of deep shale gas is pivotal for effective exploration and development.
Regarding the deep shale gas enrichment mechanisms, previous researchers have proposed various models such as the binary enrichment theory [10], ternary enrichment theory [11], source-cap matching theory [12,13], and multi-factor coupled enrichment theory [14]. However, these models predominantly adopt static theories, with comparatively limited exploration into the migration and diffusion phenomena associated with shale gas.
In the context of the dynamic shale gas enrichment theory, previous studies have indicated that the migration and flow behavior of shale gas are significantly different from the conventional gas reservoirs. Notably, Darcy’s law inadequately explains the flow dynamics [15]. Additionally, the migration process involves the gradual flow of nanoscale pores into larger spaces, such as microfractures [16]. To understand this migration mechanism, previous researchers have proposed microscale transport models for shale gas based on flow-diffusion-desorption mechanisms [17]. Additionally, equations addressing gas flow in nanoscale pores based on Knudsen diffusion and slip flow have also been developed [18]. However, these models primarily consider small pore sizes, neglecting the contributions of macropores and fractures to shale gas migration. Recent studies have discovered five distinct migration types for shale gas in bedding fractures and matrix pores, namely Darcy flow, slip flow, Fickian diffusion, Knudsen diffusion, and adsorption–desorption diffusion [19,20,21]. These migration types significantly influence the enrichment level and determine favorable areas within shale gas reservoirs, exerting control over the direction and intensity of shale gas migration [20,21,22].
Previous studies have elucidated the direct influence of pore structure and fractal dimension on gas occurrence and permeability characteristics [23,24,25]. Pore structure parameters, including pore volume, specific surface area, pore size, and their distribution patterns, are of significant importance in studying the occurrence state, desorption diffusion, and permeability of shale gas [25,26,27,28,29]. Among these parameters, pore volume determines the migration space for shale gas, while pore size governs its migration mode and capacity [20,21,22]. In addition, the complexity of the pore system also affects the migration efficiency of shale gas. Fractal dimension is currently one of the most effective parameters for evaluating the complexity of shale pores. Extensive research by previous scholars has led to the development of various mesoporous fractal dimension models such as the BET model [30], the FFH model [31], and thermodynamic methods [32]. Additionally, the J-function model [33], the capillary bundle model [34], the thermodynamic model [35], and the Menger model [36] have been employed to calculate the fractal dimension of macropores. These models facilitate the exploration of the intricate relationship between pore complexity and shale gas permeability.
Therefore, it is of great significance to achieve a quantitative and heterogeneous characterization of pore structure in shale reservoirs to understand the migration capacity of shale gas. In this study, TOC testing, XRD analysis, low-temperature nitrogen adsorption, low-temperature CO2 adsorption, and high-pressure mercury experiments are employed to analyze the pore structure and fractal dimension characteristics of deep shale gas in southern Sichuan Basin. The objective is to gain insights into the migration capacity of deep shale gas reservoirs.

2. Geologic Background

The Sichuan Basin, located in Southwestern China, stands as one of the largest basins in the region, sprawling across an expansive 2.6 million square kilometers. Nestled in the western part of the Yangtze Plate, this basin exhibits an east–west elongated configuration, encircled by the Qinghai-Tibet Plateau and the Western Sichuan Plateau to the north and northeast, while bordering the Yunnan-Guizhou Plateau to the south and southwest [9,37]. Over time, the Sichuan Basin has evolved through multiple tectonic phases and sedimentary processes [38,39,40,41]. It comprises two principal components: the Sichuan Basin Foreland Structural Belt and the Sichuan Basin Inland Structural Belt. The Sichuan Basin Foreland Structural Belt, located in the northern and northeastern parts of the basin, serves as the marginal tectonic belt of the Qinghai-Tibet Plateau and the Western Sichuan Plateau. This tectonic belt has undergone complex structural deformations, resulting in the formation of numerous mountain ranges and fault zones [38,39]. In contrast, the Sichuan Basin Inland Structural Belt, located in the central and southern parts of the basin, is mainly composed of fault zones and fold belts, making it the primary region for crustal deformation in the central basin [40,41].
The southern Sichuan region, located on the northwest side of the Yangtze Platform, encompasses the steeply folded Chuanan area of the Huaying Mountain fold belt and the gently structured southwestern Sichuan area. Encompassing an area of approximately 22,000 square kilometers [42,43], this region is abundant in shale gas resources and hosts five prominent shale gas production bases in Fuling, Changning, Weiyuan, Zhaotong, and Weirong. The Longmaxi Formation shale gas reservoir in the study area is one of the main gas reservoirs and a key contributor to deep shale gas production in China. The study area is composed of four blocks: the Weiyuan Block, the Yuxi Block, the Luzhou Block, and the Changning Block (Figure 1). The sediment thickness of the Longmaxi Formation in the study area ranges from 200 to 500 m and is further categorized into the Longyi Member and the Long’er Member from top to bottom. The Longyi Member is further subdivided into the Longyi Member 1 sub-member and the Longyi Member 2 sub-member, with a total of four sub-layers in the Longyi Member 1 sub-member, which serves as the primary production layer.

3. Samples and Methods

3.1. Samples

To investigate the pore structure and migration ability of the deep Longmaxi Formation shale reservoir, we collected 16 shale core samples from the southern part of Sichuan. This collection comprised 3 samples each from the Weiyuan and Yuxi blocks, 4 samples from the Changning block, and 6 samples from the Luzhou block. The depths of these core samples ranged from 2349.5 m to 4926.8 m. They were systematically numbered and labeled according to the blocks they belong to, with corresponding depths provided in the Table A1. Additionally, we divided these samples into two parts. The first part underwent grinding and sieving to obtain 80–mesh and 200–mesh samples. The 80–mesh samples were used for TOC determination, while the 200–mesh samples were used for XRD, low-temperature N2 adsorption, and low-temperature CO2 adsorption. The second part of the samples were transformed into cylinders with a diameter of 2.5 cm and a height of 5 cm. These cylindrical samples were used for high-pressure mercury injection experiments and permeability measurements, as shown in Figure 2.

3.2. Methods

3.2.1. Experimental Testing

TOC tests were conducted at the laboratory affiliated with the Southwest Oil and Gas Field Company of PetroChina (Chengdu, China). The testing instrument used was the LECO-CS230 Carbon Sulfur Analyzer. Prior to the experiments, the samples were soaked in dilute hydrochloric acid (HCl) to remove inorganic carbon. Then, the samples were washed with distilled water and dried. The testing was carried out using the dried samples at a temperature of 25 °C and a humidity level of 57%.
XRD experiments were conducted at the Unconventional Petroleum Research Institute, China University of Petroleum (Beijing). The testing instrument used was the X’Pert Powder X-ray diffractometer. Prior to the experiments, the samples were crushed to a 200–mesh size and dried. The dried samples were then pressed onto glass slides, and mineral composition was determined through sample scanning. Additionally, the instrument used Cu radiation, with a voltage of 40 kV and a current of 40 mA. The scanning speed of the instrument was 2°/min, with a scanning step size of 0.02°.
High-pressure mercury intrusion, low-temperature nitrogen adsorption, and CO2 adsorption experiments were conducted at the Key Laboratory of Unconventional Oil and Gas, China Petroleum Group. Low-temperature N2 adsorption and CO2 adsorption were performed using the Autosorb-IQ3 surface area and pore size analyzer produced by Quantachrome, Boynton Beach, FL, USA. Prior to the tests, the samples were crushed, dried at 105 °C for 8 h, and vacuum degassed for 18 h. Low-temperature N2 adsorption was conducted at 77 K, and low-pressure CO2 adsorption was performed at 273 K. The specific surface area was calculated using the BET model, and the pore volume was calculated using the BJH model for low-temperature N2 adsorption. High-pressure mercury intrusion was performed using the Pore Master 60 GT fully automated mercury intrusion porosimeter from Quantachrome, USA. The maximum working pressure was 60,000 PSI, and the pore size measurement range was 0.03 to 1000 µm, with an accuracy of mercury intrusion volume measurement at 0.1 cm3.
Permeability measurements were carried out at Beijing Yanbo Times Co., Ltd. (Beijing, China), using the PoroPDP-200 pressure decay porosity permeability measurement instrument from Petrolab Company (Albany, NY, USA). The instrument’s testing range extended from 0.00001 to 10 mD. In this study, the permeability of shale samples was measured using the non-steady-state method (pressure pulse decay method). It is worth noting that the sample permeability measurements were fully automated, with a testing error below 0.5%.

3.2.2. Fractal Theory

The fractal dimension of shale pores can be calculated for micropores, mesopores, and macropores. As shale predominantly occurs in micropores in the form of free gas, our study focused on calculating the fractal dimensions for mesopores and macropores. Various models exist for calculating the fractal dimension of mesopores, including the BET model [30], the FFH model [31], and thermodynamic methods [32]. Among these, the FFH model is the most widely adopted, offering two algorithms—one is based on the van der Waals force mechanism and the other on the capillary condensation mechanism [44]. Previous research [44] suggests that the capillary condensation mechanism is more suitable for studying the heterogeneity of porous media. Therefore, in this study, this method was adopted to calculate the fractal dimension of the gas adsorption part, and the calculation formula is as follows:
ln V = C + D 3 ln ln P / P 0
In this equation, V represents the gas adsorption amount (cm3/g), P represents the equilibrium pressure of the system (MPa), P0 represents the saturation vapor pressure of the gas (MPa), C is a constant (dimensionless), and D is the fractal dimension (dimensionless). In the scatter plot of lnV − ln(P/P0), the slope K of the double logarithmic curve corresponds to D − 3 in Equation (1), allowing the calculation of the fractal dimension of mesopores based on D = K + 3.
The current models for calculating the fractal dimension of macropores are the J-function model [33], the capillary bundle model [34], the thermodynamic model [35] and the Menger model [36]. After comparing previous research, it was found that the fractal dimension of the capillary bundle model has a better correlation with the physical properties of the reservoir and pore structure parameters, making it widely used by scholars [34,45,46,47]. The methods of calculating fractal dimension according to the capillary bundle model are based on water saturation and mercury saturation [47], but the capillary bundle calculation model based on water saturation is most widely used, expressed as follows:
lg 1 S H g = D 3 lg P c D 3 P min
In the equation, SHg represents the volume fraction of mercury entering the pore (%), Pc represents the capillary pressure (MPa), and Pmin represents the capillary pressure corresponding to the maximum throat radius (MPa). In the scatter plot of lg(1 − SHg) − lgPc, the slope K of the double logarithmic curve corresponds to D − 3 in Equation (2), facilitating the calculation of the fractal dimension of macropores based on D = 3 + K.

3.2.3. Shale Gas Transport Capacity

The ability of shale gas migration can be determined by calculating the Knudsen number (Kn). Gas migration types are categorized as follows: when Kn < 0.001, the gas migration type is Darcy flow; when 0.001 < Kn < 0.01, the gas migration type is slippage flow; when 0.01 < Kn < 1, the gas migration type is Fick diffusion; when Kn > 1, the gas migration type is Knudsen diffusion; and when the pore size is smaller than or equal to twice the thickness of the adsorption layer plus the exclusion layer thickness, the gas migration form is adsorbed gas diffusion. The formula for calculating Kn can be obtained by referring to reference [20]. Since the migration ability of Darcy flow is 100 times that of slip flow and 10,000 to 1,000,000 times that of Fickian diffusion [20,21], we consider that if more than 1% of the pore volume in the samples satisfies Darcy flow, it can be approximately considered as satisfying Darcy’s law.

4. Results

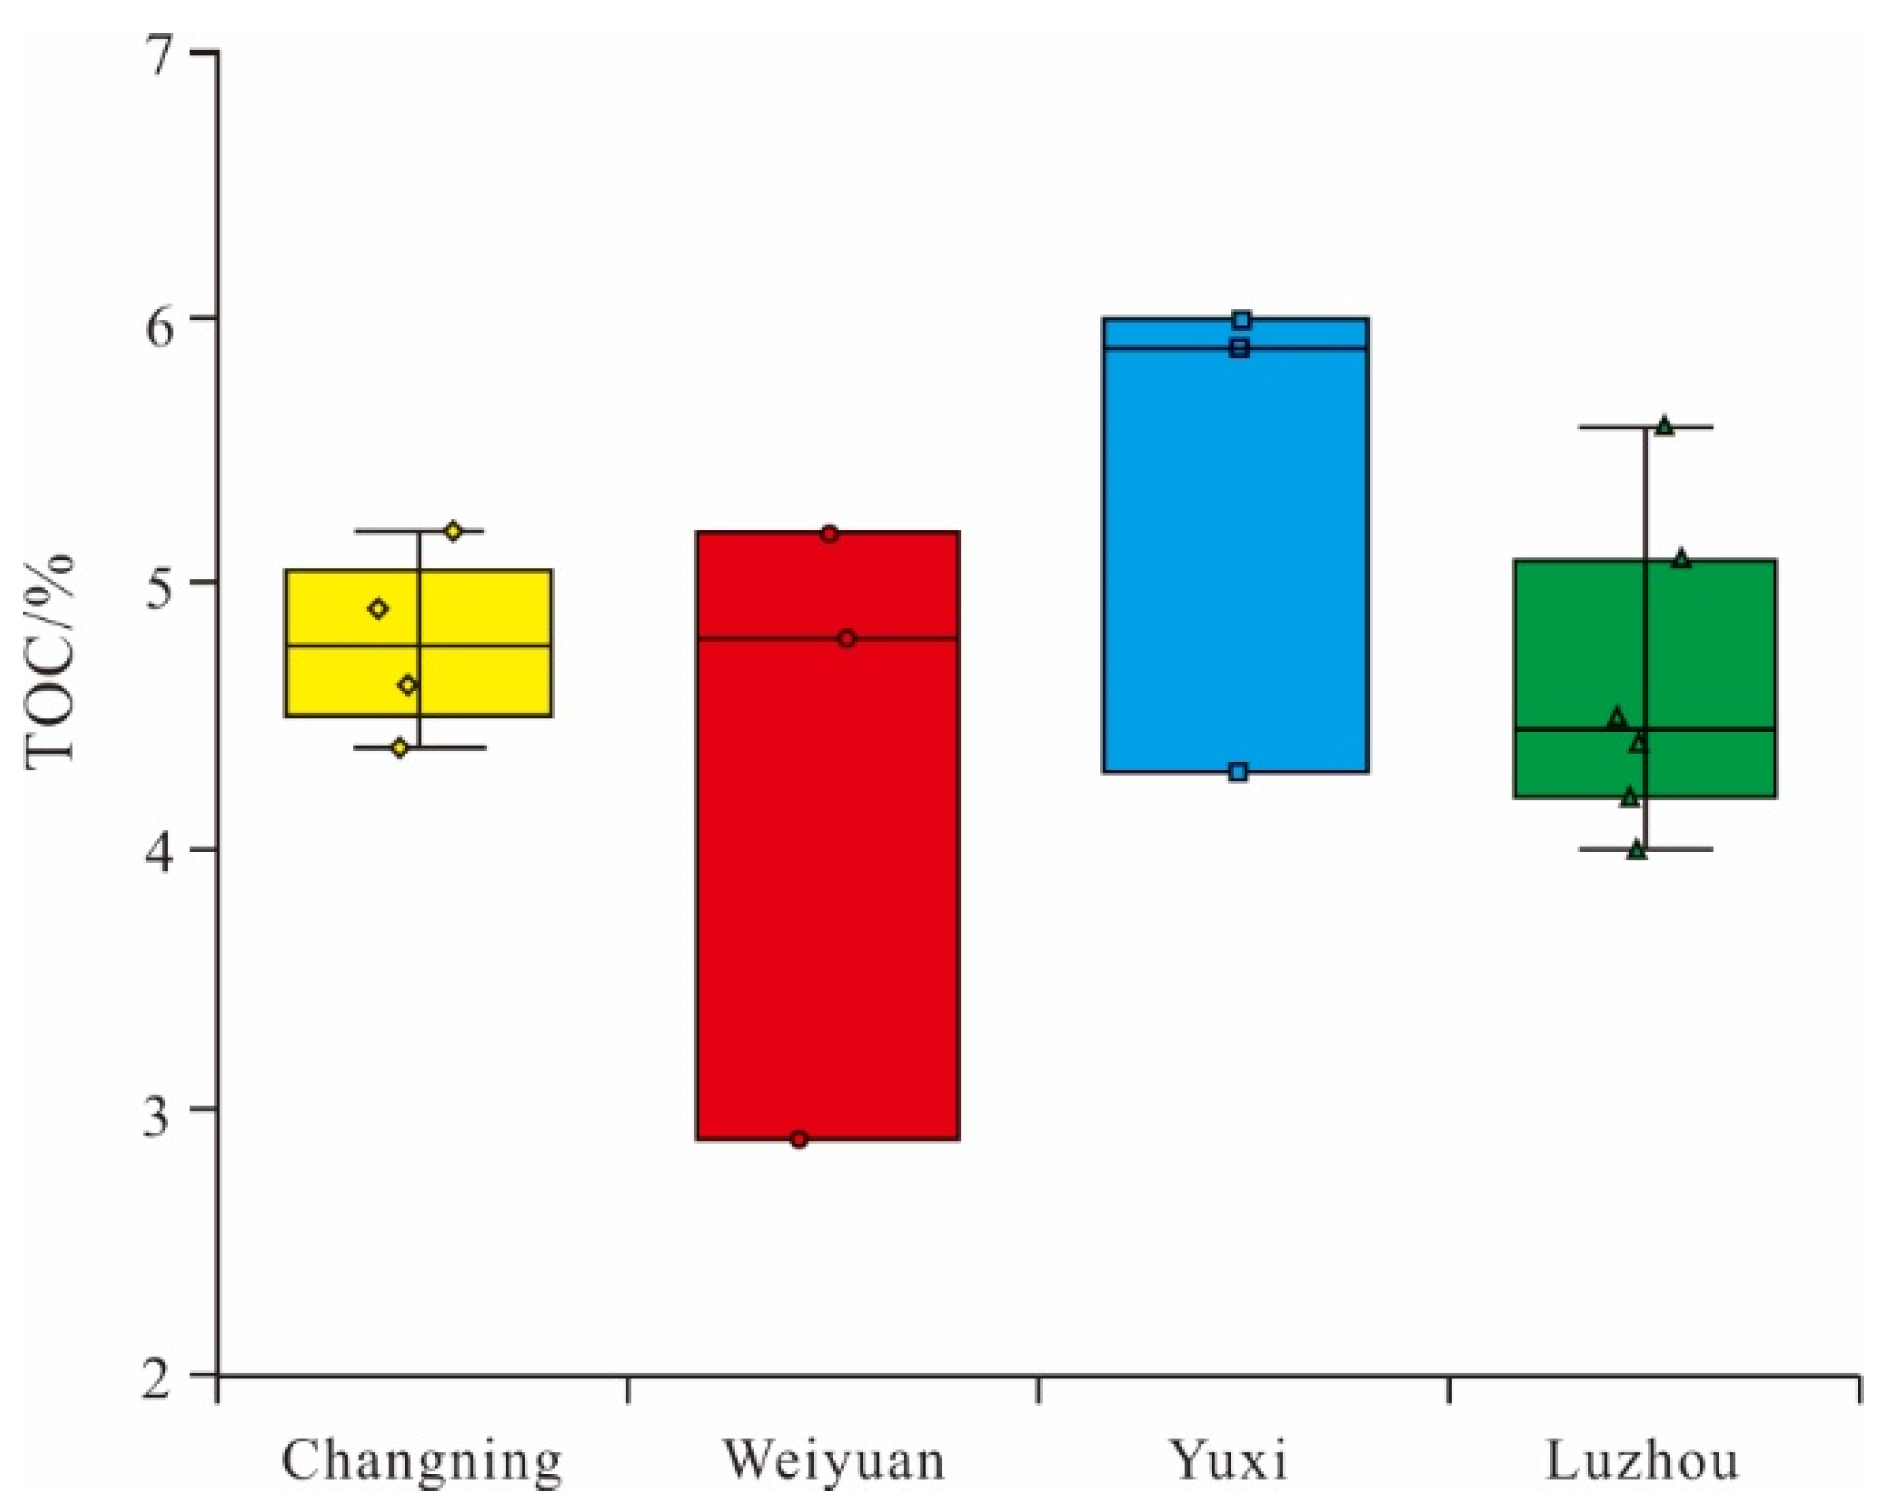
4.1. Total Organic Carbon
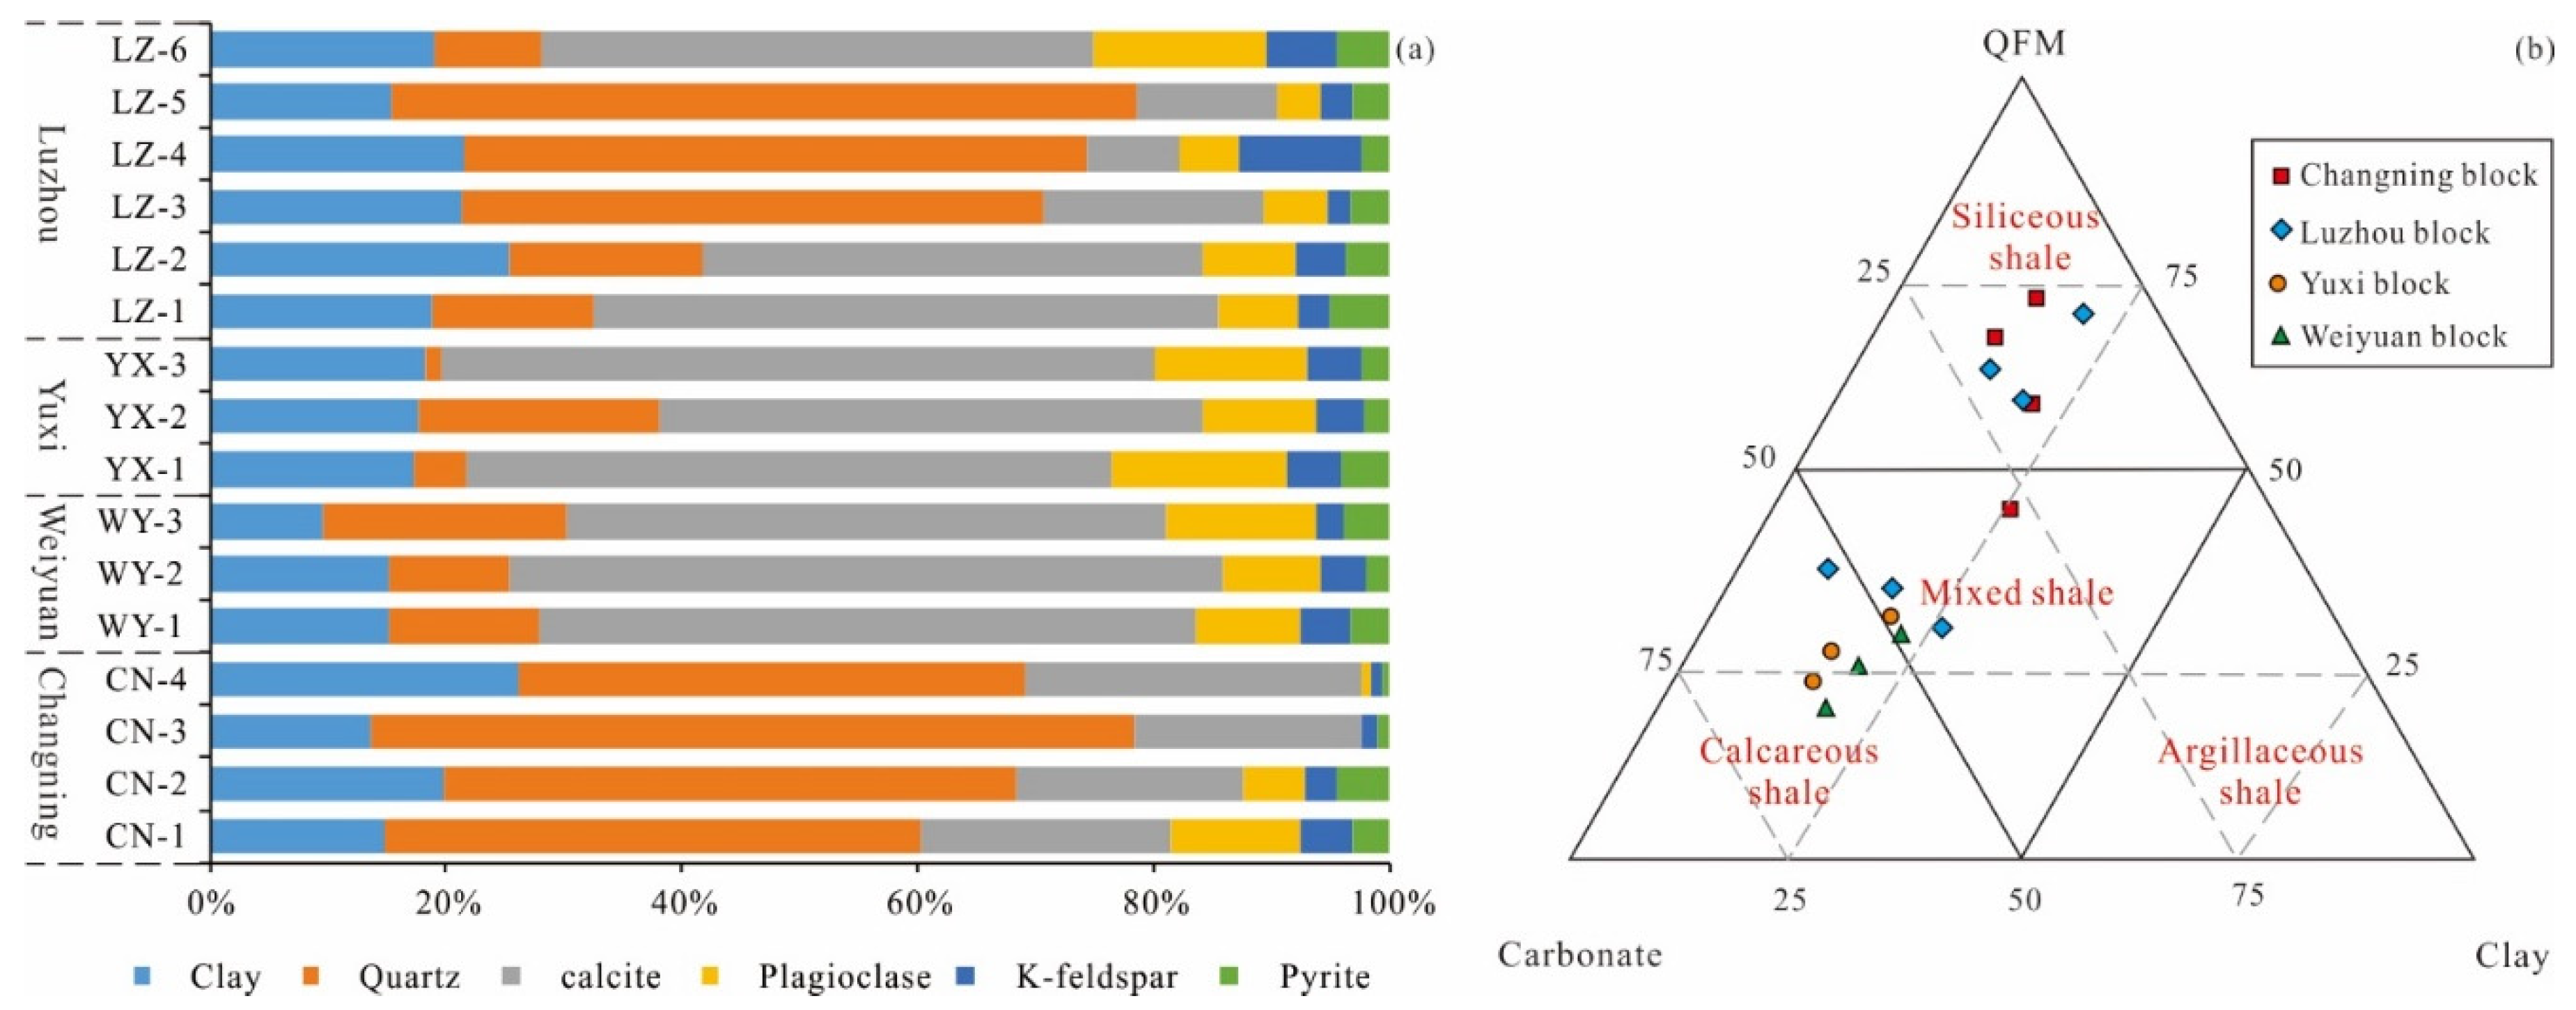
This study analyzed the TOC across 16 samples in the study area, as shown in Figure 2. Based on Figure 3, the TOC content of Longmaxi Formation shale in the study area ranges from 2.9% to 6%, with an average value of 4.75%. The highest TOC content was found in the Yuxi block of the Yuxi Formation shale, with an average value of 5.4%, followed by the Changning block (average value of 4.78%) and the Luzhou block (average value of 4.63%). The Weiyuan block has the lowest TOC content in the Longmaxi Formation shale, with an average value of 4.3%.

4.2. Mineralogy

The mineral composition of the Longmaxi Formation shale in the study area was analyzed, and the results are presented in Figure 4. According to Figure 4a, the diagenetic minerals of Longmaxi Formation shale include clay, quartz, calcite, plagioclase, K-feldspar, and pyrite. Calcite has the highest content, with an average value of 37.21%, followed by quartz (average content of 29.69%), clay minerals (average content of 18.09%), plagioclase (average content of 7.98%), K-feldspar (average content of 3.93%), and pyrite (average content of 3.07%). However, there are significant differences in the mineral composition of Longmaxi Formation shale among different blocks. The quartz content in the Changning block shale is significantly higher than that of clay and calcite, while calcite content is highest in the Weiyuan and Yuxi blocks. In the Luzhou block, shale with the highest quartz content and shale with the highest calcite content are equally distributed. Additionally, the mineral composition of shale plays a crucial role in determining the reservoir alteration difficulty, often represented by the brittleness index. This index is determined by the proportion of brittle minerals in the shale [48]. The brittleness index of Longmaxi Formation shale in the study area ranges from 21.23 to 72.7, with an average value of 44.53. The highest brittleness index was recorded in the Changning block Longmaxi Formation shale (59.29), while the lowest brittleness index was observed in the Yuxi block Longmaxi Formation shale, with a value of 28.49.
In addition, mineral composition is also an important means to determine the shale lithofacies, which holds significant implications for analyzing sedimentary environments, among other aspects. The lithofacies composition of Longmaxi Formation shale was analyzed using a mineral ternary diagram (Figure 4b) [49]. The results show that the main lithofacies of Longmaxi Formation shale in the study area are siliceous shale, calcareous shale, and mixed shale. Specifically, the Changning block is mainly composed of siliceous shale and mixed shale, while the Weiyuan and Yuxi blocks are mainly composed of calcareous shale and mixed shale. In the Luzhou block, the Longmaxi Formation shale exhibits a combination of siliceous shale, calcareous shale, and mixed shale.

4.3. Full Aperture Characterization

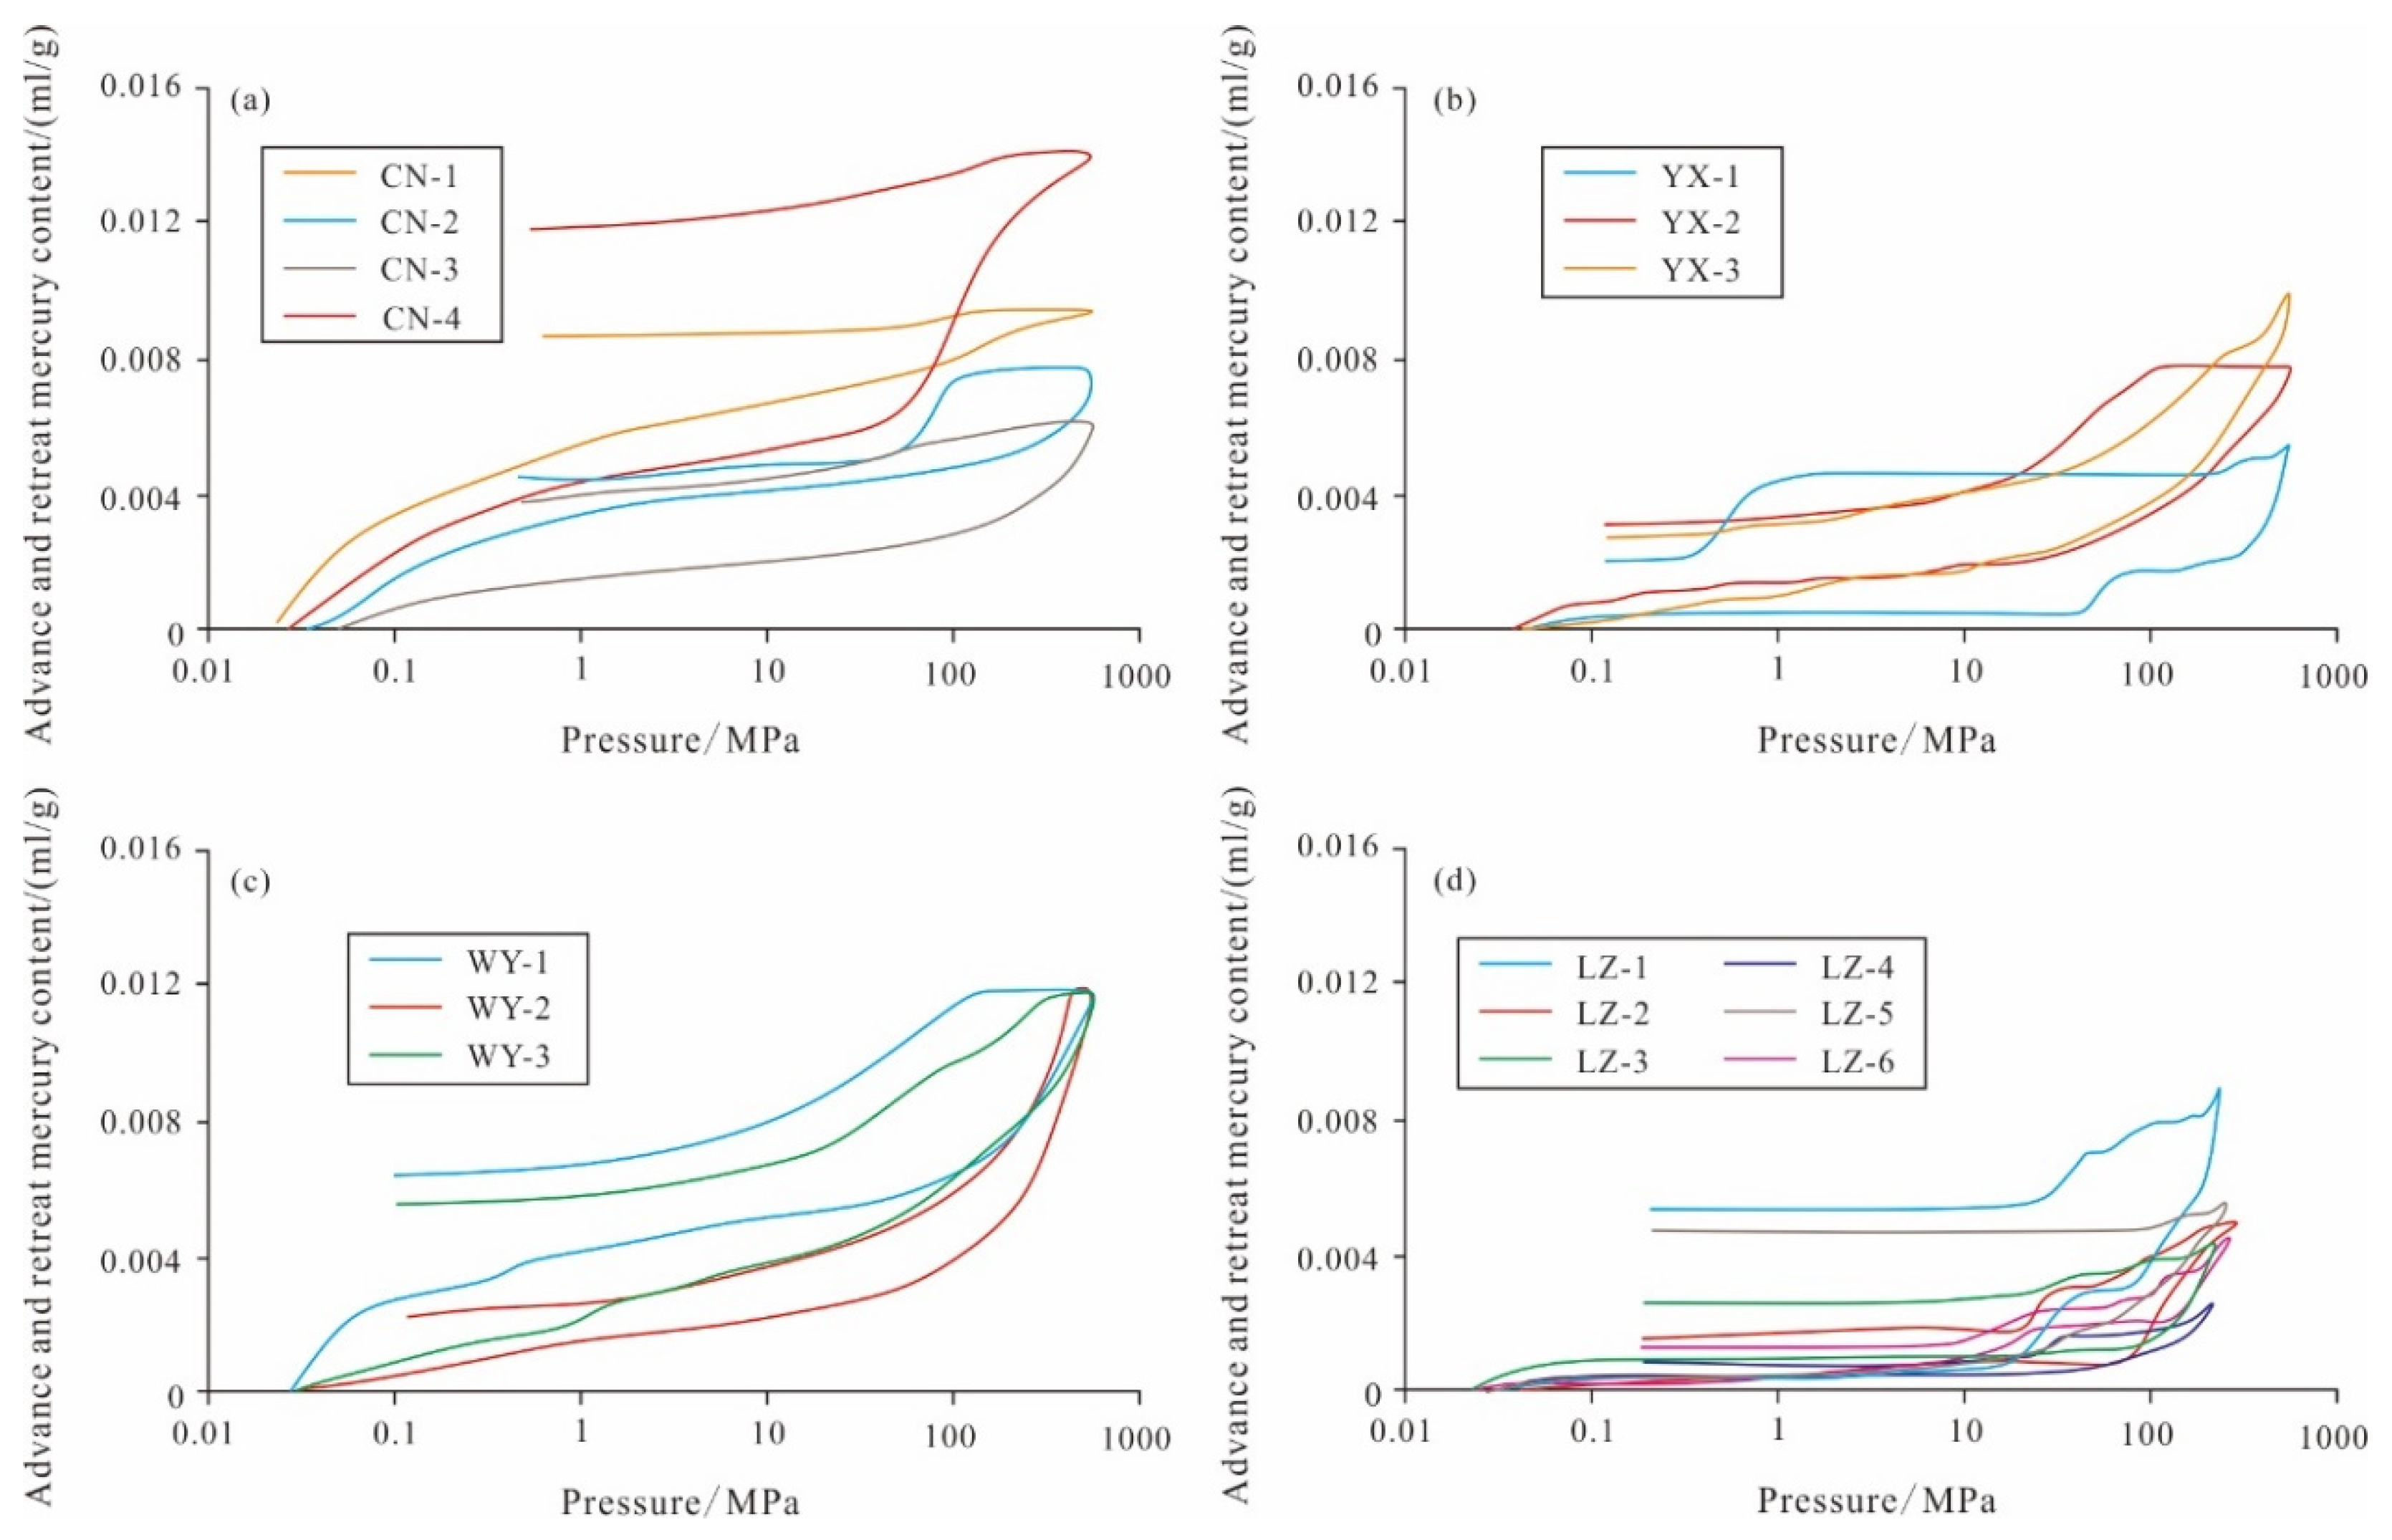
4.3.1. High-Pressure Mercury Injection

High-pressure mercury intrusion is an important method for analyzing the macroscopic pores in shale. In this study, the distribution characteristics of macroscopic pores in the Longmaxi Formation shale were analyzed using high-pressure mercury intrusion experiments. Figure 5 shows the mercury intrusion and extrusion curves of the Longmaxi Formation shale in the study area. According to Figure 5, the mercury intrusion volume of the Longmaxi Formation shale ranges from 0 to 0.016 cm3/g. Notably, the mercury intrusion volume in the Changning block (Figure 5a) and the Weiyuan block (Figure 5c) is higher than that in the Yuxi (Figure 5b) and Luzhou blocks (Figure 5d), indicating a higher macroscopic pore content in the Changning and Weiyuan blocks compared to the Yuxi and Luzhou blocks. Additionally, the mercury intrusion and extrusion curves of CN-1 and LZ-5 are similar, indicating poor connectivity of macroscopic pores in these samples.
Based on the Washburn equation, the pore diameters corresponding to each pressure point and their corresponding mercury intrusion volumes were calculated. This intrusion volume represents the pore volume corresponding to the pore diameter, providing the pore size distribution of the Longmaxi Formation shale in the study area (Figure 6). According to Figure 5, the pore volume of the Longmaxi Formation shale in the study area is mainly distributed between 1–100 nm. For pores larger than 100 nm, the pore volume in the Changning block (Figure 6a) is slightly higher than that in the Yuxi block (Figure 6b). However, the Weiyuan block has the highest proportion of pore volume larger than 100 nm in the Longmaxi Formation shale (Figure 6c), while the Luzhou block has the lowest pore volume larger than 100 nm (Figure 6d). This observation may be related to the deeper burial of the Longmaxi Formation shale in the Luzhou block.

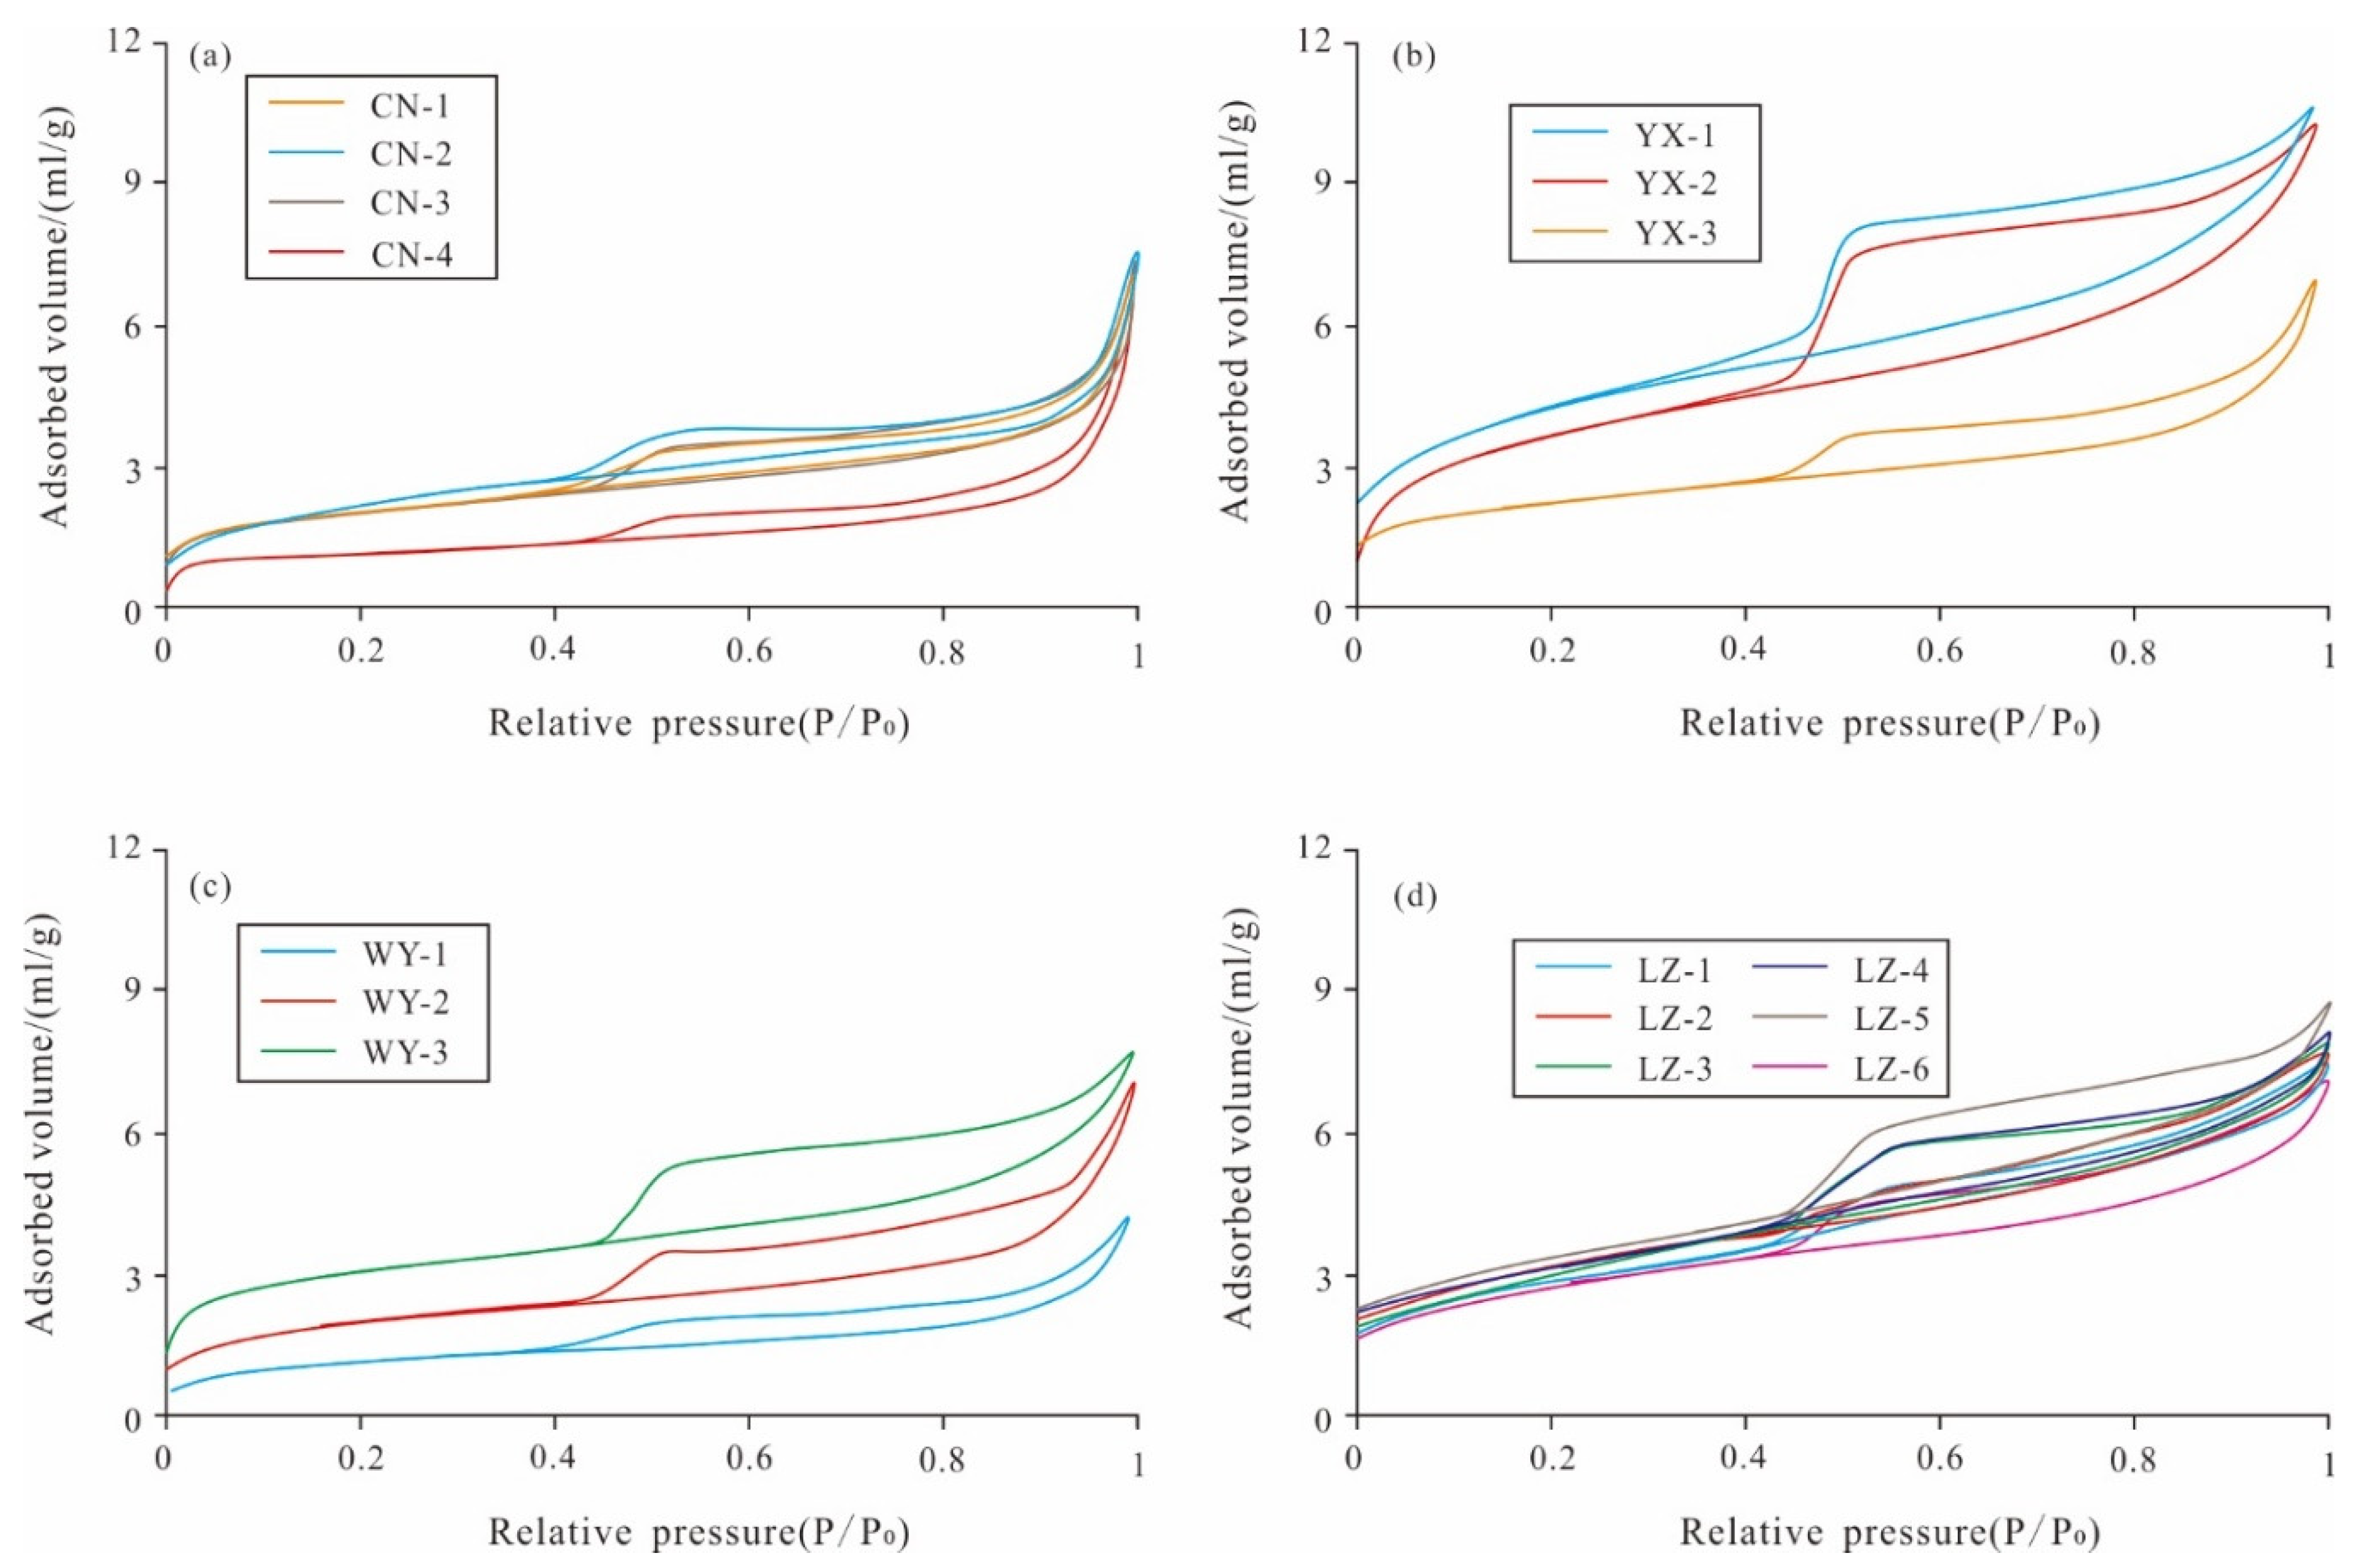
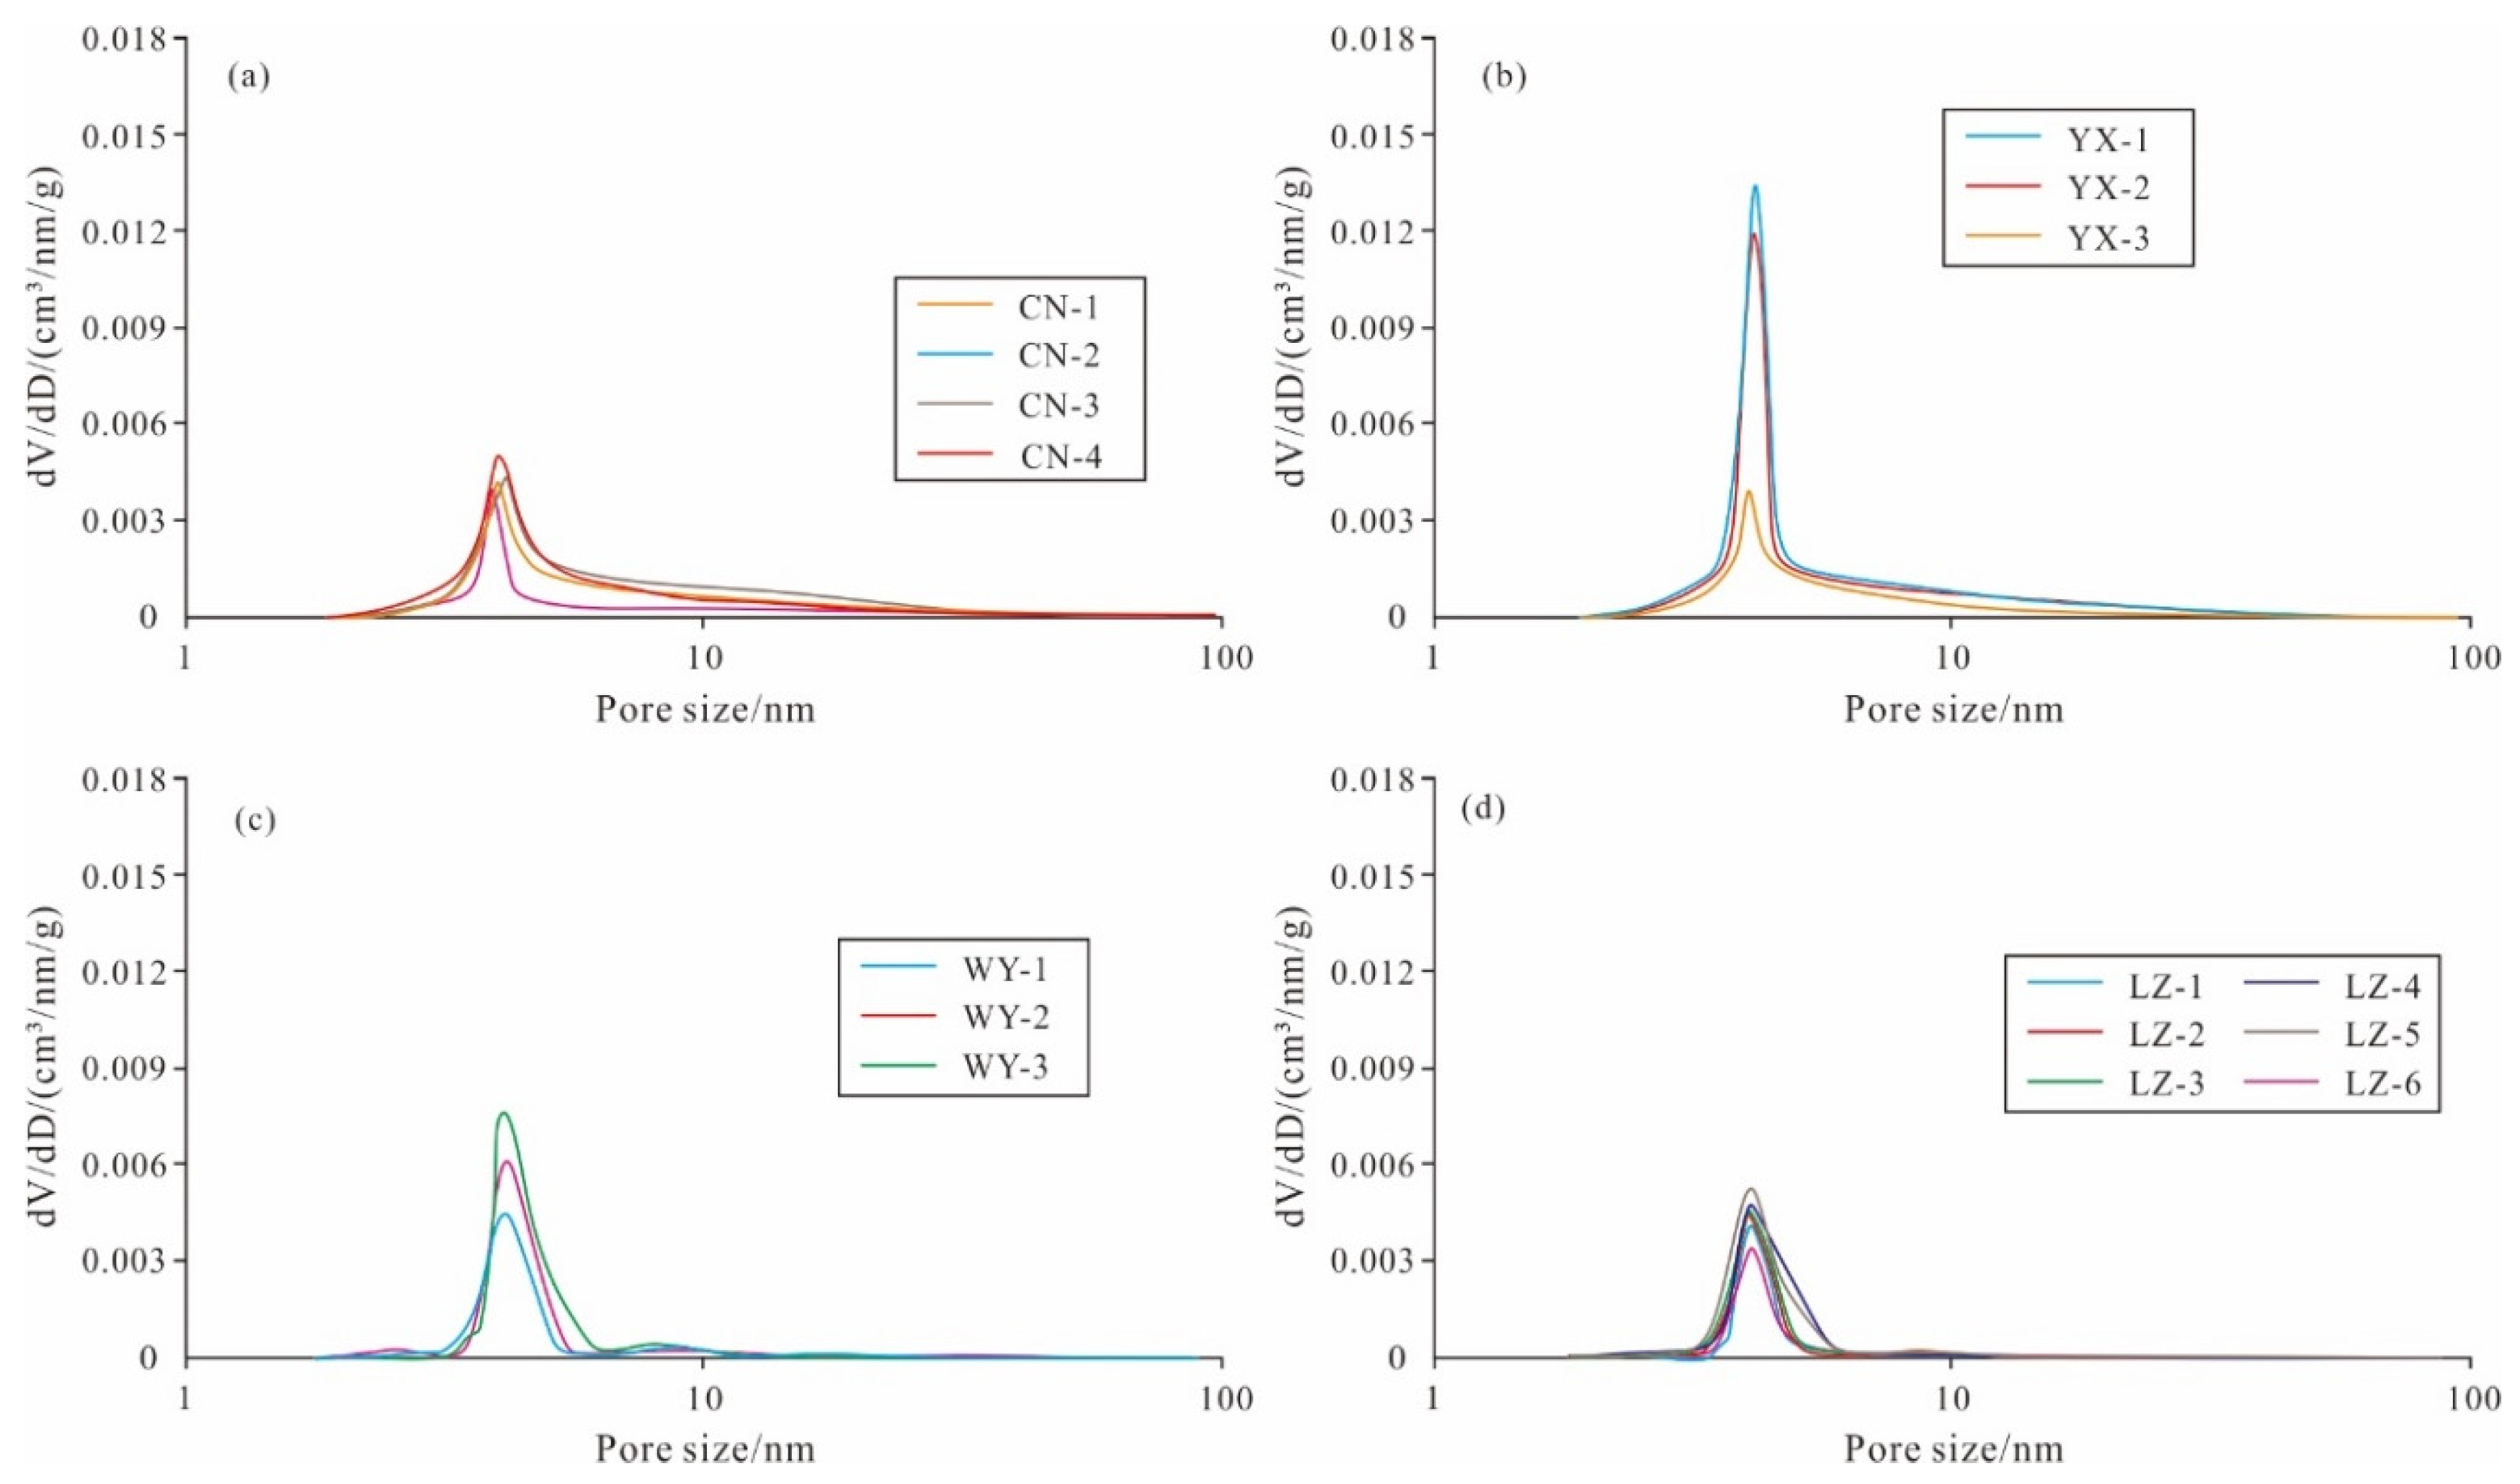
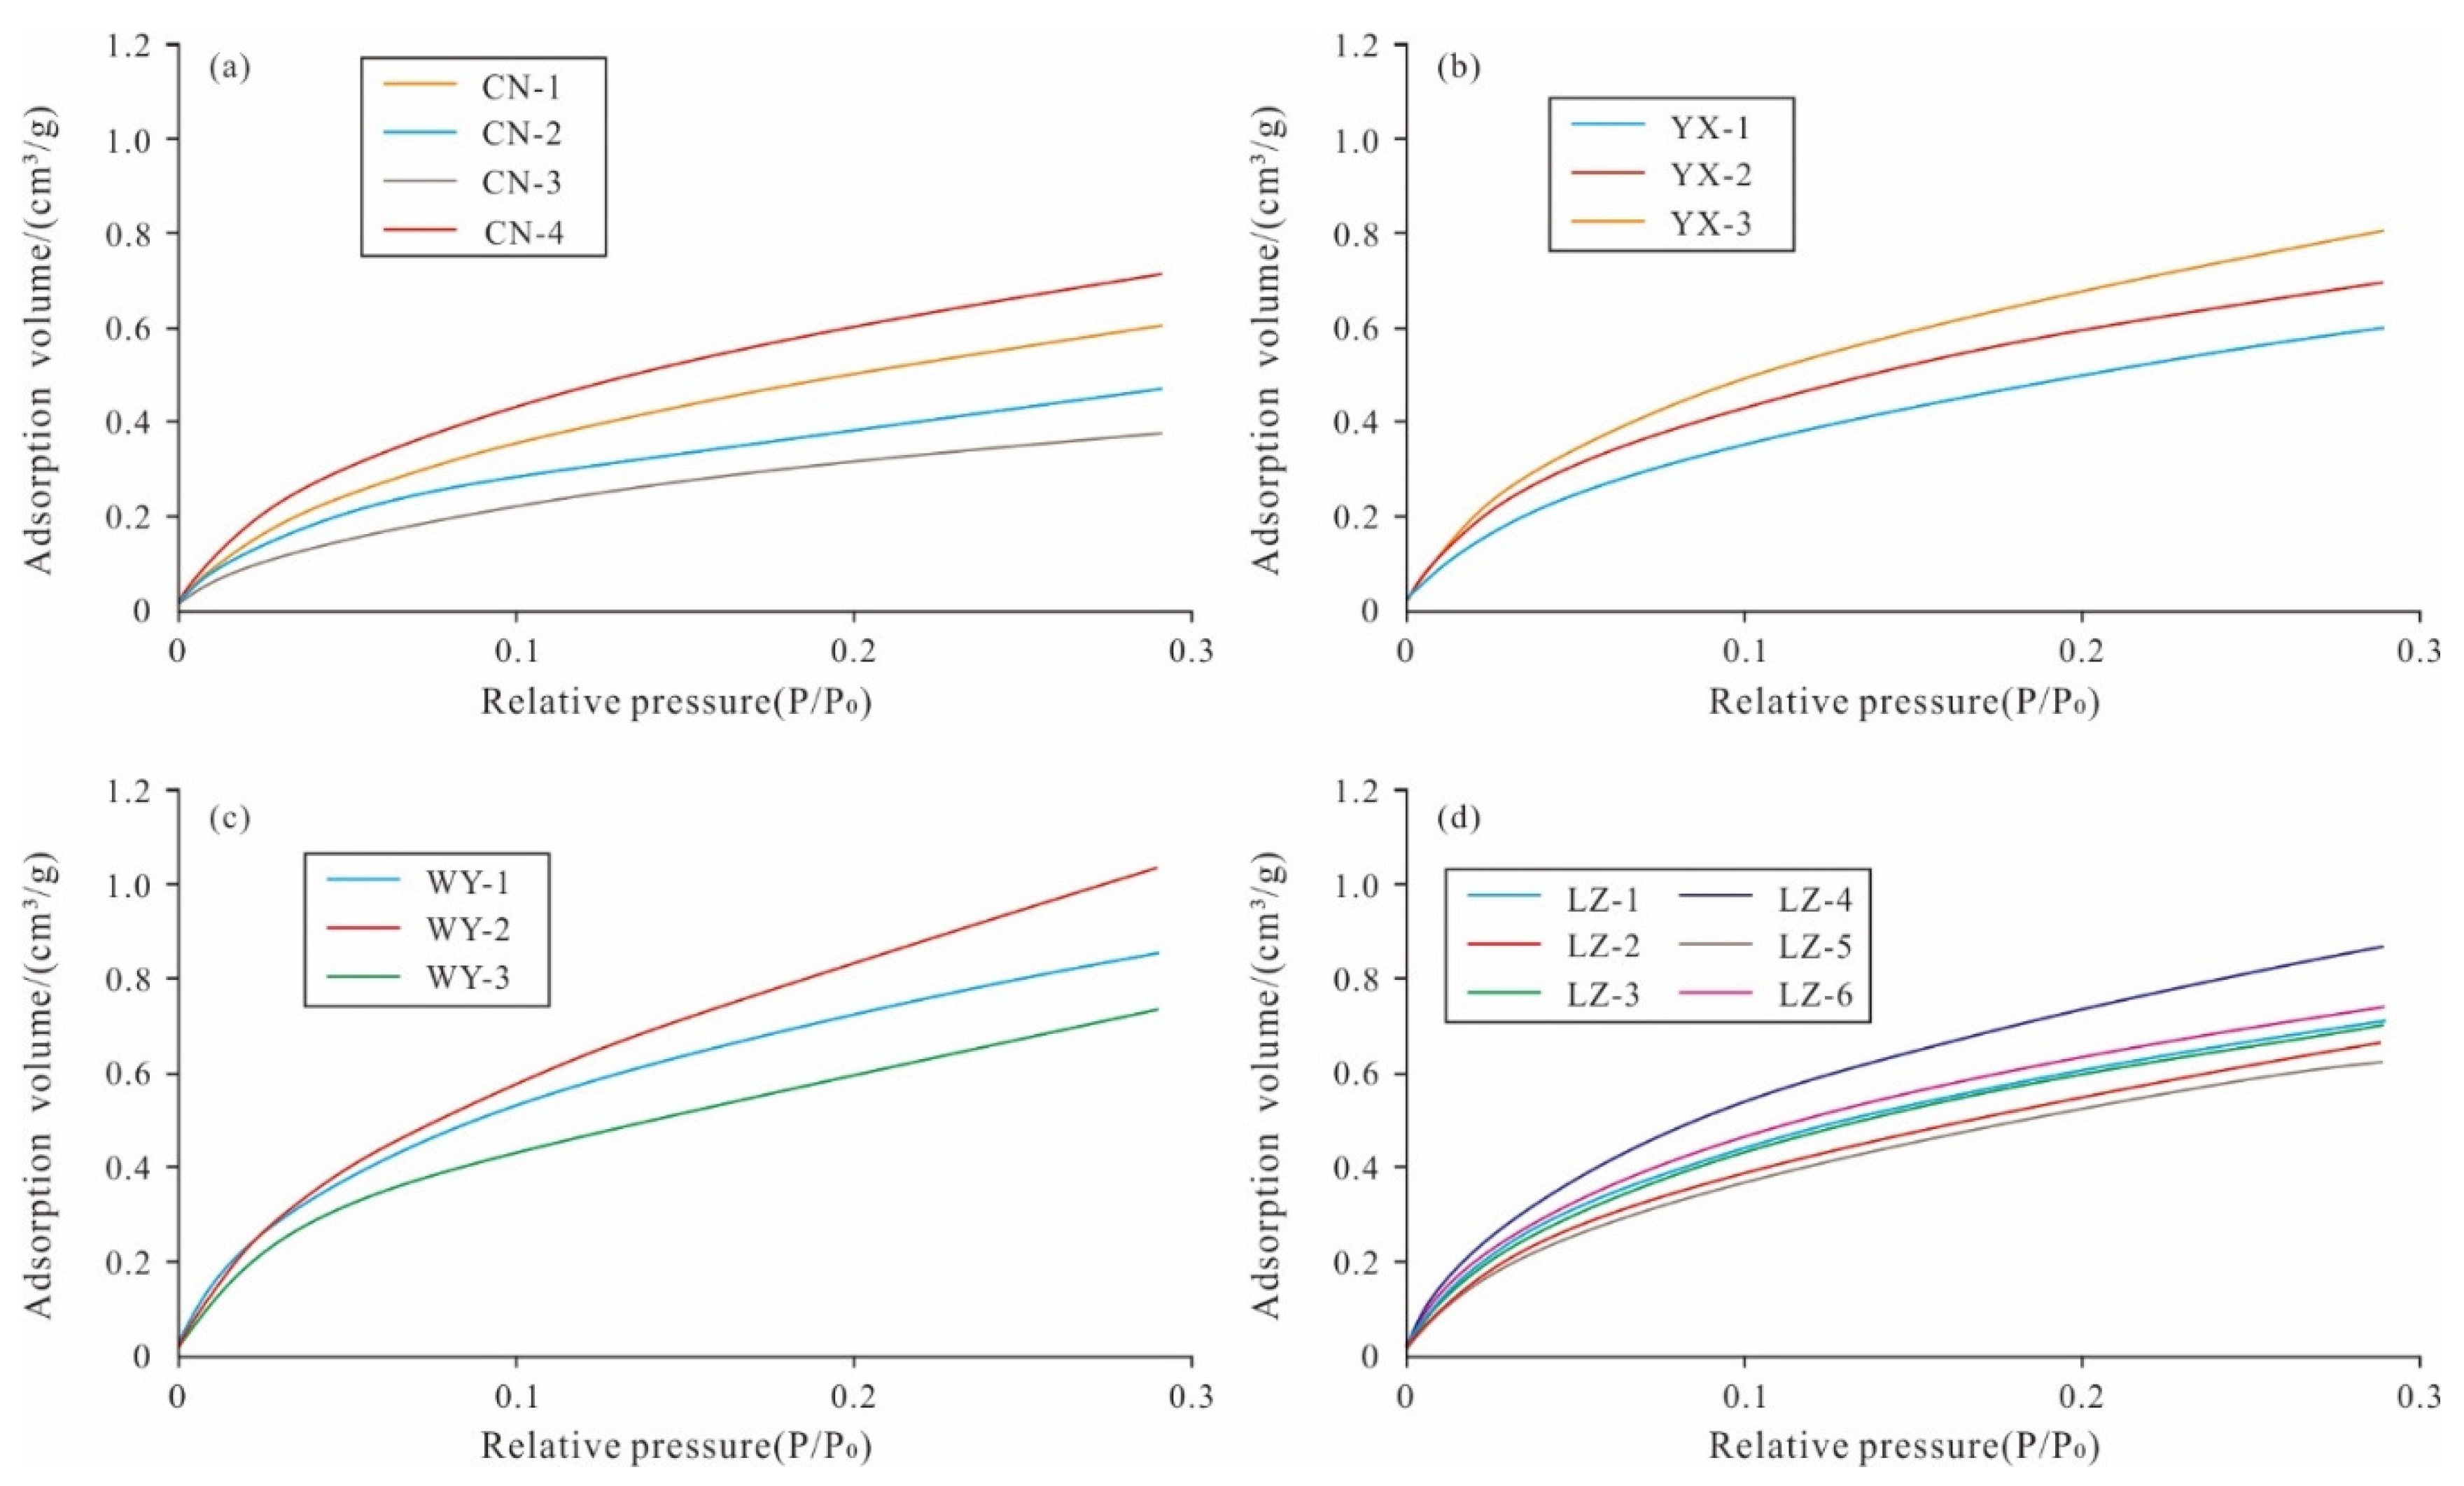
4.3.2. Low-Temperature N2 Adsorption

Low-temperature nitrogen adsorption is an important method for characterizing mesopores. In this study, the low-temperature nitrogen adsorption–desorption isotherms of 16 shale samples in the study area were analyzed (Figure 7). According to Figure 6, the adsorption–desorption isotherm types of the shale samples in the study area vary, but they all exhibit a steep drop in the desorption curve at relative pressures of 0.4–0.6, similar to the H2 and H3 type hysteresis loops proposed by IUPAC. This indicates that the pores in the samples are mainly composed of micropores and mesopores. Additionally, the shapes of the hysteresis loops in the adsorption curves can be used to identify the shape of the micropores [50]. The mesopores in the Longmaxi Formation shale in the study area are mainly composed of slit-like pores and ink bottle-like pores. Among them, the mesopores in the Longmaxi Formation shale in the Changning block are predominantly slit-like pores (Figure 7a), while the mesopores in the Yuxi block and the Weiyuan block shale are mainly ink bottle-like pores (Figure 7b,c), and the mesopores in the Luzhou block shale are mainly slit-like pores (Figure 7d).
In this study, the pore size distribution of the Longmaxi Formation shale was analyzed using the BJH model. The range of pore size distribution characterized by low-temperature N2 adsorption under this model is 2 to 180 nm. For this study, the pore size distribution in the range of 2 to 100 nm was extracted (Figure 8). The results show that the pore volume of the Longmaxi Formation shale in the study area is mainly contributed by pores with a diameter of 4 to 6 nm. This result differs from the pore volume obtained by high-pressure mercury intrusion, attributed to the difference in experimental methods. High-pressure mercury intrusion measures pore volume by the amount of mercury intrusion and extrusion, while low-temperature nitrogen adsorption relies on the gas adsorption capacity. Moreover, high-pressure mercury intrusion is more effective in characterizing macropore volume, while low-temperature nitrogen adsorption is more effective in characterizing mesopore volume.

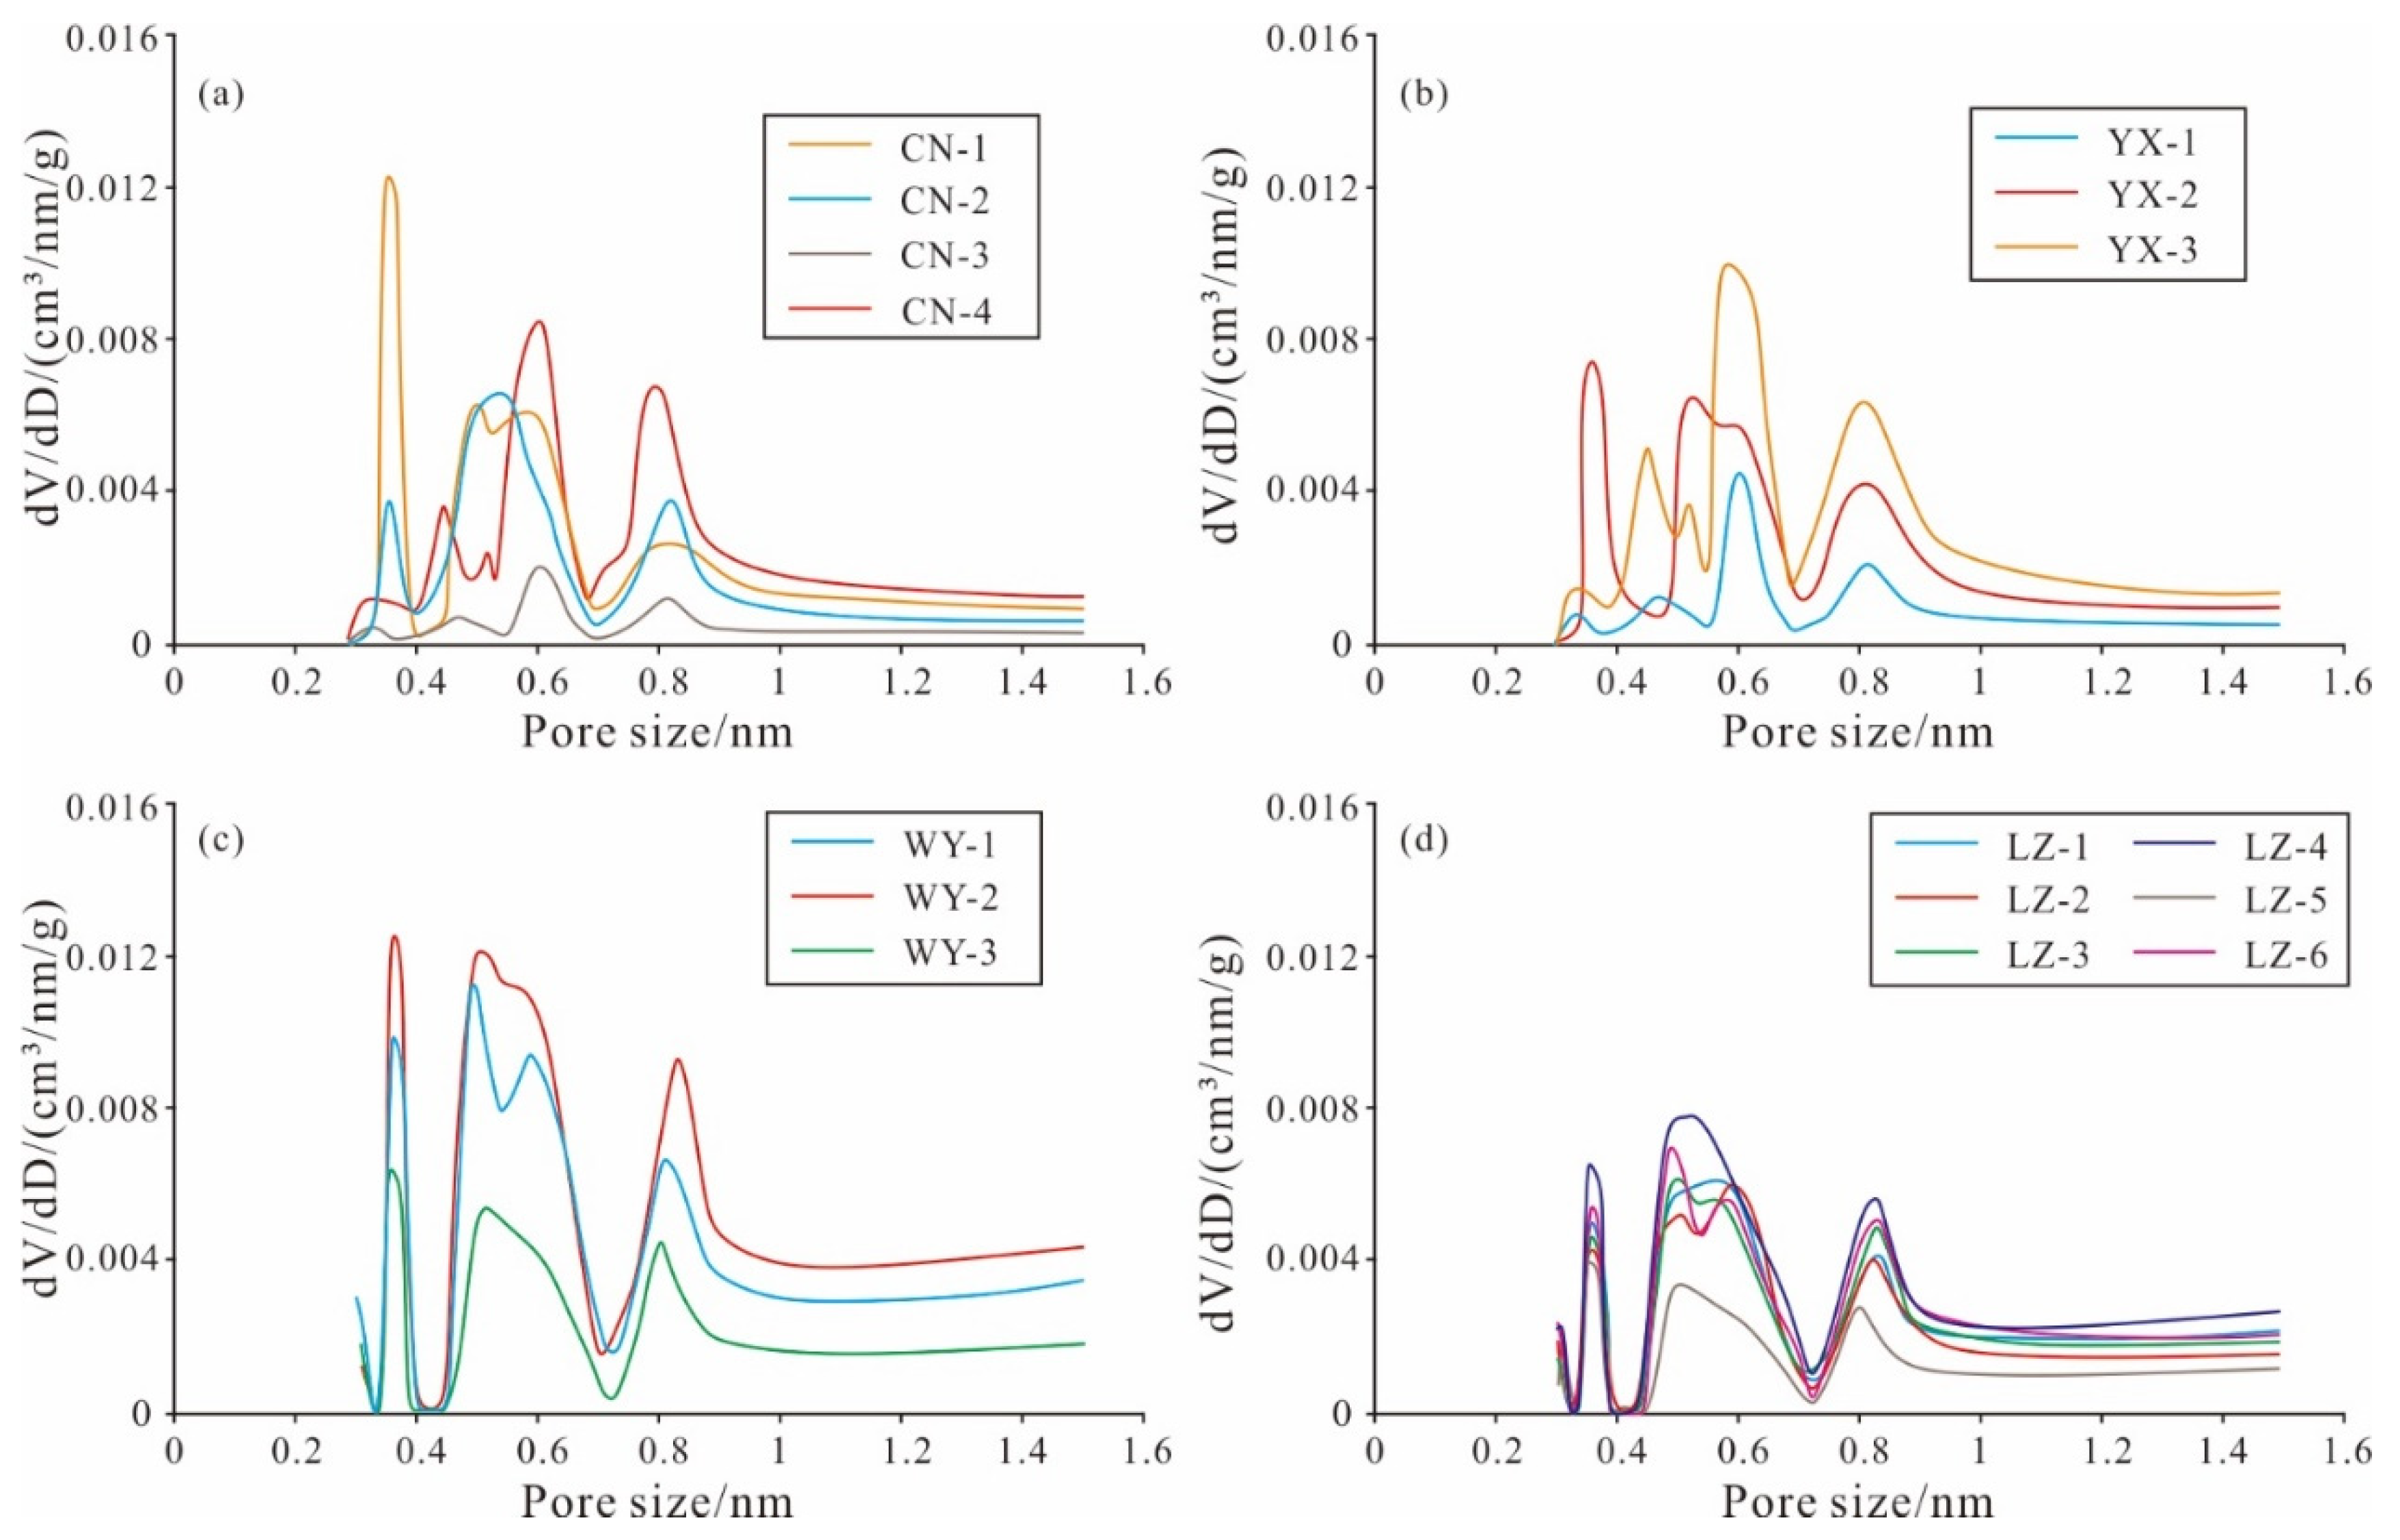
4.3.3. Low-Temperature CO2 Adsorption

CO2 adsorption is one of the important methods for characterizing the micropore structure of shale. Based on the CO2 adsorption curves (Figure 9), the CN-3 sample in the Changning block has the lowest adsorption capacity, measuring 0.394 cm3/g (Figure 9a), while the WY-2 sample has the highest adsorption capacity, at 1.03 cm3/g (Figure 9c). Additionally, the overall CO2 adsorption capacity of the samples in the Changning block is lower than the other three blocks, with the Weiyuan block exhibiting the highest adsorption capacity, followed by the Luzhou (Figure 9d) and Yuxi blocks (Figure 9b).
The NL-DFT model was used to analyze the CO2 adsorption capacity characterization in shale micropores. The results revealed a three-peak distribution in most micropores of the Longmaxi Formation shale in the study area, with peaks at 0.33–0.385 nm, 0.501–0.603 nm, and 0.805–0.85 nm. Only a few samples showed four peaks (Figure 10), such as CN-4 (Figure 10a), YX-3 (Figure 10b), WY-1 (Figure 10c), and LZ-2 (Figure 10d). According to Figure 9, the micropore volume of the Longmaxi Formation shale samples in the Weiyuan block is the largest.

4.3.4. Full Aperture Distribution

The present study utilized a method proposed in previous studies [50,51] to comprehensively characterize the pore size distribution of the Longmaxi Formation shale in the study area using high-pressure mercury intrusion, low-temperature nitrogen adsorption, and low-pressure carbon dioxide adsorption. The results are shown in Figure 11. According to Figure 11, the pore volume distribution of the Longmaxi Formation shale ranges from 0.0131 to 0.0364 cm3/g. Micropores, mesopores, and macropores are all well-developed, with mesopores contributing the most to the pore volume of the shale, accounting for approximately 56%. Micropores are the second largest contributor, accounting for approximately 26% of the pore volume, while macropores contribute approximately 18% to the pore volume. Additionally, the average pore size distribution of the Longmaxi Formation shale in the study area ranges from 4.55 to 17.92 nm, with an average value of 7.69 nm. The specific surface area ranges from 12.01 to 21.99 m2/g.

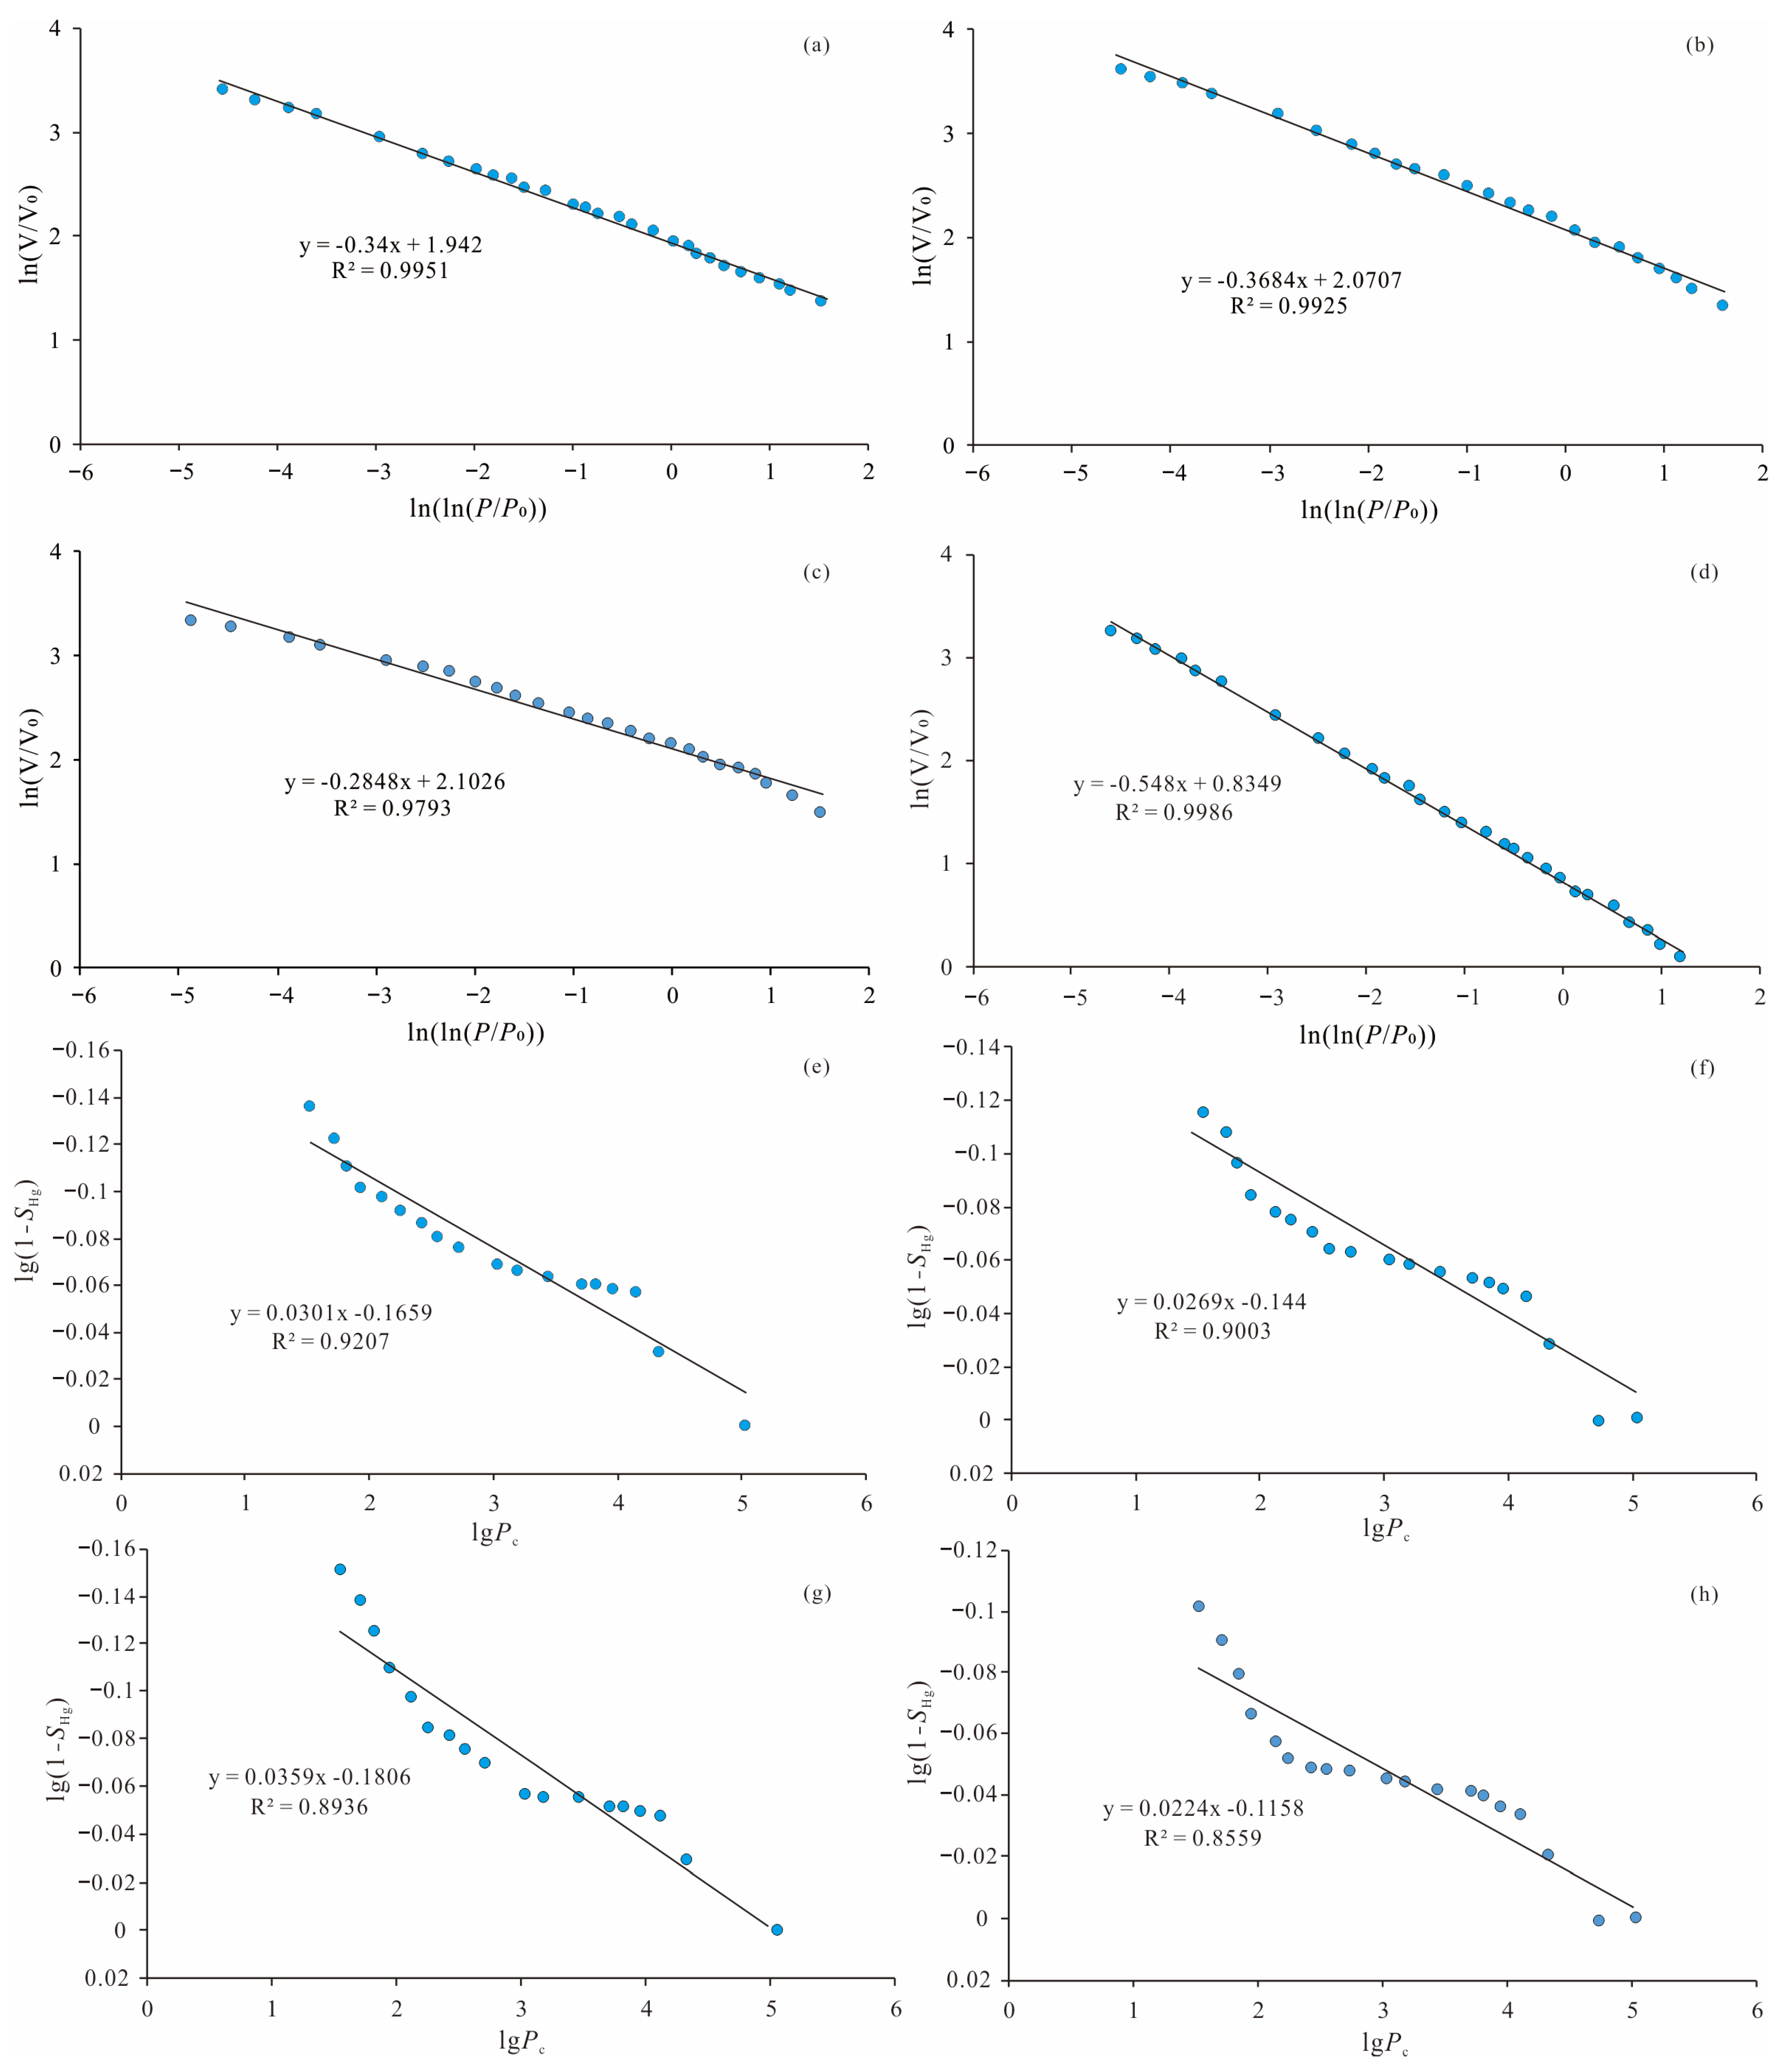
4.4. Fractal Characteristics

In this study, the fractal dimensions of the meso-pores and micro-pores of the Longmaxi Formation shale in the study area were calculated using Equations (1) and (2) respectively. The results are shown in Figure 12 and Table A1. According to Figure 12 and Table A1, the fractal dimension (D1) of the meso-pores in the Longmaxi Formation shale ranges from 2.452 to 2.8548, with an average of 2.6833. The D1 values for the Changning block, Weiyuan block, Yuxi block, and Luzhou block are 2.6925, 2.6789, 2.7726, and 2.6346 respectively. The fractal dimension (D2) of the macro-pores in the Longmaxi Formation shale ranges from 2.9626 to 2.9786, with an average of 2.9707. The D2 values for the Changning block, Weiyuan block, Yuxi block, and Luzhou block are 2.9683, 2.9648, 2.9765, and 2.9726 respectively.
In addition, there are differences in the fractal dimensions of shale with different lithologies. For example, the D1 values for siliceous shale range from 2.6064 to 2.7312, with an average of 2.6619, while the D2 values range from 2.9636 to 2.9746, with an average of 2.9693. For mixed shale, the D1 values range from 2.452 to 2.8315, with an average of 2.6528, while the D2 values range from 2.9626 to 2.9786, with an average of 2.9721. For calcareous shale, the D1 values range from 2.6316 to 2.8548, with an average of 2.7394, while the D2 values range from 2.9641 to 2.9779, with an average of 2.9713.

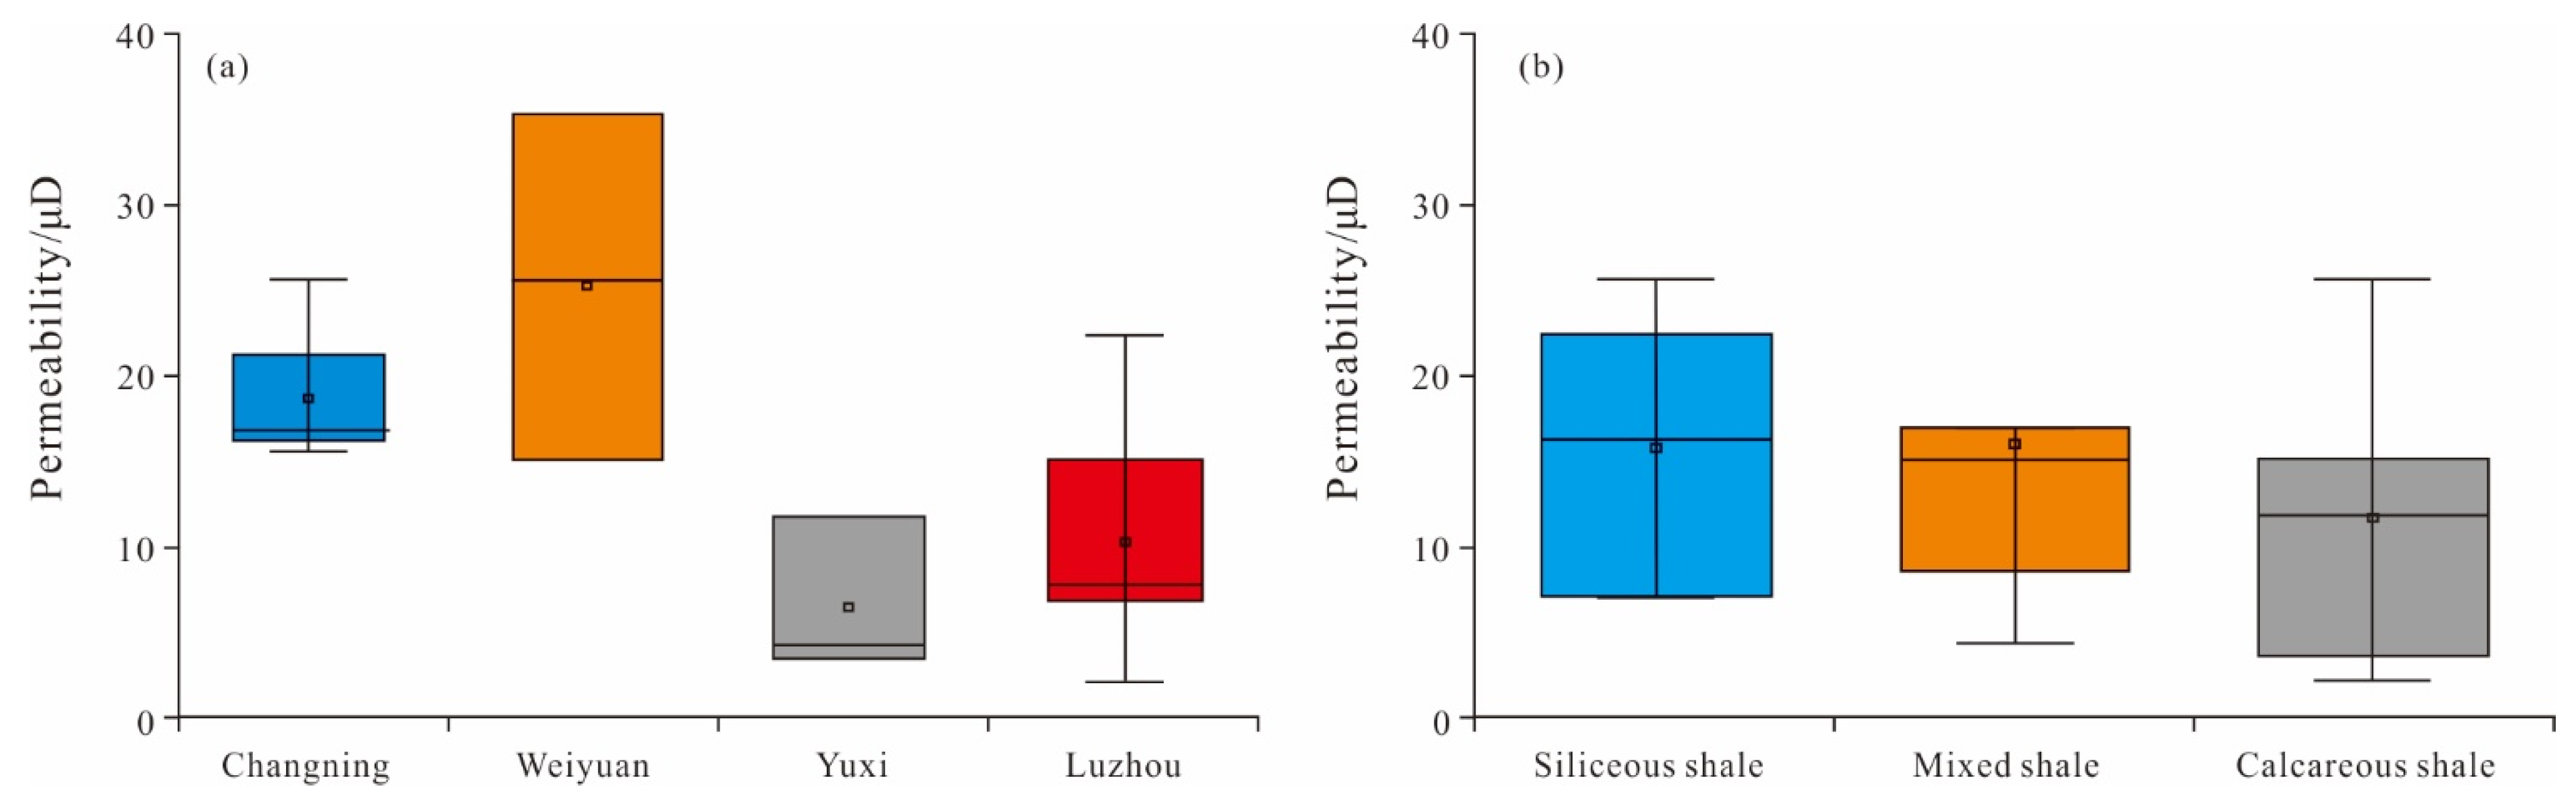
4.5. Permeability and Pores Satisfying Darcy Flow

The permeability of the Longmaxi Formation shale in the study area was measured using the pressure pulse decay method, and the results are shown in Figure 13. According to Figure 13, the permeability of the Longmaxi Formation shale in the study area ranges from 2.13 to 35.22 μD, with an average of 14.53 μD. There are notable differences in shale permeability among different blocks. Specifically, the average permeability of the Longmaxi Formation shale is 18.74 μD in the Changning block, 25.31 μD in the Weiyuan block, 6.53 μD in the Yuxi block, and 10.35 μD in the Luzhou block (Figure 13a). This indicates that as the uplift magnitude decreases, the shale reservoir exhibits a rebound in petrophysical properties, leading to a gradual increase in the permeability. Additionally, shale permeability exhibits variations with different lithologies, where the average permeability is 15.75 μD for siliceous shale, 15.98 μD for mixed shale, and 11.63 μD for calcareous shale (Figure 13b).
The migration forms of shale gas can be determined by Kn [20,21]. In this study, Kn and the critical migration aperture of different blocks were calculated using the geothermal gradient and pressure coefficient. By combining Kn with the relationship between various migration forms, the aperture of different migration types in the Longmaxi Formation shale in the study area was determined. The aperture satisfying Darcy flow in the Changning block is approximately 195 nm, in the Weiyuan block is 335 nm, in the Yuxi block is 155 nm, and in the Luzhou block is 147 nm.

5. Discussion

5.1. Factors Controlling Pore Complexity

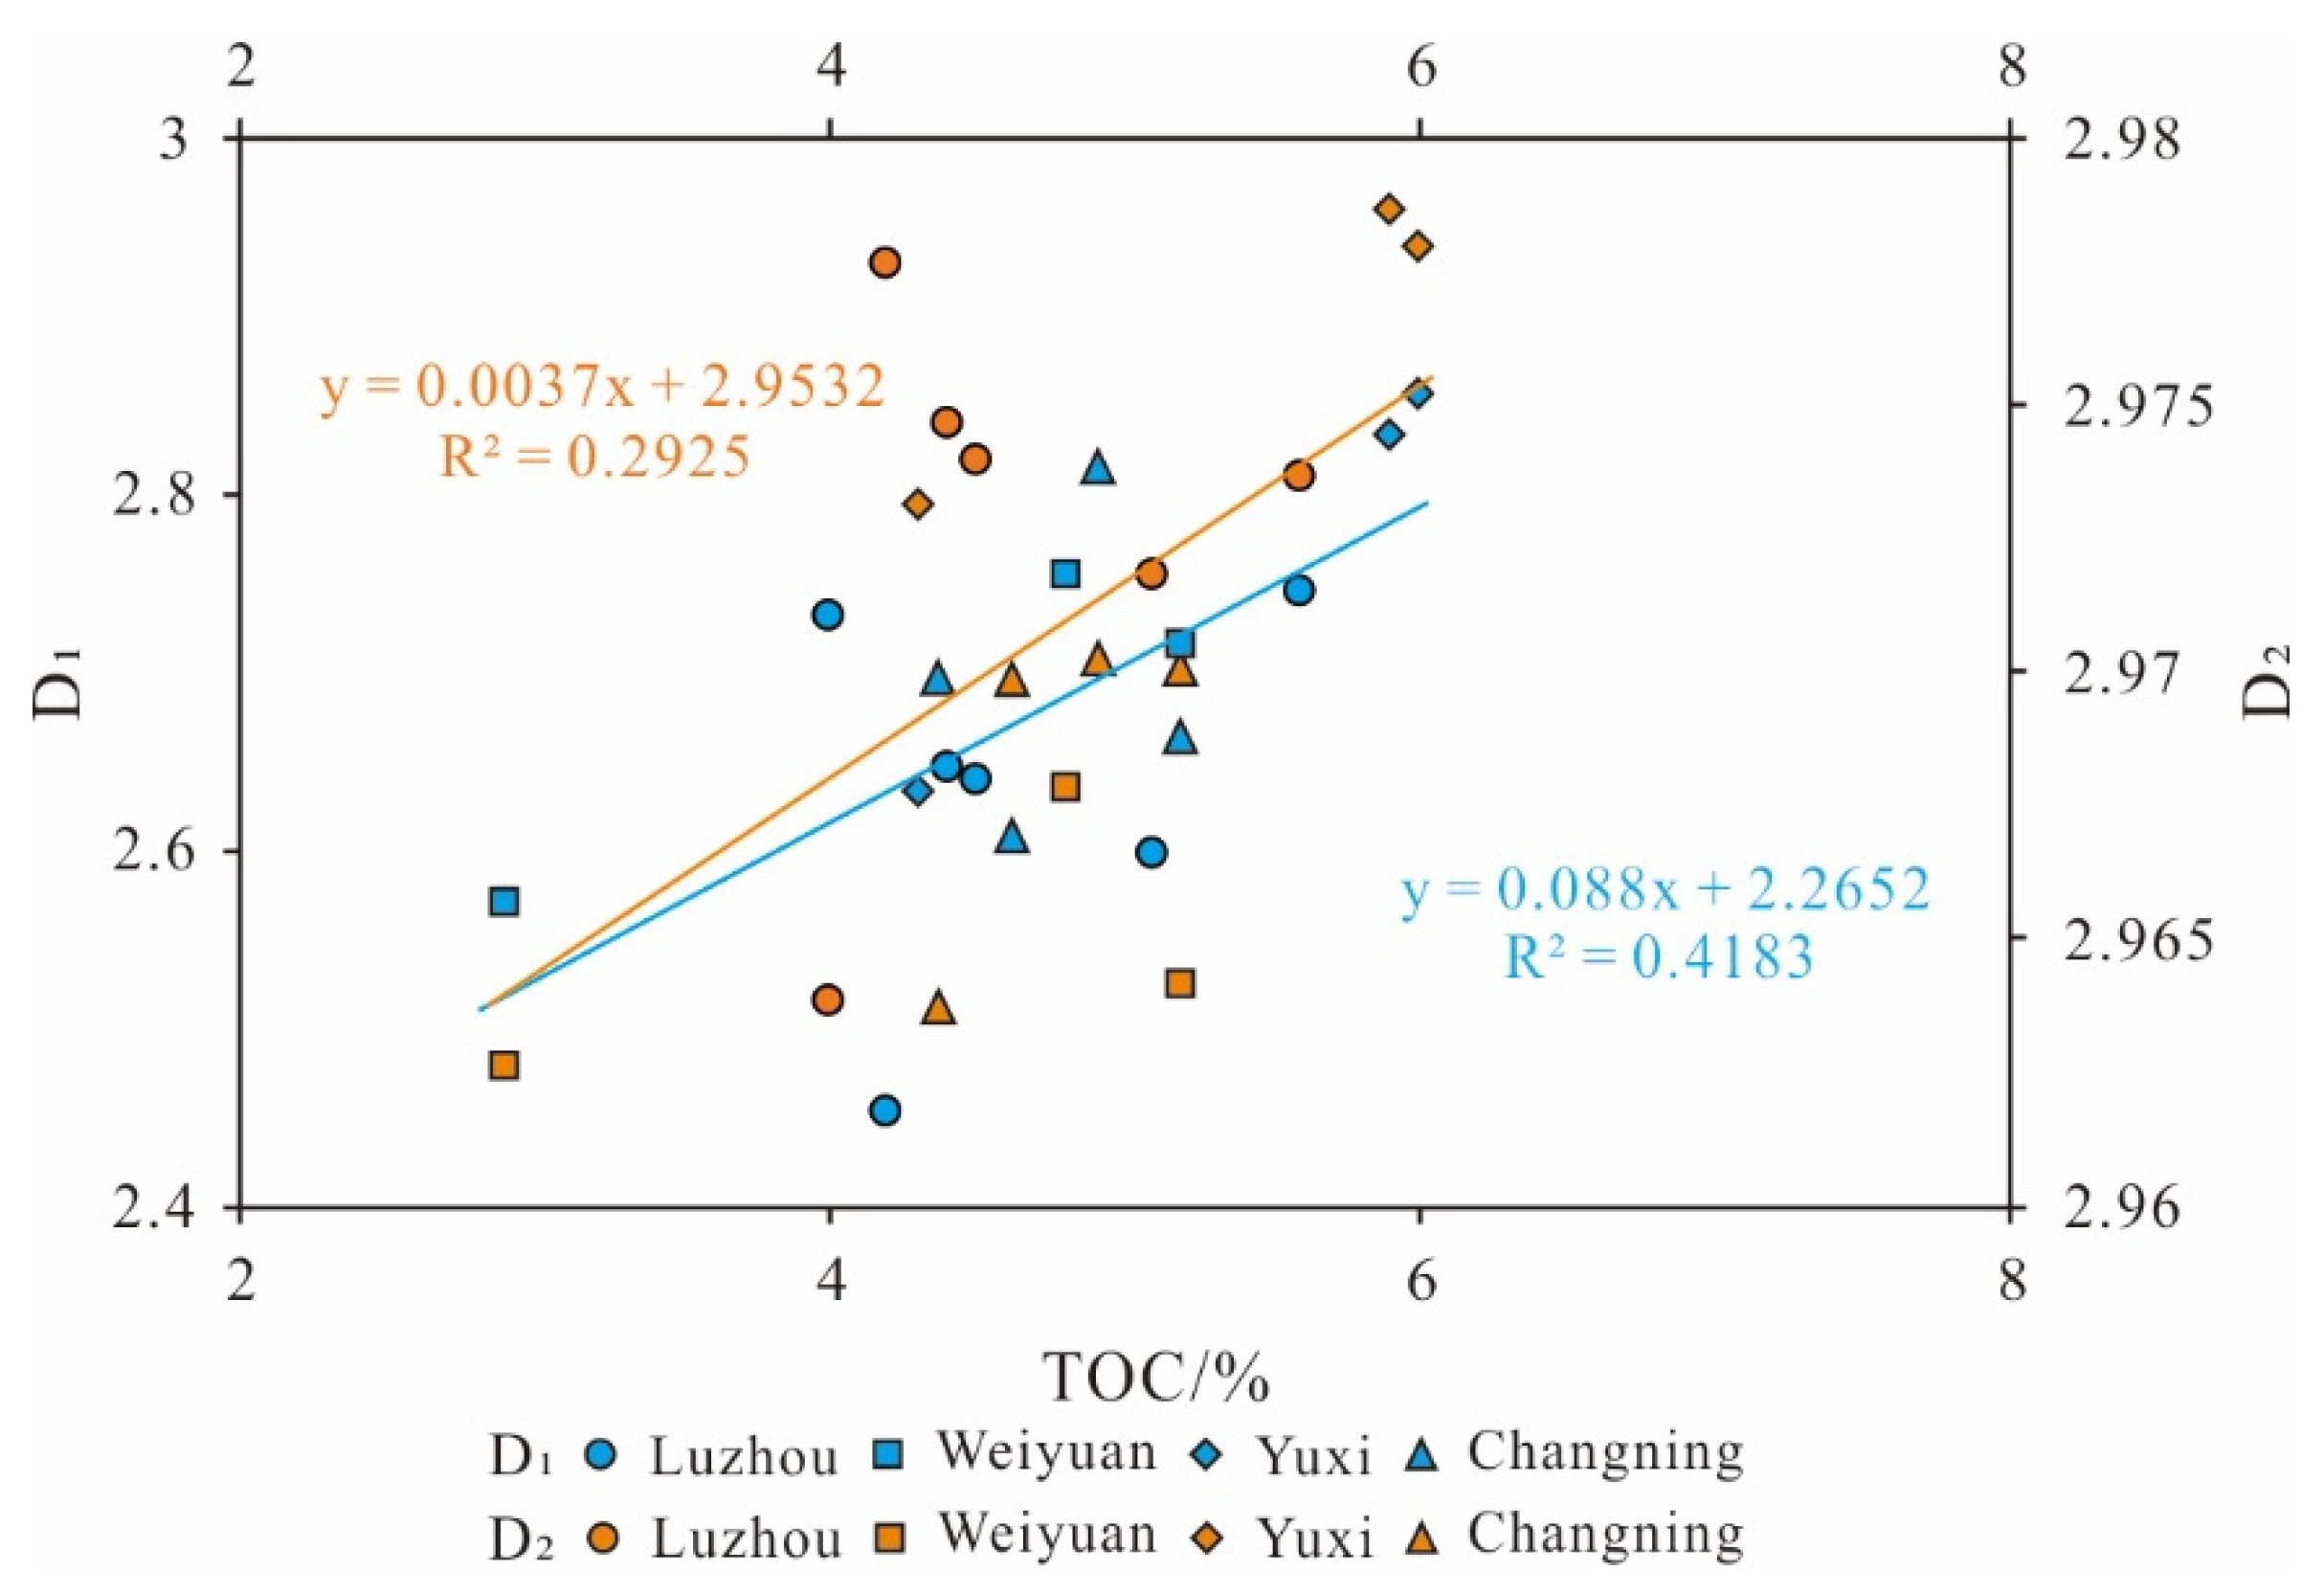
5.1.1. Influence of TOC on Pore Complexity

Organic matter serves as the material basis for hydrocarbon gas generation and plays a crucial role in the development of organic matter pores [52]. This study explores the correlation between the fractal dimensions (D1 and D2) of mesopores and macropores and TOC content. The results show that both D1 and D2 of the Longmaxi Formation shale in the study area increases with rising TOC content. Notably, the correlation between D1 and TOC is significantly stronger than that between D2 and TOC (Figure 14). This indicates that organic matter pores have a significant impact on shale porosity, and this impact is more pronounced on mesopores.

5.1.2. The Influence of Mineral Composition on the Pore Complexity

The minerals present in the Longmaxi Formation shale in the study area include carbonate minerals (calcite), feldspar (K-feldspar + plagioclase), quartz, and clay minerals. This study investigates the correlation between the fractal dimension of the Longmaxi Formation shale and these mineral components. The results are shown in Figure 15.
Based on Figure 15a, clay minerals show a positive correlation with both D1 and D2, although not significantly. This may be due to the fact that clay minerals in the diagenetic stage are prone to structural changes, resulting in various pore and fracture types. These changes increase the surface area and volume of pores, contributing to a more complex pore structure. On the other hand, quartz does not show a clear correlation with D1 and D2 (Figure 15b), but D2 shows a weak negative correlation with quartz. Smooth internal surfaces of quartz particles result in poor development of secondary and primary pores. An increase in quartz content reduces the pore surface heterogeneity, pore development, and pore structure complexity, leading to a decrease in D2. Carbonate minerals do not show a clear correlation with D1 and D2 (Figure 15c). This is because carbonate minerals mostly exist in a cement form, filling and obstructing pores, thus reducing pore connectivity. Additionally, carbonate minerals are soluble and can create dissolution pores. The dual impact of carbonate minerals on pore development contributes to the poor correlation between carbonate minerals and D1 and D2. The influence mechanism of feldspar on D1 and D2 is different. D1 shows an increasing trend followed by a decreasing trend with rising feldspar content, while D2 shows a decreasing trend followed by an increasing trend (Figure 15d). This is because feldspar is a soluble mineral, and at low feldspar content, feldspar dissolution occurs. Under compaction, large pores decrease while medium and micro pores increase, resulting in an increase in D1 and a decrease in D2. Furthermore, feldspar dissolution pores are generally large pores, so at high feldspar content, D2 increases while D1 decreases.

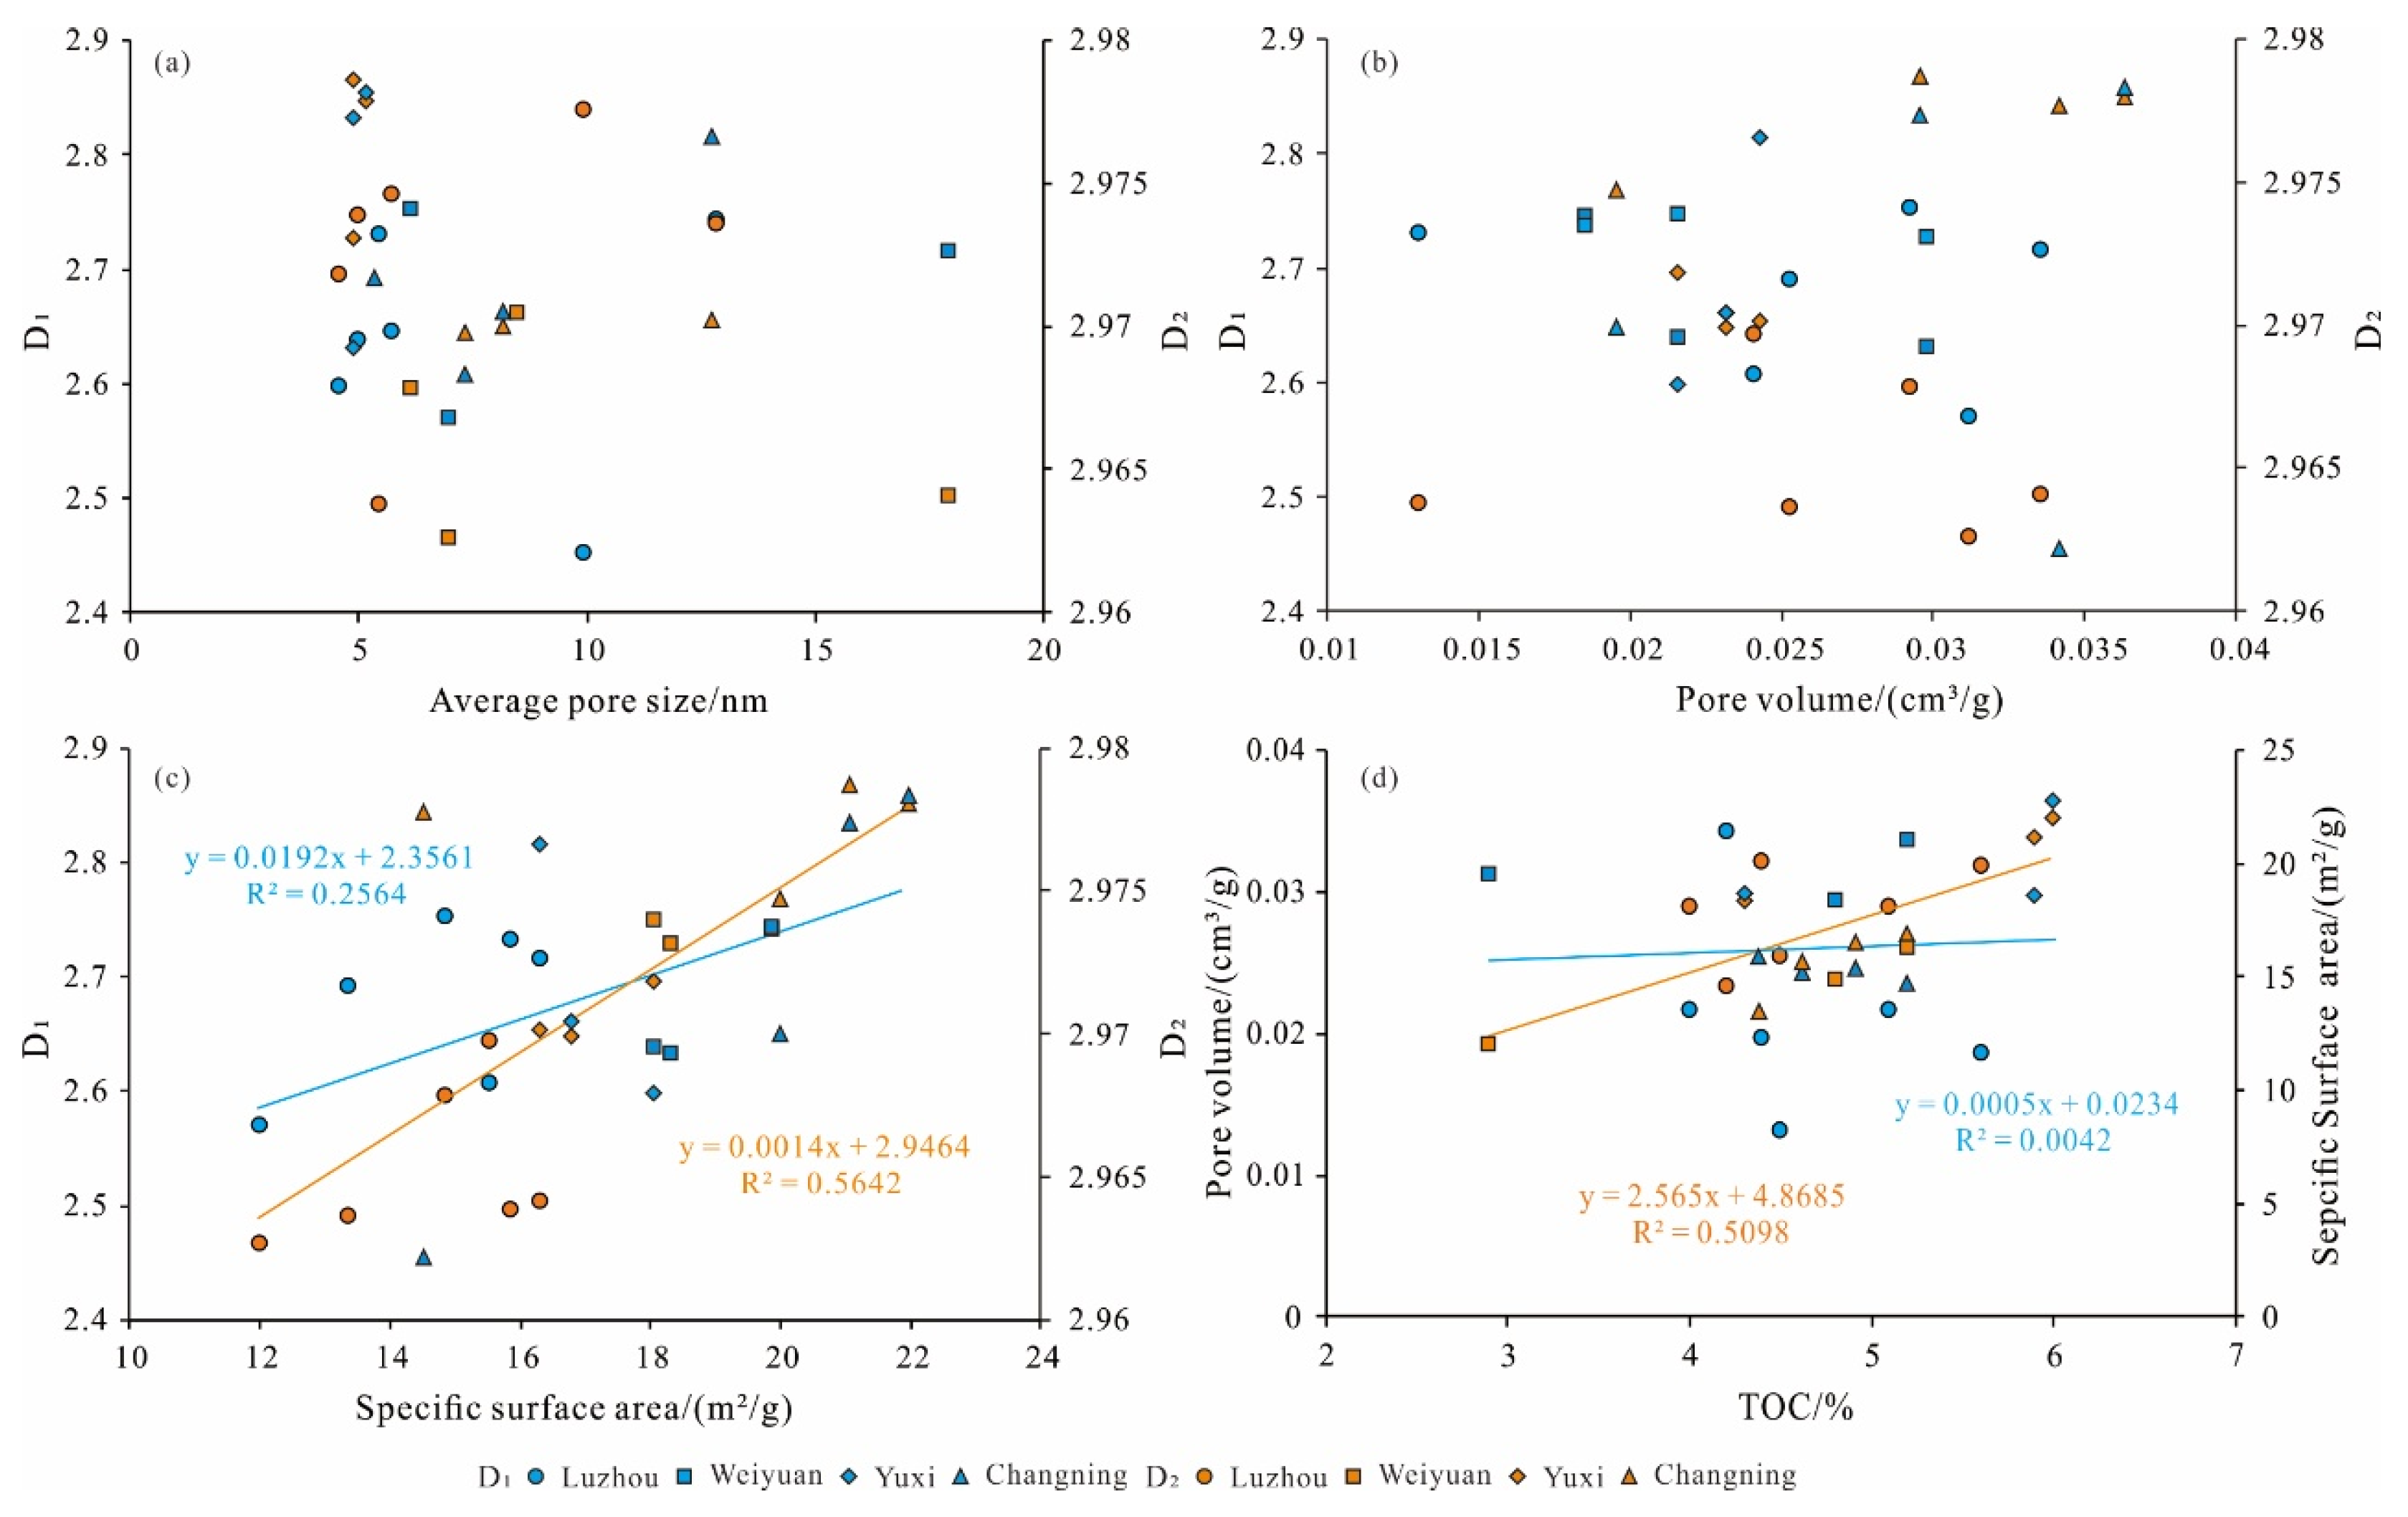
5.1.3. The Influence of Pore Structure on the Pore Complexity

The pore structure significantly influences the pore fractal dimension. The study explores the relationship between the Longmaxi Formation shale in the study area and its fractal dimension, as illustrated in Figure 16. The analysis reveals no clear correlation between D1 and D2 and the average pore size or pore volume (Figure 16a,b). However, a strong correlation exists between D1 and D2 and the specific surface area, which increases proportionally with the specific surface area (Figure 16c). This indicates that a larger specific surface area corresponds to a more complex pore structure. Additionally, the correlation between D2 and specific surface area is stronger than that between D1 and the specific surface area, suggesting that the specific surface area has a more substantial influence on the pore structure of macropores. This phenomenon stems from the composition of pores in the Longmaxi Formation shale, primarily consisting of micropores and mesopores (Figure 11), which also explains the lack of a clear correlation between D2 and average pore size or pore volume.
Additionally, this study analyzed the correlation between TOC and pore volume, as well as specific surface area. The results show no clear correlation between TOC and pore volume, but a higher correlation between TOC and specific surface area (Figure 16d). Furthermore, a significant correlation exists between D1 and D2 and TOC content (Figure 15), indicating the presence of organic-matter-rich pores in the pore system of the Longmaxi Formation shale in the study area, with the specific surface area mainly contributed by organic matter pores.

5.2. Shale Gas Migration Capacity and Its Influencing Factors

Shale reservoirs contain various types of pores and fractures, acting as important pathways for shale gas migration. These pathways facilitate shale gas migration differently, but the permeability of shale is collectively contributed by these various types of migration. Therefore, permeability can be obtained by calculating the parallel permeability of each type of migration [53]. Additionally, previous studies have found that the mobility of Darcy flow is 100–1000 times greater than that of slip flow [21,53]. Therefore, if 1% of the pores satisfy Darcy flow, it can be approximated that the permeability is predominantly contributed by Darcy flow. By examining the pore structure of shale in each block, the proportion of pores satisfying Darcy flow in the study area was determined, as shown in Figure 17. According to Figure 17, the proportion of pores in the Longmaxi Formation shale in the study area that satisfies Darcy flow, ranges from approximately 3.7% to 11.8%, with an average value of 6.6%. The Changning block is approximately 7.1%, the Weiyuan block is approximately 5.8%, the Yuxi block is approximately 6.2%, and the Luzhou block is approximately 7%. This indicates that the permeability of the Longmaxi Formation shale can be attributed to Darcy flow to a significant extent.
In addition, the pore volume, complexity, and specific surface area of the pores are also important factors affecting the shale gas migration capability. Permeability, as an important parameter for assessing shale gas migration capability, was analyzed for its correlation with the proportion of pores satisfying Darcy flow, specific surface area, D1, and D2, as shown in Figure 18. According to Figure 18, there is no significant correlation between permeability and the proportion of pores satisfying Darcy flow (Figure 18a). This lack of correlation is related to pore connectivity and is negatively correlated with the specific surface area. A larger specific surface area is more favorable for gas adsorption but hinders gas migration. Additionally, a larger specific surface area indicates a higher complexity of the pores, leading to poorer gas migration capability, consistent with the correlation shown in Figure 18b. However, there is no significant correlation between shale permeability and D1, but there is a clear negative correlation with D2. This indicates that the primary mechanism for shale gas migration is through macropores, while mesopores play a minor role.

6. Conclusions

This investigation into the mineralogy, organic geochemistry, pore structure, and permeability of the Longmaxi Formation shale in the study area has yielded the following key findings:
(1)
The principal lithogenic minerals in the Longmaxi Formation shale in the study area consist of quartz and calcite, resulting in the classification of siliceous shale, calcareous shale, and mixed shale.
(2)
The pore structure of the Longmaxi Formation shale in the study area is complex, with an average pore size ranging from 4.55 to 17.92 nm, pore volume ranging from 0.0131 to 0.0364 cm3/g, and specific surface area ranging from 12.01 to 21.99 m2/g. The fractal dimensions (D1) of the mesopores range from 2.452 to 2.8548, and the fractal dimensions (D2) of the macropores range from 2.9626 to 2.9786.
(3)
Fractal dimensions of shale are influenced by organic matter, inorganic minerals, and pore structure parameters. Both D1 and D2 exhibit positive correlations with TOC, clay mineral content, and specific surface area, while showing negative correlations with quartz. However, correlations with calcite content, pore volume, and average pore size are not statistically significant.
(4)
Macropores emerge as the primary contributors to the migration capability of shale reservoirs, with the permeability of shale being influenced by D2, specific surface area, and the connectivity of macropores.

Author Contributions

Conceptualization, Q.W. and J.W.; methodology, Q.W. and L.X.; validation, Y.Y. (Yuran Yang), J.W. and X.T.; formal analysis, Z.J., J.L. and H.M.; investigation, Z.J., J.W. and H.M.; resources, Z.J. and L.X.; data curation, Q.W., J.L. and X.T.; writing—original draft preparation, Q.W. and H.M.; writing—review and editing, Q.W., Y.Y. (Yuran Yang), L.X. and Y.Y. (Yingzi Yin); visualization, Q.W., Y.Y. (Yuran Yang) and H.M.; project administration, J.W., Y.Y. (Yingzi Yin) and Z.J.; and funding acquisition, Z.J., J.W. and X.T. All authors have read and agreed to the published version of the manuscript.

Funding

This research was funded by nnovative Research Group Project of the National Natural Science Foundation of China (grant nos. 42372144, 41872135 and 42072151) and the National Energy Shale Gas R & D (Experiment) Center (grant no. 2022-KFKT-15).

Data Availability Statement

For data other than those presented in the manuscript’s Table A1, please contact the corresponding author for access.

Acknowledgments

This study was supported by the Innovative Research Group Project of the National Natural Science Foundation of China and the National Energy Shale Gas R & D (Experiment) Center. In addition, we would like to express our gratitude to the Shale Gas Research Institute of PetroChina Southwest Oil and Gas Field Company for providing samples and the valuable suggestions provided by the editors and reviewers.

Conflicts of Interest

Authors Jianfa Wu, Qiuzi Wu, Liang Xu, Yuran Yang, Jia Liu and Yingzi Yin were employed by the Shale Gas Research Institution, PetroChina Southwest Oil & Gasfield Company. The remaining authors declare that the research was conducted in the absence of any commercial or financial relationships that could be construed as a potential conflict of interest.

Appendix A

Table A1. TOC: mineralogy, pore structure, and permeability of the Longmaxi Formation shale in the study area.
SamplesDepth/mBlocksTOC/%Mineral Content/%Fractal DimensionLithofaciesPermeability
/μD
Pore Volume
/(cm3/g)
BET Surface Area/(m2/g)Average Pore Size/nmProportion/%
ClayQuartzCalcitePlagioclaseK-FeldsparPyriteD1D2
CN-12520.4Changning4.6214.7345.4921.29114.323.172.60642.9697Siliceous shale16.850.024115.537.359.56
CN-23148.44.3819.9148.4219.45.062.684.532.69022.9636Siliceous shale25.630.025313.365.376.86
CN-33166.95.213.5864.919.1901.271.062.662.9699Siliceous shale15.640.0232116.788.176.83
CN-42349.54.9126.2242.8528.530.80.90.72.81352.9701Mixed shale16.850.0243116.3112.765.00
WY-12569Weiyuan5.215.1312.7155.758.94.223.292.71522.9641Calcareous shale15.080.033616.317.924.72
WY-23116.744.815.2510.2260.398.263.862.022.75232.9678Calcareous shale25.630.029314.846.146.73
WY-33784.962.99.3820.0449.2612.362.363.72.56932.9626Mixed shale35.220.031212.016.985.84
YX-14077.1Yuxi5.917.364.4154.6114.964.564.12.83152.9786Mixed shale4.260.029621.064.897.25
YX-23754617.820.445.99.742.22.85482.9779Calcareous shale11.790.036421.995.165.40
YX-333454.318.321.2560.6512.934.652.32.63162.9731Calcareous shale3.520.029818.314.896.05
LZ-14039Luzhou5.618.813.852.96.72.75.12.74322.9736Calcareous shale2.130.018619.8712.8611.79
LZ-23839.75.125.516.342.37.994.313.62.59762.9718Mixed shale15.030.021618.064.554.00
LZ-34926.84.421.449.218.75.51.93.32.64582.9746Siliceous shale7.050.019620.015.737.58
LZ-44086.44.521.552.87.95.110.42.32.63752.9739Siliceous shale6.890.013115.844.986.76
LZ-54918415.463.211.93.72.63.22.73122.9638Siliceous shale22.450.021618.065.437.99
LZ-64031.34.219.19.146.714.645.964.52.4522.9776Mixed shale8.540.034214.539.933.73

References

  1. Guo, X.S.; Li, Y.P.; Li, J.L.; Feng, M.G.; Duan, H. Shale Discovery of Fuling Shale Gas Field and its prospects. Front. Energy 2019, 13, 354–366. [Google Scholar] [CrossRef]
  2. Ma, Y.S.; Cai, X.Y.; Zhao, P.R. China’s shale gas exploration and development: Understanding and practice. Pet. Exp. Dev. 2018, 45, 589–603. [Google Scholar] [CrossRef]
  3. Zou, C.N.; Zhu, R.K.; Chen, Z.Q.; Chen, Z.Q.; Ogg, J.G.; Wu, S.T.; Dong, D.Z.; Qiu, Z.; Wang, Y.M.; Wang, L.; et al. Organic-matter-rich shales of China. Earth. Sci. Rev. 2019, 189, 51–78. [Google Scholar] [CrossRef]
  4. Ma, X.H.; Zhang, X.W.; Xiong, W.; Liu, Y.Y.; Gao, J.L.; Yu, R.Z.; Sun, Y.P.; Wu, J.; Kang, L.X.; Zhao, S.P. Prospects and challenges of shale gas development in China. Pet. Sci. Bul. 2023, 4, 491–501. [Google Scholar]
  5. Gong, X.; Ma, X.H.; Liu, Y.Y.; Li, G.F. Advances in Hydraulic Fracture Propagation Research in Shale Reservoirs. Minerals 2022, 12, 1438. [Google Scholar] [CrossRef]
  6. Nie, H.K.; Li, P.; Dang, W.; Ding, J.H.; Sun, C.X.; Liu, M.; Wang, J.; Du, W.; Zhang, P.X.; Li, D.H.; et al. Enrichment characteristics and research directions of deep shale gas: A case study of the Ordovician Wufeng-Silurian Longmaxi shale in the Sichuan Basin and its surrounding areas, China. Pet. Exp. Dev. 2022, 49, 648–659. [Google Scholar]
  7. Chen, L.; Zuo, L.; Jiang, Z.X.; Jiang, S.; Liu, K.Y.; Tan, J.Q.; Zhang, L.C. Mechanisms of shale gas adsorption: Evidence from thermodynamics and kinetics study of methane adsorption on shale. Chem. Eng. J. 2019, 361, 559–570. [Google Scholar] [CrossRef]
  8. Fan, C.H.; Li, H.; Qin, Q.R.; He, S.; Zhong, C. Geological conditions and exploration potential of shale gas reservoir in Wufeng and Longmaxi Formation of southeastern Sichuan Basin, China. J. Pet. Sci. Eng. 2020, 191, 107138. [Google Scholar] [CrossRef]
  9. Shi, X.W.; Wu, W.; Wu, Q.Z.; Zhong, K.S.; Jiang, Z.X.; Miao, H. Controlling Factors and Forming Types of Deep Shale Gas Enrichment in Sichuan Basin, China. Energies 2022, 15, 7023. [Google Scholar] [CrossRef]
  10. Guo, X.S.; Hu, D.F.; Li, Y.P.; Wei, Z.H.; Wei, X.F.; Liu, Z.J. Geological factors controlling shale gas enrichment and high production in Fuling shale gas field. Pet. Exp. Dev. 2017, 44, 513–523. [Google Scholar] [CrossRef]
  11. Sun, C.X.; Nie, H.K.; Dang, W.; Chen, Q.; Zhang, G.R.; Li, W.P.; Lu, Z.Y. Shale Gas Exploration and Development in China: Current Status, Geological Challenges, and Future Directions. Energy Fuels 2021, 35, 6359–6379. [Google Scholar] [CrossRef]
  12. Nie, H.K.; Jin, Z.J.; Li, P.; Katz, B.J.; Dang, W.; Liu, Q.Y.; Ding, J.H.; Jiang, S.; Li, D.H. Deep shale gas in the Ordovician-Silurian Wufeng–Longmaxi formations of the Sichuan Basin, SW China: Insights from reservoir characteristics, preservation conditions and development strategies. J. Asian. Earth Sci. 2023, 244, 105521. [Google Scholar] [CrossRef]
  13. Jin, Z.J.; Nie, H.K. Evolution History of Overpressured and Normally Pressured Shale Gas Reservoirs in Wufeng Formation-Longmaxi Formation, Sichuan Basin, China: An Analysis from the Perspective of Source and Seal Coupling Mechanism. Energy Fuels 2022, 36, 10870–10885. [Google Scholar] [CrossRef]
  14. Jiang, Z.X.; Song, Y.; Tang, X.L.; Li, Z.; Wang, X.M.; Wang, G.Z.; Xue, Z.X.; Li, X.; Zhang, K.; Chang, J.Q.; et al. Controlling factors of marine shale gas differential enrichment in southern China. Pet. Exp. Dev. 2020, 47, 617–628. [Google Scholar] [CrossRef]
  15. Zhang, X.L.; Xiao, L.Z.; Guo, L.; Xie, Q.M. Investigation of shale gas microflow with the Lattice Boltzmann method. Pet. Sci. 2015, 12, 96–103. [Google Scholar] [CrossRef]
  16. Li, Y.Z.; Li, Y.M.; Luo, P.; Zhao, K.Z. Study on seepage mechanism and productivity of shale gas. Fault-Block Oil Gas Field 2013, 20, 186–190. [Google Scholar]
  17. Sun, L.; Qiu, Z.; Zhu, R.K.; Guo, Q.L. Occurrence and Migration Mechanism and Application Models of Tight and Shale Hydrocarbon. Bul. Geol. Sci. Technol. 2015, 34, 115–122. [Google Scholar]
  18. Javadpour, F. Nanopores and Apparent Permeability of Gas Flowin Mudrocks (Shales and Siltstone). J. Can. Pet. Technol. 2009, 48, 16–21. [Google Scholar] [CrossRef]
  19. Soeder, D.J. Porosity and permeability of eastern devonian gas shale. SPE Form. Eval. 1998, 3, 116–124. [Google Scholar] [CrossRef]
  20. Wang, G.Z. Differential Enrichment Mechanism of Shale Gas in the Southern Marine Longmaxi Formation. Ph.D. Thesis, China University of Petroleum, Beijing, China, 2022; pp. 1–141. [Google Scholar]
  21. Miao, H.; Jiang, Z.X.; Tang, X.L.; Wang, G.Z.; Wu, Q.Z.; Fan, W.L.; Zheng, H.Y. Strata Uplift Controlled Deep Shale Gas Accumulation Modes: A Case Study from the Weiyuan Block, Sichuan Basin. Energy Fuels 2023, 37, 12889–12904. [Google Scholar] [CrossRef]
  22. Wang, G.Z.; Jiang, Z.X.; Gong, H.J.; Shi, Y.G.; He, S.J.; Miao, H. A Novel Method for Calculating Diffusion Coefficient of Shale Gas Reservoirs: A Case Study of Longmaxi Formation in Weiyuan Area, Sichuan Basin, China. Appl. Sci. 2023, 13, 7044. [Google Scholar] [CrossRef]
  23. Li, Y.; Wang, Z.S.; Pan, Z.J.; Niu, X.L.; Yu, Y.; Meng, S.Z. Pore structure and its fractal dimensions of transitional shale: A cross-section from east margin of the Ordos Basin, China. Fuel 2019, 241, 417–431. [Google Scholar] [CrossRef]
  24. Xu, H.; Zhou, W.; Zhang, R.; Liu, S.M.; Zhou, Q.M. Characterizations of pore, mineral and petrographic properties of marine shale using multiple techniques and their implications on gas storage capability for Sichuan Longmaxi gas shale field in China. Fuel 2019, 241, 360–371. [Google Scholar] [CrossRef]
  25. Xi, Z.D.; Tang, S.H.; Wang, J.; Yi, J.J.; Guo, Y.Y.; Wang, K.F. Pore Structure and Fractal Characteristics of Niutitang Shale from China. Minerals 2018, 8, 163. [Google Scholar] [CrossRef]
  26. Yang, R.; He, S.; Yi, J.Z.; Hu, Q.H. Nano-scale pore structure and fractal dimension of organic-rich Wufeng-Longmaxi shale from Jiaoshiba area, Sichuan Basin: Investigations using FE-SEM, gas adsorption and helium pycnometry. Mar. Pet. Geol. 2016, 70, 27–45. [Google Scholar] [CrossRef]
  27. Wang, Z.Z.; Fu, X.H.; Pan, J.N.; Deng, Z. Effect of N2/CO2 injection and alternate injection on volume swelling/shrinkage strain of coal. Energy 2023, 275, 127377. [Google Scholar] [CrossRef]
  28. Pan, J.N.; He, H.X.; Li, G.F.; Wang, X.L.; Hou, Q.L.; Liu, L.L.; Cheng, N.N. Anisotropic strain of anthracite induced by different phase CO2 injection and its effect on permeability. Energy 2023, 284, 128619. [Google Scholar] [CrossRef]
  29. Wang, Z.Z.; Pan, J.N.; Hou, Q.L.; Niu, J.J.; Tian, J.J.; Wang, H.C.; Fu, X.H. Changes in the anisotropic permeability of low-rank coal under varying effective stress in Fukang mining area, China. Fuel 2018, 234, 1481–1497. [Google Scholar] [CrossRef]
  30. Pfeifer, P.; Wu, Y.J.; Cole, M.W.; Krim, J. Multilayer adsorption on a fractally rough surface. Phys. Rev. Lett. 1989, 62, 1997–2000. [Google Scholar] [CrossRef]
  31. Avnir, D.; Jaroniec, M. An isotherm equation for adsorption on fractal surfaces of heterogeneous porous materials. Langmuir 1989, 5, 1431–1433. [Google Scholar] [CrossRef]
  32. Neimark, A.V.; Unger, K.K. Method of discrimination of surface fractality. J. Colloid Interface Sci. 1993, 158, 412–419. [Google Scholar] [CrossRef]
  33. Wang, Y.J.; Fan, W.M.; Zhang, G.W.; Zhang, Y.H. Phanerozoic tectonics of the South China Block: Key observations and controversies. Gondwana Res. 2013, 23, 1273–1305. [Google Scholar] [CrossRef]
  34. Li, Z.; Liang, Z.K.; Jiang, Z.X.; Gao, F.L.; Zhang, Y.H.; Yu, H.Y.; Xiao, L.; Yang, Y.D. The Impacts of Matrix Compositions on Nanopore Structure and Fractal Characteristics of Lacustrine Shales from the Changling Fault Depression, Songliao Basin, China. Minerals 2019, 9, 127. [Google Scholar] [CrossRef]
  35. Lai, J.; Wang, G.W.; Wang, Z.Y.; Chen, J.; Pang, X.J.; Wang, S.C.; Zhou, Z.L.; He, Z.B.; Qin, Z.Q.; Fan, X.Q. A review on pore structure characterization in tight sandstones. Earth Sci. Rev. 2018, 177, 436–457. [Google Scholar] [CrossRef]
  36. Zhang, B.Q.; Li, S.F. Determination of the surface fractal dimension for porous media by mercury porosimetry. Ind. Eng. Chem. Res. 1995, 34, 1383–1386. [Google Scholar] [CrossRef]
  37. Washburn, E.W. The dynamics of capillary flow. Phys. Rev. 1921, 17, 273–283. [Google Scholar] [CrossRef]
  38. Li, Z.Q.; Ying, D.L.; Li, H.K.; Yang, G.; Zeng, Q.; Guo, X.Y.; Chen, X. Evolution of the western Sichuan basin and its superimposed characteristic, China. Acta Pet. Sin. 2011, 27, 2362–2370. [Google Scholar]
  39. Liu, S.G.; Yang, Y.; Deng, B.; Zhong, Y.; Wen, L.; Sun, W.; Li, Z.W.; Jansa, L.; Li, J.X.; Song, J.M.; et al. Tectonic evolution of the Sichuan Basin, Southwest China. Earth-Sci. Rev. 2021, 213, 103470. [Google Scholar] [CrossRef]
  40. Zhu, H.J.; Ju, Y.W.; Qi, Y.; Huang, C.; Zhang, L. Impact of tectonism on pore type and pore structure evolution in organic-rich shale: Implications for gas storage and migration pathways in naturally deformed rocks. Fuel 2018, 228, 272–289. [Google Scholar] [CrossRef]
  41. Miao, Z.S.; Pei, Y.W.; Su, N.; Sheng, S.Z.; Feng, B.; Jiang, H.; Liang, H.; Hong, H.T. Spatial and temporal evolution of the Sinian and its implications on petroleum exploration in the Sichuan Basin, China. J. Pet. Sci. Eng. 2021, 210, 110036. [Google Scholar] [CrossRef]
  42. Feng, R.; Luo, H.R.; Chen, Z.W.; Zhang, F.S. Integrated microseismic and geomechanical analysis of hydraulic fracturing induced fault reactivation: A case study in Sichuan Basin, Southwest China. Geoemch. Geophys. Geoener. Georesour. 2023, 9, 48. [Google Scholar] [CrossRef]
  43. Liang, X.; Liu, S.G.; Wang, S.B.; Deng, B.; Zhou, S.Y.; Ma, W.X. Analysis of the Oldest Carbonate Gas Reservoir in China New Geological Significance of the Dengying Gas Reservoir in the Weiyuan Structure, Sichuan Basin. J. Earth Sci. 2019, 30, 348–366. [Google Scholar] [CrossRef]
  44. Jiang, F.J.; Chen, D.; Chen, J.; Li, Q.W.; Liu, Y.; Shao, X.H.; Hu, T.; Dai, J.X. Fractal analysis of shale pore structure of continental gas shale reservoir in the Ordos Basin, NW China. Energy Fuels 2016, 30, 4676–4689. [Google Scholar] [CrossRef]
  45. Song, Z.Z.; Liu, G.D.; Yang, W.W.; Zou, H.Y. Multi-fractal distribution analysis for pore structure characterization of tight sandstone—A case study of the Upper Paleozoic tight formations in the Longdong District, Ordos Basin. Mar. Pet. Geol. 2018, 92, 842–854. [Google Scholar] [CrossRef]
  46. Gang, T.; Kelkar, M.G. A More General Capillary Pressure Curve and Its Estimation from Production Data. In Proceedings of the Rocky Mountain Oil & Gas Technology Symposium, Denver, CO, USA, 16–18 April 2007; pp. 2–3. [Google Scholar]
  47. Eichheimer, P.; Thielmann, M.; Popov, A.; Golabek, G.J.; Fujita, W.; Kottwitz, M.O.; Kaus, B.J.P. Pore-scale permeability prediction for Newtonian and non-Newtonian fluids. Solid Earth 2019, 10, 1717–1731. [Google Scholar] [CrossRef]
  48. Miao, H.; Guo, J.Y.; Wang, Y.B.; Jiang, Z.X.; Zhang, C.J.; Li, C.M. Mineralogical and elemental geochemical characteristics of Taodonggou Group mudstone in the Taibei Sag, Turpan–Hami Basin: Implication for its formation mechanism. Solid Earth 2023, 14, 1031–1052. [Google Scholar] [CrossRef]
  49. Glaser, K.S.; Miller, C.K.; Johnson, G.M.; Kleinberg, R.L.; Pennington, W.D. Seeking the sweet Spot: Reservoir and completion quality in organic shales. Oilfield Rev. 2014, 25, 16–29. [Google Scholar]
  50. Li, X.Y.; Chen, S.B.; Wang, Y.W.; Zhang, Y.K.; Wang, Y.K.; Wu, J.J.; Zhang, J.J.; Khan, J. Influence of Pore Structure Particularity and Pore Water on the Occurrence of Deep Shale Gas: Wufeng–Longmaxi Formation, Luzhou Block, Sichuan Basin. Nat. Resour. Res. 2022, 31, 1403–1423. [Google Scholar] [CrossRef]
  51. Zhang, X.; Wang, D.; Zhang, L.; Xing, Y.; Zhang, Y.; Wang, W.; Liu, Y.; Mao, H. Research on Microscopic Pore Structure Characteristics and Influencing Factors of Shale Reservoirs: A Case Study of the Second Member of the Permian Lucaogou Formation in Malang Sag, Santanghu Basin. Energies 2023, 16, 2453. [Google Scholar] [CrossRef]
  52. Trabucho-Alexandre, J.; Hay, W.W.; de Boer, P.L. Phanerozoic environments of black shale deposition and the Wilson Cycle. Solid Earth 2012, 3, 29–42. [Google Scholar] [CrossRef]
  53. Wang, G.Z.; Jiang, Z.X.; Tang, X.L.; He, S.J.; Wang, Y.C.; Chang, J.Q. Critical conditions and capacities of shale gas diffusion and seepage types in the Longmaxi Formation in Jiaoshiba area, Sichuan Basin. Acta Geol. Sin. 2023, 91, 210–220, (In Chinese with an English abstract). [Google Scholar]
Figure 1. Geological background of the study area.
Minerals 14 00100 g001
Figure 2. Experimental and testing flowchart.
Minerals 14 00100 g002
Figure 3. Box diagram of TOC content distribution in the shale of Longmaxi Formation in southern Sichuan.
Minerals 14 00100 g003
Figure 4. Mineralogical characteristics of shale in the Longmaxi Formation of the research area. (a) Mineral composition of Longmaxi Formation shale; (b) classification of shale facies in the Longmaxi Formation.
Minerals 14 00100 g004
Figure 5. Mercury intrusion and retreat curves of the Longmaxi Formation shale in the research area. (a) Changning block; (b) Yuxi block; (c) Weiyuan block; (d) Luzhou block.
Minerals 14 00100 g005
Figure 6. Pore size distribution of high-pressure mercury injection in Longmaxi Formation shale in the research area. (a) Changning block; (b) Yuxi block; (c) Weiyuan block; and (d) Luzhou block.
Minerals 14 00100 g006
Figure 7. Low temperature nitrogen adsorption–desorption curve of Longmaxi Formation shale. (a) Changning block; (b) Yuxi block; (c) Weiyuan block; and (d) Luzhou block.
Minerals 14 00100 g007
Figure 8. Pore size distribution of Longmaxi Formation shale based on low-temperature nitrogen adsorption. (a) Changning block; (b) Yuxi block; (c) Weiyuan block; and (d) Luzhou block.
Minerals 14 00100 g008
Figure 9. CO2 adsorption curve of Longmaxi Formation shale. (a) Changning block; (b) Yuxi block; (c) Weiyuan block; and (d) Luzhou block.
Minerals 14 00100 g009
Figure 10. Micropore distribution of Longmaxi Formation shale based on CO2 adsorption. (a) Changning block; (b) Yuxi block; (c) Weiyuan block; and (d) Luzhou block.
Minerals 14 00100 g010
Figure 11. Full pore size distribution of shale in Longmaxi Formation. (a) Changning block; (b) Yuxi block; (c) Weiyuan block; and (d) Luzhou block.
Minerals 14 00100 g011
Figure 12. Fractal dimension characteristics of typical shale samples from Longmaxi Formation. (a) CN-3, 3166.9 m, D1; (b) WY-1, 2569 m, D1; (c) YX-3, 3345 m, D1; (d) LZ-6, 4031.3 m, D1; (e) CN-3, 3166.9 m, D2; (f) WY-1, 2569 m, D2; (g) YX-3, 3345 m, D2; and (h) LZ-6, 4031.3 m, D2.
Minerals 14 00100 g012
Figure 13. Distribution characteristics of permeability in the Longmaxi Formation shale in the research area. (a) Permeability of Longmaxi Formation Shale in different blocks; (b) Permeability of Longmaxi Formation Shale in different lithofacies.
Minerals 14 00100 g013
Figure 14. The relationship between TOC pairs and fractal dimensions (D1, D2).
Minerals 14 00100 g014
Figure 15. The relationship between mineral composition and fractal dimensions (D1, D2). (a) Clay vs. D1, D2; (b) quartz vs. D1, D2; (c) calcite vs. D1, D2; and (d) feldspar vs. D1, D2.
Minerals 14 00100 g015
Figure 16. The relationship between pore structure and fractal dimensions (D1, D2). (a) Average pore size vs. D1, D2; (b) pore volume vs. D1, D2; (c) surface area vs. D1, D2; and (d) TOC vs. pore volume, surface area.
Minerals 14 00100 g016
Figure 17. The proportion of pore sizes in the Longmaxi Formation shale in the research area that meets Darcy flow.
Minerals 14 00100 g017
Figure 18. The correlation between the permeability and the proportion of pores satisfying Darcy flow, specific surface area, D1, and D2. (a) Permeability vs. proportion of pores satisfying Darcy flow and specific surface area; (b) permeability vs. D1 and D2.
Minerals 14 00100 g018
Disclaimer/Publisher’s Note: The statements, opinions and data contained in all publications are solely those of the individual author(s) and contributor(s) and not of MDPI and/or the editor(s). MDPI and/or the editor(s) disclaim responsibility for any injury to people or property resulting from any ideas, methods, instructions or products referred to in the content.

