
The Heat Treatment of Pink Zoisite

Institute for Chemical Technology or Organic Materials, Johannes Kepler University Linz, 4040 Linz, Austria
Minerals 2022, 12(11), 1472; https://doi.org/10.3390/min12111472
Submission received: 21 October 2022
/
Revised: 18 November 2022
/
Accepted: 18 November 2022
/
Published: 21 November 2022
(This article belongs to the Special Issue Gem Characterisation)
Abstract
:Natural pink zoisites owe their color to a high concentration of manganese paired with low concentrations of other coloring elements such as vanadium or titanium. Upon conventional heating, such stones typically suffer from the reduction of Mn3+ to the colorless Mn2+ species alongside the destruction of the brownish yellow color that is related to titanium. We have processed manganese containing zoisites under the high pressure of pure oxygen which allowed the manganese to remain oxidized, while the brownish yellow color component was still successfully removed. Depending on the vanadium level, the treated gems show a pink to purplish pink color. Detection of this treatment is not easy as the temperature is too low to result in a change in internal features, but a combination of UV-Vis-NIR spectroscopy and trace element chemistry provided by LA-ICP-MS give evidence of such treatment.
1. Introduction
The mineral zoisite, Ca2Al3[O|OH|SiO4|Si2O7] was first found in the 18th century in a location in Austria called Saualpe (pig alp) and thus named Saualpite [1]. In honor of Karl Sigmund Zois, Freiherr von Edelstein, a rich patron of natural sciences who has funded the research and travels that led to the finding of this new mineral, it was renamed zoisite in 1805 [2]. While zoisite is known as an opaque mineral in several colors, such as the pinkish thulite [3] or the green Anyolithe, which is best known as a host mineral of large rubies from Tanzania [4], the gem and jewelry industry only became aware of this material in the late 1960s when gem-quality blue to violet crystals were found close to Merelani, in the Laletema hills of Tanzania [5,6,7]. As the name zoisite was considered to be an obstacle in marketing, the name tanzanite was coined for this blue variety by Henry B. Platt of Tiffany & Company [8,9]. The deposit, its geology, and mineralogy have been reviewed extensively by many authors and shall not be discussed here in detail [8,10,11,12] as this work only focuses on the pinkish variety of zoisite. Besides this famous location, gem-quality zoisite has so far only been found in Alchuri, Pakistan, mostly of brownish green color [13] and a small find of crystals with a light purple hue is reported from Afghanistan [14].
Most natural zoisite that comes out of the single most important locality in Tanzania is colored brownish (>70%), with a small fraction of about 5% being natural blue and about 1% having a natural pink color (Figure 1). Those numbers are according to a major gem rough dealer who has dealt with tanzanites since 1970 and has seen and handled hundreds of thousands of them [15]. Smith reports a general opinion of only 1% being naturally blue but based on his own experiences in 2009, he estimates that more than 10% are natural blues [16]. The overall color of a zoisite is very hard to describe due its strong trichroism [17]. Each axis can have a very distinct color and when a gem is cut from such a piece of rough, the orientation plays a major role in assigning the final face-up color. The cause of color has been the subject of many studies and is still discussed controversially. It is known that there are two different sites for Al3+ in zoisite which are distorted octahedrons [18]. Transition elements such as V, Cr, Fe, or Mn can replace aluminum and induce color. Vanadium has been found to be the main reason for blue coloration in tanzanite [18], while chromium results in green coloration [19]. Langer et al. have reported the UV-Vis spectra of pink zoisite and stated that the reason for the pink color is Mn(III) ions replacing Al in the crystal lattice. They also provide theoretical calculations of the band positions and a comparison with synthetic materials. Their interpretation is in accordance with many other examples where Mn(III) causes pink coloration [20] as well as the data provided on the minerals.gps.caltech.edu webpage by George Rossman [21]. Hainschwang and Notari also describe the manganese content to be distinctively higher in pink zoisites than in those of other colors, but point out that the color mechanism is not quite understood yet [22]. A good online article can be found at the Spectroscopy for Gemologists website, describing a 0.97 ct pink zoisite, presenting UV-Vis, FTIR, Photoluminescence spectra [23]. However, Wikipedia lists Mn(II), which is basically colorless [24], as a substitute for calcium [25].
In this study, the term pink zoisite is used when at least one axis displays an intense pink coloration. Unfortunately, the pink axis is in many cases visible along the thinner side of a crystal (e.g., Figure 1 center), which is another reason why pink gemstones are rare and typically rather small. Cut stones are typically below 1 ct and anything above has to be considered rare; the largest gem the author has been offered so far is 8.22 ct.
While the heat treatment of brownish zoisite to turn it into blue tanzanite is well known and a common practice in the trade [26,27], the cause of color modification is still not clear and discussed controversial. Chemical analyses clearly suggest that vanadium plays an essential role in the blue coloration of zoisite but its oxidation state and changes during heat treatment are not fully understood.
So far, no method has been described that enables the treatment of zoisites with a certain chemical composition to turn them into pink or pinkish colors. It is the aim of this paper to describe the necessary prerequisites in terms of untreated material, how it is treated, and finally, the influence of the treatment on the spectroscopic properties.
2. Materials and Methods
These results were obtained as part of a larger ongoing project on the coloration of zoisites. In total, more than 1000 samples have been investigated; the number of samples directly used in this study was around 20. All samples are from Merelani, Tanzania and were obtained from three independent dealers, two of them located in the USA and one in Germany. The samples were either used without any pretreatment such as polishing windows or cut into gemstones by the author. A description of all samples is given in Table 1 and a photo provided in Figure 2.
Densities were determined with a Kern EBM 200-3V balance equipped with a Kern YDB-01 set for density determination. Refractive indices were measured on a RHG-181 gem refractometer using diiodomethane as contact liquid.
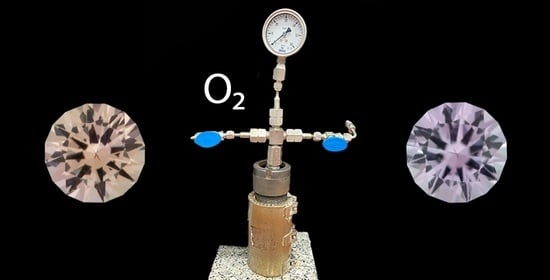
Heat treatment was performed either in a Simon–Mueller oven with the samples embedded in activated charcoal, or in a steel autoclave that was pressurized to 30 bar with pure oxygen. Heating rates were 2 °C min−1 up to the final temperature, holding for 30 min and then cooling with again 2 °C min−1.
Elemental concentrations were measured by Laser ablation—inductively coupled plasma mass spectrometry (LA-ICP-MS) using a Cetac LSX-213 G2+ laser ablation system (Teledyne Cetac Technologies, Omaha, NE, USA) connected to a Thermo Fisher Scientific X-Series II ICP MS system (Thermo Fisher Scientific, Waltham, MA, USA). Tuning and calibration were carried out using NIST 610, 612, and 614 glass standards to maximize signal intensity while minimizing oxide ratios; reference values were taken from Jochum et al. [28]. 29Si was used as an internal standard and all samples corrected to a value of 18.5%. The laser ablation was operated with a 100 µm spot size, a laser fluence of 9.2 J cm−2, and a repetition rate of 10 Hz. 230 shots were made on each spot and the ablated products transferred to the ICP-MS with flow rates of two times 600 mL.min−1 He gas. Each sample was measured at three different spots. All concentrations are given in ppmw.
UV-Vis-NIR spectra were collected on a Shimadzu UV-3600i plus spectrometer (Shimadzu, Tokyo, Japan) equipped with a multi-purpose large sample compartment MPC-603A containing an integrating sphere, polarizing filter, and an accessory to measure small samples (~2 mm beam diameter). Spectra were measured from 240 to 1600 nm with a slit width of 20 nm, data interval of 2 nm, and the scan rate set to high (70 s per spectrum). Rough samples were oriented along crystallographic faces if present, otherwise a polarized computer screen was used to get the best possible separation of color axes. Optical pathlengths could not be determined as most samples had a rough surface that prohibited exact measurement. Cut gems were measured from the culet in the direction of the table to minimize reflections due to cutting and also oriented with a PC screen to separate the color axes as good as possible. Quantitative color description has been done using the L*a*b color space tool of the Shimadzu LabSolutions UV-Vis software (Vers. 1.11).
3. Results and Discussion
3.1. Chemical Composition of Pink Zoisites
Standard gemological properties have been determined for one natural pink zoisite, one unheated piece of rough (polished on three sides), two oxygen-treated pink, and one conventionally-heated blue gemstone. Refractive indices were measured on the table by rotating the samples 5–6 times; the values presented in Table 2 are the ranges observed for the lower reading (1) and the higher reading (2). Recording of RIs along the three crystallographic axes was not possible as the gems have not been oriented along those axes to yield the best possible optical performance. All stones are doubly refractive and the refractive index values are in good agreement with literature data, although a bit on the lower end [6,29]. Densities with about 3.18 g cm−3 are lower than the 3.35 g cm−3 typically reported for tanzanite [6,30] but in good agreement with the range of 3.15–3.35 cm−3 listed for zoisite [31] or the theoretical value of 3.09 g cm−3 [32]. All values are listed in Table 2.
In the first step of this study, the chemistry of pink, pinkish, and orangey zoisite crystals or cutting rough was determined by LA-ICP-MS. The data presented in Table 3 are selected from a larger dataset and include 1 pinkish red sample, 7 pink, 2 orangey pinks, 4 orange, and 2 purple ones. The manganese concentration of the measured samples lies between 60 and 1000 ppm with the majority ranging between 150 and 300 ppm. Whereas as a rule of thumb it can be said that the concentration of manganese correlates with the saturation of the pink color component, no general deduction of the color is possible from this value alone. As can be seen from the two purplish samples 6 and 7, which both have very high Mn levels, a high level of vanadium always results in a blue color component. In general, the vanadium values for the tested stones are between 50 and 1400 ppm, with the purest pinks having concentrations below 150 ppm and purplish and orange stones having the highest concentrations. Magnesium does not have any known influence on color, its concentrations are widespread between below 100 and 3000 ppm. Iron does also not seem to play an important role in the coloring mechanism; its overall concentrations range from 40 up to 2400 ppm with some samples of similar pink color having levels of 40–850 ppm. Chromium concentrations are generally very low, from below 1 ppm up to 100 ppm; the highest values are found in the samples that are orange. Finally, titanium, which in preliminary studies as well as literature [12] has been found to correlate with a UV-Vis band that results in a yellow to brown color, has been found in levels from 30 to 360 ppm.
3.2. UV-Vis-NIR Spectroscopy
The UV-Vis spectra of an untreated, natural piece of gem-quality pink zoisite (entry 4 in Table 3) are seen in Figure 3. Upon visual inspection, this piece, like most of the pure pinks, seems to be dichroic, displaying a pink and a yellowish color. The spectrum of the pink orientation shows a distinct band at 530 nm, which has been assigned to Mn(III) [9], and a strong absorption in the UV range below 400 nm. In the yellow direction, the 530 nm band is considerably smaller and an absorption centering at around 420 nm is present.
Orange is also amongst the rarer colors for zoisite as it requires a lack of blue components (vanadium) and a good ratio of pink/red and yellow. Stones that can be cut into orange gems are typically of lower saturation and their trichroic colors are pink or purplish pink, yellow, and a faint blue or purple. Olivier has described orange zoisite to be rich in rare earth elements (REEs) and lists concentrations of 2300–12,000 ppm [12], which is in good agreement with the values of 2800–20,500 ppm (average 10,800 ppm for entrees 8, 9 and 10 in Table 2, data available upon request) found in this study. He attributes the absorption bands to neodymium (Nd3+): 520–535, 575–585, 745–750, and 795–805 nm, and in part titanium (Ti3+): 465 nm.
The gemmy piece described here (entry 2 in Table 2) has a vanadium concentration of 500–600 ppm, 60–75 ppm Ti, 13 ppm Cr, and 200 ppm Mn. Iron is with 360 ppm in the higher range, but maximum values are above 2000 ppm, as mentioned above. The UV-Vis-NIR spectra displayed in Figure 4 show that the major difference to the spectra of a pink zoisite is the dominance of the 445 nm band causing the stone to look yellow in one direction. The contribution of vanadium is seen in the two broad bands centered at 600 and 765 nm with a shoulder at 530 nm [12,17,18]. Figure 5 shows the isolated colors as the gem is rotated in front of a polarized light source, in this case a computer screen. Pink and yellow are rather saturated, the blue color is only faint.
3.3. Heat Treatment of Orange Zoisite
In contrast to conventional heating processes, where the rough or cut stones are embedded in clay, jewelry-casting investment powder or carbon black and heated to temperatures of 500–600 °C under ambient atmosphere, we heated material that has a pinkish color component in an autoclave under a pressure of 30 to 40 bar of pure oxygen. Heating was carried out with 2 °C min−1 up to 500 °C, and after keeping this temperature for 30 minutes, the autoclave was cooled down with a maximum temperature rate of again 2 °C min−1. Under these conditions the manganese remained in the 3+ oxidation state, thus the pink color (band at 530 nm) was preserved. The 445 nm band on the other hand was still removed by this treatment, resulting in an overall color change of the gem from orange to a slightly purplish pink (Figure 6). Figure 7 shows again the isolated colors as the treated gem is rotated in front of a polarized light source. Pink remains rather saturated; the blue color is also almost unchanged but the yellow is converted into almost colorless. Depending on the intensity of the blue axis, which also remains unchanged, stones that are treated with this process can show pink to pinkish purple colors.
The color change becomes very obvious when the visible spectra are analyzed using the CIELAB or L*a*b color space. In the L*a*b system the a-axis describes green (negative values) to red (positive values) color, the b-axis blue (negative values) to yellow (positive values) color, and the L value more or less describes the lightness. In order to enable a two-dimensionalview, the three-dimensional color space is sliced at a fixed L value, in our case, if not stated otherwise, 50.
In Figure 8, the values of the a and b components are displayed and the change due to heating is indicated by arrows. Whereas the blue and pink points remain relatively constant, the biggest change is seen in the yellow component. The a and b values change from 10 and 70 to almost 0 and 0, while the L value is also lowered from 74 to 44 (thus the starting point is outside the color frame in the large graph; the insert shows its position with the original L value).
When heating such zoisites in the conventional way, either embedded in clay, jewelry-casting investment powder, or carbon black to temperatures of 500−600 °C, the yellow as well as the pink color component are lost, and the material turns a light purplish blue color (Figure 9).
To further investigate especially the temperature dependence of this process, several pieces of zoisite that contained a pink color component were subjected to various treatments. All pieces seemed to originate from the same crystal and displayed a greenish orange color, one having a greenish orange rim and a reddish pink core; two of the pieces are listed in Table 1 as samples 8 and 9. A first heating step was done at 430 °C (max oxygen pressure of 40 bar in all experiments), causing outer rims to turn a more green color while the core remained unchanged; a second treatment at 460 °C resulted in the rim to turn light blue with practically no yellow left, while the core still remained unchanged (Figure 10).
The second piece was subjected to the same treatment steps as mentioned above but further heated without pressure in the ambient atmosphere, embedded in charcoal to 500 °C and in a final step to 550 °C. The stone turned a purplish blue of medium saturation-the pink was no longer visible without the use of a polarizer. UV-Vis-NIR spectra show a complete vanishing of the 455 nm band as well as a drop in absorption between 340 and 350 nm leaving an isolated band at 384 nm behind (Figure 11). After heating to 550 °C, a further decrease in the deep UV region could be seen, allowing a band at 294 nm to stand out. The resulting spectrum is very similar to those of standard blue tanzanites.
Figure 11 and Figure 12 show the UV-Vis-NIR spectra of the untreated stone and after each treatment step, once with the polarization filter set to isolate the yellow axis (indicated by a maximum absorbance at 1600 nm), and once at a 90° angle to isolate the pink color. The first (yellow direction) spectra all have a band system in common that is dominated by two broad bands, one centered at 770 nm and the other around 630 nm. Those remain unchanged during the treatment and contribute to the bluish color component which is also very prominent in blue tanzanites. The band at 445 nm, which is the main reason for the yellow coloration, is gradually removed by this treatment and correlated more or less with the temperature, independent of atmosphere or pressure. While the absorption in the UV region remains rather unchanged during the heat treatment under oxygen atmosphere at elevated pressures, a transmission window is formed upon conventional heating to 500 and 550 °C in the region of 330-350 nm and thus an absorption band at 380 nm (Figure 11).
When looking at the spectra recorded in the pink direction the band at 520 nm can clearly be seen in the untreated sample. During the first 3 treatment steps this band remains rather constant, while after heating to 550 in ambient atmosphere the band seems to be reduced and the side band at 580 nm is strongly increased. As long as the sample is untreated or treated with pressurized oxygen there is a UV absorption continuum starting at roughly 400 nm. When further heating to 500 °C in ambient atmosphere this absorption is shifted towards the UV by 50 nm and upon heating to 550 °C the absorption in the UV region is generally lowered giving rise to two new bands centered at 375 and 300 nm (Figure 12).
A clearer picture can again be obtained using the L*a*b presentation, which shows in the yellow direction an almost linear decrease in the b value from 50 to 0, whereas in the a value, a change of anyway only 10 to 0 is observed (Figure 13a). Looking at the pink direction, things are more complicated. The b value goes down to about 0 during the oxygen treatment, and when further heated to 500 and 550 °C, respectively, the value goes to −10, which indicates a blue instead of a yellow color component. The a value is at first less affected by the various treatment steps, but the final heating to 550 °C in ambient atmosphere results in a distinct lowering of this parameter and thus a loss of pink color as can be seen in Figure 13b.
3.4. Detection of the Treatment
The detection of treatments of gemstones is of particular interest as it may have a large influence on their value. In this particular case it is not easily possible to distinguish between treated and untreated gems as the temperature used in the process is rather low which means that typical inclusions, that are scarce in gem-quality zoisite anyway, are not altered or only marginally altered in the process [33]. Liquid hydrogen sulfide or mercaptane inclusions have been reported to be possibly indicative of a heat treatment above 600 °C at ambient pressure but have not been considered in the course of this work [34,35,36].
This can be compared, for example, to the heat treatment of sapphires [37,38]. While conventional treatment is done at temperatures above 1500 °C, leading to alteration of inclusions or cracks in the host sapphire due to the higher thermal expansion coefficient of the inclusion, more recent treatments at temperatures of around 800 °C (so called low-heat treatments) also do not alter the inclusion scenery and thus pose a problem in terms of identification of the treatment [39].
While most natural pure pink zoisites have rather low levels of color-relevant trace elements with the exception of manganese (70–1000 ppm), those that have been treated to improve their color started out with titanium concentrations that are on the higher side. Unfortunately, some natural pinks do also show titanium levels that have to be considered high. However, those latter stones do also have higher concentrations of vanadium, which masks the yellow color components and gives the material an overall bluish-pink to purple tint. When combining this knowledge with interpretation of the UV-Vis-NIR spectra, in some cases the treatment becomes obvious, e.g., material having a high titanium concentration and not showing a 445 nm band should be considered suspicious. Another indication is the reduced absorption in the UV region; however, this effect is most pronounced in conventional heat treatment and at temperatures above 500 °C. Overall, it has to be admitted that the number of treated samples is still not high enough to enable a statistically significant statement on which absolute values are indicative for this novel treatment procedure.
FTIR and Raman spectra also remain unchanged (data not shown), so the best indication for this treatment so far is a two-step combination of UV-Vis-NIR spectroscopy and determination of trace elements:
Step 1: determination of trace elements, especially Ti, V, and Mn.
Step 2: measuring polarized UV-Vis-NIR spectra and checking for the 445 nm band in the direction of the c-axis (indicated by an intense absorption at 1600 nm).
If titanium is present but no 445 nm band, the chances are very high that the zoisite has been treated.
4. Conclusions
It has been shown that zoisites that do have a pink and yellow color component can be treated to remove the yellow whilst maintaining the pink color. If the blue color component is not too dominant, such stones will end up being pink to purplish pink. In order to achieve such a color change, it is necessary to perform the heat treatment in an oxygen atmosphere under elevated pressure, e.g., 30–40 bar. The temperatures can be adjusted depending on the type of material used–best results have been obtained between 430 and 500 °C. The chemical effect of this treatment is that the coloring element manganese remains in its 3+ oxidation state, whereas under conventional heating conditions, it is reduced to Mn2+. Detection of such a treatment is not easy and currently, a combination of trace element distribution together with UV-Vis-NIR spectroscopy seems to be most promising, although more data have to be acquired in order to provide statistically relevant results.
In order to further investigate the reason for color in zoisite techniques such as EPR, luminescence spectroscopy and crystallographic studies might help shed some light onto still controversially discussed topics. The contribution of theoretical predictions must also not be underestimated but what has proven to be most important is the collection of a representative sample library, which allows to determine statistically relevant data.
Funding
This research received no external funding.
Data Availability Statement
Data are contained within the article.
Acknowledgments
The author is grateful to Steve Ulatowski for providing samples and many discussions on the topic.
Conflicts of Interest
The author declares no conflict of interest.
References
- Zoisite. Available online: https://www.mindat.org/min-4430.html (accessed on 20 October 2022).
- Von Radics, P. Zois von Edelstein, Siegmund. In Allgemeine Deutsche Biographie (ADB); Duncker & Humblot: Leipzig, Germany, 1900; Volume 45, pp. 403–406. [Google Scholar]
- Thulite. Available online: https://www.mindat.org/min-3955.html (accessed on 20 October 2022).
- Game, P.M. Zoisite-amphibolite with corundum from Tanganyika. Miner. Mag. J. Miner. Soc. 1954, 30, 458–466. [Google Scholar] [CrossRef]
- Bruce, G.A. Zoisite, a new gem discovery. Rocks Miner. 1968, 43, 332–334. [Google Scholar] [CrossRef]
- Hurlbut, C.S. Gem Zoisite from Tanzania. Am. Miner. 1969, 54, 702–709. [Google Scholar]
- Bank, H.; Berdesinski, W.; Nuber, B. Strontiumhaltiger trichroitischer. Z. Dtsch. Ges. Für Edelsteinkd. 1967, 61, 27–29. [Google Scholar]
- Wilson, W.E.; Saul, J.M.; Pardieu, V.; Hughes, R.W. The Merelani Tanzanite Mines. Miner. Rec. 2009, 40, 347–408. [Google Scholar]
- Liddicoat, R.T.; Crowningshield, G.R. More about zoisite. Lapid. J. 1968, 22, 736–740. [Google Scholar]
- Cairncross, B. Connoisseur´s Choice: Tanzanite, Gem Variety of Zoisite, Merelani Hills, Simanjiro District, Manyara Region, Tanzania. Rocks Miner. 2019, 94, 530–539. [Google Scholar] [CrossRef]
- Cairncross, B. The Where of Mineral Names: Tanzanite, A Variety of Zoisite, Merelani Hills, Simanjiro District, Manyara Region, Tanzania. Rocks Miner. 2020, 95, 48–462. [Google Scholar] [CrossRef]
- Olivier, B. The Geology and Petrology of the Merelani Tanzanite Deposits, NE Tanzania. Ph.D. Thesis, University of Stellenbosch, Stellenbosch, South Africa, 2006. [Google Scholar]
- Blauwet, D. Alchuri Shigar Valley, Northern Areas, Pakistan. Miner. Rec. 2006, 37, 513–540. [Google Scholar]
- Beaton, D.; Lu, R. Zoisite from Afghanistan. Gems Gemol. 2009, 45, 70. [Google Scholar]
- Ulatowski, S.; 14923 Rattlesnake Rd., Grass Valley, CA 95945, USA. Personal communication, 2022.
- Smith, C.P. Natural-color tanzanite. Gems Gemol. 2011, 47, 119–120. [Google Scholar]
- Faye, G.H.; Nickel, E.H. On the pleochroism of vanadium-bearing zoisite from Tanzania. Canad. Miner. 1971, 10, 812–821. [Google Scholar]
- Koziarska, B.; Godlewski, M.; Suchocki, A. Optical properties of zoisite. Phys. Rev. B 1994, 50, 12297–12300. [Google Scholar] [CrossRef] [PubMed]
- Javier-Ccallata, H.; Watanabe, S. Crystal field effect on EPR and optical absorption properties of natural green zoisite. Spectrochim. Acta A Mol. Biomol. Spectr. 2013, 104, 505–511. [Google Scholar] [CrossRef]
- Langer, K.; Tillmanns, E.; Kersten, M.; Almen, H.; Arni, R.K. The crystal chemistry of Mn3+ in the clino- and orthozoisite structure types, Ca2M33+[OH|O|SiO4|Si2O7]: A structural and spectroscopic study of some natural piemontites and “thulites” and their synthetic equivalents. Z. Kristallogr. 2002, 217, 563–580. [Google Scholar] [CrossRef]
- Zoisite Visible Spectra (400–1000 nm). Available online: http://minerals.gps.caltech.edu/FILES/Visible/zoisite/Index.html (accessed on 3 November 2022).
- Hainschwang, T.; Notari, F. Zoisite – More than just Tanzanite. InColor 2012, 19, 44–49. [Google Scholar]
- Pink Zoisite var. Thulite from Tanzania Reaching almost the Carat. Available online: https://www.spec4gem.info/reports/8-reports/313-pink-zoisite-var-thulite-from-tanzania-of-almost-a-carat.html (accessed on 13 January 2022).
- Fritsch, E.; Rossman, G.R. An update on color in gems. Part 1: Introduction and colors caused by dispersed metal ions. Gems Gemol. 1987, 23, 126–139. [Google Scholar] [CrossRef] [Green Version]
- Thulite. Available online: https://en.wikipedia.org/wiki/Thulite (accessed on 20 October 2022).
- Thongnopkun, P.; Chanwanitsakun, P. Effect of heat treatment on spectroscopic properties of tanzanite. J. Phys. Conf. Ser. 2018, 1144, 012183. [Google Scholar] [CrossRef]
- Pluthmetwisute, T.; Wanthanachaisaeng, B.; Saiyasombat, C.; Sutthirat, C. Cause of Color modification in Tanzanite after Heat Treatment. Molecules 2020, 25, 3743. [Google Scholar] [CrossRef]
- Jochum, K.P.; Weis, U.; Stoll, B.; Kuzmin, D.; Yang, Q.; Raczek, I.; Jacob, D.E.; Stracke, A.; Birbaum, K.; Frick, D.A.; et al. Determination of reference values for NIST SRM 610–617 glasses following ISO guidelines. Geostand. Geoanal. Res. 2011, 35, 397–429. [Google Scholar] [CrossRef]
- Bocchio, R.; Adamo, I.; Bordoni, V.; Caucia, F.; Diella, V. Gem-quality zoisite from Merelani (Northeastern Tanzania): Review and new data. Period. Mineral 2012, 81, 379–391. [Google Scholar]
- Dominy, G.M. Handbook of Gemmology; Amazonas Gem Publications: Palma de Mallorca, Spain, 2018; Volume 1, Appendix A. [Google Scholar]
- IGS: Specific Gravity Values of Selected Gems. Available online: https://www.gemsociety.org/article/select-gems-ordered-density/ (accessed on 8 November 2022).
- Moore, P.B. Cell data of orientate and its relation to ardennite and zoisite. Canad. Miner. 1964, 8, 262–265. [Google Scholar]
- Yang, S.; Ye, H.; Liu, Y. The Different Inclusions’ Characteristics between Natural and Heat-Treated Tanzanite: Evidence from Raman Spectroscopy. Crystals 2021, 11, 1302. [Google Scholar] [CrossRef]
- Rankin, A.; Taylor, D.; Treloar, P. Mercaptans in Tanzanite from Merelani, Tanzania—A New Type of Stinkstone? J. Gemmol. 2014, 34, 11–13. [Google Scholar]
- Taylor, D.; Rankin, A.H.; Treloar, P.J. Liquid hydrogen sulphide (H2S) fluid inclusions in unheated tanzanites (zoisite) from Merelani, Tanzania: Part 1. Recognition, characterization and gemmological importance. J. Gemmol. 2013, 33, 149–159. [Google Scholar] [CrossRef]
- Rankin, A.H.; Taylor, D.; Treloar, P.J. Liquid hydrogen sulphide (H2S) fluid inclusions in unheated tanzanites (zoisite) from Merelani, Tanzania: Part 2. Influence on gem integrity during and after heat treatment. J. Gemmol. 2013, 33, 161–169. [Google Scholar] [CrossRef]
- Crowningshield, R.; Nassau, K. The heat and diffusion treatment of natural and synthetic sapphires. J. Gemmol. 1981, 17, 528–541. [Google Scholar] [CrossRef] [Green Version]
- Themelis, T. The Heat Treatment of Ruby and Sapphire; Ted Themelis: Bangkok, Thailand, 2018; Volume 1. [Google Scholar]
- Saeseaw, S.; Khowpong, C.; Vertriest, W. Low-temperature heat treatment of pink sapphires from Ilakaka, Madagascar. Gems Gemol. 2020, 56, 448–457. [Google Scholar] [CrossRef]
Figure 1.
Natural pink zoisite crystals with orange, purple, or no secondary color. Those samples from Merelani, Tanzania, were not part of the study and measure 25 mm × 25 mm × 9 mm, 18 mm × 11 mm × 7 mm, and 36 mm × 10 mm × 7 mm.
Figure 1.
Natural pink zoisite crystals with orange, purple, or no secondary color. Those samples from Merelani, Tanzania, were not part of the study and measure 25 mm × 25 mm × 9 mm, 18 mm × 11 mm × 7 mm, and 36 mm × 10 mm × 7 mm.

Figure 2.
Photo of the samples described in Table 1, samples 1 to 8 top row from left to right, samples 9 to 16 bottom row left to right; samples 2 and 16 have been heat treated under pressure with oxygen at 460 °C, sample 11 at 500 °C; samples 1 and 7 have been heat treated in charcoal and ambient atmosphere at 550 °C.

Figure 3.
UV-Vis-NIR spectra of a 1.55 ct untreated, naturally pink zoisite (sample 4) along the three axis and a photo of the zoisite.
Figure 3.
UV-Vis-NIR spectra of a 1.55 ct untreated, naturally pink zoisite (sample 4) along the three axis and a photo of the zoisite.

Figure 4.
UV-Vis-NIR spectra of a 0.67 ct orange zoisite (sample 2) along the three axes and a photo of the gem.
Figure 4.
UV-Vis-NIR spectra of a 0.67 ct orange zoisite (sample 2) along the three axes and a photo of the gem.

Figure 5.
Individual colors of the 0.67 ct orange gem (sample 2) viewed with a polarized light source.
Figure 5.
Individual colors of the 0.67 ct orange gem (sample 2) viewed with a polarized light source.

Figure 6.
UV-Vis-NIR spectra of a 0.67 ct orange zoisite (sample 2) after heat treatment with oxygen under pressure along the three axes and a photo of the treated gem.
Figure 6.
UV-Vis-NIR spectra of a 0.67 ct orange zoisite (sample 2) after heat treatment with oxygen under pressure along the three axes and a photo of the treated gem.

Figure 7.
Individual colors of the 0.67 ct orange gem (sample 2) after heat treatment with oxygen under pressure viewed with a polarized light source.
Figure 7.
Individual colors of the 0.67 ct orange gem (sample 2) after heat treatment with oxygen under pressure viewed with a polarized light source.

Figure 8.
L*a*b coordinates of the orange zoisite before and after heat treatment under oxygen atmosphere. The arrows indicate the change in a and b values, the small insert shows the original starting point of the yellow color component at correct L value of 74.
Figure 8.
L*a*b coordinates of the orange zoisite before and after heat treatment under oxygen atmosphere. The arrows indicate the change in a and b values, the small insert shows the original starting point of the yellow color component at correct L value of 74.

Figure 9.
From left to right: untreated orange zoisite; bicolor sample treated at 430 and subsequently 460 °C under pressure with oxygen; sample treated at 430 and 460 °C under pressure with oxygen and subsequently at 500 and 550 °C in ambient atmosphere; sample treated directly at 550 °C in ambient atmosphere. All samples are parts of the same crystal with two fragments listed as samples 8 and 9 in Table 1.

Figure 10.
6.22 g bicolor zoisite with reddish core without treatment and after oxygen treatment at 430 and 460 °C; photos taken with polarized light to select the pink color direction. Parts of the same crystal are listed as samples 8 and 9 in Table 1.
Figure 10.
6.22 g bicolor zoisite with reddish core without treatment and after oxygen treatment at 430 and 460 °C; photos taken with polarized light to select the pink color direction. Parts of the same crystal are listed as samples 8 and 9 in Table 1.

Figure 11.
UV Vis spectra of the greenish-orange rough before treatment (orange), after 430 °C in oxygen (blue), 460 °C in oxygen (green), 500 °C in charcoal (red) and 550 °C in charcoal (purple). Polarization parallel to yellow.
Figure 11.
UV Vis spectra of the greenish-orange rough before treatment (orange), after 430 °C in oxygen (blue), 460 °C in oxygen (green), 500 °C in charcoal (red) and 550 °C in charcoal (purple). Polarization parallel to yellow.

Figure 12.
UV Vis spectra of the greenish-orange rough before treatment (orange), after 430 °C in oxygen (blue), 460 °C in oxygen (green), 500 °C in charcoal (red) and 550 °C in charcoal (purple). Polarization parallel to pink.
Figure 12.
UV Vis spectra of the greenish-orange rough before treatment (orange), after 430 °C in oxygen (blue), 460 °C in oxygen (green), 500 °C in charcoal (red) and 550 °C in charcoal (purple). Polarization parallel to pink.

Figure 13.
Change of color in the (a) yellow and (b) pink axis in L*a*b coordinates during the treatment steps.
Figure 13.
Change of color in the (a) yellow and (b) pink axis in L*a*b coordinates during the treatment steps.


Table 1.
Description of samples used for chemical analysis.
| Sample | Color | Weight/ct | Dimensions/mm |
|---|---|---|---|
| 1 | pinkish purple | 0.81 | 5.5 × 4.4 × 4.4 |
| 2 | orange | 0.67 (1.95) * | 4.4 × 4.4 × 3.7 |
| 3 | orangey pink | 0.4 (1.34) | 4.3 × 4.3 × 2.4 |
| 4 | pink | 1.56 | 7 × 5.6 × 4.4 |
| 5 | purplish pink | 0.83 | 8.6 × 4.8 × 2.7 |
| 6 | purplish pink | 2.05 | 8.6 × 6.8 × 5.1 |
| 7 | bluish purple | 0.92 | 7.1 × 4.9 × 4.1 |
| 8 | orange | 3.56 | 11 × 6.5 × 5.6 |
| 9 | orange | 1.05 | 7.5 × 4.4 × 4.5 |
| 10 | orange | 3.63 | 12.6 × 5.9 × 5.8 |
| 11 | pink | 3.44 | 10.4 × 7.9 × 3.6 |
| 12 | red | 6.71 | 14.4 × 10.1 × 7 |
| 13 | pink | 8.44 | 17.9 × 7.9 × 6.5 |
| 14 | pink | 1.79 (3.2) | 10.1 × 6.2 × 3.9 |
| 15 | pink | 6.55 | 13 × 11.6 × 5.1 |
| 16 | orangey pink | 0.59 (1.97) | 5 (diameter) × 3.4 |
* Values in brackets are before cutting.
Table 2.
Standard gemological properties.
| Color | Treatment | Weight | RI Range 1 | RI Range 2 | Double Refractive | Density/g cm−3 |
|---|---|---|---|---|---|---|
| pink | none | 1.79 ct | 1.680–1.700 | 1.690–1.705 | + | 3.179 |
| orange | none | 19.02 ct | 1.688–1.690 | 1.683–1.698 | + | 3.192 |
| pink | O2-heated | 3.30 ct | 1.685–1.694 | 1.690–1.700 | + | 3.208 |
| pink | O2-heated | 0.67 ct | 1.675–1.690 | 1.680–1.696 | + | 3.122 |
| blue | standard heated | 7.75 ct | 1.672–1.698 | 1.680–1.702 | + | 3.172 |
Table 3.
Color and concentration of trace elements in ppmw of the zoisite samples.
| Sample | 24Mg | 47Ti | 51V | 52Cr | 55Mn | 56Fe |
|---|---|---|---|---|---|---|
| 1 | 1913.9 | 217.9 | 706.7 | 29.7 | 280.9 | 238.0 |
| 1 | 1996.9 | 267.4 | 689.8 | 29.6 | 282.4 | 238.1 |
| 1 | 1914.6 | 225.9 | 709.2 | 27.5 | 268.5 | 229.4 |
| 2 | 199.7 | 59.5 | 530.0 | 13.4 | 197.1 | 356.9 |
| 2 | 183.3 | 74.6 | 507.9 | 12.1 | 191.1 | 355.3 |
| 2 | 192.8 | 61.6 | 685.4 | 14.0 | 210.2 | 382.6 |
| 3 | 166.2 | 42.6 | 543.3 | 3.4 | 307.9 | 2441.6 |
| 3 | 194.2 | 37.7 | 484.4 | 2.9 | 286.8 | 2218.8 |
| 3 | 207.7 | 41.4 | 485.9 | 2.6 | 300.6 | 2265.0 |
| 4 | 280.4 | 18.3 | 125.0 | 0.6 | 69.3 | 36.3 |
| 4 | 225.3 | 44.6 | 132.5 | 0.8 | 66.1 | 36.4 |
| 4 | 227.7 | 6.9 | 107.1 | 1.3 | 77.5 | 65.3 |
| 5 | 117.9 | 55.5 | 246.9 | 9.4 | 206.8 | 310.8 |
| 5 | 114.0 | 72.7 | 312.4 | 9.0 | 181.5 | 0.01 |
| 5 | 97.6 | 73.9 | 321.2 | 7.0 | 187.7 | 272.1 |
| 6 | 103.3 | 28.6 | 1150.5 | 8.5 | 427.9 | 1955.6 |
| 6 | 108.5 | 34.6 | 1420.0 | 11.1 | 350.1 | 1464.2 |
| 6 | 93.9 | 38.3 | 1218.9 | 9.8 | 404.2 | 1869.6 |
| 7 | 97.5 | 39.2 | 737.0 | 8.3 | 214.4 | 1514.1 |
| 7 | 152.0 | 45.8 | 743.5 | 8.4 | 313.5 | 1502.3 |
| 7 | 106.8 | 45.7 | 795.6 | 9.6 | 261.7 | 1637.1 |
| 8 | 1820.2 | 151.4 | 1032.0 | 85.4 | 183.0 | 325.1 |
| 8 | 3082.6 | 117.6 | 687.1 | 53.5 | 237.2 | 434.7 |
| 8 | 2679.3 | 130.1 | 739.6 | 61.5 | 230.5 | 400.6 |
| 8 | 851.2 | 171.8 | 1184.5 | 105.6 | 115.8 | 184.2 |
| 8 | 1555.2 | 120.3 | 920.7 | 83.8 | 154.4 | 267.4 |
| 8 | 2964.8 | 138.5 | 713.4 | 56.1 | 243.8 | 452.6 |
| 8 | 1206.0 | 149.5 | 1010.0 | 87.5 | 127.8 | 226.3 |
| 9 | 461.0 | 136.1 | 455.5 | 25.6 | 68.6 | 39.6 |
| 9 | 621.6 | 118.4 | 496.5 | 25.6 | 83.2 | 2309.4 |
| 9 | 726.6 | 128.9 | 513.3 | 30.8 | 105.0 | 66.4 |
| 10 | 1424.8 | 148.0 | 487.4 | 26.2 | 187.8 | 130.6 |
| 10 | 1356.3 | 154.9 | 463.3 | 23.3 | 176.0 | 118.1 |
| 10 | 1393.5 | 145.8 | 499.3 | 29.3 | 185.4 | 159.4 |
| 11 | 2154.2 | 191.9 | 489.2 | 21.7 | 272.5 | 166.2 |
| 11 | 2617.2 | 2.2 | 498.3 | 43.4 | 283.0 | 304.1 |
| 11 | 2283.5 | 200.1 | 480.8 | 21.1 | 293.4 | 202.7 |
| 12 | 1779.4 | 241.3 | 477.2 | 25.6 | 249.9 | 135.1 |
| 12 | 1873.1 | 253.9 | 476.7 | 23.9 | 260.1 | 161.3 |
| 12 | 1648.2 | 213.7 | 439.1 | 22.3 | 229.6 | 142.9 |
| 13 | 857.1 | 28.1 | 64.8 | 0.01 | 929.1 | 885.9 |
| 13 | 959.4 | 61.8 | 107.2 | 77.0 | 835.2 | 821.9 |
| 13 | 910.3 | 85.2 | 78.9 | 0.3 | 844.8 | 851.1 |
| 14 | 65.6 | 172.3 | 124.2 | 8.2 | 96.7 | 75.6 |
| 14 | 95.4 | 213.7 | 132.6 | 9.0 | 104.4 | 80.5 |
| 14 | 83.0 | 208.7 | 121.2 | 8.6 | 95.6 | 82.7 |
| 15 | 408.6 | 82.9 | 58.2 | 0.1 | 1067.1 | 811.0 |
| 15 | 354.6 | 58.6 | 51.9 | 0.1 | 938.0 | 681.4 |
| 15 | 388.6 | 68.8 | 61.3 | 0.4 | 1052.1 | 783.0 |
| 16 | 630.3 | 363.5 | 636.6 | 37.0 | 69.8 | 83.2 |
| 16 | 545.0 | 337.6 | 591.7 | 35.7 | 60.4 | 83.8 |
| 16 | 562.3 | 365.5 | 674.5 | 37.0 | 69.9 | 91.0 |
Publisher’s Note: MDPI stays neutral with regard to jurisdictional claims in published maps and institutional affiliations. |
© 2022 by the author. Licensee MDPI, Basel, Switzerland. This article is an open access article distributed under the terms and conditions of the Creative Commons Attribution (CC BY) license (https://creativecommons.org/licenses/by/4.0/).
Share and Cite
MDPI and ACS Style
Schwarzinger, C. The Heat Treatment of Pink Zoisite. Minerals 2022, 12, 1472. https://doi.org/10.3390/min12111472
AMA Style
Schwarzinger C. The Heat Treatment of Pink Zoisite. Minerals. 2022; 12(11):1472. https://doi.org/10.3390/min12111472
Chicago/Turabian StyleSchwarzinger, Clemens. 2022. "The Heat Treatment of Pink Zoisite" Minerals 12, no. 11: 1472. https://doi.org/10.3390/min12111472
Note that from the first issue of 2016, this journal uses article numbers instead of page numbers. See further details here.