
Correlation between Compressive Strength and Heat of Hydration of Cement Mortars with Siliceous Fly Ash

Department of Mechanics of Materials and Structures, Faculty of Civil and Environmental Engineering, Gdansk University of Technology, Narutowicza 11/12, 80–233 Gdansk, Poland
Minerals 2022, 12(11), 1471; https://doi.org/10.3390/min12111471
Submission received: 17 October 2022
/
Revised: 15 November 2022
/
Accepted: 18 November 2022
/
Published: 20 November 2022
Abstract
:This paper presents the results of calorimetric and strength tests of mortars with ordinary Portland cement and two substitution rates (10 and 20%) of cement by siliceous fly ash. The prepared samples were cured under isothermal conditions at four different temperatures: 23, 33, 43 and 53 °C. Heat of hydration was measured using an isothermal calorimeter dedicated to monitor the hydration process of cementitious composites such as paste, mortar and concrete. Thermal data were recorded continuously for 7 days, while compression tests were performed at 6 h and 1, 2, 5, 7 and 14 days of hardening. The studies proved that the amount of heat released correlates with the early-age strength of 50 mm mortar cubes. In the case of samples cured at 23 and 53 °C, a linear relationship between the heat of hydration and compressive strength was observed. The high value of the coefficient of determination (R2) allows one to estimate the mortar compressive strength after 7 and 14 days based on hydration heat tests conducted at standard temperature (23 °C), regardless of the percentage of siliceous fly ash. The increased curing temperatures do not guarantee a high correlation between compressive strength and the amount of heat released.
1. Introduction
Calorimetric tests give the possibility to monitor the reaction process, which provides information on the reaction kinetics of cementitious composites. The standards EN 196-9 [1] and EN 196-8 [2] describe in detail two procedures for determining the heat of hydration of cement materials by the semi-adiabatic and solution method. In turn, ASTM C1679 [3], ASTM C1702 [4], and EN 196-11 [5] standards allow for precise measurements of the rate and amount of heat released for cement composites using isothermal tests. The mentioned standards [3,4,5] define the scope of application of isothermal calorimetric tests and discuss their methodology. The curves of hydration evolution identify the characteristic periods of increasing and delaying of the reaction rate [6]. The curing temperature has a direct influence on the development of mechanical properties of cement composites. The basic methods for determination the strength of hardened concrete or mortar are destructive tests. Commonly, compression tests are carried out after 28 days in order to determine the concrete class. Currently, engineers need information on early-age strength (at 2 or 7 days) of building materials in order to shorten the construction schedule [7]. Additionally, cement producers are interested in the quality of the produced material and require results after one day of hydration, as later results come too late to prevent substandard cement from leaving the plant [8]. Measuring the heat of hydration is also useful for concrete applications, especially for massive structures where the heat measurements can be used to predict the concrete temperature evolution over time and the risk of thermal cracking [8].
The composition of mixture, the content of mineral additions and curing conditions strongly affect the mechanical and thermal properties of cementitious materials [9,10,11,12,13,14]. Calorimetric tests monitor the endothermic cement hydration process, while the cement reaction process leads to strength development. It allows one to use heat measurements to estimate the strength gain of mortars and concretes, including numerical simulations of the temperature evolution over time [15,16,17,18]. However, there is little evidence in the literature regarding the correlation between heat and strength. Bobrowicz [19] analysed the relationship between the compressive strength of standard mortars and the amount of heat released at low temperatures (20, 10 and 0 °C). The performed tests showed a linear correlation, describing the mortar strength gain as a function of the heat of hydration released under isothermal conditions [19]. Ge et al. [20] investigated a wide range of cements with different cement compositions. The authors correlated a number of properties with isothermal heat generation and found a very good correlation between the compressive strength and heat of hydration of mortar. Bentz et al. [21] examined a database of over 200 mortar mixes and found a linear relationship between mortar cube compressive strength and heat for reasonably low water/binder ratios (w/b < 0.43) when heat was determined per unit volume of mixing water basis. Baran et al. [22] tested about 200 samples of industrial cements produced in 9 manufacturing plants in Poland. The obtained results proved that there is a strong (Pearson linear correlation factor R (0.7223–0.9103)) correlation between the heat of hydration and compressive strength after 28 days of hardening of Portland cement without mineral additions. The high correlation factors allow one to estimate the standard compressive strength of cement after 28 days of hardening on the basis of heat-of-hydration tests after 3 days. However, in the case of blast furnace cement, such relationships are on the borderline between weak and moderate (Pearson linear correlation factor R (0.0173–0.8327)) [22]. Boubekeur et al. [23] proposed a new empirical equation to estimate the compressive strength depending on the hydration heat for blended cement preserved at constant temperature at early age. The founded results illustrated a good accuracy with the experimental ones and reflected the best choice to be used to predict the compressive strength depending on the heat of hydration at early age (7 days).
The main aim of this study is to determine whether isothermal calorimetry is an alternative method to predict early-age mortar compressive strength. The novelty of this research is to define the relationship between strength and heat for mortars cured at four different temperatures. Moreover, not only were pure Portland cement samples included, but also two levels of replacement of cement with siliceous fly ash. It is interesting to find a less time- and resource-consuming method of evaluating compressive strength measurements.
This paper reports the results of calorimetric and strength tests of mortars with ordinary Portland cement and two substitution rates (10 and 20%) of cement by siliceous fly ash. The standard [24] allows one to use of 33% of ash in the cement composite; hence, the most common content of siliceous fly ash was tested (i.e., 10 and 20%). The experimental program included tests of heat of hydration and compressive strength for three types of mortars hardened at four temperatures: 23, 33, 43 and 53 °C. The basic temperature, i.e., 23 °C, was related to laboratory conditions, and the next three values were 10 °C higher each time to maintain a constant temperature rise between the considered conditions. The relationship between the mortar compressive strength and the amount of heat of hydration was analysed in detail. The effectiveness of estimating the early-age strength of the mortar based on the results of calorimetric measurements and the limitations of the discussed method was demonstrated.
2. Materials and Methods
2.1. Materials
Laboratory tests were carried out using ordinary Portland cement CEM I 42.5 R [25] coming from the Górażdże Cement Plant and siliceous fly ash (FA) obtained from a thermal power plant located in Opole. The chemical compositions of used materials were determined by X-ray fluorescence (XRF) (Table 1). The loss on ignition (LOI) was analysed in accordance with EN 196-2 [26]. The specific density was determined according to ASTM C188 [27]. The Blaine’s specific surface area was tested using EN 196-6 [28] and ASTM C204 [29] standards.
Taking into account the obtained chemical composition and selected physical properties, the siliceous fly ash can be classified as category A with the requirements of EN 450-1 [30] (Table 1) and class F in accordance with ASTM C618 [31]. The chemical requirements for FA class F acc. to ASTM C618 are as follows: SiO2 + Al2O3 + Fe2O3 min. 70%, SO3 max. 5%, LOI max. 6% and humidity max. 3%. The siliceous fly ash fineness as a residue on the sieve (0.045 mm) during wet sieving was 32.9% wt., which allows one to classify the ash in the N category (Table 1, [30]). The analysis of its chemical composition shows the dominance of three elements in particular, in the oxide form: SiO2, Al2O3 and Fe2O3. The mentioned oxides are in the amorphous form, which influences the pozzolanic activity of the ash during the reaction with the cement. In the early stage of hydration, the siliceous fly ash particles act as microaggregates, filling the pores of the binding binders with hydration products. At a later age, the effect of its chemical influence is observed. Dissolved compounds react with Ca(OH)2, the product of cement hydration, to form a gel phase, C-A-S-H (fly ash with 24.57% Al). The course of the pozzolanic reaction of ash shows a slower growth rate of the C-S-H phase in the microstructure of the binders compared to the same phase with the cement alone [32].
2.2. Mixture Copostions
In the present studies, three mortar mixtures were made with constant water–binder ratio (w/b = 0.4). The reference samples were moulded from ordinary Portland cement (OPC). Additionally, two coefficients of cement substitution by adding 10% (OPC + 10% FA) and 20% (OPC + 20% FA) siliceous fly ash were considered. The compositions of mortar mixtures are presented in Table 2.
2.3. Calorimetric Tests
The process of cement hydration consists of five stages: a rapid initial period, an induction period, acceleration, retardation and a stage of delay and inhibition of the reaction [33]. The supplementary cementitious materials and curing conditions have a significant effect on the rate and amount of heat released. Isothermal calorimetry makes it possible to track the development of the heat of hydration (J/g), as well as the heat generation rate (J/g/h) of cement materials over time. Isothermal conditions allow the temperature to be kept constant throughout the whole test. The advantage of this method is the high precision of the measuring instrument compared to semi-adiabatic or adiabatic methods.
In this study, the measurements of the heat of hydration of mortars were carried out using the TAM Air three-channel isothermal calorimeter, which meets the requirements of ASTM C1679 [3], ASTM C1702 [4] and EN 196-11 [5]. The device allows one to monitor the heat of pastes, mortars or concretes with a large volume of the tested sample (125 mL). Many research teams conduct calorimetric tests using paste samples, but according to ASTM C1679 [3], the results of mortar tests provide a better correlation with concrete setting and early strength development, which is the main idea of this test. During each test, data were recorded continuously over 7 days using a data logger connected to a computer. The baseline was established within 12 h, and signal stability conditions were achieved using the linear least-squares procedure (a slope of the calorimetric signal absolute value less than 3 μW/h and a standard deviation less than 12 μW was taken). In each test series, three measurement samples and three reference samples were made. The reference samples contained an inert material (quartz sand with water) with a heat capacity similar to the test sample. The adoption of this type of solution ensures a stable baseline of the device, which determines the quality of the research.
2.4. Compression Tests
The 50 mm cubic mortar specimens were formed in accordance with the guidelines of ASTM C109/C109M [34] and cured in water baths at constant temperatures: 23, 33, 43 and 53 °C. Prior to the destructive tests, the specimens were taken out of the water baths, and loose sand grains that would be in contact with the bearing blocks of the testing machine were removed. The Advantest 9 C300kN computer-controlled mechanical testing machine was used to perform compression tests on the mortar specimens after 6 or 12 h and 1, 2, 5, 7 and 14 days of hardening. The investigations were carried out according to the EN 12390-3 standard [35] with a constant rate of loading equals 1000 N/s. Three mortar cubes were tested each time. The total number of prepared specimens was 216 (3 mixtures × 4 temperatures × 18 cubes per set, Figure 1).
3. Results
3.1. The Heat of Hydration
The evolution of cement hydration for mortars without siliceous fly ash is shown in Figure 2. The considered OPC mixtures display two significant heat flow maxima during the main period (Figure 2a). The first is attained several hours after the beginning of the acceleration period. The second one, called a “sulfate depletion peak” by Lerch [36], is due to the a renewed C3A dissolution and an accelerated ettringite precipitation. These are the reasons for the additional heat flow that can be detected at the second heat flow maximum during the retardation period [37,38]. The sulfate depletion peak increases with increasing temperature due to the activation energy of the C3A phase. The high curing temperature accelerates the hydration reaction and leads to higher heat generation rate, confirming the thermally activated nature of the hydration reaction (Figure 2a). Moreover, an increase in the curing temperature from 23 to 53 °C significantly shortens the induction period of the hydration process. Sulphate depletion depends on temperature, since the associated peak is shifted to later hydration stages with decreasing temperature. High curing temperature increases the total amount of heat released (Figure 2b). When 10 and 20% mass of cement was replaced by FA, the similar relationship between heat development and curing temperature was observed. The heat produced after 12 h for the mortar without and with 10 and 20% of FA is 2.9, 3.1 and 3.5 times higher at 53 °C than heat measured at 23 °C (Table 3). For mortars without FA, the heat released after 165 h was equal to 313 J/g at 23 °C and 354 J/g at 53 °C. In the case of mortar with 10% of FA, the maximum heat ranges from 280 at 23 °C to 319 J/g at 53 °C. The 20% substitution level of cement by FA results in the lowest values of heat recorded after 165 h (260 J/g at 23 °C and 320 J/g at 53 °C). The total accumulated heat Qtot was calculated by plotting Q (1/t) and using nonlinear approximation for measurement data obtained after 50 h of the experiment (1/t = 1/50 = 0.02 ). The fitting function g(1/t) = a × exp(b/t) was used. For 1/t ∼ 0, g(∼0) = Qtot. The extrapolation procedure was described in detail in [39,40]. A summary of the measured heat values for all mixtures is presented in Table 3.
Figure 3 shows the effect of the addition of siliceous fly ash on the kinetics of the hydration process at 23 and 53 °C. The addition of ash reduces the rate of hydration regardless of the curing temperature; it slightly delays the occurrence of the hydration peak and clearly reduces its maximum value due to the drop in the siliceous fly ash pozzolanic reaction rate (Figure 3a,c, Table 4). The above results confirmed the research carried out by Haustein et al. [41]. At 53 °C, the second peak has a clear narrow shape and its value increases significantly in comparison to the measurements carried out at 23 °C (Figure 3a,c). The appearance of the second peak includes the C3A renewal reaction with a loss of gypsum [42]. In the case of the tested mortars, the amount of heat released decreases with the increasing amount of the mineral additive in each of the considered conditions (Figure 3b,c, Table 3). After 165 h, the heat emission of mortar containing 10% and 20% FA decreased by 10.4% and 16.8%, respectively, at 23 °C (Figure 3b) and by 10.0% and 9.7%, respectively, at 53 °C (Figure 3d) compared with the mortar without mineral addition. Moghaddam et al. [42] stated that the cumulative heat of hydration produced for cement samples with FA was lower than that for samples without siliceous fly ash. Snelson et al. [43] reported that the small specific surface area and low solubility of the aluminosilicate present in the ash are the main factors contributing to the reduction in the total amount of heat released. Feng and Deschner [32,44] reported that in the process of hydration, the precipitation of the CSH and Ca(OH)2 phases requires the saturation of the Ca2+ concentration in the liquid phase of the cement mortar. Reducing the cement content in the mortar sample reduces the Ca2+ concentration in the liquid phase, delaying the saturation of Ca2+. Therefore, the increased content of FA in the cement mortar delays the early-age hydration and the appearance of the second exothermic peak (Figure 3a,c).
In order to estimate the amount of heat released due to fly ash, additional analysis was carried out (Table 5). For example, for the 20% FA mix at 53 °C, the heat of hydration is 320 J/g at 165 h. For pure OPC at 53 °C, the measured heat is 354 J/g at 165 h. If we assume the 20% FA does not significantly influence the heat release of the 80% OPC, the heat release due to FA is 320 − 354 × 80% = 36.8 J/g. In the case of samples tested at 43 and 33 °C, the amount of heat produced by FA equals 29.6 and 30.6 J/g, respectively. In turn, the lowest curing temperature, i.e., 23 °C, results in the lowest amount of heat (9.6 J/g) generated due to 20% FA. Taking into account the above calculations, it can be stated that the high curing temperature accelerates the dissolution of siliceous fly ash and finally results in the highest amount of heat released (Table 5).
3.2. Compressive Strength of Mortar Samples
Compression tests of mortar samples stored at 33, 43 and 53 °C were carried out after 6 h and 1, 2, 5, 7 and 14 days, and for samples cured at 23 °C, after 12 h and 1, 2, 5, 7 and 14 days. The development of compressive strength of mortar cubes is presented in the form of bar graph (Figure 4). The standard deviation of strength varies from 0.1 MPa to 5.8 MPa. Taking into account the strength development of mortar cured at 23 °C, it can be stated that strength rises gradually, while at higher temperatures (33, 43 and 53 °C), strength increases moderately over 1 day. The high curing temperature (33, 43 and 53 °C) significantly accelerates early-age strength. For example, after 6 h, the average compressive strength of cubes cured at 33 °C was 4 MPa, at 43 °C was 12 MPa and at 53 ° C was equal to 19 MPa.
The obtained results indicate that the addition of FA affects the pozzolanic activity, reduces the early-age strength of mortar cubes cured at 23, 33 and 43 °C and visibly increases strength at 53 °C. After 7 days, for concrete containing 20% of siliceous fly ash, the compressive strength decreased by 41% at 23 °C (Figure 4a) and increased by 23% at 53 °C (Figure 4d) in comparison to the control sample. After 14 days, for concrete containing 20% of ash, the compressive strength decreased by 15% at 23 °C (Figure 4a) and increased by 16% at 53 °C (Figure 4d) in comparison to the control sample. The substitution of cement with FA can enhance the long-term (after 28 days) compressive strength because more FA reacts with CH to form the strength-giving gel.
3.3. Relationship between Heat and Strength
In the first stage of studies, the relationship between compressive strength and the heat of hydration was considered. Due to the fact that the calorimetric tests were carried out for 7 days, the value of the heat of hydration after 14 days was taken as an extrapolated value according to Table 3. As demonstrated in Figure 5, the correlation between mentioned parameters is close to linear, regardless of the curing temperature and the type of mixture. However, the highest variation is observed in the case of samples cured at 43 °C (Figure 5c). The above observations contributed to making an attempt to estimate the early-age compressive strength on the basis of the amount of the released heat.
In Figure 6, Figure 7, Figure 8 and Figure 9, the identification of the relationship between the 7-day compressive strength of mortar and the hydration heat measured after 12, 24, 48, 72, 120 and 165 h for the four temperatures (23, 33, 43 and 53 °C) is plotted. In all cases, linear approximations were performed using the least-squares method by determining the coefficient of determination (R2) of the fitted line.
For samples stored at 23 °C, the highest coefficients of determination were noted, i.e., from 0.9860 for the heat released after 12 h to 0.9950 for the heat released after 24 h (Figure 6). In the case of cubes cured at 33 °C, the R2 coefficient is about 0.5 (Figure 7), while at 43 °C, the approximation is incorrect (Figure 8). Taking into account mortars stored at 53 °C, a linear relationship with R2 coefficients close to unity was calculated, i.e., from 0.7801 to 0.9553 (Figure 9). In this case, the slope of the straight lines is negative, due to the fact that at this temperature the strength of the samples containing 20% of FA exceeds the strength of the mortar samples without the supplementary cementitious materials, i.e., with a lower amount of heat released, a higher value of compressive strength was achieved. It is worth noting that in general, high temperature lowers the later-age strength, i.e., a crossover effect is observed [45]. On the other hand, high temperature accelerates the dissolution of FA, which could help improve strength at the later age. At 53 °C, the latter reason dominates; hence, an inverse trend is observed. At 33 °C and 43 °C, both factors are influencing the results; hence, no obvious correlations are seen.
A similar analysis was carried out for the 14-day strength of samples cured at 23 and 53 °C (Figure 10 and Figure 11). In the case of these two temperatures, there is a clear linear colreelation between the analysed values, although the coefficient of determination is lower than in the case of the mortar strength achieved after 7 days.
Based on the equations of the lines determined for the highest coefficients R2 (related to heat after 24 h) the compressive strengths after 7 and 14 days for mortar cured at 23 °C (Table 6) and 53 °C (Table 7) were calculated.
For instance, the 7-day compressive strength estimated for cubes stored at 23 °C (Table 6) using the equation y = 0.3882x − 10.49 (Figure 6) was equal to 57.83, 47.74 and 41.14 MPa for samples without and with 10% and 20% FA, respectively. Mortar strengths determined in destructive tests were 57.73, 48.44 and 40.80 MPa; therefore, the relative error of the measured and estimated strength was equal to 0.2, 1.4 and 0.8%. In turn, the 14-day compressive strength calculated for cubes stored at 23 °C using the equation y = 0.2002x + 24.73 (Figure 10) was equal to 59.97, 54.76 and 51.36 MPa for specimens without and with 10% and 20% FA, respectively. Mortar strengths determined in destructive tests were 59.65, 55.80 and 50.77 MPa; therefore, the relative error of the measured and estimated strength was equal to 0.5, 1.9 and 1.2%. The similar calculation was conducted for cubes stored at 53 °C. In this case, the relative errors between measured and estimated strength varies from 0.5 to 3.5% (Table 7).
4. Conclusions
Precise measurements of released heat are a proper method to identify the thermal parameters of the hydration process of cement composites. The conducted research proved that it is possible to use isothermal calorimetry to estimate the early-age strength of cement mortars without and with the addition of siliceous fly ash.
In the case of samples cured at 23 and 53 °C, a clear linear relationship between the monitored parameters was observed. The coefficients of determination of the approximated lines were close to one. The high value of the R2 factor allows one to estimate the mortar compressive strength after 7 and 14 days based on heat measurements conducted at standard temperature (23 °C) after just 24 h. The relative error of the strength estimated and determined in destructive tests varies from 0.2% to 1.9%. It is much more difficult to predict mortar strength for samples cured at 33 and 43 °C. At 33 °C and 43 °C, two factors (high curing temperature and FA addition) are influencing the results; hence, no obvious correlations are seen. In these cases, no linear relationships were achieved between the amount of heat released and the compressive strength. On the other hand, for the highest considered temperature, i.e., 53 °C, there is a linear correlation between the strength and the heat of hydration, and the R2 coefficients are close to one in the case of approximation of data obtained after 24 h. In two analysed curing temperatures, i.e., 23 and 53 °C, the predictions of mortar compressive strength based on measured heat of hydration are generally within ±3.5% of the experimentally measured strength values.
The potential of the current measurement methods, with emphasis on the high precision of colorimetric tests, can successfully contribute to reducing the number of destructive tests with significant savings in resources. The monitoring of the heat evolution of cement mortar using isothermal calorimetry provides an alternative to estimating early-age strengths when standards do not require typical compression tests of mortar samples, or can be used to increase the frequency of measurements to improve cement quality.
Funding
This research received no external funding.
Data Availability Statement
Data is contained within the article.
Conflicts of Interest
The author declares no conflict of interest.
References
- EN 196-9; Methods of Testing Cement. Part 9. Heat of Hydration—Semi-Adiabatic Method. European Standards; European Committee for Standardization: Brussels, Belgium, 2010.
- EN 196-8; Methods of Testing Cement. Part 8. Heat of Hydration—Solution Method. European Standards; European Committee for Standardization: Brussels, Belgium, 2010.
- ASTM C1679; Standard Practice for Measuring Hydration Kinetics of Hydraulic Cementitious Mixtures Using Isothermal Calorimetry. ASTM International: West Conshohocken, PA, USA, 2017.
- ASTM C1702; Standard Test Method for Measurement of Heat of Hydration of Hydraulic Cementitious Materials Using Isothermal Conduction Calorimetry. ASTM International: West Conshohocken, PA, USA, 2017.
- EN 196-11; Methods of Testing Cement. Part 11. Heat of Hydration—Isothermal Conduction Calorimetry Method. European Standards; European Committee for Standardization: Brussels, Belgium, 2018.
- Usherov-Marshak, V.; Ciak, M. Isothermal calorimetry in the standard ASTM C1679-08. Cem. Lime Concr. 2010, 2, 108–110. [Google Scholar]
- Do, T.A.; Hoang, T.T.; Bui-Tien, T.; Hoang, H.V.; Do, T.D.; Nguyen, P.A. Evaluation of heat of hydration, temperature evolution and thermal cracking risk in high-strength concrete at early ages. Case Stud. Therm. Eng. 2020, 21, 100658. [Google Scholar] [CrossRef]
- Frølich, L.; Wadsö, L.; Sandberg, P. Using isothermal calorimetry to predict one day mortar strengths. Cem. Concr. Res. 2016, 88, 108–113. [Google Scholar] [CrossRef]
- Wang, Q.; Wang, D.; Chen, H. The role of fly ash microsphere in the microstructure and macroscopic properties of high-strength concrete. Cem. Concr. Compos. 2017, 83, 125–137. [Google Scholar] [CrossRef]
- Haustein, E. The selected physico-chemical properties of microspheres and possibility of their use in cement composites. Compos. Theory Pract. 2016, 16, 25–29. [Google Scholar]
- Zhang, T.; Yu, Q.; Wei, J.; Zhang, P.; Chen, P. A gap-graded particle size distribution for blended cements: Analytical approach and experimental validation. Powder Technol. 2011, 214, 259–268. [Google Scholar] [CrossRef]
- Haustein, E.; Kuryłowicz-Cudowska, A. Effect of Particle Size of Fly Ash Microspheres (FAMs) on the Selected Properties of Concrete. Minerals 2022, 12, 847. [Google Scholar] [CrossRef]
- Blissett, R.S.; Rowson, N.A. A review of the multi-component utilisation of coal fly ash. Fuel 2012, 97, 1–23. [Google Scholar] [CrossRef]
- Klathae, T.; Tanawuttiphong, N.; Tangchirapat, W.; Chindaprasirt, P.; Sukontasukkul, P.; Jaturapitakkul, C. Heat evolution, strengths, and drying shrinkage of concrete containing high volume ground bagasse ash with different LOIs. Constr. Build. Mater. 2020, 258, 119443. [Google Scholar] [CrossRef]
- Kuryłowicz-Cudowska, A. Determination of thermophysical parameters involved in the numerical model to predict the temperature field of cast-in-place concrete bridge deck. Materials 2019, 12, 3089. [Google Scholar] [CrossRef] [Green Version]
- Mariak, A.; Kurpińska, M.; Wilde, K. Maturity curve for estimating the in-place strength of high performance concrete. MATEC Web Conf. 2019, 262, 06007. [Google Scholar] [CrossRef] [Green Version]
- Kuryłowicz-Cudowska, A.; Wilde, K.; Chróścielewski, J. Prediction of cast-in–place concrete strength of the extradosed bridge deck based on temperature monitoring and numerical simulations. Constr. Build. Mater. 2020, 254, 1–17. [Google Scholar] [CrossRef]
- Kuryłowicz-Cudowska, A.; Wilde, K. FEM and experimental investigations of concrete temperature field in the massive stemwall of the bridge abutment. Constr. Build. Mater. 2022, 347, 128565. [Google Scholar] [CrossRef]
- Bobrowicz, J. Relation between cements compressive strength and the amount of the hydration heat evolvet in low temperatures. Build. Res. Inst. 2005, 3, 1–14. (In Polish) [Google Scholar]
- Ge, Z.; Wang, K.; Sandberg, P.; Ruiz, J.M. Characterization and performance prediction of cement-based materials using a simple isothermal calorimeter. J. Adv. Concr. Technol. 2009, 7, 1–12. [Google Scholar] [CrossRef] [Green Version]
- Bentz, D.; Barrett, T.; De La Varga, I.; Weiss, W.J. Relating compressive strength to heat release in mortars. Adv. Civil. Eng. Mater. 2012, 1, 1–14. [Google Scholar] [CrossRef] [Green Version]
- Baran, T.; Pichniarczyk, P. Correlation factor between heat of hydration and compressive strength of common cement. Constr. Build. Mater. 2017, 150, 321–332. [Google Scholar] [CrossRef]
- Boubekeur, T.; Salhi, M.; Ezziane, K.; Kadri, R.-H. Effect of elevated temperature on the hydration heat and mechanical properties of blended cements mortars. J. Mater. Eng. Struct. 2021, 8, 341–356. [Google Scholar]
- EN 206-1; Concrete—Part 1: Specification, Performance, Production and Conformity. European Standards; European Committee for Standardization: Brussels, Belgium, 2020.
- EN 197-1; Cement—Part 1: Composition, Specifications and Conformity Criteria for Common Cements. European Standards; European Committee for Standardization: Brussels, Belgium, 2012.
- EN 196-2; Methods of Testing Cement—Part 2: Chemical Analysis of Cement. European Standards; European Committee for Standardization: Brussels, Belgium, 2013.
- ASTM C188; Standard Test Method for Density of Hydraulic Cement. ASTM International: West Conshohocken, PA, USA, 2017.
- EN 196-6; Methods of Testing Cement—Part 6: Determination of Fineness. European Standards; European Committee for Standardization: Brussels, Belgium, 2019.
- ASTM C204; Standard Test Methods for Fineness of Hydraulic Cement by Air-Permeability Apparatus. ASTM International: West Conshohocken, PA, USA, 2014.
- EN 450-1; Fly Ash for Concrete—Part 1: Definition, Specifications and Conformity Criteria. European Standards; European Committee for Standardization: Brussels, Belgium, 2012.
- ASTM C618; Standard Specification for Coal Fly Ash and Raw or Calcined Natural Pozzolan for Use in Concrete. ASTM International: West Conshohocken, PA, USA, 2019.
- Feng, J.; Sun, J.; Yan, P. The influence of ground fly ash on cement hydration and mechanical property of mortar. Adv. Civ. Eng. 2018, 2018, 4023178. [Google Scholar] [CrossRef] [Green Version]
- Klemczak, B.; Batog, M. Heat of hydration of low-clinker cements—Part I: Semi-adiabatic and isothermal tests at different temperature. J. Therm. Anal. Calorim. 2016, 123, 1351–1360. [Google Scholar] [CrossRef] [Green Version]
- ASTMC109/C109M; Standard Test Method for Compressive Strength of Hydraulic Cement Mortars (Using 2-in. or [50-mm] Cube Specimens). ASTM International: West Conshohocken, PA, USA, 2016.
- EN 12390-3; Testing Hardened Concrete—Part 3: Compressive Strength of Test Specimens. European Standards; European Committee for Standardization: Brussels, Belgium, 2019.
- Lerch, W. The influence of gypsum on the hydration and properties of Portland cement pastes. Am. Soc. Test. Mater. 1946, 46, 1252–1297. [Google Scholar]
- Hesse, C.; Goetz-Neunhoeffer, F.; Neubauer, J. A new approach in quantitative insitu XRD of cement pastes: Correlation of heat flow curves with early hydration reactions. Cem. Concr. Res. 2010, 41, 123–128. [Google Scholar] [CrossRef]
- Jansen, D.; Goetz-Neunhoeffer, F.; Lothenbach, B.; Neubauer, J. The early hydration of Ordinary Portland Cement (OPC): An approach comparing measured heat flow with calculated heat flow from QXRD. Cem. Concr. Res. 2012, 42, 134–138. [Google Scholar] [CrossRef]
- Kuryłowicz-Cudowska, A.; Haustein, E. Isothermal calorimetry and compressive strength tests of mortar specimens for determination of apparent activation energy. J. Mater. Civ. Eng. 2021, 33, 04021035. [Google Scholar] [CrossRef]
- Azenha, M. Numerical Simulation of the Structural Behaviour of Concrete since Its Early Ages. Ph.D. Thesis, Faculty of Engineering, University of Porto, Porto, Portugal, 2009. [Google Scholar]
- Haustein, E.; Kuryłowicz-Cudowska, A.; Łuczkiewicz, A.; Fudala-Książek, S.; Cieślik, B.M. Influence of Cement Replacement with Sewage Sludge Ash (SSA) on the Heat of Hydration of Cement Mortar. Materials 2022, 15, 1547. [Google Scholar] [CrossRef]
- Moghaddam, F.; Sirivivatnanon, V.; Vessalas, K. The effect of fly ash fineness on heat of hydration, microstructure, flow and compressive strength of blended cement pastes. Case Stud. Constr. Mater. 2019, 10, e00218. [Google Scholar] [CrossRef]
- Snelson, D.G.; Wild, S.; O’Farrell, M. Heat of hydration of portland cement–metakaolin–fly ash (PC–MK–PFA) blends. Cem. Concr. Res. 2008, 38, 832–840. [Google Scholar] [CrossRef]
- Deschner, F.; Winnefeld, F.; Lothenbach, B. Hydration of a portland cement with high replacement by siliceous fly ash. Cem. Concr. Res. 2012, 42, 1389–1400. [Google Scholar] [CrossRef]
- Kjellsen, K.O.; Detwiler, R.J. Later-age strength prediction by a modified maturity model. ACI Mater. J. 1993, 90, 220–227. [Google Scholar]
Figure 1.
(a) One set of fresh mortar samples; (b) compression test.
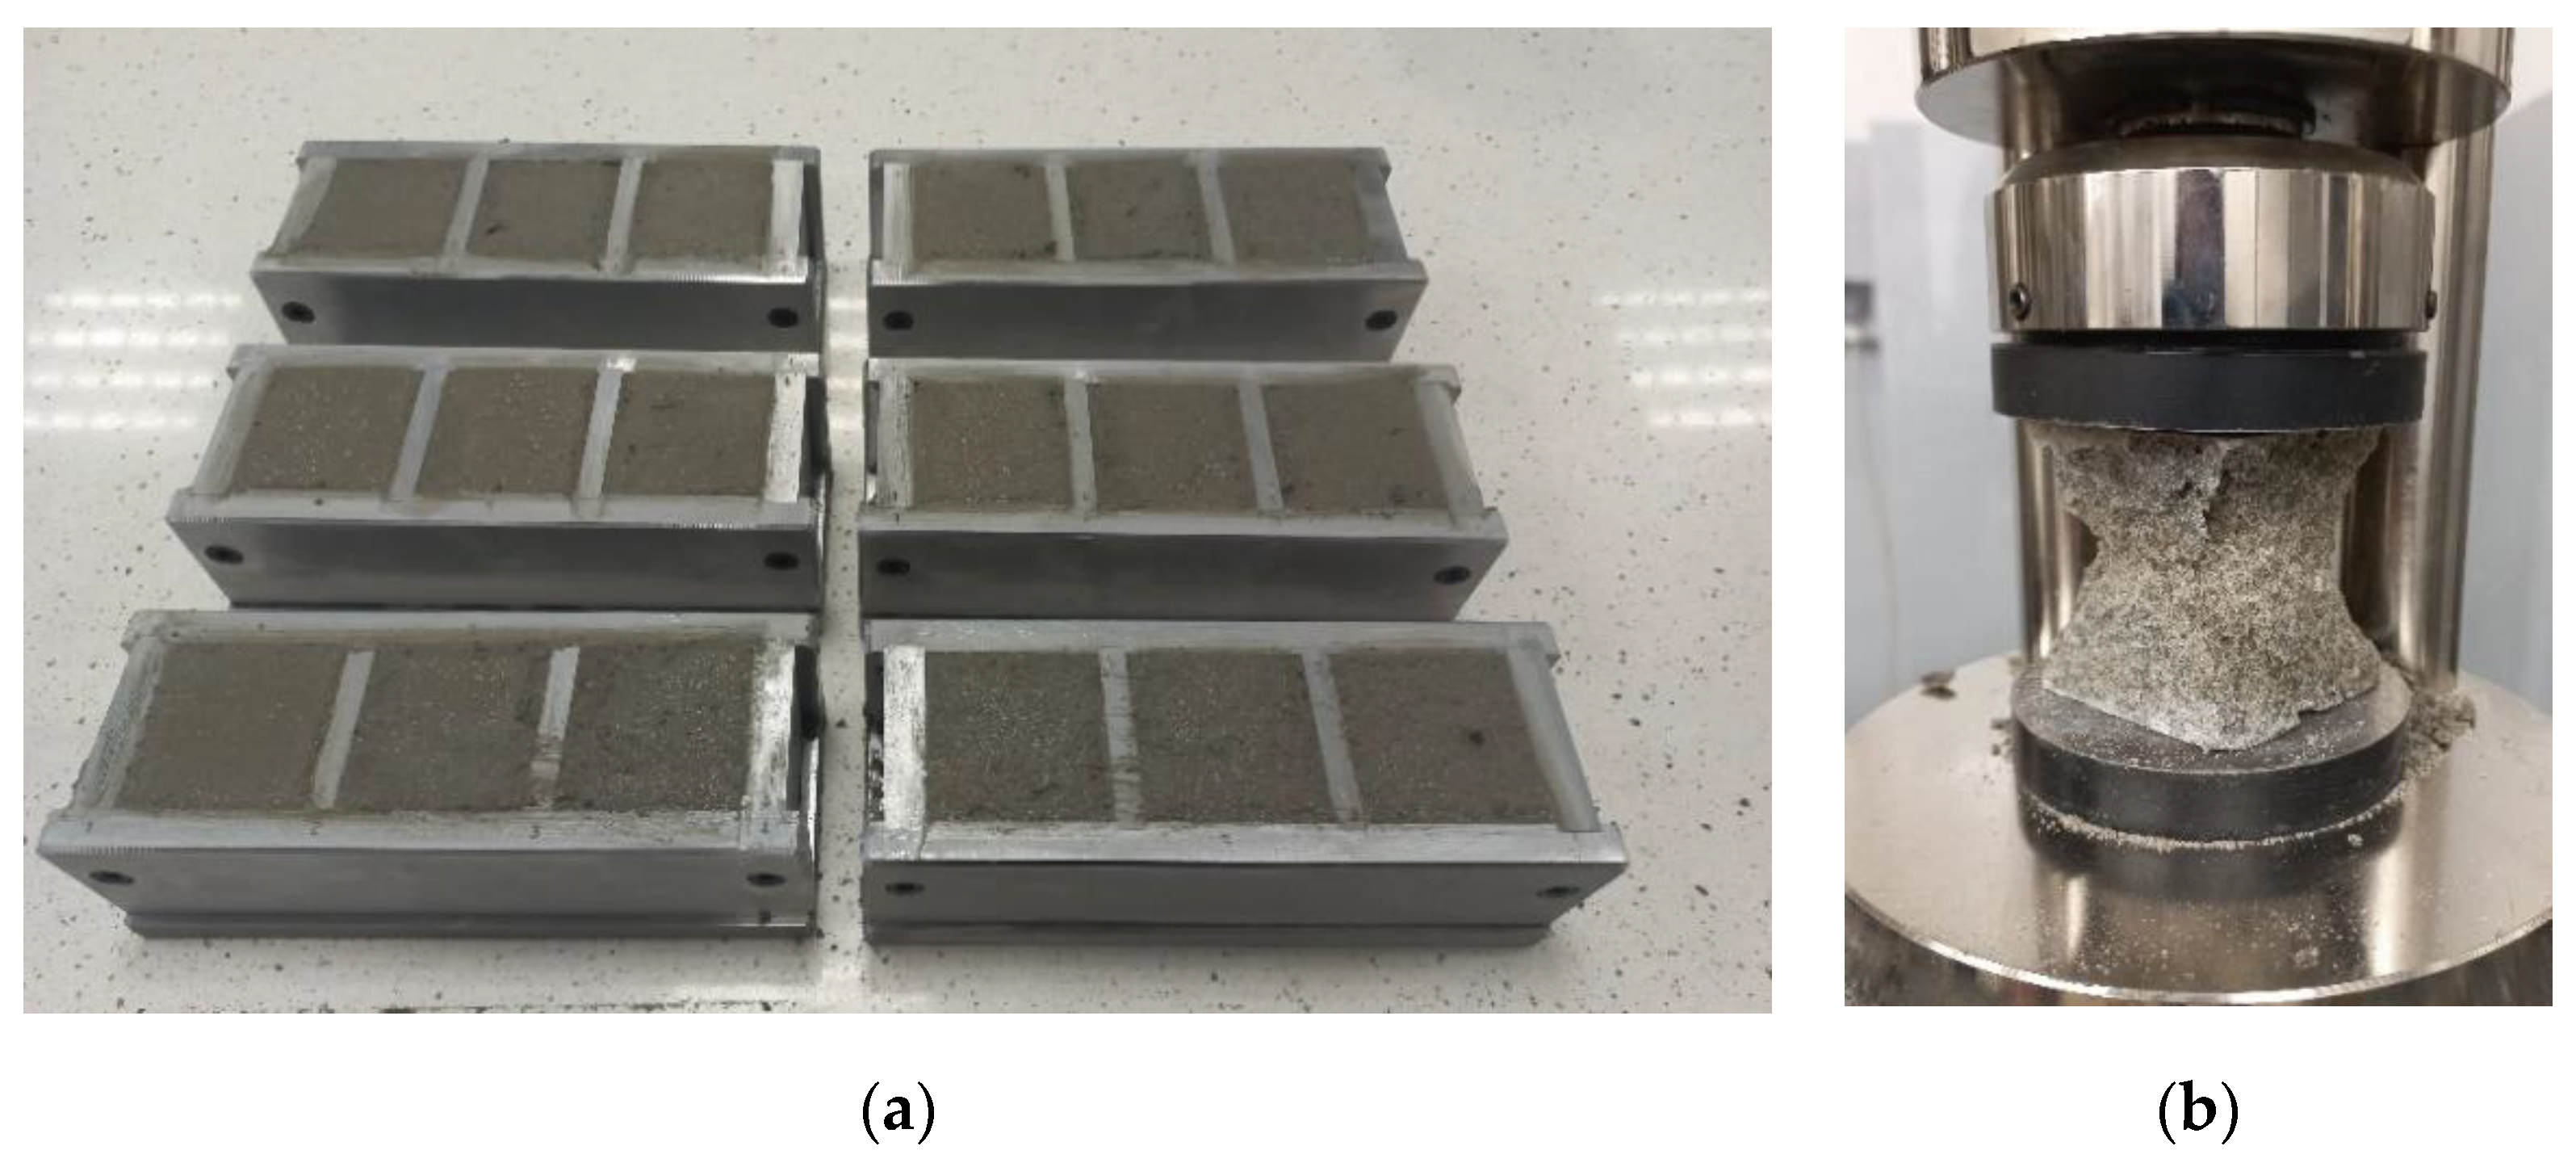
Figure 2.
Results of calorimetric tests for OPC mortar mixtures: (a) the heat generation rate at first 72 h, (b) heat of hydration during 165 h.
Figure 2.
Results of calorimetric tests for OPC mortar mixtures: (a) the heat generation rate at first 72 h, (b) heat of hydration during 165 h.
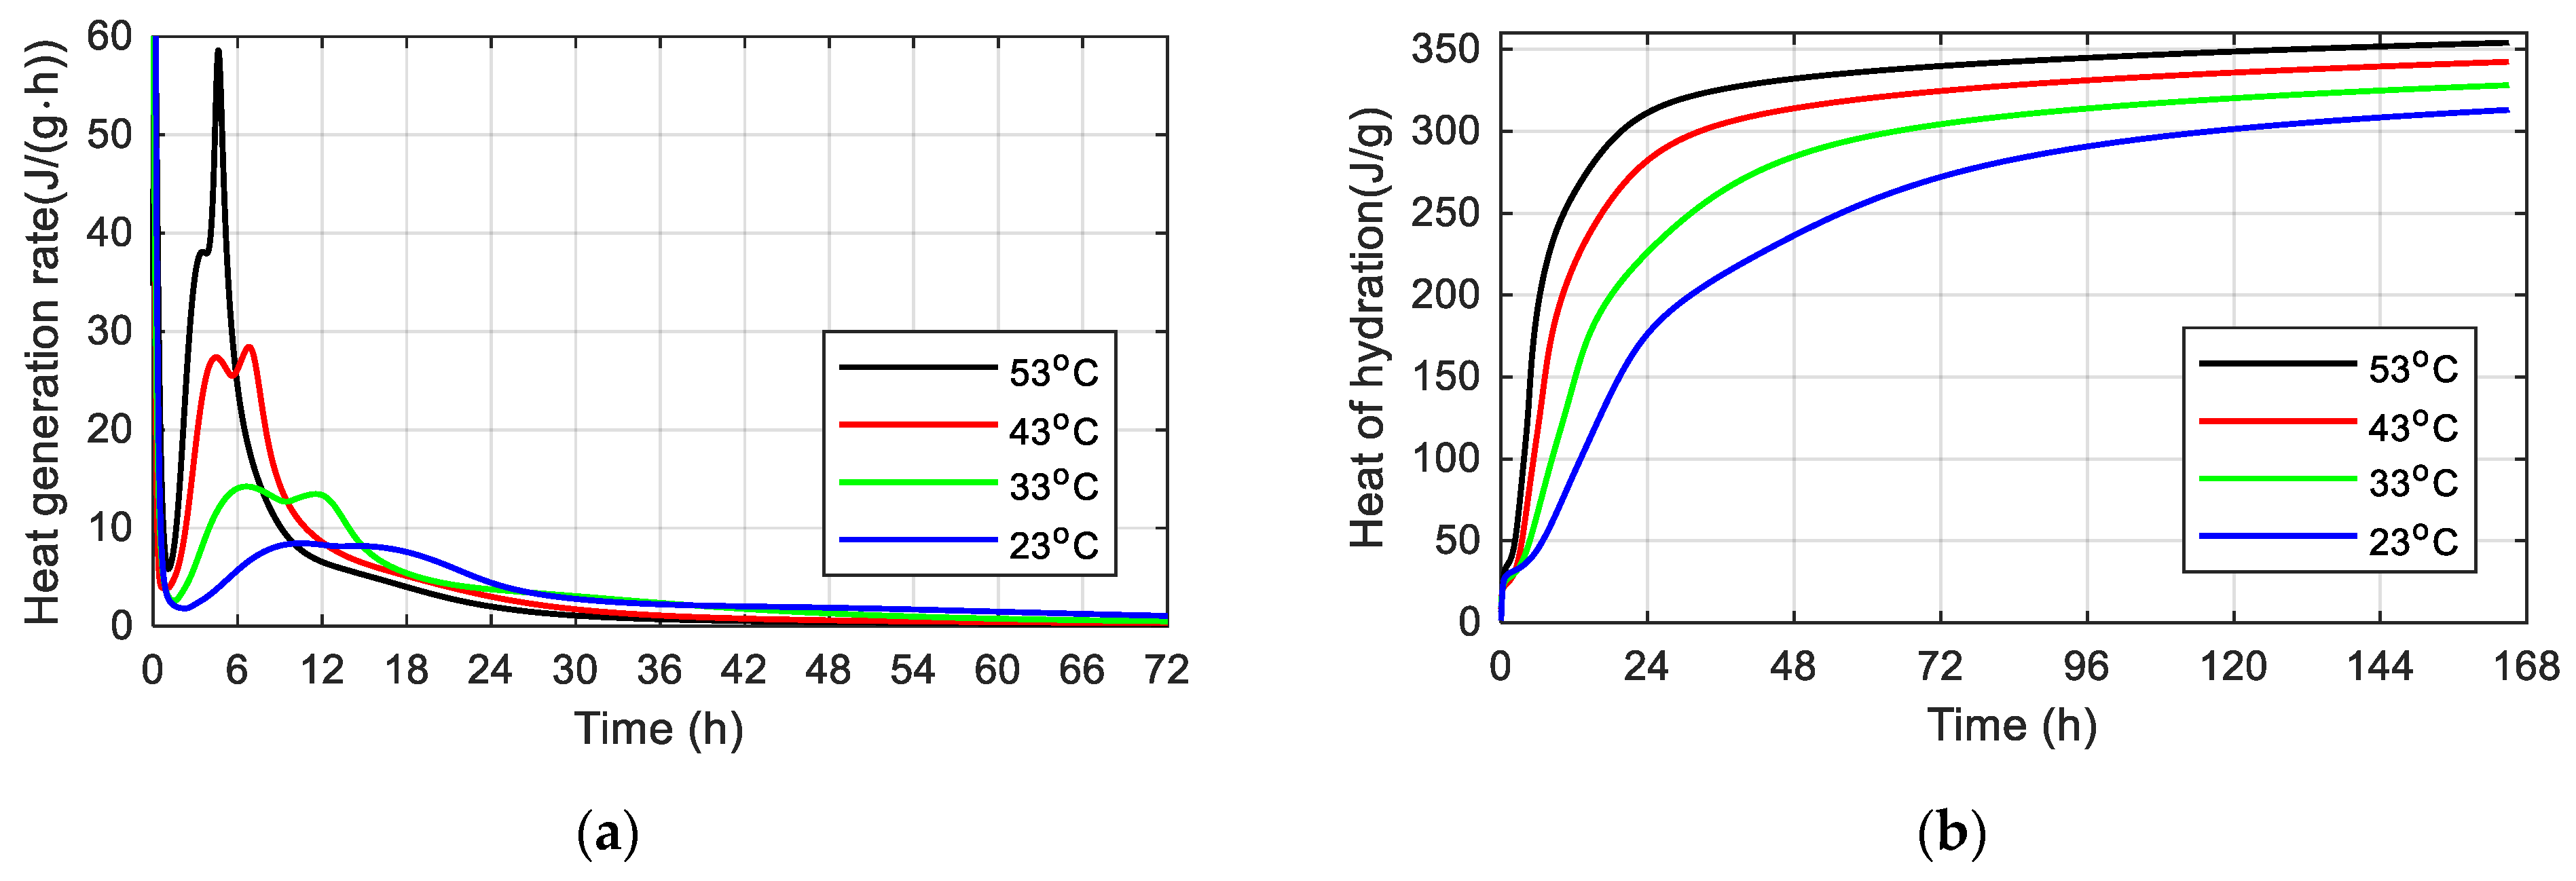
Figure 3.
Effect of FA addition on the heat generation rate and heat of hydration of mortars cured at 23 °C (a,c); and 53 °C (b,d).
Figure 3.
Effect of FA addition on the heat generation rate and heat of hydration of mortars cured at 23 °C (a,c); and 53 °C (b,d).
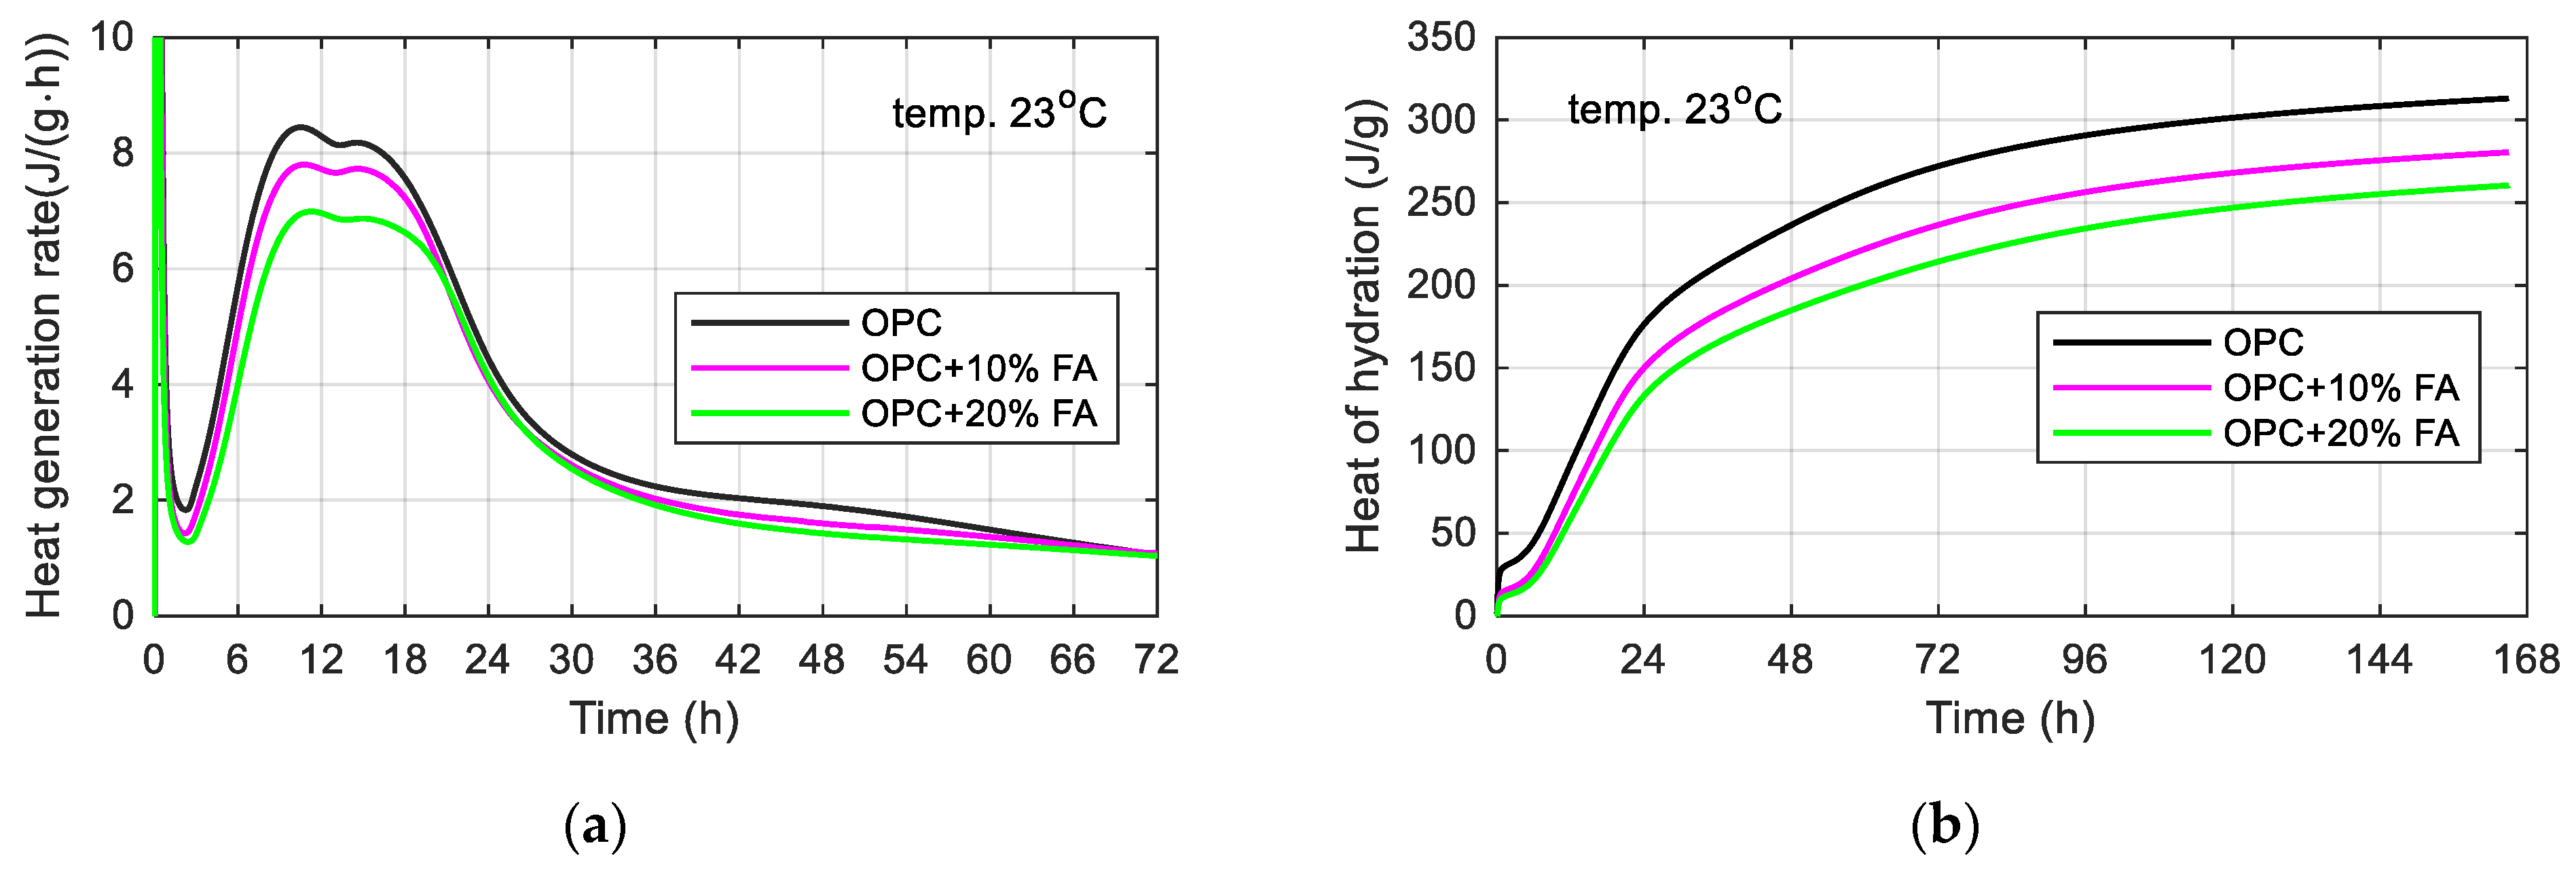
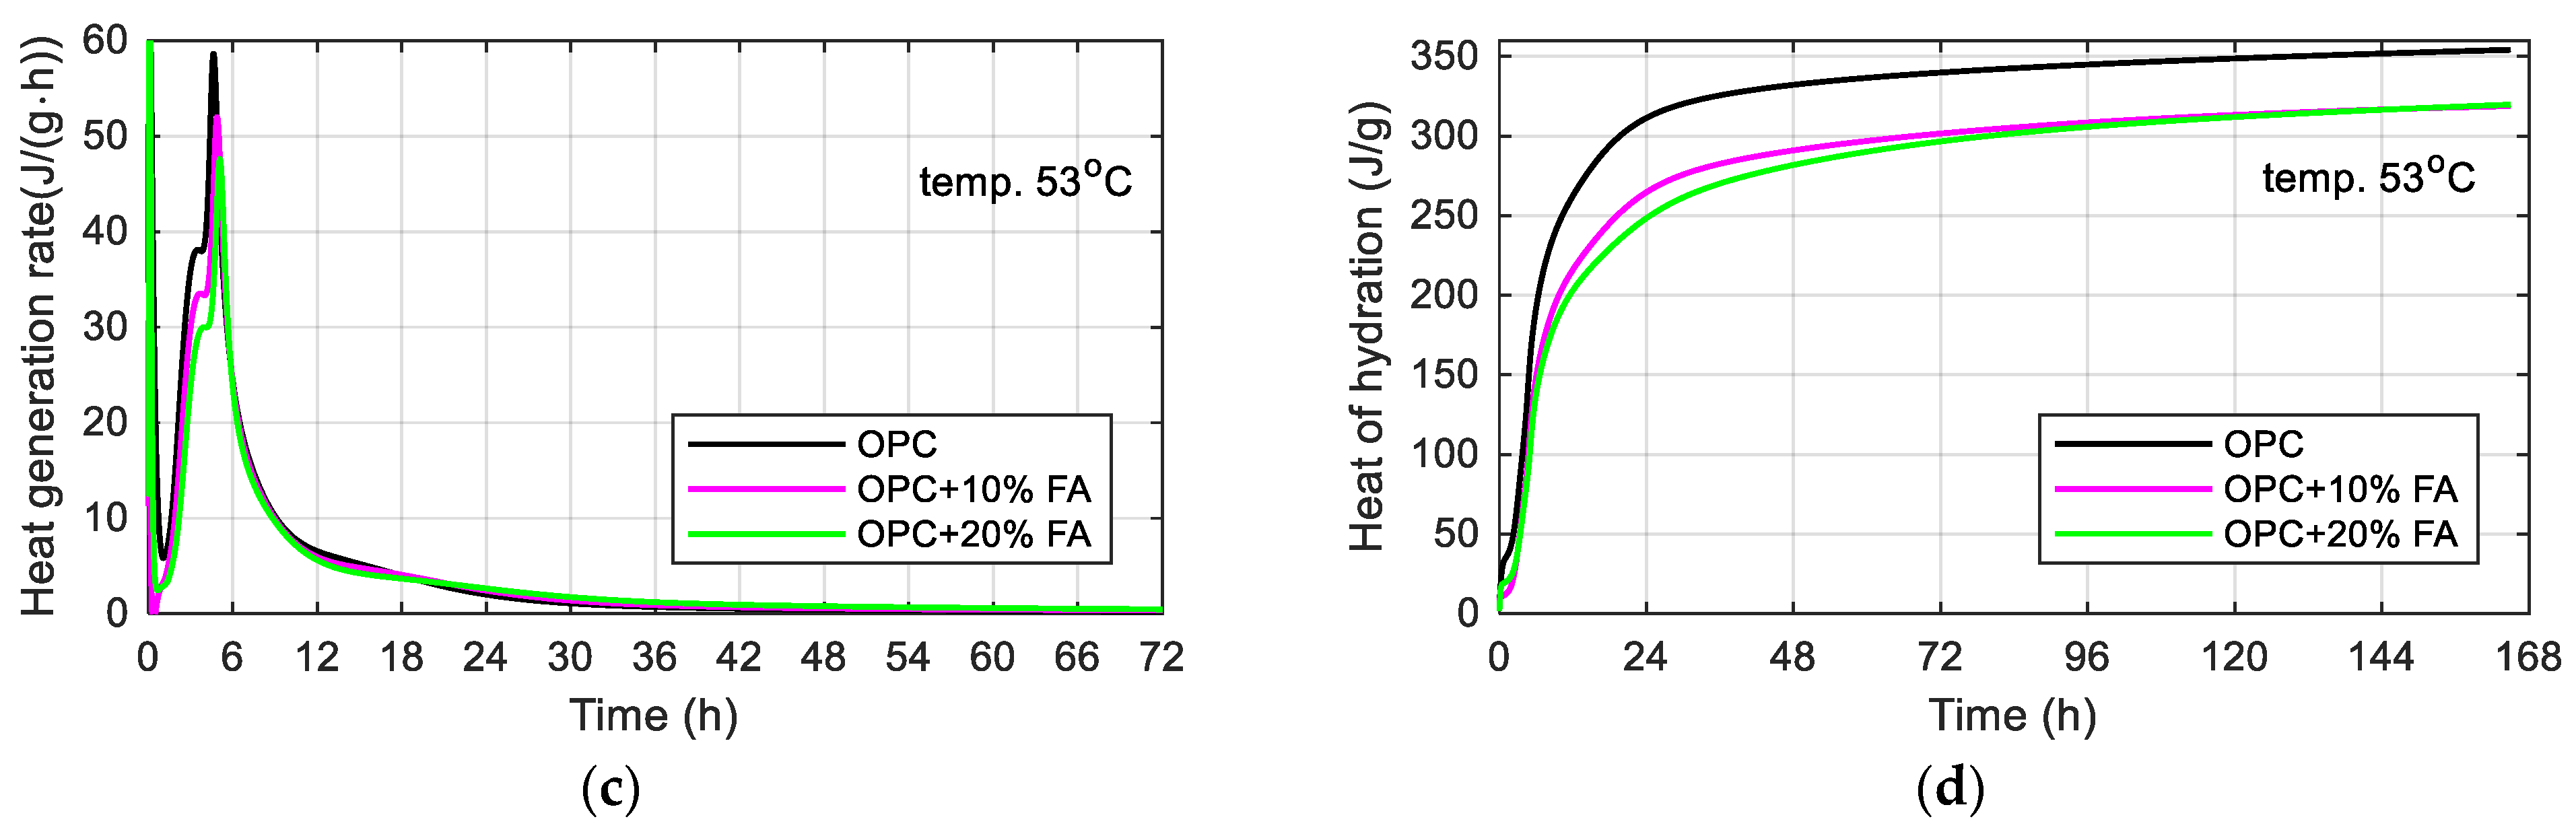
Figure 4.
Average compressive strength of mortar specimens cured at different temperatures: (a) 23 °C; (b) 33 °C; (c) 43 °C; (d) 53 °C.
Figure 4.
Average compressive strength of mortar specimens cured at different temperatures: (a) 23 °C; (b) 33 °C; (c) 43 °C; (d) 53 °C.
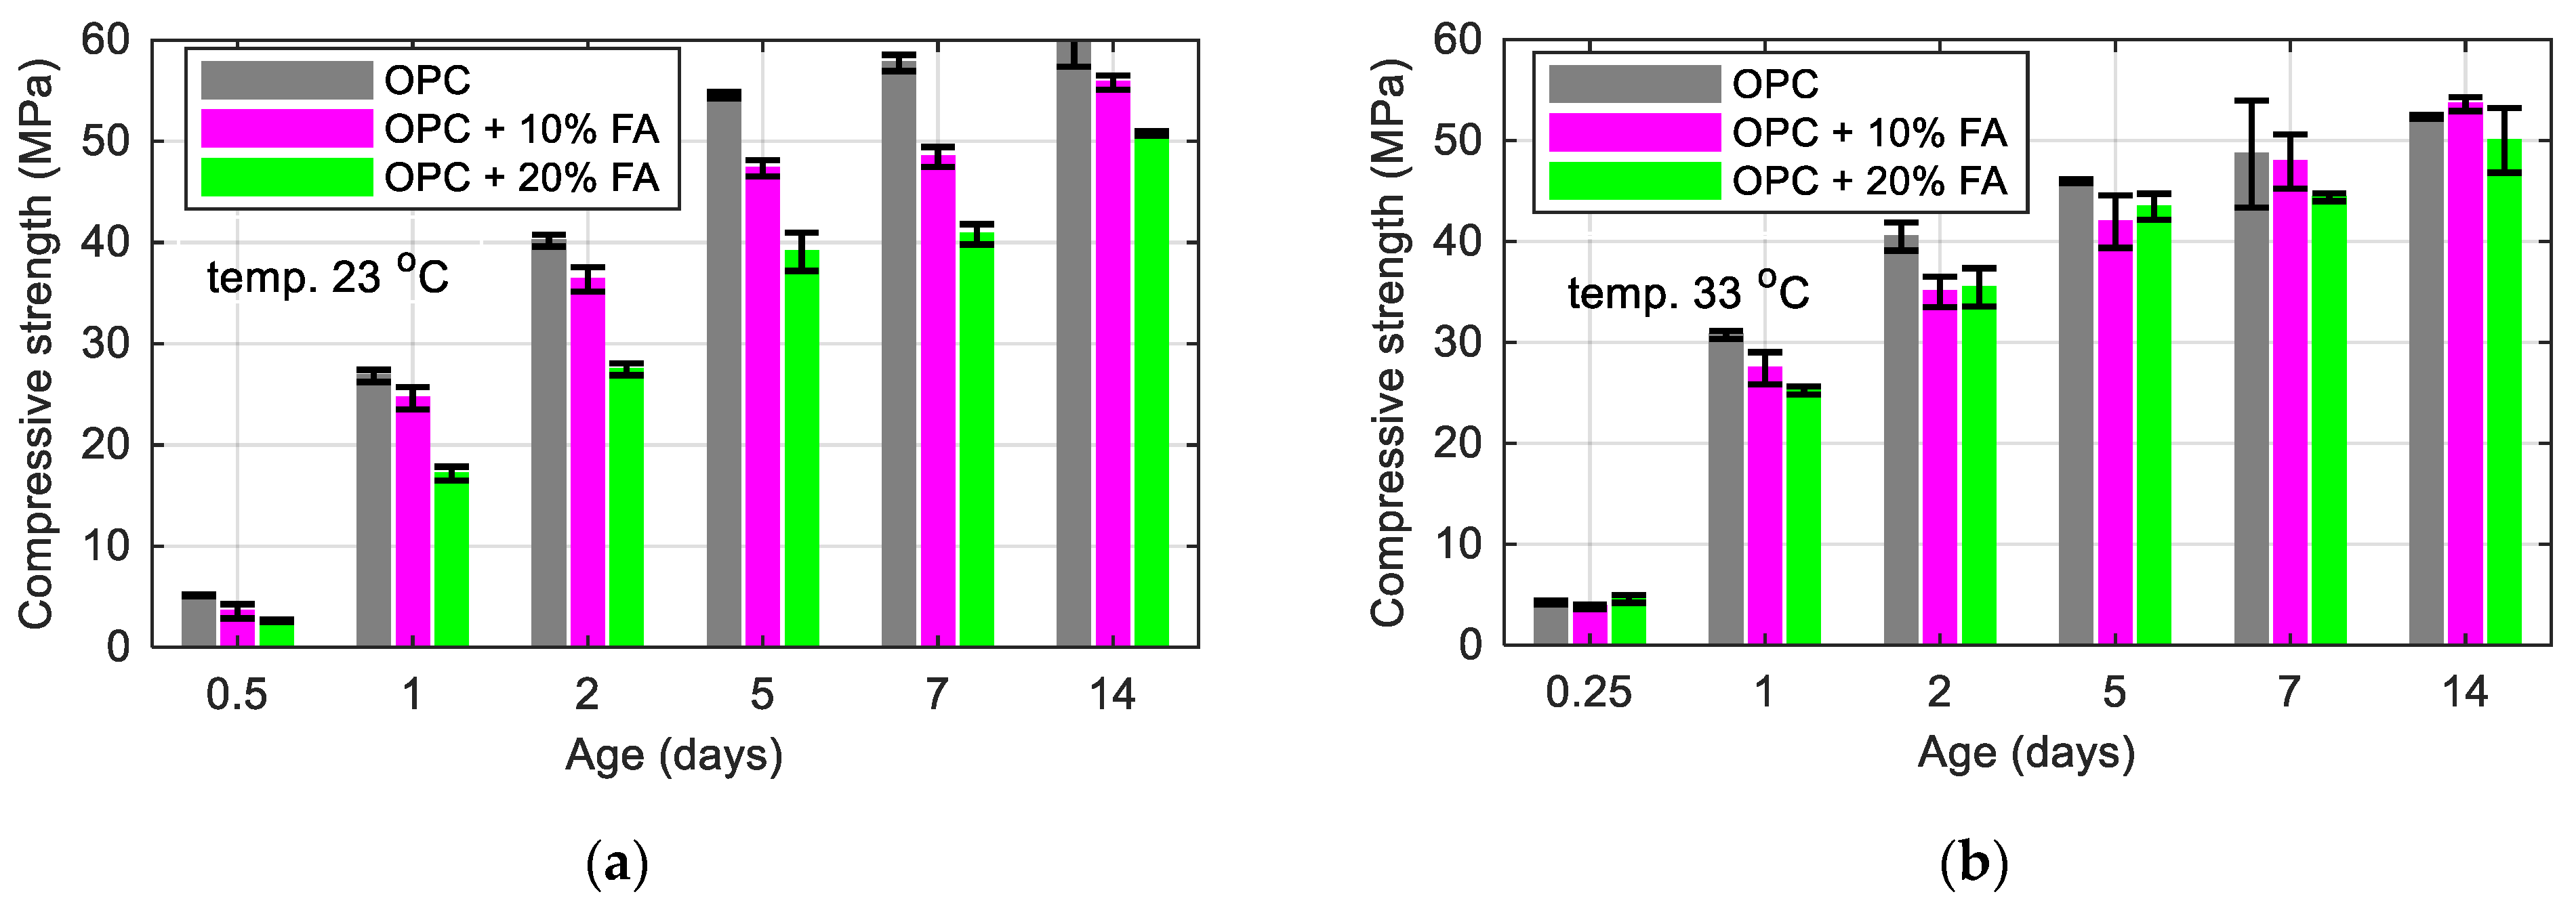
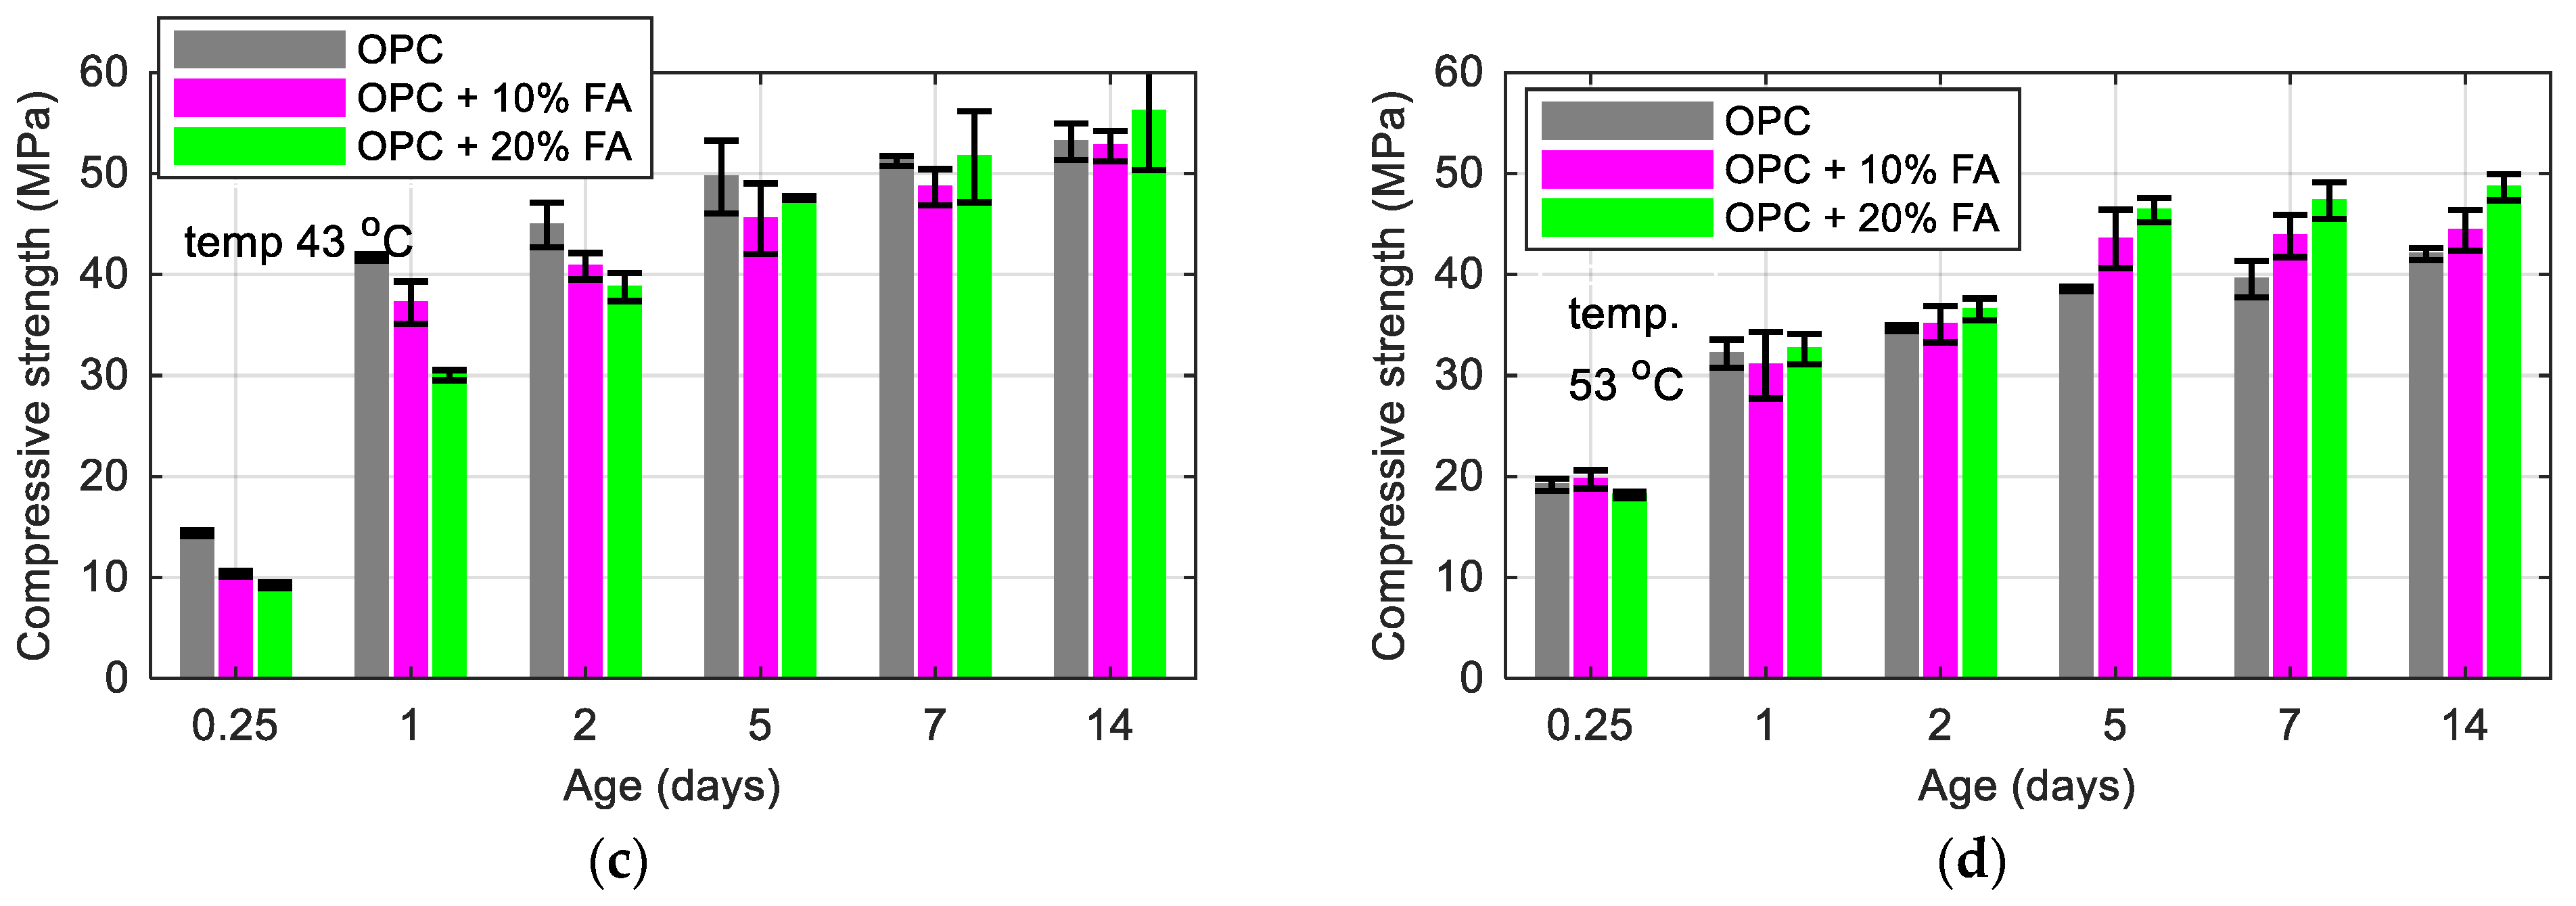
Figure 5.
Compressive strength vs. heat of hydration released at temperatures: (a) 23 °C; (b) 33 °C; (c) 43 °C; (d) 53 °C.
Figure 5.
Compressive strength vs. heat of hydration released at temperatures: (a) 23 °C; (b) 33 °C; (c) 43 °C; (d) 53 °C.
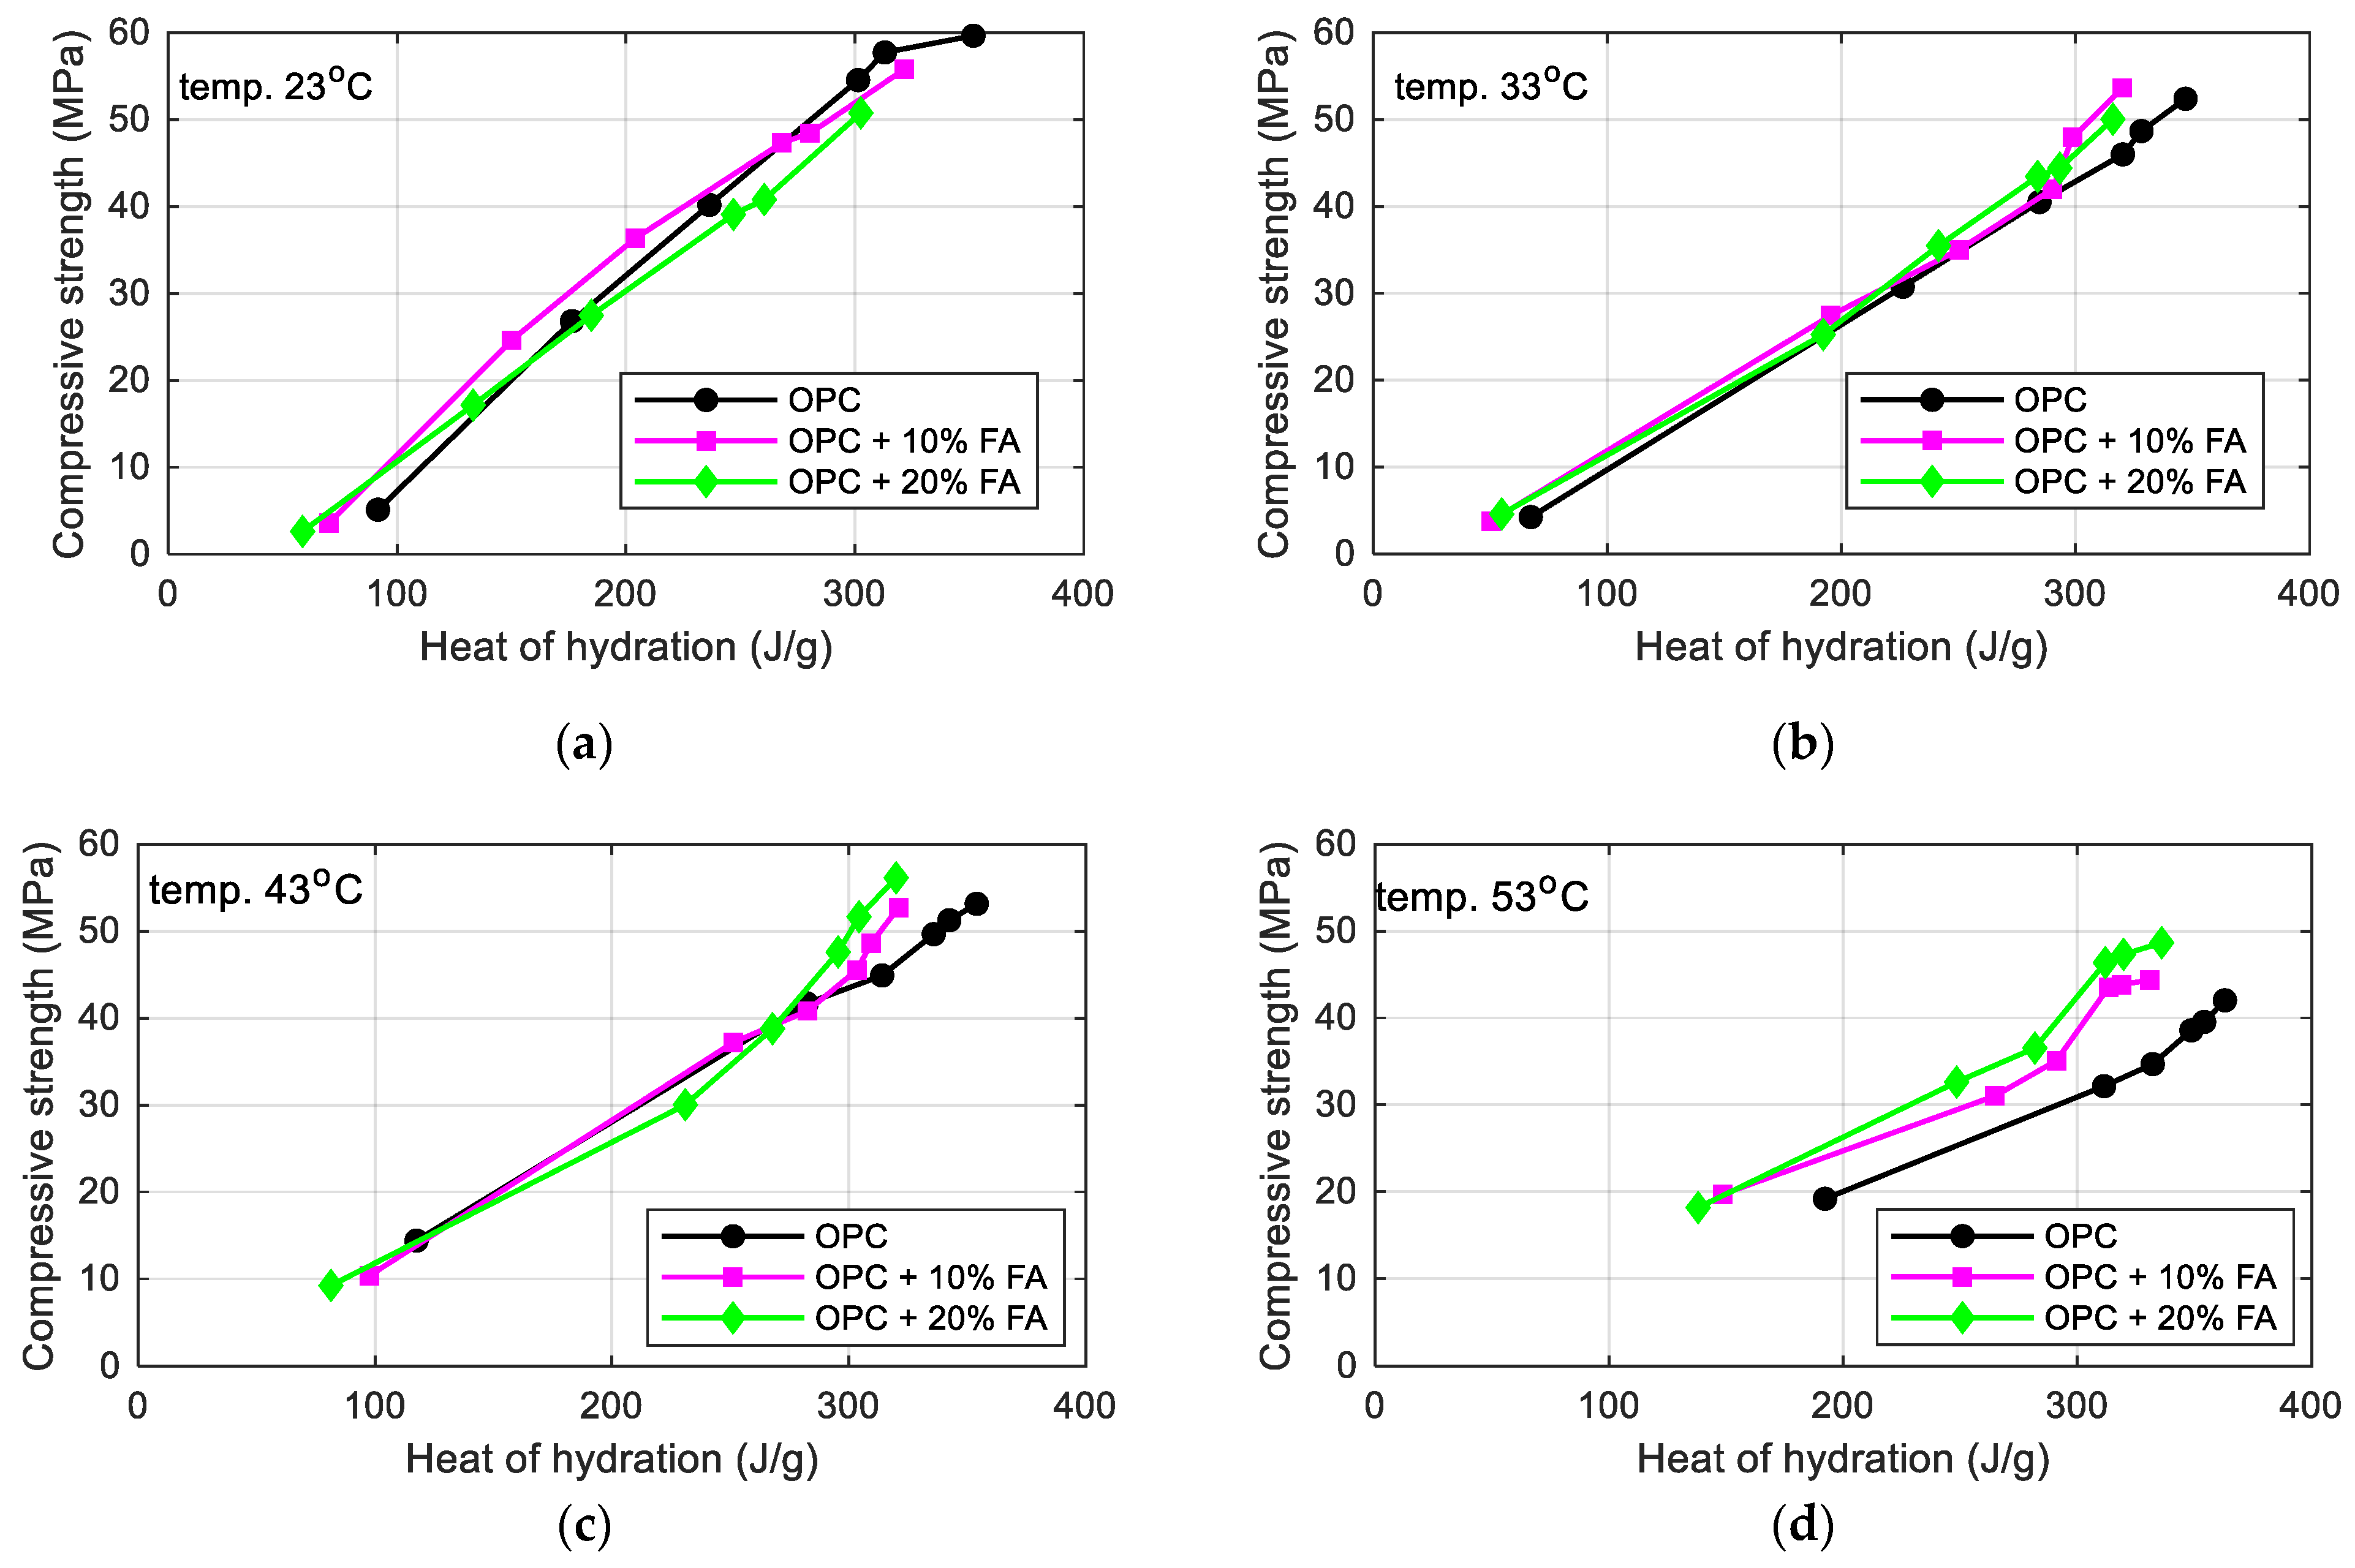
Figure 6.
Correlation of 7-day strength and heat of mortars cured at 23 °C.
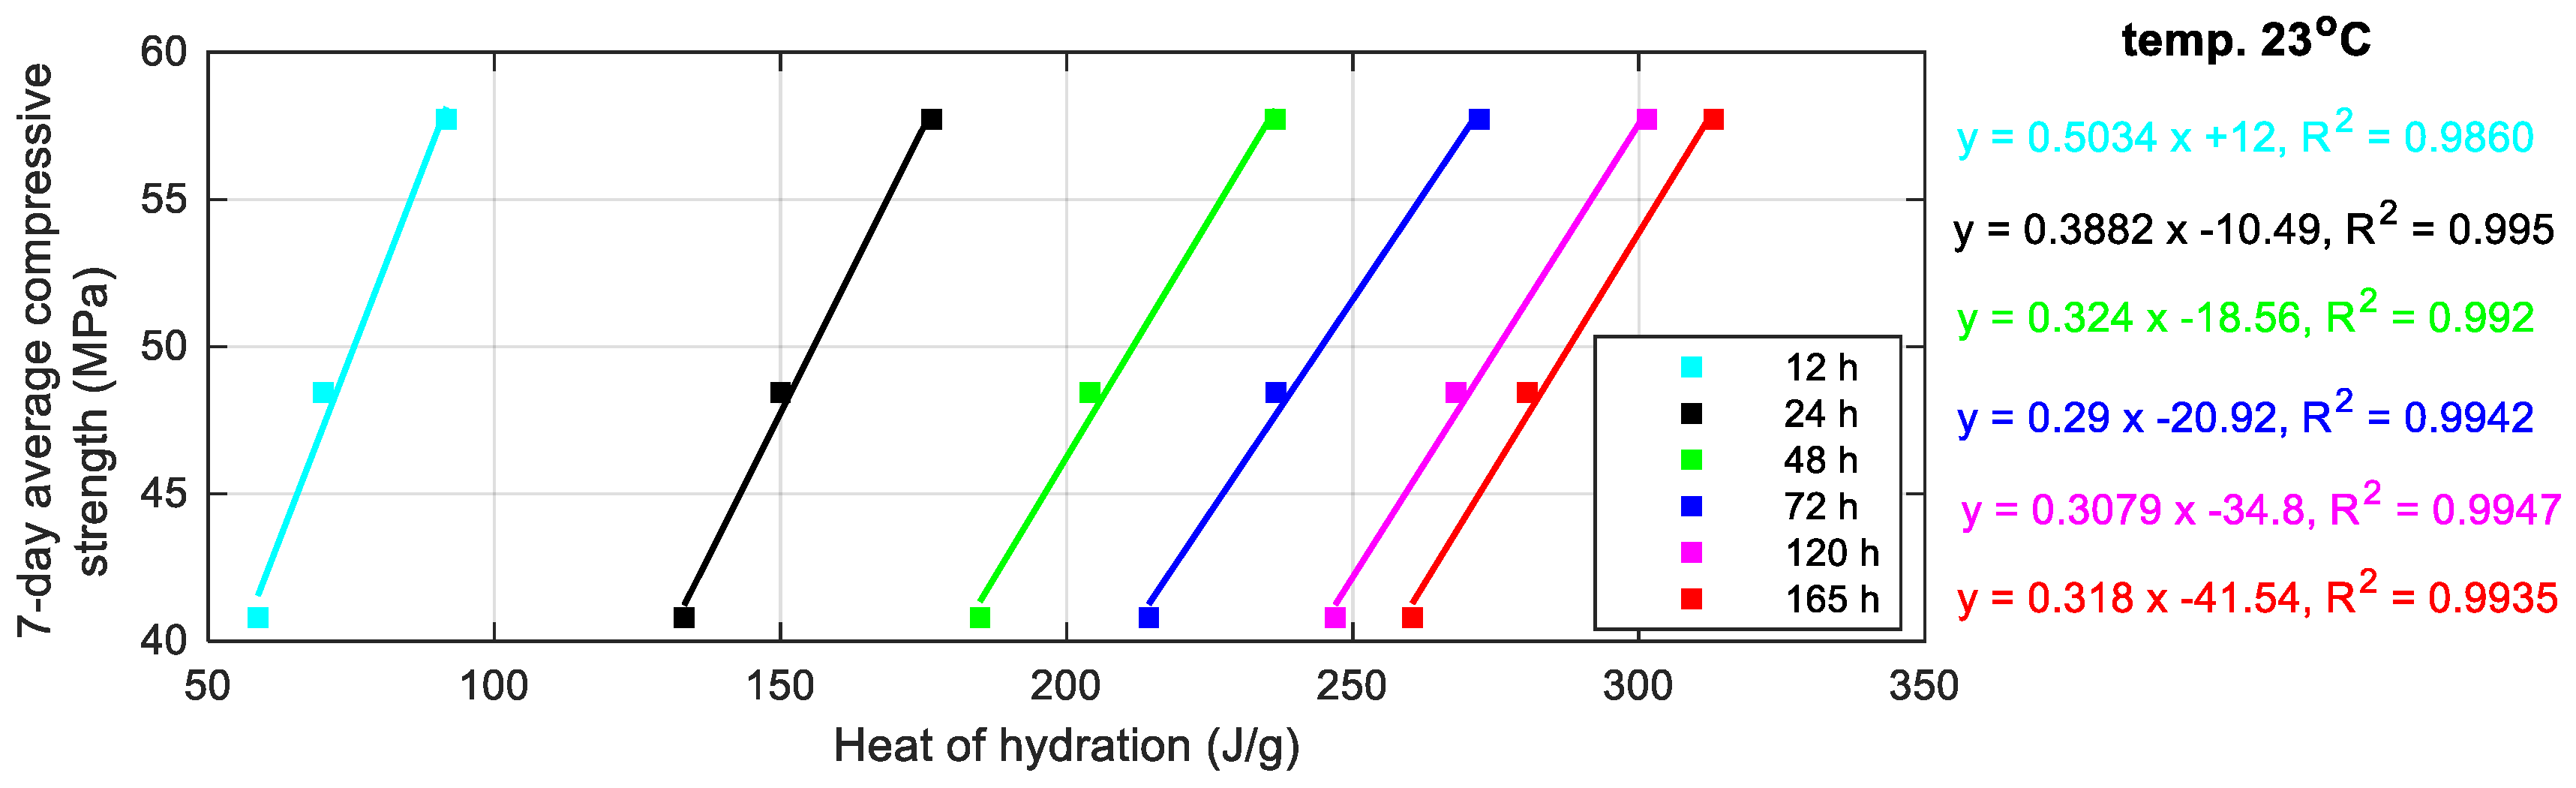
Figure 7.
Correlation of 7-day strength and heat of mortars cured at 33 °C.
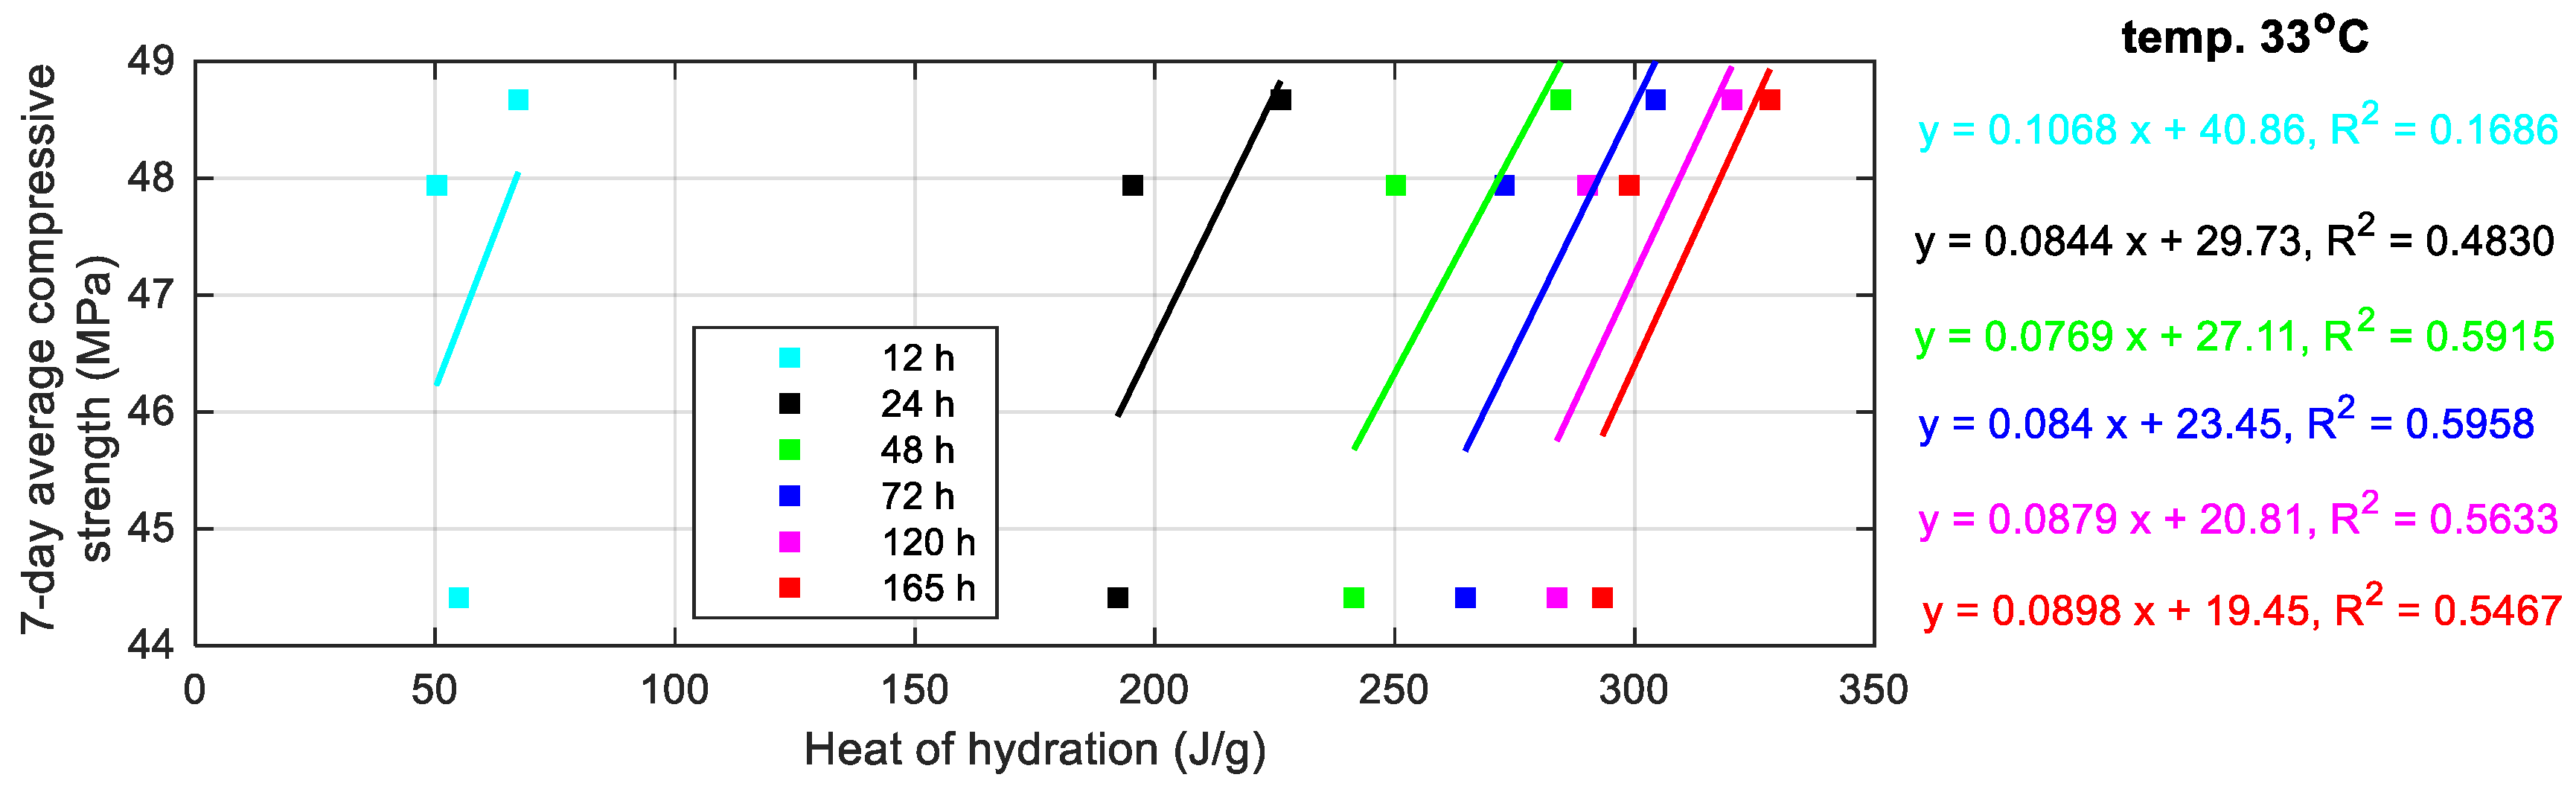
Figure 8.
Correlation of 7-day strength and heat of mortars cured at 43 °C.
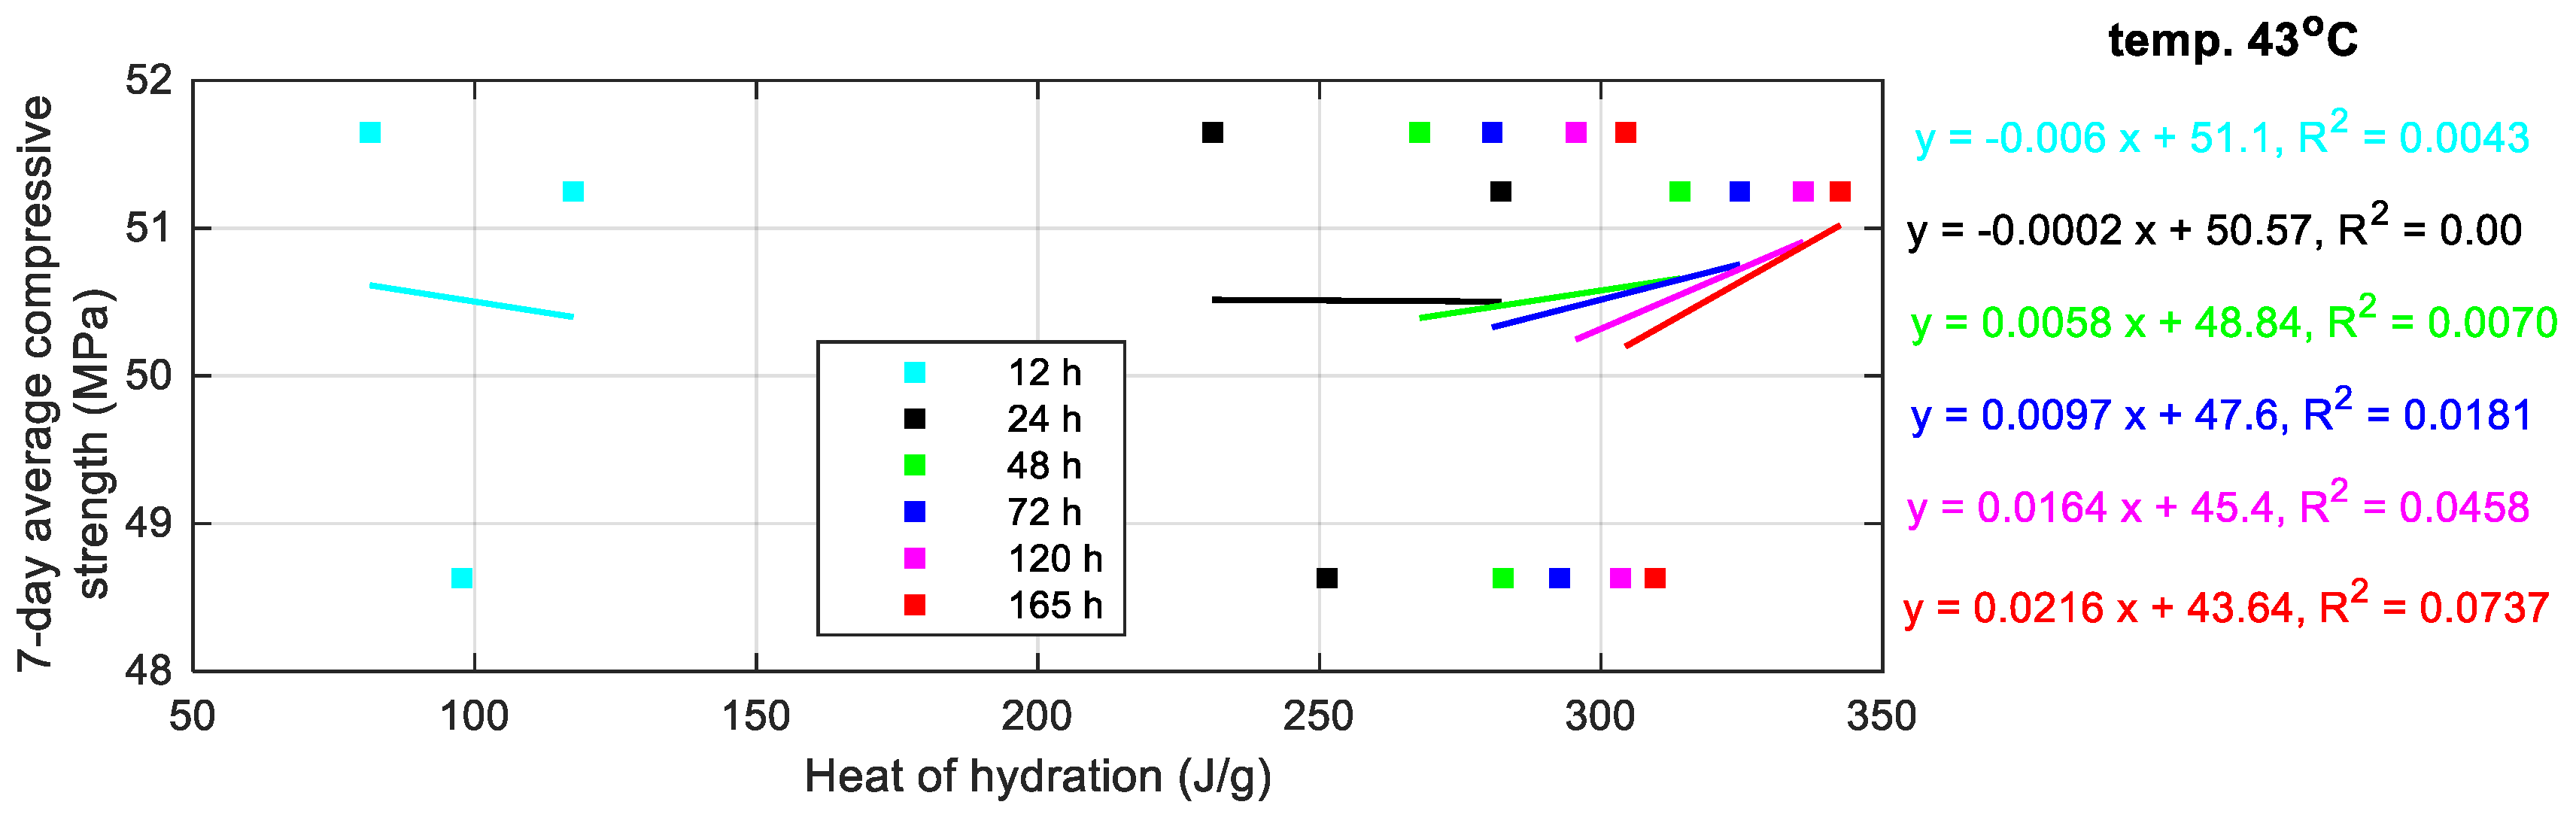
Figure 9.
Correlation of 7-day strength and heat of mortars cured at 53 °C.
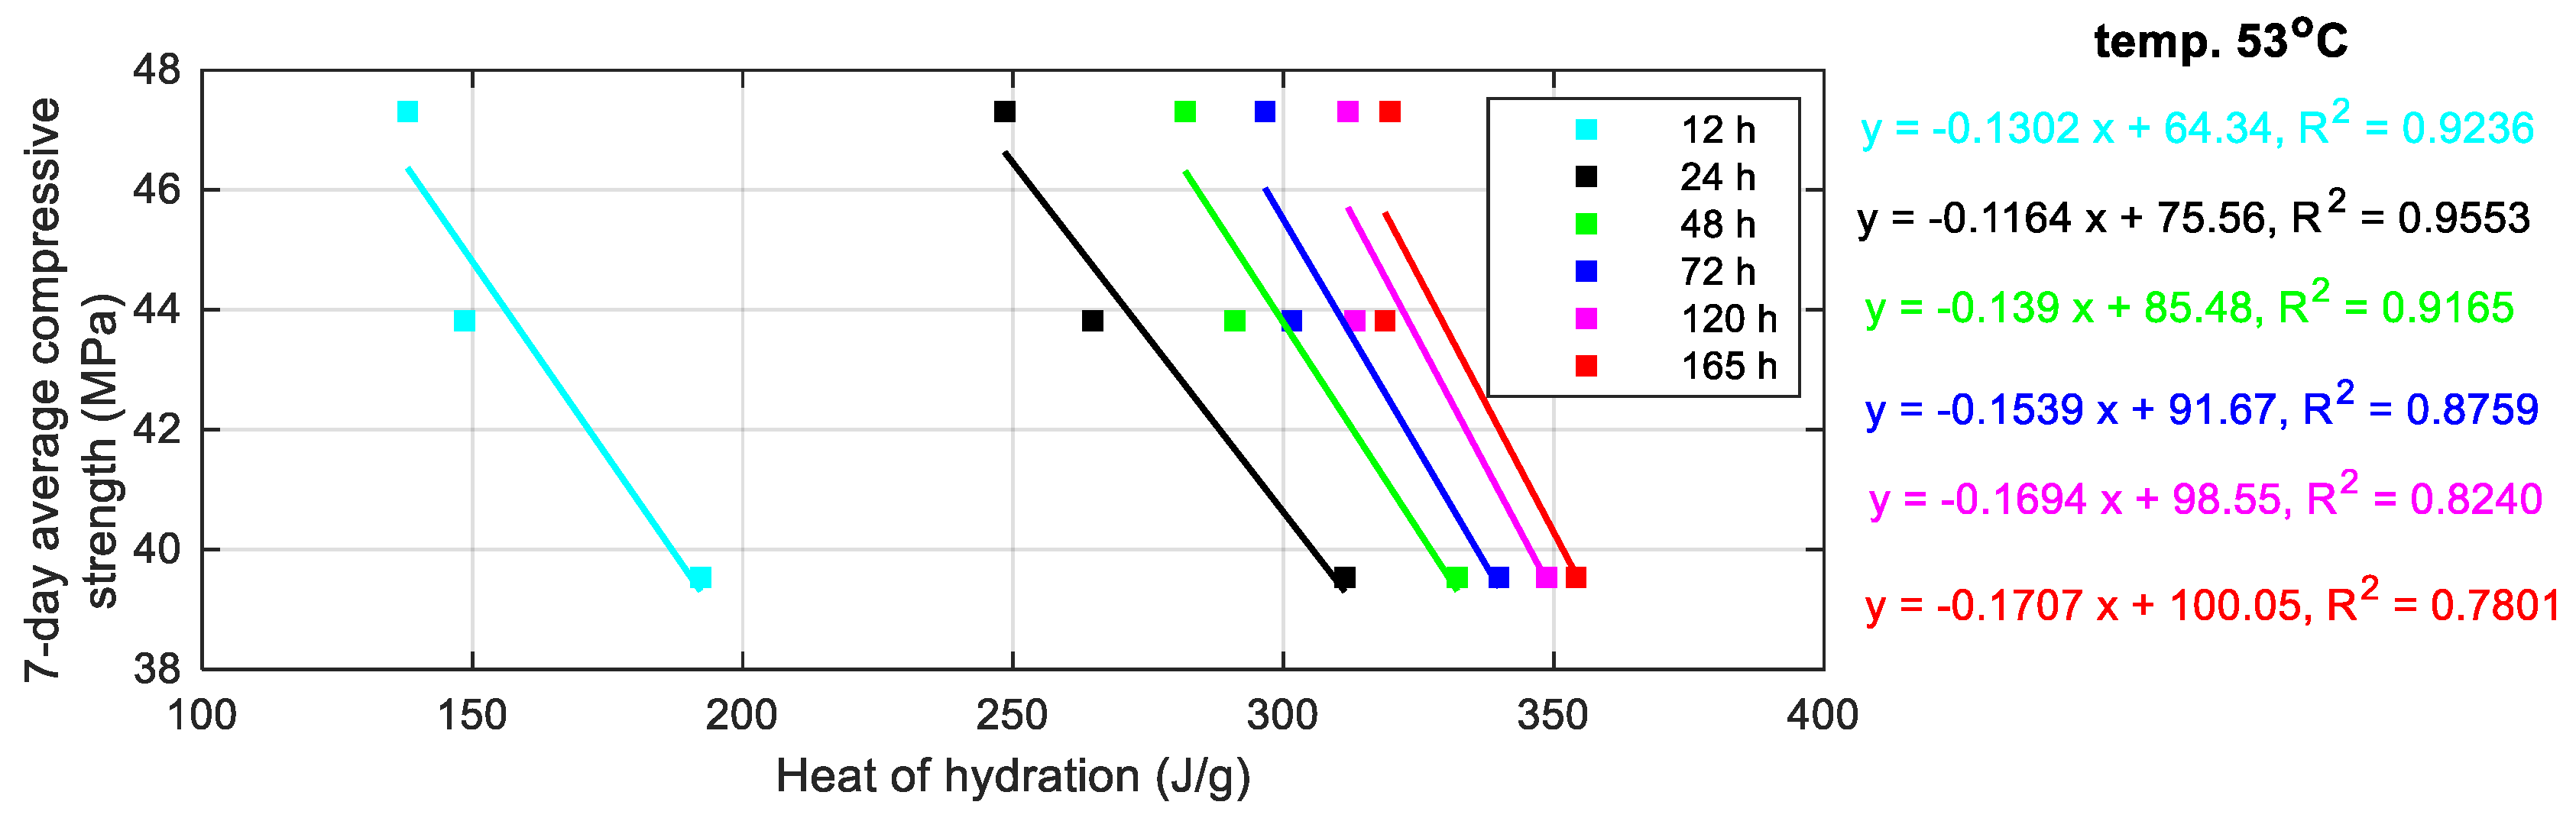
Figure 10.
Correlation of 14-day strength and heat of mortars cured at 23 °C.
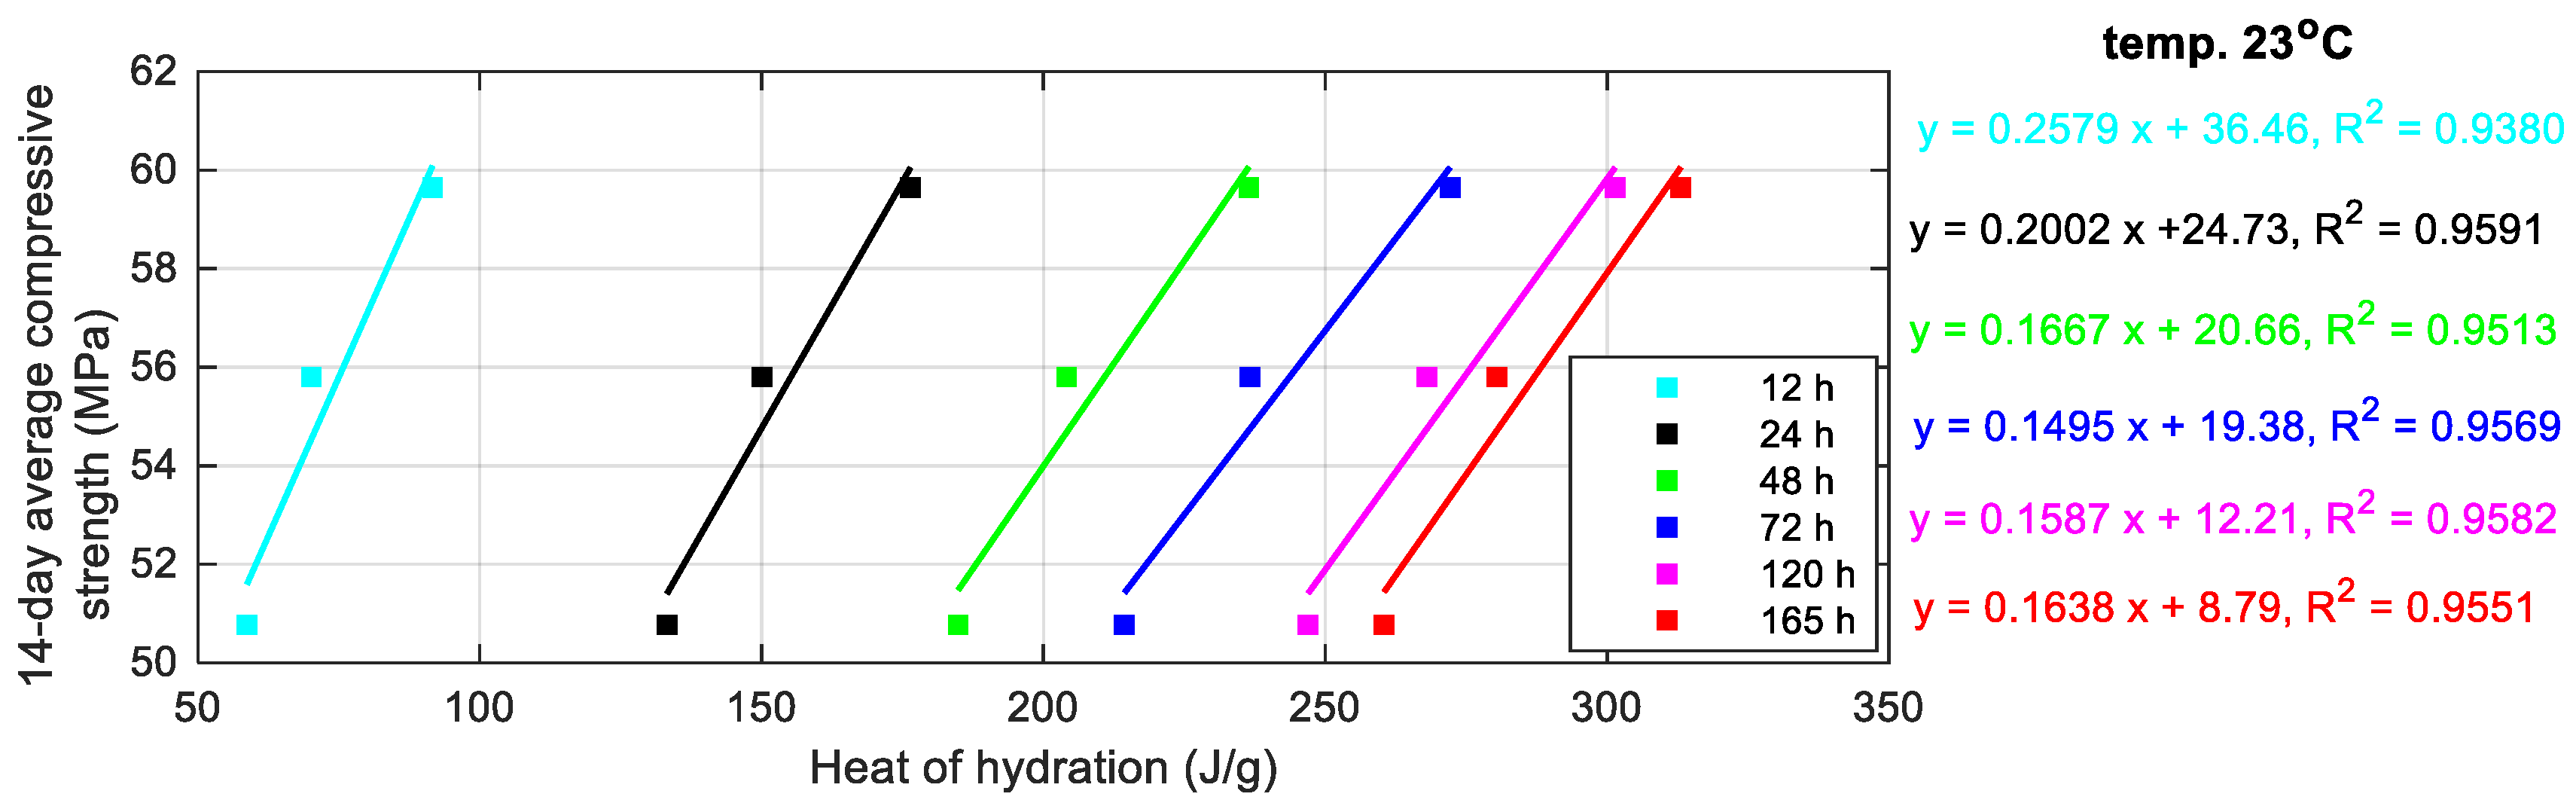
Figure 11.
Correlation of 14-day strength and heat of mortars cured at 53 °C.


Table 1.
Chemical compositions and physical properties of the materials.
| Property | OPC | FA | Requirements for Siliceous Fly Ash Acc. to EN 450-1 [30] |
|---|---|---|---|
| CaO (wt. %) | 64.08 | 3.65 | - |
| SiO2 (wt. %) | 21.23 | 55.44 | ≥25 |
| Al2O3 (wt. %) | 4.99 | 24.57 | - |
| SO3 (wt. %) | 2.97 | 0.62 | ≤3 |
| MgO (wt. %) | 2.48 | 2.57 | ≤4 |
| Fe2O3 (wt. %) | 2.23 | 6.36 | - |
| K2O (wt. %) | 0.92 | 3.04 | - |
| Na2O (wt. %) | 0.13 | 1.04 | - |
| Chloride content (wt. %) | 0.04 | - | - |
| LOI (wt. %) | 2.96 | 2.56 | class: A ≤ 5, B ≤ 7, C ≤ 9. |
| Density (g/cm3) | 3.05 | 2.10 | - |
| Specific surface area (cm2/g) | 2360 | 2250 | - |
| Fineness, sieve residue 0.045 mm (wt. %) | - | 32.9 | ≤40 (N), ≤12 (S) |
Table 2.
Composition of mortar mixtures, w/b = 0.40 1.
| Mix Proportions of the Mortars (kg/m3) | ||||
|---|---|---|---|---|
| Mortar Mix | Cement CEM I 42.5 R | Siliceous Fly Ash (FA) | Fine Aggregate 0–2 mm | Water |
| OPC | 440 | 0 (0%) | 1142 | 175 |
| OPC + 10% FA | 396 | 44 (10%) | 1142 | 175 |
| OPC + 20% FA | 352 | 88 (20%) | 1142 | 175 |
1 w/b = water/(cement + FA).
Table 3.
Heat of hydration.
| Mortar Mix | Temp. (°C) | Heat of Hydration after Hours (J/g) | ||||||||
|---|---|---|---|---|---|---|---|---|---|---|
| 12 h | 24 h | 36 h | 48 h | 60 h | 72 h | 120 h | 165 h | Total * | ||
| OPC | 23 | 92 | 176 | 212 | 236 | 257 | 272 | 301 | 313 | 352 |
| 33 | 148 | 226 | 263 | 284 | 297 | 304 | 320 | 328 | 347 | |
| 43 | 219 | 282 | 304 | 314 | 320 | 325 | 336 | 343 | 354 | |
| 53 | 263 | 311 | 326 | 332 | 337 | 340 | 349 | 354 | 363 | |
| OPC + 10% FA | 23 | 70 | 150 | 183 | 204 | 222 | 237 | 268 | 280 | 322 |
| 33 | 120 | 195 | 228 | 250 | 264 | 273 | 290 | 299 | 320 | |
| 43 | 193 | 251 | 273 | 283 | 288 | 293 | 303 | 310 | 321 | |
| 53 | 216 | 265 | 283 | 291 | 297 | 302 | 313 | 319 | 331 | |
| OPC + 20% FA | 23 | 59 | 133 | 165 | 185 | 201 | 214 | 245 | 260 | 303 |
| 33 | 122 | 192 | 221 | 242 | 255 | 265 | 284 | 293 | 316 | |
| 43 | 177 | 231 | 256 | 268 | 275 | 281 | 296 | 304 | 320 | |
| 53 | 203 | 248 | 270 | 282 | 290 | 297 | 312 | 320 | 336 | |
* extrapolated value.
Table 4.
Maximum peak value of heat generation rate.
| Mortar Mix | Temp. (°C) | Max. Peak (J/g/h) | Time of Peak Occurrence (h) |
|---|---|---|---|
| OPC | 23 | 8.1 | 15.9 |
| 33 | 13.4 | 11.7 | |
| 43 | 28.4 | 6.8 | |
| 53 | 58.6 | 4.6 | |
| OPC + 10% FA | 23 | 7.6 | 16.4 |
| 33 | 12.1 | 12.7 | |
| 43 | 26.2 | 6.9 | |
| 53 | 52.0 | 4.9 | |
| OPC + 20% FA | 23 | 6.6 | 17.9 |
| 33 | 11.7 | 12.8 | |
| 43 | 21.5 | 8.0 | |
| 53 | 47.6 | 5.1 |
Table 5.
The heat released due to 20% of siliceous fly ash at 165 h.
| Temperature (°C) | 23 | 33 | 43 | 53 |
|---|---|---|---|---|
| Amount of heat released due to 20% FA (J/g) | 9.6 | 30.6 | 29.6 | 36.8 |
Table 6.
Comparison of strength of mortar cured at 23 °C.
| Mortar Mix. | Strength after 7 Days (MPa) | Strength after 14 Days (MPa) | ||||
|---|---|---|---|---|---|---|
| Measured (MPa) | Calculated for R2 = 0.9950 (MPa) | Relative Error (%) | Measured (MPa) | Calculated for R2 = 0.9591 (MPa) | Relative Error (%) | |
| OPC | 57.73 | 57.83 | 0.2 | 59.65 | 59.97 | 0.5 |
| OPC + 10% FA | 48.44 | 47.74 | 1.4 | 55.80 | 54.76 | 1.9 |
| OPC + 20% FA | 40.80 | 41.14 | 0.8 | 50.77 | 51.36 | 1.2 |
Table 7.
Comparison of strength of mortar cured at 53 °C.
| Mortar Mix. | Strength after 7 Days (MPa) | Strength after 14 Days (MPa) | ||||
|---|---|---|---|---|---|---|
| Measured (MPa) | Calculated for R2 = 0.9553 (MPa) | Relative Error (%) | Measured (MPa) | Calculated for R2 = 0.8204 (MPa) | Relative Error (%) | |
| OPC | 39.54 | 39.36 | 0.5 | 42.03 | 41.64 | 0.9 |
| OPC + 10% FA | 43.82 | 44.71 | 2.0 | 44.38 | 45.92 | 3.5 |
| OPC + 20% FA | 47.31 | 46.69 | 1.3 | 48.65 | 47.50 | 2.4 |
Publisher’s Note: MDPI stays neutral with regard to jurisdictional claims in published maps and institutional affiliations. |
© 2022 by the author. Licensee MDPI, Basel, Switzerland. This article is an open access article distributed under the terms and conditions of the Creative Commons Attribution (CC BY) license (https://creativecommons.org/licenses/by/4.0/).
Share and Cite
MDPI and ACS Style
Kuryłowicz-Cudowska, A. Correlation between Compressive Strength and Heat of Hydration of Cement Mortars with Siliceous Fly Ash. Minerals 2022, 12, 1471. https://doi.org/10.3390/min12111471
AMA Style
Kuryłowicz-Cudowska A. Correlation between Compressive Strength and Heat of Hydration of Cement Mortars with Siliceous Fly Ash. Minerals. 2022; 12(11):1471. https://doi.org/10.3390/min12111471
Chicago/Turabian StyleKuryłowicz-Cudowska, Aleksandra. 2022. "Correlation between Compressive Strength and Heat of Hydration of Cement Mortars with Siliceous Fly Ash" Minerals 12, no. 11: 1471. https://doi.org/10.3390/min12111471
Note that from the first issue of 2016, this journal uses article numbers instead of page numbers. See further details here.