Article

Design Optimization of Alloy Wheels Based on a Dynamic Cornering Fatigue Test Using Finite Element Analysis and Multi-Additional Sampling of Efficient Global Optimization

by
Atthaphon Ariyarit
1,
Supakit Rooppakhun
1,*,
Worawat Puangchaum
1 and
Tharathep Phiboon
2
1
School of Mechanical Engineering, Institute of Engineering, Suranaree University of Technology, University Avenue, Nakhon Ratchasima 30000, Thailand
2
Institute of Research and Development, Suranaree University of Technology, Muang, Nakhon Ratchasima 30000, Thailand
*
Author to whom correspondence should be addressed.
Symmetry 2023, 15(12), 2169; https://doi.org/10.3390/sym15122169
Submission received: 13 November 2023 / Revised: 28 November 2023 / Accepted: 4 December 2023 / Published: 6 December 2023
(This article belongs to the Special Issue Applied Mechanics, Engineering and Modeling - Volume II)

Abstract

:
An alloy wheel is generally a symmetrically shaped part integral to a vehicle because its weight and strength can improve driving performance. Therefore, alloy wheel design is essential, and a novel design method should be considered. Currently, the Multi-Additional Sampling Efficient Global Optimization (MAs-EGO) has been proposed and widely implemented in various fields of engineering design. This study employed a surrogate model to maximize Expected Hypervolume Improvement (EHVI) for multi-objectives by increasing multi-sampling per iteration to update a surrogate model and evaluate an optimal point for alloy wheel design. Latin Hypercube Sampling (LHS) was used to generate an initial design of an alloy wheel, including the thickness and width of the spoke wheel. The maximum principal stress according to the dynamic cornering fatigue simulation was then evaluated for risk of failure using Finite Element (FE) analysis. The objectives were to minimize both the principal stress and weight of the symmetric alloy wheel. The Kriging method was used to construct a surrogate model, including a Genetic Algorithm (GA), which was performed to maximize hypervolume improvement to explore the next additional sampling point, and that point was also an optimal point for the process when computation had converged. Finally, FE results were validated through a designed apparatus to confirm the numerical solution. The results exhibit thatMulti-Additional Sampling Efficient Global Optimization can achieve an optimal alloy shape. The maximum principal stress distribution occurs in the spoke area and exhibits a symmetrical pattern around the axis following the cyclic bending load. The optimal design point of the alloy wheel can reduce 20.181% and 3.176% of principal stress and weight, respectively, compared to the initial design. The experimental results are consistent trend in the same direction as FEA results.

1. Introduction

Alloy wheels, such as passenger cars or pickup trucks, are essential to automobiles carrying heavy things or commercial products. Alloy wheels generally have a symmetrical shape and are classified into four types, namely disc type, spoke type, fin type, and mesh type, respectively, including principal components such as rim and wheel disc, as shown in Figure 1. Each wheel supports the whole body of the vehicle in balance with static and dynamic loads depending on carrying weight, velocity, and road surface. Because of those loads, there is concern about the strength of the alloy wheel structure, and its geometric parameter is significant to be determined to reach safety requirements and standards. Generally, a passenger car wheel must pass three standard tests before running mass production: the dynamic radial fatigue test, the dynamic cornering fatigue test, and the impact test. However, mechanical engineering design and wheel analysis require predicting deformation and fatigue failure before pilot model testing [1]. The mechanical design of alloy wheels with Finite Element Analysis (FEA) simulation is imperatively utilized for fatigue life prediction, because it is more flexible for modeling part geometries, applying material properties, and types of load. Strength analysis of three-wheel materials, such as magnesium, aluminum, and alloy steels, for passenger cars using the FEA model, is performed to determine the optimal geometry and mass under a dynamic load. The result revealed that the steel alloy was the foremost among the three types in terms of ultimate strength, followed by aluminum and magnesium. However, its mass increased the rotational inertia of entire wheels. From the fatigue strength test, aluminum was the best material for lightweight wheels. The magnesium wheel showed failure in the shortest fatigue cycle; however, the aluminum wheel could withstand the complex dynamic load, exhibiting load fatigue life. Stress analysis from the FEA results revealed that maximum stress concentration is represented around the connecting area between the rim and the drop center, where the rim plays a role as the first support of radial load from tires [2,3].
Structure Optimization of alloy wheels through validation of FEA simulation models with actual experiments under static load was present in several previous studies. P. Rammurty et al. [4] performed an experiment fatigue test of aluminum alloy 356.2 T2 of alloy wheel to find a correlation between stress and fatigue for taking properties of it to apply to FEA, and compared the result from simulations against Japan Light Alloy Wheel Standard ISO 3006:2015. The result showed that test was pass; in addition, this FEA modeling cloud be utilized to estimate life cycle of 356.2 T2 alloy wheel. Liangmo Wang et al. [5] improved the dimension of alloy wheels to avoid maximum stress around screw holes by using FEA to predict the fatigue life cycle for decreasing cost before manufacturing. Xiaofeng Wang et al. [6] studied the dynamic cornering fatigue test prediction by the fundamental failure theory of alloy wheels and calculation of fatigue life considering bilinear isotropic hardening, multi-axis fatigue, and rain-flow counting the Palmgren-Miner rule; the crack area of the alloy wheel from FEA was consistent with the experiment. Dong [7] designed the shape of an alloy wheel under dynamic cornering fatigue test with FEA by considering stress distribution and deformation on the alloy wheel, simulated fatigue life according to transient structural with cyclic loading, and analyzed design variables of alloy wheel by response surface method with nine initial sampling from design of experiment. Sourav Das [3] diagnosed the weight loss of the alloy wheel by applying FEA with radial loading distribution and determined AlSi as a material of the alloy wheel. The radial fatigue test, cornering fatigue test, and impact test were considered using the FE simulation, and the result depicted that the optimal shape of the alloy cut its weight but still passed the standard fatigue test. D.H. Burande and T.N. Kazi [8] performed an alloy wheel with dynamic cornering fatigue test and radial fatigue test following ISO 3006:2015, using FE simulation, which compared two material types, namely aluminum A356 and aluminum 7075-T6 on both methods; the result showed that aluminum A356 provided FEA result was close to experiment rather than another. Rakesh B. Thakare [9] executed a type alloy wheel on FEA with a dynamic cornering fatigue test for comparing strain against an experiment under the Society of Automotive Engineering (SAE) standard, aimed around holes fixing between wheel and disc, and both results were agreeable.
Previous works tried to perform FEA and experiment; an original optimization method has been provided to design alloy wheels, such as response surface optimization. Another way of optimization design is Efficient Global Optimization (EGO). This technique is a high computational cost optimization process, especially in structure design problems, because most designs require experiments to verify numerical simulation and optimization results. The EGO process begins with generating an initial sampling point set by the design of the experiment. Then, yield is collected by engineering solution, namely: (1) analytical method such as failure theory, (2) numerical method such as FEA, and (3) experiment method such as dynamic cornering fatigue test. The surrogate model is used to predict the correlation between design variables (input) and yield (output). Finally, data improvement is executed by the optimization method to search for an optimal point of the surrogate model. That point is the next additional sampling point for evaluation to increase the accuracy of the surrogate model by adding the next sampling point into the model [10]. The optimization method with a surrogate model is famous for being utilized in various fields such as chemical engineering design [11,12], mechanical engineering design [13,14], material engineering analysis [15,16], biomedical engineering [17] and especially in aerospace engineering design [18,19] because of high computation time or cost experiment in this field. Furthermore, the original EGO was designed for exploring only a Single Additional sampling (Sas) point per iteration that previous research performed on the design shape of airfoil [20] and blade of the helicopter [21] with multi-objective and multi-level fidelity of valuation. Hence, several research works studied addition with multi-sampling per iteration using parallel computing techniques tested with mathematics functions to prove a novel algorithm [22,23]. Therefore, Multi-Additional sampling (MAs) EGO can save several iterations of computation and quickly converge the answer rather than SAs-EGO or the original EGO. Moreover, MAs-EGO can be achieved with airfoil design [24].
Due to the advantage of MAs EGO, this present work was purposed to utilize MAs EGO for applying alloy wheel design based on the dynamic cornering fatigue test. The FE analysis was performed to a single fidelity for output evaluation, including the Kriging method, which was then used to construct a surrogate model. The multi-objective and escalation of multi-sampling per iteration for the recreation surrogate model are considered. Finally, the designed apparatus is used to validate the result of the FE simulation.

2. Multi-Objective Efficient Global Optimization

The EGO or the original EGO procedure can be displayed in Figure 2. Firstly, the EGO starts with generating the initial sampling for input or design variables. This process is called the design of experiment (DOE); the user can use various methods for implementation, such as full factorial, Central Composite Design (CCD), Latin Hypercube Sampling (LHS), etc. Secondly, the created input was collected using an analytical, numerical, or experimental method to collect the output or yield. Thirdly, the input and output were brought together to find a correlation called a surrogate model; there are many methods to construct it, such as Response Surface, the Kriging method, the Radial Basis Function (RBF), etc. Finally, a surrogate model was performed into the Expected Improvement equation (EI). The EI was maximized by an arbitrary optimization method to determine the uncertainty area known as the following sampling point but needed only a single one. The following sampling point was used to find the subsequent output by the collection process. A surrogate model was updated with a new input and output, repeating the step until the answer was converged. The last result is an answer to the EGO process [10].

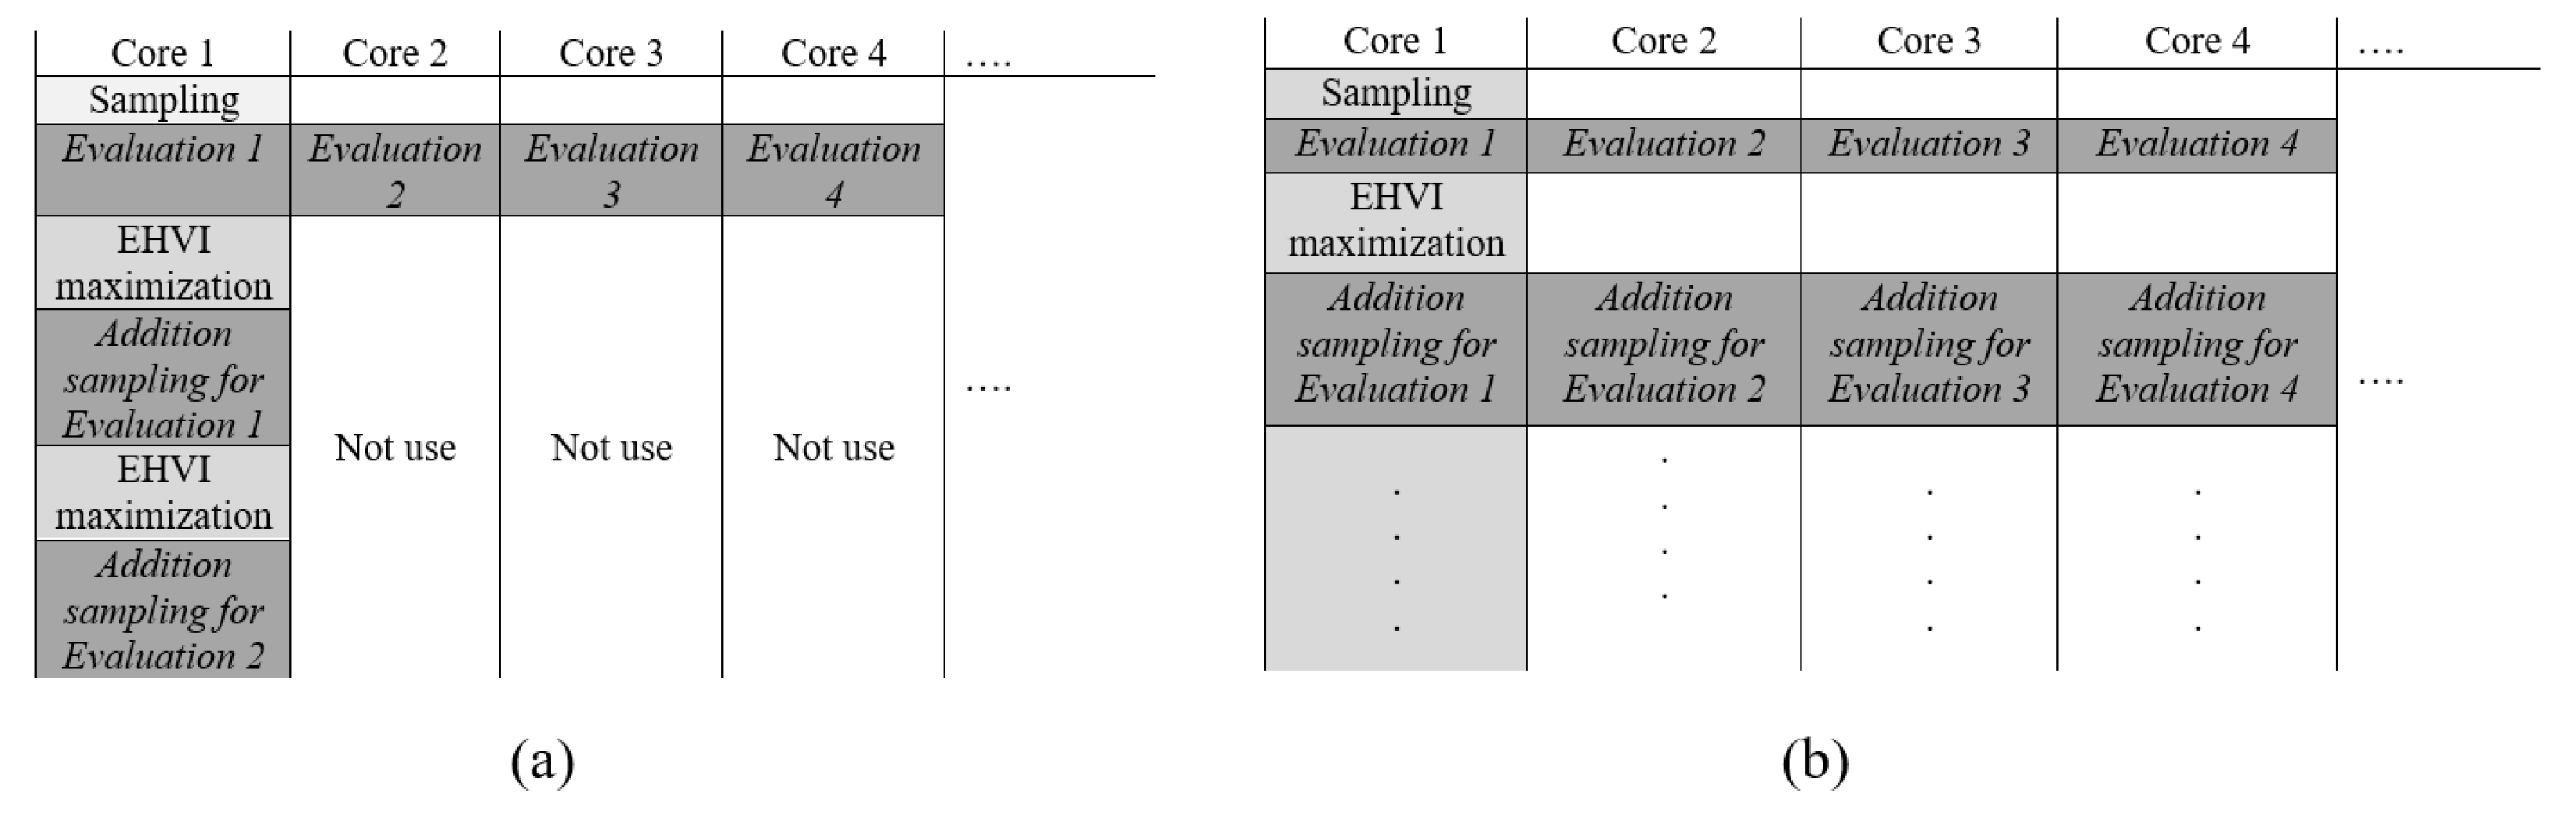
2.1. Multi-Additional Sampling

Generally, the EGO with a single objective is an uncomplicated problem. A surrogate model represents an objective correlation between input and output, as shown in Figure 2b. As mentioned previously, the EI has been involved in solving single objective EGO, in which EI is the equation for the function of the hypervolume improvement combined with the uncertainty of the additional sampling point. An arbitrary optimization method is used to search for an additional sampling point by maximizing the EI; the EI at point x can be defined as the following equation.
E [ I ( x ) ] = r e f ( f r e f y ^ ( x ) ) Φ ( y ^ ( x ) ) d y
where E [ I ( x ) ] is the expected improvement function, Φ is the probability density function, given the mean and variance that represents uncertainty about y ^ ( x ) , and y ^ ( x ) is the prediction value from the surrogate model. Integration from r e f to over d y is the probability value from to the reference point of the amount of improvement that is expected over the function of response (y).
The EGO with multi-objective is rather complicated to deal with EI. Hence, EI has developed its algorithm to become Expected Hypervolume Improvement (EHVI). The EHVI can be manipulated with multi-objective; the EHVI at point x can be defined as:
E H V I [ f 1 ( x ) , f 2 ( x ) , , f M ( x ) ] = f r e f 1 f r e f 2 f r e f M H V I [ f 1 ( x ) , f 2 ( x ) , , f M ( x ) ] × ϕ 1 ( F 1 ) ϕ 2 ( F 2 ) ϕ M ( F M ) d F 1 d F 2 d F M ,
where F i is denoted as a Gaussian random function N [ f ^ i ( x ) , s ^ i 2 ( x ) ] . ϕ i ( F i ) is the probability function and f r e f i the reference value used for calculating the hypervolume.
The original EGO has obtained only a single additional sampling per iteration. The schematic process of the original EGO is shown in Figure 2a. Also, it can be performed only by single-core computation. Here, Figure 3a shows a diagram of a single computation EGO and other available cores; however, it cannot perform for other evaluations. Therefore, to break through a limitation of the original EGO, parallel core computation is released to assist in the calculation process of EGO converges rapidly by improving the original EGO to become MAs EGO as shown in a diagram of parallel computation EGO in Figure 3b [23].
This present work was to implement the MAs with multi-objective EGO. Therefore, the schematic process of MAs EGO was updated, as shown in Figure 2b. Then, Equation (2) was applied for multi-objective, and Figure 2b is the implementation process of this work.

2.2. Kriging Method

The Kriging method is a spatial interpolation method that originated in mining geology and uses a limited set of sampled data points to estimate the value of a variable over a continuous spatial field. An ordinary kriging method insists on a global model and a local deviation to estimate the unknown function y ^ ( x ) [25] as follows:
y ^ ( x ) = μ ( x ) ε ( x )
where μ ( x ) and ε ( x ) are global model and a local deviation, respectively. The sample points x are interpolated with the Gaussian random function. To find ε ( x ) the correlation between Z ( x i ) and Z ( x j ) is related to the distance between the two corresponding points x i and x j . Therefore, a local deviation is expressed as:
d ( x i , x j ) = k = 1 m θ k | x i k x j k | 2
Corr [ Z ( x i ) , Z ( x j ) ] = exp d ( x i , x j )
where θ k ( 0 θ k ) is the correlation vector parameter element, and n is the sample point number. The Kriging equation can be rearranged as follows:
y ^ ( x ) = μ ( x ) + r T R 1 ( F μ ^ )
where F = [ f ( x 1 ) , f ( x 2 ) , f ( x 3 ) , , f ( x n ) ] T is the value of the evaluated function at X = { x 1 , x 2 , x 3 , , x n } , R is represented to the n × n matrix, in which ( i , j ) entry is Corr [ Z ( x i ) , Z ( x j ) ] and r is the vector ith element [26] as follows:
r i ( x ) = Corr [ Z ( x i ) , Z ( x j ) ]
where μ is the constant value in the original Kriging model and μ ^ is given by:
μ ^ = [ μ 1 , μ 2 , μ 3 , , μ n ] T
and μ is defined as:
μ = 1 T R 1 F 1 T R 1 1
The unknown parameter, μ , for the original Kriging model can be estimated through maximum likelihood estimation as:
ln ( μ , σ 2 , θ ) = n 2 ln σ 2 1 2 ln | R |
The maximum likelihood estimation function is an m-dimension unconstrained nonlinear optimization problem and σ 2 can be defined as:
σ 2 = ( F μ ^ ) T R 1 ( F μ ^ ) n
The mean square error s 2 ( x ) at a point x of this function can be calculated by using the equation:
s 2 ( x ) = σ 1 r T R 1 r + 1 T R 1 F 1 T R 1 1
where 1 denotes an n-dimensional unit vector.

2.3. Genetic Algorithm

The genetic algorithm (GA) [27] is a meta-heuristic optimization method for solving both constraint and unconstraint, and only single objective optimization problems based on natural selection, which drives biological evolution—the procedure of GA first starts with determining chromosome form and generating the initial population. Secondly, the objective function value is set for searching optimal chromosomes, and fitness evaluation is considered for contesting each chromosome. Thirdly, the genetic operation is involved to evaluate chromosomes for finding a new generation of chromosomes that is sufficient strength to deal with fitness function. Genetic operation consists of selection, crossover, and mutation, respectively. The selection method is to select the initial chromosome that contributes to the population of the next generation. The crossover method combines two previous chromosomes called parents to form the next chromosome, called children for the next generation. The mutation method is to apply random changes to individual parents to children. The GA procedure repeats until it gets strong children to determine the fitness function. The processes of GA and genetic operation are presented in Figure 4.

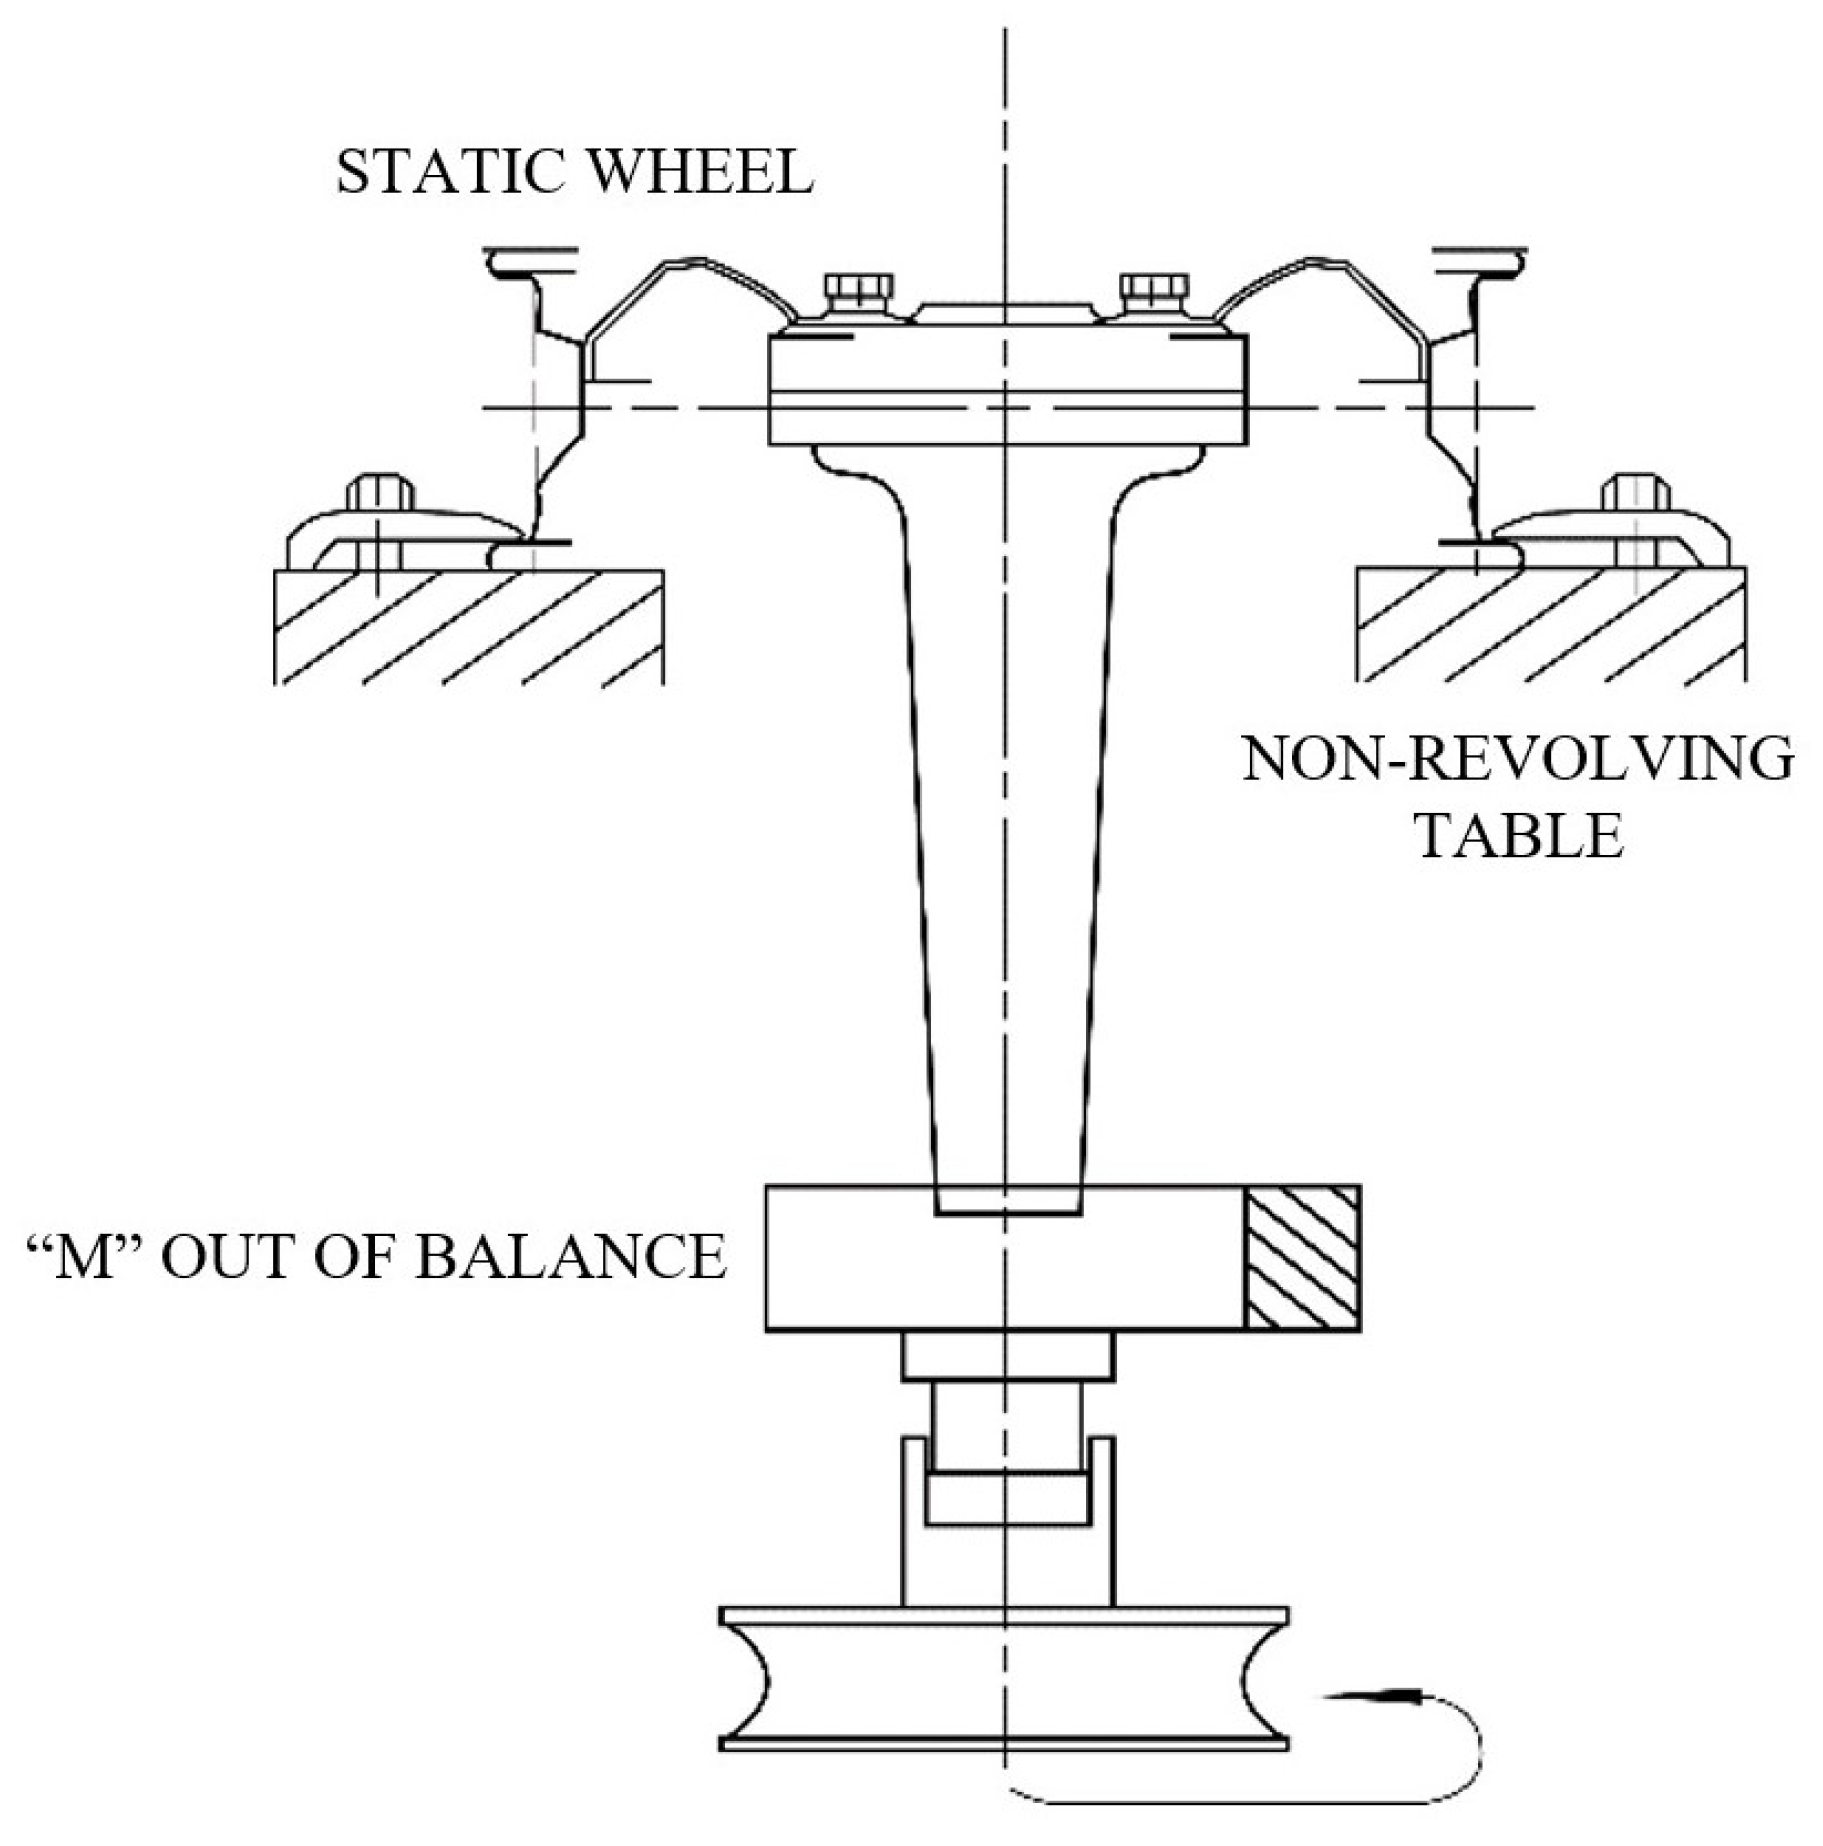
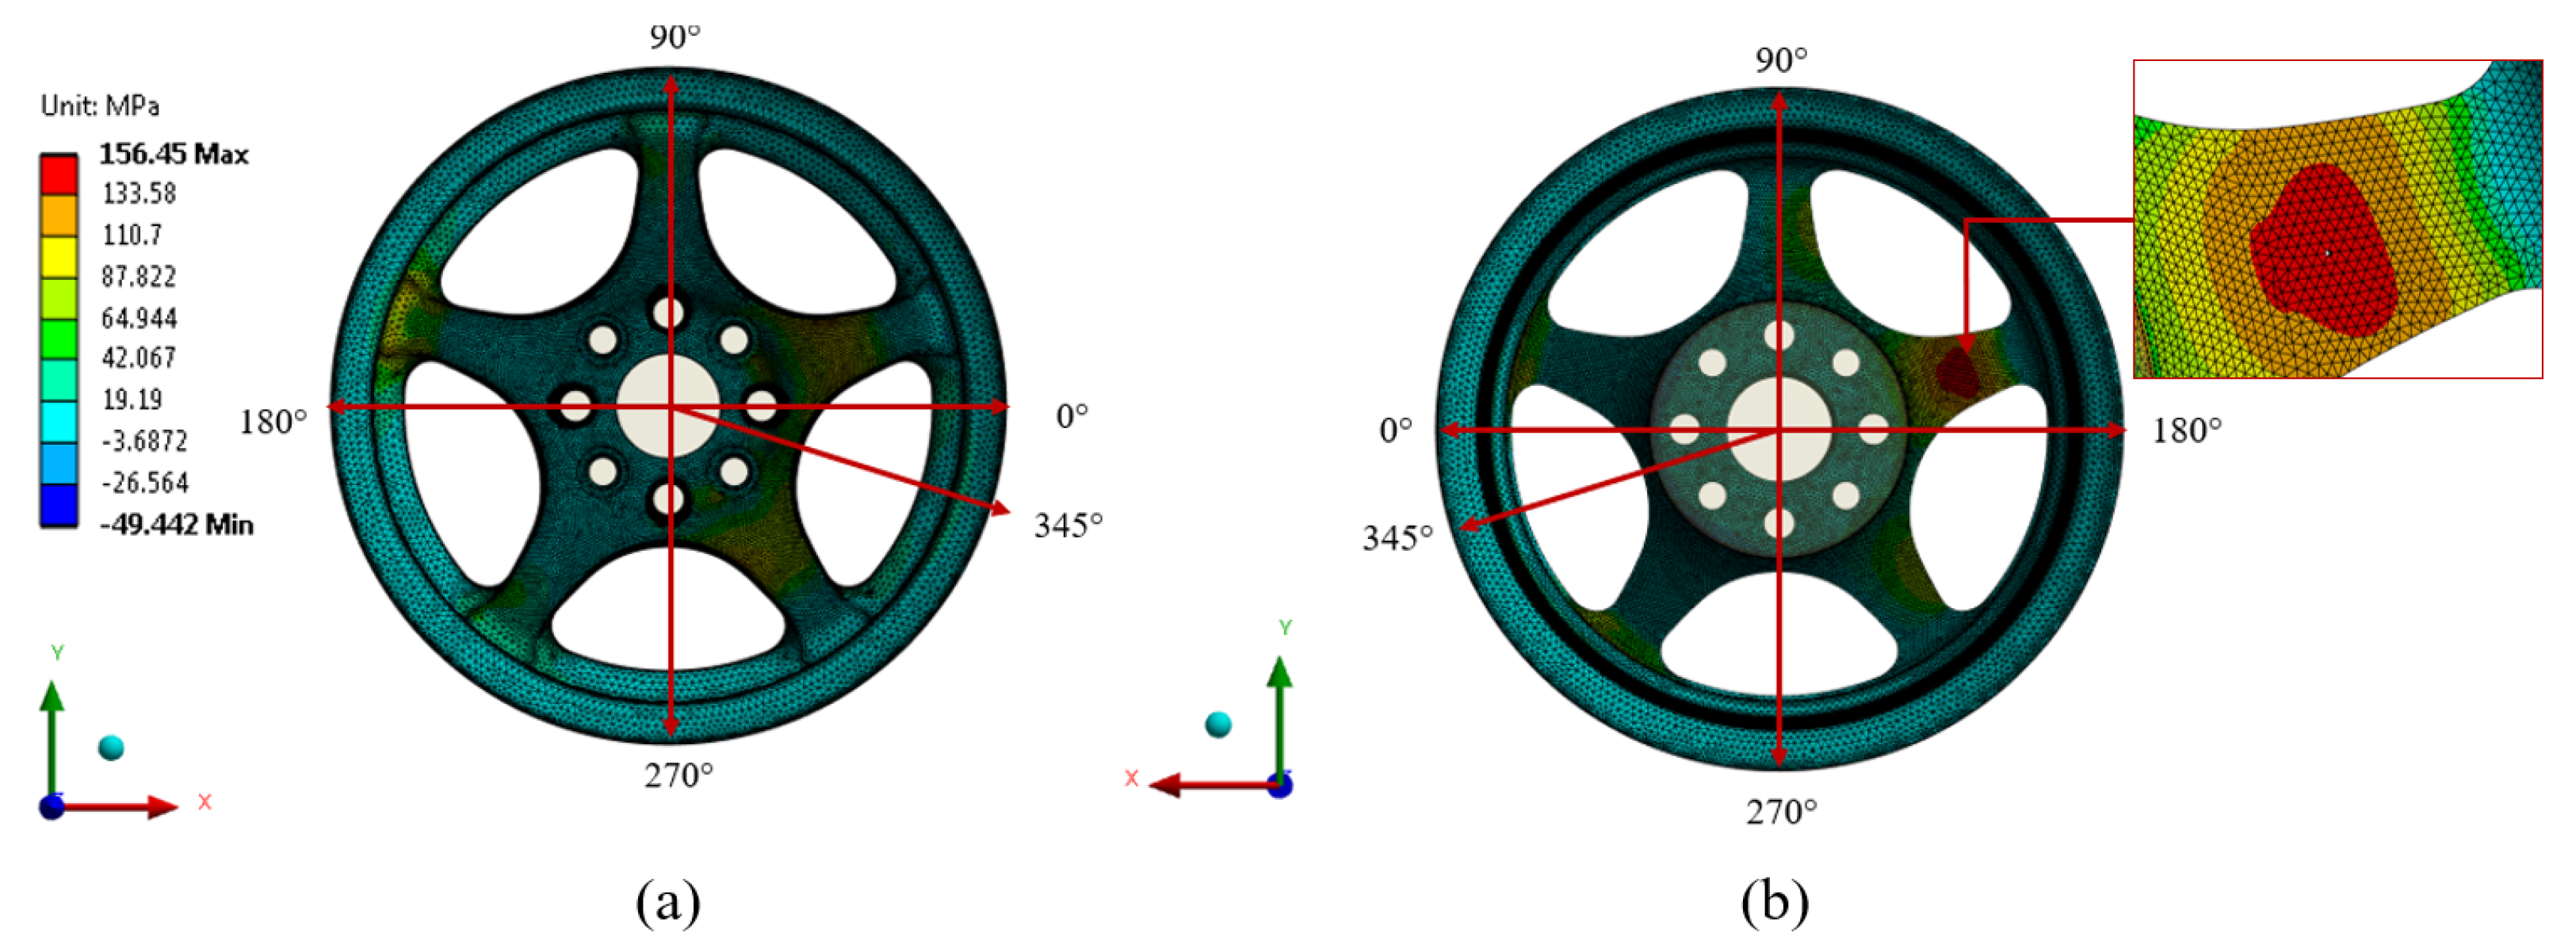
3. Dynamic Cornering Fatigue Analysis

The dynamic cornering fatigue test simulates twisting load conditions on a single wheel during driving. The fixtures clamp the downside flange of the rim, and a load arm shaft is attached to the mounting surface of the wheel. A test load with a symmetrical constant cyclical rotation and bending is applied on the arm shaft end. The bending moment of testing can be calculated from Equation (13). Figure 5 shows a typical setup of the cornering fatigue test for evaluating the cornering fatigue of the alloy wheel according to the ISO 3006:2015 standard [28].
M b , m a x = S F v ( μ r d y n + d )
where S is the safety factor, F v is the maximum load on the wheel (N), μ is the friction coefficient between the tire and the road (≈ 0.7), r d y n is the maximum rotation radius that the tire acts on the wheel (m), d is the offset distance from the center alignment of wheel (m). The test will be passed when the rotation is at least 1.0 × 10 5 cycles without any cracks on the wheel.

4. Materials and Methods

The procedure of the entire present work is shown in Figure 6. The DOE is to choose a random thickness and width of the wheel spoke as initial variables by setting several samplings from the user. The FE analysis was performed to collect principal stress as yield through computational simulation. A surrogate model is to construct a correlation between design variables and alloy wheel yield and data improvement to maximize EHVI for multi-objective and add a multi-sampling point to update a surrogate model. The algorithm has been running until the solution converges. In addition, the FE results were validated by the dynamic cornering fatigue test. Details of each method have been described intensively in the topics below.

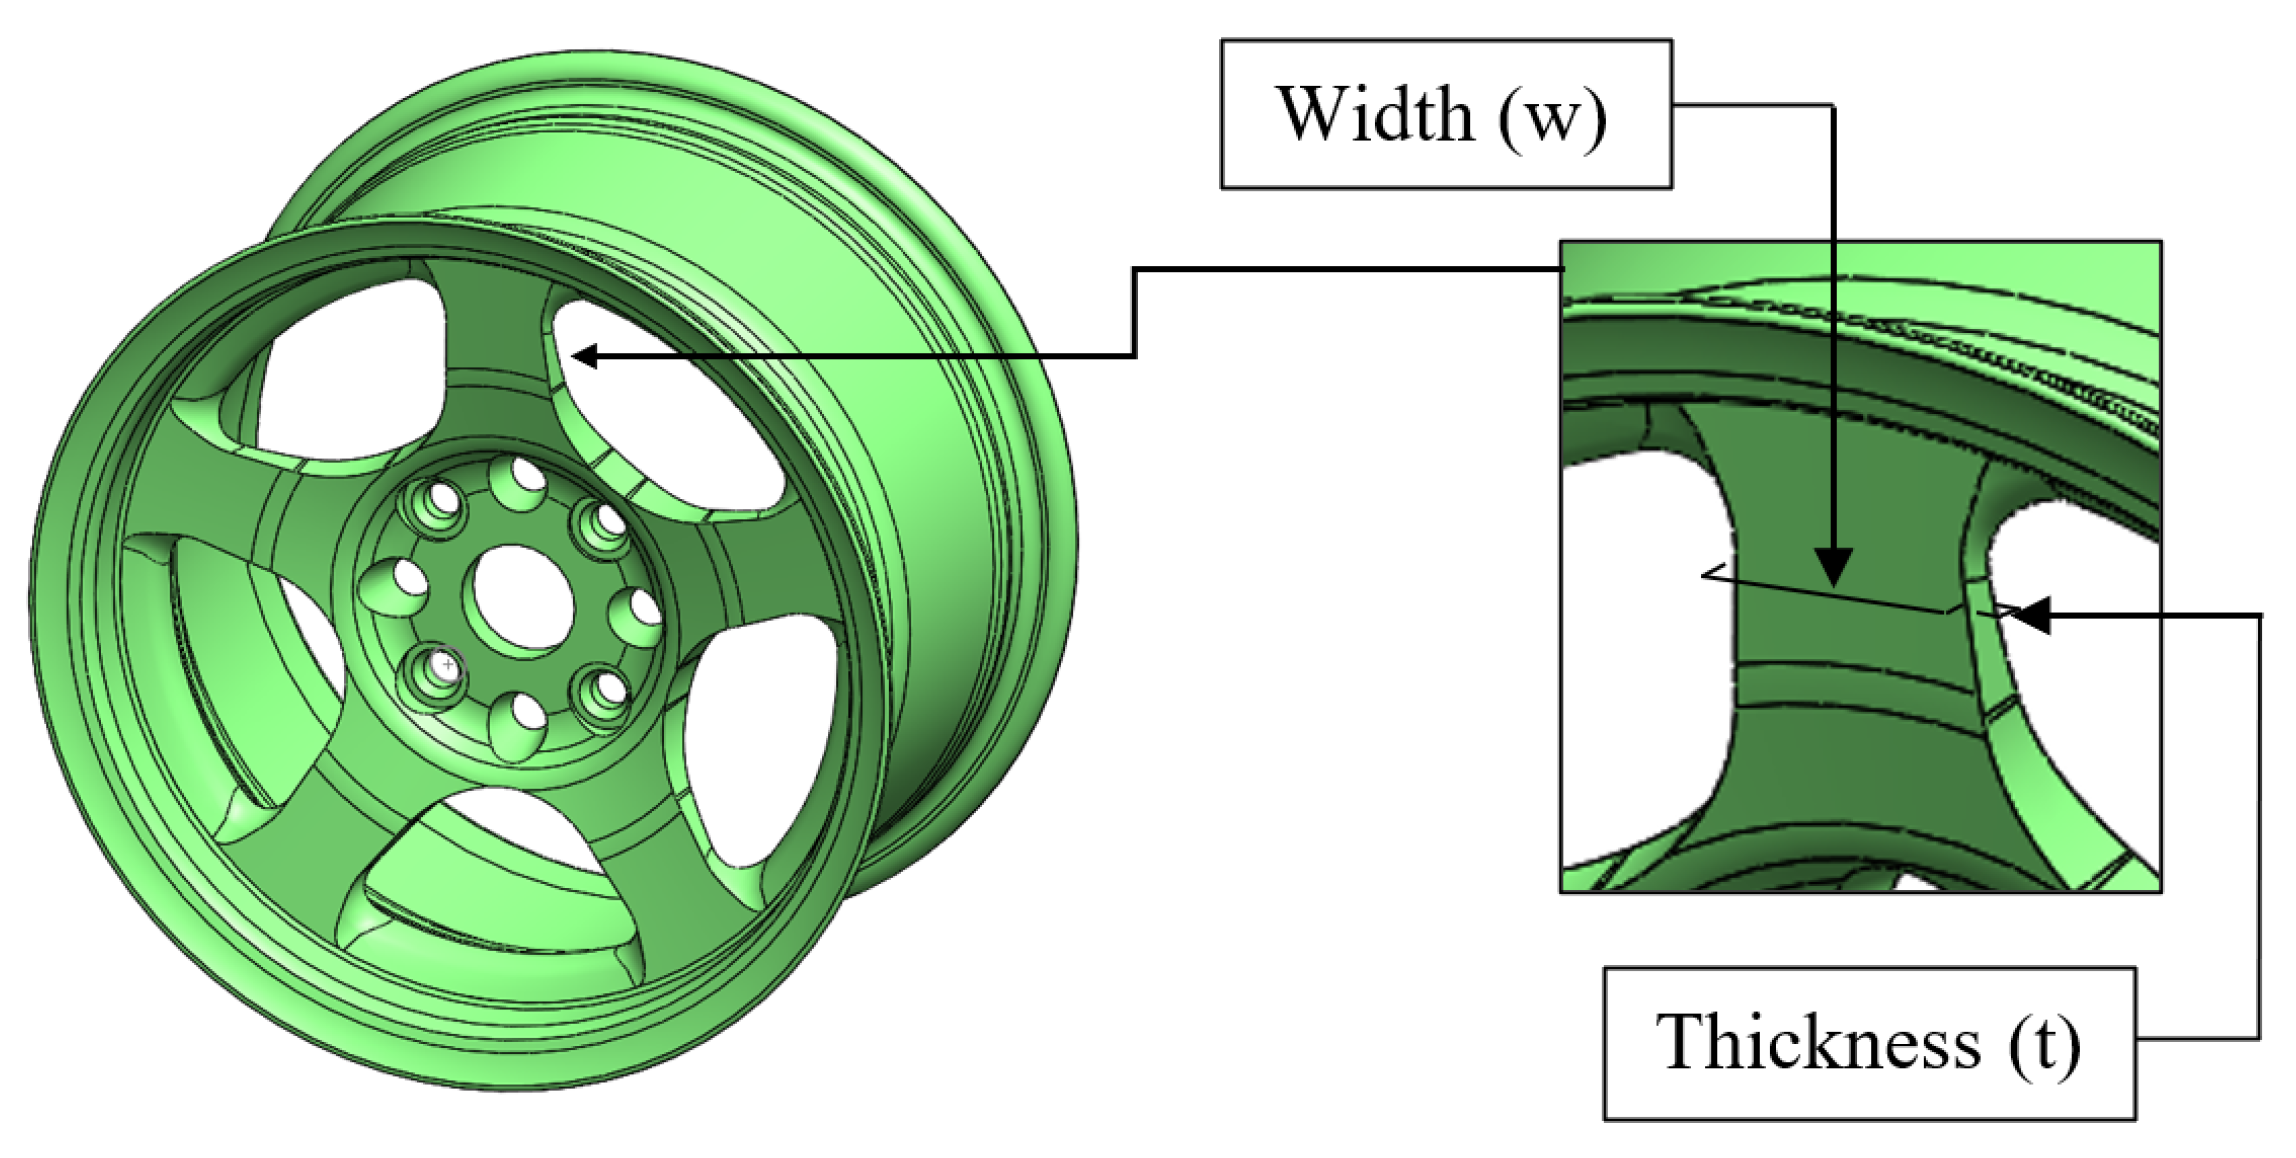
4.1. Design of Experiment

The DOE is the first procedure of MAs-EGO to choose randomly as initialization of design variables. When the alloy wheel has been tested by dynamic cornering fatigue test, stress concentration mainly appears between the rim and the spoke end. That is a critical point for failure during tests [29]. Hence, the thickness and the width of the spoke of the alloy wheel should be considered in the design of this present work, as shown in Figure 7. The thickness range was initialized from 13 mm to 18 mm, while the width also had 58 mm to 63 mm of design range. The LHS generates the initial sampling point of design variables because the user can prescribe number sampling [30,31]. Thirty initial design variables were created, and Figure 8 represented the distribution of initial sampling among the design range. The main feature of LHS was generating different sampling on the vertical and horizontal axis. As a consequence, the initial sampling could be unable for repetition.

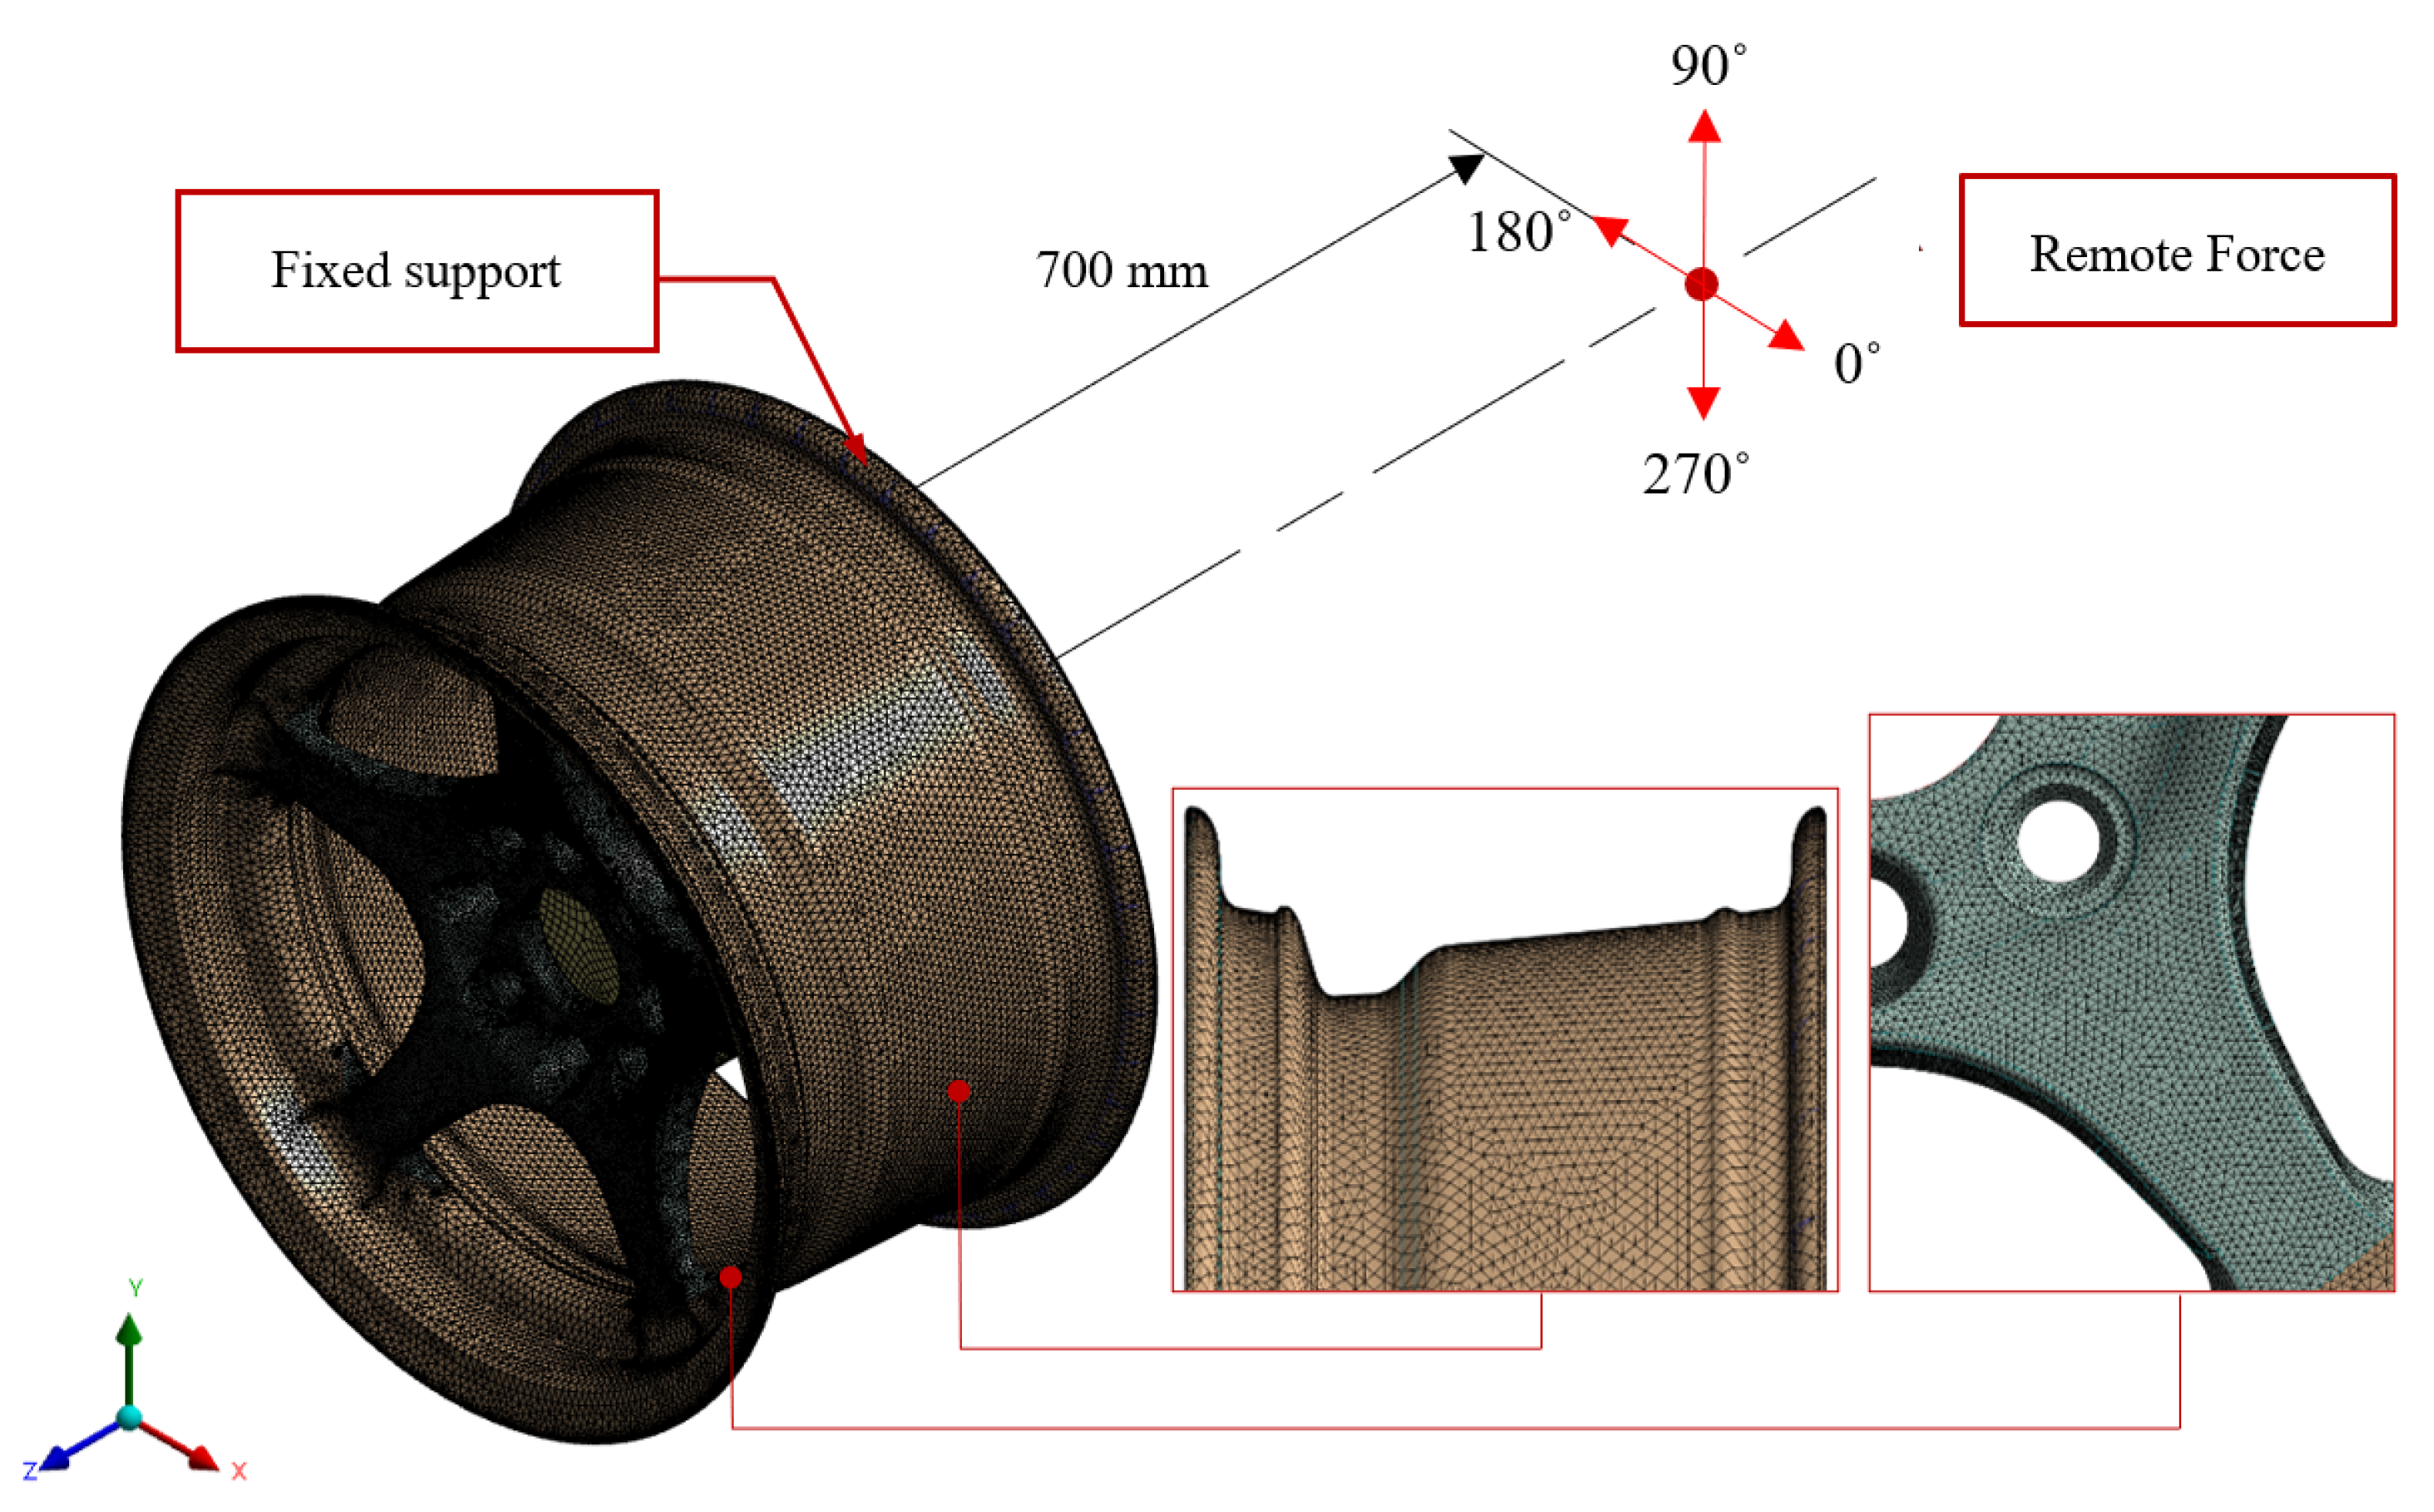
4.2. Finite Element Simulation

A case study of an axisymmetrical 13-inch diameter aluminum alloy wheel was performed in this study. The assumption of linear elastic homogenous isotropic material was considered. Generally, the aluminum alloy with A356 grade of material was usually used in alloy wheel industries with different chemical ingredients, depending on the manufacturer. The chemical composition of alloy-A356 was obtained from testing several aluminum alloy-A356 specimens with standard tensile test (ASTM E8/E8M). Table 1 and Table 2 displayed the chemical composition and mechanical properties of Alloy-A356, respectively.
The fatigue test under symmetrical cyclic load also tested another set of Al Alloy A356 specimens. The test data were collected to find a relationship between the stress and life cycle (S-N cycle) for the input of the dynamic cornering fatigue model. The S-N curve obtained from the fatigue test is shown in Figure 9.
The tetrahedron element was used for the FE of the alloy wheel. According to the boundary condition, the region of the wheel rim was considered fixed support. The distance between the remote force and rim was equal to 700 mm according to the dynamic cornering fatigue test of the ISO 3006:2015 standard. The remote load was used and calculated from Equation (13). The remote force was executed as a cyclic loading starting from 0 degrees in a step of 15 degrees, increasing until the completed cycle following the dynamic cornering fatigue test, as shown in Figure 10.
This study performed mesh convergence testing to verify that the FE result was significantly independent according to mesh refinement. The element size was considered between 10.0 mm to 2.0 mm until the different percentages changing of the maximum total displacement was less than 1%, as shown in Figure 11. The result revealed that the displacement changed insignificantly between 4 mm size and 2 mm size, with a 0.179% difference with the total element number of 757,720 elements.
Figure 12 and Figure 13 showed the FE results of maximum principal stress and maximum deformation of the alloy wheel, respectively. The spoke area suffers the largest maximum stress distribution, which is a symmetrical pattern around the axis under the cyclic bending load. The magnitude of maximum principal stress of 156.5 MPa occurred on the spoke area zone of a rear wheel region according to the cyclic loading of 345 degrees, because that position was performed directly to a spoke of the wheel, as shown in Figure 12a,b, which is consistent with past research [7,29]. However, it did not exceed the yield strength of the material. In addition, the result of maximum displacement was approximately 0.4 mm on the spoke of the wheel opposite to the maximum principal stress region. The loading direction of 345 degrees was directly performed with the bending moment to the spoke wheel. Nevertheless, this deformation was still in a linear isotropic range that did not affect permanent failure [32,33,34].

4.3. Surrogate Model and Data Improvement

Surrogate Model

A surrogate model is used to determine a correlation between input and output. In this study, the input is the thickness and width of the wheel, while the output is the principal stress and weight, respectively. According to the Kriging method, the multi-objective problem minimizes the principal stress and weight was performed. μ ( x ) was calculated from Equation (7), then estimated the maximum likelihood function to find θ from Equation (2) and substituted into Equation (10) to receive local deviation ε ( x ) , producing a Kriging model by integrating μ ( x ) and ε ( x ) , as shown in Equation (14):
Minimize : σ P ( t , w ) Minimize : W ( t , w ) subject to : 58 mm t 63 mm 13 mm w 18 mm
where σ P ( t , w ) and W ( t , w ) are the principal stress and weight of alloy wheel that depended on the thickness and width of the allow wheel, respectively.

4.4. Data Improvement

Data improvement is meant to evaluate the maximum hypervolume improvement. HVI aimed to calculate the uncertainty area values of the objective function. For searching HVI, two objective functions of this present work were put into the expected hypervolume equation. The answer of EHVI was additional sampling, and to become multi-additional sampling, this additional sampling was predicted yield by the kriging model for the process cycle. This study proposes three additional sampling points per iteration; when additional sampling was three points, they were taken to evaluate from FE simulation. Results from FE simulation were activated instead of prediction results, and updated as a surrogate model. The process was repeated until it converged according to the number of two objective functions in the EHVI equation, which became one, as shown in Equation (13). Hence, genetic algorithms can be applied to this equation. The population was initialized to 50, and generation was set to 50. Tournament search was selected for the selection process. The crossover method was Blend Crossover Operator (BLX) with a 0.9 crossover rate. A mutation rate value of 0.1 was requisite to prevent replication of the next generation’s population. The total computation of population was 2500 times for this present work.
Maximize : E H V I [ σ P ( t , w ) , W ( t , w ) ] = σ P W H V I [ σ P , W ] × Φ 1 ( σ P ) d σ P Φ 2 ( W ) d W

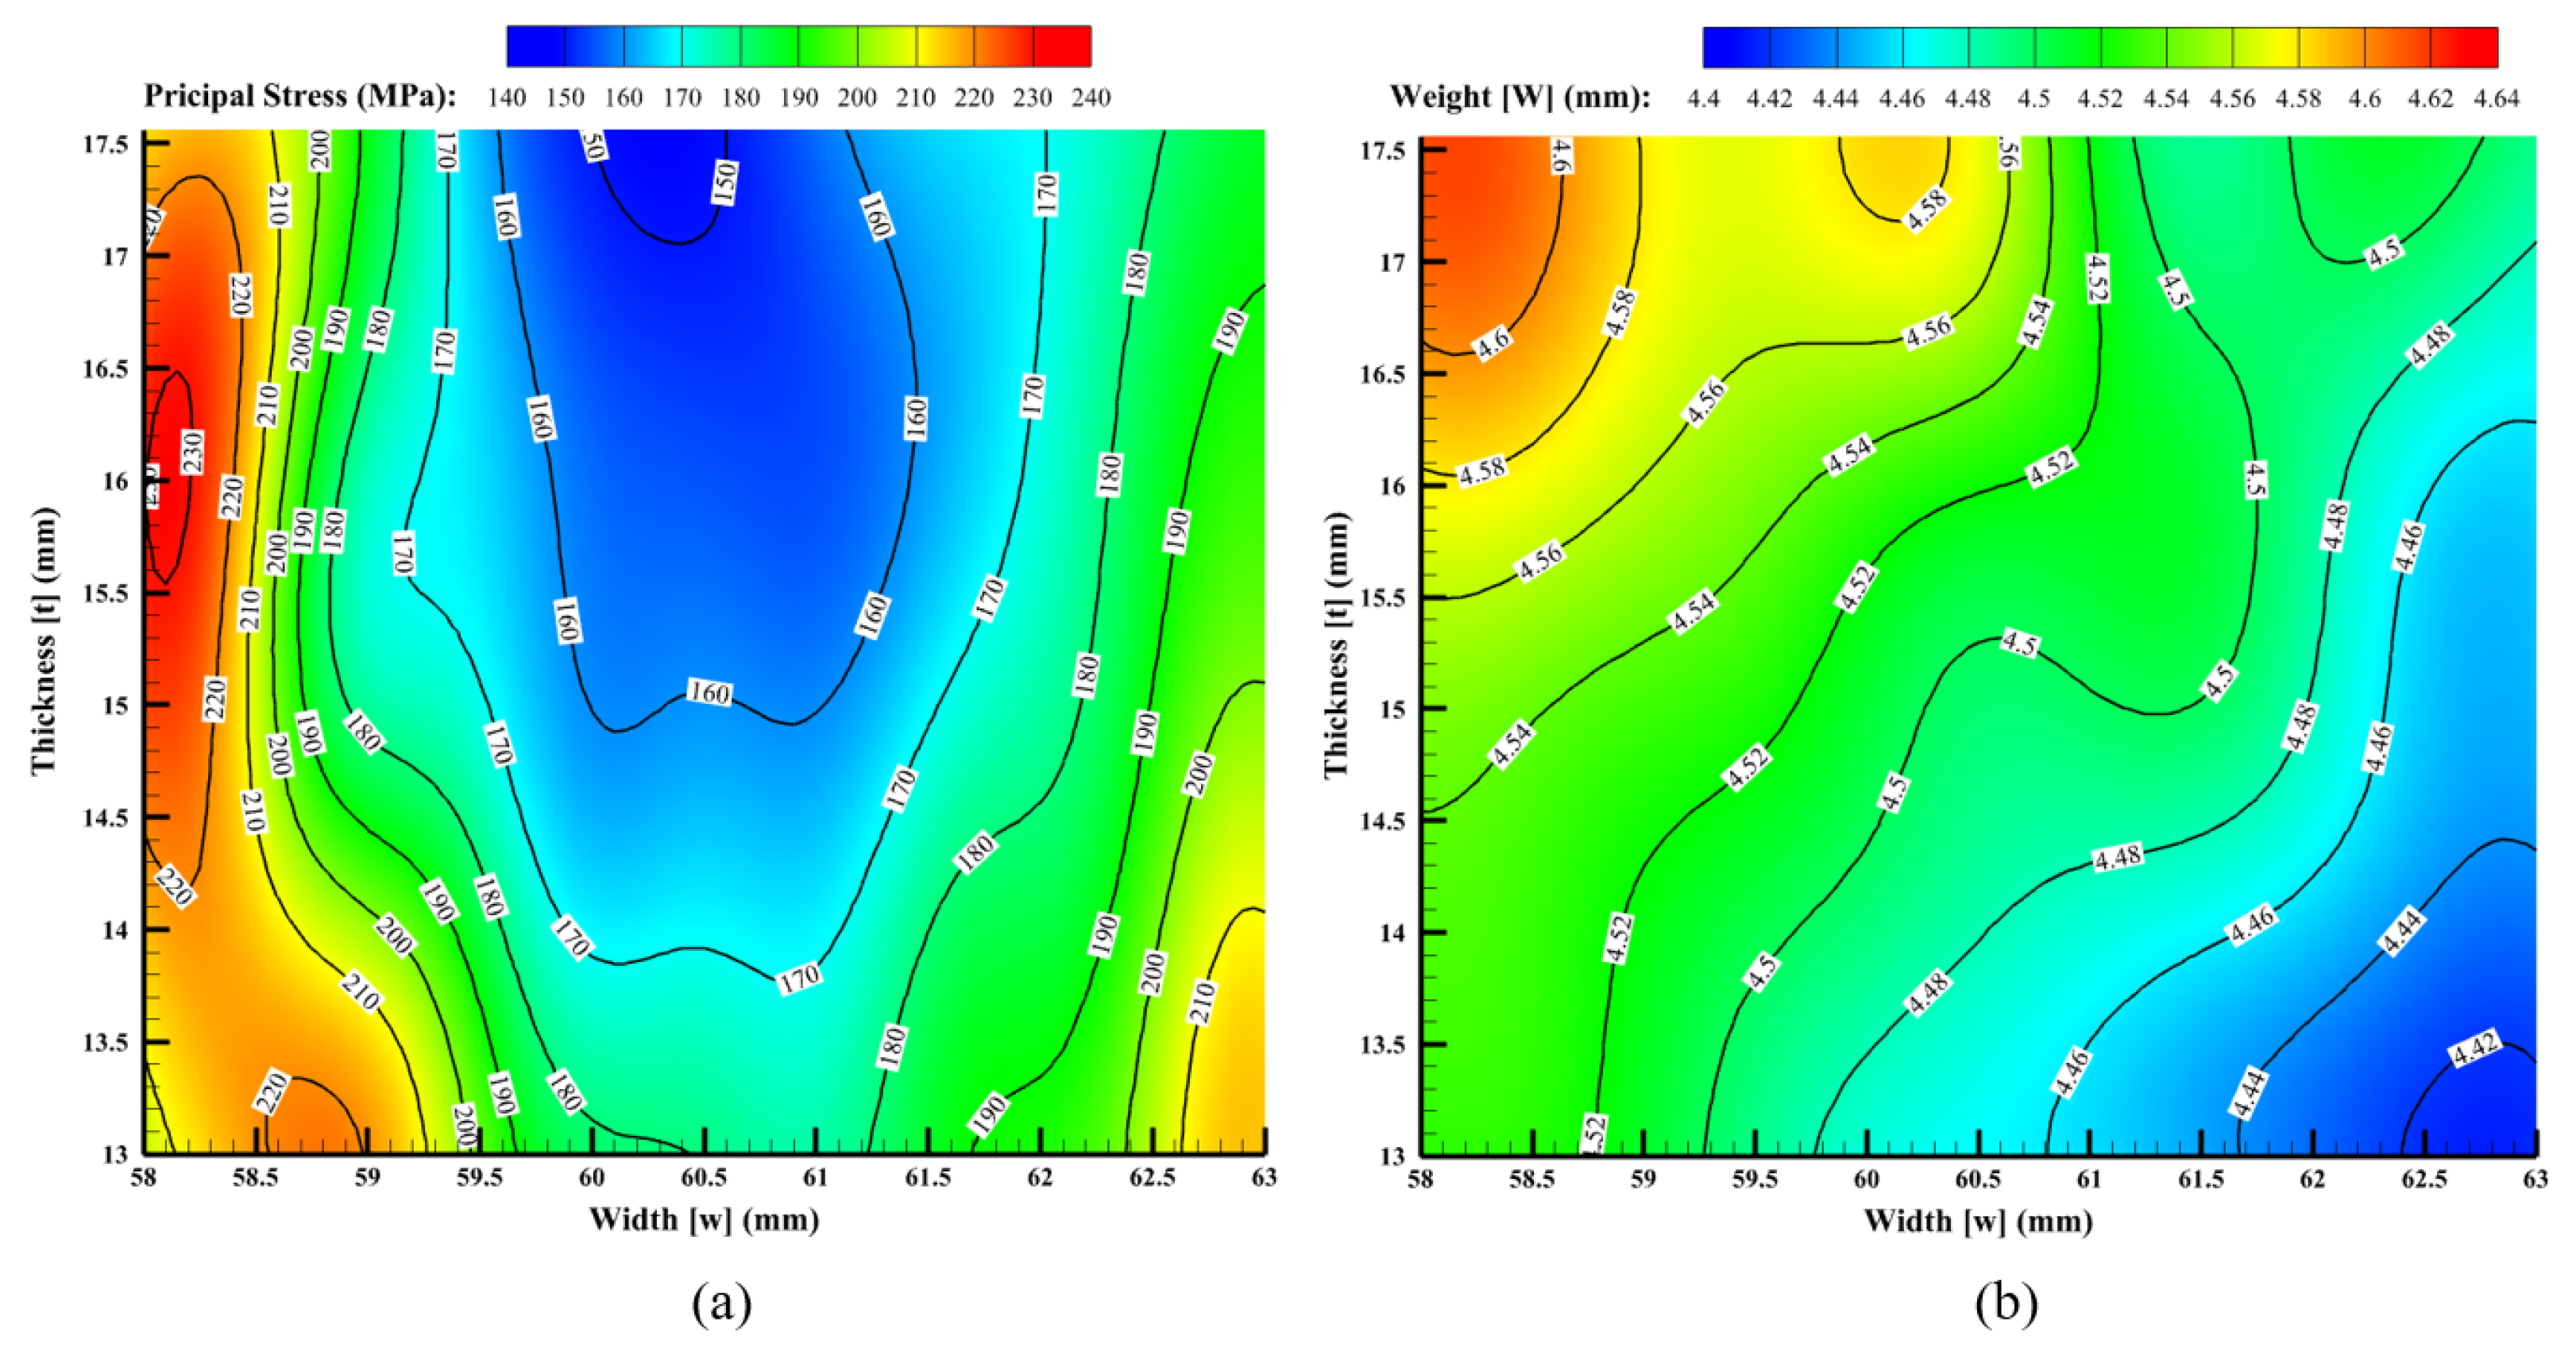
5. Results and Discussion

The result of the optimization is shown in Table 3. The number of samplings from 31 to 51 is additional samplings that have been optimized through EHVI value. The three samplings are conducted to evaluate for one iteration as an addition of multi-sampling. The algorithm converged when the number of additional samplings reached 51 at the iteration of seventh, which means the uncertainty area of a surrogate model is almost neglected, and accuracy is sufficient to give optimization results. The minimum point of principal stress and weight of the alloy wheel is 150.0935 MPa and 4.4083 kg, respectively. The minimum and maximum optimal solution of spoke thickness is 60.5996 mm and 62.9134 mm, respectively. The spoke width is 13.0003 mm and 17.1923 mm, respectively.
This work aims to minimize the principal stress and weight of the alloy wheel; the result of the optimum solution is shown in Figure 14 as the Pareto front of the entire design variables. Initial sampling is 30 points, as shown in the back circle; additional sampling is 21 points, as shown in the white diamond; therefore, the evaluated samplings must be 51 points. The additional samplings are a Pareto front solution, except for the 41st sampling point because 30 initial sampling points are sufficient to construct a surrogate model, and the function is close to an actual function. Cause optimization of EHVI had the solution at the Pareto front; besides, escalation of an optimum point from the previous data improvement process into a new surrogate model causes more accuracy. That means additional samplings are a non-dominated solution. No other samplings have less value than them. Pareto solution points can be utilized in different conditions. If vehicles require a lightweight alloy wheel, design point#3 should be considered because mass inertia reduces. The mass of the wheel of design point#3 can be lighter with a percentage of 3.588 reductions compared to the initial design with the highest weight. However, the spoke of the wheel will be punished with 222.62 MPa of principal stress. The life cycle of this design point#3 of the alloy wheel will be shorter because of principal stress augmentation. The alloy wheel of this design point will be plastic deformation, because its principal stress is higher than yield strength. If vehicles require a long cycle to be used, design point#2 will answer the problems, because this point directly has the smallest principal stress value that causes the life cycle. However, it must be exchanged with a reduction percentage of 34.244 compared to the initial design with the highest principal stress, the weight increase that will influence more fuel consumption. Generally, there is always a trade-off between the two objectives. For this reason, design point#2 has 182.194 MPa of principal stress and 4.4494 kg of weight, which are in the middle of the Pareto, which is most suitable for this present work because this point can deal with the two objectives’ 20.181% and 3.176% reduction of principal stress and weight of alloy wheel, which is lower than yield strength and weight is lighter than initial design; hence, design point#2 should be conducted to manufacture for a safe vehicle.
Figure 15 shows the response surface constructed by design variables and objectives of the Kriging model of principal stress and weight. The value of thickness multiplied by the value of width is the cross-sectional area of the spoke wheel, and can be conducted to calculate the entire volume of the alloy wheel; therefore, variable thickness (13 mm–18 mm) multiplies with a constant value of thickness (60.5 mm); when thickness increases, a cross-sectional area also has increased. The principal stress is lower as follows: the minimum principal stress is located on the middle top, as shown in Figure 15a. However, the thickness and width increase and the volume of the alloy wheel also increases, causing the amount of weight of the alloy wheel to have an increasing value. Suppose a constant thickness (13 mm) multiplied by a variable width (60.5 mm–63 mm) was considered to ensure this cross-sectional area was less than the previous condition. The principal stress has increased on the bottom of the middle to right-hand side of Figure 16. However, when a cross-sectional area decreases, the weight of the alloy also decreases for the same reason as the above condition; hence, the lesser weight of the alloy wheel occurs on the bottom right-hand side, as displayed in Figure 15b. In this case study, there was only one type of alloy wheel considered. Therefore, the optimization results will change if, in other cases, the wheel geometry and the number of holes are changed.

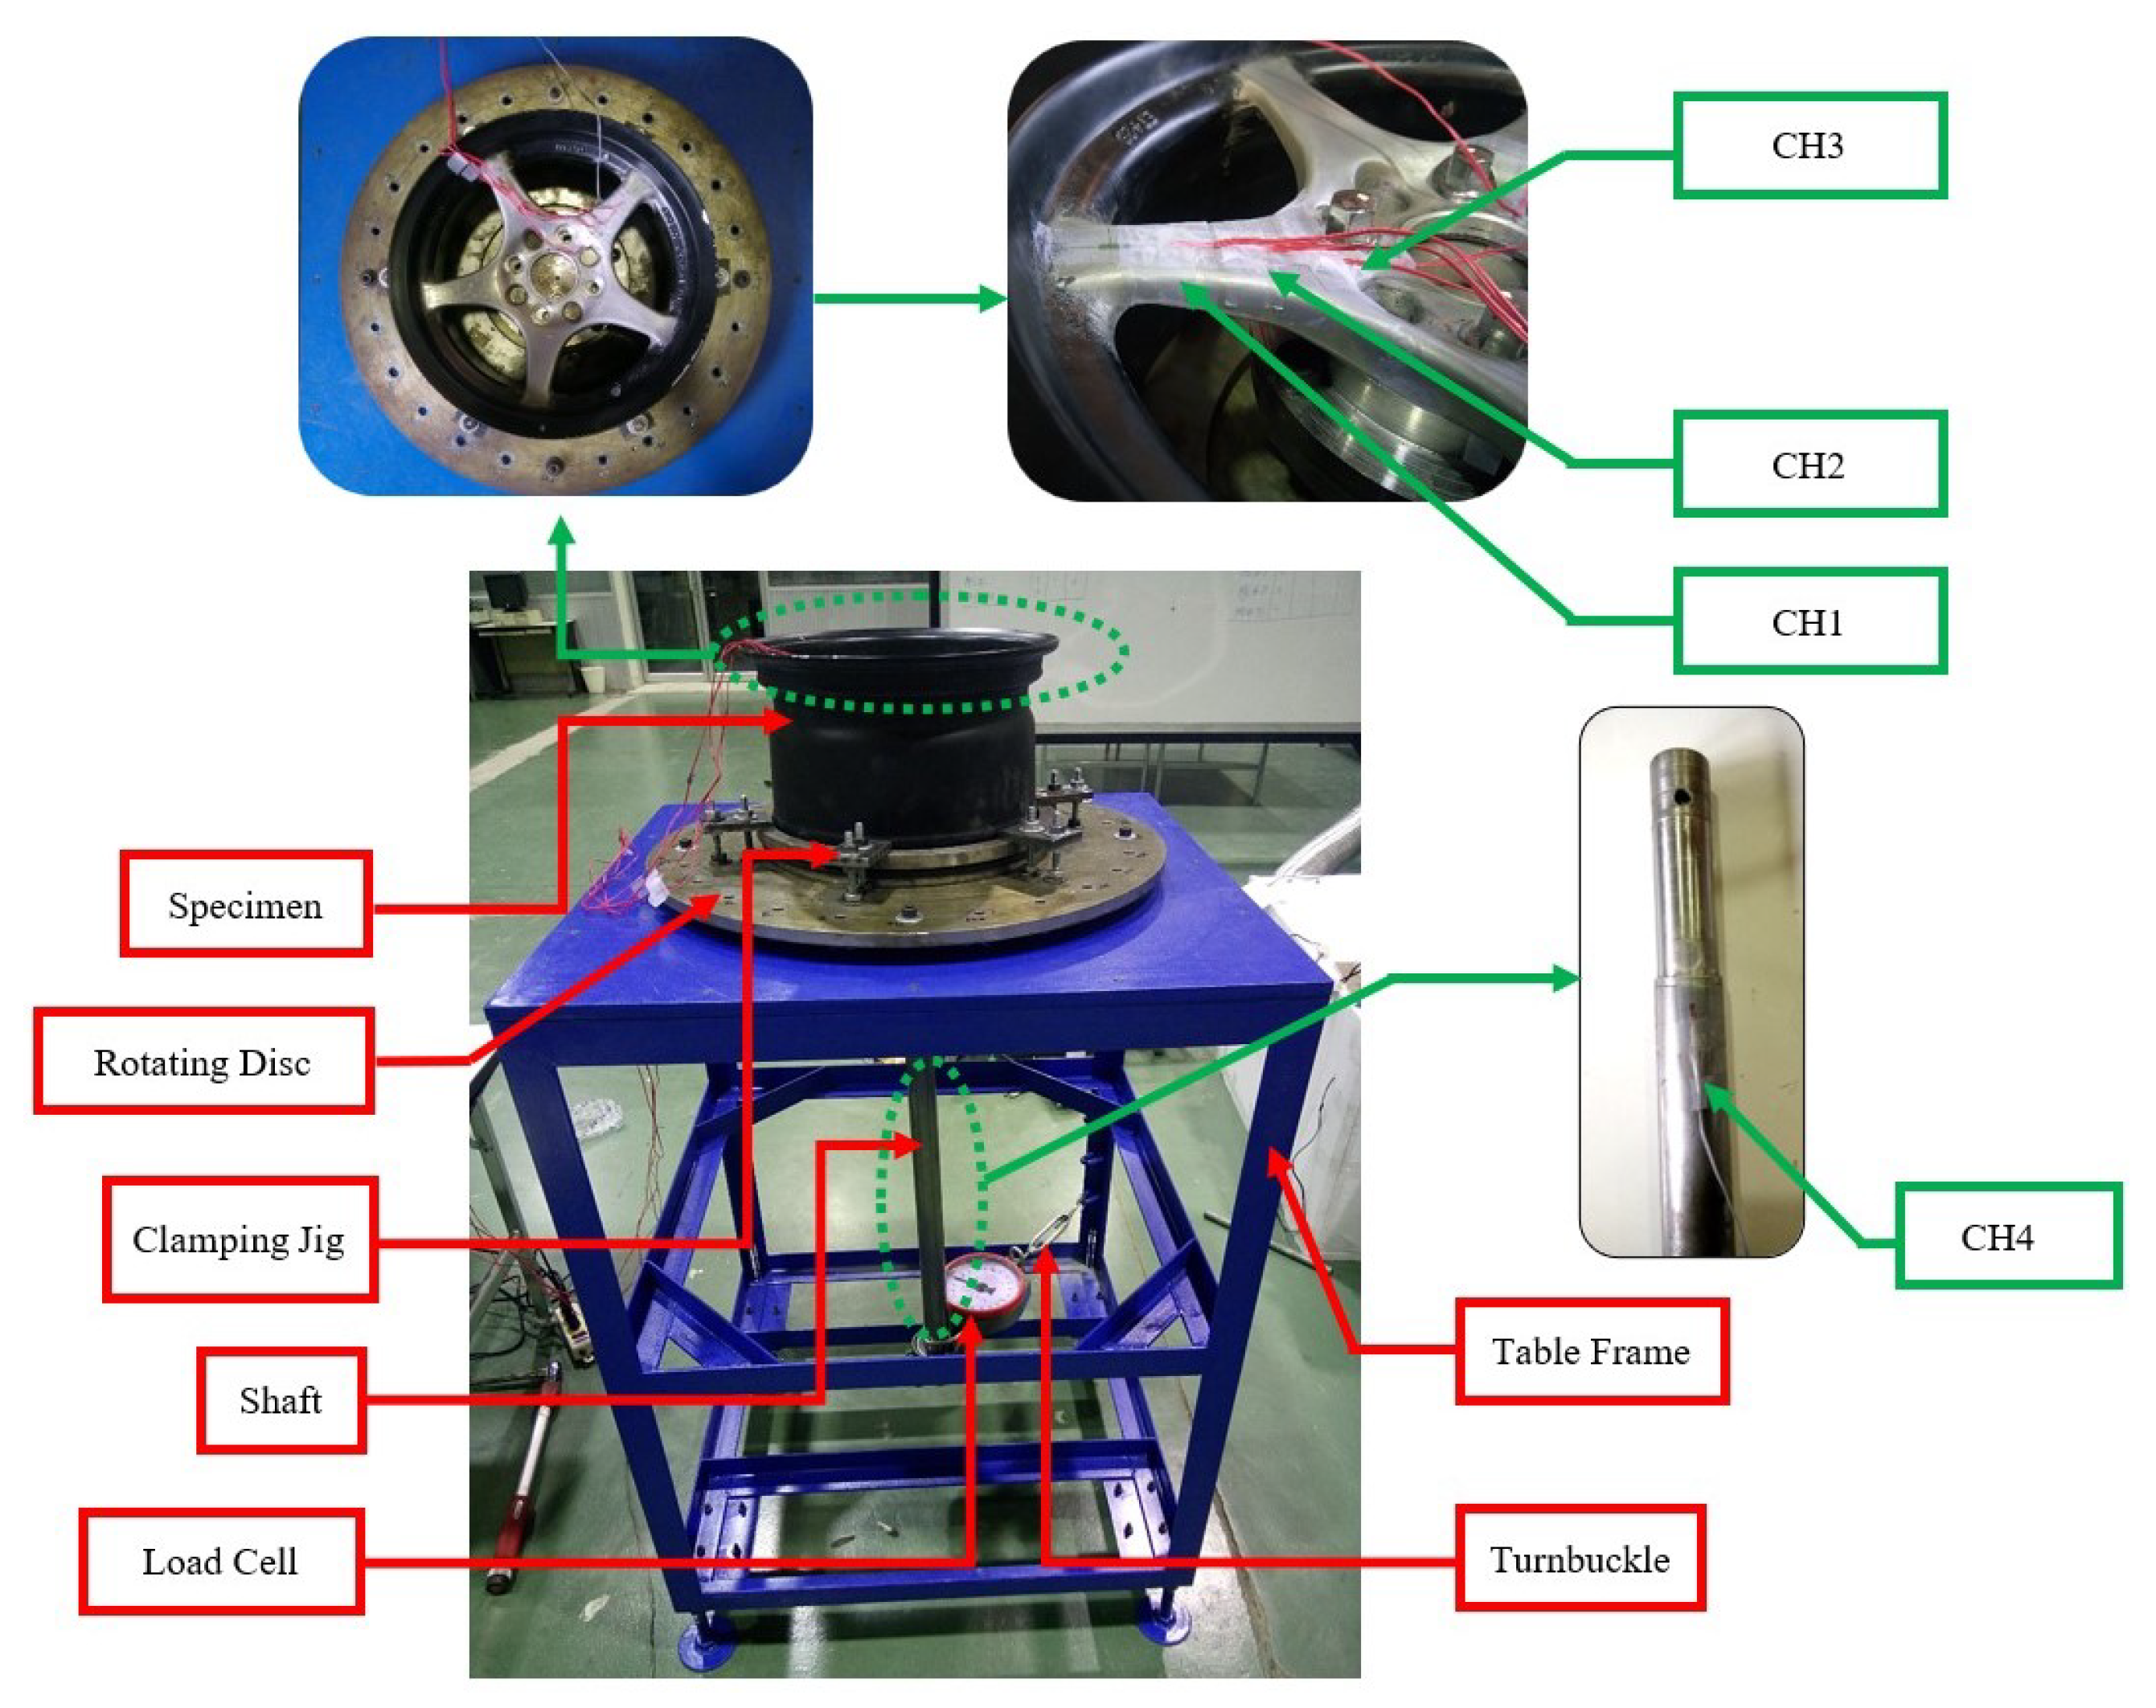
6. Mechanical Validation of Finite Element Simulation

The mechanical test for validating the FE simulation was performed in this study. The result of strain at the point in the cycle pattern obtained from a computer simulation was then compared to mechanical testing. The ISO 3006:2015 static load simulation testing machine has been designed and constructed according to the dynamic cornering fatigue test. The testing apparatus consists of a table frame and wheel axle shaft, which can generate the applied forces for the radial bending moment and a rim clamping jig assembly that can change the loading angle, as shown in Figure 16. According to the testing, the alloy wheel specimen was constrained on the clamping jig, and the shaft was applied load for the constant cyclical rotation bending, as shown in Figure 17. The result of strain distribution related to the cyclic bending moment angle for four positions was monitored using the strain gauge technique. The specimen had cyclic bending loading under the rotated angle applied in a range from 0 to 360 degrees with an increment of 30 degrees. Four strain sensors were installed on the alloy wheel and shaft, including three points on the wheel spoke position and one on the shaft, as shown in Figure 16. The results from testing were then compared to the finite element simulation.
Figure 17a–d exhibited the comparison of strain values between the mechanical test and FE analysis for the strain sensor positions one to four, respectively. The results showed that the strain value of all positions was changed as a symmetrical cyclic pattern related to the changing angle of the rotating bending load. Both retain responses measured by experiment and simulation results are on the same trend.
The result of strain value at positions two and three displayed an initial plus sign, and it was then decreased to the minus sign value when the loading angle was increased and closed to 180 degrees. Also, the changed strain was increased to the plus sign when the loading angle increased to 360 degrees. The strain exhibited the cyclic pattern due to the effect of changing the rotation of the bending moment direction. The stain value at position one, including position four, displayed the opposite sign due to the adjacent to the fixation support. Comparatively, the FE result exhibited a cyclic strain pattern similar to the experiment test. According to the FE results, however, the strain value at a point of position one to position four revealed the maximum error compared to the experiment result was in a range of 0.98% to 44.75%, 0.23% to 29.21%, 1.97% to 32.07%, and 1.91% to 18.44%, respectively. The maximum error occurred at the initial angle position. This may be due to the inconsistency of the conditions in the simulation analysis with the actual test.

7. Conclusions

This present work proposed a novel method for alloy wheel design based on the cornering fatigue test condition that no previous research had conducted. The FE combined with the MAs-EGO approach was performed on a multiple-objective design problem, including minimizing the principal stress and weight. The result revealed that MAs-EGO could achieve the advantage of the optimum solution for the thickness and width of the alloy wheel spoke. The total sampling point of the evaluation was initial with 51 points, combining 30 initial sampling points and 21 additional sampling points when the iteration of running had reached the seventh iteration. According to the minimum principal stress and weight, the proposed optimal thickness and width decreased by 20.181% and 3.176% compared to the initial design. In addition, the testing apparatus was conducted to validate the FE simulation. The comparative result showed that the FE analysis exhibited a symmetrical cyclic strain similar to the experiment test.

Author Contributions

Conceptualization, A.A. and S.R.; methodology, S.R.; software, A.A. and T.P.; validation, A.A., S.R., W.P. and T.P.; formal analysis, A.A. and T.P.; investigation, S.R. and T.P.; resources, S.R. and W.P.; data curation, S.R., W.P. and T.P.; writing—original draft preparation, A.A., S.R. and T.P.; writing—review and editing, A.A. and S.R.; visualization, A.A. and T.P.; supervision, S.R.; funding acquisition, A.A. All authors have read and agreed to the published version of the manuscript.

Funding

This research was funded by the National Research Council of Thailand (NRCT) grant number N42A650549.

Data Availability Statement

The data that support the findings of this study are available from the corresponding author upon reasonable request.

Conflicts of Interest

The authors declare no conflict of interest.

References

  1. Mandage, A.; Sharma, M.; Rayate, A.; Kange, P.; Hirulkar, N. Fatigue Life Estimation of an Aluminium Wheel Rim Using Finite Element Analysis. Int. J. Sci. Adv. Res. Technol. 2016, 2, 30–33. [Google Scholar]
  2. Rao, K.S.; Rajesh, M.; Babu, G.S. Design and analysis of alloy wheels. Int. Res. J. Eng. Technol. 2017, 7, 2036–2042. [Google Scholar]
  3. Das, S. Design and weight optimization of aluminum alloy wheel. Int. J. Sci. Res. Publ. 2014, 4, 1–12. [Google Scholar]
  4. Raju, P.R.; Satyanarayana, B.; Ramji, K.; Babu, K.S. Evaluation of fatigue life of aluminium alloy wheels under bending loads. Fatigue Fract. Eng. Mater. Struct. 2009, 32, 119–126. [Google Scholar] [CrossRef]
  5. Wang, L.; Chen, Y.; Wang, C.; Wang, Q. Fatigue life analysis of aluminum wheels by simulation of rotary fatigue test. Stroj. Vestn. J. Mech. Eng. 2011, 57, 31–39. [Google Scholar] [CrossRef]
  6. Wang, X.; Zhang, X. Simulation of dynamic cornering fatigue test of a steel passenger car wheel. Int. J. Fatigue 2010, 32, 434–442. [Google Scholar] [CrossRef]
  7. Dong, Z.; Wang, X.; Zhang, X.; Lou, W.; Huang, Y.; Zhong, M. Fatigue life prediction for the steel passenger car wheel in the dynamic cornering fatigue test. Strength Mater. 2020, 52, 662–682. [Google Scholar] [CrossRef]
  8. Burande, D.; Kazi, T. Fatigue analysis of alloy wheel for passenger car under radial load. Int. J. Eng. Res. Gen. Sci. 2016, 4, 26–36. [Google Scholar]
  9. Thakare, R. Stress analysis in wheel rim by using dynamic cornering fatigue test under different conditions. Int. J. Adv. Res. Innov. Ideas Educ. 2017, 3, 4863–4868. [Google Scholar]
  10. Jones, D.R.; Schonlau, M.; Welch, W.J. Efficient global optimization of expensive black-box functions. J. Glob. Optim. 1998, 13, 455–492. [Google Scholar] [CrossRef]
  11. Bano, G.; Wang, Z.; Facco, P.; Bezzo, F.; Barolo, M.; Ierapetritou, M. A novel and systematic approach to identify the design space of pharmaceutical processes. Comput. Chem. Eng. 2018, 115, 309–322. [Google Scholar] [CrossRef]
  12. Wang, Z.; Escotet-Espinoza, M.S.; Singh, R.; Ierapetritou, M. Surrogate-based optimization for pharmaceutical manufacturing processes. In Computer Aided Chemical Engineering; Elsevier: Amsterdam, The Netherlands, 2017; Volume 40, pp. 2797–2802. [Google Scholar]
  13. Bureerat, S.; Sleesongsom, S. Constraint handling technique for four-bar linkage path generation using self-adaptive teaching—Learning-based optimization with a diversity archive. Eng. Optim. 2021, 53, 513–530. [Google Scholar] [CrossRef]
  14. Preedawiphat, P.; Mahayotsanun, N.; Sucharitpwatskul, S.; Funazuka, T.; Takatsuji, N.; Bureerat, S.; Dohda, K. Finite element analysis of grain size effects on curvature in micro-extrusion. Appl. Sci. 2020, 10, 4767. [Google Scholar] [CrossRef]
  15. Wiangkham, A.; Aengchuan, P.; Kasemsri, R.; Pichitkul, A.; Tantrairatn, S.; Ariyarit, A. Improvement of Mixed-Mode I/II Fracture Toughness Modeling Prediction Performance by Using a Multi-Fidelity Surrogate Model Based on Fracture Criteria. Materials 2022, 15, 8580. [Google Scholar] [CrossRef] [PubMed]
  16. Petcharat, N.; Wiangkham, A.; Pichitkul, A.; Tantrairatn, S.; Aengchuan, P.; Bureerat, S.; Banpap, S.; Khunthongplatprasert, P.; Ariyarit, A. The multi-objective optimization of material properties of 3D print onyx/carbon fiber composites via surrogate model. Mater. Today Commun. 2023, 37, 107362. [Google Scholar] [CrossRef]
  17. Takian, W.; Rooppakhun, S.; Ariyarit, A.; Sucharitpwatskul, S. Optimal Conformity Design of Tibial Insert Component Based on ISO Standard Wear Test Using Finite Element Analysis and Surrogate Model. Symmetry 2021, 13, 2377. [Google Scholar] [CrossRef]
  18. Kishi, Y.; Yashiro, R.; Kanazaki, M. Low-Boom Design for Supersonic Transport with Canard and Forward-Swept Wings Using Equivalent Area Design Method. Aerospace 2023, 10, 717. [Google Scholar] [CrossRef]
  19. Lin, Q.; Gong, L.; Zhang, Y.; Kou, M.; Zhou, Q. A probability of improvement-based multi-fidelity robust optimization approach for aerospace products design. Aerosp. Sci. Technol. 2022, 128, 107764. [Google Scholar] [CrossRef]
  20. Cinquegrana, D.; Iuliano, E. Efficient global optimization method for multipoint airfoil Design. In Advances in Evolutionary and Deterministic Methods for Design, Optimization and Control in Engineering and Sciences; Springer: Berlin/Heidelberg, Germany, 2019; pp. 95–114. [Google Scholar]
  21. Viana, F.; Haftka, R.; Venter, G.; Hamman, R. Efficient global optimization with experimental data: Revisiting the paper helicopter design. In Proceedings of the 52nd AIAA/ASME/ASCE/AHS/ASC Structures, Structural Dynamics and Materials Conference 19th AIAA/ASME/AHS Adaptive Structures Conference 13t AIAA Non-Deterministic, Denver, CO, USA, 4–7 April 2011; p. 2099. [Google Scholar]
  22. Haftka, R.T.; Villanueva, D.; Chaudhuri, A. Parallel surrogate-assisted global optimization with expensive functions—A survey. Struct. Multidiscip. Optim. 2016, 54, 3–13. [Google Scholar] [CrossRef]
  23. Ariyarit, A.; Phiboon, T.; Kanazaki, M.; Bureerat, S. The effect of multi-additional sampling for multi-fidelity efficient global optimization. Symmetry 2020, 12, 1499. [Google Scholar] [CrossRef]
  24. Kanazaki, M.; Imamura, T.; Matsuno, T.; Chiba, K. Multiple additional sampling by expected improvement maximization in efficient global optimization for real-world design problems. In Proceedings of the Intelligent and Evolutionary Systems: The 20th Asia Pacific Symposium, IES 2016, Canberra, Australia, November 2016; Springer: Berlin/Heidelberg, Germany, 2017; pp. 183–194. [Google Scholar]
  25. Matheron, G. Principles of geostatistics. Econ. Geol. 1963, 58, 1246–1266. [Google Scholar] [CrossRef]
  26. Moore, R. Geostatistics in Hydrology: Kriging Interpolation; Tech. Rep.; Mathematics Department, Macquarie University: Sydney, Australia, 1999. [Google Scholar]
  27. Holland, J.H. Genetic algorithms. Sci. Am. 1992, 267, 66–73. [Google Scholar] [CrossRef]
  28. ISO 3006:2015; Road Vehicles—Passenger Car Wheels for Road Use—Test Methods. ISO: Geneva, Switzerland, 2015.
  29. Ahmad, M.; Sivanesan, T.; Mahmud, A. Structural optimization of alloy wheel rim using design of experiments. Int. J. Veh. Struct. Syst. 2018, 10, 122–126. [Google Scholar] [CrossRef]
  30. Husslage, B.G.; Rennen, G.; Van Dam, E.R.; Den Hertog, D. Space-filling Latin hypercube designs for computer experiments. Optim. Eng. 2011, 12, 611–630. [Google Scholar] [CrossRef]
  31. Loh, W.L. On Latin hypercube sampling. Ann. Stat. 1996, 24, 2058–2080. [Google Scholar] [CrossRef]
  32. Chen, X.; Liu, Y. Finite Element Modeling and Simulation with ANSYS Workbench; CRC Press: Boca Raton, FL, USA, 2018. [Google Scholar]
  33. Shigley, J.E.; Mitchell, L.D.; Saunders, H. Mechanical Engineering Design. J. Mech. Trans. Autom. 1985, 107, 145. [Google Scholar] [CrossRef]
  34. Norton, R.L. Machine Design; Prentice Hall: London, UK, 2010. [Google Scholar]
Figure 1. Type of alloy wheel in general industry and components. (a) Disc type, (b) spoke type, (c) fin type, (d) mesh type, and (e) rim and disc type.
Symmetry 15 02169 g001
Figure 2. Schematic process of (a) the original EGO and (b) MAs EGO.
Symmetry 15 02169 g002
Figure 3. Diagram of (a) single computation and (b) parallel computation EGO.
Symmetry 15 02169 g003
Figure 4. Schematic process of GA and genetic operation.
Symmetry 15 02169 g004
Figure 5. A schematic of dynamic cornering fatigue testing machine setup.
Symmetry 15 02169 g005
Figure 6. Schematic process of this present work.
Symmetry 15 02169 g006
Figure 7. Design variables of an alloy wheel.
Symmetry 15 02169 g007
Figure 8. Distribution of initial sampling among design range.
Symmetry 15 02169 g008
Figure 9. S-N curve of Alloy A356.
Symmetry 15 02169 g009
Figure 10. The FE model of the alloy wheel included the boundary condition.
Symmetry 15 02169 g010
Figure 11. Element convergence of alloy wheel geometry.
Symmetry 15 02169 g011
Figure 12. The FE result of maximum principal stress (a) front view (b) rear view.
Symmetry 15 02169 g012
Figure 13. The FE result for maximum deformation.
Symmetry 15 02169 g013
Figure 14. (a) Distribution of initial sampling and additional sampling (b) Pareto front of design variables related to the weight and principal stress.
Symmetry 15 02169 g014
Figure 15. (a) The contour plot of the principal stress according to the design parameters (b) The contour plot of weight according to the design parameters.
Symmetry 15 02169 g015
Figure 16. The experimental apparatus used in the study.
Symmetry 15 02169 g016
Figure 17. The comparison result of the strain between the mechanical test and FE analysis; (a) strain position one, (b) strain position two, (c) strain position three, and (d) strain position four.
Symmetry 15 02169 g017
Table 1. Chemical composition of Al Alloy A356 (percent of weight).
SiFeMgTiSr
6.5–7.5%<0.15%0.27–0.29%0.1–0.15%0.005–0.0155%
Table 2. Mechanical Properties of Al Alloy A356.
PropertyYield StrengthUltimate StrengthElongationModulus of Elasticity
(MPa)(MPa)(%)(GPa)
220265370
Table 3. The results of multi-additional sampling optimization.
IterationNo.Width: wThickness: tPrincipleWeight
Sampling(mm)(mm)Stress (MPa)(kg)
3162.5907913.0003212.36124.41644
13261.1110514.43483167.02274.47476
3361.3429413.85585176.45884.45779
3461.9975413.00002199.09434.42878
23560.9195614.99054160.13234.49212
3660.6326816.63042152.99844.52772
3761.2393214.14289173.89954.46194
33860.5995817.19233151.29514.54639
3961.5239413.653182.19394.44935
4062.913413.0004222.61764.4083
44161.6085215.8109163.65734.49525
4261.0074214.72151163.27524.48355
4362.2785813.0000189.25614.4413
54461.7811313.12851191.85774.43697
4562.8315713.02221217.36894.41237
4662.288813.00558207.62394.42054
64760.8225915.51454157.76414.50077
4861.2063714.21846169.1264.47055
4960.6498816.47167152.99844.52772
75062.1698613.00006203.18974.42465
5160.5733617.99858150.09354.56472
Disclaimer/Publisher’s Note: The statements, opinions and data contained in all publications are solely those of the individual author(s) and contributor(s) and not of MDPI and/or the editor(s). MDPI and/or the editor(s) disclaim responsibility for any injury to people or property resulting from any ideas, methods, instructions or products referred to in the content.

