Landscape Dynamics on the Island of La Gonave, Haiti, 1990–2010


Abstract
:1. Introduction
2. Methods
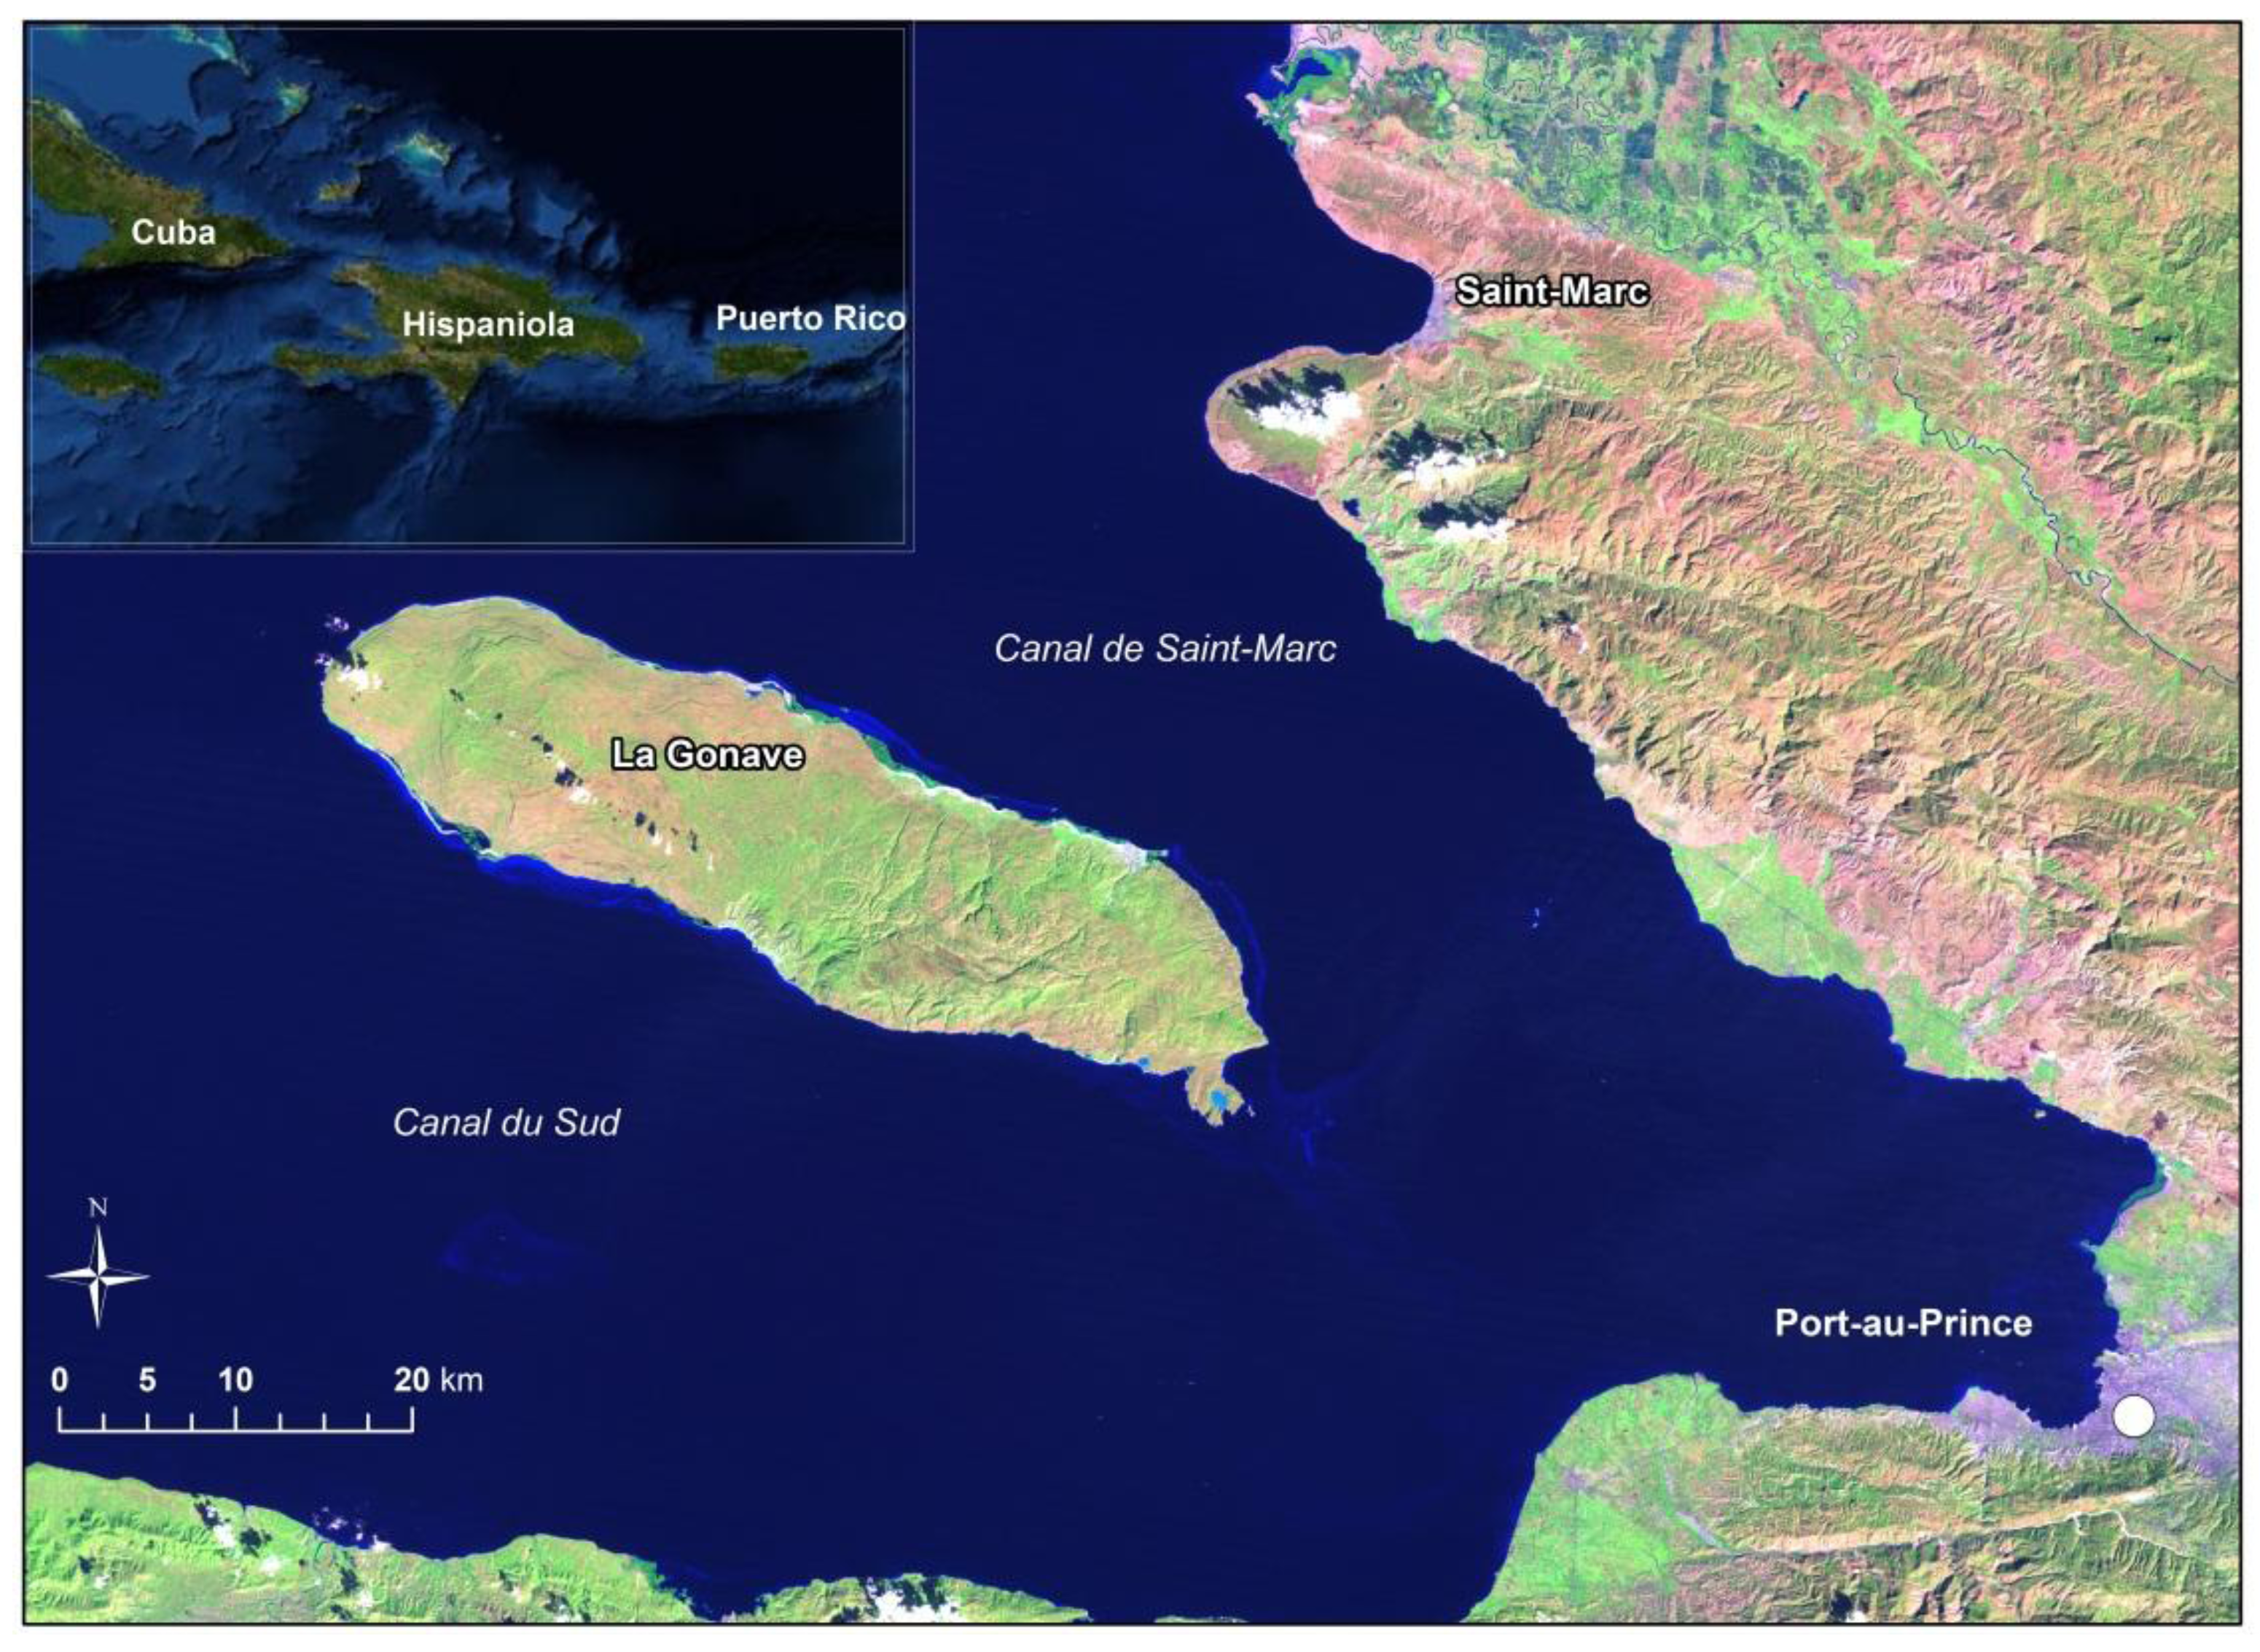
2.1. Study Area
2.2. Data
2.3. Image Classification and Accuracy Assessment
2.4. Change Detection and Spatial Pattern Analysis
3. Results
3.1. Assessment of Image Classification Accuracy

| Reference | Total | Correct (%) | Commission (%) | |||||
|---|---|---|---|---|---|---|---|---|
| Ag | Forest | Shrub | Barren | Wetlands | ||||
| Agriculture | 56 | 0 | 4 | 0 | 0 | 60 | 93 | 7 |
| Forest/DV | 3 | 46 | 10 | 6 | 0 | 65 | 71 | 29 |
| Shrub | 1 | 1 | 48 | 5 | 0 | 55 | 87 | 13 |
| Barren/Eroded | 3 | 0 | 6 | 55 | 0 | 64 | 86 | 14 |
| Nonforested Wetlands | 0 | 0 | 0 | 0 | 61 | 61 | 100 | |
| Total | 63 | 47 | 68 | 66 | 61 | (n = 305) | ||
| % Correct | 89 | 98 | 71 | 83 | 100 | Overall (%) = 87 | ||
| % Omission | 11 | 2 | 29 | 17 | 0 | kappa = 0.84 | ||
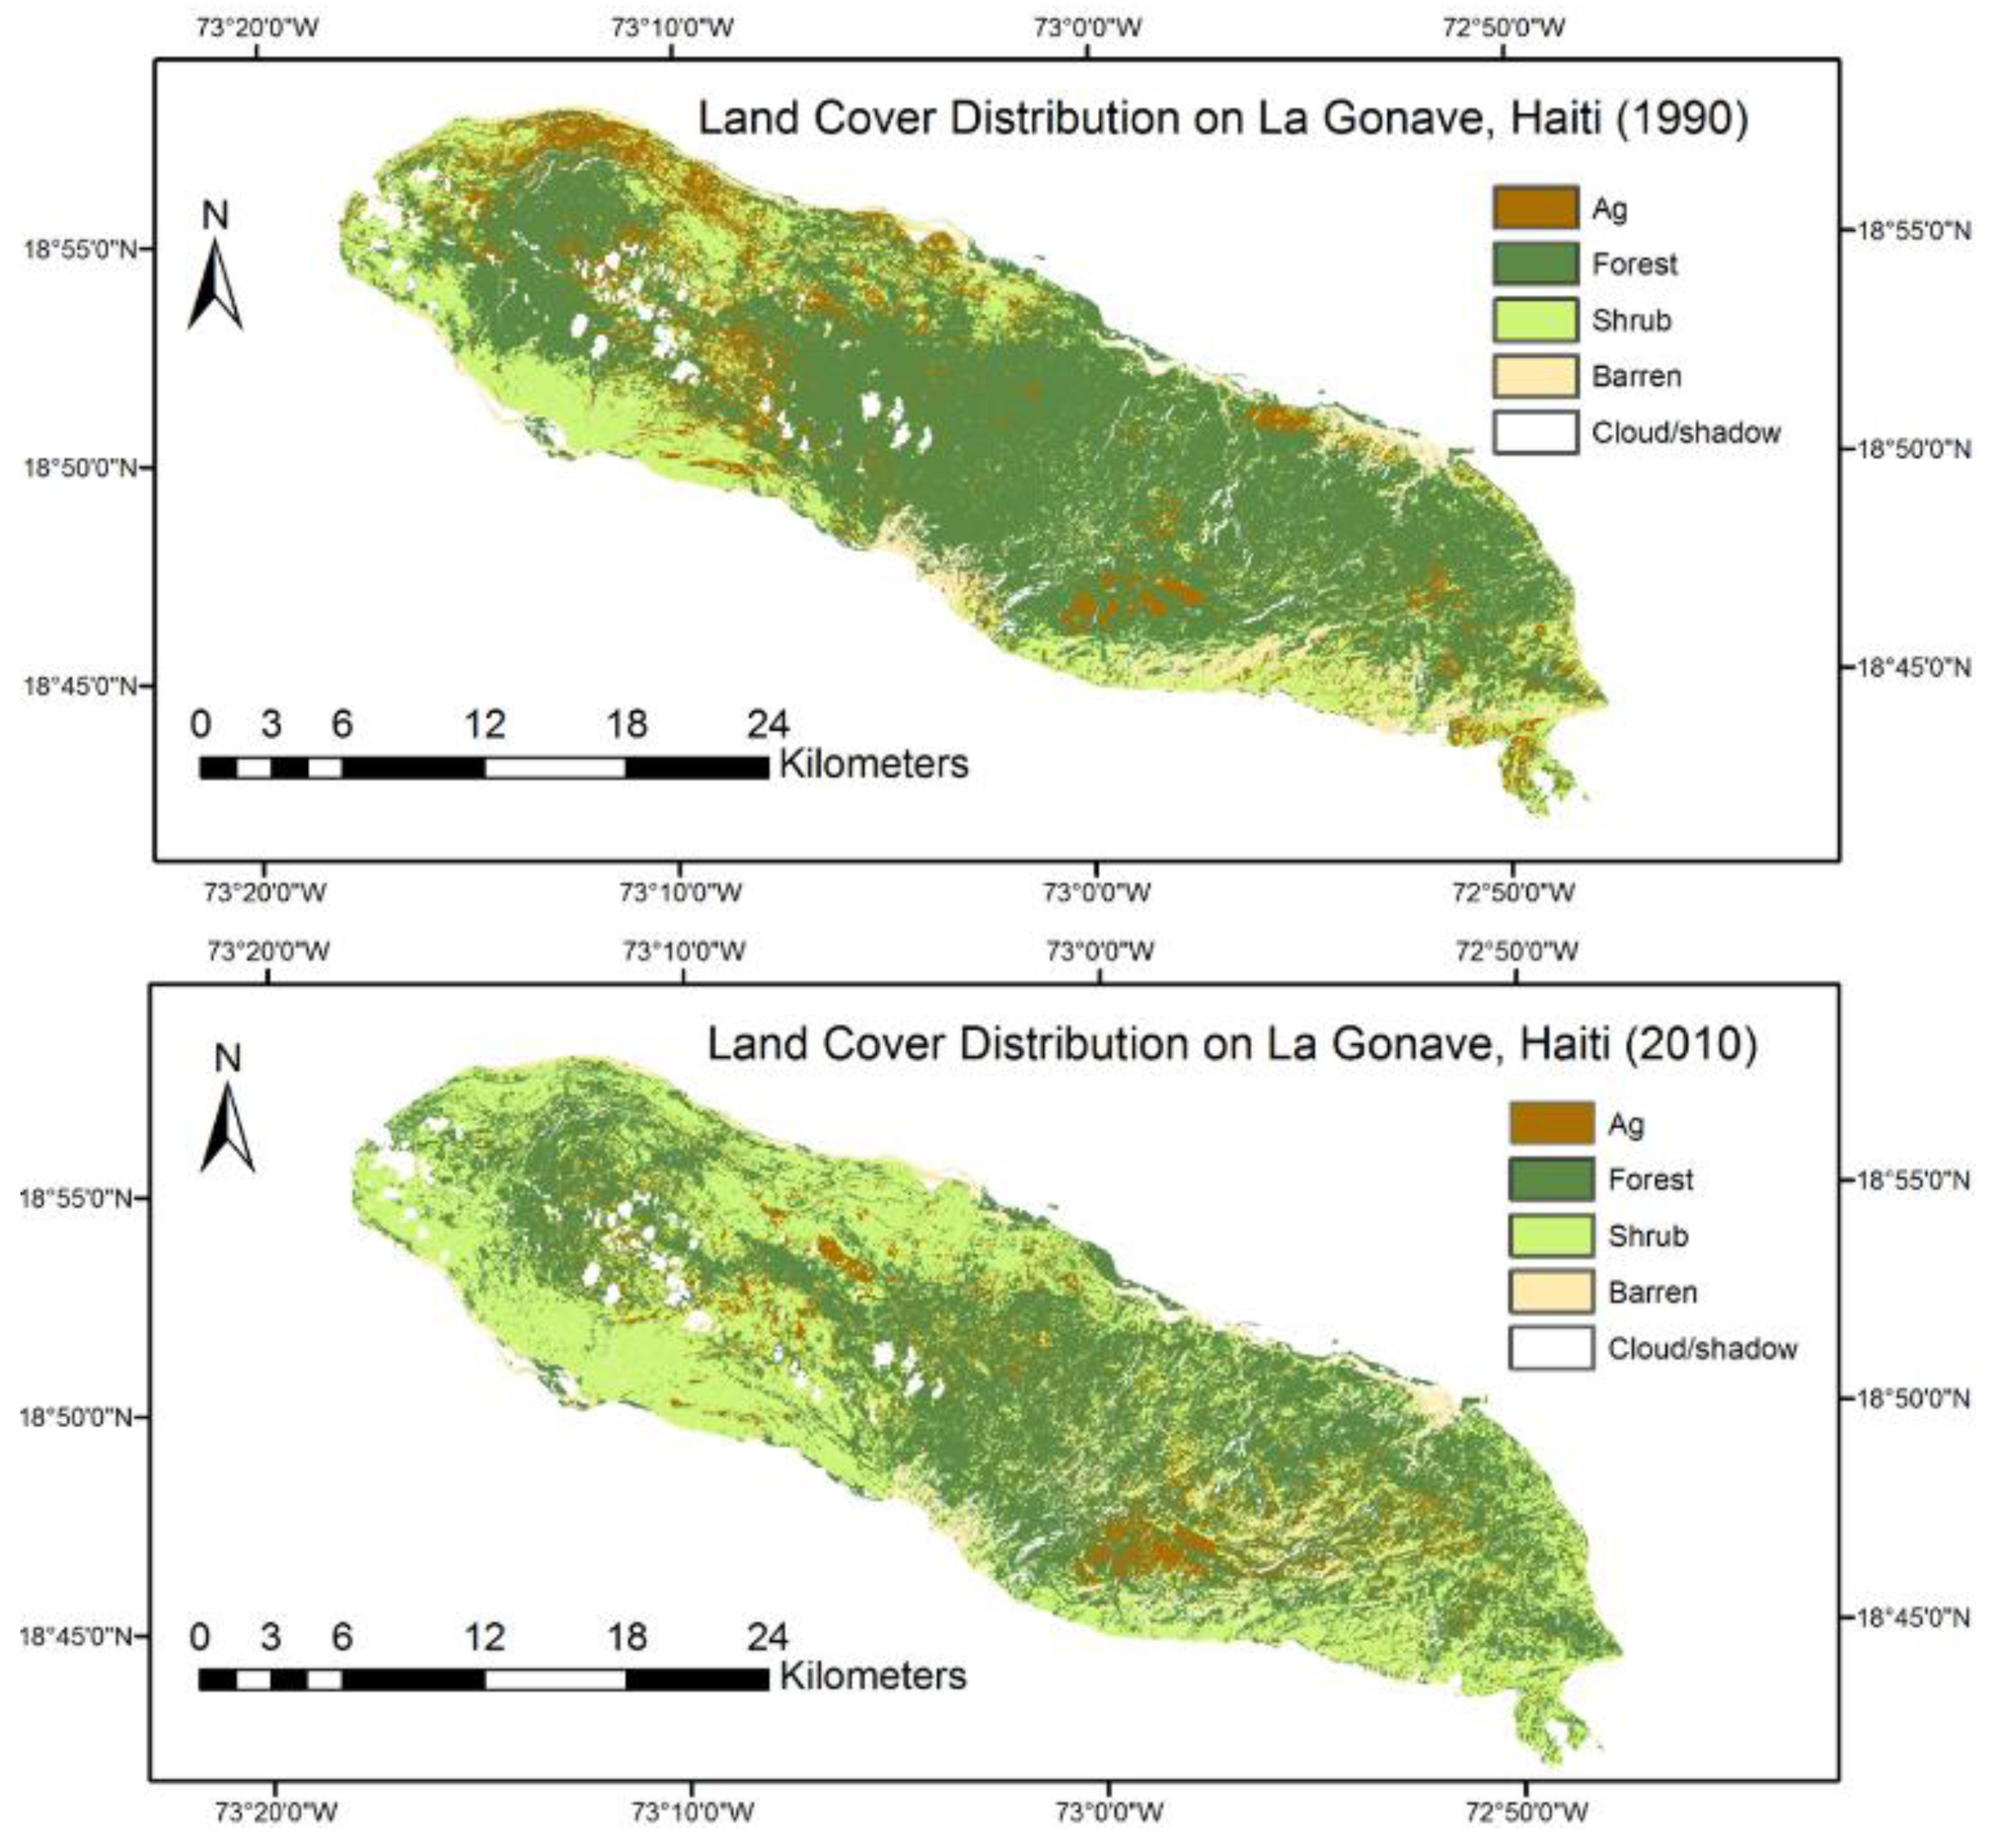
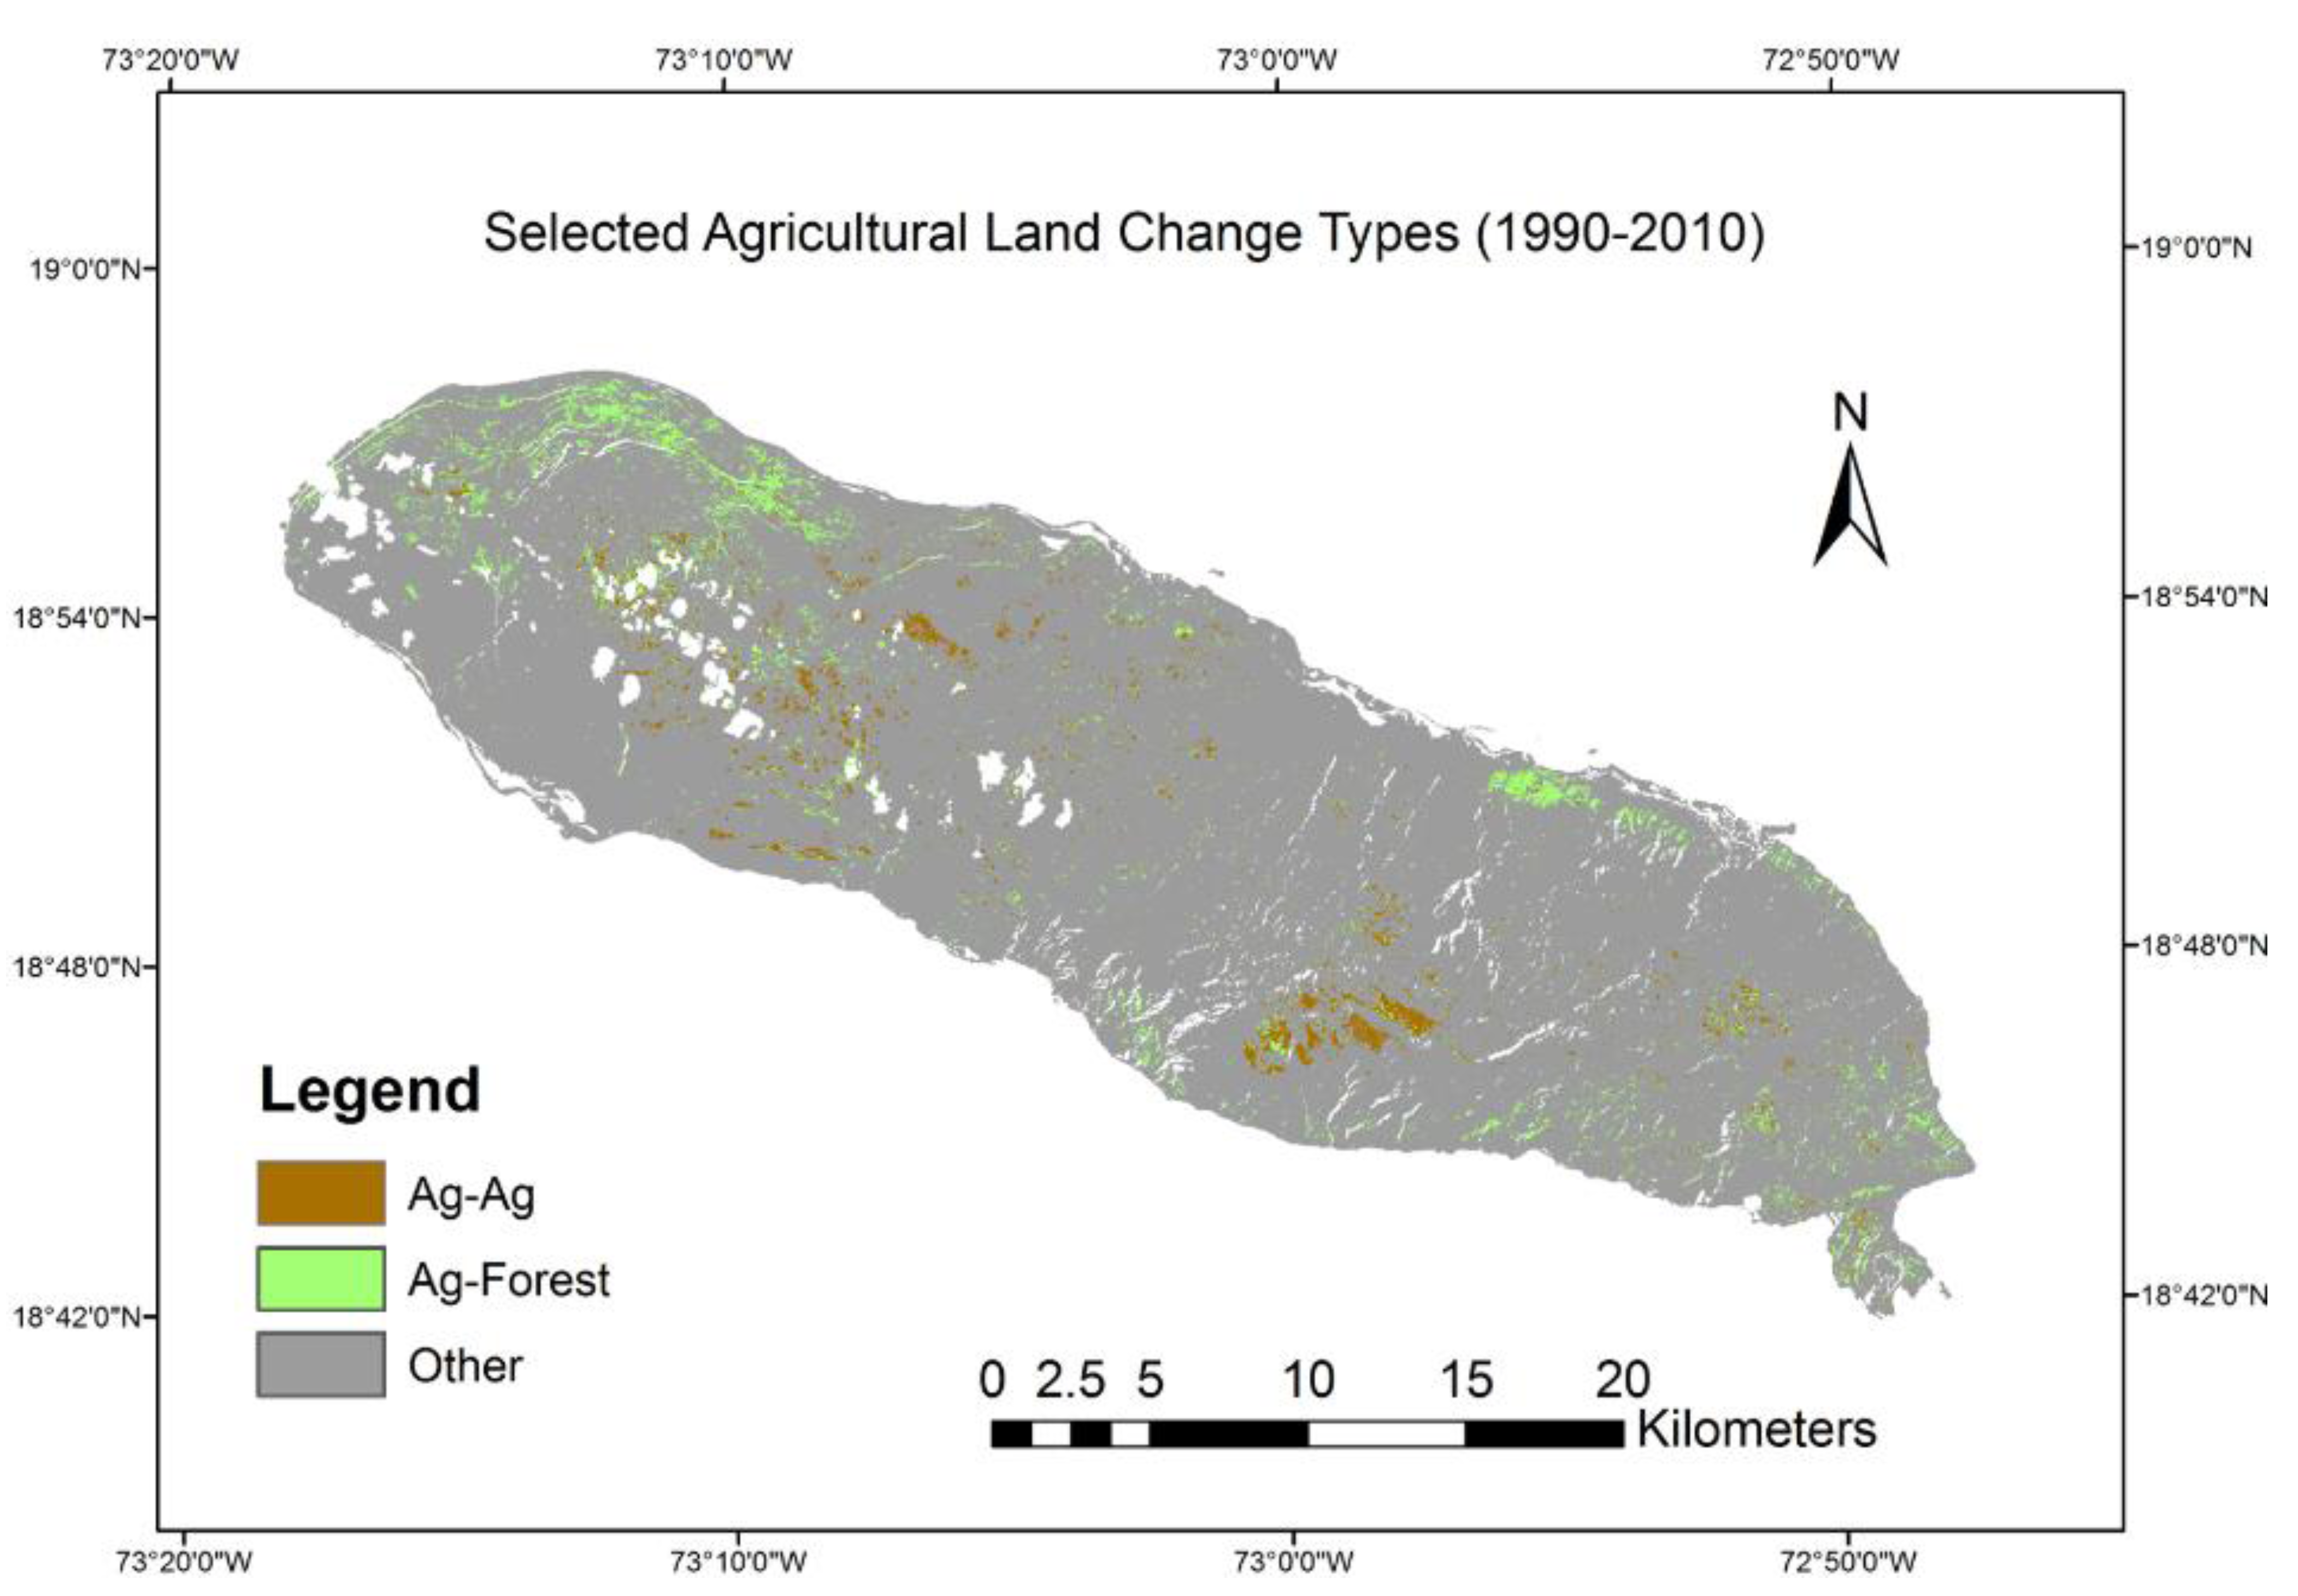
3.2. Land Cover Change and Conversion
| Class | 1990 Area (ha) | 2010 Area (ha) | 1990–2010 Area Change (ha) | 1990–2010 Area Change (%) | Annual Rate of Change |
|---|---|---|---|---|---|
| Agriculture | 7,996.0 | 4,819.0 | −3,177 | −39.7 | −2.5 |
| Forest/DV | 38,652.1 | 29,883.3 | −8,768.8 | −22.7 | −1.3 |
| Shrub | 14,012.6 | 26,255.7 | 12,243.2 | +87.4 | +3.2 |
| Barren/Eroded | 4,224.6 | 3,927.2 | −297.4 | −7.0 | −0.4 |
| Ag2010 | Forest2010 | Shrub2010 | Barren2010 | Total | |
|---|---|---|---|---|---|
| Ag1990 | 19.76 | 34.23 | 45.01 | 1.00 | 100.00 |
| Forest/DV1990 | 7.31 | 62.52 | 27.47 | 2.70 | 100.00 |
| Shrub1990 | 2.65 | 15.07 | 75.17 | 7.11 | 100.00 |
| Barren1990 | 1.01 | 20.53 | 35.66 | 42.79 | 100.00 |
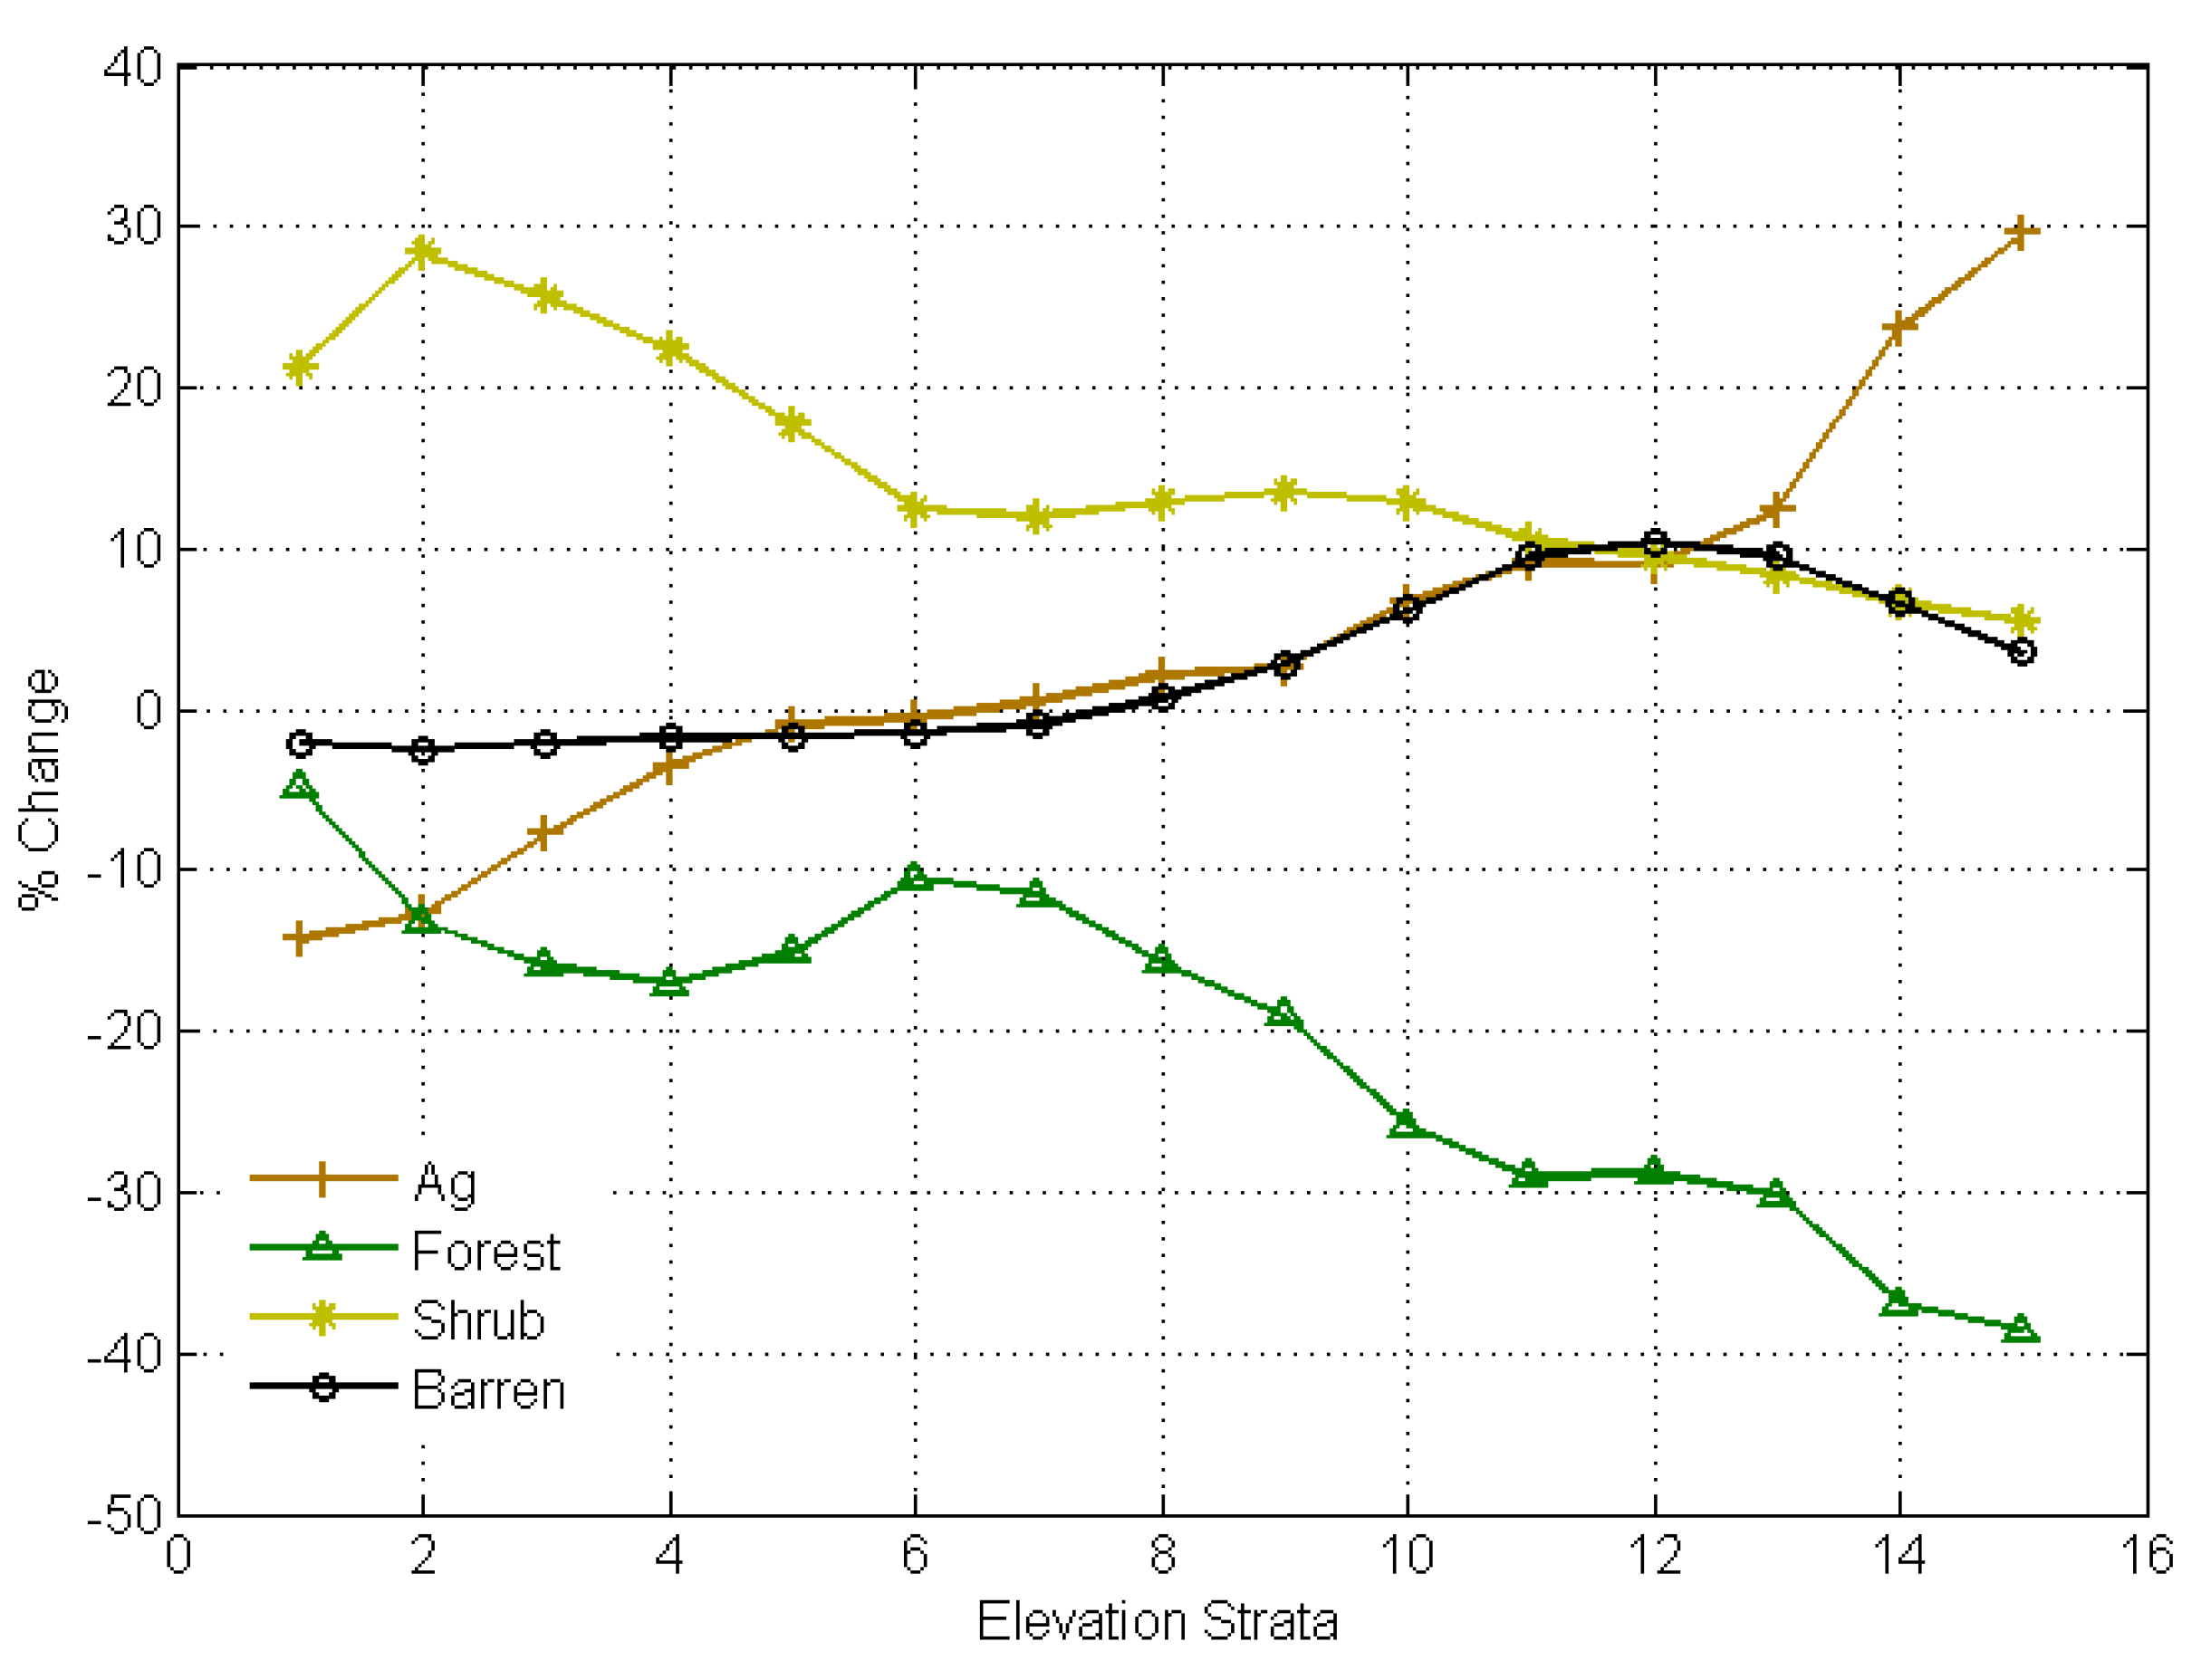
3.3. Landscape Pattern Analysis
| Year | Total Area (km2) | PN | MP (km2) | LP (km2) | |
|---|---|---|---|---|---|
| Forest/DV | 1990 | 389.61 | 4557 | 0.085 | 357.52 |
| 2010 | 314.43 | 4655 | 0.068 | 259.65 | |
| Agriculture | 1990 | 80.91 | 9234 | 0.009 | 12.32 |
| 2010 | 49.10 | 8102 | 0.006 | 5.24 | |
| Shrub | 1990 | 142.28 | 7454 | 0.019 | 40.04 |
| 2010 | 265.85 | 8362 | 0.032 | 86.45 | |
| Barren/Eroded | 1990 | 46.73 | 3710 | 0.013 | 11.13 |
| 2010 | 39.75 | 4202 | 0.009 | 16.61 |
4. Discussion
5. Conclusions
Conflicts of Interest
References
- Houghton, R.A. Tropical Deforestation as a Source of Greenhouse Gas Emissions. In Tropical Deforestation and Climate Change; Moutinho, P., Schwartzman, S., Eds.; Environmental Defense: Belem, Brazil, 2005; pp. 13–21. [Google Scholar]
- Lambin, E.F.; Geist, H.J.; Lepers, E. Dynamics of land-use and land-cover change in tropical regions. Annu. Rev. Environ. Resour. 2003, 28, 205–241. [Google Scholar] [CrossRef]
- Lambin, E.F.; Turner, B.L.; Geist, H.; Agbola, S.; Angelsen, A. The causes of land-use and land-cover change: Moving beyond the myths. Glob. Environ. Chang. 2001, 11, 261–269. [Google Scholar] [CrossRef]
- Cramer, W.; Bondeau, A.; Schaphoff, S.; Lucht, W.; Smith, B.; Sitch, S. Tropical forests and the global carbon cycle: Impacts of atmospheric carbon dioxide, climate change and rate of deforestation. Philos. Trans. R. Soc. Lond. B 2004, 359, 331–343. [Google Scholar] [CrossRef]
- Laurance, W.F. Reflections on the tropical deforestation crisis. Biol. Conserv. 1999, 91, 109–117. [Google Scholar] [CrossRef]
- Lal, R. Deforestation and land-use effects on soil degradation and rehabilitation in western nigeria. Land Degrad. Dev. 1997, 8, 95–126. [Google Scholar] [CrossRef]
- Foley, J.A.; DeFries, R.; Asner, G.P.; Barford, C.; Bonan, G.; Carpenter, S.R.; Chapin, F.S.; Coe, M.T.; Daily, G.C.; Gibbs, H.K.; et al. Global consequences of land use. Science 2005, 309, 570–574. [Google Scholar] [CrossRef]
- Metzger, M.J.; Rounsevell, M.D.A.; Leemans, R.; Schroter, D. The vulnerability of ecoystem services to land use change. Agric. Ecosyst. Environ. 2006, 114, 69–85. [Google Scholar] [CrossRef]
- Skole, D.; Tucker, C. Tropical deforestation and habitat fragmentation in the amazon: Satellite data from 1978 to 1988. Science 1993, 260, 1905–1910. [Google Scholar]
- Walsh, S.J.; Crawford, T.W.; Crews-Meyer, K.A.; Welsh, W.F. A multi scale analysis of land use land cover change and NDVI variation in Nang Rong District, Northeast Thailand. Agric. Ecosyst. Environ. 2001, 85, 47–64. [Google Scholar] [CrossRef]
- Walsh, S.J.; Shao, Y.; Mena, C.F.; McCleary, A.L. Integration of hyperion satellite data and a household social survey to characterize the causes and consequences of reforestation patterns in the northern ecuadorian amazon. Photogramm. Eng. Remote Sens. 2008, 74, 725–735. [Google Scholar]
- Rindfuss, R.R.; Walsh, S.J.; Turner, B.L.; Fox, J.; Mishra, V. Developing a science of land change: Challenges and methodological issues. Proc. Natl. Acad. Sci. USA 2004, 101, 13976–13981. [Google Scholar]
- Food and Agriculture Organization (FAO), An Interim Report on the State of Forestry Resources in the Developing Countries; Food and Agriculture Organization (FAO): Bloomington, IN, USA, 1998.
- Dolisca, F.; Mcdaniel, J.; Teeter, L.; Jolly, C. Land tenure, population pressure, and deforestation in Haiti: The case of forêt des pins reserve. J. For. Econ. 2007, 13, 277–289. [Google Scholar]
- Lea, J.D. A Review of Literature on Charcoal in Haiti. In Proposis: Semiarid Fuelwood and Forage Tree. Building Consensus for the Disenfranchised; Center Semi-Aridforest Resources Publication: Kingsville, TX, USA, 1996. [Google Scholar]
- Woodring, W.P.; Brown, J.S.; Burbank, W.S. Geology of the Republic of Haiti; The Lord Baltimore Press: Baltimore, MD, USA, 1924. [Google Scholar]
- Franz, R.; Gicca, D.F. Observations on the Haitian snake antillophis parvifrons alleni. J. Herpetol. 1982, 16, 419–420. [Google Scholar] [CrossRef]
- Hadden, R.L.; Minson, S.G. The Geology of Haiti: An Annotated Bibliography of Haiti’s Geology, Geography and Earth Science; Army Geospatial Center, US Army Corps of Engineers: Alexandria, VA, USA, 2010. [Google Scholar]
- Institut Haïtien de Statistique et d’Informatique (IHSI), Statistiques Démographiques et Sociales; Departement de L’Ouest, Ministere de L’Economie et Des Finances: Port-au-Prince, Haiti, 2003.
- World Vision Australia, Haiti: Thousands Flee to la Gonave to Seek Food and Shelter; World Vision Australia: Melbourne, Australia, 2010.
- Songe, C.; Woodcock, C.E.; Seto, K.C.; Lenney, M.P.; Macomber, S.A. Classification and change detection using Landsat TM data when and how to correct atmospheric effects? Remote Sens. Environ. 2001, 75, 230–244. [Google Scholar] [CrossRef]
- United States Geological Survey, Hazards Data Distribution Systems (HDDS); US Geological Survey: Sioux Falls, SD, USA, 2011.
- Anderson, J.R.; Hardy, E.E.; Roack, J.T.; Witmer, R.E. A Land Use and Land Cover Classification System of use with Remote Sensor Data; United States Government Printing Office: Washington, DC, USA, 1976. [Google Scholar]
- Weng, Q. Land use change analysis in the Zhujiang delta of china using satellite remote sensing, GIS and stochastic modelling. J. Environ. Manag. 2002, 64, 273–284. [Google Scholar] [CrossRef]
- Congalton, R. A review of assessing the accuracy of classifications of remotely sensed data. Remote Sens. Environ. 1991, 37, 35–46. [Google Scholar] [CrossRef]
- Shrestha, D.; Zinck, A. Land use classification in mountainous areas: Integration of image processing, digital elevation data and field knowledge (application to Nepal). Int. J. Appl. Earth Obs. Geoinf. 2001, 3, 78–95. [Google Scholar] [CrossRef]
- Smits, P.C.; Dellapiane, S.G.; Schowengerdt, R.A. Quality assessment of image classic cation algorithms for land-cover mapping: A review and a proposal for a cost-based approach. Int. J. Remote Sens. 1990, 20, 1461–1486. [Google Scholar]
- Cochran, W.G. Sampling Techniques; Wiley: New York, NY, USA, 1977. [Google Scholar]
- Stehman, S.V. Estimating the kappa coefficient and its variance under stratified random sampling. Photogramm. Eng. Remote Sens. 1996, 62, 401–402. [Google Scholar]
- Singh, A. Review article digital change detection techniques using remotely-sensed data. Int. J. Remote Sens. 1989, 10, 989–1003. [Google Scholar] [CrossRef]
- Liu, H.; Zhou, Q. Accuracy analysis of remote sensing change detection by rule-based rationality evaluation with post-classification comparison. Int. J. Remote Sens. 2004, 25, 1037–1050. [Google Scholar] [CrossRef]
- Yuan, F.; Sawaya, K.; Loeffelholz, B.; Bauer, M. Land cover classification and change analysis of the twin cities (Minnesota) metropolitan area by multitemporal Landsat remote sensing. Remote Sens. Environ. 2005, 98, 317–328. [Google Scholar] [CrossRef]
- Turner, M.G. Landscape ecology: The effect of pattern on process. Annu. Rev. Ecol. Syst. 1989, 20, 171–197. [Google Scholar]
- Gustafson, E.J. Quantifying landscape spatial pattern: What is the state of the art? Ecosystems 1998, 1, 143–158. [Google Scholar] [CrossRef]
- Luck, M.; Wu, J. A gradient analysis of urban landscape pattern: A case study from the Phoenix metropolitan region, Arizona, USA. Landsc. Ecol. 2002, 17, 327–339. [Google Scholar] [CrossRef]
- Millington, A.C.; Velez-Liendo, X.M.; Bradley, A.V. Scale dependence in multitemporal mapping of forest fragmentation in Bolivia: Implications for explaining temporal trends in landscape ecology and applications to biodiversity conservation. ISPRS J. Photogramm. Remote Sens. 2003, 57, 298–299. [Google Scholar]
- McGarigal, K.; Marks, B.J. Fragstats: Spatial Pattern Analysis Program for Quantifying Landscape Structure; US Department of Agriculture, Forest Service, Pacific Northwest Research Station: Portland, OR, USA, 1993. [Google Scholar]
- Riitters, K. Assessing habitat suitability at multiple scales: A landscape-level approach. Biol. Conserv. 1997, 81, 191–202. [Google Scholar] [CrossRef]
- Tischendorf, L. Can landscape indices predict ecological processes consistently? Landsc. Ecol. 2001, 16, 235–259. [Google Scholar] [CrossRef]
- Vital, J.A. Land Use/Cover Chang Using Remote Sensing and Geographic Information Systems: Pic Macaya National Park, Haiti; Michigan Technological University: Houghton, MI, USA, 2008. [Google Scholar]
- Forman, R.T. Some general principles of landscape and regional ecology. Landsc. Ecol. 1995, 10, 133–143. [Google Scholar] [CrossRef]
- Bal, Z.G.; Dent, D.L.; Olsson, L.; Schaepman, M.E. Global Assessment of Land Degradation and Improvement: Identification by Remote Sensing; United Nations Food and Agriculture Organization-International Soil Reference and Information Center (FAO-ISRIC): Wageningen, The Nethernlands, 2008. [Google Scholar]
- Stevenson, G.G. The production, distribution, and consumption of fuelwood in Haiti. J. Dev. Area. 1989, 24, 59–77. [Google Scholar]
- Peres, C.; Barlow, J.; Laurance, W. Detecting anthropogenic disturbance in tropical forests. Trends Ecol. Evol. 2006, 21, 227–229. [Google Scholar] [CrossRef]
- Read, J.M.; Denslow, J.S.; Guzman, S.M. Documenting land cover history of a humid tropical environment in northeastern coasta Rica using time-series remotely sensed data. GIS Remote Sens. Appl. Biogeogr. Ecol. 2001, 626, 69–89. [Google Scholar]
© 2013 by the authors; licensee MDPI, Basel, Switzerland. This article is an open access article distributed under the terms and conditions of the Creative Commons Attribution license (http://creativecommons.org/licenses/by/3.0/).
Share and Cite
White, J.; Shao, Y.; Kennedy, L.M.; Campbell, J.B. Landscape Dynamics on the Island of La Gonave, Haiti, 1990–2010. Land 2013, 2, 493-507. https://doi.org/10.3390/land2030493
White J, Shao Y, Kennedy LM, Campbell JB. Landscape Dynamics on the Island of La Gonave, Haiti, 1990–2010. Land. 2013; 2(3):493-507. https://doi.org/10.3390/land2030493
Chicago/Turabian StyleWhite, Justin, Yang Shao, Lisa M. Kennedy, and James B. Campbell. 2013. "Landscape Dynamics on the Island of La Gonave, Haiti, 1990–2010" Land 2, no. 3: 493-507. https://doi.org/10.3390/land2030493