Article

Linking Land Cover Data and Crop Yields for Mapping and Assessment of Pollination Services in Europe

Institute for Environment and Sustainability, Joint Research Centre of the European Commission, Via E. Fermi 2749, 20127 Ispra, Italy
*
Author to whom correspondence should be addressed.
Land 2013, 2(3), 472-492; https://doi.org/10.3390/land2030472
Submission received: 25 July 2013 / Revised: 23 August 2013 / Accepted: 5 September 2013 / Published: 11 September 2013

Abstract

:
Pollination is a key ecosystem service as many crops but in particular, fruits and vegetables are partially dependent on pollinating insects to produce food for human consumption. Here we assessed how pollination services are delivered at the European scale. We used this assessment to estimate the relative contribution of wild pollinators to crop production. We developed an index of relative pollination potential, which is defined as the relative potential or relative capacity of ecosystems to support crop pollination. The model for relative pollination potential is based on the assumption that different habitats, but in particular forest edges, grasslands rich in flowers and riparian areas, offer suitable sites for wild pollinator insects. Using data of the foraging range of wild bees with short flight distances, we linked relative pollination potential to regional statistics of crop production. At aggregated EU level, the absence of insect pollination would result in a reduction of between 25% and 32% of the total production of crops which are partially dependent on insect pollination, depending on the data source used for the assessment. This production deficit decreases to 2.5% if only the relative pollination potential of a single guild of pollinators is considered. A strength of our approach is the spatially-explicit link between land cover based relative pollination potential and crop yield which enables a general assessment of the benefits that are derived from pollination services in Europe while providing insight where pollination gaps in the landscape occur.

1. Introduction

Crop pollination by wild insects is an important ecosystem service with high economic value. The productivity of many agricultural crops depends on the presence of pollinating insects and the ecosystems that support insect populations. A recent report highlighted in particular the role of wild pollinators, which are more effective than honey bees in enhancing fruit set of crops [1]. Insect pollination is necessary for 75% of global crops that are used as human food [2] and the cultivation of pollination-dependent crops has steadily increased between 1961 and 2006 [3]. Several attempts have estimated the global economic value of pollination [4,5,6] and, although these estimates are still uncertain since the dependency of crops on insect pollination is not completely understood, these studies make clear that ecosystem services such as crop pollination are fundamental for human well-being. Concerns have therefore arisen, whether such services can be maintained at a sustainable level in degraded agro-ecosystems [7,8]. The loss of pollinators has indeed received a lot of global concern due to its importance for human wellbeing [9] and the potential negative impact of the loss of pollination services on food security and human welfare has triggered the attention of, in particular, agricultural policy-makers. Several studies provide evidence that pollinator diversity and abundance has significantly fallen [9,10,11], and these losses are in particular biased towards species with a specialization for particular habitats and diets [9]. The main drivers of pollinator losses are to be found in habitat loss [11] and agricultural intensification [9,11]. Such biased losses of species with particular traits are of concern since they are expected to reduce the resilience of crop pollination services across species, season and space.
In Europe, crop production is argued to be highly dependent on insect pollination with about 84% of all crops that have been studied depending on or benefiting from insect pollination [12]. The assumed dependence of European crops on pollination and the high monetary value associated with crop pollination triggered a demand to delineate places where semi-natural and natural ecosystems have the potential to provide pollination services in Europe so that these habitats can be conserved or restored [8,13]. There is indeed an explicit policy request for better spatial data of ecosystem services in general and pollination services in particular. Action 5 of the EU Biodiversity strategy [14,15] calls the EU Member States to map and assess the state of ecosystems and their services in their national territory by 2014, assess the economic value of such services, and promote the integration of these values into accounting and reporting systems at EU and national level by 2020. The purpose of this effort is to provide the knowledge base on which decisions that affect land based resources can be made, especially by the EU’s agriculture and regional policies.
Here we present an approach to map and assess the relative importance of pollination to European agricultural crops at a continental scale. We framed our mapping approach in the ecosystem services cascade model [16], which connects ecosystem structure and functioning to human well-being though the flow of ecosystem services. Different habitats, but in particular forest edges, grasslands rich in flowers and riparian areas, offer suitable sites for wild pollinator insects such as solitary or honey bees, bumblebees or butterflies [17,18,19]. As soon as these insects start foraging, ecosystems that host these insect populations have the potential to increase the yield of adjacent crops that are dependent on insect mediated pollination [20]. While cereals do not profit from pollination, important fruit, vegetable, nut, spice, and oil crops do [2]. The demand for the pollination service is thus generated by the decision of the farmer to plant crops, which depend on or profit from pollination [6]. At this point, wild pollinators deliver economic value which can be measured by assessing the contribution of pollination to total crop yield or by estimating the costs that are saved based on replacing wild pollination with a managed form [3,21,22,23].
Our approach to map how pollination services are delivered at landscape scale and to assess the relative contribution to crop production builds on the framework proposed by Lonsdorf et al. [24]. These authors summarized key ecological information of different pollinator species into a model using simple land-cover data and field or expert based parameters on flight distance and foraging and nesting behavior. The model then predicts an index related to relative abundance and connects this index to farm production of crops that are dependent on insect pollination. Here, we refer to this index as the relative pollination potential, which is defined as the relative potential or relative capacity of ecosystems to support crop pollination. To be applicable at the European scale, we adapted the model to make optimal use of European wide datasets and models of land cover and land use and to account for climatic variation. Next, we linked relative pollination potential to regional statistics of crop production to assess the benefits that arise from wild pollinators and we identified areas in the landscape with a deficit in potential pollination. Finally we discuss strengths and shortcomings of our approach with a view on using the information for policy support at EU scale.

2. Methods

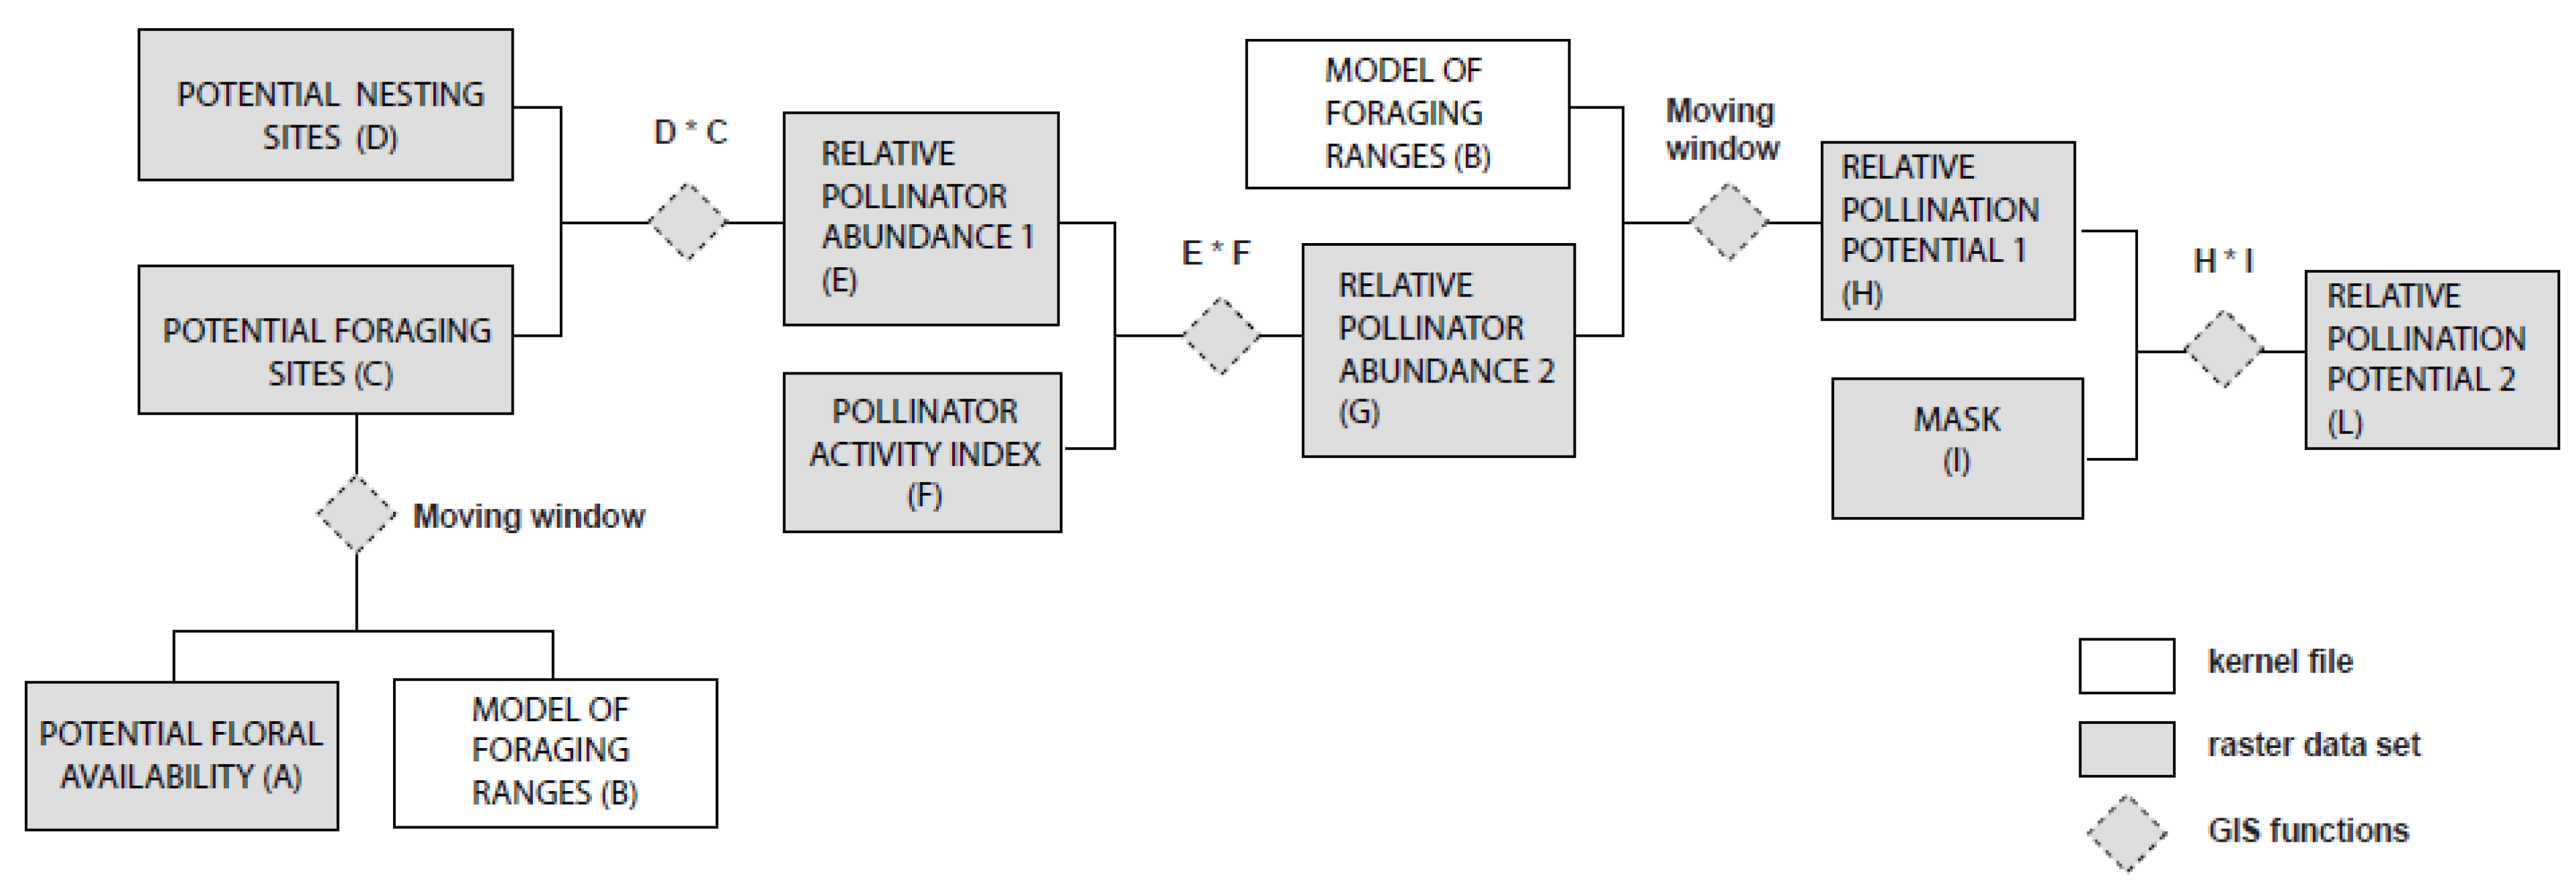
2.1. General Outline of the Pollination Supply Model

The applied methodology was derived from the InVEST model which was developed for mapping ecosystem services at local scale [24,25] but adapted to fit a continentally scaled mapping approach. The InVEST pollination model focuses on wild bees as key animal pollinators. It scores land cover parcels for their potential to host and feed wild pollinator insects and generates an index of the relative abundance of pollinators. Next, once the abundance indices at source habitats are estimated, it predicts a relative abundance of different pollinator species on parcels with crops that need pollination based on species-specific flight ranges.
At the European scale the InVEST model was adapted at four essential points: (1) different input data were used to model composite indicators for floral availability and nesting suitability; (2) a specific land parcel system based on the CAPRI (Common Agricultural Policy Regionalized Impact) model [26] was used to estimate the contribution of crops to floral availability and nesting suitability and to estimate the relative benefits derived from pollination; (3) an extra module was computed to estimate the activity of wild bee pollinators and (4) areas where pollinators cannot physically occur were excluded.
The underlying rationale of the pollination model is explained in Figure 1. The model uses an expert based assessment of various types of land cover information to estimate the availability of floral resources (A) and foraging ranges (B) to map possible foraging sites (C). This data is combined with an estimate of available nesting sites (D) to derive an index of relative pollinator abundance (E) on each cell of a land cover map. Map E is corrected for differences in activity (F) as a result of climatic variation in temperature and solar irradiance. Bees become inactive when a combination of temperature and irradiance falls below a certain threshold [27]. This affects their abundance outside the nest. Including temperature dependent activity resulted in an updated relative pollinator abundance (G). Flight range information (B) is used a second time to estimate relative pollination potential (H). A final map of relative pollination potential (L) was obtained by masking out areas where pollinator insects cannot find nesting sites such as on open water and at high altitudes (I). Our model required five key input variables and parameters: (1) a specific map of nesting suitability; (2) a specific map of floral resource availability; (3) species-specific parameters describing the flight range; (4) species-specific parameters that relate temperature and solar irradiance to activity and (5) a map of land cover types where insects cannot forage or find nesting sites.
Figure 1. Flow chart outlining the setup of the pollination model which results in the calculation of the relative pollination potential.
Land 02 00472 g001
Maps of relative pollination potential can be produced for each pollinator species provided that parameters about flight distance and activity are available [24]. For the purpose of this study, we generated only one map showing the relative pollination potential based on a single ecological guild of pollinators with a relatively short flight distance using solitary bees as model. However, this model nor the InVEST pollination module are restricted to this ecological guild provided that species-specific data to parameterize the model are available.

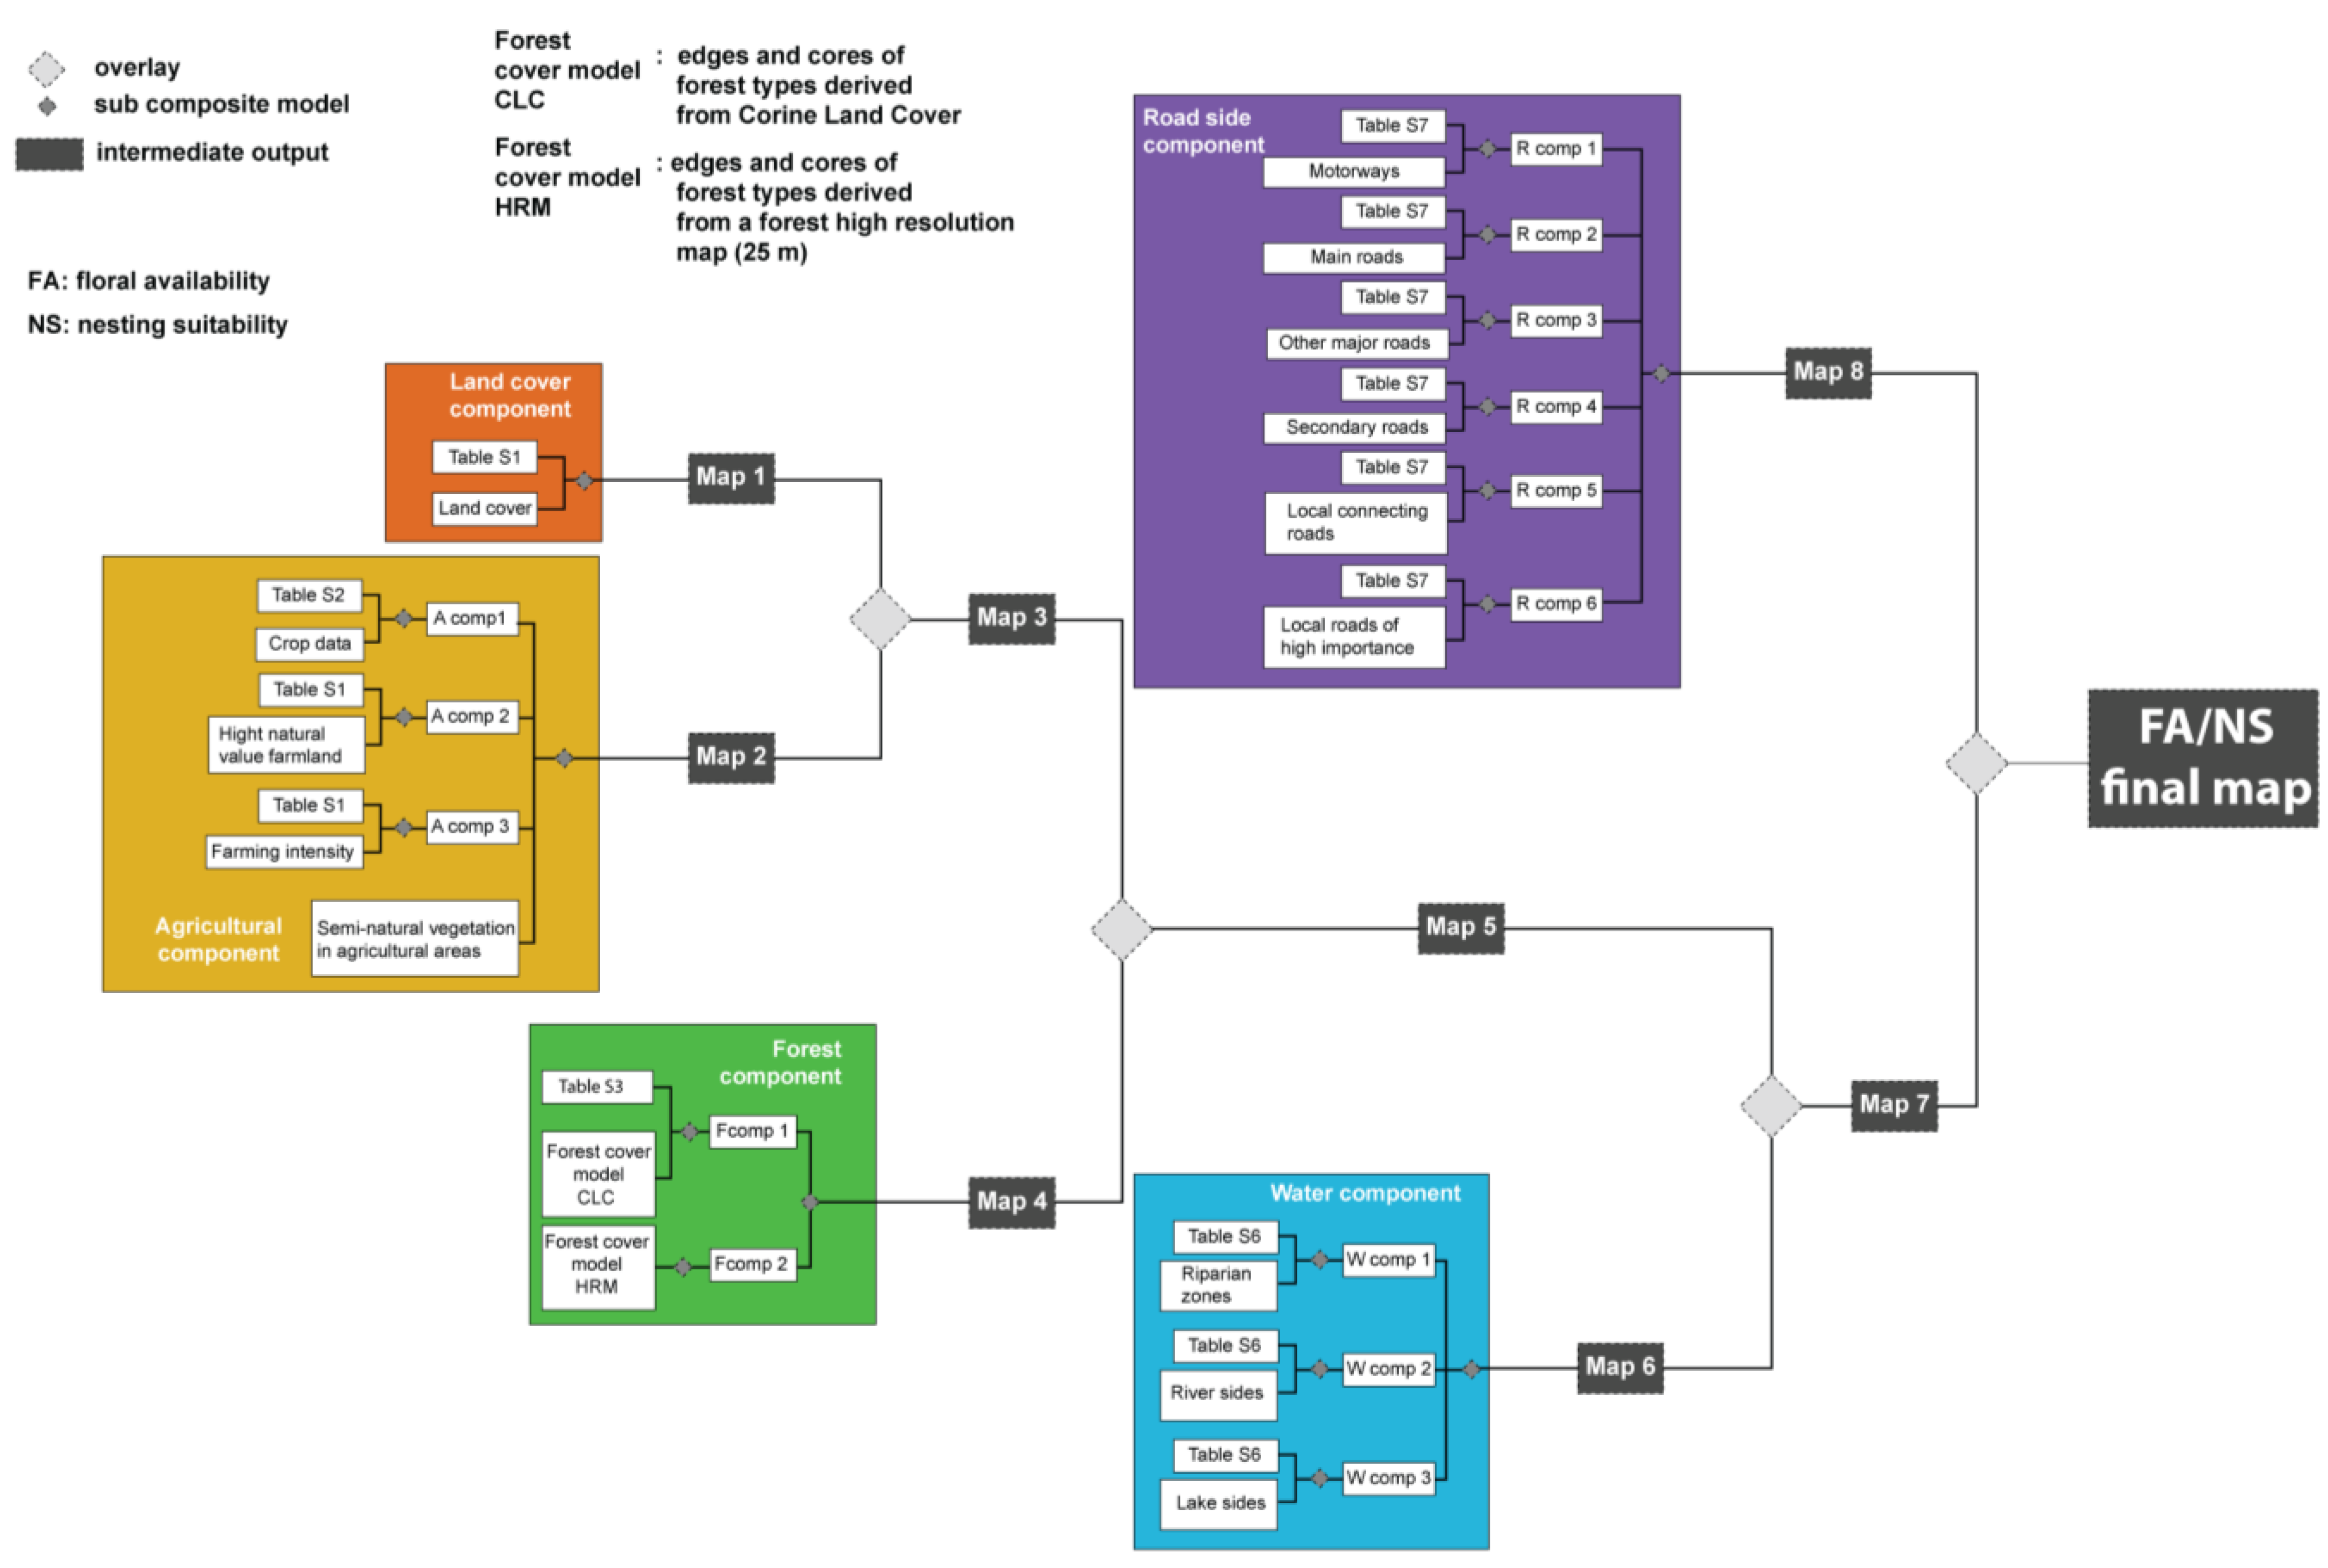
2.2. Nesting Suitability and Floral Availability

Two composite indicators were used to map floral availability (Map A, Figure 1) and nesting suitability (Map D, Figure 1). Both maps were constructed using similar spatial datasets and models but different weights were given to each spatial attribute with respect to their capacity to host nests or their availability of floral resources. Assigning weights to the various spatial attributes was based on literature. Next, we organized a one day workshop during which we discussed the weights with three experts to derive a set of final weights per land cover or land use type on a scale between 0 and 1. A score of 0.5 would indicate that 50% of the land cover pixel provides suitable nesting sites and available floral resources [24].
Figure 2 presents a flowchart showing how both composite indicators were derived using several spatial datasets while several tables of the Supplement to this article provide the scores between 0 and 1 assigned to different land cover and land use types with respect to nesting suitability and floral availability.
Figure 2. Flow chart presenting the data flow used to derive a final map of nesting suitability and floral availability (FA/NS final) (Models A and D in Figure 1). The data used to obtain the maps are presented in Table 1. The Tables S1 to S7 in the supplement contain the scores that were attributed to different land cover types. The supplement also lists the different GIS functions and operations used to derive maps 1, 2, 4, 6 and 8.
Land 02 00472 g002
The base map for the assessment of nesting suitability and floral availability was the CORINE Land Cover data for the year 2000 (CLC2000) (Table 1, Table S1). The CLC2000 data were subsequently combined with other datasets in a composite model in order to improve the initial scores using more accurate spatial data on agricultural land use, forest cover, riparian areas and roadsides (Figure 2, Table 1); more accurate spatial data replaced or overlapped with the specific CLC2000 type avoiding double counting. These land cover types are assumed to be important suppliers of habitats for wild bee species [17,18,19,23].
The model to obtain final scores for nesting suitability and floral availability has a cascade structure (Figure 2). Starting from a set of initial scores based on only land cover (Map 1 in Figure 2), the model was updated at each step with new information using logical expressions and GIS operations to determine values in areas where spatial datasets overlap each other or where more accurate spatial data can be used instead of the basic land cover map. Map 2 (Figure 2) assessed nesting suitability and floral availability in agricultural land and updated Map 1 to Map 3. Next, this latter map was overlaid with a forest-specific assessment (Map 4) to result in Map 5. In a following step, spatial data on riparian areas (Map 6) was added to construct Map 7. Subsequently, the data on road sides were considered (Map 8). The final result was a map of potential nesting suitability and floral availability (map FA/NS final).
Table 1. Data sources used for each component of the pollination model to calculate the relative pollination potential. The relationships between the different model components are shown in Figure 2.
ComponentData DescriptionResolution
Land cover CORINE Land Cover 2000 (CLC2000) raster data—version 13 (02/2010)
Source: EEA, 2010
Map of the European environmental landscape based on interpretation of satellite images with land cover types in 44 standard classes.
100 m
Agricultural land useCrop yield data
The CAPRI model results in crop yield statistics for homogeneous clusters of 1 km2 pixels (HSMU), identified on the basis of the Farm Structure Survey regions (NUTS 2 or 3, depending on the Member State, EUROSTAT 2003), land cover (CLC2000), soil mapping units (European Soil Database V2.0, European Commission, 2004) and slope [26].
1,000 m
Olive farming data [28] 100 m
High Nature Value Farmland (HNV) data.
HNV is defined as areas in Europe where agriculture is a major (usually the dominant) land use and where that agriculture supports, or is associated with, either a high species and habitat diversity or the presence of species of European conservation concern, or both. Source: JRC [29]
100 m
Presence of semi-natural vegetation at European scale.
Source JRC, unpublished
100 m
Road network TeleAtlas® MultiNet dataset (version 2007.10)
WaterRiparian zones [30]25 m
CCM2 data (river network and small lakes) Source: JRC/EEA
CLC2000 data (main lakes) Source: EEA
Forest coverCLC2000 data Source: EEA100 m
Pan-European Forest/Non-Forest Map 2006, Source: JRC [31]25 m
Activity indexAGRI4CAST interpolated grid [32]25 km
The remainder of this section provides more detail on the different components of the spatial model. All the maps were made at a 100 m resolution using the CLC2000 dataset as base layer. This required for some datasets to aggregate data from higher spatial resolution to 100 m while other data had to be downscaled. The text of the supplement to this paper contains more specific details on the GIS operations and functions that were used to derive a final map of nesting suitability and floral availability.

2.2.1. Cropland

Cropland is a dominant land cover in Europe but the CLC2000 data do not report agricultural land use or management of the land. Therefore, additional data were used to determine nesting suitability and floral availability on arable land. We used spatial data of land use (crop types) based on the CAPRI model [26] to assign weights for nesting suitability and floral availability for each crop type (Table S2 of the Supplement). The CAPRI model provides crop shares for Homogenous Soil Mapping Units (HSMU), which have a size of 1 km2. Next, we replaced the CLC2000 arable land cover with the HSMU crop data and calculated a score for floral availability and nesting suitability as a weighted zonal average (Figure 2). Note that flowering crops are suppliers of floral resources for pollinators while at the same time they may benefit from pollination as well. This is the case for fruit trees such as apple orchards. Other crops, for instance potato, carry flowers which attract foraging insects but the production of the edible parts of the plant is situated in its root zone and hence, not dependent on pollination. Other crops, such as cereals, are not dependent on pollination and provide little floral resources for pollinators.
The presence of extensive farming, which is characterized by a small input of labor, fertilizer and capital relative to the land area being farmed, or organic farming increases pollination success [33]. It enhances the benefit of crop pollination for yield quantity and quality [34] and determines a favorable condition for the insect activity [23,35]. Therefore, scores of habitat suitability and floral availability were increased in agricultural areas under extensive farming [28] and areas under High Natural Value Farmland (Table S1, Supplement; Figure 2, [29]). To determine areas under extensive farming, only data about olive cultures are available at the European scale, but the same procedure could be used to add data layers to the model for other crop types as well. Habitat heterogeneity and the presence of semi-natural habitats in an agricultural landscape improve insect activity due to increased nesting sites and floral resources [35,36,37]. So as a last step we increased again the scores of nesting suitability and floral availability in agricultural areas based on the CLC2000 dataset that intersect with a map of the semi natural habitats in Europe (unpublished dataset, source: Joint Research Centre) so as to value e.g., small patches of woodland in agricultural land.

2.2.2. Forest

Forest and woodland provide nesting habitat and floral resources for pollinators. In particular, forest edges adjacent to more open land have a positive impact and small patches are particularly important for insect activity [17,18]. Forests were mapped using the CLC2000 data in combination with a high resolution forest map [31]. We computed the Euclidean distance from the edges to the core of forested patches. For the CLC2000 data, we assigned separate scores to the edge and core areas of different forest types, namely broad-leaved, coniferous and mixed forests (Table S3). The edge area score is constant. The core area score decreases from its edge towards its center, according to a distance decay function based on the average foraging range of pollinators. A high resolution forest map (HRFM) was aggregated at 100 m proportionally to the surface covered. We then combined the two datasets.

2.2.3. Riparian Zones

Riparian zones, lake boundaries, levees, rivers and ditches in semi natural zones have a positive impact on insect activity [19]. Here we used a European riparian zone model [30], which evaluates a set of land cover types (forest and semi-natural areas and water bodies, Table S4) and assigns them to a particular riparian zone class. The output data has a spatial resolution of 25 m. River network and lake boundaries datasets complement the European riparian zones model for areas that are not included, which are agricultural areas, open spaces with little or no vegetation, inland wetlands and maritime wetlands (Table S5). We assumed a buffer of 25 m along rivers, lakes and wetlands in areas not considered by the European riparian zone model and assessed at 100 m resolution the percentage of the land cover types included in Table S5 relative to all available land. Next, the riparian zone that was obtained from the European riparian zone model as well as from the extension of this model in the above mentioned land cover types were scored for their nesting suitability and floral availability using the scores of Table S6.

2.2.4. Road Sides

Marginal habitats, roadsides and field paths in semi natural zones have a positive impact on nesting suitability and floral availability, and may provide suitable bee habitat especially in highly modified landscapes [18,38,39]. In Europe, road sides, although influenced by emissions from traffic, road maintenance or agriculture, are often mowed which is assumed to explain higher plant diversity of road sites relative to other field border sites [39]. Moreover, in several EU countries, particular regulation applies with respect to the dates and frequency of mowing and pesticide use in order to maintain the natural character of road sides. Arguably, we assumed higher nesting suitability and floral availability on road sites. We used TeleAtlas as a model for the road network in Europe. We extracted only roads inside natural, semi natural and agricultural landscapes (excluding all the artificial zones) and we assigned specific scores for NS and FA to a 25 m buffer computed for six road types. The data were the aggregated at 100 m resolution. Scores change according to the importance of the road (Table S7).

2.3. Foraging Range Model

Land parcels, which are suitable to support nesting, are connected to crops that need to be pollinated by the flight distance of pollinating insects (Model B in Figure 1). Wild bees can pollinate crops insofar as the distance between their nests and the crops that provide foraging resources does not exceed the foraging range. Furthermore, foraging is assumed to decline exponentially with distance [40,41,42]. Average foraging distances are species-specific and vary between a few meters to several kilometers. Based on data of expected foraging distance of different bee species [24], we selected a distance of 200 m to represent short flight distance species, using solitary bees as a model [40]. This distance was used to simulate the potential foraging sites (Model C in Figure 1) and the relative pollination potential (Model H in Figure 1) using the same equations as the InVEST model [24].

2.4. Activity

Habitats may be suitable to provide nesting sites or forage to pollinators but if the ambient temperature is below a certain threshold, the potential to pollinate approaches zero as insects will not leave the nest in order to forage. Corbet et al. [27] developed a model to express pollination activities based on the proportion of active honeybees and bumblebees. This proportion was measured by counting in the field the numbers of individuals that leave the nest for foraging relative to the peak number of nest leavers that was observed during daily counting. Social bee species were demonstrated to increase their activity linearly with temperature if a certain temperature threshold was reached. Because we could not find any specific information for solitary bees, we assumed a similar linear model, which increases activity as a function of temperature.
We thus adapted the relative pollination abundance to account for climatic variation in temperature and solar irradiance by calculating an annually averaged activity coefficient between 0% and 100% representing the pollination activity (Model F in Figure 1).
The activity coefficient A was calculated as:
A (%) = −39.3 + 4.01 × Tblackglobe
where Tblackglobe stands for the temperature in a black, spherical model, which simulates the body temperature of an insect. This temperature can be calculated as a function of ambient temperature T (°C) and solar irradiance R (W·m−2) [27]:
Tblackglobe = −0.62 + 1.027 × T + 0.006 × R
Activity coefficients that were <0% or >100% were adjusted to 0% and 100%, respectively. This assessment was performed at 25 km resolution using the JRC MARS climate database [32] which contains meteorological data for Europe. The database reports solar irradiance in units kJ·m−2·day−1. To convert to W·m−2, we calculated the hours of daylight as a trigonometric function of latitude.

2.5. Regional Pollination Deficit

The map of relative pollination potential (Map L, Figure 1) was applied in two regions in Europe (Veneto, Italy and Midi-Pyrénées, France) to visualize better where areas exist with a pollination deficit or a gap in the supply of the service. Pollination deficits were mapped as the difference between 1 and the regional relative pollination potential. This latter quantity is the relative pollination potential which is normalized between 0 and 1.

2.6. Benefit for Crop Production

We assessed the biophysical demand for pollination using a methodology based on Gallai et al. [5]. Their work is based on the hypothesis that the economic impact of pollinators on agricultural output is measurable through the use of dependence ratios quantifying the impact of a lack of insect pollinators on crop production value. We multiplied CAPRI based statistics on crop production and the dependence ratios to estimate what share of the total crop yield in metric ton can be attributed to insect pollination. This value corresponds to a crop production deficit, which is the reduction in crop production in absence of animal pollination [22]. Table S2 shows the list of crops taken into account for this study and their dependence on insect pollination as a percentage between 0% and 100%.
For 24 countries of the EU, for which CAPRI output is available, we calculated the crop production deficit CPD (%) by summing over all HSMU units as:
Land 02 00472 i001
where CPD represents the share of the crop yield attributed to insect pollination, DPj is the dependency (%) of crop j on insect pollination, HYj is the total production (tonne·yr−1) of pollination-dependent crop j for each HSMU and RPPj is the average relative pollination potential for each HSMU (Map L, Figure 1). We also calculated Equation (3) assuming that RPPj is equal to 1 (maximum potential) to allow comparisons between our results and previous reports that do not account for the potential of landscapes to provide pollination services.
The CAPRI model lumps different crops into single, aggregate categories. As a result, crop-specific differences in dependency on pollination are leveled. For example, the CAPRI model groups all vegetables but tomatoes into a single class. However, the dependency on pollination between different vegetables varies widely from no dependency to 95% for water melons and melons. This will effect values for CPD for countries where pollination-dependent fruits and vegetables are grown. Eurostat, the EU’s statistical office, provides more detailed production data of crops at a national level. We downloaded Eurostat table with code “apro_cpp_crop” for the year 2004 from the Eurostat website which contains data of harvested production in ton per year for 17 categories and subcategories for cereals, 30 categories and subcategories for other main crops (mainly dried pulses, root crops and industrial crops), 40 categories and subcategories for vegetables and 41 categories and subcategories for fruits. Using [5] we assigned dependencies on all crop types. Table S8 contains the crops dependent on insect pollination along with the dependency (%) assigned to each type. Next, we applied equation 3 for each country of the EU-28 assuming RPP = 1 and omitting the sum over HSMU since the production data were national aggregates.

3. Results

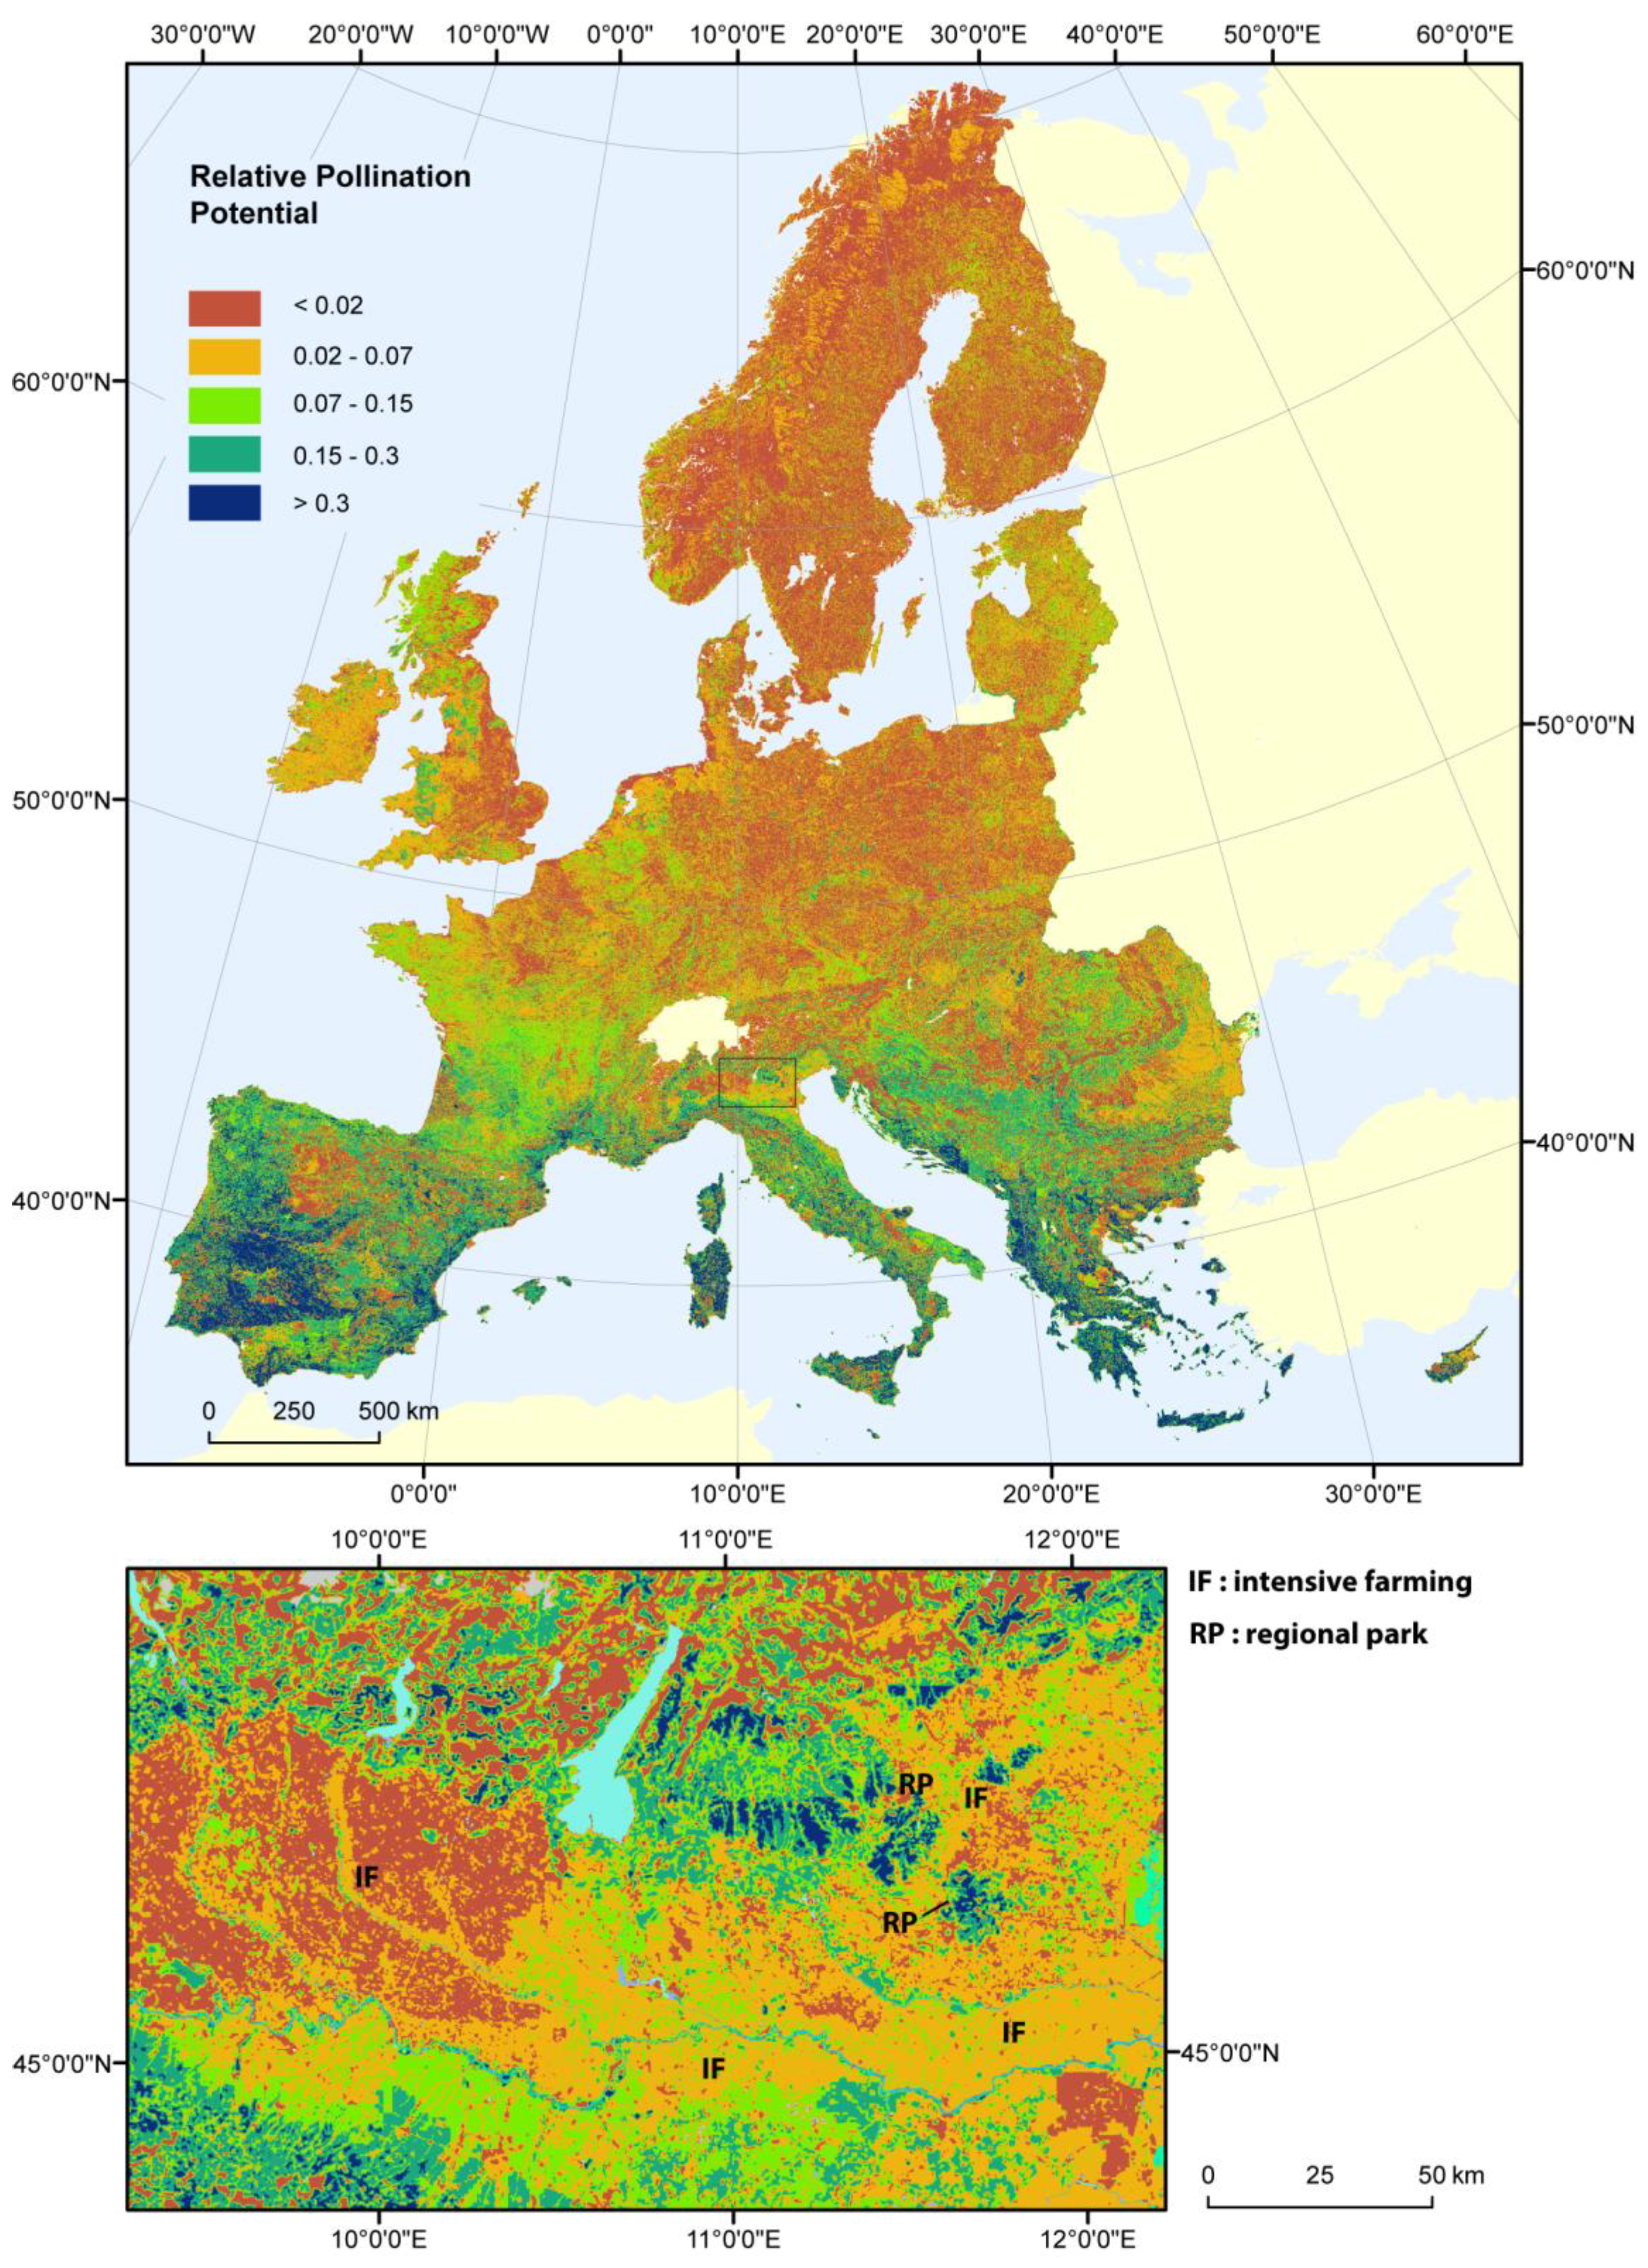
3.1. Relative Pollination Potential

An EU wide map of relative pollination potential (RPP) is presented in Figure 3. This map depicts the potential of land cover cells to provide crop pollination by short-flight distance pollinators on a relative scale between 0 and 1. A value of 0 means no capacity to supply pollination, while a value of 1 refers to a maximum capacity to provide pollination services by a single guild of pollinators. It is based on the input information that is presented in Figure 1 including the relative suitability of land cover cells to host pollinator populations, the availability to provide floral resources and the average activity of bees as a result of climatic variation. The general pattern of the RPP is an increase of pollination potential along a north-south gradient in southern direction following the temperature gradient in Europe, corresponding to the modeled activity rate of bees.
Given temperature, RPP is low in areas where the dominant land use is arable land used for the production of cereals. This is the case for the east of the United Kingdom, areas in France surrounding the capital, areas in central Spain, the Po plain in Italy, areas in northern Germany, Poland and Slovakia and the along the borders of the Danube in Bulgaria and Romania. These areas are assumed to have a relatively low nesting suitability and to offer limited resources for foraging due to lower abundance of plants with flowers carrying nectar.
The inset in Figure 3 demonstrates the modeled effect of semi-natural and natural areas on pollination potential. The inset covers a large part of the Po Valley in North Italy with Lake Garda as clear land mark in the middle of the map. Areas in orange correspond to intensively used agricultural land where RPP is low, indicated by IF (intensive farming). Different elements but in particular the riparian area along river Po (flowing from the west to the east) and regional parks (RP on the map) increase the pollination potential of the landscape.
Figure 3. Relative Pollination Potential (RPP) index. RPP estimates the capacity of land cover cells to provide crop pollination by short flight distance pollinators. The inset covers the Po valley in North Italy.
Land 02 00472 g003

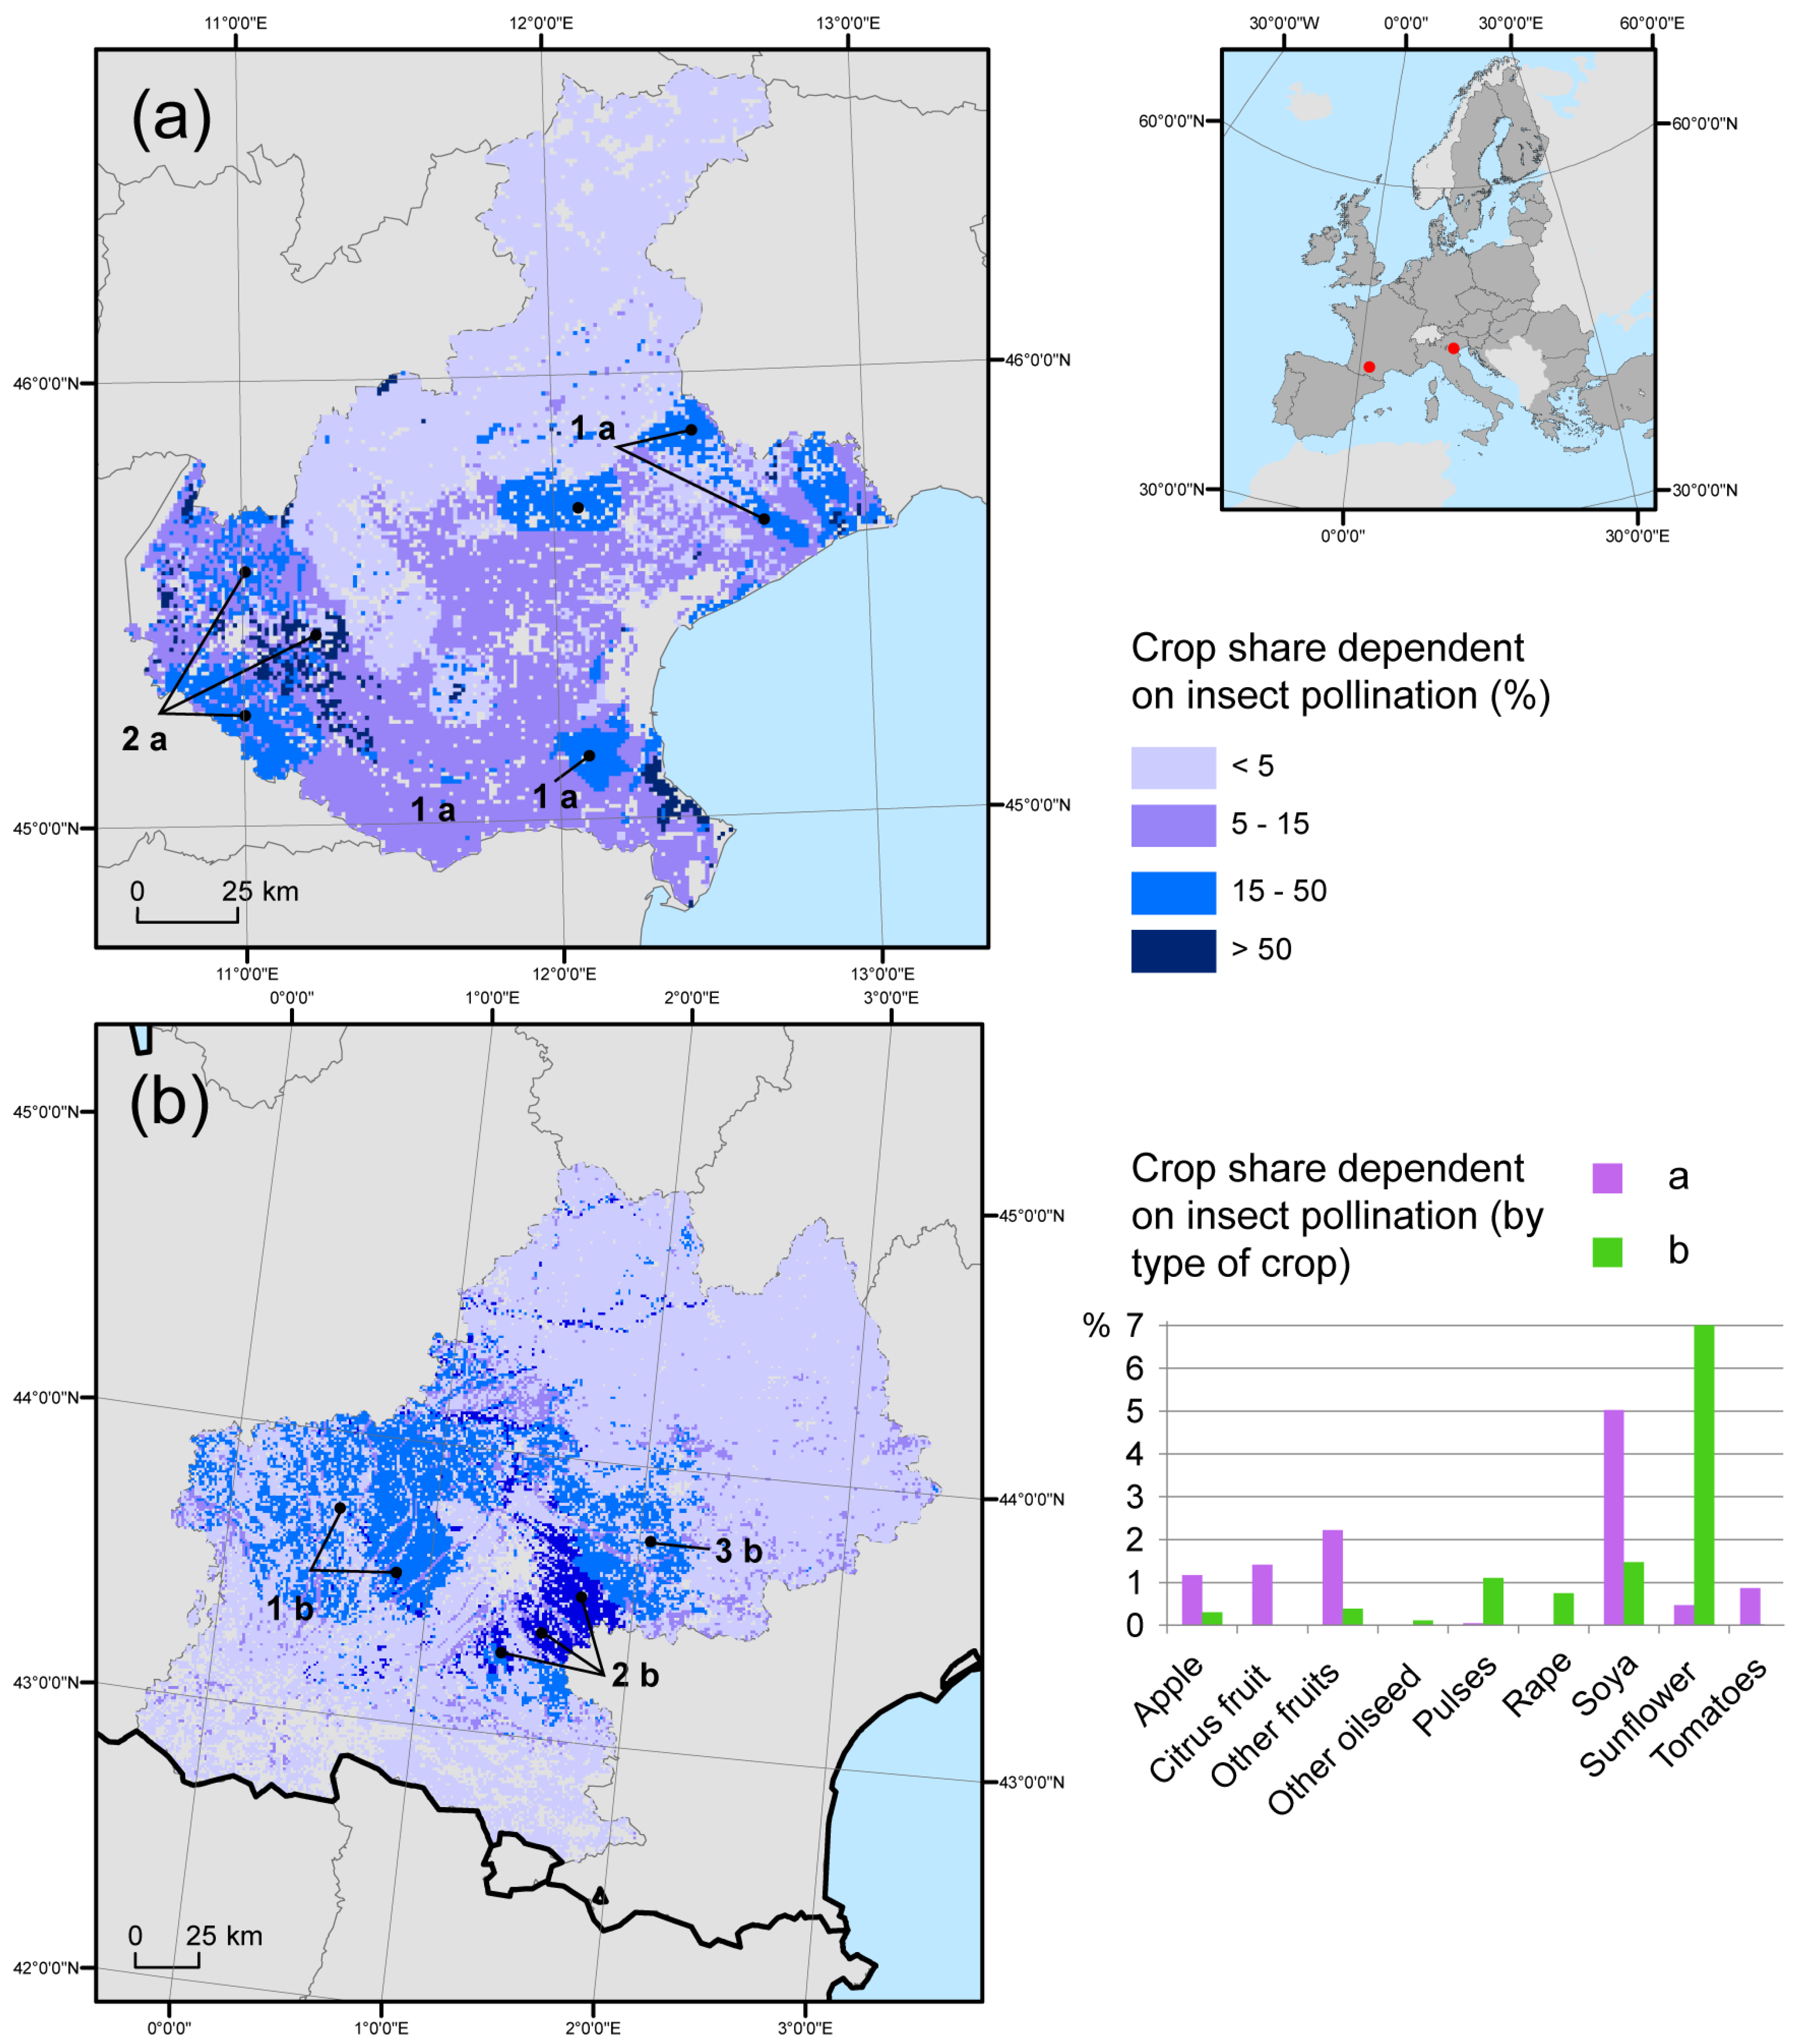
3.2. Benefits of Pollination for Crop Yield

Table 2 estimates for the 28 member states of the European Union (EU) the benefits of pollination for crop yield estimated by the percentage reduction of the aggregate production of crops, which are dependent on insect pollination. At aggregated EU level, the absence of insect pollination would result in a reduction of 25% of the total production of pollination-dependent crops, if the assessment is based on the CAPRI model and 32.6% if the assessment is based on Eurostat statistical data. This deficit decreases to 2.46% if only the relative pollination potential is considered that is mapped in Figure 3. Recall that this is the potential that is expected to be supplied by only a single guild of pollinator characterized by a short foraging distance. Adding more species with increased flight range to the map of relative pollination potential would increase this percentage, up to a maximum of 25% if the landscape can provide a fully covering potential to crop fields that require insect pollination.
Table 2. Crop production deficit (CPD, %) assuming a loss of maximum relative pollination potential (RPP = 1) and assuming a loss of relative pollination potential based on the map in Figure 3. Data are taken for 2004. CAPRI does not have data for Croatia, Malta and Cyrus.
CountryCPD (%) (RPP = 1)CPD (%) (RPP = 1)CPD (%) (RPP)
Source: EUROSTATSource: CAPRISource: CAPRI
Austria47.745.03.83
Belgium26.639.73.26
Bulgaria30.823.41.78
Croatia45.7
Cyprus23.9
Czech Republic28.827.41.29
Denmark26.025.10.79
Estonia26.024.21.15
Finland34.120.90.71
France32.329.12.82
Germany30.729.31.28
Greece34.820.14.11
Hungary40.935.42.44
Ireland8.729.31.11
Italy30.723.92.95
Latvia46.236.01.91
Lithuania25.827.91.04
Luxembourg36.851.45.14
Malta43.6
Netherlands32.532.32.71
Poland45.345.02.09
Portugal21.17.52.16
Romania46.831.33.6
Slovakia26.426.81.79
Slovenia57.957.06.86
Spain27.98.41.67
Sweden28.926.80.78
United Kingdom22.421.50.69
European Union32.625.12.46
There were some notable differences between countries (Table 2). The average yield gap of pollination-dependent crops was about 29.8% (based on CAPRI) and 33.2% (based on Eurostat statistics). These average values assume a maximum pollination potential. The yield gap decreases to 2.3%, on average, if relative pollination potential was considered. Some countries exhibited quite high values of CPD, for instance Austria and Slovenia, evidencing their large shares of fruits in the total pollination-dependent crop production (63% in Austria and 87% in Slovenia based on Eurostat statistics). High shares of rape production, which is partially dependent on insect pollination, explain values for CPD > 25% in Estonia, Czech Republic and Denmark. For countries with a relatively large share of tomato production, e.g., Finland and The Netherlands, the results were biased by production in green houses which depend on managed pollination. Separate results for production under glass were not available. Three countries exhibited divergent results if CPD was compared between calculations based on Eurostat statistics and CAPRI model output. Ireland had a crop production deficit of 9% using Eurostat data while CAPRI based estimates delivered a yield gap of 29%. The opposite was noted for Spain and Portugal where Eurostat statistics yielded considerably higher values for CPD than the CAPRI outputs did. In Ireland, agricultural yield was mainly composed of cereals and non-dependent crops. Since 2000, Eurostat does not report any longer the production of Irish fruits and vegetables while the CAPRI model still contains these crops and provides downscaled yield estimates. Portugal has a lower share of pollination-dependent fruits in CAPRI outputs (25%) relative to Eurostat (46%), explaining the difference in CPD. In Spain, shares of pollination-dependent crops are similar between the two data sources but the more detailed assessment of CPD based on Eurostat statistics resulted in a higher value for CPD.

3.3. Regional Gap Analysis

As an example, we demonstrated for two regions how the map of relative pollination potential can be applied to assess at landscape scale gaps in the potential supply of pollination services. Both regions, the Midi-Pyrénées in the south of France and Veneto in the northeast of Italy, have significant agricultural activities where 27% and 41%, respectively, of the land is used for crop production. Figure 4 maps the pollination deficit for the two regions while Figure 5 maps the share of crops which is dependent on insect pollination.
In Veneto 80% of land is characterized by a medium to high or high pollination deficit, with 50% of this land concentrated in agricultural areas with intensive farming (1a, Figure 4a), where soya is one of the most dominant crop types dependent on insect pollination (1a, Figure 5a). In contrast, a medium to low gap is detected in the province of Verona (2a, Figure 4a), in the area of the Colli Euganei Regional park (3A, Figure 4a), and in the Treviso province (4a, Figure 4a). Agricultural activities in the area around Verona are dominated by cultivation of fruits, olives and soya (2a, Figure 5a).
In the Midi-Pyrénées, almost 40% of the land has a low pollination deficit; 42% has a medium to high gap while almost 20% has a high gap. The latter areas are, similarly as in the Veneto region, characterized by agricultural areas with an intensive farming practice where 15% of crops are dependent on insect pollination. In particular, these are soya and pulse in the department of Gers (1b, Figure 5b), rape and sunflowers in the department of Haute-Garonne (2b, Figure 5b), and sunflowers in the department of Tarn (3b, Figure 5b).
Figure 4. Pollination deficit for two regions in Europe. (a) Veneto northeast Italy; (b) Midi-Pyrénées, southern France). Color codes on the map correspond with areas of low, medium, medium to high and high gaps in the potential supply of pollination. Pie charts present the relative share of each gap for the entire region. See text for explanation of the codes on the maps.
Land 02 00472 g004
Figure 5. Crop share (%) dependent on insect pollination: (a) Veneto northeast Italy; (b) Midi-Pyrénées, southern France).
Land 02 00472 g005

4. Discussion

The general finding of our study was that mapping the supply of pollination services can be performed at the European scale based on the availability of habitats suitable for foraging and nesting of pollinator insects. Clearly, the maps presented in this paper are to be considered as the first tier approach to map pollination supply and demand. The approach would certainly benefit from further refinements.

4.1. Strengths and Applications

The mapping method based on the InVEST model [24] produced useful maps that help asses large-scale patterns of the availability of pollination services and its potential mismatches with the pollination demand of agricultural crops. Such information may be helpful in planning both EU and national policies related to both sustainable agriculture and maintenance of biodiversity. The maps can also be used to assess needs for practical mitigation measures to promote insect pollinators for example in national agri-environment schemes in much smaller local scales. When linked to land use change models and to agro-economic models such as CAPRI, dynamics and scenarios can be assessed.
A clear strength of our approach is the spatially-explicit link between land cover based pollination potential and crop yields which enables an assessment of the benefits that are derived from pollination services in Europe. Global assessments of the benefits of pollination for crop production [5,6,22] usually link crop production statistics to plant-specific dependency on insect pollination in order to calculate the production deficit, which corresponds to the loss of production in absence of animal pollination. Among the main crops that contribute to human food, some, such as most cereals, do not depend on insects for their pollination, while others can be highly or totally dependent on insect pollination, such as many fruits and vegetables [2]. Several statistics have been reported to express the contribution of pollination to crop production. The production of 84% of crop species cultivated in Europe depends directly on insect pollinators, especially bees [12]. And Klein et al. [2] found that 87 crops, that is 70% of the 124 main crops used directly for human consumption in the world, are dependent on pollinators. However, if production statistics are used, the contribution of pollination to agriculture decreases, mainly due to the large share of non-dependent crops in total yield. Gallai et al. [5] estimated that 9.5% of the economic value of global crop production can be attributed to insect pollination. They pointed out that the production value of a ton of the crop categories that do not depend on insect pollination—namely cereals, sugar crops, and roots and tubers—averaged €151 while that of those that are pollinator-dependent averaged €761 , or five times more, and these values were significantly different. Aizen et al. [22] calculated the production deficit in agricultural production in absence of animal pollination between 2% and 4% for the developed world. Another global study [6] assessed vulnerability of countries with respect to the decline of pollination services as the portion of national agricultural GDP, which depends on pollination of crops. This proportion was estimated at 9.4% using data for 2009.
The underlying assumption of these assessments is that the full pollination potential of agro-ecosystems and adjacent habitats, which support pollinator populations is realized. Our assessment goes one step further since we calculate production deficit in a spatially explicit manner, through the flight distance of bees. This is in part an explanation for the lower production deficit we obtained at EU scale. We estimated a yield gap of between 25% and 30% for pollination-dependent crops. However, the larger share of EU agricultural yield is composed of non-dependent crops such as root crops and cereals. Pollination-dependent crops represent only between 1% and 2% of the aggregate EU crop yield. So accounting for total crop yield reduces the yield gap to a value between 0.25% and 0.6%, assuming maximum relative pollination potential. Including relative pollination potential reduces again the yield gap to a value lower than 0.05%. In our model, the low potential of arable land distant from semi-natural ecosystems, riparian areas and forest edges, results in lower production deficit. Furthermore, we considered only one ecological guild, i.e., pollinators with a short flight distance. Adding species with a larger flight range such as bumblebees to the model of relative pollination potential will therefore increase the estimates we obtained for production deficit. We thus consider our values as conservative estimates of production deficit.
The RPP estimates the potential capacity of all landscapes to provide pollination. Accordingly, we can focus on spatially explicit gaps of service supply. It is, however, important to stress that pollination is a key service for crop production but that it sustains also natural vegetation. If needed, the work presented here can be used to assess how pollinators sustain for instance threatened plant species that depend on pollination.

4.2. Limitations

An essential limitation is that the map of European pollination potential is largely based on expert knowledge. The model is in essence built on the hypothesis that the visitation rate of crops by pollinators is a function of the distance to natural areas [23,41]. The basic assumption of the model is thus that natural areas and in particular edge habitats offer suitable nesting sites and floral resources. It therefore represents a first tier approach that needs to be validated further using statistics on population abundance of different pollinator species. However, poor data coverage of Europe with respect to field observations of pollinator species as well as problems related to the up scaling of field data to landscape level both remain important issues that limit the possibility for validation of the present model. Yet, we explored several options to test the performance of the relative pollination abundance indicator. We submitted an inventory of bee species diversity in different European habitats across different biogeographical regions [43] to the GBIF (Global Biodiversity Information Facility) database and extracted all occurrences. This yielded a dataset with about 336 thousand occurrences of 278 different bee species across Europe. However, European bee species occurrences in the GBIF database are heavily biased towards Great Britain with about 45% of the occurrences and Sweden with 25% of the occurrences. In particular, Mediterranean countries are poorly represented. Mapping species occurrence would enable us to better delineate the geographical distribution of key pollinator species, but presence data cannot be used to validate the abundance or population density of species. Some datasets on pollinator abundance are available but the comparison between the abundance of bee species in field samples and relative pollination abundance estimated for grid cells based on data with resolutions >100 m introduces more uncertainty. A proper validation of our model would require a tailored sampling program, which could not be done for the purpose of our study.
A second limitation to the model is the poor representation of valuable habitats in agricultural landscapes by land cover data. Though complemented with data from the JRC forest map at 25 m resolution, the model lacks information on presence of semi-natural vegetation and landscape elements at fine scale in agricultural land (i.e., hedges, ponds, ditches, etc.). Some agri-environmental measures such as flower strips and stream buffer zones may increase the presence of bees as well. Such shortcomings cause an underestimation of pollination potential in arable land.
Similar to our attempt to map pollination potential, the assessment of demand is a first approximation that needs further refinements. Our approach is conservative in the sense that we grouped crops into a few categories only (derived from the CAPRI model, see Table S2). For some countries, and in particular for Spain, the comparison with Eurostat statistics demonstrated that using CAPRI results in an under estimation of the crop production deficit.
Our model only considered land cover as predictor variable for relative pollination abundance. Several other important drivers of pollinator loss were not considered [44]. In particular, the application of insecticides is shown to be important reason for the decline of pollinators in Europe and elsewhere. Whereas recent reports provide strong evidence for the negative impacts of pesticide use on bee species [45,46], it remains challenging to combine the scarce data on pesticide application with species-specific dose response relationships for the purpose of modeling relative pollinator abundance [47].

5. Conclusions

New biodiversity policies increasingly acknowledge ecosystem services providing essential life supporting functions to our society. Ecosystems and the services they provide have now become part of the new post 2010 biodiversity strategies at global and European scales. To become effective as argument to the protection of biodiversity, actions at the EU scale will address the knowledge gap in ecosystem services assessments. These gaps are to a large extent an assessment of where and at what quantities ecosystem services are produced and what the flow of benefits to society is based on monetary valuation.
The result reported in this paper respond to several policy needs at EU level. The overarching Europe 2020 strategy aims at building smart, sustainable and inclusive growth for the European Union. It establishes resource efficiency as the guiding principle for other EU policies. For environmental policy, it requires demonstrating that natural ecosystems and the services they provide are good for economic growth as well as for the environment. For agricultural policy, it requires demonstrating that farmland biodiversity and ecosystems are key to sustain agricultural production.
However, better ecological observations of key pollinator species are needed to include important drivers of pollinator abundance in modeling and mapping approaches which were not included in the study, for instance the use of pesticides or the presence of pollinator supporting habitats in the landscape.

Acknowledgments

This project was part of the PRESS-2 study. The authors thank Benis Egoh, Lorenzo Marini and Andrea Battisti for providing crucial input during an expert meeting. The maps that are published in this paper will be made available to readers on their request. Please contact the corresponding author.

Conflicts of Interest

The authors declare no conflict of interest.

References

  1. Garibaldi, L.A.; Steffan-Dewenter, I.; Winfree, R.; Aizen, M.A.; Bommarco, R.; Cunningham, S.A.; Kremen, C.; Carvalheiro, L.G.; Harder, L.D.; Afik, O.; et al. Wild pollinators enhance fruit set of crops regardless of honey bee abundance. Science 2013, 340, 1608–1611. [Google Scholar]
  2. Klein, A.M.; Vaissière, B.E.; Cane, J.H.; Steffan-Dewenter, I.; Cunningham, S.A.; Kremen, C.; Tscharntke, T. Importance of pollinators in changing landscapes for world crops. Proc. R. Soc. B Biol. Sci. 2007, 274, 303–313. [Google Scholar] [CrossRef]
  3. Aizen, M.A.; Garibaldi, L.A.; Cunningham, S.A.; Klein, A.M. Long-term global trends in crop yield and production reveal no current pollination shortage but increasing pollinator dependency. Curr. Biol. 2008, 18, 1572–1575. [Google Scholar] [CrossRef]
  4. Pimentel, D.; Wilson, C.; McCullum, C.; Huang, R.; Dwen, P.; Flack, J.; Tran, Q.; Saltman, T.; Cliff, B. Economic and environmental benefits of biodiversity: The annual economic and environmental benefits of biodiversity in the United States total approximately $300 billion. BioScience 1997, 47, 747–757. [Google Scholar] [CrossRef]
  5. Gallai, N.; Salles, J.M.; Settele, J.; Vaissière, B.E. Economic valuation of the vulnerability of world agriculture confronted with pollinator decline. Ecol. Econ. 2009, 68, 810–821. [Google Scholar] [CrossRef] [Green Version]
  6. Lautenbach, S.; Seppelt, R.; Liebscher, J.; Dormann, C.F. Spatial and temporal trends of global pollination benefit. PLoS One 2012, 7, e35954. [Google Scholar]
  7. Kremen, C.; Ostfeld, R.S. A call to ecologists: Measuring, analyzing, and managing ecosystem services. Front. Ecol. Environ. 2005, 3, 540–548. [Google Scholar] [CrossRef]
  8. Bommarco, R.; Kleijn, D.; Potts, S.G. Ecological intensification: Harnessing ecosystem services for food security. Trend. Ecol. Evol. 2012, 28, 230–238. [Google Scholar] [CrossRef]
  9. Potts, S.G.; Biesmeijer, J.C.; Kremen, C.; Neumann, P.; Schweiger, O.; Kunin, W.E. Global pollinator declines: Trends, impacts and drivers. Trend. Ecol. Evol. 2010, 25, 345–353. [Google Scholar] [CrossRef]
  10. Biesmeijer, J.C.; Roberts, S.P.M.; Reemer, M.; Ohlemüller, R.; Edwards, M.; Peeters, T.; Schaffers, A.P.; Potts, S.G.; Kleukers, R.; Thomas, C.D.; et al. Parallel declines in pollinators and insect-pollinated plants in Britain and The Netherlands. Science 2006, 313, 351–354. [Google Scholar] [CrossRef]
  11. Winfree, R.; Aguilar, R.; Vázquez, D.P.; LeBuhn, G.; Aizen, M.A. A meta-analysis of bees’ responses to anthropogenic disturbance. Ecology 2009, 90, 2068–2076. [Google Scholar] [CrossRef]
  12. Williams, I.H. The dependence of crop production within the European Union on pollination by honey bees. Agric. Zool. Rev. 1994, 6, 229–257. [Google Scholar]
  13. Winfree, R.; Williams, N.M.; Dushoff, J.; Kremen, C. Native bees provide insurance against ongoing honey bee losses. Ecol. Lett. 2007, 10, 1105–1113. [Google Scholar] [CrossRef]
  14. Our Life Insurance, Our Natural Capital: An EU Biodiversity Strategy to 2020; European Commission: Brussels, Belgium, 2011.
  15. Maes, J.; Egoh, B.; Willemen, L.; Liquete, C.; Vihervaara, P.; Schägner, J.P.; Grizzetti, B.; Drakou, E.G.; Notte, A.L.; Zulian, G.; et al. Mapping ecosystem services for policy support and decision making in the European Union. Ecosyst. Serv. 2012, 1, 31–39. [Google Scholar] [CrossRef]
  16. Haines-Young, R.H.; Potschin, M.P. The Links between Biodiversity, Ecosystem Services and Human Well-Being. In Ecosystem Ecology: A New Synthesis; Raffaelli, D.G., Frid, C.L.J., Eds.; Cambridge University Press: Cambridge, UK, 2010; p. 162. [Google Scholar]
  17. Kells, A.R.; Goulson, D. Preferred nesting sites of bumblebee queens (hymenoptera: Apidae) in agroecosystems in the UK. Biol. Conserv. 2003, 109, 165–174. [Google Scholar] [CrossRef]
  18. Svensson, B.; Lagerlöf, J.; Svensson, B.G. Habitat preferences of nest-seeking bumble bees (hymenoptera: Apidae) in an agricultural landscape. Agric. Ecosyst. Environ. 2000, 77, 247–255. [Google Scholar] [CrossRef]
  19. Westphal, C.; Steffan-Dewenter, I.; Tscharntke, T. Mass flowering crops enhance pollinator densities at a landscape scale. Ecol. Lett. 2003, 6, 961–965. [Google Scholar] [CrossRef]
  20. Carvalheiro, L.G.; Veldtman, R.; Shenkute, A.G.; Tesfay, G.B.; Pirk, C.W.W.; Donaldson, J.S.; Nicolson, S.W. Natural and within-farmland biodiversity enhances crop productivity. Ecol. Lett. 2011, 14, 251–259. [Google Scholar] [CrossRef]
  21. Aizen, M.A.; Feinsinger, P. Forest fragmentation, pollination, and plant reproduction in a chaco dry forest, Argentina. Ecology 1994, 75, 330–351. [Google Scholar] [CrossRef]
  22. Aizen, M.A.; Garibaldi, L.A.; Cunningham, S.A.; Klein, A.M. How much does agriculture depend on pollinators? Lessons from long-term trends in crop production. Ann. Bot. 2009, 103, 1579–1588. [Google Scholar] [CrossRef]
  23. Garibaldi, L.A.; Steffan-Dewenter, I.; Kremen, C.; Morales, J.M.; Bommarco, R.; Cunningham, S.A.; Carvalheiro, L.G.; Chacoff, N.P.; Dudenhöffer, J.H.; Greenleaf, S.S.; et al. Stability of pollination services decreases with isolation from natural areas despite honey bee visits. Ecol. Lett. 2011, 14, 1062–1072. [Google Scholar] [CrossRef]
  24. Lonsdorf, E.; Kremen, C.; Ricketts, T.; Winfree, R.; Williams, N.; Greenleaf, S. Modelling pollination services across agricultural landscapes. Ann. Bot. 2009, 103, 1589–1600. [Google Scholar] [CrossRef]
  25. Kareiva, P.; Tallis, H.; Ricketts, T.H.; Daily, G.C.; Polasky, S. Natural Capital—Theory and Practice of Mapping Ecosystem Services; Oxford University Press: New York, NY, USA, 2011. [Google Scholar]
  26. Britz, W.; Witzke, H.P. Capri Model Documentation 2008: Version 2; Institute for Food and Resource Economics, University of Bonn: Bonn, Germany, 2008. Available online: http://www.capri-model.org/dokuwiki/doku.php/ (accessed on 22 August 2013).
  27. Corbet, S.A. Temperature and the pollinating activity of social bees. Ecol. Entomol. 1993, 18, 17–30. [Google Scholar] [CrossRef]
  28. Weissteiner, C.J.; Strobl, P.; Sommer, S. Assessment of status and trends of olive farming intensity in EU-mediterranean countries using remote sensing time series and land cover data. Ecol. Indic. 2011, 11, 601–610. [Google Scholar] [CrossRef]
  29. Paracchini, M.L.; Petersen, J.E.; Hoogeveen, Y.; Bamps, C.; Burfield, I.; van Swaay, C. High Nature Value Farmland in Europe. An Estimate of the Distribution Patterns on the Basis of Land Cover and Biodiversity Data; Publications Office of the European Union: Luxembourg, 2008. [Google Scholar]
  30. Clerici, N.; Weissteiner, C.J.; Paracchini, M.L.; Boschetti, L.; Baraldi, A.; Strobl, P. Pan-European distribution modelling of stream riparian zones based on multi-source earth observation data. Ecol. Indic. 2013, 24, 211–223. [Google Scholar] [CrossRef]
  31. Kempeneers, P.; Sedano, F.; Seebach, L.; Strobl, P.; San-Miguel-Ayanz, J. Data fusion of different spatial resolution remote sensing images applied to forest-type mapping. IEEE Trans. Geosci. Remote Sens. 2011, 49, 4977–4986. [Google Scholar] [CrossRef]
  32. Baruth, B.; Genovese, G.; Leo, O. Cgms Version 9.2 User Manual and Technical Documentation; Publications Office of the European Union: Luxembourg, 2007. [Google Scholar]
  33. Ricketts, T.H.; Daily, G.C.; Ehrlich, P.R.; Michener, C.D. Economic value of tropical forest to coffee production. Proc. Natl. Acad. Sci. USA 2004, 101, 12579–12582. [Google Scholar]
  34. Andersson, G.K.S.; Rundlöf, M.; Smith, H.G. Organic farming improves pollination success in strawberries. PLoS One 2012, 7, e31599. [Google Scholar] [CrossRef]
  35. Holzschuh, A.; Steffan-Dewenter, I.; Tscharntke, T. Agricultural landscapes with organic crops support higher pollinator diversity. Oikos 2008, 117, 354–361. [Google Scholar] [CrossRef]
  36. Holzschuh, A.; Dudenhöffer, J.H.; Tscharntke, T. Landscapes with wild bee habitats enhance pollination, fruit set and yield of sweet cherry. Biol. Conserv. 2012, 153, 101–107. [Google Scholar] [CrossRef]
  37. Winfree, R.; Williams, N.M.; Gaines, H.; Ascher, J.S.; Kremen, C. Wild bee pollinators provide the majority of crop visitation across land-use gradients in New Jersey and Pennsylvania, USA. J. Appl. Ecol. 2008, 45, 793–802. [Google Scholar]
  38. Hopwood, J.L. The contribution of roadside grassland restorations to native bee conservation. Biol. Conserv. 2008, 141, 2632–2640. [Google Scholar] [CrossRef]
  39. Henriksen, C.I.; Langer, V. Road verges and winter wheat fields as resources for wild bees in agricultural landscapes. Agric. Ecosyst. Environ. 2013, 173, 66–71. [Google Scholar] [CrossRef]
  40. Gathmann, A.; Tscharntke, T. Foraging ranges of solitary bees. J. Anim. Ecol. 2002, 71, 757–764. [Google Scholar] [CrossRef]
  41. Ricketts, T.H.; Regetz, J.; Steffan-Dewenter, I.; Cunningham, S.A.; Kremen, C.; Bogdanski, A.; Gemmill-Herren, B.; Greenleaf, S.S.; Klein, A.M.; Mayfield, M.M.; et al. Landscape effects on crop pollination services: Are there general patterns? Ecol. Lett. 2008, 11, 499–515. [Google Scholar] [CrossRef]
  42. Zurbuchen, A.; Landert, L.; Klaiber, J.; Müller, A.; Hein, S.; Dorn, S. Maximum foraging ranges in solitary bees: Only few individuals have the capability to cover long foraging distances. Biol. Conserv. 2010, 143, 669–676. [Google Scholar] [CrossRef]
  43. Westphal, C.; Bommarco, R.; Carré, G.; Lamborn, E.; Morison, N.; Petanidou, T.; Potts, S.G.; Roberts, S.P.M.; Szentgyörgyi, H.; Tscheulin, T.; et al. Measuring bee diversity in different european habitats and biogeographical regions. Ecol. Monogr. 2008, 78, 653–671. [Google Scholar] [CrossRef]
  44. Kennedy, C.M.; Lonsdorf, E.; Neel, M.C.; Williams, N.M.; Ricketts, T.H.; Winfree, R.; Bommarco, R.; Brittain, C.; Burley, A.L.; Cariveau, D.; et al. A global quantitative synthesis of local and landscape effects on wild bee pollinators in agroecosystems. Ecol. Lett. 2013, 16, 584–599. [Google Scholar] [CrossRef]
  45. Henry, M.; Béguin, M.; Requier, F.; Rollin, O.; Odoux, J.-F.; Aupinel, P.; Aptel, J.; Tchamitchian, S.; Decourtye, A. A common pesticide decreases foraging success and survival in honey bees. Science 2012, 336, 348–350. [Google Scholar] [CrossRef]
  46. Whitehorn, P.R.; O’Connor, S.; Wackers, F.L.; Goulson, D. Neonicotinoid pesticide reduces bumble bee colony growth and queen production. Science 2012, 336, 351–352. [Google Scholar] [CrossRef]
  47. Maes, J.; Hauck, J.; Paracchini, M.L.; Ratamäki, O.; Hutchins, M.; Termansen, M.; Furman, E.; Pérez-Soba, M.; Braat, L.; Bidoglio, G. Mainstreaming ecosystem services into EU policy. Curr. Opin. Environ. Sustain. 2013, 5, 128–134. [Google Scholar] [CrossRef]

