

Incorporating High-Speed Rail Development Scenario for Tourism Land Use Simulation: A Case Study of Xinxing County, China


1
School of Geography and Remote Sensing, Guangzhou University, Guangzhou 510006, China
2
School of Architecture and Urban Planning, Guangzhou University, Guangzhou 510006, China
3
Department of Geography, University of Cincinnati, Cincinnati, OH 45221-0131, USA
*
Authors to whom correspondence should be addressed.
Land 2023, 12(6), 1170; https://doi.org/10.3390/land12061170
Submission received: 3 May 2023
/
Revised: 25 May 2023
/
Accepted: 30 May 2023
/
Published: 1 June 2023
(This article belongs to the Special Issue Sustainable Evaluation Methodology of Urban and Regional Planning)
Abstract
:High-speed rail (HSR) has been proven to drive the development of regional tourism. However, few studies paid attention to the impact of HSR on future tourism land use. In this study, points of interest (POI) were used to obtain the locations and types of tourism facilities, and high-resolution remote sensing images helped us determine the spatial extents of the tourism facilities, so that tourism land could be identified. A system dynamics (SD) model was coupled with the patch-generating land use simulation (PLUS) model to simulate future tourism land by considering two scenarios, including HSR-led development (HRD) and the historical development pattern (HD) scenario. The SD model was employed to project the amount of tourism land and determine the HSR effects via empirical analysis. The PLUS model was applied to simulate the spatial distribution of tourism land and model the HSR effect by adopting a planned tourism area as the development area. The study area is Xinxing County in Guangdong Province, China, a county dominated by rural tourism, with the HSR expected to open in 2025. The results revealed that the SD-PLUS model has great advantages in simulating tourism land use change, and the HRD scenario leads to major changes in the sources of tourism land growth. This research provides new insights for policymakers on making countermeasures for the sustainability of tourism and rural revitalization at the county level.
1. Introduction
Over the past few years, the tourism sector has emerged as a significant driving force of socioeconomic development [1]. Rural tourism can increase employment opportunities and create business vitality, which offers an opportunity to achieve urban-rural integration and revitalize rural areas [2,3,4]. To address the decline of rural areas, the Chinese government has recently proposed a series of rural revitalization policies [5,6,7]. The Chinese urbanization rate exceeded 60% in 2019, which means that rural-urban relations have entered a new stage. The integrated urban-rural development strategy with the county as the basic unit has also been proposed by the Chinese government [8]. Therefore, studies of tourism development at the county level become academic, which can give guidance for boosting the long-term growth of rural tourism and the integration of urban and rural China.
The rapid growth of tourism has resulted in significant changes in land use, which further leads to profound effects on ecosystems [9,10,11]. The advancements in Remote Sensing (RS) and Geographic Information Systems (GIS) have provided powerful tools to reveal the spatio-temporal characteristics of land use changes in tourism regions. Some indicators related to land use changes have been used to evaluate the spatio-temporal impacts of tourism development on land development [12,13]. Additionally, some studies focused on the driving mechanisms of tourism-induced land use changes to provide countermeasures [2,7,14]. However, these studies were based on historical changes to explore the impact mechanisms of tourism development on land use change, which makes it difficult to provide countermeasures for future policies [15,16,17].
Land use simulation is not only an effective approach to understanding how tourism will affect future land use changes but also to providing implications for sustainable tourism development [18]. The Cellular Automata (CA) model is a popular method for simulating land use changes [19,20,21]. Some studies have analyzed the impact of tourism development on land use change and simulated land use changes caused by tourism development using the CA model [22,23]. Although these studies have improved our views of land use changes driven by tourism activities, they cannot differentiate tourism land from other land use due to a coarse land use classification method. This renders it impossible for them to simulate the spatial variations of tourism land as a separate land type.
Previous studies have proven that the opening of the HSR could indeed expand coverage to tourism destinations and stimulate the growth of local tourism in China [24,25,26,27]. Several studies have been carried out to investigate the influence of HSR on land use patterns, urbanization, and rising land prices [28,29,30]. However, few studies have examined the impact of HSR on tourism land use changes, limiting the ability to propose targeted planning for future tourism growth.
This study proposes a framework to incorporate the opening of HSR in tourism land development simulation. In this framework, the top-down system dynamics (SD) model was coupled with the patch-generating land use simulation (PLUS) model to simulate the spatial changes of future tourism land. The SD model has been widely used to project land use demand in multiple scenarios since it is advantageous in predicting the non-linear interactions between various elements in a complex system [31]. In this study, the SD model incorporating the economy, population, agricultural production, and tourism industry sectors was established to project the amount of tourism land and determine the HSR effects via empirical analysis. The PLUS model, which has been demonstrated to have advantages in modeling land use changes by considering planning rules at the patch level [32], was applied to model HSR-led tourism land use expansion.
The proposed framework was implemented in Xinxing County, a typical tourist county in Guangdong Province, China, where rural tourism is dominant. The tourism land was identified using high-resolution remote sensing images and POI data. POI related to the tourism industry were used to determine the location of tourism facilities, and then high-resolution remote sensing images were applied to map the spatial extent of the tourism facilities. We designed two scenarios to clarify the effect of HSR on tourism land: the HSR-led development scenario (HRD) as an experimental target and a historical development scenario (HD) as the control for comparative analysis. The integrated models were employed to model tourism land use changes in two phases: from 2015 to 2020 for validating the model and from 2020 to 2035 for simulating tourism land use changes influenced by HSR opening.
The remainder of the article is divided into the following sections: Section 2 summarizes the existing related literature, and Section 3 presents the framework and introduces the SD model and PLUS model. The study area and the datasets are described in Section 4. The findings and discussion are shown in Section 5. Section 6 provides the conclusions.
2. Literature Review
2.1. Land Use Change with Tourism Industry
The exploration of the interactions between land use patterns and the tourism industry can have policy implications for sustainable tourism development [33,34]. Previous studies can be summarized as efforts in two main aspects. The first aspect primarily aims to comprehend the spatio-temporal changes in land use in the context of tourism development and the driving mechanisms triggered by tourism. For example, Wang and Liu (2013) investigated land use changes driven by tourism on Hainan Island from 1991 to 2007, which revealed that cropland is most significantly affected by tourism activities [35]. Marzuki et al. (2016) employed landscape indexes to measure the influence of coastal tourism activities on land use changes [36]. Ma et al. (2020) studied the pattern of spatially complex morphological changes in tourism resorts using two tourist locations that represent the mountain resort type, and the seaside resort type respectively [37]. Furgala-Selezniow et al. (2021) employed interpretable machine learning models to investigate the impact of tourism development on the lakeshore zone in a typical post-glacial lakeland in Northern Poland [38].
The second aspect involves simulating the impact of tourism development on future land use. Petrov et al. (2009) conducted a study using the MOLAND model to simulate future urban land use changes under multiple scenarios, using the Algarve region in Portugal as a case study. The aim was to analyze the impact of the tourism industry on future land use changes [39]. Mao et al. (2014) used an SD-CA model to simulate potential future land use changes influenced by tourism in the Lijiang River Basin in China [16]. The results revealed that the land use landscape of the study area was spatially disturbed by tourism activities. Boavida-Portugal et al. (2016) simulated land use patterns influenced by tourism development in Portugal’s coastal regions using a CA model and Markov chain transition probabilities [23]. However, these studies are macro-scale qualitative studies, which make it difficult to explain the spatial effects of tourism.
2.2. Land Use Pattern with HSR Opening
HSR is an important transportation infrastructure to improve the city’s connectivity to the outside community [40]. HSR plays a significant role in driving transformative shifts in urban land use, surpassing the impact of other transportation infrastructure [41]. Some empirical studies have indicated that overall HSR positively impacts urban land use intensity, but there is spatial heterogeneity in the impact on land use simulation [29,30]. In addition, some studies have also focused on the impact of HSR station location choice on influencing urban land use [42,43]. The results of these studies are empirical and hardly support future planning at the fine scale.
Further, modeling the impact of HSR on future urban land use patterns has become a concern for scholars. For instance, Basse (2013) used a constrained cellular automata model to simulate the future land use changes in the trans-border region of France, Monaco, and Italy (Côte d’Azur-Riviera) affected by HSR [44]. Shen et al. (2014) employed a cellular automata-based model to analyze three scenarios with different assumptions regarding the locations of HSR stations [45]. The study aimed to simulate the potential land use impacts of future HSR services on Aveiro, Portugal, and its neighboring cities. Liang et al. (2018) utilized a cellular automata (CA) model that incorporated the effects of transportation planning update mechanisms to simulate the impact of high-speed rail planning on urban land use. These studies are focused on the regional scale, and county-scale simulations need to be further clarified [46].
2.3. Tourism Land Use Simulation
The concept of tourism land has yet to be clearly and uniformly defined [47]. Previous studies have typically calibrated land types associated with the tourism industry as tourism land, which encompasses accommodations, catering, recreation, sightseeing, and other related functions [48]. A critical technique for managing tourism and promoting its sustainable development is to separate the land types associated with tourism and simulate their future evolution.
With the availability of high-resolution remote sensing datasets and the rise of big data related to the tourism industry [49,50], two recent works by Liu et al. (2018) and Shi et al. (2020) aimed to identify the tourism land use and simulate the spatio-temporal changes [47,48]. In Liu et al. (2018)’s study, the tourism land use dataset was obtained by remote sensing images and field calibration for modeling future spatial patterns, and the determining factors for the spatial pattern of tourism land were also explored in the scenic areas [48]. Field investigation was limited to scenic areas due to the high cost and time required. Further, Shi et al. (2020) used POI data to obtain information on tourism-related service facilities and combined them with remote sensing images to obtain the tourism land in Emeishan City, a typical mountain tourism city in China [47]. This methodology, integrating POI data and remote sensing images, allows for efficient and comprehensive identification of tourism land, facilitating the analysis and modeling of tourism land at the regional scale.
Although the above studies filled the gap in modeling tourism land use in the future, there remains a limitation in the following aspect: First, these studies applied Markov chains to project future land use demand in the historical inertia of development, making it challenging to model the demand for tourism land affected by planning and policy scenarios such as the opening of the HSR. Second, the studies failed to simulate the tourism land under the policy scenario and were affected by spatial effects. To address these gaps, this study employs an SD model to simulate the demand for tourism land against the background of HSR development. Additionally, the PLUS model is utilized to incorporate the planned tourism areas and simulate the spatial effects induced by the HSR policy.
3. Methods
3.1. Study Framework
We proposed a framework: first, tourism land was identified using POIs and high-resolution remote sensing images, then we simulated future tourism land use changes by incorporating the top-down SD model with the bottom-up PLUS model (Figure 1). The demand for tourism land in two scenarios is estimated by linking the economy, population, agricultural production, and tourism industry sectors using the SD model. The PLUS model was applied to simulate the spatial pattern of tourism land use changes. To reveal the influence of HSR on tourism land changes, we set up two land use development scenarios, including the historical development scenario (HD) in the existing development policy inertia as a control and the HSR-led development scenario (HRD) as an experiment. The living area of transit-oriented development (TOD) was planned as an area of accommodation for tourists brought by HSR; thus, we adopted it as the priority development area to simulate spatial patterns of tourism land use changes influenced by HSR (see Section 4.1 for detailed descriptions).
3.2. SD Model for Land Use Demand Projection
The SD model is a powerful approach for simulating the intricate nonlinear relationships among various components of a complex system [31,51]. By integrating feedback and interactions between various aspects, it has been utilized to project land use demands under different scenarios. Land use change is a complex system that is related to the economy, population, agricultural production, and tourism industry sectors. In this segment, the SD model to predict the amounts of each land use type was divided into four sectors (Figure 2). The structure of the inventory and flow diagram was built based on the links between the sections, and the system variables were established by the initial variables and change rates of the parts. The model was divided into four sections, which are the economy, population, agricultural production, and tourism industry sectors. Since previous studies have not elucidated the linkages between tourism land and tourism-related elements, we treat the tourism land sector as a separate subsystem. Based on analyzing the relationship between sections and variables, the model of land use demand was established using Vensim PLE x32. Changes in each land use type are governed by a combination of socioeconomic conditions as well as interactions between the various land use types [51]. For example, tourism land use is influenced by the GDP of the restaurant and transportation industries, which directly affect changes in urban land use and rural settlements. The variables and stocks of the model were determined, and then the causal feedback loop structure was constructed. We collected the datasets of specific parameters from historical statistics yearbook data to build the model. The unit of measurement used in the economic sector and the tourism land sector is the Chinese yuan. The specific parameters of both scenarios are shown in Table 1. The GDP growth rate (GGR), urban population growth rate (UPR), rural population growth rate (RPGR), food growth rate (FGR), the GDP of accommodation and catering growth rate (GACGR), the GDP of transportation growth rate (GTGR), and the proportion of construction land investment (PCLI), the proportion of agriculture, forestry, and fishery investment (PAFFI) were selected as the variables. These parameters were obtained from the statistical yearbook of the study area from 2015 to 2020 in the HD scenario. The changes in parameters after the opening of HSR were obtained by calculating the changes in three counties with the same level of development as Xinxing in the HRD scenario.
3.2.1. Economy Sector
The economic development of a region as reflected by GDP influences fixed asset investment, the amount of population, and food production, which also affects tourism development. The annual average growth rate of GDP was calculated according to the historical statistical yearbook from 2014 to 2019, which was used as the economic growth rate in the historical scenario. Fixed asset investment, investment in agriculture, forestry, and fisheries, and investment in construction land were determined according to the change in GGR. Changes in these elements affect variables and stocks in other sectors, which has an impact on the number of different types of land use. The increase in GGR leads to an increase in fixed asset investment, which inevitably leads to an increase in the amount of urban land, industrial land, cropland, grassland, and woodland as a result of the increase in production factors in urban, agricultural, and industrial areas. It promotes population growth and the shift from the rural population to the urban population, thus increasing the demand for housing and the amount of urban land, as well as the amount of cropland due to the increased demand for food.
3.2.2. Population Sector
Population growth can drive economic and tourism development and provide labor for employment. In terms of population, we have divided it into urban and rural populations as state variables due to the varying requirements of other sectors. Both state variables are supplemented with GDP, population growth rate, and housing area per capita as auxiliary variables to explore the changes in population size. The growth of urban populations demands more residential properties, leading to an expansion of urban land. On the other hand, rural population growth results in the establishment of more rural settlements, requiring an increase in food production to meet their needs. The overall population growth leads to an increase in demand for food, which in turn increases the demand for cropland.
3.2.3. Agricultural Production Sector
The economy and population growth require more product supply, which is usually provided by the agricultural production sector. The agricultural sector is an essential component of economic development. Investment in agricultural productivity is crucial for the growth of this sector, as it directly impacts agricultural production. In this subsystem, we considered the amount of cropland, woodland, grassland, and water land as state variables, while population growth and investment in agriculture, forestry, livestock, and fishing were considered auxiliary variables. Any changes in these auxiliary variables would directly impact the stock of land use, leading to changes in the amount of land use.
3.2.4. Tourism Industry Sector
The GDP of the accommodation and restaurant industry and the GDP of the transportation industry are two parts of the economy sector, but both are closely related to the tourism industry. Hence, we selected these two variables in the tourism industry sector and performed a multiple linear regression analysis with the amount of tourism land. We obtained the annual values and annual growth rates of these two indicators from the statistical yearbook of Xinxing from 2014 to 2019. The annual average growth rate of the previously mentioned indicators was calculated as the growth rate of HD. In the case of HRD, three counties with HSR services at a similar level of development as Xinxing were selected as references for parameter setting. The mean annual growth rates of the selected variables were calculated separately for the five years before the opening of the HSR and the three years after the opening of the HSR. We compared the differences between the two results to determine the impact of HSR on the chosen index. The conclusions showed that the growth rate of the two indicators after the opening of HSR was 1.2 times and 1.22 times that before the opening of HSR, respectively. Thus, the growth rate under the HSR can be calculated according to the historical situation.
3.3. PLUS for Land Use Changes Simulation
In current CA studies, two major strategies may be summarized from the methods included to identify the causes of land use: transition analysis strategy (TAS) and pattern analysis strategy (PAS). The PLUS model employs a novel data mining framework that contains the benefits and addresses the drawbacks of both strategies. Therefore, a land expansion analysis strategy (LEAS) with a CA model based on multitype random patch seeds (CARS) was incorporated into the PLUS model to simulate the multiple land use changes. Due to its benefits in the following two areas, this model is advantageous in tourism land use simulation at the patch level [32,52]. First, the PLUS model could capture the expansion of the tourism land use data over two time periods. In the LEAS module, the random forest algorithm is employed to calculate the development probability of tourism land use as well as the contribution of factors to tourism land development during that time. Second, PLUS combines stochastic seed generation and threshold-decreasing mechanisms to model the changes in tourism land under the threshold of development probability. Additionally, a stochastic seed mechanism within the planned development zone is integrated with the PLUS model, allowing the role of the HSR-planned TOD zone on tourism land to be considered in the simulation process.
4. Study Area and Datasets
4.1. Study Area
Xinxing County (111°57′–112°31′ E, 22°22′–22°50′ N) is located in the west of Guangdong Province, southern China (Figure 3). It covers an area of approximately 1521.68 km2, and most of the land is mountainous and hilly. Although Xinxing County has the advantage of being adjacent to the Pearl River Delta area, one of the most developed regions in China, there is still a considerable gap in economic development compared with the Pearl River Delta area. The county is rich in tourism resources, with more than 10 tourist scenic spots that are famous for Buddhist culture and hot springs, mainly located in rural areas. This provides the county great potential for rural tourism development. Additionally, the HSR station under construction in the county will open in 2025. It will improve the connection between Xinxing County and other regions in Guangdong Province, which may offer opportunities for rural tourism development and revitalization. TOD is a public transportation-oriented development pattern that is gradually being extended to HSR in China. To maximize the effect of HSR on tourism, the Xinxing government has proposed TOD planning surrounding the HSR station, including performing arts areas, living areas, production exhibition areas, service areas, and ecological agricultural experience areas. As the living area of TOD is an area that provides accommodation and catering for tourists, it is considered a development area for tourism land. Therefore, Xinxing is a good case study area to investigate the demand and spatial pattern of future tourism land use changes driven by HSR planning in tourism counties, which aims to propose targeted policies for rural tourism development and contribute to rural revitalization.
4.2. Datasets
In this study, POIs and remote sensing datasets were combined to obtain tourism land use data. We used the API interface of Baidu Map to obtain POIs of catering service facilities, hotel service facilities, amusement parks, farmhouses, and hot spring resorts. POI data were displayed in Google Earth Pro, then visually interpreted with remote sensing images to capture the vector data of tourism land in 2020. Since we lacked POI data in 2015, we assessed the tourism land data of 2015 by combining the 2020 tourism land data with historical image data from 2015. We judged it as tourism land because it was construction land in 2015; otherwise, it is recognized as other land use. The historical land use datasets were from the Institute of Geographic Sciences and Natural Resources Research, Chinese Academy of Sciences, and were divided into cropland, woodland, grassland, water, urban land, rural settlement, and industrial land. The living area of TOD as the development area was from the Xinxing government. Historical land use datasets and tourism land use data were merged and converted to realize land use data, including tourism land use. The statistical data was from the local government’s statistical yearbooks. The nighttime light data was from the Earth Observation Group (EOG), and this paper adopted the monthly cloud-free DNB composite. There were 12 factors considered for the driving forces of spatial changes in land use (Figure 4), including transportation factors, location factors, human activity factors, and terrain factors [32,53] (Table 2). The TUD dataset was from Tencent Location Service Platform, which can precisely represent spatio-temporal human activities, and the mapping method referred to Huang’s (2021) study [54].
5. Results and Discussion
5.1. Model Validation
In this study, the model validation was divided into two parts: the validation of the predicted demand in the SD model and the validation of the spatial simulation in PLUS. It was applied to the period from 2015 to 2020, and the simulations for future scenarios to the period from 2020 to 2035. We employed the quantity of land used in 2015 as the setpoint and the SD model to project the demand for each kind of land use in 2020. The projected demand for land use in 2020 was compared with actual quantities to validate the SD model’s accuracy. As shown by Table 3, the accuracy of the SD model is trustworthy for predicting the demand for tourism land, as evidenced by the relative error of 2.44% between the simulated and real amounts of tourism land. As for simulation validation, the land use spatial distribution in 2020 was modeled based on that in 2015. The kappa coefficient and overall accuracy had been utilized to explain the accuracy of land use simulation, and user accuracy was employed to estimate the simulation performance of tourism land use. The overall accuracy was 94%, and the Kappa coefficient was 0.88. Additionally, the tourism land’s user accuracy is 0.93. These results suggest that the PLUS model is advantageous for simulating tourism land use with other land use types at the county level.
5.2. Future Tourism Land Use Changes Considering the Opening of HSR
5.2.1. Demand Projection and Spatial Simulation of Tourism Land
The validated SD model was then applied to simulate the future tourism land use growth in 2035 based on the tourism land use pattern in 2020. The projected land use demand and changes in both scenarios in 2035 are shown in Table 4. The projected demand for tourism land was 4.431 km2 and 5.369 km2 in HD and HSR scenarios, respectively. It showed that the projected demand for tourism land impacted by HSR is 21.12% higher than that of the HD scenario. As shown in Figure 5, starting in 2025, the impact of HSR development becomes evident, leading to a growing disparity in the quantity of tourism land between the HRD scenario and the HD scenario without HSR influence. Further, the projected demand for tourism land and other land use types was put into the PLUS model to obtain the simulation results of spatial distribution in 2035 based on the land use in 2020 (Figure 6). The tourism land was mainly distributed in the county center area and nearby the HSR station and scenic spots in the HSR scenario.
5.2.2. Spatial Distribution of Tourism Land Use Changes
Four sub-regions, including the county center area, scenic spots of Buddhism, hot springs, and farmhouses, were chosen to explore the role of HSR in the spatial changes of tourism land (Figure 7). The county center area and the development area surrounding the HSR station revealed significant growth in tourism land in 2035 as compared to tourism land in 2020 and the simulation result of the HSR scenario (Figure 7(a1,a3,b1,b3)). In the county center area, tourism land was scattered in the HRD scenario but highly concentrated in the HD scenario (Figure 7(a2,a3)). This is probably because the TOD is planned to be located at the HSR station, and the opening of the HSR affects the surrounding area, resulting in a strong driving effect on the surrounding tourism land. The county center area is not the primary choice for tourists for accommodation and catering. Additionally, the development area was located in Liuzu town, where the tourism resources are mainly attributed to Buddhism. The mixture of tourism resources and the HSR station carries great power over tourism land development in the HRD scenario. This area was most significantly affected by HSR opening, with tourism land experiencing explosive growth (Figure 7(b2,b3)).
In both future scenarios, the tourism land expanded significantly around the roads, especially the road intersections (Figure 7(c2,c3)), mainly located in Dongcheng town, Shuitai town, and Niancun town with rich tourism resources (Figure 7). In the HD scenario, tourism land around the provincial roads increased noticeably, while there were few changes in tourism land around the county roads. However, tourism land has grown considerably around provincial and county roads in the HRD scenario. This phenomenon illustrates that transportation is more critical to the development of tourism land in the HRD scenario. Therefore, connectivity has a significant impact on the development of rural tourism led by HSR, and priority needs to be given to constructing and maintaining roads in rural areas.
5.2.3. Source of Tourism Land Use Transfer
The source of tourism land expansion was computed from 2020 to future scenarios in 2035 (Figure 8). In the HRD scenario, woodland was the main source of tourism land expansion, accounting for almost 56.8% of the total amount of tourism land inflow in 2035. The following sources of tourism land expansion were rural settlement (25.4%), cropland (9.7%), and urban land (7.2%), respectively. Whereas cropland (64.2%) was the main source of tourism land in the HD scenario, urban land (20.9%) and woodland (13.6%) were the important sources of tourism land in 2035. This indicates that the opening of HSR will cause the sources of tourism land expansion to be different, and the effect is mainly on the woodland, not the cropland, in the study area. Since the tourism resources of the study area are in rural areas, the purpose of HSR planning is to stimulate rural tourism development. The station of HSR and the planning of TOD were set in rural areas, surrounded by woodland, rural settlements, and cropland. Especially the living area of TOD as a development area is a considerable area of woodland in 2020, which shifts to tourism land in 2035. Thus, it leads to the result that tourism land in the HRD scenario occupies the above-mentioned land use types, and the main source is woodland.
In the HD scenario, cropland was the major source of tourism land growth, which is similar to a previous study in the Li River basin in Guilin, China, which showed that changes in land use in tourism regions mainly put pressure on cropland [16]. Similarly, the recent case of Hainan Island, a tourist island in China, indicated that cropland is the type of land use most significantly affected by the tourism industry [55]. However, the main pressure from tourism land was shifted to woodland in the HRD scenario due to the features of rural tourism land and the development area of the location. Moreover, it is somewhat different from other studies where Shi’s study’s tourism land is mainly located in urban areas and the development of tourism land is achieved by encroaching on urban land, as in the case of mountain vacations [47]. Thus, the planning for tourism development and the situation of local tourism should be highlighted in the simulation of tourism land affected by policies.
5.3. Driving Force Analysis and Policy Implications
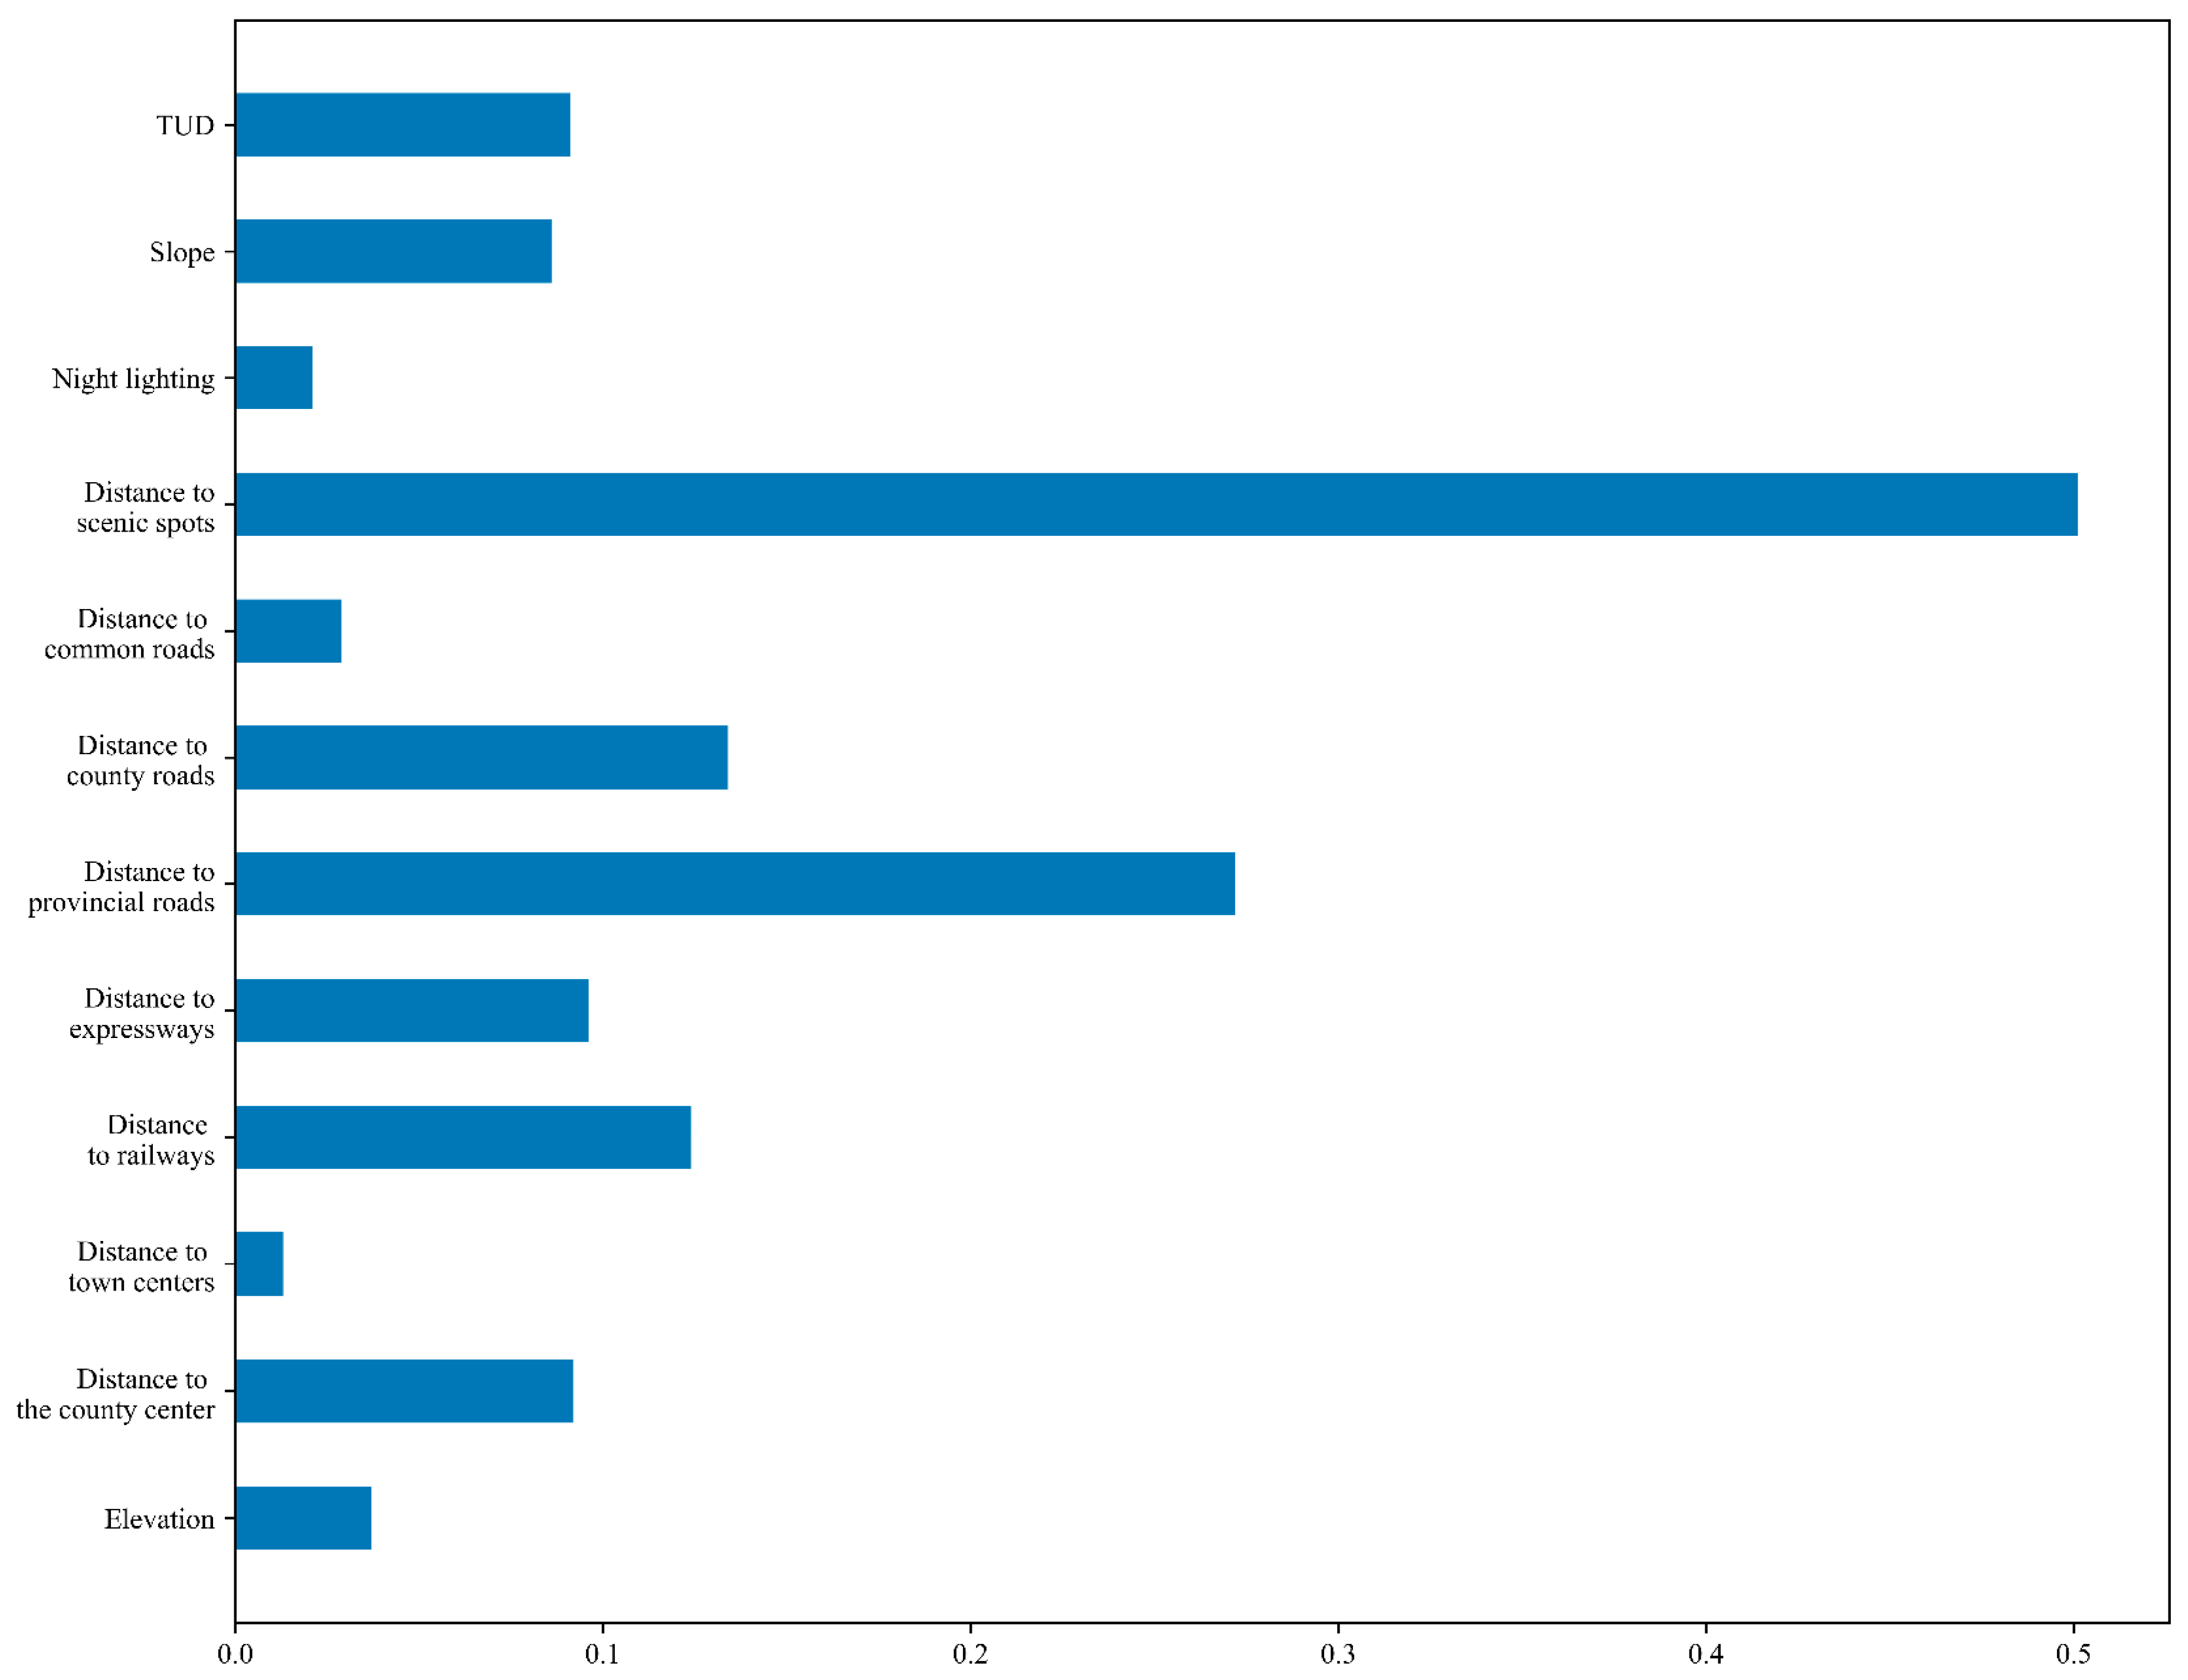
Future tourism planning may benefit from analyzing the factors that influence how land changes due to tourism. It is common to combine the driving mechanisms of tourism land development to inform policy development [38]. The contribution of driving factors to tourism land use changes was quantitatively accessed based on expansion in historical land use and driving forces by using the LEAS module in the PLUS model. As shown in Figure 9, the distance to scenic spots is the primary factor affecting the tourism land changes, followed by the transportation factors, including distance to provincial roads, distance to expressways, distance to railways, and distance to county roads. Night light and the distance to town centers have little effect on explaining the expansion of tourism land. It is worth noting that different levels of roads have different impacts on tourism land, which is consistent with a study on tourism land use [48]. The distance to provincial roads and the distance to county roads have a much greater impact on tourism land than other transportation factors. This implies that the demand for tourism land along the provincial and county roads surrounding the scenic spots that have great potential for development should be considered. Similarly, a study on tourism and land use change in Guilin, China, showed significant impacts of land use change in distance to roads and distance to tourist areas [16], which is similar to our findings.
In China, rural tourism is mainly regarded as an economic tool for rural development in the modernization process of the country, and the government is the main driver of rural tourism development [6,56]. The simulation results of future tourism land by incorporating planning and policy scenarios can offer insights for policymakers to guide the tourism development in tourism counties, thus supporting rural tourism development and rural revitalization. The potential influence of HSR on tourism land changes can be simulated with the opening of HSR as the transit dividend policy, which can provide a case for proposing management policies for tourism counties confronted with the introduction of HSR. In the HRD scenario, the woodland was under the most pressure, and the government needs to assess ecological values to prevent ecological risks during tourism planning. In the central area of the county, tourism land is scattered, and there is a need for the government to enhance its management and improve the performance of enterprise services. The expansion of tourism land outside the central area of the county was significant, indicating the need for improved infrastructure for rural tourism, including transportation and accommodation. The government should guide and promote the sustainable development of tourism land around scenic spots. Additionally, the living area of TOD planning was situated in a rural region, necessitating better transportation links between this area and tourism scenic spots.
6. Conclusions
This study designed a novel framework that considers the effects of HSR planning on tourism land use simulation by coupling the SD model and the PLUS model. A tourism county in China with HSR construction, Xinxing County, became able to take advantage of the integrated model. The objective is to provide policy suggestions for supporting sustainable tourism development by conducting an HRD scenario. The major contributions and findings from this study are the following: First, the user accuracy of the tourism land indicated that the performance of the coupled SD-PLUS model in simulating tourism land change was satisfactory. This study selected a county for rural tourism, and the application of this case can provide a reference for similar counties that are planning for HSR in the future or are underway. Policymakers should notice the impact of HSR opening on tourism land and model the trend of tourism land affected by HSR to better promote the rational development of tourism via the SD-PLUS model.
Second, the study investigated the contribution of driving forces to tourism land changes using the PLUS model. The findings indicated that the primary factor determining the tourism land change is the distance to scenic spots, followed by transportation factors. Knowledge of the driving mechanisms of tourism land use can provide a reference for future policymaking for tourism land development. This enlightens policymakers to focus on the demands of tourism land development along the provincial and county roads surrounding the scenic spots. This has inspired policymakers to attend to the demand for tourism land development around scenic spots and in areas with high accessibility, managing the conflict between ecological land and tourism land.
Third, the study revealed that the spatial change of tourism land is mainly related to the planning policy supporting HSR, especially in the area neighboring the HSR station. The location of tourism planning areas can lead to changes in the sources of tourism land growth, which requires the ecological protection of their surroundings. This can provide insights for counties that have opened or will open HSR in formulating tourism development policies in China.
Despite the merits of this study, several aspects of the current work warrant further study. First, we were able to predict the tourism land demand in the SD model using only two variables: the GDP of the accommodation and restaurant industry and the GDP of the transport industry, as there was a lack of data to measure the tourism industry sector. Therefore, we appeal that the government establish a database of tourism-related indicators in an attempt to be supportive of the development of tourism land use studies. Second, this study failed to examine the impact on tourism during the COVID-19 pandemic due to a lack of available data to support it. These issues should be addressed in future studies. Third, the planned HSR route was not included as a driving factor as the detailed HSR route was not available. Fourth, this paper simulated the tourism land from 2015 to 2020 for the purpose of validating the model, which fails to consider the effect of HSR opening. Since the sample of similar counties with dominant rural tourism is small and there are no related datasets, there remains a gap in the validation for future studies to fill.
Author Contributions
Conceptualization, Z.J. and S.L.; Data curation, Z.W.; Resources, S.L., Z.L. (Zhangping Lin) and Z.W.; Software, Z.J. and Z.L. (Zhipeng Lai); Supervision, S.L. and L.L.; Validation, Z.L. (Zhangping Lin) and Z.L. (Zhipeng Lai); Writing—original draft, Z.J.; Writing—review and editing, S.L. and L.L. All authors have read and agreed to the published version of the manuscript.
Funding
This research was sponsored by the National Natural Science Foundation of China (Grant No. 42271467, 41871290).
Data Availability Statement
All data and materials are available upon request.
Conflicts of Interest
The authors declare that they have no known competing financial interests or personal relationships that could have appeared to influence the work reported in this paper.
References
- UNWTO. Available online: https://www.unwto.org/ (accessed on 7 December 2021).
- Li, J.; Bai, Y.; Alatalo, J.M. Impacts of rural tourism-driven land use change on ecosystems services provision in Erhai Lake Basin, China. Ecosyst. Serv. 2020, 42, 101081. [Google Scholar] [CrossRef]
- Ning, G.; He, J. Study on Green Rural-Tourism in Undeveloped Western Region of China Under the Perspective of Urban-Rural Integration. AMR 2012, 518–523, 6075–6078. [Google Scholar] [CrossRef]
- Su, B. Rural Tourism in China. Tour. Manag. 2011, 32, 1438–1441. [Google Scholar] [CrossRef]
- Chen, K.; Long, H.; Liao, L.; Tu, S.; Li, T. Land Use Transitions and Urban-Rural Integrated Development: Theoretical Framework and China’s Evidence. Land Use Policy 2020, 92, 104465. [Google Scholar] [CrossRef]
- Liu, C.; Dou, X.; Li, J.; Cai, L.A. Analyzing Government Role in Rural Tourism Development: An Empirical Investigation from China. J. Rural Stud. 2020, 79, 177–188. [Google Scholar] [CrossRef]
- Yang, J.; Yang, R.; Chen, M.H.; Su, C.H.J.; Zhi, Y.; Xi, J. Effects of rural revitalization on rural tourism. J. Hosp. Tour. Manag. 2021, 47, 35–45. [Google Scholar] [CrossRef]
- National Development and Reform Commission (NDRC) People’s Republic of China. Available online: https://en.ndrc.gov.cn/ (accessed on 7 December 2021).
- Gössling, S. Global Environmental Consequences of Tourism. Glob. Environ. Change 2002, 12, 283–302. [Google Scholar] [CrossRef]
- Gössling, S.; Peeters, P. Assessing Tourism’s Global Environmental Impact 1900–2050. J. Sustain. Tour. 2015, 23, 639–659. [Google Scholar] [CrossRef]
- Xi, J.; Zhao, M.; Ge, Q.; Kong, Q. Changes in Land Use of a Village Driven by over 25 Years of Tourism: The Case of Gougezhuang Village, China. Land Use Policy 2014, 40, 119–130. [Google Scholar] [CrossRef]
- Dey, J.; Sakhre, S.; Gupta, V.; Vijay, R.; Pathak, S.; Biniwale, R.; Kumar, R. Geospatial Assessment of Tourism Impact on Land Environment of Dehradun, Uttarakhand, India. Env. Monit. Assess. 2018, 190, 181. [Google Scholar] [CrossRef]
- Yang, X.; Wang, J.; Sun, X.; Zhang, H.; Li, N.; Liu, J. Tourism Industry-Driven Changes in Land Use and Ecological Risk Assessment at Jiuzhaigou UNESCO World Heritage Site. J. Spat. Sci. 2018, 63, 341–358. [Google Scholar] [CrossRef]
- Shui, W.; Xu, G. Analysis of the Influential Factors for Changes to Land Use in China’s Xingwen Global Geopark against a Tourism Development Background. Geocarto Int. 2016, 31, 22–41. [Google Scholar] [CrossRef]
- Li, M.; Fang, L.; Huang, X.; Goh, C. A Spatial–Temporal Analysis of Hotels in Urban Tourism Destination. Int. J. Hosp. Manag. 2015, 45, 34–43. [Google Scholar] [CrossRef]
- Mao, X.; Meng, J.; Wang, Q. Tourism and land transformation: A case study of the Li River Basin, Guilin, China. J. Mt. Sci. 2014, 11, 1606–1619. [Google Scholar] [CrossRef]
- You, W.; Ji, Z.; Wu, L.; Deng, X.; Huang, D.; Chen, B.; Yu, J.; He, D. Modeling Changes in Land Use Patterns and Ecosystem Services to Explore a Potential Solution for Meeting the Management Needs of a Heritage Site at the Landscape Level. Ecol. Indic. 2017, 73, 68–78. [Google Scholar] [CrossRef]
- Ren, Y.; Lü, Y.; Comber, A.; Fu, B.; Harris, P.; Wu, L. Spatially Explicit Simulation of Land Use/Land Cover Changes: Current Coverage and Future Prospects. Earth-Sci. Rev. 2019, 190, 398–415. [Google Scholar] [CrossRef]
- Gomes, E.; Abrantes, P.; Banos, A.; Rocha, J. Modelling Future Land Use Scenarios Based on Farmers’ Intentions and a Cellular Automata Approach. Land Use Policy 2019, 85, 142–154. [Google Scholar] [CrossRef]
- Li, X.; Liu, X. An Extended Cellular Automaton Using Case-based Reasoning for Simulating Urban Development in a Large Complex Region. Int. J. Geogr. Inf. Sci. 2006, 20, 1109–1136. [Google Scholar] [CrossRef]
- Li, X.; Yeh, A.G.-O. Neural-Network-Based Cellular Automata for Simulating Multiple Land Use Changes Using GIS. Int. J. Geogr. Inf. Sci. 2002, 16, 323–343. [Google Scholar] [CrossRef]
- Mao, X.; Meng, J.; Wang, Q. Modeling the effects of tourism and land regulation on land-use change in tourist regions: A case study of the Lijiang River Basin in Guilin, China. Land Use Policy 2014, 41, 368–377. [Google Scholar] [CrossRef]
- Boavida-Portugal, I.; Rocha, J.; Ferreira, C.C. Exploring the impacts of future tourism development on land use/cover changes. Appl. Geogr. 2016, 77, 82–91. [Google Scholar] [CrossRef]
- Gao, Y.; Nan, Y.; Song, S. High-speed Rail and City Tourism: Evidence from Tencent Migration Big Data on Two Chinese Golden Weeks. Growth Change 2021, 53, 1012–1036. [Google Scholar] [CrossRef]
- Jin, S.; Yang, J.; Wang, E.; Liu, J. The Influence of High-Speed Rail on Ice–Snow Tourism in Northeastern China. Tour. Manag. 2020, 78, 104070. [Google Scholar] [CrossRef]
- Sun, Y.-Y.; Lin, Z.-W. Move Fast, Travel Slow: The Influence of High-Speed Rail on Tourism in Taiwan. J. Sustain. Tour. 2018, 26, 433–450. [Google Scholar] [CrossRef]
- Wang, D.; Niu, Y.; Qian, J. Evolution and Optimization of China’s Urban Tourism Spatial Structure: A High Speed Rail Perspective. Tour. Manag. 2018, 64, 218–232. [Google Scholar] [CrossRef]
- Chang, Z.; Zheng, L.; Yang, T.; Long, F. High-Speed Rail, New Town Development, and the Spatial Mismatch of Land Leases in China. Land Use Policy 2022, 115, 106014. [Google Scholar] [CrossRef]
- Niu, F.; Xin, Z.; Sun, D. Urban Land Use Effects of High-Speed Railway Network in China: A Spatial Spillover Perspective. Land Use Policy 2021, 105, 105417. [Google Scholar] [CrossRef]
- Zhang, H.; Li, X.; Liu, X.; Chen, Y.; Ou, J.; Niu, N.; Jin, Y.; Shi, H. Will the Development of a High-Speed Railway Have Impacts on Land Use Patterns in China? Ann. Am. Assoc. Geogr. 2019, 109, 979–1005. [Google Scholar] [CrossRef]
- Coyle, R.G. System Dynamics Modelling: A Practical Approach. J. Oper. Res. Soc. 1997, 48, 544. [Google Scholar] [CrossRef]
- Liang, X.; Guan, Q.; Clarke, K.C.; Liu, S.; Wang, B.; Yao, Y. Understanding the drivers of sustainable land expansion using a patch-generating land use simulation (PLUS) model: A case study in Wuhan, China. Comput. Environ. Urban Syst. 2021, 85, 101569. [Google Scholar] [CrossRef]
- Votsi, N.E.P.; Mazaris, A.D.; Kallimanis, A.S.; Pantis, J.D. Natural quiet: An additional feature reflecting green tourism development in conservation areas of Greece. Tour. Manag. Perspect. 2014, 11, 10–17. [Google Scholar] [CrossRef]
- Bahaire, T.; Elliott-White, M. The application of geographical information systems (GIS) in sustainable tourism planning: A review. J. Sustain. Tour. 1999, 7, 159–174. [Google Scholar] [CrossRef]
- Wang, J.; Liu, Y. Tourism-Led Land-Use Changes and Their Environmental Effects in the Southern Coastal Region of Hainan Island, China. J. Coast. Res. 2013, 290, 1118–1125. [Google Scholar] [CrossRef]
- Marzuki, A.; Masron, T.; Ismail, N. Land use changes analysis for Pantai Chenang, Langkawi using spatial patch analysis technique in relation to coastal tourism. Tour. Plan. Dev. 2016, 13, 154–167. [Google Scholar] [CrossRef]
- Ma, H.; Xi, J.; Wang, Q.; Liu, J.; Gong, Z. Spatial Complex Morphological Evolution and Influencing Factors for Mountain and Seaside Resort Tourism Destinations. Complexity 2020, 2020, 4137145. [Google Scholar] [CrossRef]
- Furgała-Selezniow, G.; Jankun-Woźnicka, M.; Kruk, M.; Omelan, A.A. Land use and land cover pattern as a measure of tourism impact on a lakeshore zone. Land 2021, 10, 787. [Google Scholar] [CrossRef]
- Petrov, L.O.; Lavalle, C.; Kasanko, M. Urban land use scenarios for a tourist region in Europe: Applying the MOLAND model to Algarve, Portugal. Landsc. Urban Plan. 2009, 92, 10–23. [Google Scholar] [CrossRef]
- He, D.; Chen, Z.; Pei, T.; Zhou, J. Analysis of structural evolution and its influencing factors of the high-speed railway network in China’s three urban agglomerations. Cities 2023, 132, 104063. [Google Scholar] [CrossRef]
- Chen, Z.; Zhou, Y.; Haynes, K.E. Change in land use structure in urban China: Does the development of high-speed rail make a difference. Land Use Policy 2021, 111, 104962. [Google Scholar] [CrossRef]
- Diao, M.; Zhu, Y.; Zhu, J. Intra-city access to inter-city transport nodes: The implications of high-speed-rail station locations for the urban development of Chinese cities. Urban Stud. 2017, 54, 2249–2267. [Google Scholar] [CrossRef]
- Wang, B.; Ersoy, A.; van Bueren, E.; de Jong, M. Rules for the governance of transport and land use integration in high-speed railway station areas in China: The case of Lanzhou. Urban Policy Res. 2022, 40, 122–141. [Google Scholar] [CrossRef]
- Basse, R.M. A constrained cellular automata model to simulate the potential effects of high-speed train stations on land-use dynamics in trans-border regions. J. Transp. Geogr. 2013, 32, 23–37. [Google Scholar] [CrossRef]
- Shen, Y.; Martinez, L.M.; de Abreu e Silva, J. Cellular agent-based approach incorporating spatial discrete choice methods: Simulation of future land use impacts of high-speed rail on Aveiro, Portugal. Transp. Res. Rec. 2014, 2430, 105–115. [Google Scholar] [CrossRef]
- Liang, X.; Liu, X.; Li, D.; Zhao, H.; Chen, G. Urban growth simulation by incorporating planning policies into a CA-based future land-use simulation model. Int. J. Geogr. Inf. Sci. 2018, 32, 2294–2316. [Google Scholar] [CrossRef]
- Shi, H.; Li, X.; Yang, Z.; Li, T.; Ren, Y.; Liu, T.; Yang, N.; Zhang, H.; Chen, G.; Liang, X. Tourism Land Use Simulation for Regional Tourism Planning Using POIs and Cellular Automata. Trans. GIS 2020, 24, 1119–1138. [Google Scholar] [CrossRef]
- Liu, J.; Wang, J.; Wang, S.; Wang, J.; Deng, G. Analysis and Simulation of the Spatiotemporal Evolution Pattern of Tourism Lands at the Natural World Heritage Site Jiuzhaigou, China. Habitat Int. 2018, 79, 74–88. [Google Scholar] [CrossRef]
- Al-Saad, S.A.; Jawarneh, R.N.; Aloudat, A.S. Spatiotemporal cluster analysis of reputable tourist accommodation in Greater Amman Municipality, Jordan. J. Hosp. Tour. Technol. 2023. [Google Scholar] [CrossRef]
- Beneki, C.; Spiggos, T. Spatial Patterns of Tourism Activity Through the Lens of TripAdvisor’s Online Restaurant Reviews: A Case Study from Corfu. In Culture and Tourism in a Smart, Globalized, and Sustainable World: 7th International Conference of IACuDiT, Hydra, Greece; Springer International Publishing: Cham, Switzerland, 2020; pp. 559–585. [Google Scholar]
- Liu, X.; Liang, X.; Li, X.; Xu, X.; Ou, J.; Chen, Y.; Li, S.; Wang, S.; Pei, F. A Future Land Use Simulation Model (FLUS) for Simulating Multiple Land Use Scenarios by Coupling Human and Natural Effects. Landsc. Urban Plan. 2017, 168, 94–116. [Google Scholar] [CrossRef]
- Gao, L.; Tao, F.; Liu, R.; Wang, Z.; Leng, H.; Zhou, T. Multi-scenario simulation and ecological risk analysis of land use based on the PLUS model: A case study of Nanjing. Sustain. Cities Soc. 2022, 85, 104055. [Google Scholar] [CrossRef]
- Lai, Z.; Chen, C.; Chen, J.; Wu, Z.; Wang, F.; Li, S. Multi-Scenario Simulation of Land-Use Change and Delineation of Urban Growth Boundaries in County Area: A Case Study of Xinxing County, Guangdong Province. Land 2022, 11, 1598. [Google Scholar] [CrossRef]
- Huang, Z.; Li, S.; Gao, F.; Wang, F.; Lin, J.; Tan, Z. Evaluating the Performance of LBSM Data to Estimate the Gross Domestic Product of China at Multiple Scales: A Comparison with NPP-VIIRS Nighttime Light Data. J. Clean. Prod. 2021, 328, 129558. [Google Scholar] [CrossRef]
- Chu, L.; Oloo, F.; Chen, B.; Xie, M.; Blaschke, T. Assessing the Influence of Tourism-Driven Activities on Environmental Variables on Hainan Island, China. Remote Sens. 2020, 12, 2813. [Google Scholar] [CrossRef]
- Gao, C.; Cheng, L. Tourism-driven rural spatial restructuring in the metropolitan fringe: An empirical observation. Land Use Policy 2020, 95, 104609. [Google Scholar] [CrossRef]
Figure 1.
Schematic framework of the SD-PLUS model for simulating future tourism land.
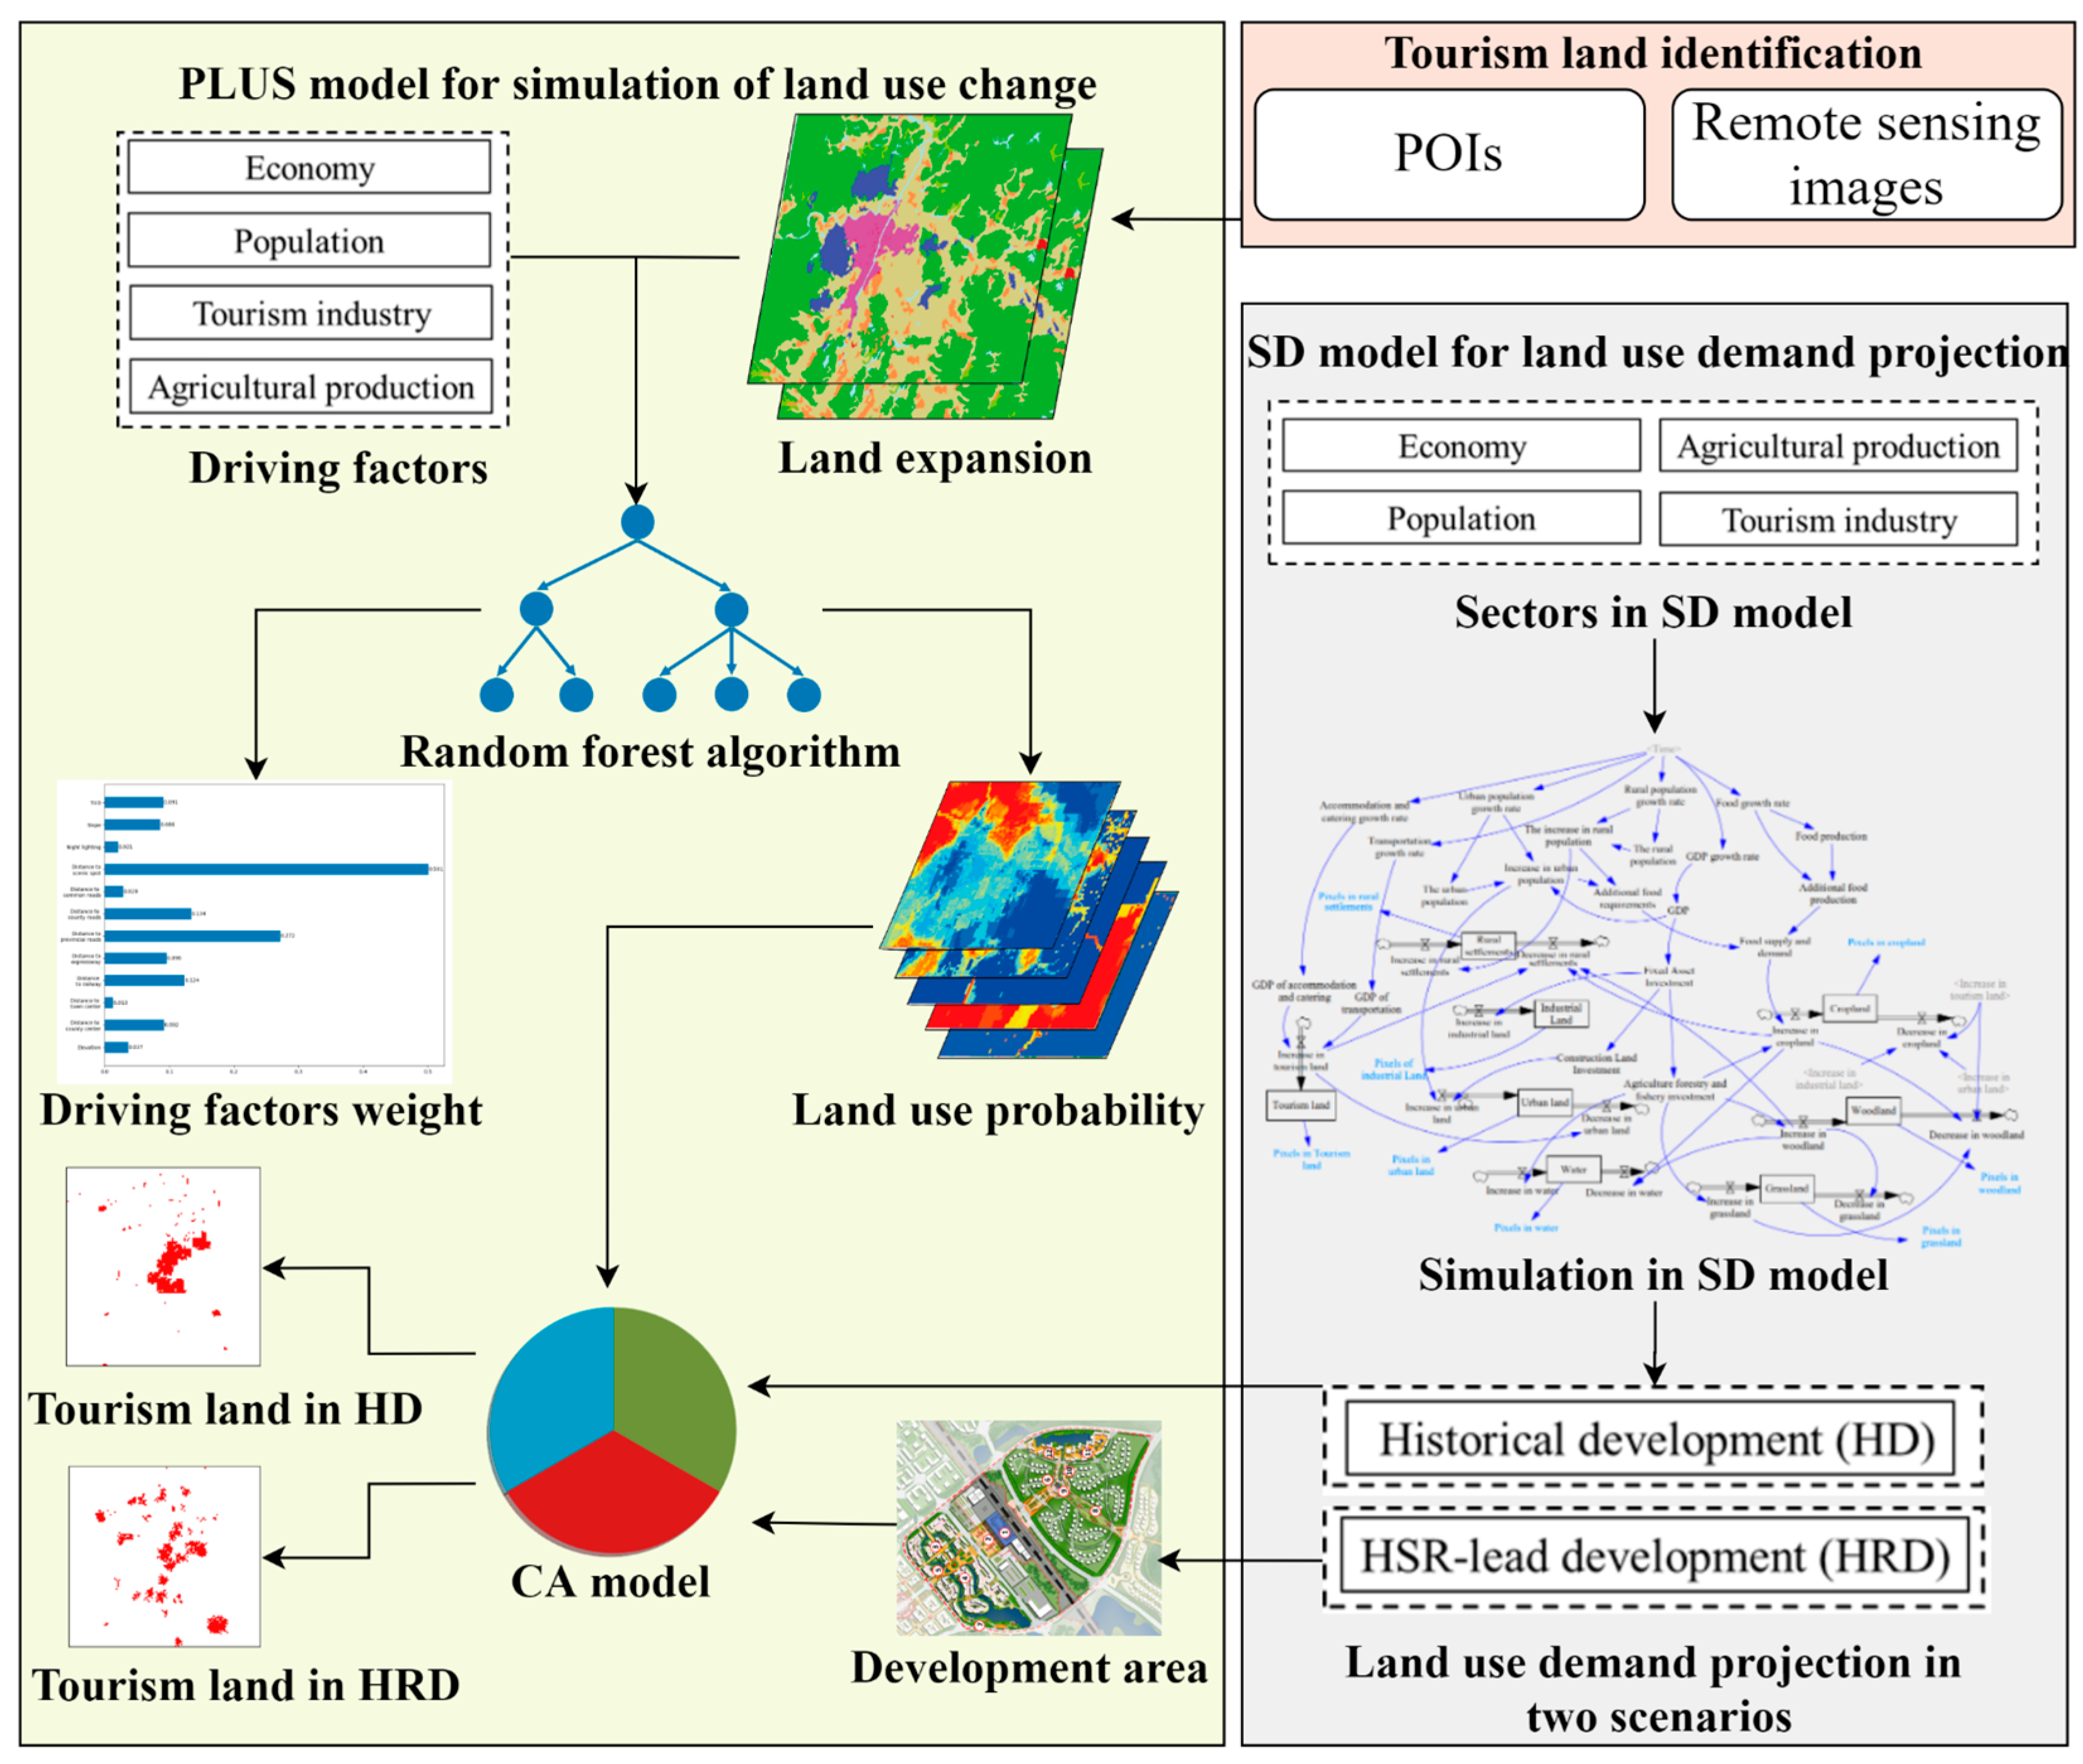
Figure 2.
The interactions and competition of different land use types in the SD model.
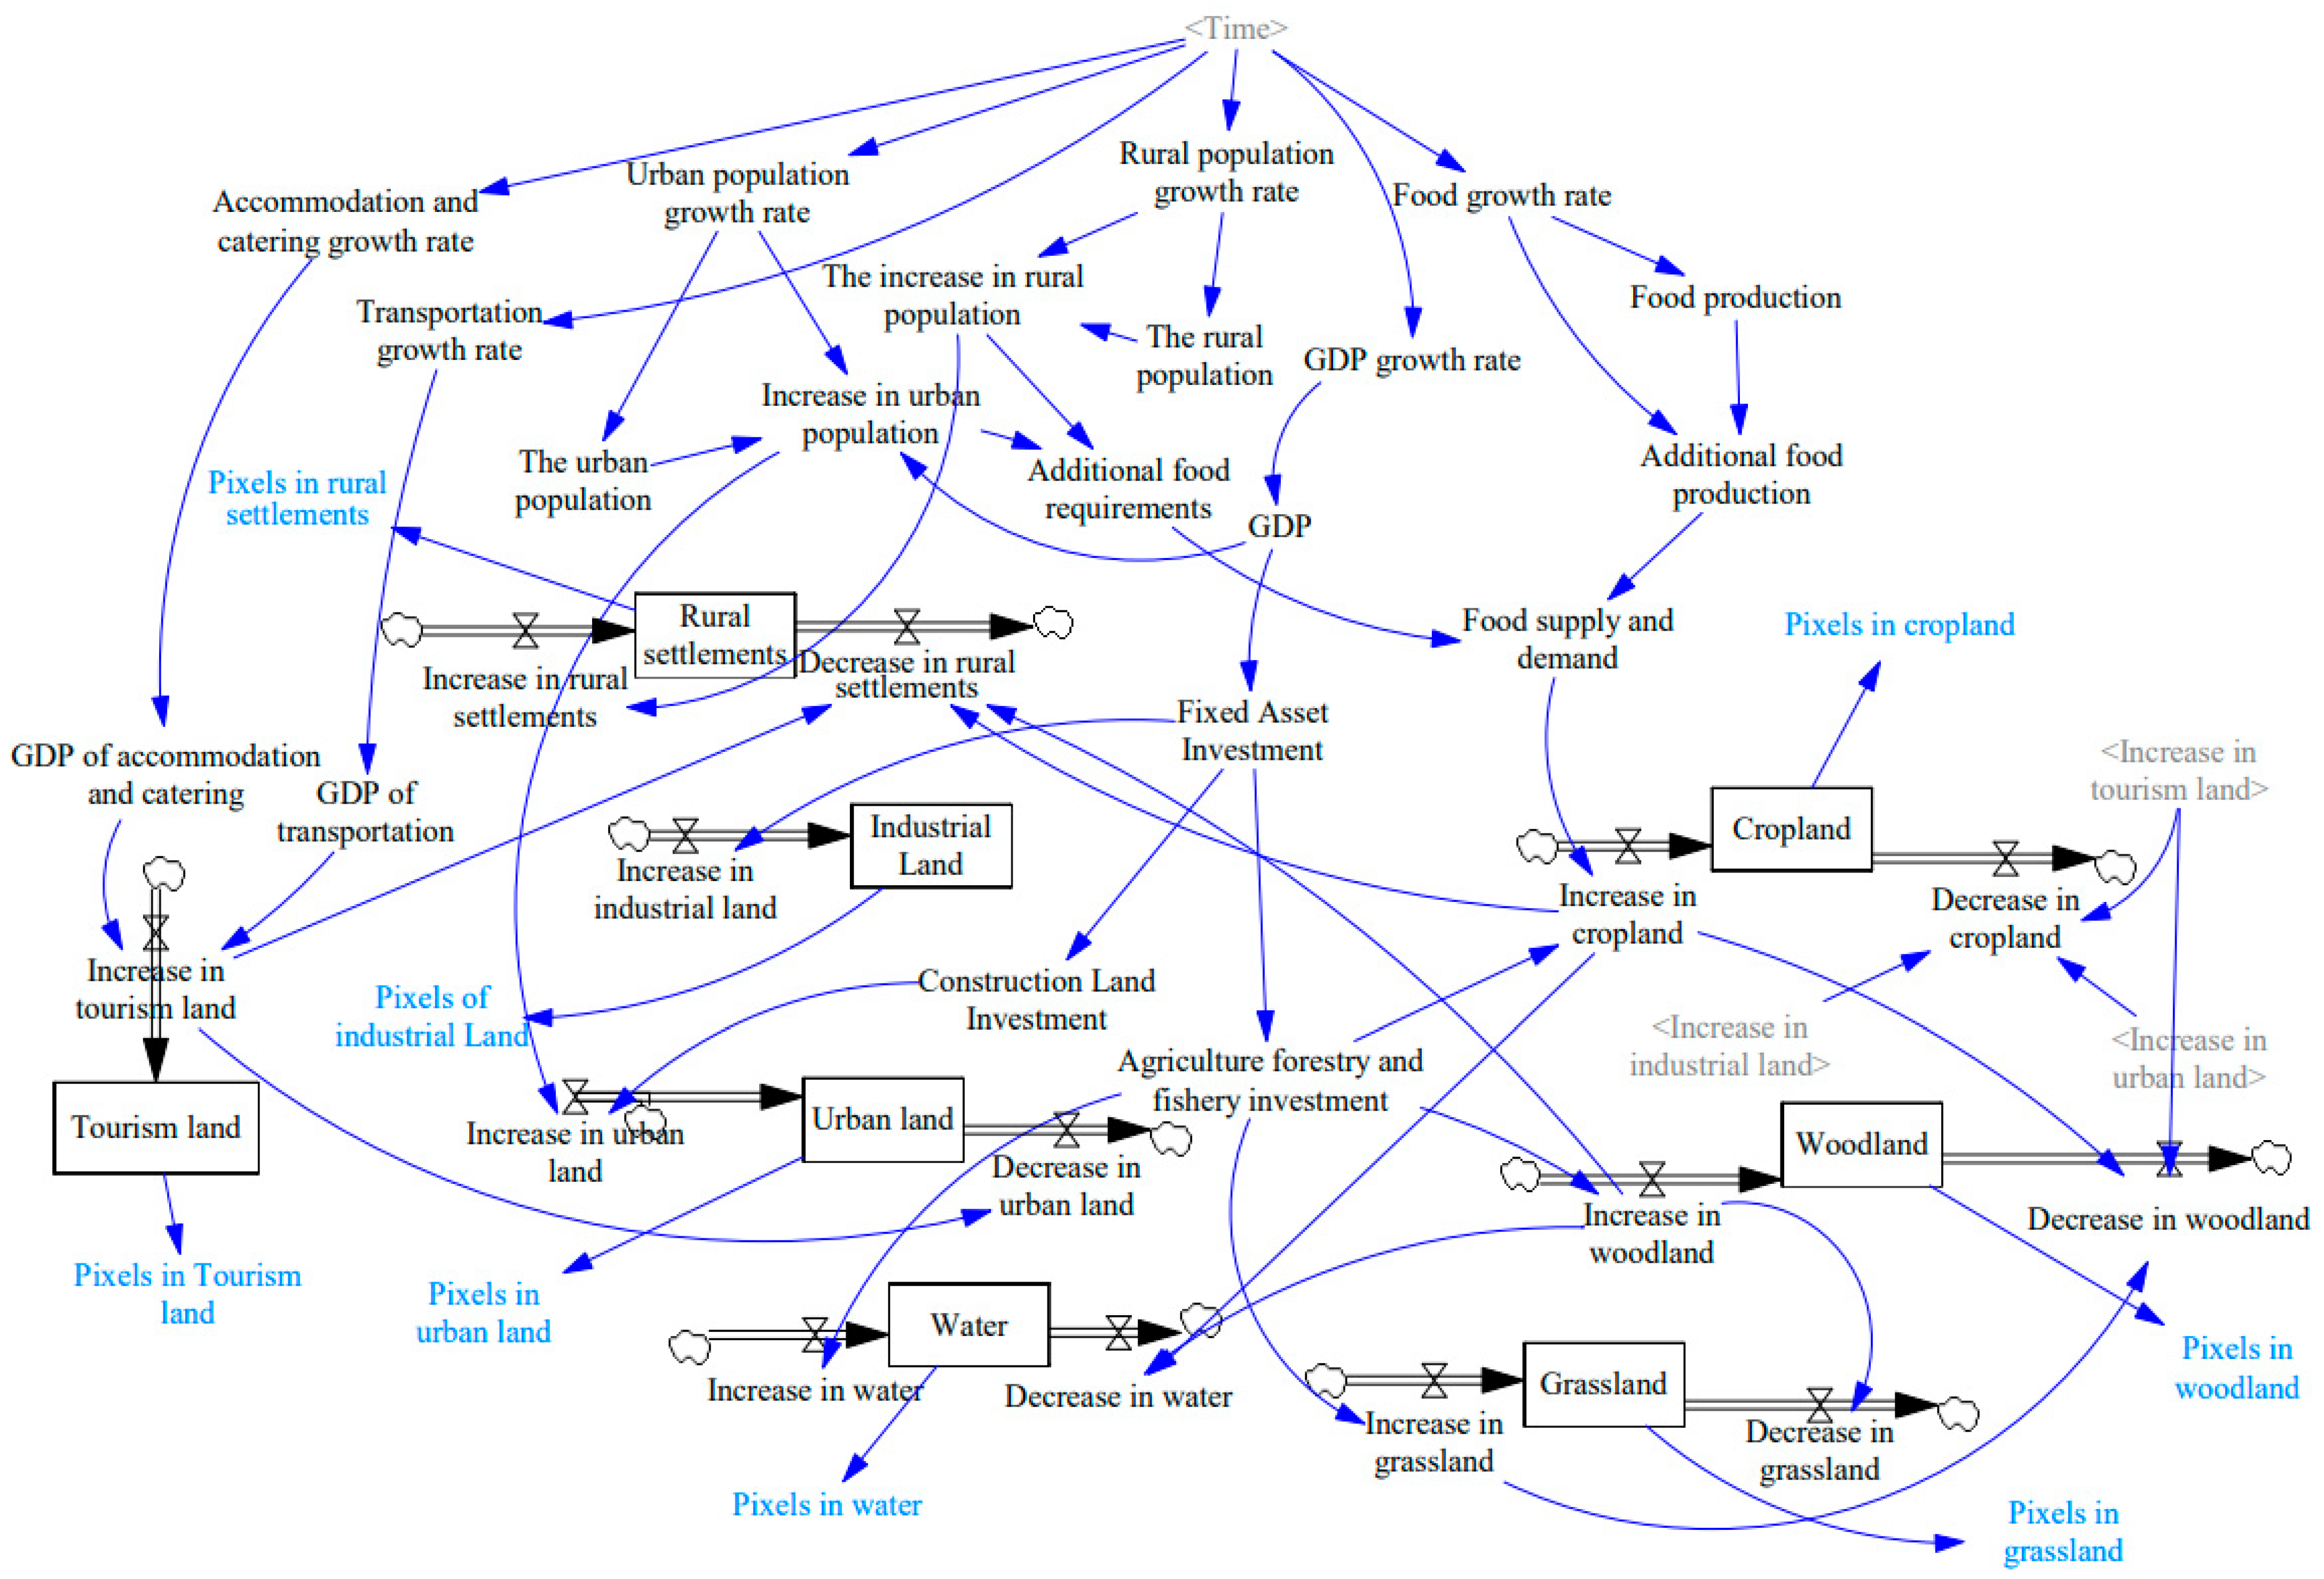
Figure 3.
Study area.
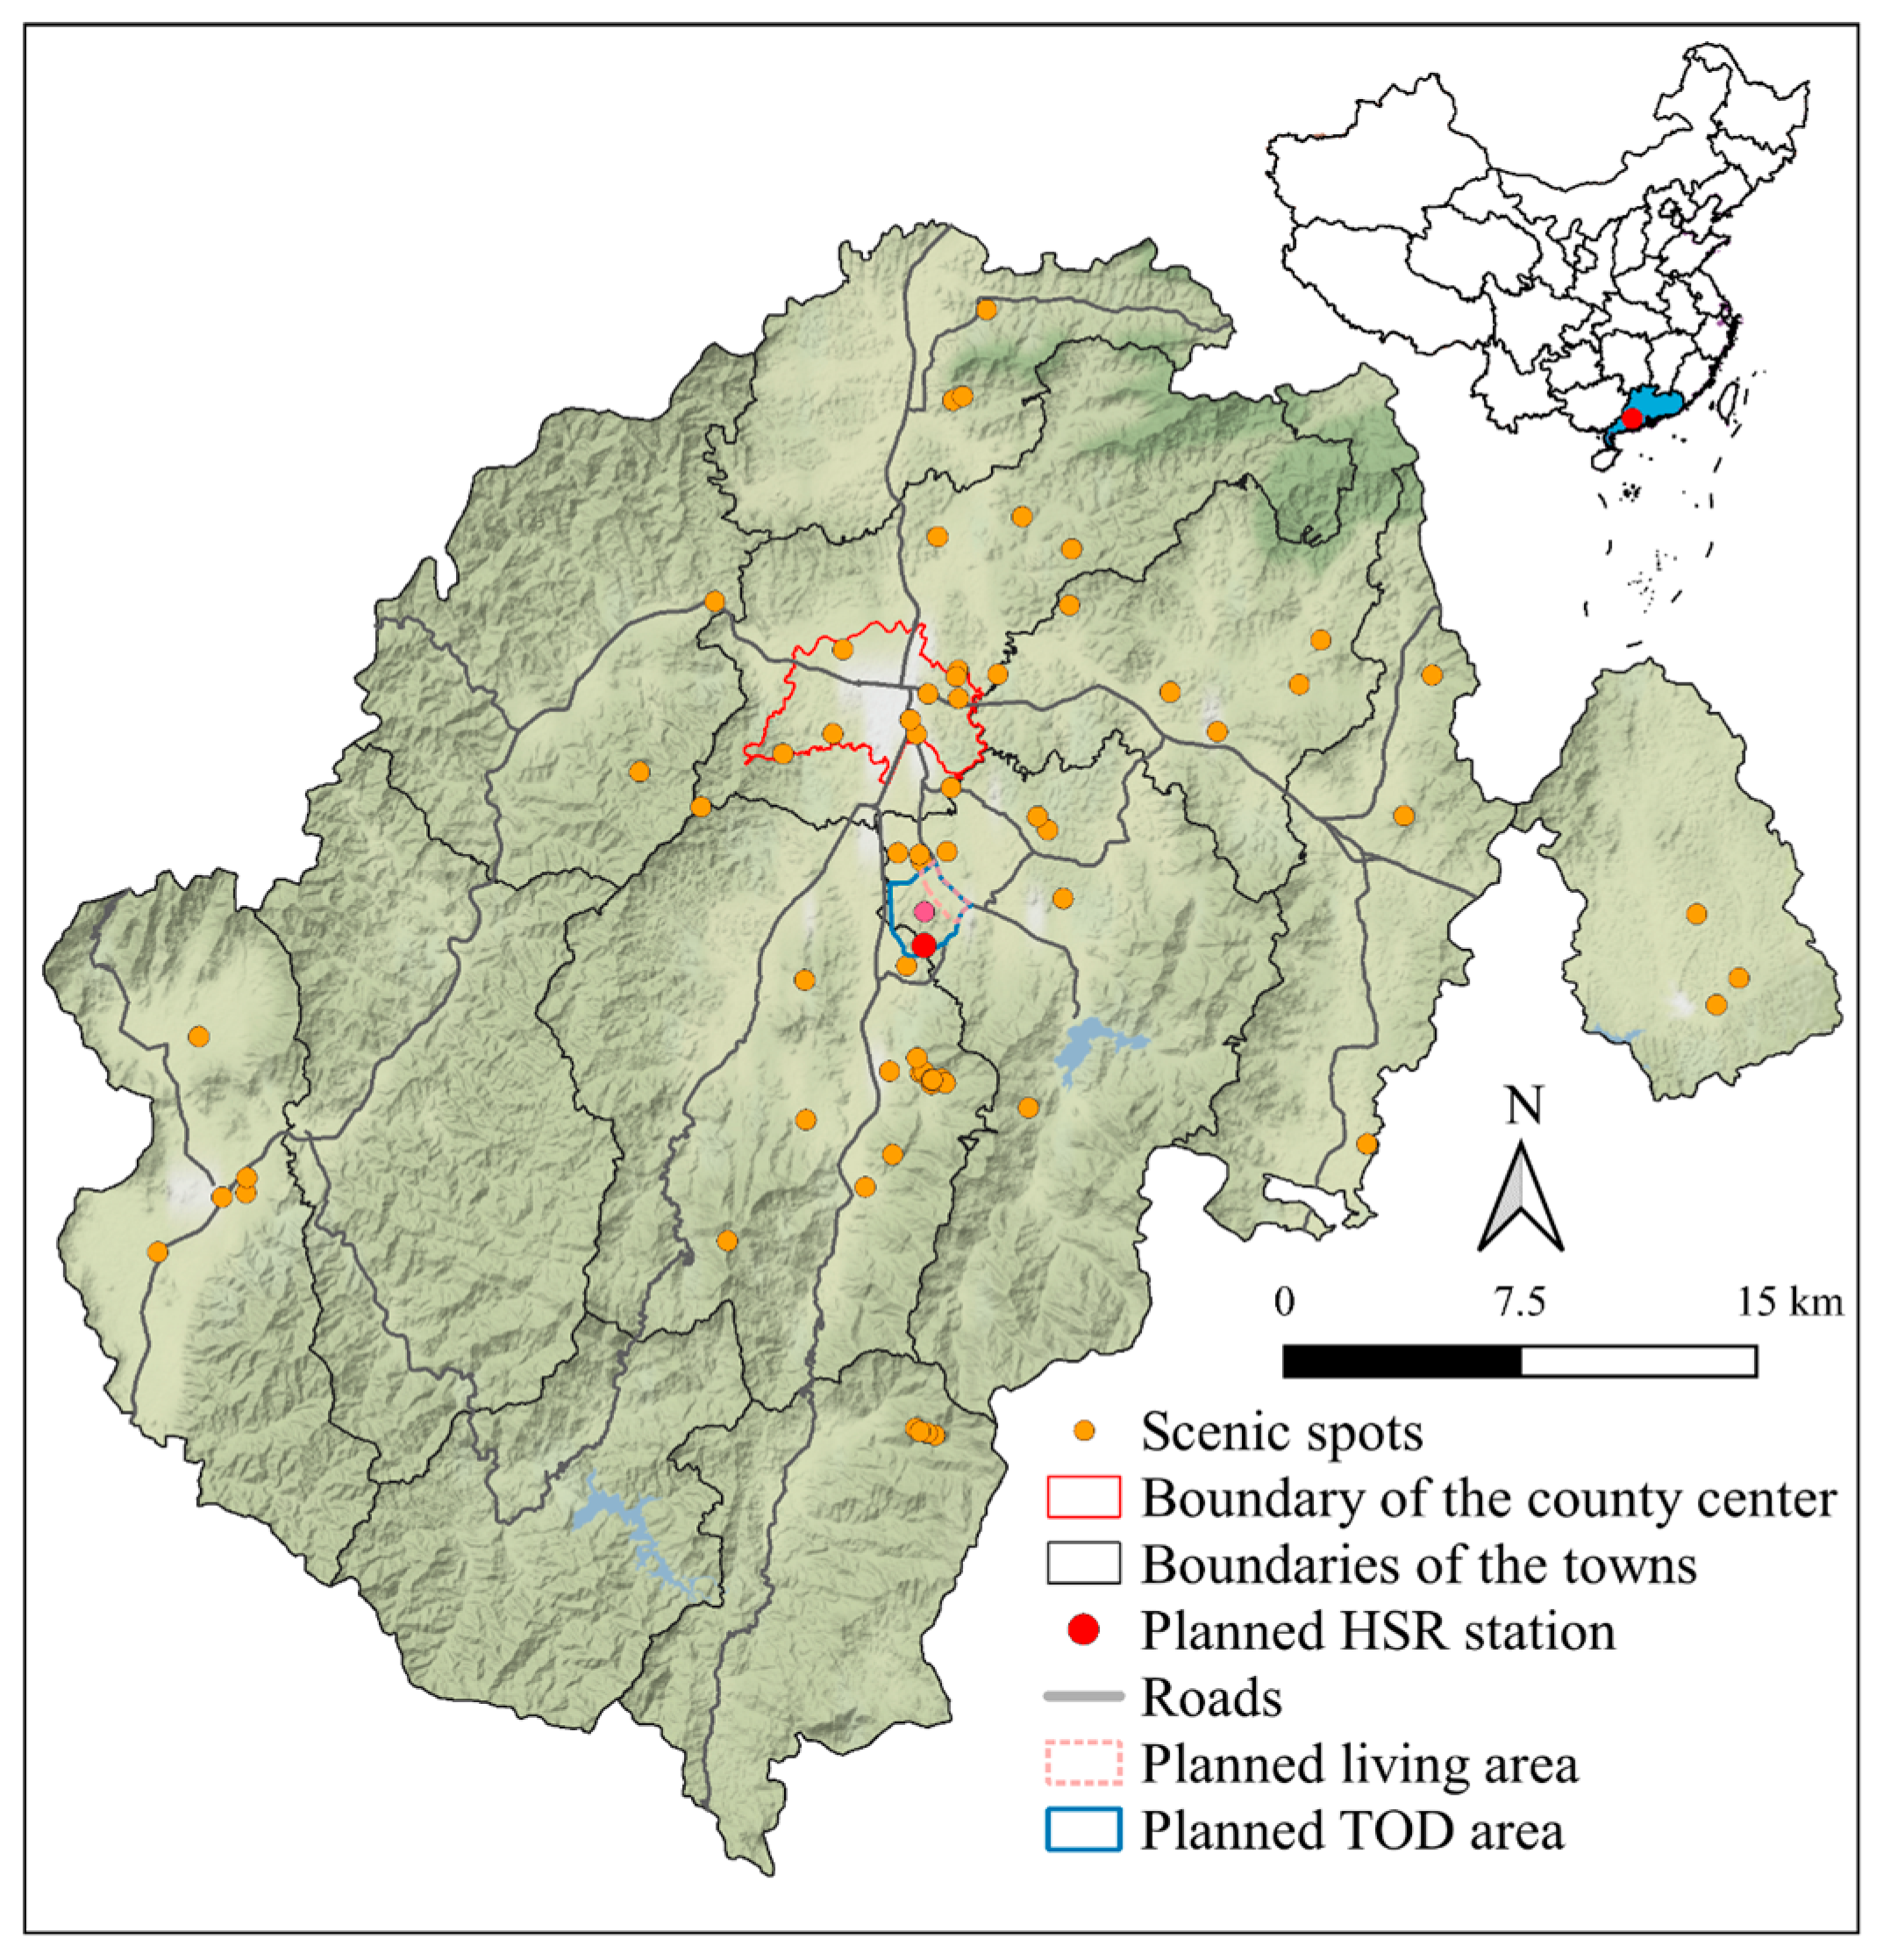
Figure 4.
Driving factors: (a) slope; (b) nighttime lighting; (c) elevation; (d) distance to county roads; (e) distance to railways; (f) distance to town centers; (g) distance to provincial roads; (h) distance to scenic spots; (i) distance to common roads; (j) TUD; (k) distance to the county center; (l) distance to expressways.
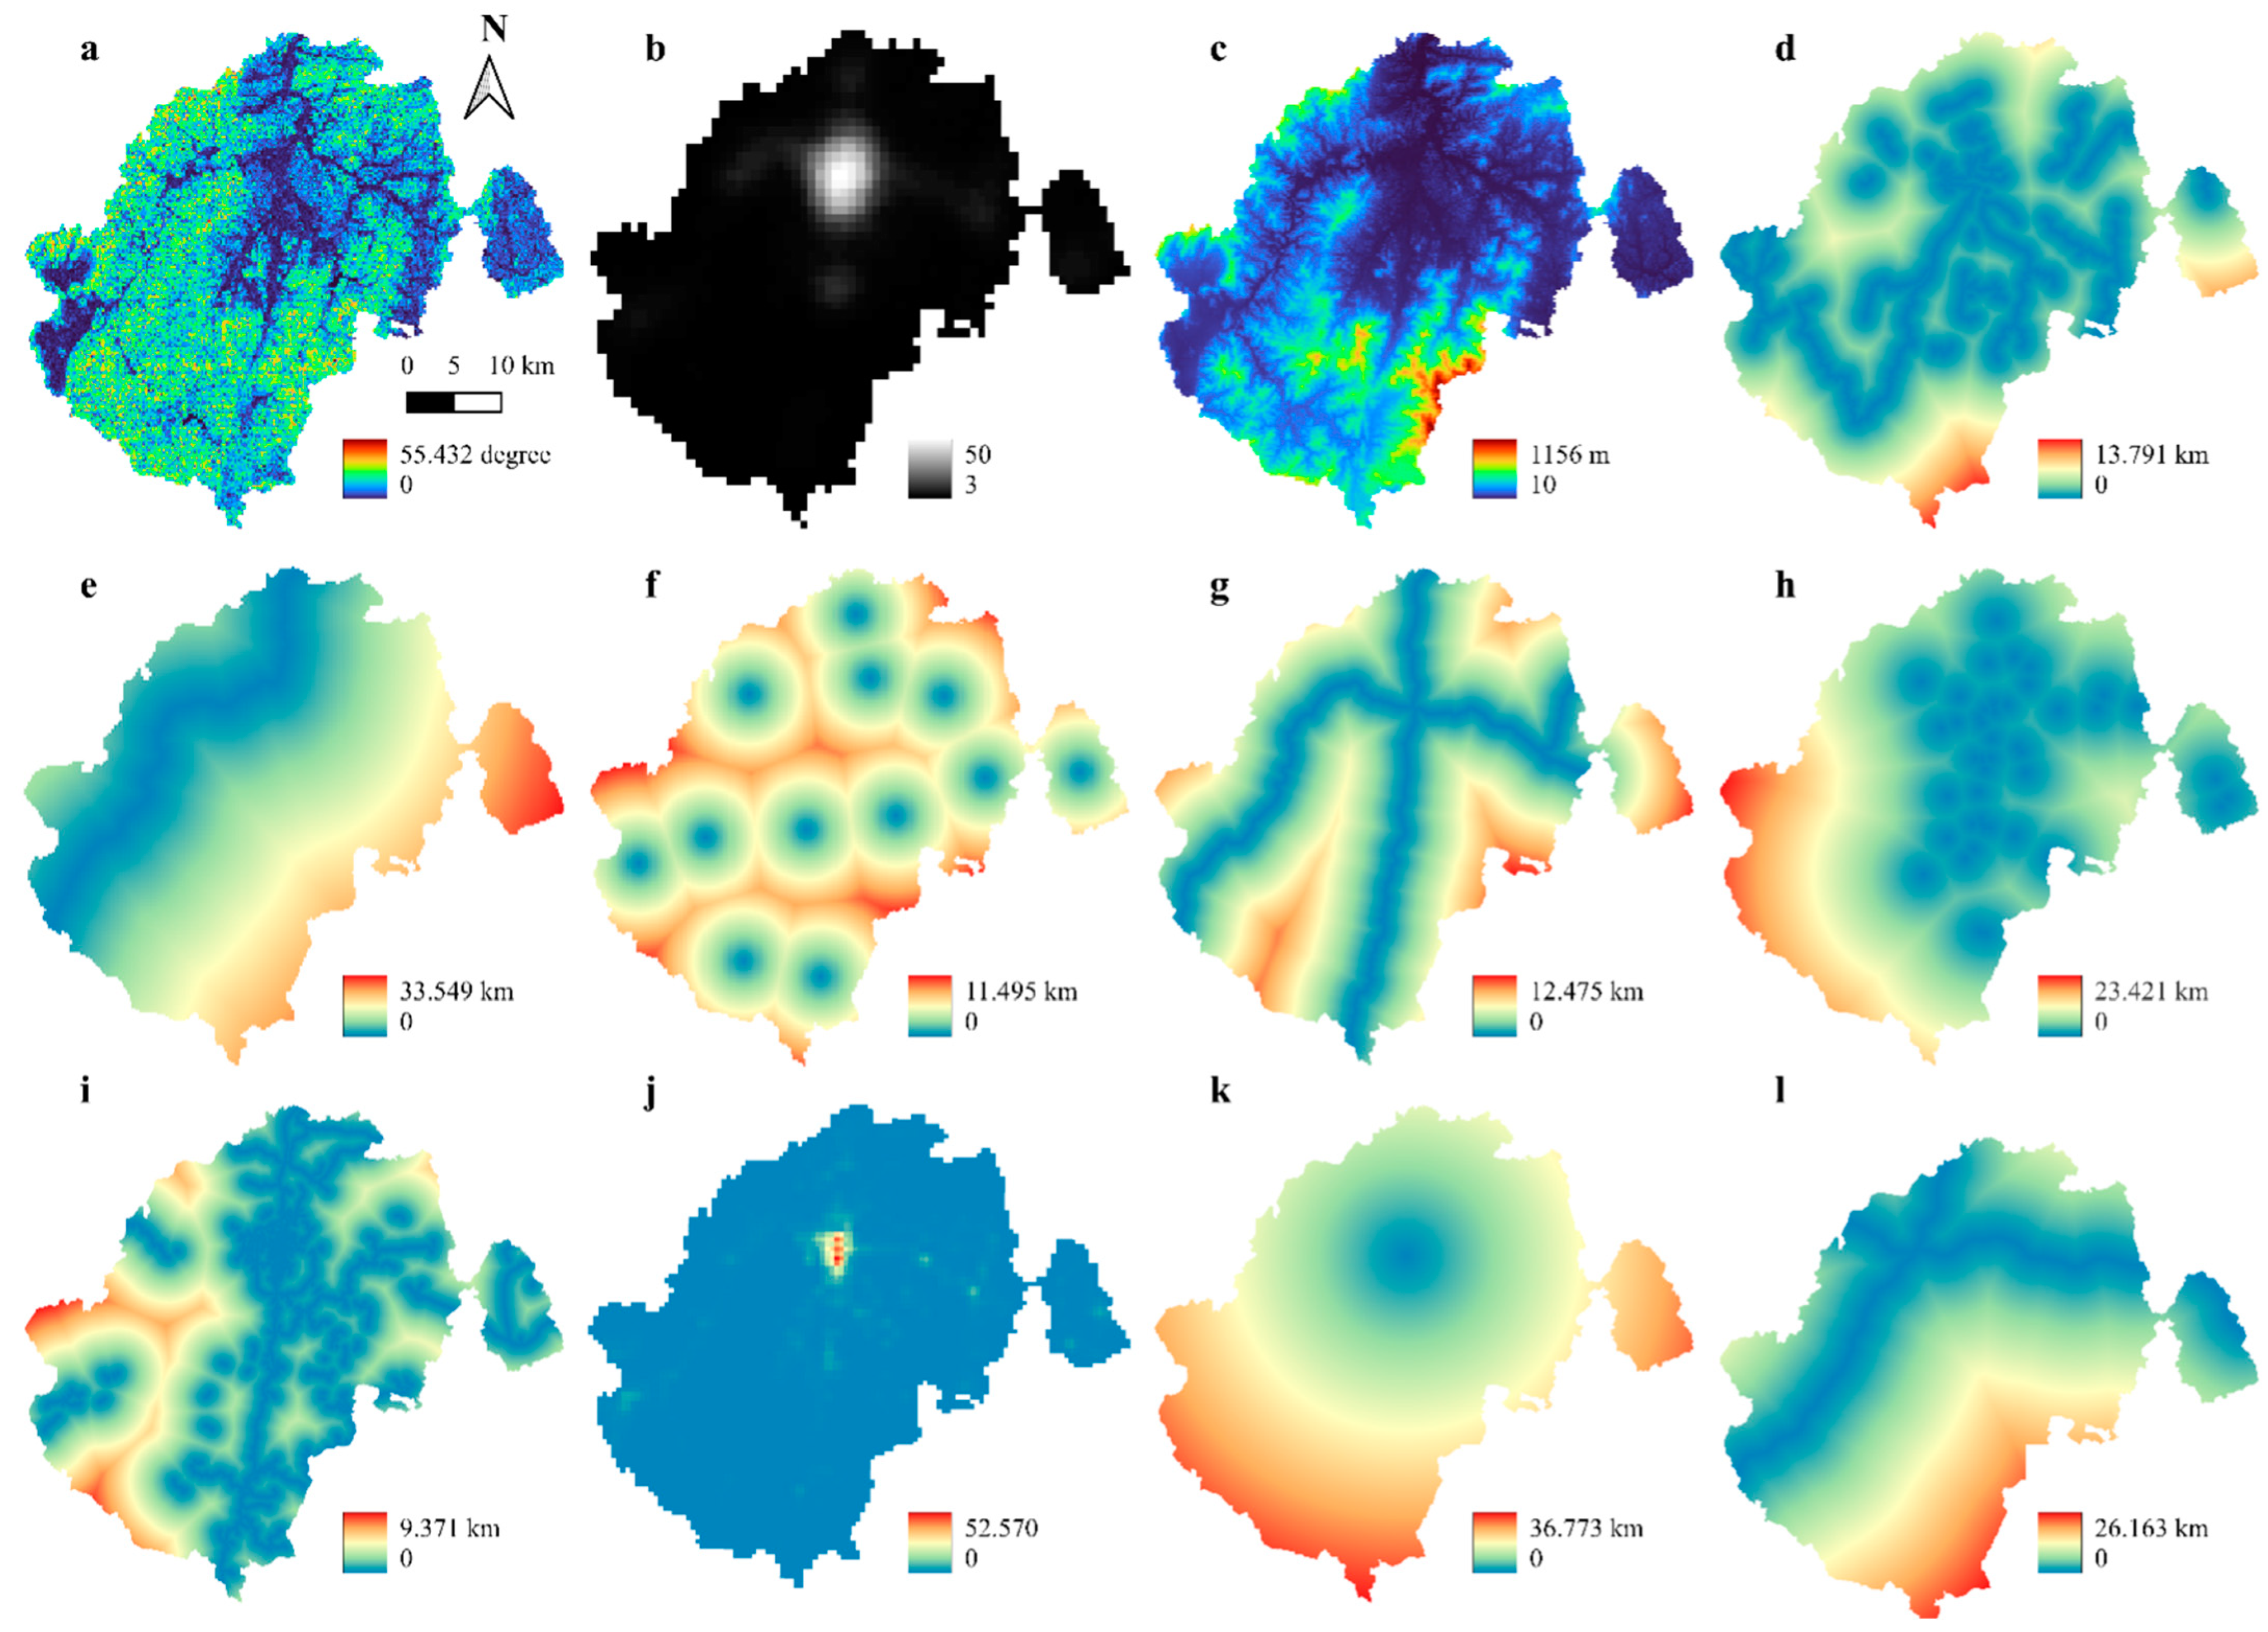
Figure 5.
The predicted tourism land number in SD model.

Figure 6.
The simulated results of land use patterns under two scenarios: (a) land use patterns in 2020; (b) land use patterns under the HD scenario in 2035; (c) land use patterns under the HRD scenario in 2035.
Figure 6.
The simulated results of land use patterns under two scenarios: (a) land use patterns in 2020; (b) land use patterns under the HD scenario in 2035; (c) land use patterns under the HRD scenario in 2035.

Figure 7.
Spatial distribution of tourism land: (a) county center area; (b) scenic spots of Buddhism; (c) scenic spots of hot springs and farmhouses; (d) scenic spots of hot springs; (1) land use in 2020; (2) HD scenario; (3) HRD scenario.
Figure 7.
Spatial distribution of tourism land: (a) county center area; (b) scenic spots of Buddhism; (c) scenic spots of hot springs and farmhouses; (d) scenic spots of hot springs; (1) land use in 2020; (2) HD scenario; (3) HRD scenario.
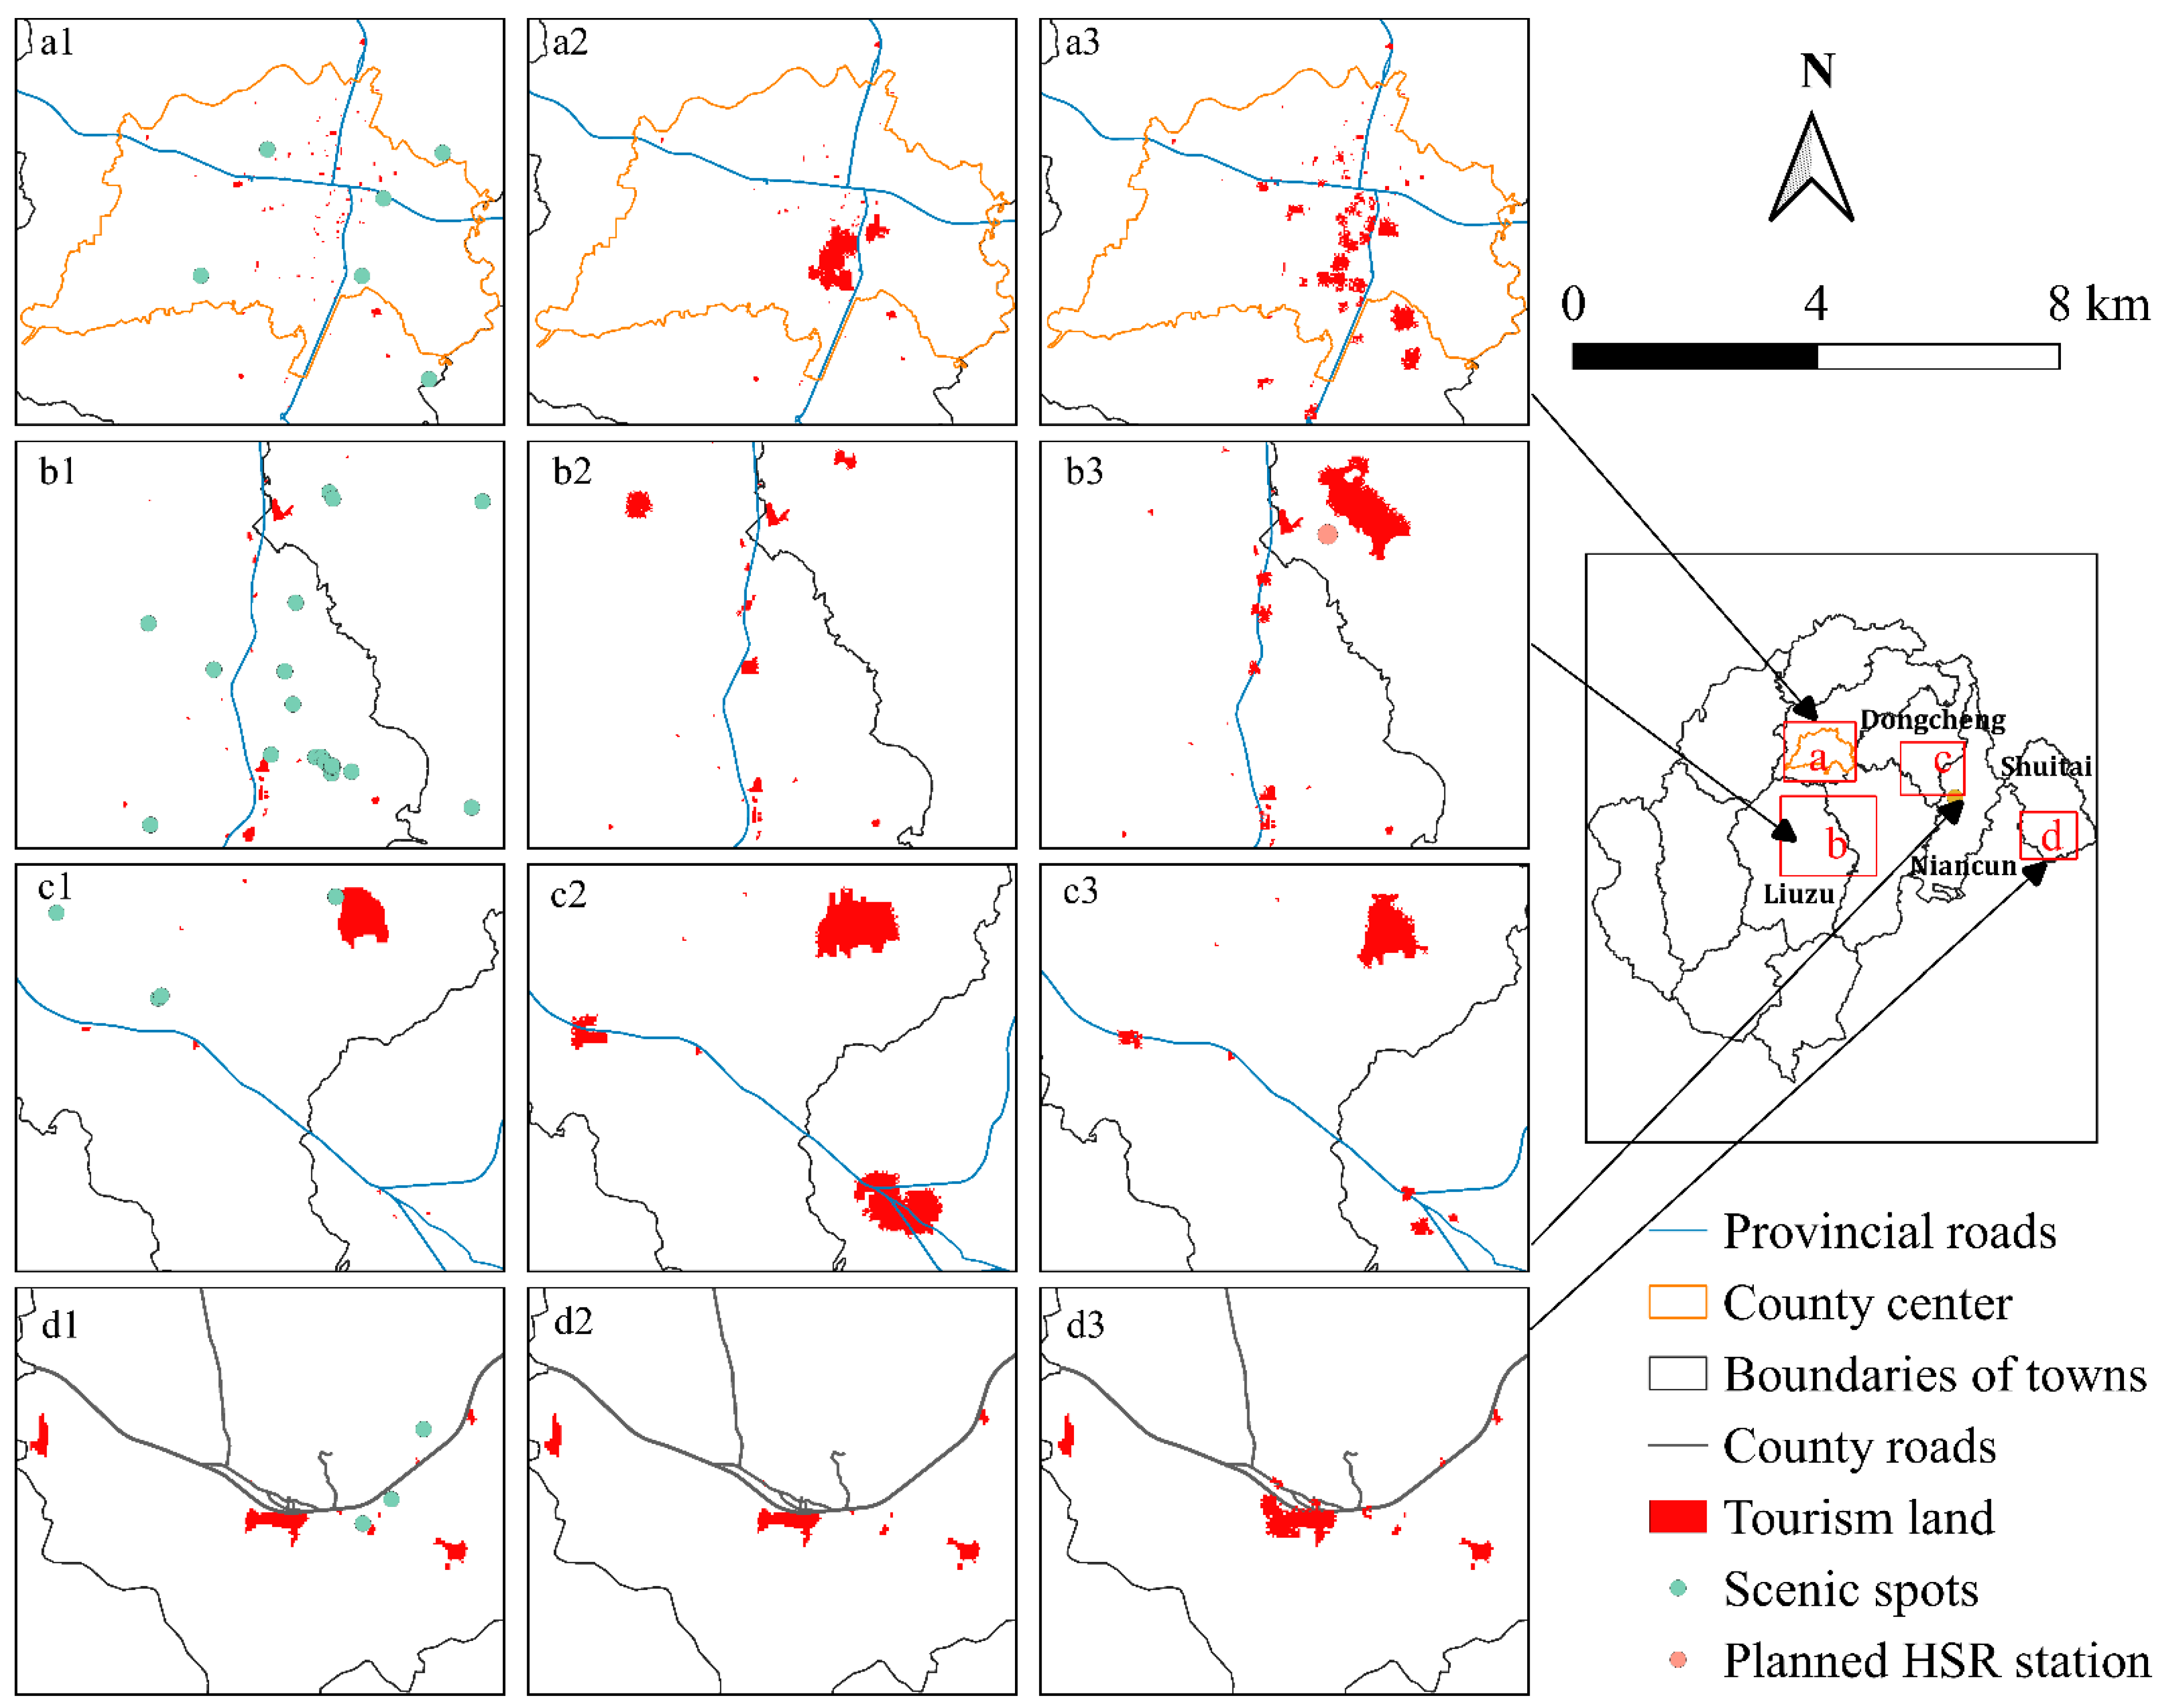
Figure 8.
Source of tourism land transfer from 2020 to 2035 under different scenarios.
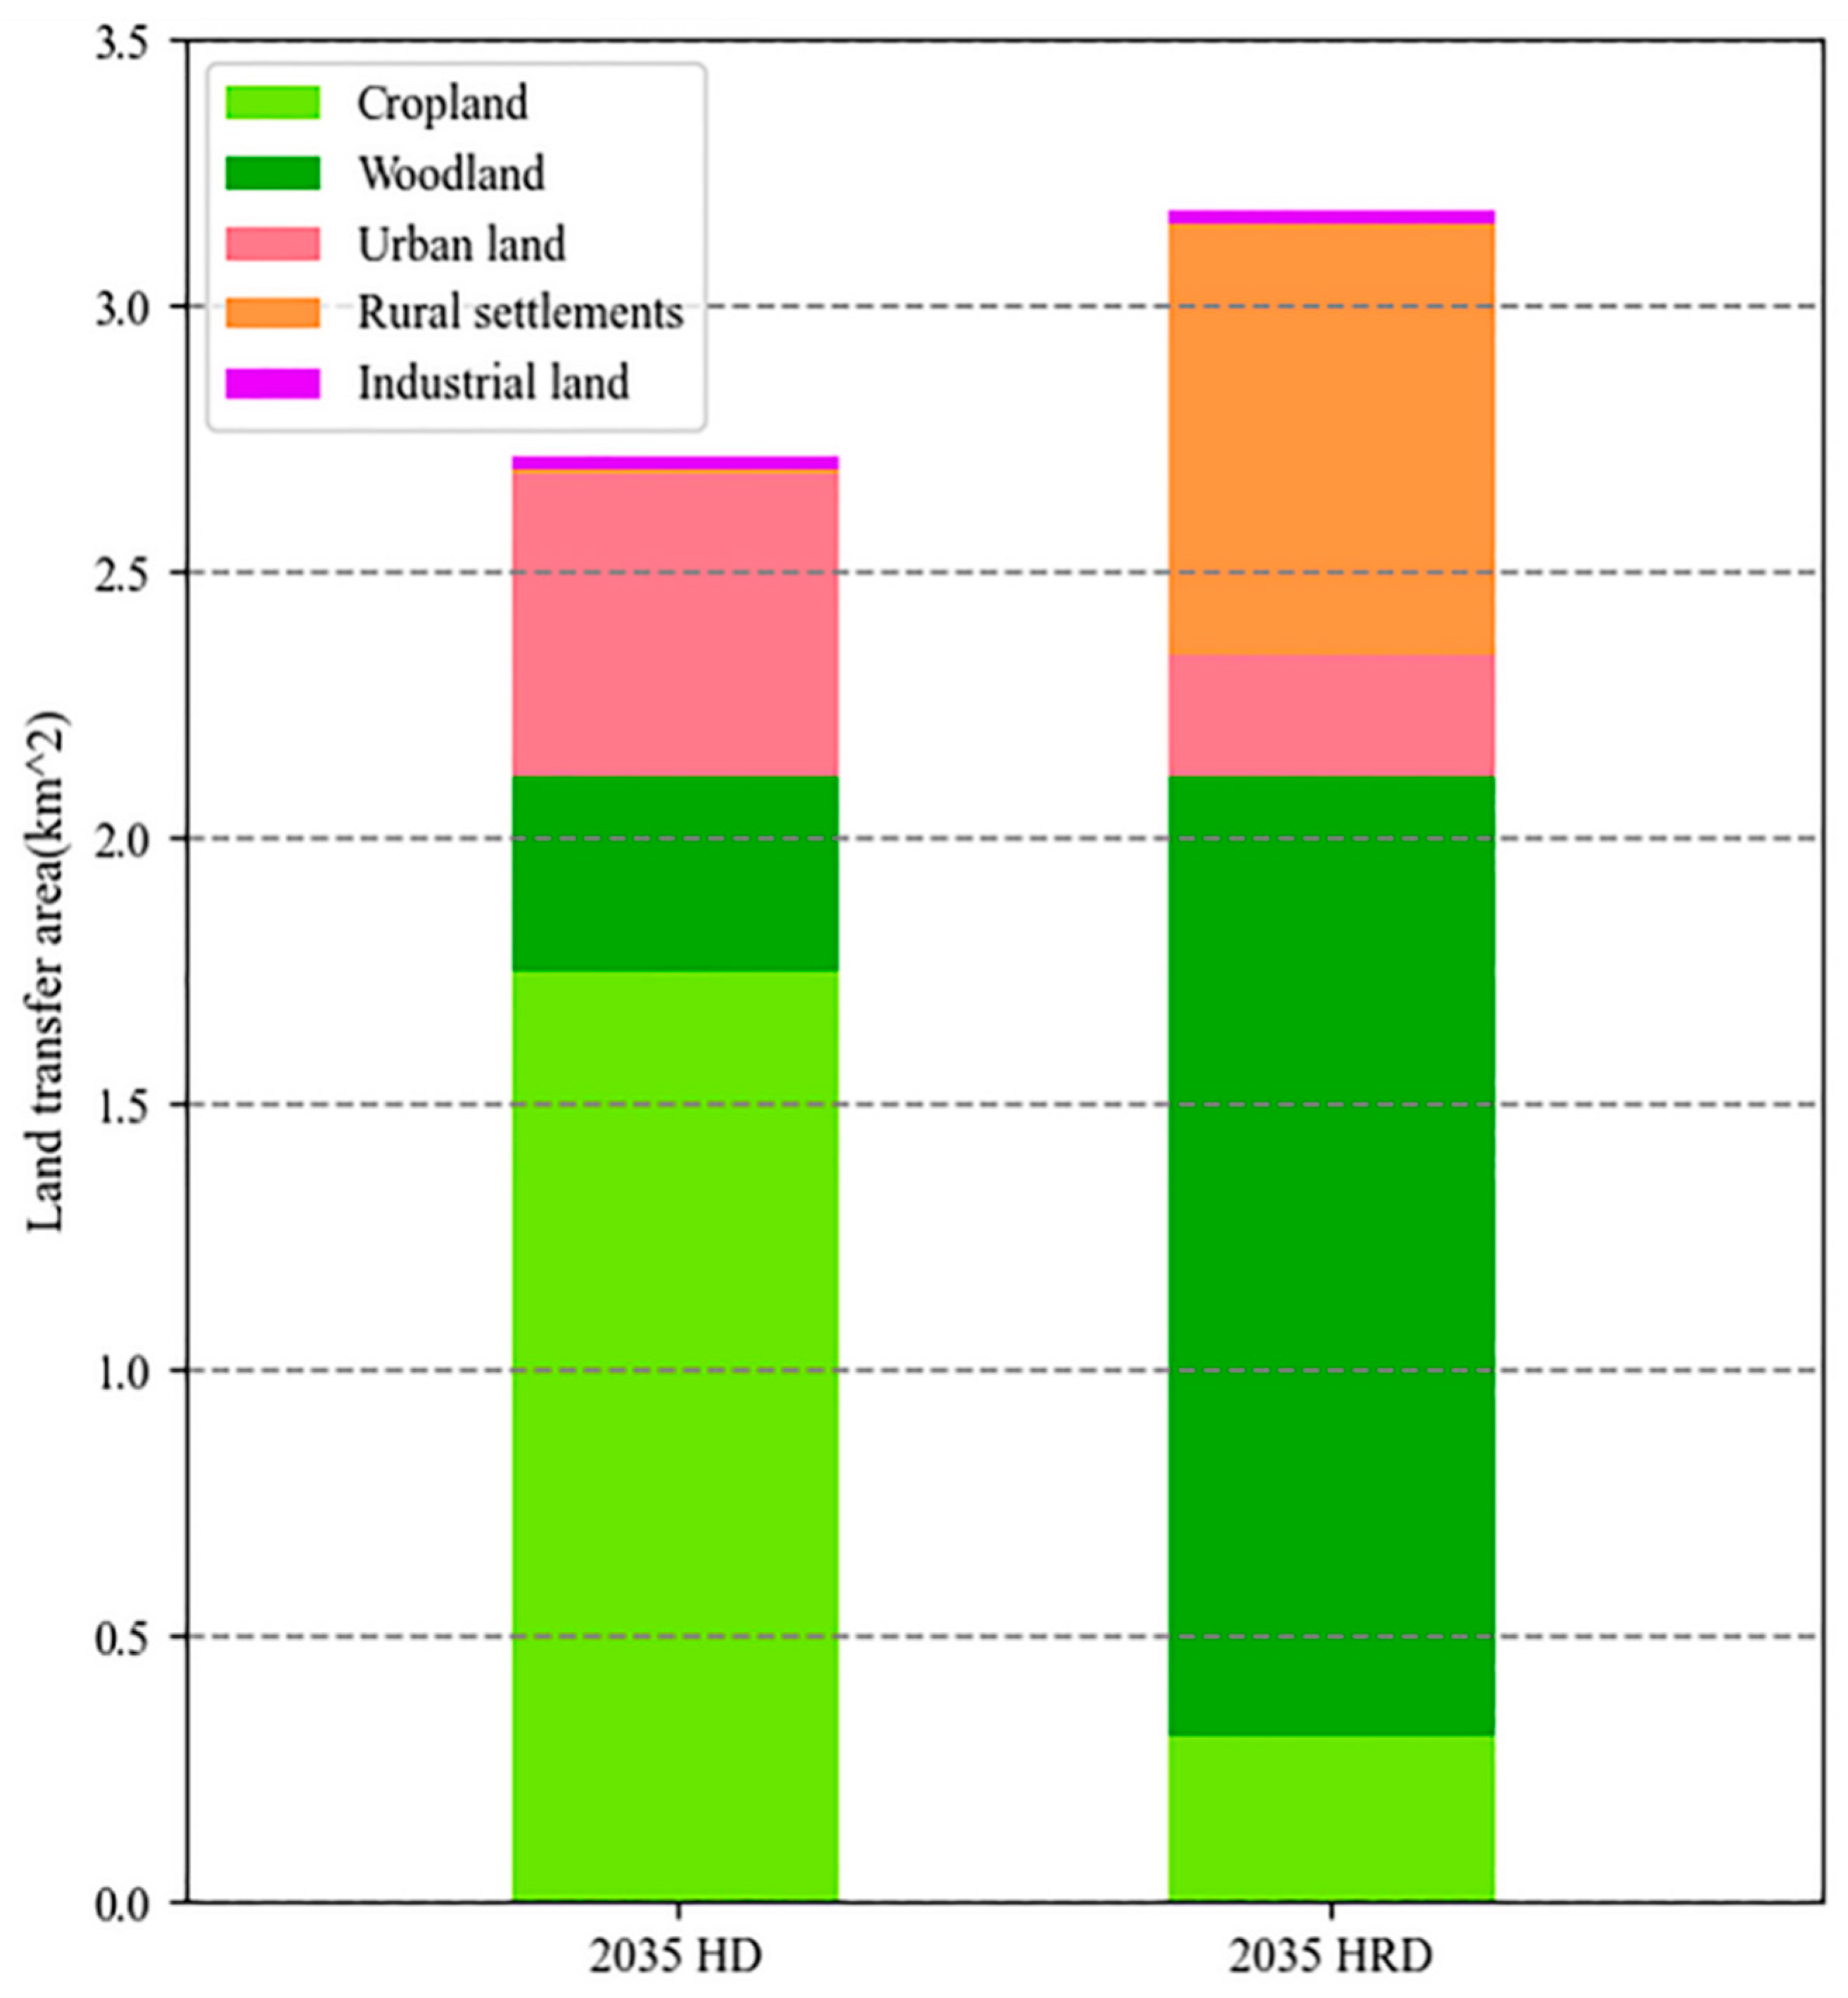
Figure 9.
Contribution of driving factors to tourism land.

Table 1.
Parameter settings in the SD model in both scenarios from 2020 to 2035.
| Type | GGR | UPGR | RPGR | FGR | GACGR | GTGR | PCLI | PAFFI |
|---|---|---|---|---|---|---|---|---|
| HD | 9.8% | 2.5% | −0.11% | 0.171% | 11.2% | 6.0% | 6.0% | 2.7% |
| HRD | 10.5% | 2.7% | −0.05% | 0.175% | 14.1% | 7.2% | 6.5% | 2.9% |
Table 2.
Data description.
| Category | Data | Year | Resolution | Source |
|---|---|---|---|---|
| Identification of tourism land | Satellite image | 2015 and 2019 | 4 m | Google Earth Pro |
| Tourism POIs | 2020 | / | Baidu Map | |
| Development area | Living area in planned TOD | 2020 | / | From Xinxing government |
| Distance to railways | 2019 | 30 m | ||
| Distance to provincial roads | 2019 | 30 m | ||
| Transportation factors | Distance to expressways | 2019 | 30 m | Authors’ calculation based on Amap |
| Distance to county roads | 2019 | 30 m | ||
| Distance to common roads | 2019 | 30 m | ||
| Distance to the county center | 2020 | 30 m | ||
| Location factors | Distance to scenic spots | 2020 | 30 m | Author’s calculation based on POI from Baidu Map |
| Distance to town centers | 2020 | 30 m | ||
| Human activities | Tencent user density (TUD) | 2019 | 500 m | https://cloud.tencent.com/solution/lbs |
| Night-time lighting | 2019 | 500 m | https://eogdata.mines.edu/download_dnb_composites.html | |
| Terrain factors | Elevation | 2019 | 30 m | |
| Slope | 2019 | 30 m | Calculation by slope analysis of elevation in QGIS3.16 |
Table 3.
The simulated area and actual area of each land use in 2020.
| Land Use Types | Cropland | Woodland | Grassland | Water | Urban Land | Rural Settlement | Industrial Land | Tourism Land |
|---|---|---|---|---|---|---|---|---|
| Simulation | 363,781 | 1,138,377 | 52,437 | 28,083 | 18,752 | 55,037 | 30,806 | 2099 |
| reality | 365,118 | 1,136,803 | 53,241 | 27,949 | 18,094 | 54,184 | 30,907 | 2049 |
| Error (%) | −0.37% | 0.14% | −1.51% | 0.48% | 3.64% | 1.57% | −0.33% | 2.44% |
Table 4.
The projected land use demand and change in 2035 under two scenarios (km2).
| Land Use Type | Cropland | Woodland | Grassland | Water | Urban Land | Rural Settlement | Industrial Land | Tourism Land |
|---|---|---|---|---|---|---|---|---|
| HD demand | 316.485 | 968.957 | 48.843 | 23.376 | 22.557 | 47.308 | 46.138 | 4.431 |
| change | −8.583 | −18.641 | 1.546 | −0.372 | 6.273 | −0.402 | 18.774 | 2.633 |
| HRD demand | 314.458 | 968.976 | 47.607 | 22.455 | 26.043 | 47.096 | 46.092 | 5.369 |
| change | −10.611 | −18.621 | −0.917 | −1.293 | 9.758 | −0.614 | 18.728 | 3.571 |
Disclaimer/Publisher’s Note: The statements, opinions and data contained in all publications are solely those of the individual author(s) and contributor(s) and not of MDPI and/or the editor(s). MDPI and/or the editor(s) disclaim responsibility for any injury to people or property resulting from any ideas, methods, instructions or products referred to in the content. |
© 2023 by the authors. Licensee MDPI, Basel, Switzerland. This article is an open access article distributed under the terms and conditions of the Creative Commons Attribution (CC BY) license (https://creativecommons.org/licenses/by/4.0/).
Share and Cite
MDPI and ACS Style
Jiao, Z.; Li, S.; Lin, Z.; Lai, Z.; Wu, Z.; Liu, L. Incorporating High-Speed Rail Development Scenario for Tourism Land Use Simulation: A Case Study of Xinxing County, China. Land 2023, 12, 1170. https://doi.org/10.3390/land12061170
AMA Style
Jiao Z, Li S, Lin Z, Lai Z, Wu Z, Liu L. Incorporating High-Speed Rail Development Scenario for Tourism Land Use Simulation: A Case Study of Xinxing County, China. Land. 2023; 12(6):1170. https://doi.org/10.3390/land12061170
Chicago/Turabian StyleJiao, Zhenzhi, Shaoying Li, Zhangping Lin, Zhipeng Lai, Zhuo Wu, and Lin Liu. 2023. "Incorporating High-Speed Rail Development Scenario for Tourism Land Use Simulation: A Case Study of Xinxing County, China" Land 12, no. 6: 1170. https://doi.org/10.3390/land12061170
Note that from the first issue of 2016, this journal uses article numbers instead of page numbers. See further details here.