Article

Spatial Distribution and Associated Risk Assessment of Heavy Metal Pollution in Farmland Soil Surrounding the Ganhe Industrial Park in Qinghai Province, China

1
Shaanxi Key Laboratory of Land Consolidation, School of Land Engineering, Chang’an University, Xi’an 710054, China
2
School of Earth Science and Resources, Chang’an University, Xi’an 710054, China
3
Qingdao Hisense School, Qingdao 266000, China
4
Xi’an Meihang Remote Sensing Information Co., Ltd., Xi’an 710199, China
*
Author to whom correspondence should be addressed.
Land 2023, 12(6), 1172; https://doi.org/10.3390/land12061172
Submission received: 8 May 2023 / Revised: 28 May 2023 / Accepted: 30 May 2023 / Published: 1 June 2023

Abstract

:
The farmland around the industrial areas in the Upper Yellow River is crucial for agricultural production but is vulnerable to contamination from the surrounding industries. This research focused on analyzing the spatial distribution and environmental risks of heavy metal pollution in the farmland around the Ganhe Industrial Park in the Qinghai–Tibet Plateau. A total of 138 surface soil samples were collected, and the concentration of seven heavy metals (Cd, As, Pb, Cr, Cu, Ni, and Zn) was analyzed using the random forest (RF) model. Pollution indicators, including the pollution index and Nemero index, were used to evaluate the pollution levels of soil heavy metals. The human health and ecological risks were estimated using the hazard index (HI) and the potential ecological risk index (RI). Cd and Zn were identified as the primary soil pollutants in the study area, with Cd being more concentrated than other heavy metals. Heavy metal contamination was most severe in the central–eastern region of the study area, with a ring-shaped distribution, which correlated with the presence of zinc smelting and chemical plants. Furthermore, the study revealed that soil heavy metal contamination posed a health threat to the local population, with children being particularly vulnerable to non-carcinogenic risks when the HI was 1.21 and to potential carcinogenic risks when the CR was 2.27 × 10⁻⁵. Additionally, heavy metal pollution caused a moderate to high ecological risk in 56.4% of the samples. The results highlighted the severe impact of soil heavy metal pollution on the delicate ecosystem of the Upper Yellow River and Qinghai–Tibet Plateau. The government should take action to improve soil environment management and prevent heavy metal pollution to protect the health of the local population and the ecological environment.

1. Introduction

Soil heavy metal pollution is considered to be one of the most serious environmental problems that can lead to health risks for humans and animals [1,2,3,4,5,6]. Heavy metals could enter the soil through various pathways, including bedrock weathering, precipitation, dust settlement, and waste discharge [7,8,9]. Wastes discharged by anthropogenic activities, such as mining, metal processing and smelting, chemical production, factory emissions, and sewage irrigation, are major sources of heavy metal pollution in soil [10,11,12,13]. Prior research has demonstrated that the elevated concentration of heavy metals in soil poses a threat to crops, animals, and human health through direct exposure (such as ingestion, dermal absorption, and inhalation) or via food chains [14,15,16,17,18,19,20,21].
Heavy metals in soils are difficult to degrade and decontaminate [8]. The presence of heavy metals in soils is a serious concern for soil environment management and heavy metal pollution prevention. Several statistics-based methods have been developed to evaluate the soil heavy metal pollution degree, including pollution index (Pi), geo-accumulation index (Igeo), and Nemero index (P), which use classification criteria to assess pollution levels [8,22,23,24]. These methods could consider the influence of natural geological effects and anthropogenic activities on heavy metals in soil, with the metal background value as a parameter [25,26]. However, the relationship between the concentrations and various predictor variables often reveals non-linear features, making it challenging to predict the spatial distribution and influence factors of soil heavy metals. The random forest model (RF) has been used to overcome this challenge and predict the spatial distribution and influence factors of soil heavy metals [27]. In addition to pollution evaluation, risk assessment is also essential for heavy metal contamination. The potential ecological risk assessment (RI) is commonly used to assess the risk posed to the ecological environment and human health [8,28,29,30], while the Health Risk Assessment (HRA) is used to quantitatively assess the carcinogenic and non-carcinogenic risks of human exposure to certain contaminants [3,28].
The combination of these methods can provide a more comprehensive evaluation of the potential ecological and health risk of toxic metals in soil. However, most previous studies were carried out mainly in floodplains, ports, mining areas, or urban–rural ecotones, with few studies conducted in industrial park areas with high altitudes [1,2,3,11,12]. High-altitude areas have different characteristics for the migration and transformation of heavy metals, including low temperature, underdeveloped soil, and sensitive ecosystem, making it necessary to study heavy metal contamination in these areas as well.
The Upper Yellow River is located in the north–eastern Qinghai–Tibet Plateau, which is an area that makes up 16.2% of the total area of the Yellow River Basin [24]. The area has an average altitude of approximately 3500 m and is known as the “third pole” of the Earth due to its sensitivity to climate change in Asia and the Northern Hemisphere [31]. The most widely distributed non-zonal vegetation types in the region are alpine meadow and alpine steppe [31]. As the largest industrial park in the Upper Yellow River, the high-pollution factories in the Ganhe Industrial Park may pose a threat to the residents of the whole county, the farmland, and even the ecosystem of the Upper Yellow River and Qinghai–Tibet Plateau, due to the release of contaminants to the water, air, and soil (Figure 1). Therefore, this study aims to quantitatively evaluate the pollution status and potential risks of heavy metal concentrations in Ganhe Industrial Park by applying various methods, such as the random forest model, pollution index, Nemero index, potential ecological risk assessment, and health risk assessment [32,33]. The study not only investigated the relative environmental, economic, and natural conditions in the study area but also estimated human health and ecological risks by using the hazard index (HI) and potential ecological risk index (RI) to provide theoretical support for contamination management for the industrial park and even for the Upper Yellow River. The findings of the study could confirm the extent of heavy metal pollution in the study area, as well as the potential risks associated with this pollution, to maintain a sustainable and healthy agricultural system in the Upper Yellow River, which could also be used in similar regions in China and other developing countries.

2. Materials and Methods

2.1. Study Area

The study area is located in the north–eastern Qinghai Province, which is a typical temperate continental climate region characterized by hot summers, cold winters, and low annual precipitation. The area covers approximately 200 km2, with coordinates ranging from 36°29′49″ N~36°36′47″ N to 101°25′44″ E~101°35′2″ E (Figure 1). The elevation gradually declines from south to north, ranging from 3600 m to 2100 m, and the terrain belongs to the Qinghai–Tibet Plateau.
The land use types are dominated by farmland, grassland, and construction land, and the farmland in this study’s area is mainly used for growing grain crops (Figure 1). The soil types in the area include Chernozem, Kastanozem, Calcisols, and Cryosols, according to the classification system of the Food and Agriculture Organization (FAO) [34]. The residential and factory estates extend along two parallel drainages in the north-south direction, interspaced by farmlands and pastures. The factories include various metals (aluminum, copper, lead, zinc, iron), smelting plants, chemical plants, inorganic salt manufacturing plants, etc. The soil in the study area is heavily polluted with heavy metals, mainly as a result of industrial contaminants released into the air, water, and soil, as well as excessive use of pesticides and fertilizers.

2.2. Sampling and Analysis

A total of 138 soil samples were collected between 29 September 2020 and 3 October 2020. Semi-random distribution method was used for selecting the sampling points, taking into account the accessibility and spatial coverage of the study area (Figure 1). For each sampling point, a 20 m × 20 m square was built in the center, and five samples were collected from the four corners and the center of each square. The collected soil samples were mixed to obtain a composite sample for each sampling point. The soil samples were collected from a depth of 0–20 cm from the natural surface and were approximately 2 kg in weight. Rocks and debris were removed from the samples. The soil samples were air-dried, crushed, and sieved through 200 mesh polyethylene for analysis. The heavy metal concentrations of Cd, As, Pb, Cr, Cu, Ni, and Zn were analyzed using inductively coupled plasma mass spectrometry (ICP-MS, Thermo Fisher X7, Bremen, Germany) instruments following digestion with an HCl-H2O-HF-HNO3 mixture [35]. The analysis was conducted in a laboratory with an environment temperature of 24 °C and a humidity of 40%. The ICP-MS detection limits for all elements are calculated as three times the standard deviation of the calibration blank measurements (1:1 v/v HNO3: MQ-water); instrumental stability and tuning were checked using a solution of 10 µg/L of Li, Be, Bi, Ce, Co, In, Pb and U in HNO3 (2% v/v), and 156CeO+/140Ce+<0.3%. Internal standardization was performed using 103Rh for all elements. For ICP-MS determination, certified reference materials (GSS-3a and Gss-5a), blank, and samples were measured for quality control. The GSS-3a and Gss-5a were used for the validation of the measurement. The measured results were compared with the certified reference values, and the results were within the 95% confidence level. Moreover, repeated analysis of samples from different sampling areas was adopted, and the results of duplicate samples were consistent within the margin of error.

2.3. Risk Assessment Methods

2.3.1. Random Forest Model

The RF model was used to establish the non-linear relationship between the independent variables and the dependent variable [27]. The independent variables include factory distance, slope, road distance, annual rainfall, average annual temperature, and elevation of the samples, while the dependent variable is heavy metals in the soil.
The model-building process involved several steps [27]. Firstly, K bootstrap samples were selected using the self-expanding sampling method to train the regression tree. Then, m subsets were randomly extracted from M feature values, and the best subset was selected when the tree was split (m ≤ M). Each decision tree was built without pruning and allowed to grow to the maximum extent. Finally, the prediction results were obtained through voting.
In the modeling process, the research area was divided into 900 (30 × 30) rectangular grids with a grid size of 500 m, ensuring that the number of training grids was greater than 10% of the total grid. Sample points located in the same grid were eliminated if they had the same content values, resulting in only 136 sample points being used. The optimal parameters and accuracy of the training sets corresponding to verification sets are shown in Table 1, which was generated during the model evaluation process.
The sample dataset of 136 points was split into 70% for modeling and 30% for verification. A Python program was developed using ArcGIS Pro 2.5 to optimize the model parameters in order of the number of trees, the maximum tree depth, the number of random sampling variables, the minimum leaf size, and the accuracy of the training, and verification sets was measured (Table 1).

2.3.2. Pollution Index

The pollution index is a single-factor assessment method used to evaluate heavy metal pollution and the associated pollution risk [10,36]. It can be calculated by dividing the actual concentration of a specific heavy metal by the corresponding background values of the same metal in the soil, as indicated in the provided Equation (1)
P i = C i / S i
where Pi represents the pollution index of the heavy metal i; Ci represents the chemical analyzed value of soil heavy metal i; and Si represents the standard value of soil heavy metal quality. The standard value of soil heavy metal quality is determined by using the screening values defined in the Soil Environmental Quality Standard (GB 15618-2018) issued by the Chinese Ministry of Environmental Protection in 2018 [37].
A higher value of Pi indicates more severe contamination of the soil. When Pi is less than or equal to 1, the soil is considered uncontaminated. A Pi value between 1 and 2 indicates that the soil is low to moderately contaminated, while a Pi value between 2 and 3 indicates that the soil is moderate to heavily contaminated. Finally, if Pi is greater than 3, the soil is considered heavy to extremely contaminated [8].

2.3.3. Nemero Index

The Nemero index is a useful tool for assessing the environmental risk of pollutants, specifically heavy metals, in soil. The index takes into account the different toxic effects of each heavy metal and calculates a comprehensive measure of the environmental risk based on their concentrations. The formula for calculating the Nemero index is as follows:
P = 1 n C i S i 2 + C i S i MAX 2 2
where P is the Nemero index; C i S i MAX 2 is the maximum value of the pollution index of the heavy metal; 1 n C i S i 2 is the average value of the individual pollution index. The quality of the soil environment is classified into 5 levels based on the Nemero index, according to Table 2 [38].

2.3.4. Potential Health Risk Assessment

Health Risk Appraisal (HRA) is a quantitative method used to assess the human risk of exposure to environmental pollutants, including heavy metals [39,40]. Ingestion, inhalation, and dermal absorption are the three primary pathways through which heavy metals can enter the human body [41,42]. According to the model provided by the US Environmental Protection Agency (USEPA), the chronic daily intake (CDI) of the seven heavy metals through multiple exposure pathways was calculated using the following equations:
CDI ingest = C soil × IngR × EF × ED × CF BW × AT
CDI inhale = C soil × InhR × EF × ED PEF × BW × AT
CDI dermal = C soil × SA × AF × ABS × EF × ED × CF BW × AT
where C soil represents the average of the measured concentration of each soil heavy metal for all the samples in the study area (mg·kg−1). CDIingest, CDIinhale, and CDIdermal represent the potential intake value of each heavy metal through ingest, inhale, and dermal absorption. The other parameters in Equation (3)–(5) are shown in Table 3.
The hazard quotient (HQ) and hazard index (HI) are commonly used metrics in human health risk assessments for evaluating the potential chronic effects of exposure to multiple heavy metals. The HQ is calculated by dividing the estimated exposure level of a particular heavy metal over a specified time period by a reference dose (RfD) for a similar exposure period. The RfD is an estimate of the amount of a substance that a person can be exposed to on a daily basis over a lifetime without appreciable health risks [43]. HQ and HI are calculated using Equations (6) and (7), respectively:
HQ = CDI / RfD
HI = HQ = HQ ingest + HQ inhale + HQ dermal
where RfD is the reference dose of heavy metals (mg·kg−1) and is different for each heavy metal, as shown in Table 3 [43]. HI > 1 indicates that the environment has a serious potential for non-carcinogenic risk; HI < 1 suggests that there is no significant potential for non-carcinogenic risks in the environment [44].
The Carcinogenic Risk (CR) assessment methodology is utilized to estimate the risk of carcinogenesis for humans who are exposed to the external environment via three distinct pathways [45]. The Lifetime Carcinogenic Risk (LCR) is calculated as the aggregate of the three CRs [45]. Equations (8) and (9) are used to compute both CR and LCR:
CR = CDI × CSF
LCR = CDI ingest × CSF + CDI inhale × CSF + CDI dermal × CSF
where CSF refers to the carcinogenic slope factor of heavy metals and is different for each heavy metal (Table 4). According to the USEPA, for heavy metals, the minimum CR value is 1.00 × 10⁻⁶, and CR values between 1.00 × 10⁻⁶ and 1.00 × 10⁻⁴ suggest no severe carcinogenic risk to human health [6].

2.3.5. Potential Ecological Risks

The potential ecological risk index (RI) was a widely used method for assessing the potential ecological risk of soil heavy metal pollution. The RI considers both the concentration of heavy metals in the soil and the potential ecological impact of these metals [8,28,47]. This method takes into account various factors, such as the concentration of heavy metals, their toxicity, environmental quality standards, and ecological effects, in order to evaluate the potential impact of heavy metals on ecosystems [8]. The RI index can be calculated using the following equation:
RI = i m E r i = i m T r i × C i C n i
where RI is the comprehensive potential ecological risk index; E r i is the individual potential ecological hazard index value of heavy metal i; T r i is the toxicity factor value of heavy metal i [48]; Ci is the measured content of heavy metal i; C n i is the reference value of heavy metal i. The toxicity factor values of Pb, Cu, Cr, Cd, Zn, Ni, and As are 5, 5, 2, 30, 1, 5, and 10, respectively [47].
Based on the classification criteria of E r i and RI proposed by Hakanson (1980), E r i < 40 means low potential ecological risk; 40 ≤ E r i < 80 indicates moderate potential risk; 80 ≤ E r i < 160 represents a considerable potential risk; 160 ≤ E r i < 320 means high potential risk; E r i ≥ 320 indicates significantly very high risk. Four categories of RI values define, which are low risk (RI < 150), moderate risk (150 ≤ RI < 300), considerable risk (300 ≤ RI < 600), and high risk (RI ≥ 600) [47].

3. Results

3.1. Characteristics of Heavy Metal Contamination

3.1.1. Statistics of the Soil Heavy Metals

The statistics of the soil heavy metals concentrations are listed in Table 5. Zn had the largest mean value (147 mg·kg−1), followed by Cr (89 mg·kg−1), while Cd had the lowest mean value of 1.52 mg·kg−1. The obvious variations occurred in the measured heavy metals concentrations, varying between 0.16 and 21.8 mg·kg−1 for Cd, 3.68 and 20.8 mg·kg−1 for As, 17.0 and 223 mg·kg−1 for Pb, 47.2 and 389 mg·kg−1 for Cr, 16.0 and 46.1 mg·kg−1 for Cu, 21.3 and 93.2 mg·kg−1 for Ni, 48.6, and 1.54 × 10³ mg·kg−1 for Zn. The following metals which exceeded level 1 (the risk screening values in the standard [37]) were 65 samples (47.1% of total) for Cd, 13 samples (9.40%) for Zn, 2 samples (1.40%) for Cr, 1 sample (0.70%) for Pb, and none for the others (As, Cu and Ni). For Cd, 13 samples even exceeded level 2 (the risk intervention values in the standard).

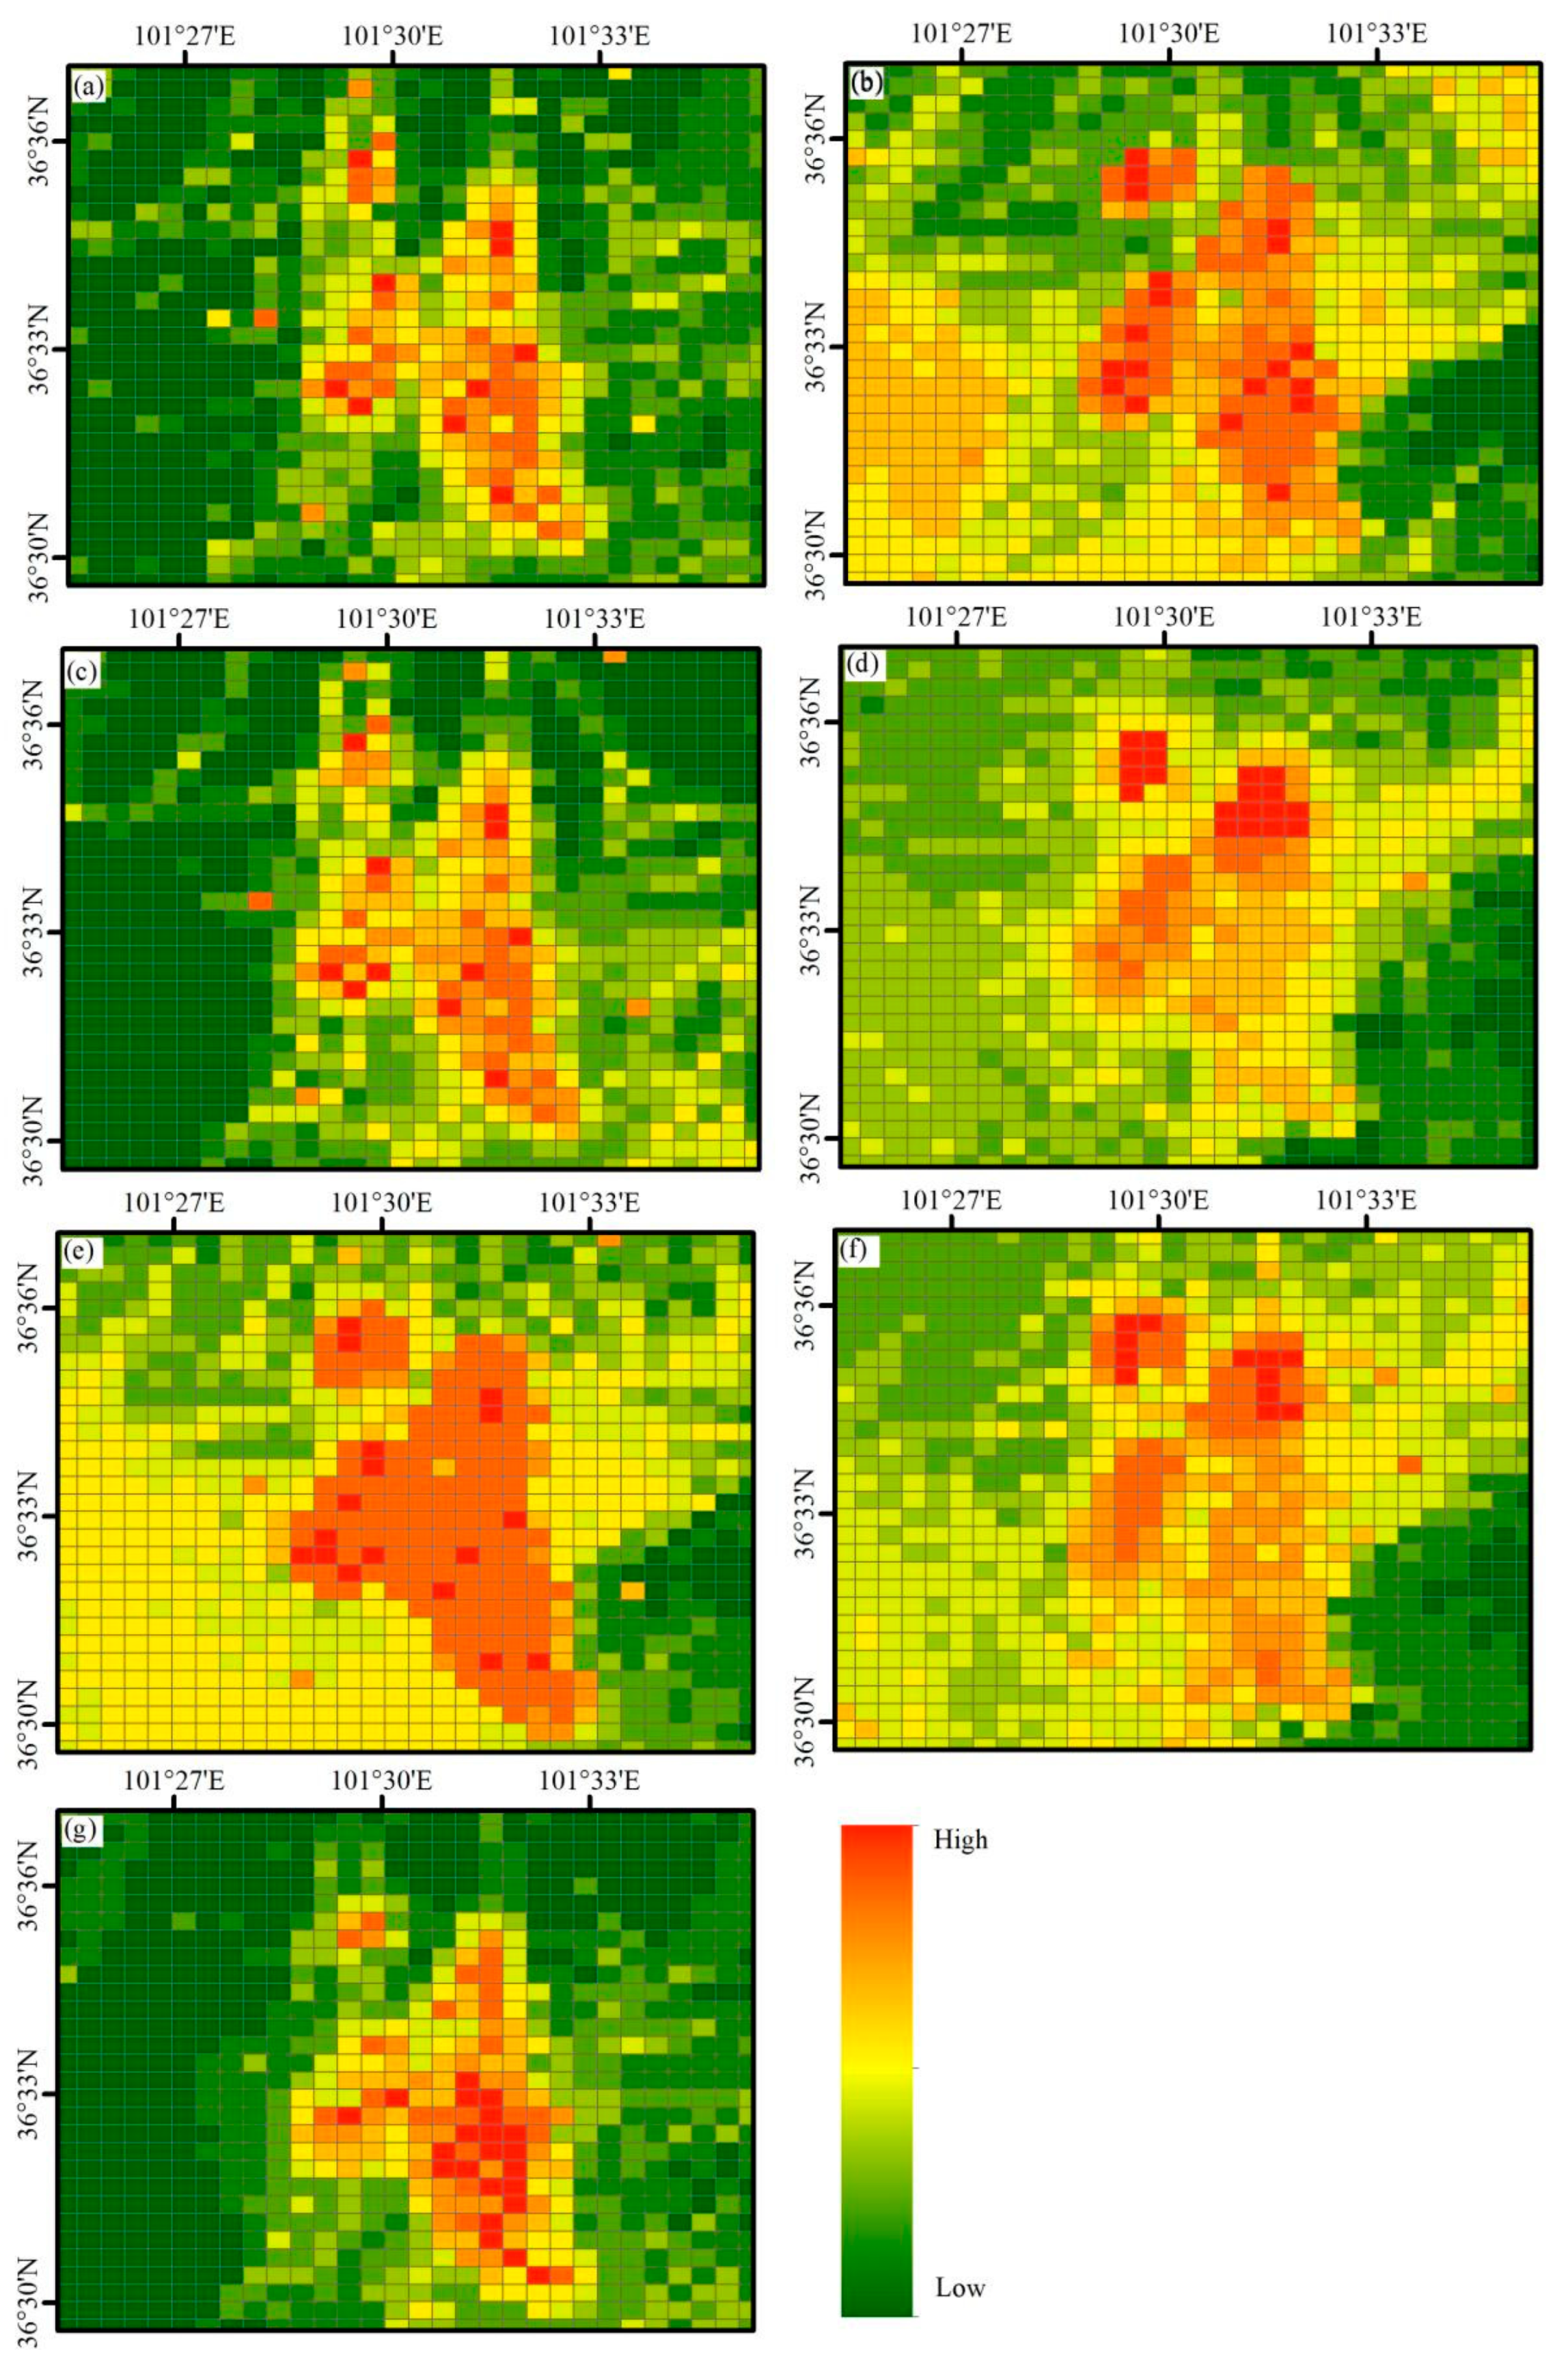
3.1.2. Spatial Distribution of RF Model

The results of the RF model pass the significance test with a level of 0.01. The accuracy of seven heavy metals was greater than 0.5, and the R2 of Cd, Cr, Ni, and Zn was above 0.8 (Table 1). From the perspective of the precision of the validation set, the precision for the other six heavy metals except As was greater than 0.5 (the R2 of four heavy metals, Cd, Cr, Ni, and Zn, is above 0.6). Finally, the results were visualized in ArcGIS Pro 2.5. The weights of six factors (factory distance, slope, road distance, annual rainfall, annual average temperature, and elevation) were calculated (Figure 2 and Figure 3).
Cd, Pb, and Zn had similar spatial distribution (Figure 2), with high pollution risk in the middle–east of the study area and low risk in the west and north–east regions. The high-risk regions were mainly concentrated in the concentrated areas of factories and enterprises. Similarly, Cr and Ni had similar spatial distributions, with high pollution risk in the north of the central region and low risk in the south–east and north–west regions. Cu had a different spatial distribution, with high pollution risk mainly concentrated in the middle of the study area and medium-risk areas in the south–west. However, the results for As were poor and did not accurately reflect the spatial distribution of pollution risks due to the relatively low R2.
The relative importance of six independent factors (factory distance, slope, road distance, annual rainfall, annual average temperature, and elevation) was analyzed (Figure 3). Specifically, the factory distance factor had the highest weight in the modeling process for all seven heavy metals. Precipitation and annual average temperature were also important factors in predicting the pollution risks of Cr and Ni. The slope factor was important for predicting the pollution risks of Cd, Pb, and Cu. For As, the weight of the factory distance factor is not significantly higher than the weights of the other factors, and the weights of the other five factors are relatively equal. Considering the poor RF modeling accuracy of As (Figure 2), it can be inferred that none of the six factors is the main determinant of As soil contamination.

3.2. Contamination Evaluation of Heavy Metals

3.2.1. Single Pollution Index Method
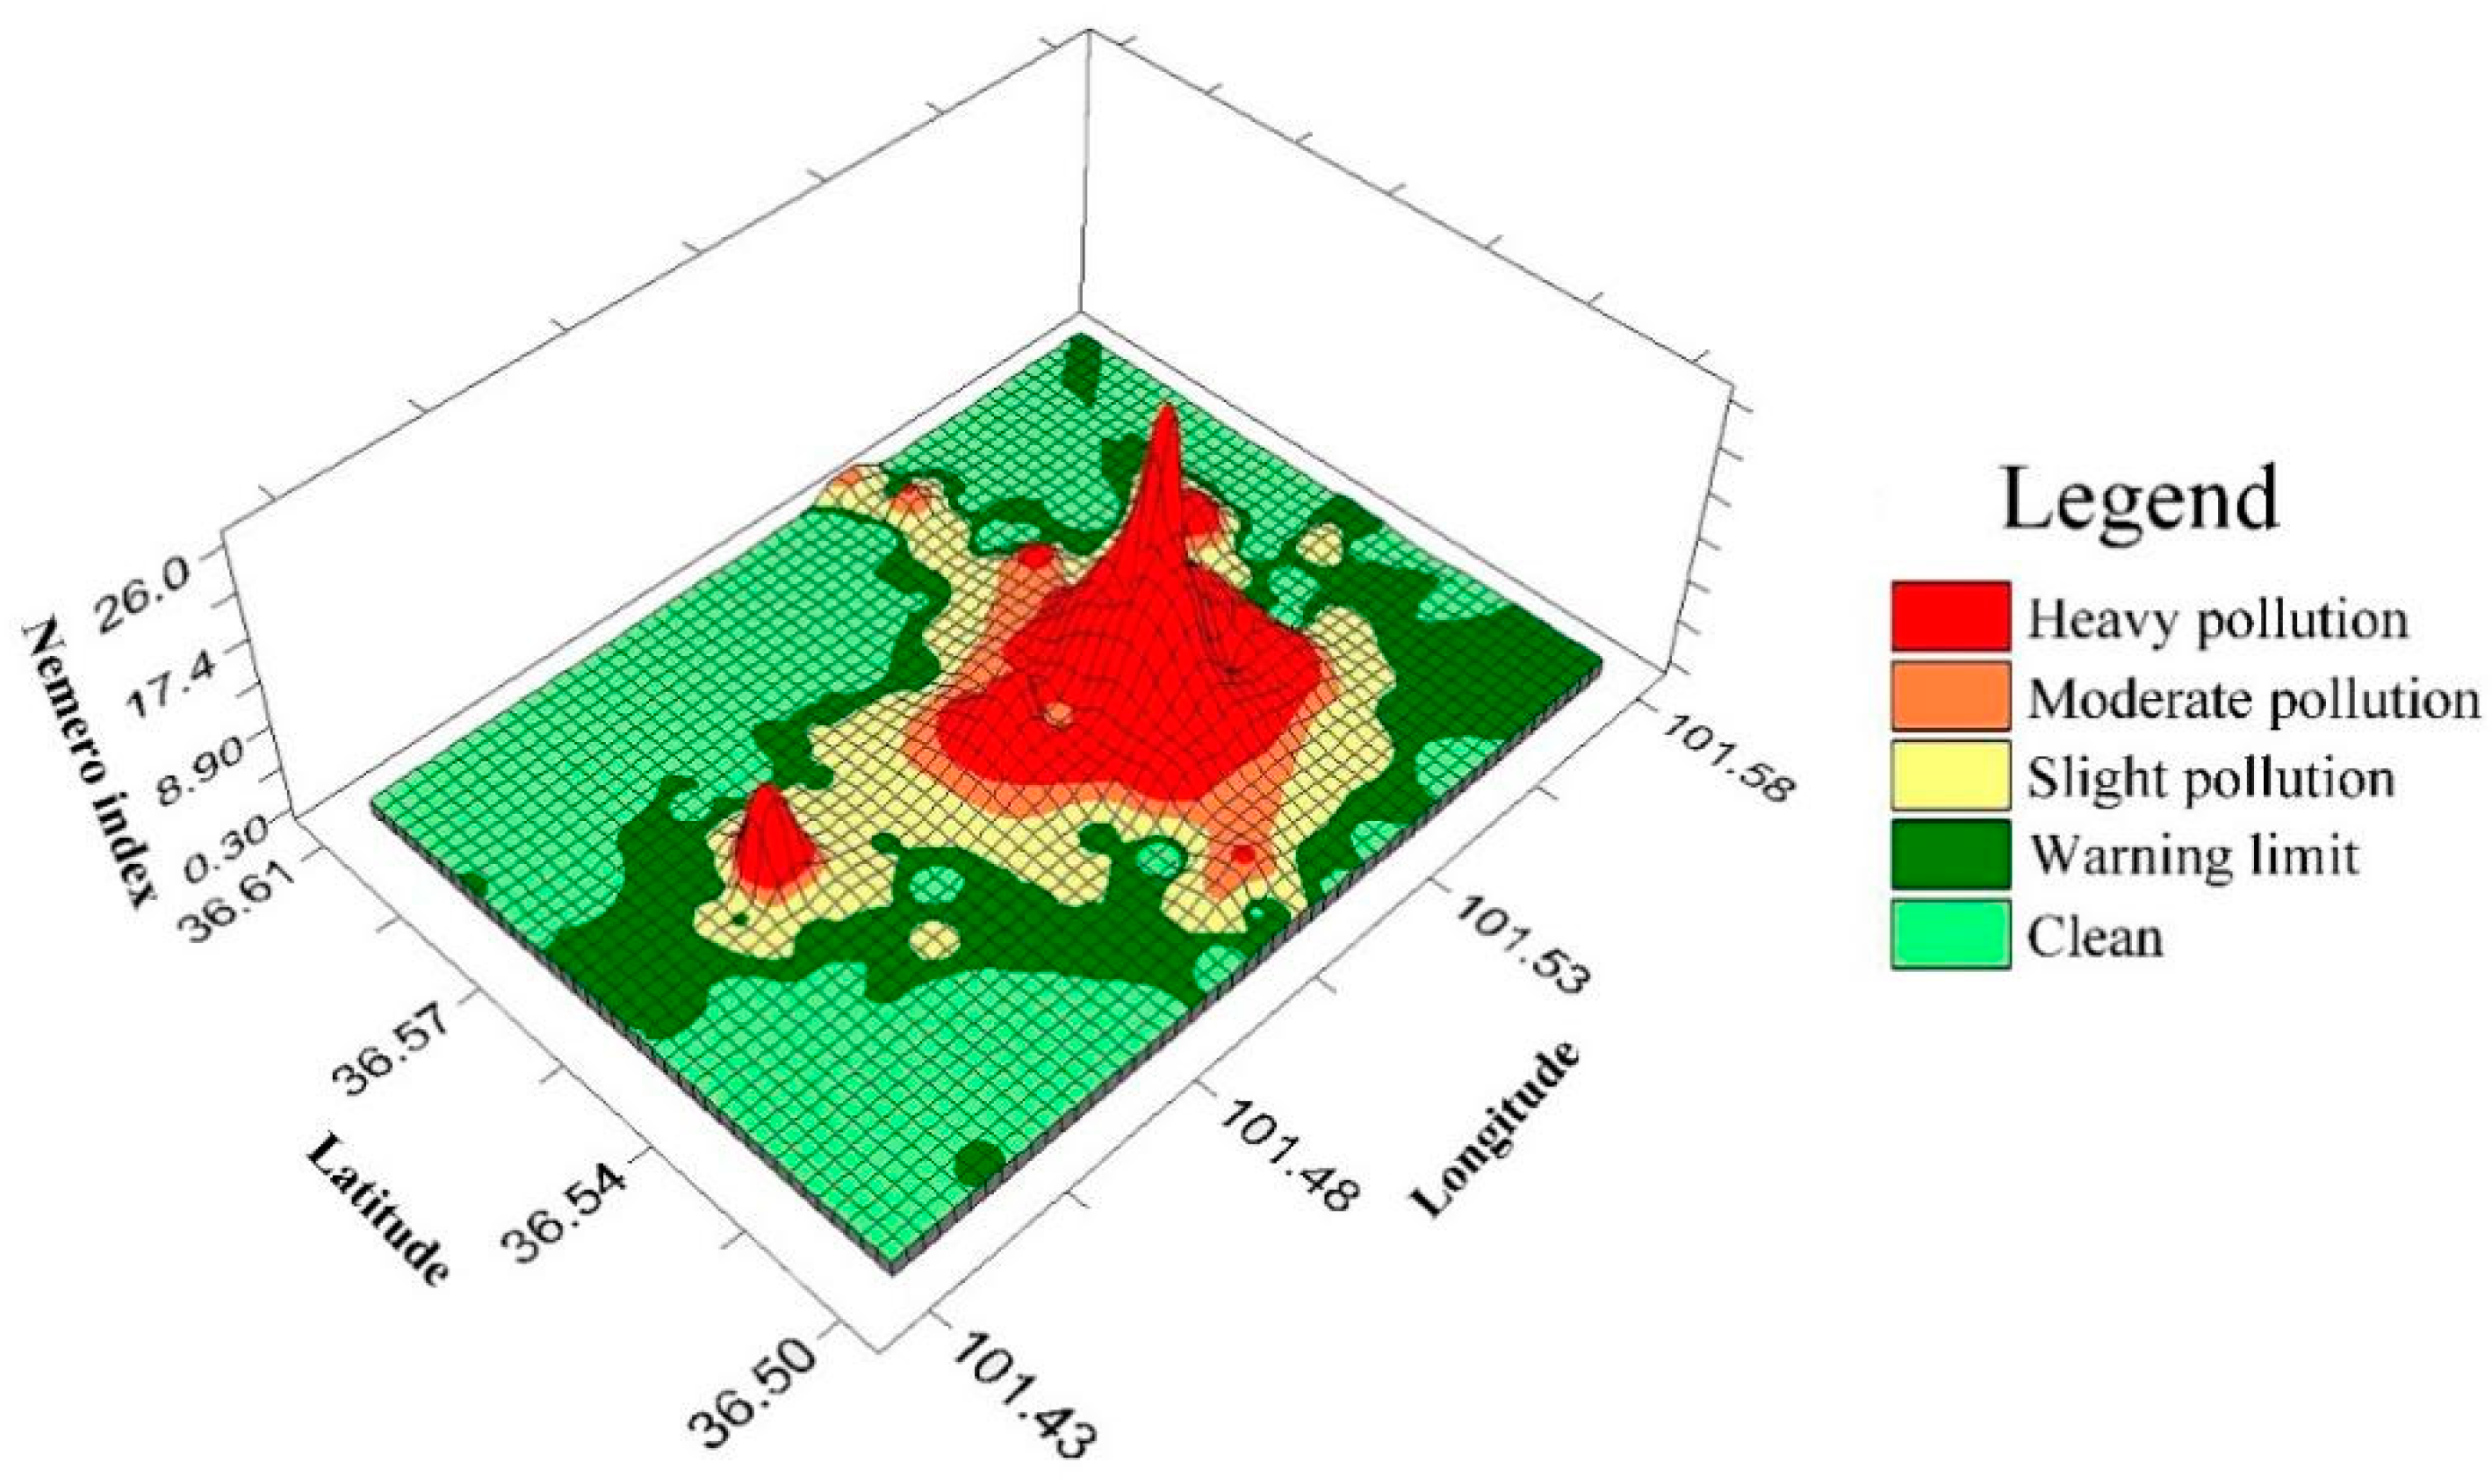
The mean values of Pi for each heavy metal, from highest to lowest, were as follows: Cd (2.53), Zn (0.49), As (0.47), Cr (0.36), Cu (0.26), Pb (0.21), and Ni (0.19). Cd was the highest pollutant among all the tested metals. Based on the classification criteria for different levels of pollution, the Pi values indicated that the pollution level of Cd was in the moderately to heavily contaminated class. The pollution levels of the other heavy metals (Zn, As, Cr, Cu, Pb, and Ni) were at uncontaminated levels based on the mean values of Pi (Figure 4). However, when considering the maximum value, Pi, Pb, and Cr were at low to moderately contaminated levels, while Cd and Zn were at heavy to extremely contaminated levels. The other heavy metals (As, Cu, and Ni) showed an unpolluted tendency.
Overall, the study area was contaminated with Cd, and there might be some contamination with Zn, Pb, and Cr, depending on the maximum values of Pi. The other heavy metals were not likely to cause significant pollution in the area.

3.2.2. Nemero Index

The mean value of the Nemero index in the study area was 1.86, which indicated that the area was slightly polluted, but the precaution levels for the samples had varying levels of pollution, with some samples being only slightly polluted and others being seriously polluted. The results indicated that more than 56.5% of the samples were above the safety level (34 warning level samples, 14 mild pollution level samples, 7 moderate pollution level samples, and 23 severe pollution level samples).
The spatial interpolation and classification of the Nemero index values were carried out using inverse distance weighting (IDW) interpolation [29,36]. Figure 5 shows that the pollution levels in the study area ranged from the safety level to the seriously polluted level. The study identified regions with slightly polluted levels, moderately polluted levels, and seriously polluted levels, which covered areas of 34.3 km2, 11.2 km2, and 22.0 km2, respectively. The polluted areas were mainly concentrated in the central–eastern region, which correlated well with relevant Cd concentrations, as shown in Figure 4.

4. Discussion

4.1. Pollution Feature and Possible Sources

Based on the statistical results of the samples (Table 5), it could be concluded that the main pollutant of heavy metal pollution in cultivated soil in the study area was Cd, followed by Zn. The coefficient of variation (CV) of Cd and Zn exceeded 100%, which suggested that the variability of these two elements was high. This high variability indicated that external factors had a significant influence on the accumulation of these metals in the soil [46].
The RF model, which was built using six independent variables, including factory distance, slope, road distance, annual rainfall, average annual temperature, and elevation, provided accurate predictions of heavy metal concentrations in the soil for each grid with a size of 500 m in the study area. The results indicated that most heavy metals, especially Cd, Pb, and Zn, had similar spatial distribution (Figure 2), with high pollution risk in the middle–east of the study area and low risk in the west and north–east regions, which was consistent with the locations of the industrial enterprises. The spatial distribution of heavily polluted areas derived from RF was comparable to that mapped from the single pollution index method and Nemero index (Figure 2, Figure 4 and Figure 5).
Based on the relative importance of six independent factors in the RF model, the factory distance factor was identified as having the highest weight in predicting pollution risks for all seven heavy metals, with particular significance for Cd and Zn (Figure 3). The modeling process showed that precipitation and annual average temperature were important factors in predicting the pollution risks of Cr and Ni. On the other hand, the slope factor was found to be significant in predicting the pollution risks of Cd, Pb, and Cu.
The results obtained in this study were consistent with those derived from source analysis of heavy metals using principal component analysis, cluster analysis, and positive matrix factor analysis methods (PMF) [49,50]. Through these methods, five potential sources, including soil parent material, coal burning, agricultural and industrial activity, electroplating, and transportation, were identified. Previous research had shown that the two major pollutants, Cd and Zn, mostly originated from agricultural and industrial activities and were distributed around industrial enterprises [51], which was in line with the finding that Cd and Zn pollution had the highest weight with the factory distance factor. Relevant studies had also indicated that there was a common source between Cr and Ni in soil, and these two heavy metals both were iron-philic elements in the epigenetic geochemical process. The content of these metals in soil was likely dominated by the soil-forming process [34,35], which was similar to the RF results indicating that the two metals resolved from the soil parent material correlated with precipitation and annual average temperature. This confirms that the combination of RF, single pollution index, and Nemero index could effectively determine the pollution degree of heavy metals, providing valuable information for the formulation of soil remediation measures.

4.2. Human Health Risks

The potential risks to children and adults posed by contaminated soil were assessed through ingestion, inhalation, and dermal contact pathways (Table 6). The HI for children was 1.21, which was nearly 10 times higher than that for adults (HI = 1.42 × 10⁻¹). The sum of the HQ values for each pathway of the seven heavy metals showed that the risk of ingestion was the highest for both adults and children, followed by dermal contact and inhalation. However, the risk of inhalation was considered negligible due to its low HQ value compared to the other two pathways.
In addition to non-carcinogenic risks, the carcinogenic risk (CR) of exposure to heavy metals, including Cd, As, Cr, and Ni, was calculated (Table 6), and it was found that the potential CR risks for children were greater than those for adults. However, none of the two indices (CR and HI) were greater than 1.00 × 10⁻⁴, which indicated that there were no severe potential carcinogenic risks in the area.
The results suggest that while there are potential non-carcinogenic risks for children due to exposure to heavy metals, there are no severe potential health risks posed to adults. It is important to continue monitoring and regulating exposure to heavy metals to ensure that these risks remain low and do not pose a significant threat to human health.

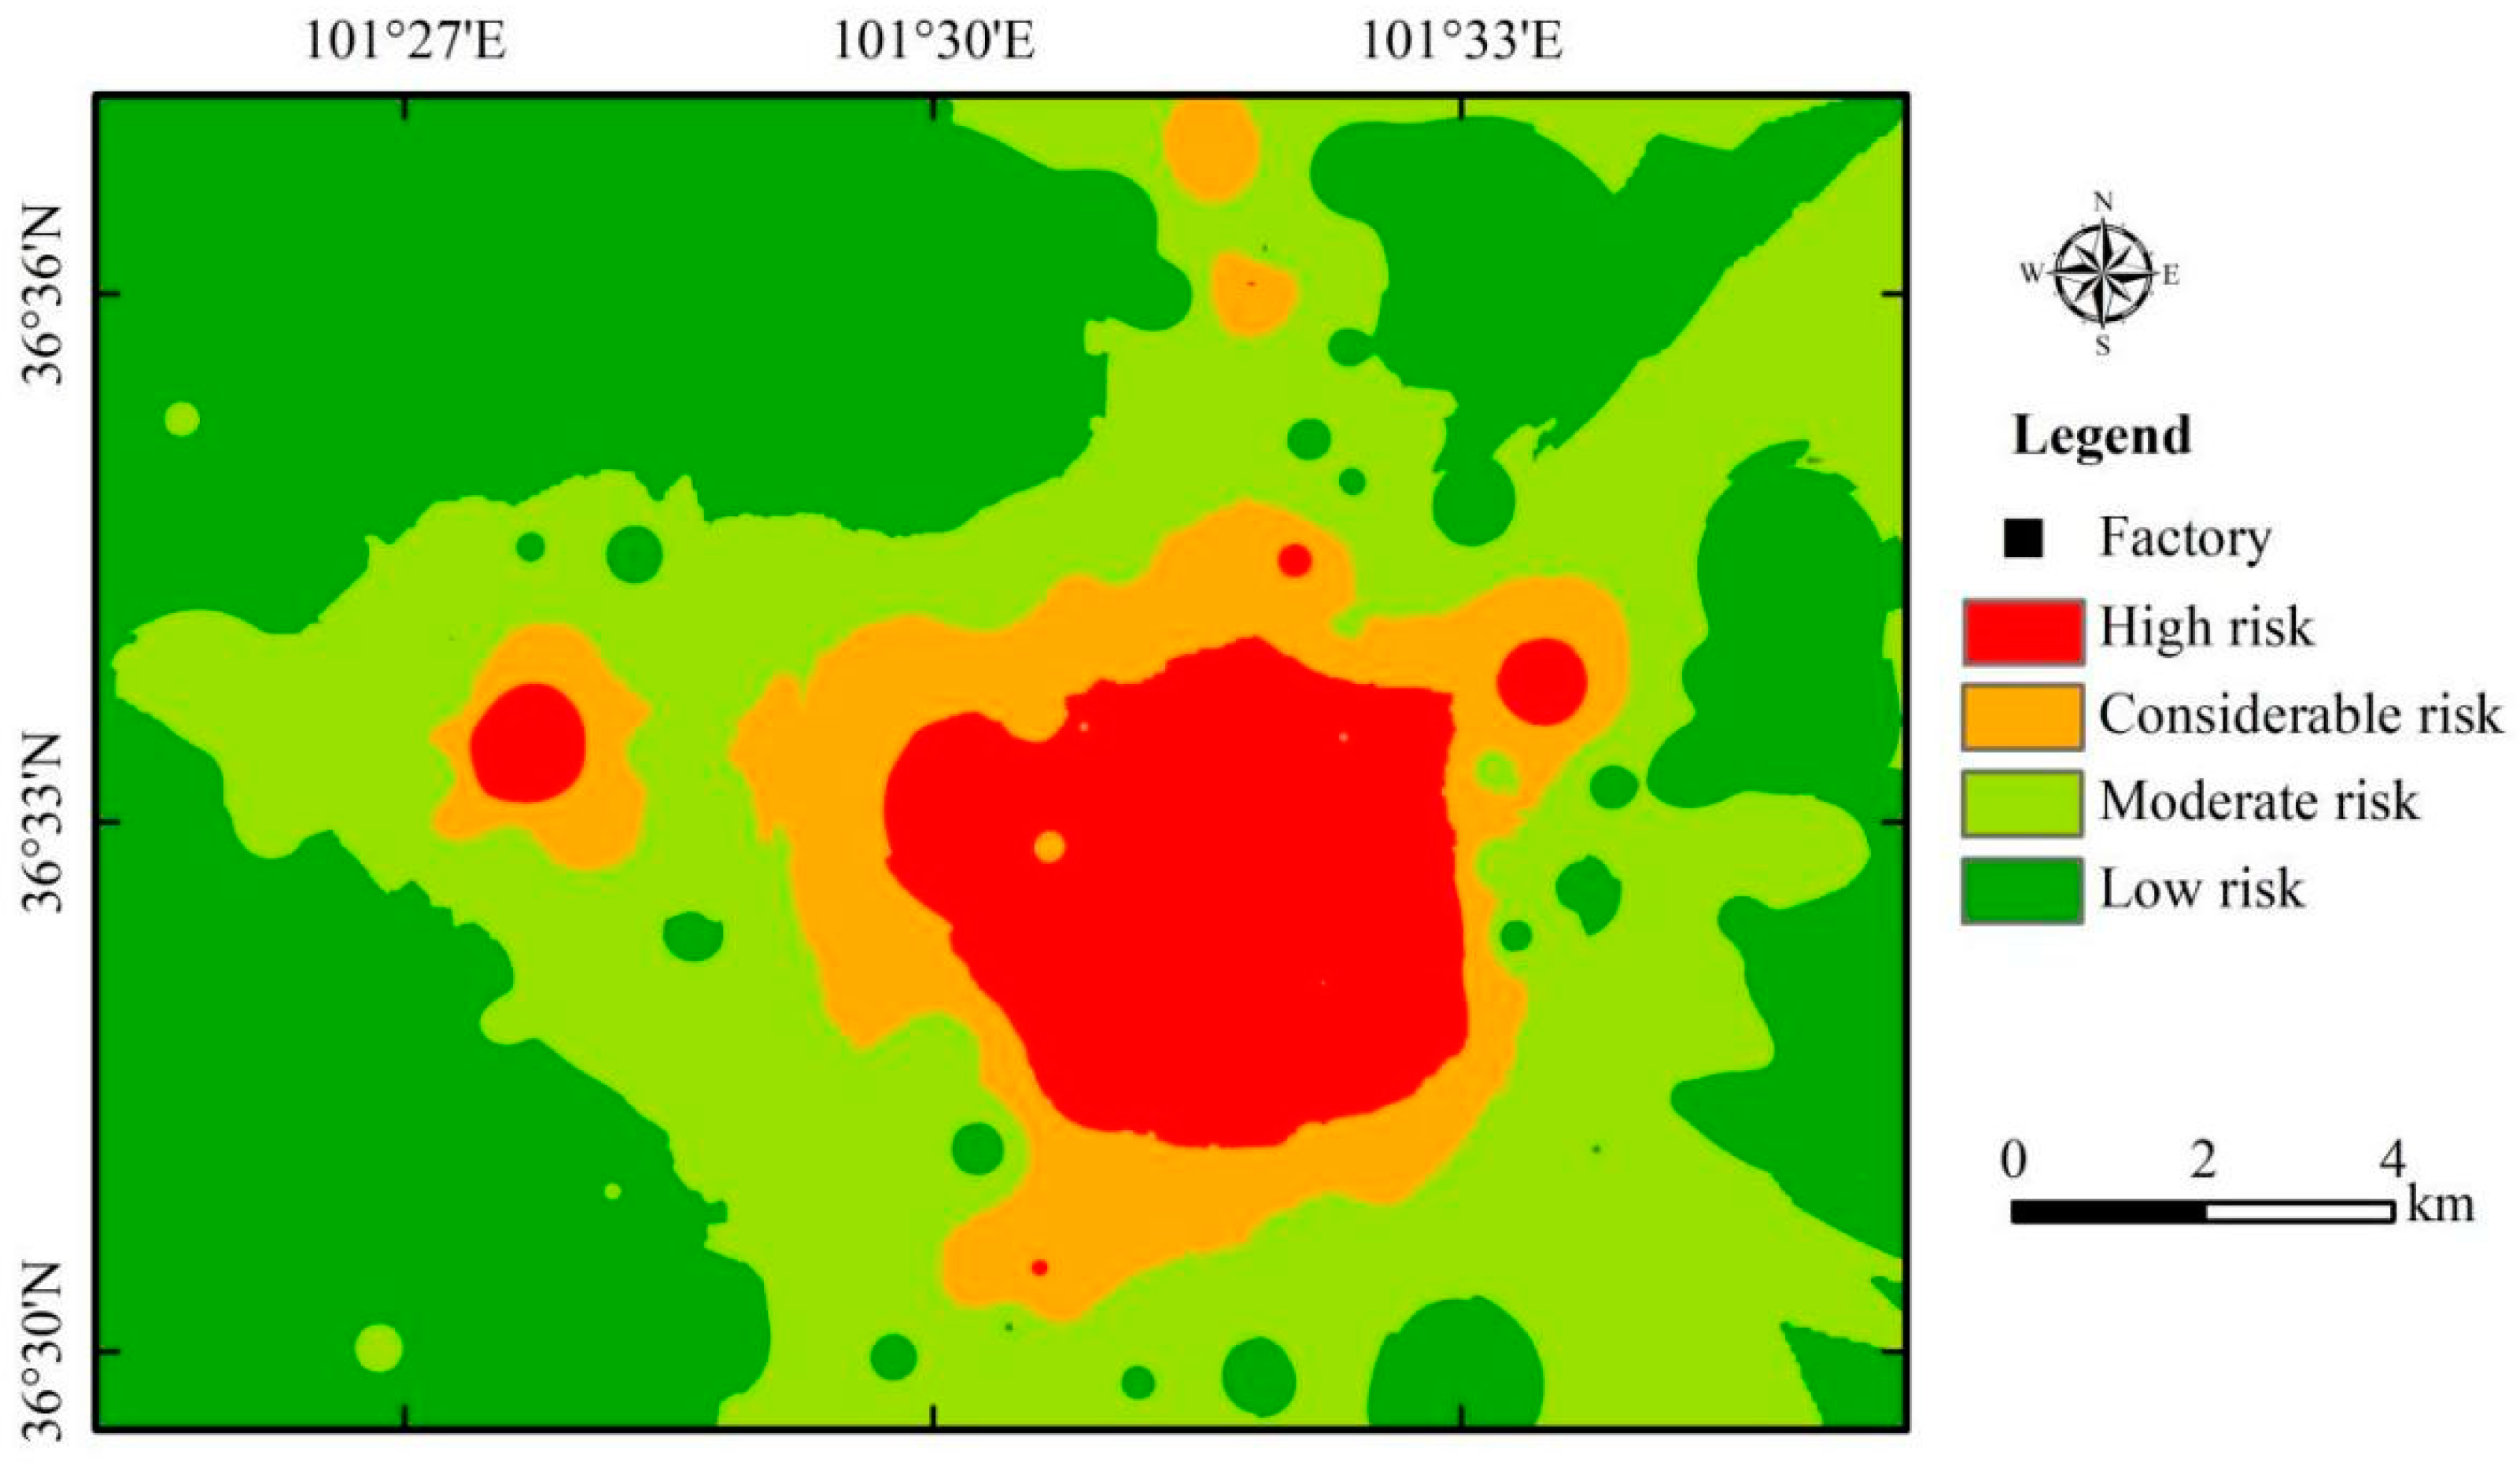
4.3. Potential Ecological Risks

According to the results, Cd was found to be the most dangerous heavy metal in the study area, with the highest mean risk value (75.8) and maximum risk value (1090) among all the heavy metals (Cd > As > Pb > Cu > Ni > Cr > Zn). The IDW interpolation and classification criteria were used to map the potential ecological risk index values, and the spatial distribution of the ecological risk index showed that the area with low risk was the largest, followed by the area with moderate risk (Figure 6). The areas with considerable and very high-risk areas were smaller in size but still significant.
It appears that the study area has an uneven distribution of RI, with the lowest, mean, and highest values being 16.9, 85.0, and 1.11 × 10³, respectively. Cd is identified as the most significant contributor to the RI, accounting for 89.2%. The spatial distribution of RI is similar to the distribution of Cd, Pb, and Zn concentrations. The study area is divided into the following four categories based on RI values: low risk (RI < 150); moderate risk (150 ≤ RI < 300); considerable risk (300 ≤ RI < 600); and very high risk (RI > 600). The area and ratio of each category were 93.3 km2 and 43.4%, 78.2 km2 and 36.3%, 22.4 km2 and 10.4%, and 21.3 km2 and 9.9%.
The results concluded that heavy metals posed noticeable potential ecological risks in the study area, and Cd was the most polluted heavy metal and, therefore, should be evaluated specifically for the relevant risks.

5. Conclusions

This study measured the levels of seven heavy metals (Cd, As, Pb, Cr, Cu, Ni, and Zn) in soils in the Ganhe Industrial Park in the Upper Yellow River and found that Cd and Zn were the main pollutants in the soils. A total of 65 samples (47.1%) for Cd, 13 samples (9.40%) for Zn, 2 samples (1.40%) for Cr, and 1 sample (0.70%) for Pb were proved to exceed the soil environmental quality standard values. Cd was more concentrated than the other elements, and the polluted areas were mainly concentrated in the central–eastern region, which was spatially correlated with the factories, such as zinc smelting plants and chemical plants. The pollution index and Nemero index results showed that more than 56.5% of the samples were beyond the safety level, indicating that the soil was slightly polluted.
The study also found that there were serious potential non-carcinogenic risks for children (HI = 1.21) but no severe potential health risks posed to adults (HI = 0.14). Similarly, the potential carcinogenic risk (CR) of heavy metals for children (CR = 2.27 × 10⁻⁵) was greater than those for adults (CR = 1.20 × 10⁻⁵). The individual index values of potential ecological risk assessment of heavy metals indicated that Cd was the main contributor to ecological risk as it recorded the highest E r i values.
Overall, this study highlights the potential ecological risks posed by heavy metals in the study area and the need for specific evaluation of Cd for relevant risks. The results provide theoretical support for pollution control and environmental management in the study area and the Upper Yellow River in China.

Author Contributions

F.Y.: conceptualization, writing, project administration, review, writing—original draft; W.M.: methodology, review; L.L.: project administration, review, editing; K.F.: writing and editing, software; C.Y.: review and supervision. All authors have read and agreed to the published version of the manuscript.

Funding

This research was funded by the National Natural Science Foundation of China (42071258).

Institutional Review Board Statement

Not applicable.

Informed Consent Statement

Not applicable.

Data Availability Statement

Not applicable.

Conflicts of Interest

The authors declare no conflict of interest.

References

  1. Cai, L.-M.; Wang, Q.-S.; Luo, J.; Chen, L.-G.; Zhu, R.-L.; Wang, S.; Tang, C.-H. Heavy Metal Contamination and Health Risk Assessment for Children near a Large Cu-Smelter in Central China. Sci. Total Environ. 2019, 650, 725–733. [Google Scholar] [CrossRef] [PubMed]
  2. Imin, B.; Abliz, A.; Shi, Q.; Liu, S.; Hao, L. Quantitatively Assessing the Risks and Possible Sources of Toxic Metals in Soil from an Arid, Coal-Dependent Industrial Region in NW China. J. Geochem. Explor. 2020, 212, 106505. [Google Scholar] [CrossRef]
  3. Liu, X.; Gu, S.; Yang, S.; Deng, J.; Xu, J. Heavy Metals in Soil-Vegetable System around E-Waste Site and the Health Risk Assessment. Sci. Total Environ. 2021, 779, 146438. [Google Scholar] [CrossRef] [PubMed]
  4. Ngo, H.T.T.; Watchalayann, P.; Nguyen, D.B.; Doan, H.N.; Liang, L. Environmental Health Risk Assessment of Heavy Metal Exposure among Children Living in an Informal E-Waste Processing Village in Viet Nam. Sci. Total Environ. 2021, 763, 142982. [Google Scholar] [CrossRef] [PubMed]
  5. Wu, Q.; Hu, W.; Wang, H.; Liu, P.; Wang, X.; Huang, B. Spatial Distribution, Ecological Risk and Sources of Heavy Metals in Soils from a Typical Economic Development Area, Southeastern China. Sci. Total Environ. 2021, 780, 146557. [Google Scholar] [CrossRef]
  6. Zhang, Y.; Li, S.; Wang, F.; Chen, Z.; Chen, J.; Wang, L. An Innovative Expression Model of Human Health Risk Based on the Quantitative Analysis of Soil Metals Sources Contribution in Different Spatial Scales. Chemosphere 2018, 207, 60–69. [Google Scholar] [CrossRef]
  7. Ali, H.; Khan, E.; Sajad, M.A. Phytoremediation of Heavy Metals—Concepts and Applications. Chemosphere 2013, 91, 869–881. [Google Scholar] [CrossRef]
  8. Zhang, P.; Qin, C.; Hong, X.; Kang, G.; Qin, M.; Yang, D.; Pang, B.; Li, Y.; He, J.; Dick, R.P. Risk Assessment and Source Analysis of Soil Heavy Metal Pollution from Lower Reaches of Yellow River Irrigation in China. Sci. Total Environ. 2018, 633, 1136–1147. [Google Scholar] [CrossRef]
  9. Zhu, X.; Yu, W.; Li, F.; Liu, C.; Ma, J.; Yan, J.; Wang, Y.; Tian, R. Spatio-Temporal Distribution and Source Identification of Heavy Metals in Particle Size Fractions of Road Dust from a Typical Industrial District. Sci. Total Environ. 2021, 780, 146357. [Google Scholar] [CrossRef]
  10. Chen, H.; Teng, Y.; Lu, S.; Wang, Y.; Wang, J. Contamination Features and Health Risk of Soil Heavy Metals in China. Sci. Total Environ. 2015, 512, 143–153. [Google Scholar] [CrossRef]
  11. Davies, B.E. Heavy Metal Contamination from Base Metal Mining and Smelting: Implications for Man and His Environment. In Applied Environmental Geochemistry; Academic Press: New York, NY, USA, 1983. [Google Scholar]
  12. Liu, W.; Zhao, J.; Ouyang, Z.; Söderlund, L.; Liu, G. Impacts of Sewage Irrigation on Heavy Metal Distribution and Contamination in Beijing, China. Environ. Int. 2005, 31, 805–812. [Google Scholar] [CrossRef]
  13. Zhang, X.; Zhong, T.; Liu, L.; Ouyang, X. Impact of Soil Heavy Metal Pollution on Food Safety in China. PLoS ONE 2015, 10, e0135182. [Google Scholar] [CrossRef] [PubMed]
  14. Cicchella, D.; Zuzolo, D.; Albanese, S.; Fedele, L.; Di Tota, I.; Guagliardi, I.; Thiombane, M.; De Vivo, B.; Lima, A. Urban Soil Contamination in Salerno (Italy): Concentrations and Patterns of Major, Minor, Trace and Ultra-Trace Elements in Soils. J. Geochem. Explor. 2020, 213, 106519. [Google Scholar] [CrossRef]
  15. Comero, S.; Servida, D.; De Capitani, L.; Gawlik, B.M. Geochemical Characterization of an Abandoned Mine Site: A Combined Positive Matrix Factorization and GIS Approach Compared with Principal Component Analysis. J. Geochem. Explor. 2012, 118, 30–37. [Google Scholar] [CrossRef]
  16. Mao, C.; Song, Y.; Chen, L.; Ji, J.; Li, J.; Yuan, X.; Yang, Z.; Ayoko, G.A.; Frost, R.L.; Theiss, F. Human Health Risks of Heavy Metals in Paddy Rice Based on Transfer Characteristics of Heavy Metals from Soil to Rice. CATENA 2019, 175, 339–348. [Google Scholar] [CrossRef]
  17. Midhat, L.; Ouazzani, N.; Hejjaj, A.; Ouhammou, A.; Mandi, L. Accumulation of Heavy Metals in Metallophytes from Three Mining Sites (Southern Centre Morocco) and Evaluation of Their Phytoremediation Potential. Ecotoxicol. Environ. Saf. 2019, 169, 150–160. [Google Scholar] [CrossRef] [PubMed]
  18. Wan, M.; Hu, W.; Wang, H.; Tian, K.; Huang, B. Comprehensive Assessment of Heavy Metal Risk in Soil-Crop Systems along the Yangtze River in Nanjing, Southeast China. Sci. Total Environ. 2021, 780, 146567. [Google Scholar] [CrossRef]
  19. Wei, J.; Gao, J.; Cen, K. Levels of Eight Heavy Metals and Health Risk Assessment Considering Food Consumption by China’s Residents Based on the 5th China Total Diet Study. Sci. Total Environ. 2019, 689, 1141–1148. [Google Scholar] [CrossRef]
  20. Zhao, R.; Guan, Q.; Luo, H.; Lin, J.; Yang, L.; Wang, F.; Pan, N.; Yang, Y. Fuzzy Synthetic Evaluation and Health Risk Assessment Quantification of Heavy Metals in Zhangye Agricultural Soil from the Perspective of Sources. Sci. Total Environ. 2019, 697, 134126. [Google Scholar] [CrossRef]
  21. Zheng, N.; Liu, J.; Wang, Q.; Liang, Z. Health Risk Assessment of Heavy Metal Exposure to Street Dust in the Zinc Smelting District, Northeast of China. Sci. Total Environ. 2010, 408, 726–733. [Google Scholar] [CrossRef]
  22. Chabukdhara, M.; Gupta, S.K.; Kotecha, Y.; Nema, A.K. Groundwater Quality in Ghaziabad District, Uttar Pradesh, India: Multivariate and Health Risk Assessment. Chemosphere 2017, 179, 167–178. [Google Scholar] [CrossRef] [PubMed]
  23. Wu, J.; Lu, J.; Li, L.; Min, X.; Luo, Y. Pollution, Ecological-Health Risks, and Sources of Heavy Metals in Soil of the Northeastern Qinghai-Tibet Plateau. Chemosphere 2018, 201, 234–242. [Google Scholar] [CrossRef] [PubMed]
  24. Zhao, Q.; Bai, J.; Gao, Y.; Zhang, G.; Lu, Q.; Jia, J. Heavy Metal Contamination in Soils from Freshwater Wetlands to Salt Marshes in the Yellow River Estuary, China. Sci. Total Environ. 2021, 774, 145072. [Google Scholar] [CrossRef]
  25. Zhang, J.; Liu, K.; He, X.; Li, W.; Zhang, M.; Cai, Q. Evaluation of heavy metal contamination of soil and the health risks in four potato-producing areas. Front. Environ. Sci. 2023, 11, 1071353. [Google Scholar] [CrossRef]
  26. Karimi, A.; Naghizadeh, A.; Biglari, H.; Peirovi, R.; Ghasemi, A.; Zarei, A. Assessment of human health risks and pollution index for heavy metals in farmlands irrigated by effluents of stabilization ponds. Environ. Sci. Pollut. Res. 2020, 27, 10317–10327. [Google Scholar] [CrossRef] [PubMed]
  27. Taghizadeh-Mehrjardi, R.; Fathizad, H.; Ali Hakimzadeh Ardakani, M.; Sodaiezadeh, H.; Kerry, R.; Heung, B.; Scholten, T. Spatio-Temporal Analysis of Heavy Metals in Arid Soils at the Catchment Scale Using Digital Soil Assessment and a Random Forest Model. Remote Sens. 2021, 13, 1698. [Google Scholar] [CrossRef]
  28. Adimalla, N.; Chen, J.; Qian, H. Spatial Characteristics of Heavy Metal Contamination and Potential Human Health Risk Assessment of Urban Soils: A Case Study from an Urban Region of South India. Ecotoxicol. Environ. Saf. 2020, 194, 110406. [Google Scholar] [CrossRef]
  29. Li, K.; Gu, Y.; Li, M.; Zhao, L.; Ding, J.; Lun, Z.; Tian, W. Spatial Analysis, Source Identification and Risk Assessment of Heavy Metals in a Coal Mining Area in Henan, Central China. Int. Biodeterior. Biodegrad. 2018, 128, 148–154. [Google Scholar] [CrossRef]
  30. Mukherjee, I.; Singh, U.K.; Singh, R.P.; Anshumali; Kumari, D.; Jha, P.K.; Mehta, P. Characterization of Heavy Metal Pollution in an Anthropogenically and Geologically Influenced Semi-Arid Region of East India and Assessment of Ecological and Human Health Risks. Sci. Total Environ. 2020, 705, 135801. [Google Scholar] [CrossRef]
  31. Duan, H.; Xue, X.; Wang, T.; Kang, W.; Liao, J.; Liu, S. Spatial and Temporal Differences in Alpine Meadow, Alpine Steppe and All Vegetation of the Qinghai-Tibetan Plateau and Their Responses to Climate Change. Remote Sens. 2021, 13, 669. [Google Scholar] [CrossRef]
  32. Wu, Y.; Wang, S.; Ni, Z.; Li, H.; May, L.; Pu, J. Emerging Water Pollution in the World’s Least Disturbed Lakes on Qinghai-Tibetan Plateau. Environ. Pollut. 2021, 272, 116032. [Google Scholar] [CrossRef] [PubMed]
  33. Fan, Y.; Fang, C. A Comprehensive Insight into Water Pollution and Driving Forces in Western China—Case Study of Qinghai. J. Clean. Prod. 2020, 274, 123950. [Google Scholar] [CrossRef]
  34. Chesworth, W.; Arbestain, M.C.; Macías, F.; Spaargaren, O.; Spaargaren, O.; Mualem, Y.; Morel-Seytoux, H.J.; Horwath, W.R.; Almendros, G.; Grossl, P.R.; et al. Classification of Soils: FAO. In Encyclopedia of Soil Science; Chesworth, W., Ed.; Springer: Dordrecht, The Netherlands, 2008; pp. 111–113. [Google Scholar] [CrossRef]
  35. Meng, R.; Du, J.H.; Liu, Y.H.; Luo, L.T.; He, K.; Liu, M.W.; Liu, B. Exploration of digestion method for determination of heavy metal elements in soil by ICP-MS. Spectrosc. Spectr. Anal. 2021, 41, 2122–2128, (In Chinese with English abstract). [Google Scholar]
  36. Qiao, P.; Yang, S.; Wei, W.; Li, P.; Cheng, Y.; Liang, S.; Lei, M.; Chen, T. Effectiveness of Predicting Spatial Contaminant Distributions at Industrial Sites Using Partitioned Interpolation Method. Environ. Geochem. Health 2021, 43, 23–36. [Google Scholar] [CrossRef] [PubMed]
  37. Lee, C.S.; Li, X.; Shi, W.; Cheung, S.C.; Thornton, I. Metal Contamination in Urban, Suburban, and Country Park Soils of Hong Kong: A Study Based on GIS and Multivariate Statistics. Sci. Total Environ. 2006, 356, 45–61. [Google Scholar] [CrossRef] [PubMed]
  38. Sawut, R.; Kasim, N.; Maihemuti, B.; Hu, L.; Abliz, A.; Abdujappar, A.; Kurban, M. Pollution Characteristics and Health Risk Assessment of Heavy Metals in the Vegetable Bases of Northwest China. Sci. Total Environ. 2018, 642, 864–878. [Google Scholar] [CrossRef]
  39. Cheng, J.; Zhou, S.H.I.; Zhu, Y. Assessment and Mapping of Environmental Quality in Agricultural Soils of Zhejiang Province, China. J. Environ. Sci. 2007, 19, 50–54. [Google Scholar] [CrossRef]
  40. Zhao, X.; Li, Z.; Wang, D.; Tao, Y.; Qiao, F.; Lei, L.; Huang, J.; Ting, Z. Characteristics, Source Apportionment and Health Risk Assessment of Heavy Metals Exposure via Household Dust from Six Cities in China. Sci. Total Environ. 2021, 762, 143126. [Google Scholar] [CrossRef]
  41. Wei, R.; Wang, X.; Tang, W.; Yang, Y.; Gao, Y.; Zhong, H.; Yang, L. Bioaccumulations and Potential Human Health Risks Assessment of Heavy Metals in Ppk-Expressing Transgenic Rice. Sci. Total Environ. 2020, 710, 136496. [Google Scholar] [CrossRef]
  42. Jiang, Y.; Chao, S.; Liu, J.; Yang, Y.; Chen, Y.; Zhang, A.; Cao, H. Source Apportionment and Health Risk Assessment of Heavy Metals in Soil for a Township in Jiangsu Province, China. Chemosphere 2017, 168, 1658–1668. [Google Scholar] [CrossRef]
  43. Singh, M.; Thind, P.S.; John, S. Health Risk Assessment of the Workers Exposed to the Heavy Metals in E-Waste Recycling Sites of Chandigarh and Ludhiana, Punjab, India. Chemosphere 2018, 203, 426–433. [Google Scholar] [CrossRef]
  44. US EPA. Regional Screening Levels (RSLs)—User’s Guide. Available online: https://www.epa.gov/risk/regional-screening-levels-rsls-users-guide (accessed on 20 March 2021).
  45. Kusin, F.M.; Azani, N.N.M.; Hasan, S.N.M.S.; Sulong, N.A. Distribution of Heavy Metals and Metalloid in Surface Sediments of Heavily-Mined Area for Bauxite Ore in Pengerang, Malaysia and Associated Risk Assessment. CATENA 2018, 165, 454–464. [Google Scholar] [CrossRef]
  46. Djahed, B.; Taghavi, M.; Farzadkia, M.; Norzaee, S.; Miri, M. Stochastic Exposure and Health Risk Assessment of Rice Contamination to the Heavy Metals in the Market of Iranshahr, Iran. Food Chem. Toxicol. 2018, 115, 405–412. [Google Scholar] [CrossRef]
  47. Huang, Y.; Chen, Q.; Deng, M.; Japenga, J.; Li, T.; Yang, X.; He, Z. Heavy Metal Pollution and Health Risk Assessment of Agricultural Soils in a Typical Peri-Urban Area in Southeast China. J. Environ. Manag. 2018, 207, 159–168. [Google Scholar] [CrossRef] [PubMed]
  48. Hakanson, L. An Ecological Risk Index for Aquatic Pollution Control.a Sedimentological Approach. Water Res. 1980, 14, 975–1001. [Google Scholar] [CrossRef]
  49. Chen, Z.F.; Hua, Y.X.; Xu, W.; Pei, J.C. Analysis of heavy metal pollution sources in suburban farmland based on positive definite matrix factor analysis model(PMF). J. Environ. Sci. 2020, 40, 276–283. [Google Scholar] [CrossRef]
  50. Chen, J.F.; Fang, H.D.; Wu, J.J.; Lin, J.M.; Lan, W.B.; Chen, J.S. Distribution and source analysis of heavy metals in farmland soil based on PMF and Pb isotopes. J. Agric. Environ. Sci. 2019, 38, 1026–1035. [Google Scholar] [CrossRef]
  51. Yin, F.; Feng, K.; Yin, C.J.; Bai, D.Z.; Wang, R.; Zhou, Y.Y.; Liang, Y.C.; Liu, L. Evaluation and source apportionment of heavy metals in arable soil of typical industrial zones in Qinghai. Chin. Environ. Sci. 2021, 41, 5217–5226. [Google Scholar] [CrossRef]
Figure 1. Distribution of sampling locations and industrial plants in the study area.
Land 12 01172 g001
Figure 2. Prediction results of heavy metal pollution risk based on random forest model, (a) Cd, (b) As, (c) Pb, (d) Cr, (e) Cu, (f) Ni, and (g) Zn.
Land 12 01172 g002
Figure 3. The weights of different factors in the random forest model, (a) Cd, (b) As, (c) Pb, (d) Cr, (e) Cu, (f) Ni, and (g) Zn.
Land 12 01172 g003
Figure 4. The spatial distribution of 7 heavy metal concentrations, (a) Cd, (b) As, (c) Pb, (d) Cr, (e) Cu, (f) Ni, and (g) Zn.
Land 12 01172 g004
Figure 5. IDW interpolation of the Nemero index.
Land 12 01172 g005
Figure 6. Map of IDW interpolated potential RI values for the study area.
Land 12 01172 g006
Table 1. Parameters and accuracy of random forest model.
Heavy MetalTree NumberMinimum of Leaf SizeMaximum of Tree DepthNumber of Random
Sampling
R2 Modeling SetR2 Validation Set
Cd614330.8560.634
As1957240.5710.399
Pb1606130.6920.518
Cr1002440.9230.699
Cu15110150.5450.570
Ni1944730.9190.796
Zn1606330.8830.616
Table 2. Grading criteria for the Nemero index [38].
Grade P Pollution Levels
I P 0.7 Clean (safe level)
II 0.7 < P 1 Warning limit (precaution level)
III 1 < P 2 Slight pollution (slightly polluted level)
IV 2 < P 3 Moderate pollution (moderately polluted level)
V P > 3 Heavy pollution (seriously polluted level)
Table 3. Parameters used in CDI estimation for non-carcinogenic risk and carcinogenic risk (adapted from US Environmental Protection Agency [43]).
ParametersUnitsValues
AdultsChildren
ABS 1.00 × 10⁻³ (0.03 for As)1.00 × 10⁻³ (0.03 for As)
AFmg·cm−20.070.20
ATcarcinogenicdays25,55025,550
ATnon-carcinogenicdays94902190
BWkg70.015.0
CFkg·mg−11.00 × 10−61.00 × 10−6
EDyear26.06.00
EFday·year−1350350
InhRm3·days−120.07.60
IngRmg·day−1100200
PEFm3·kg−11.36 × 1091.36 × 109
SAcm260322373
Table 4. The RfD values and CSF values of the seven heavy metals in the study area (data referred to [10,20,29,41,42,46]).
CdAsPbCrCuNiZn
RfDing1.00 × 10−33.00 × 10−43.50 × 10−33.00 × 10−34.00 × 10−22.00 × 10−23.00 × 10−1
RfDderm1.00 × 10−51.23 × 10−45.25 × 10−46.00 × 10−51.20 × 10−25.40 × 10−36.00 × 10−2
RfDinh1.00 × 10−53.00 × 10−43.52 × 10−32.86 × 10−54.00 × 10−29.00 × 10−53.00 × 10−1
CSFing 1.50
CSFderm 3.66
CSFinh6.3015.1 42.0 8.40 × 10⁻¹
Table 5. Statistics of soil heavy metal concentrations (mg∙kg−1) in the study area.
CdAsPbCrCuNiZn
Max (mg∙kg−1)21.820.822338946.193.21.54 × 103
Min (mg∙kg−1)0.163.6817.047.216.021.348.6
Mean (mg∙kg−1)1.5211.735.689.326.036.2147
CV (%)18024.074.045.015.020.0121
Screening value (mg∙kg−1)0.60025.0170250100190300
Control value (mg∙kg−1)4.0010010001300---
Low risk (n)73138137136138138125
Medium risk (n)520120013
High risk (n)13000000
Table 6. Non-carcinogenic risk and carcinogenic risk to adults and children in the study area.
ElementAdultsChildren
HQingHQinhHQdermHICR (LCR for As)HQingHQinhHQdermHICR (LCR for As)
Cd2.08 × 10−33.05 × 10−58.77 × 10−42.98 × 10−37.14 × 10−101.94 × 10−25.41 × 10−54.60 × 10−32.40 × 10−22.92 × 10⁻¹⁰
As5.36 × 10−27.88 × 10−61.65 × 10−27.01 × 10−21.17 × 10−55.00 × 10−11.40 × 10−58.68 × 10−25.87 × 10−12.26 × 10⁻⁵
Pb1.39 × 10−22.03 × 10−66.86 × 10−41.46 × 10⁻² 1.30 × 10−13.61 × 10−33.60 × 10−31.33 × 10−1
Cr4.08 × 10−26.29 × 10−48.61 × 10−35.00 × 10−22.81 × 10−73.81 × 10−11.12 × 10−34.52 × 10−24.27 × 10−11.15 × 10⁻⁷
Cu8.89 × 10−41.31 × 10−71.25 × 10−59.02 × 10⁻⁴ 8.30 × 10−32.32 × 10−76.57 × 10−58.37 × 10−3
Ni2.48 × 10−38.10 × 10−53.88 × 10−52.60 × 10−32.28 × 10−92.31 × 10−21.44 × 10−42.03 × 10−42.35 × 10−29.31 × 10⁻¹⁰
Zn6.73 × 10−49.90 × 10−81.42 × 10−56.87 × 10⁻⁴ 6.28 × 10−31.75 × 10−77.45 × 10−56.36 × 10−3
Total1.14 × 10−17.51 × 10−42.67 × 10−21.42 × 10−11.20 × 10−51.071.34 × 10−31.41 × 10−11.212.27 × 10−5
Disclaimer/Publisher’s Note: The statements, opinions and data contained in all publications are solely those of the individual author(s) and contributor(s) and not of MDPI and/or the editor(s). MDPI and/or the editor(s) disclaim responsibility for any injury to people or property resulting from any ideas, methods, instructions or products referred to in the content.

