

Quantitative Analysis of Seasonality and the Impact of COVID-19 on Tourists’ Use of Urban Green Space in Okinawa: An ARIMA Modeling Approach Using Web Review Data

Abstract
:1. Introduction
2. Methods
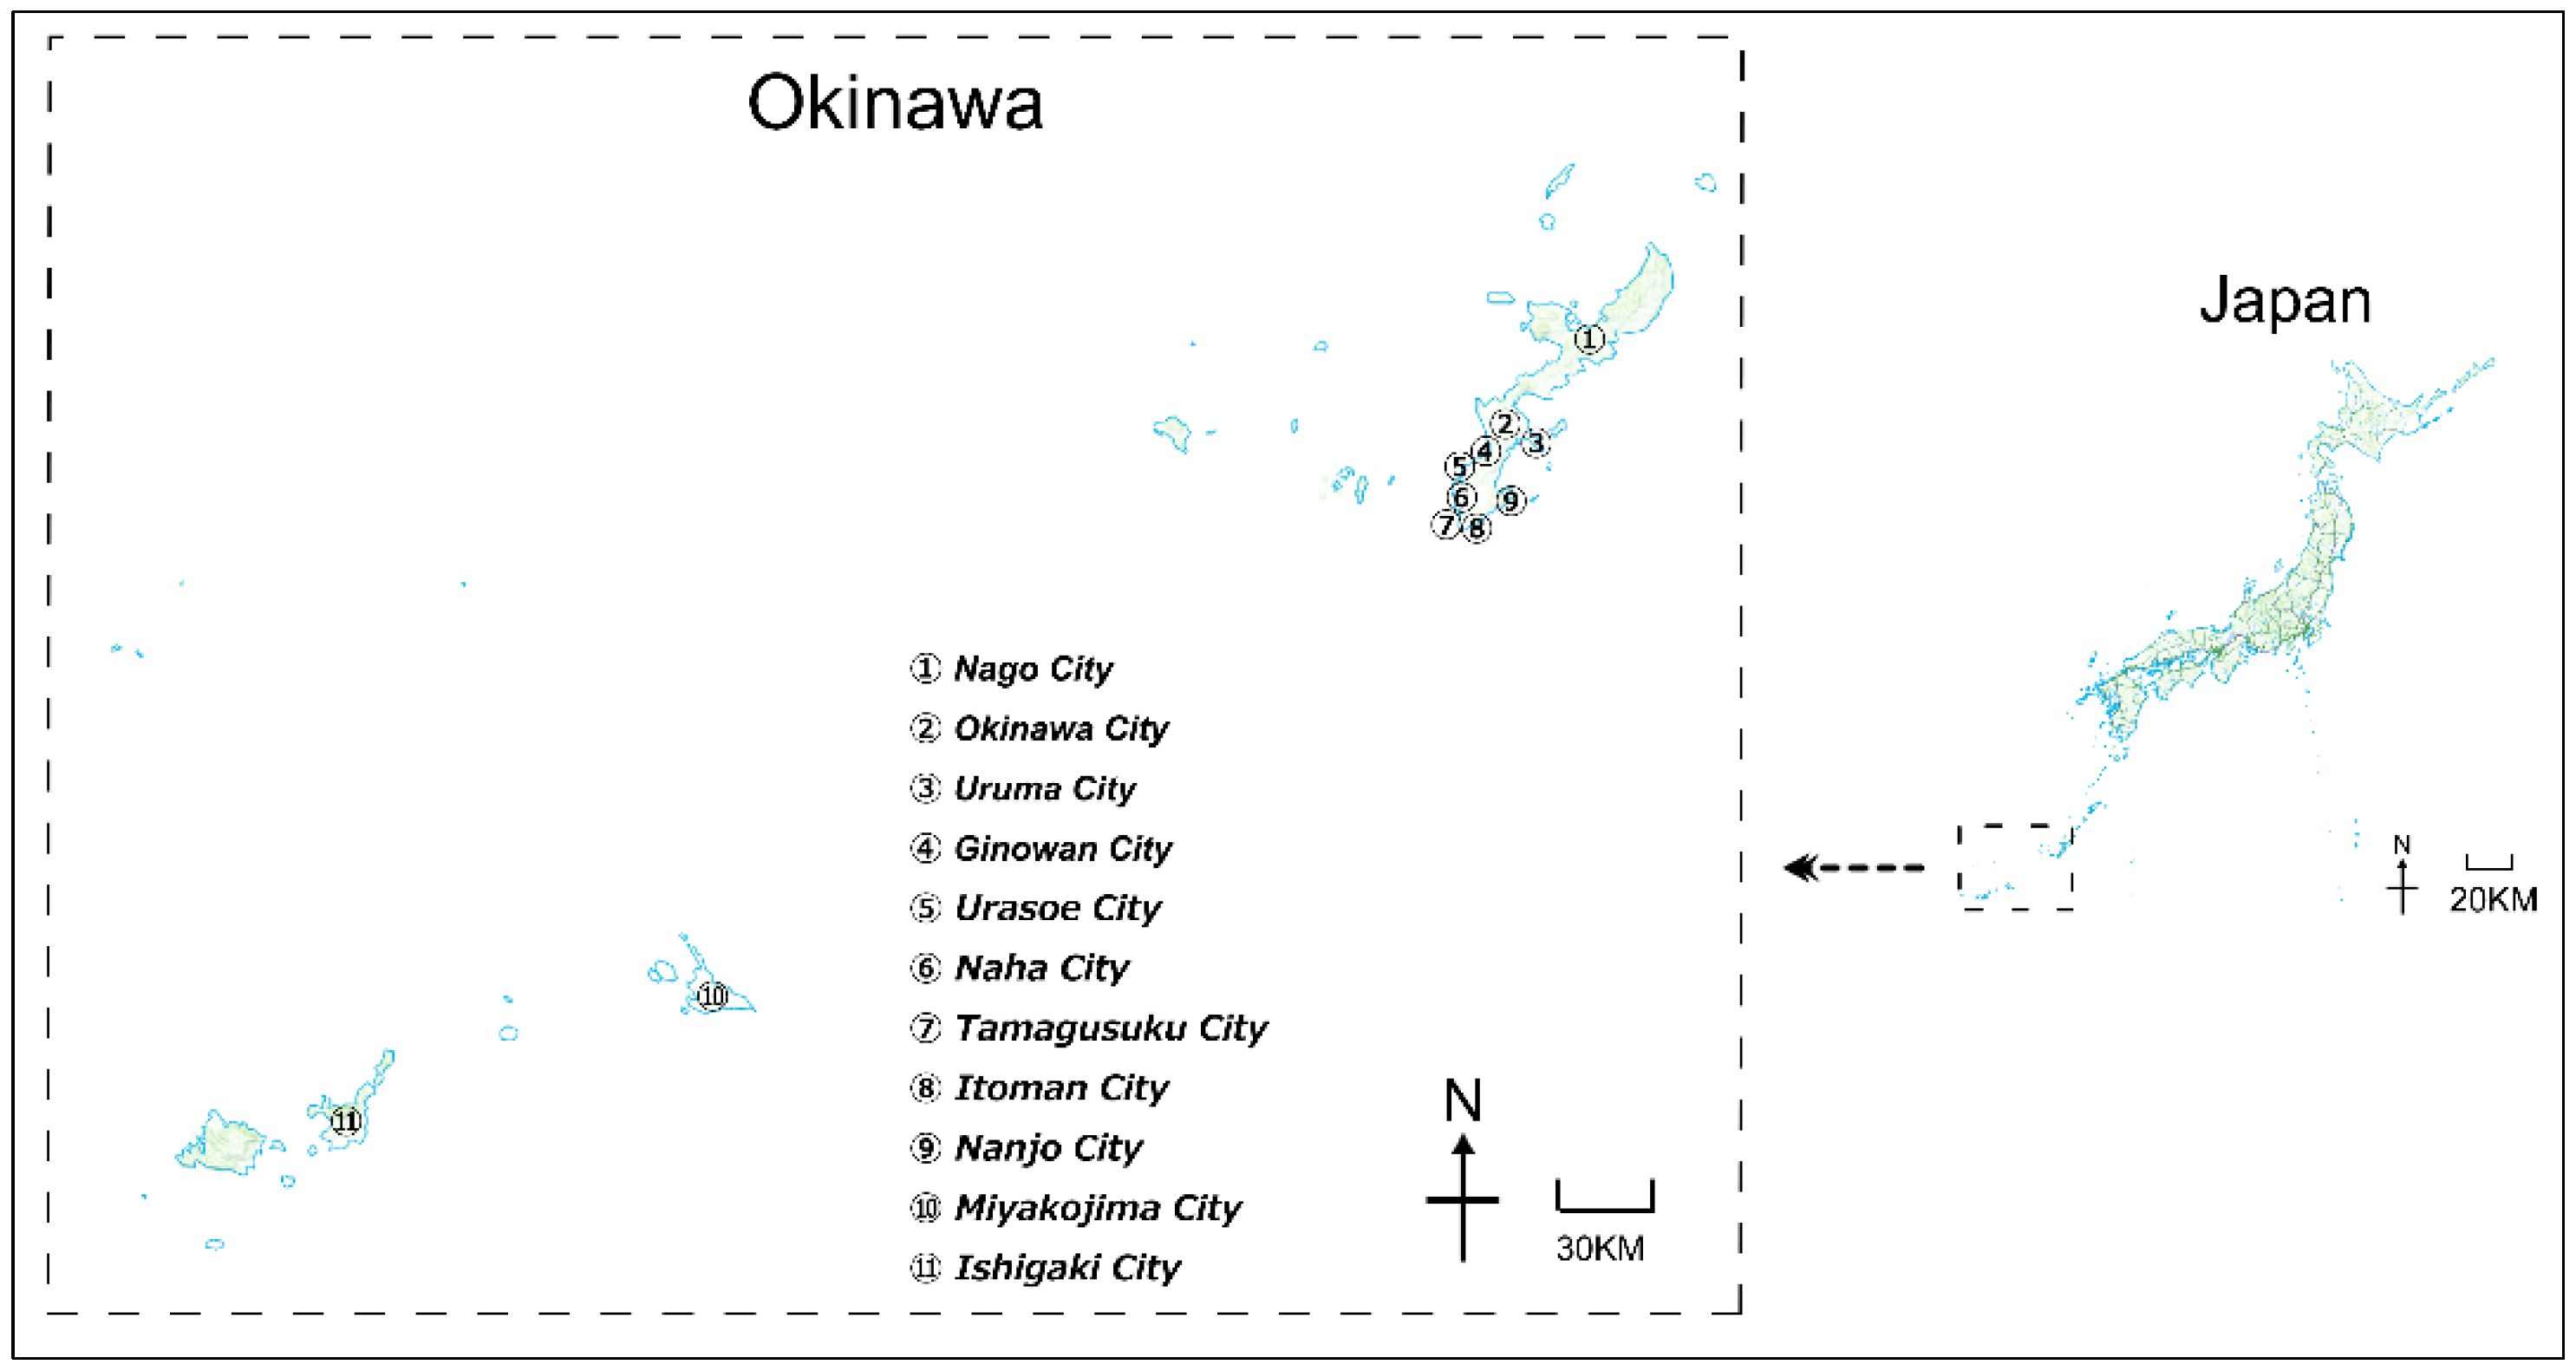
2.1. Study Objects
2.2. Data Sources
2.3. Modeling the ARIMA
3. Results
3.1. Results of Crawling the Research Data
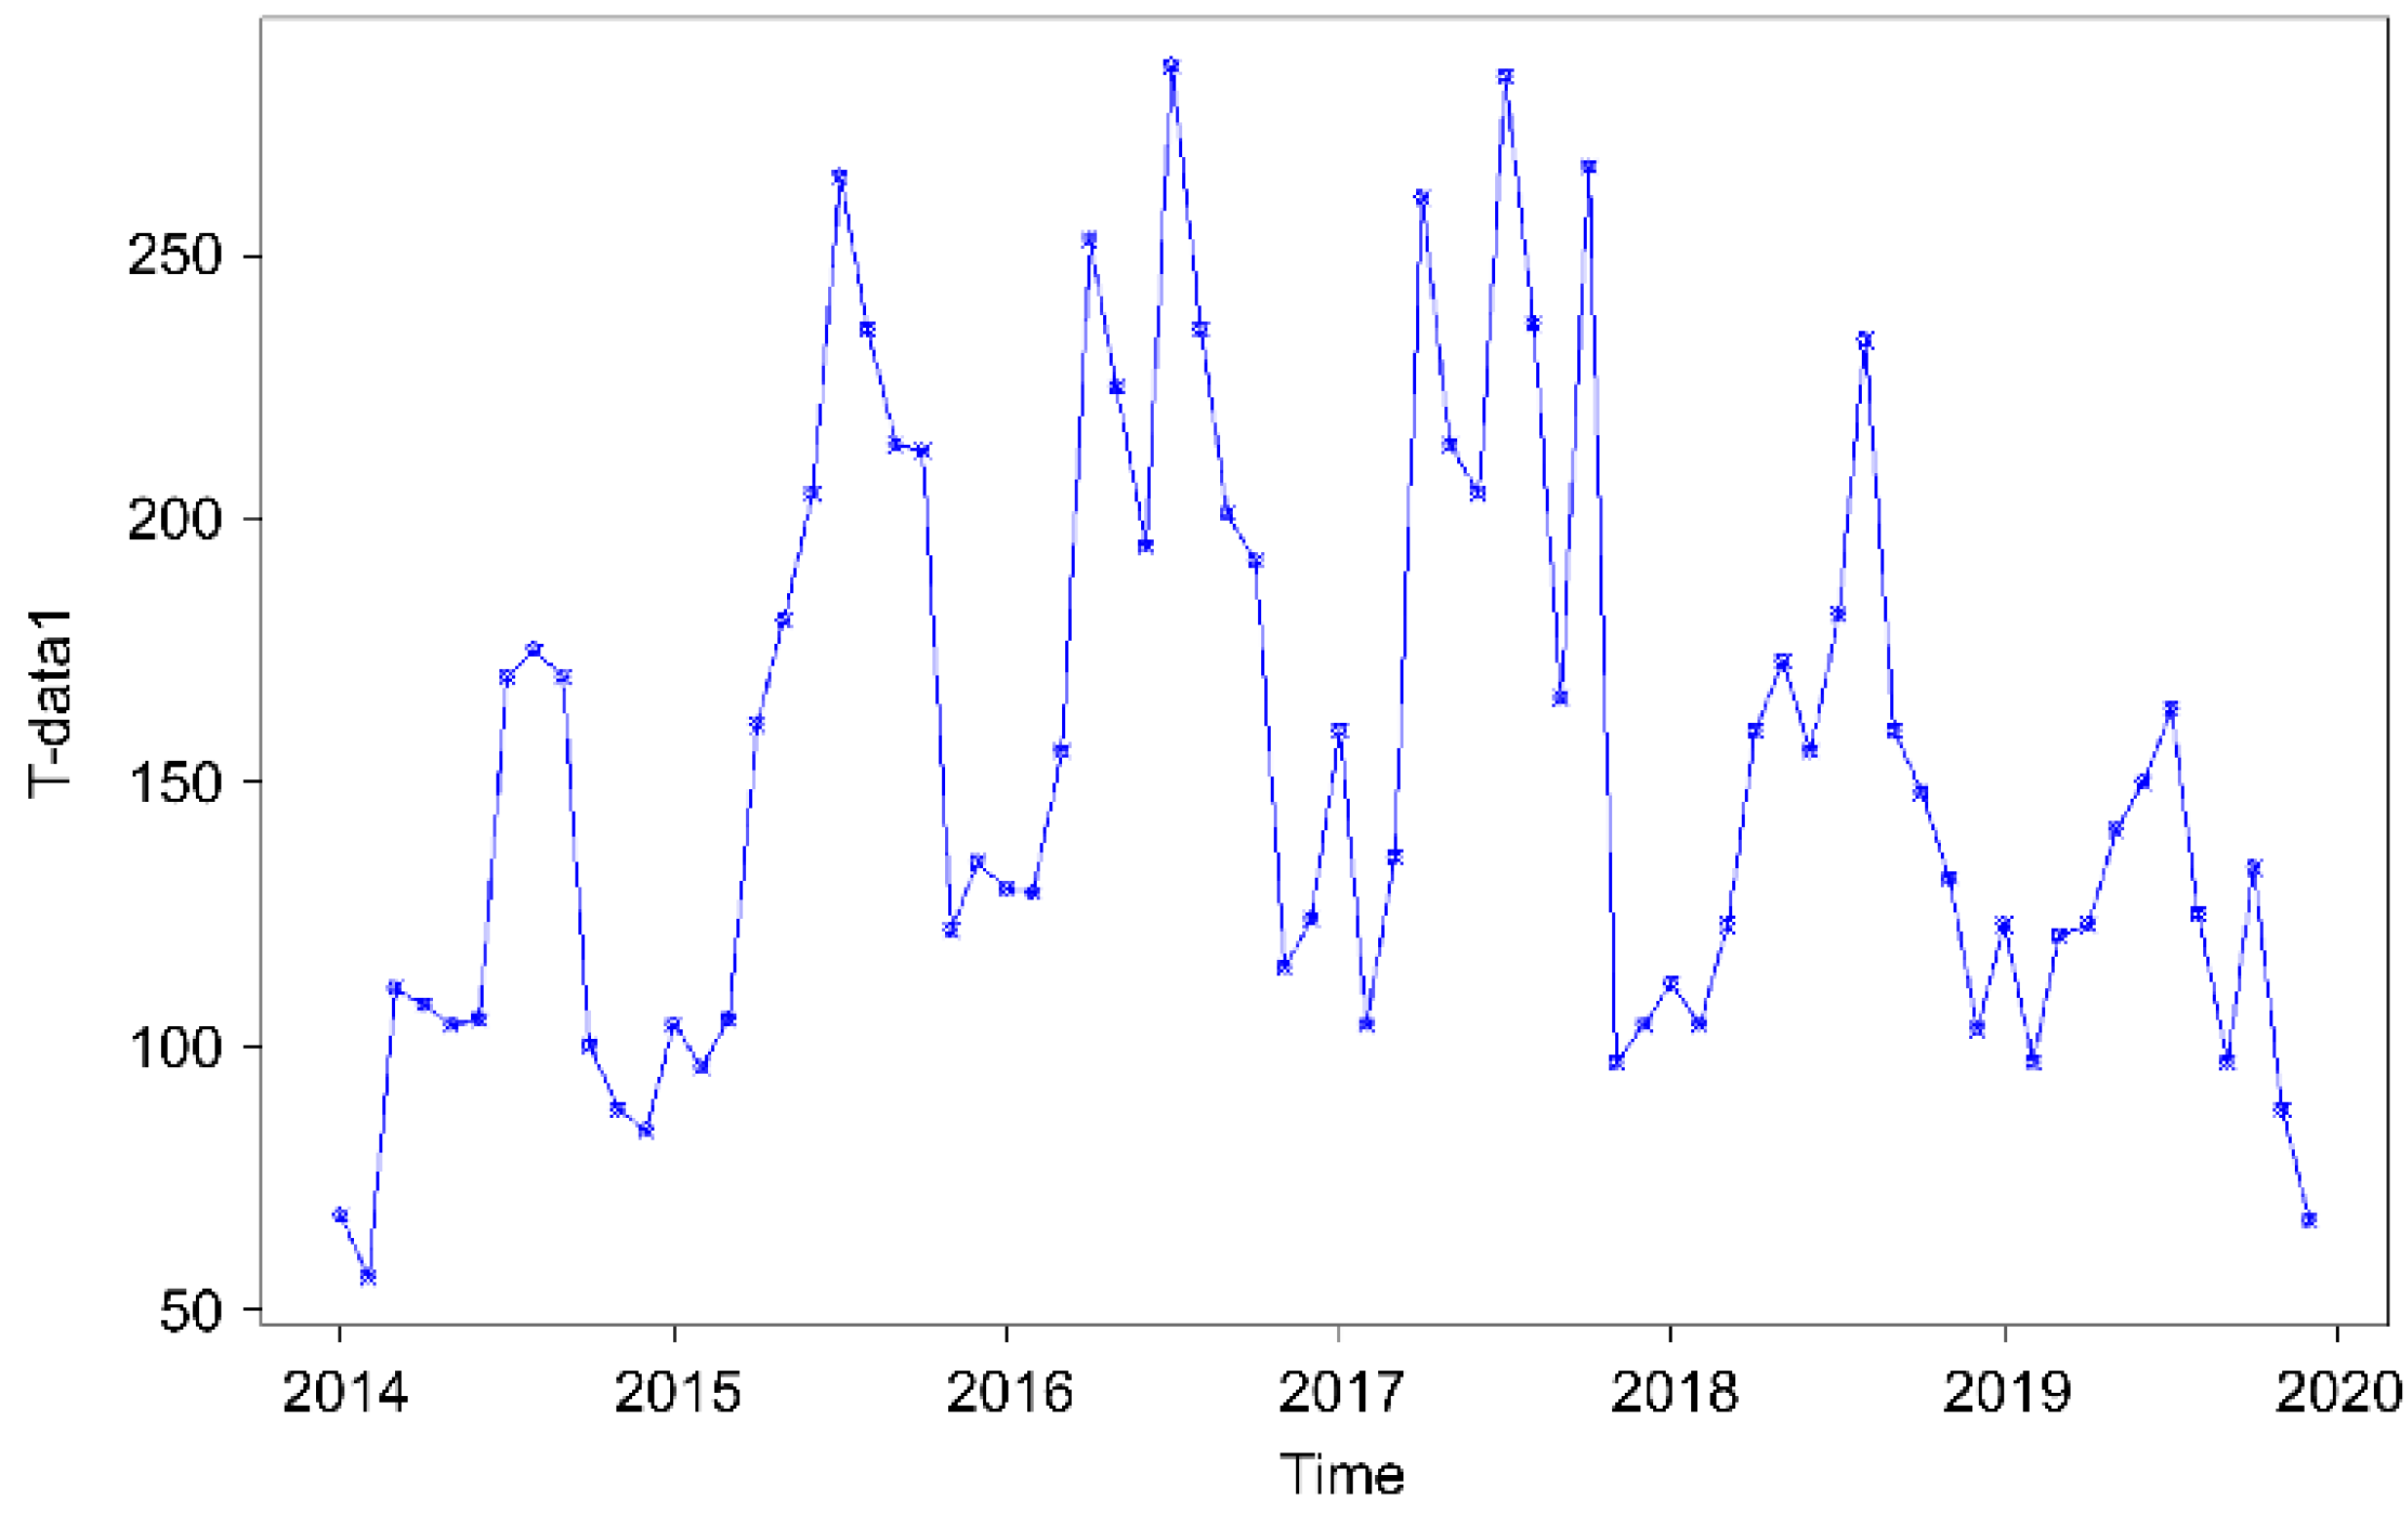
3.2. Results of Collating the Time-Series Dataset
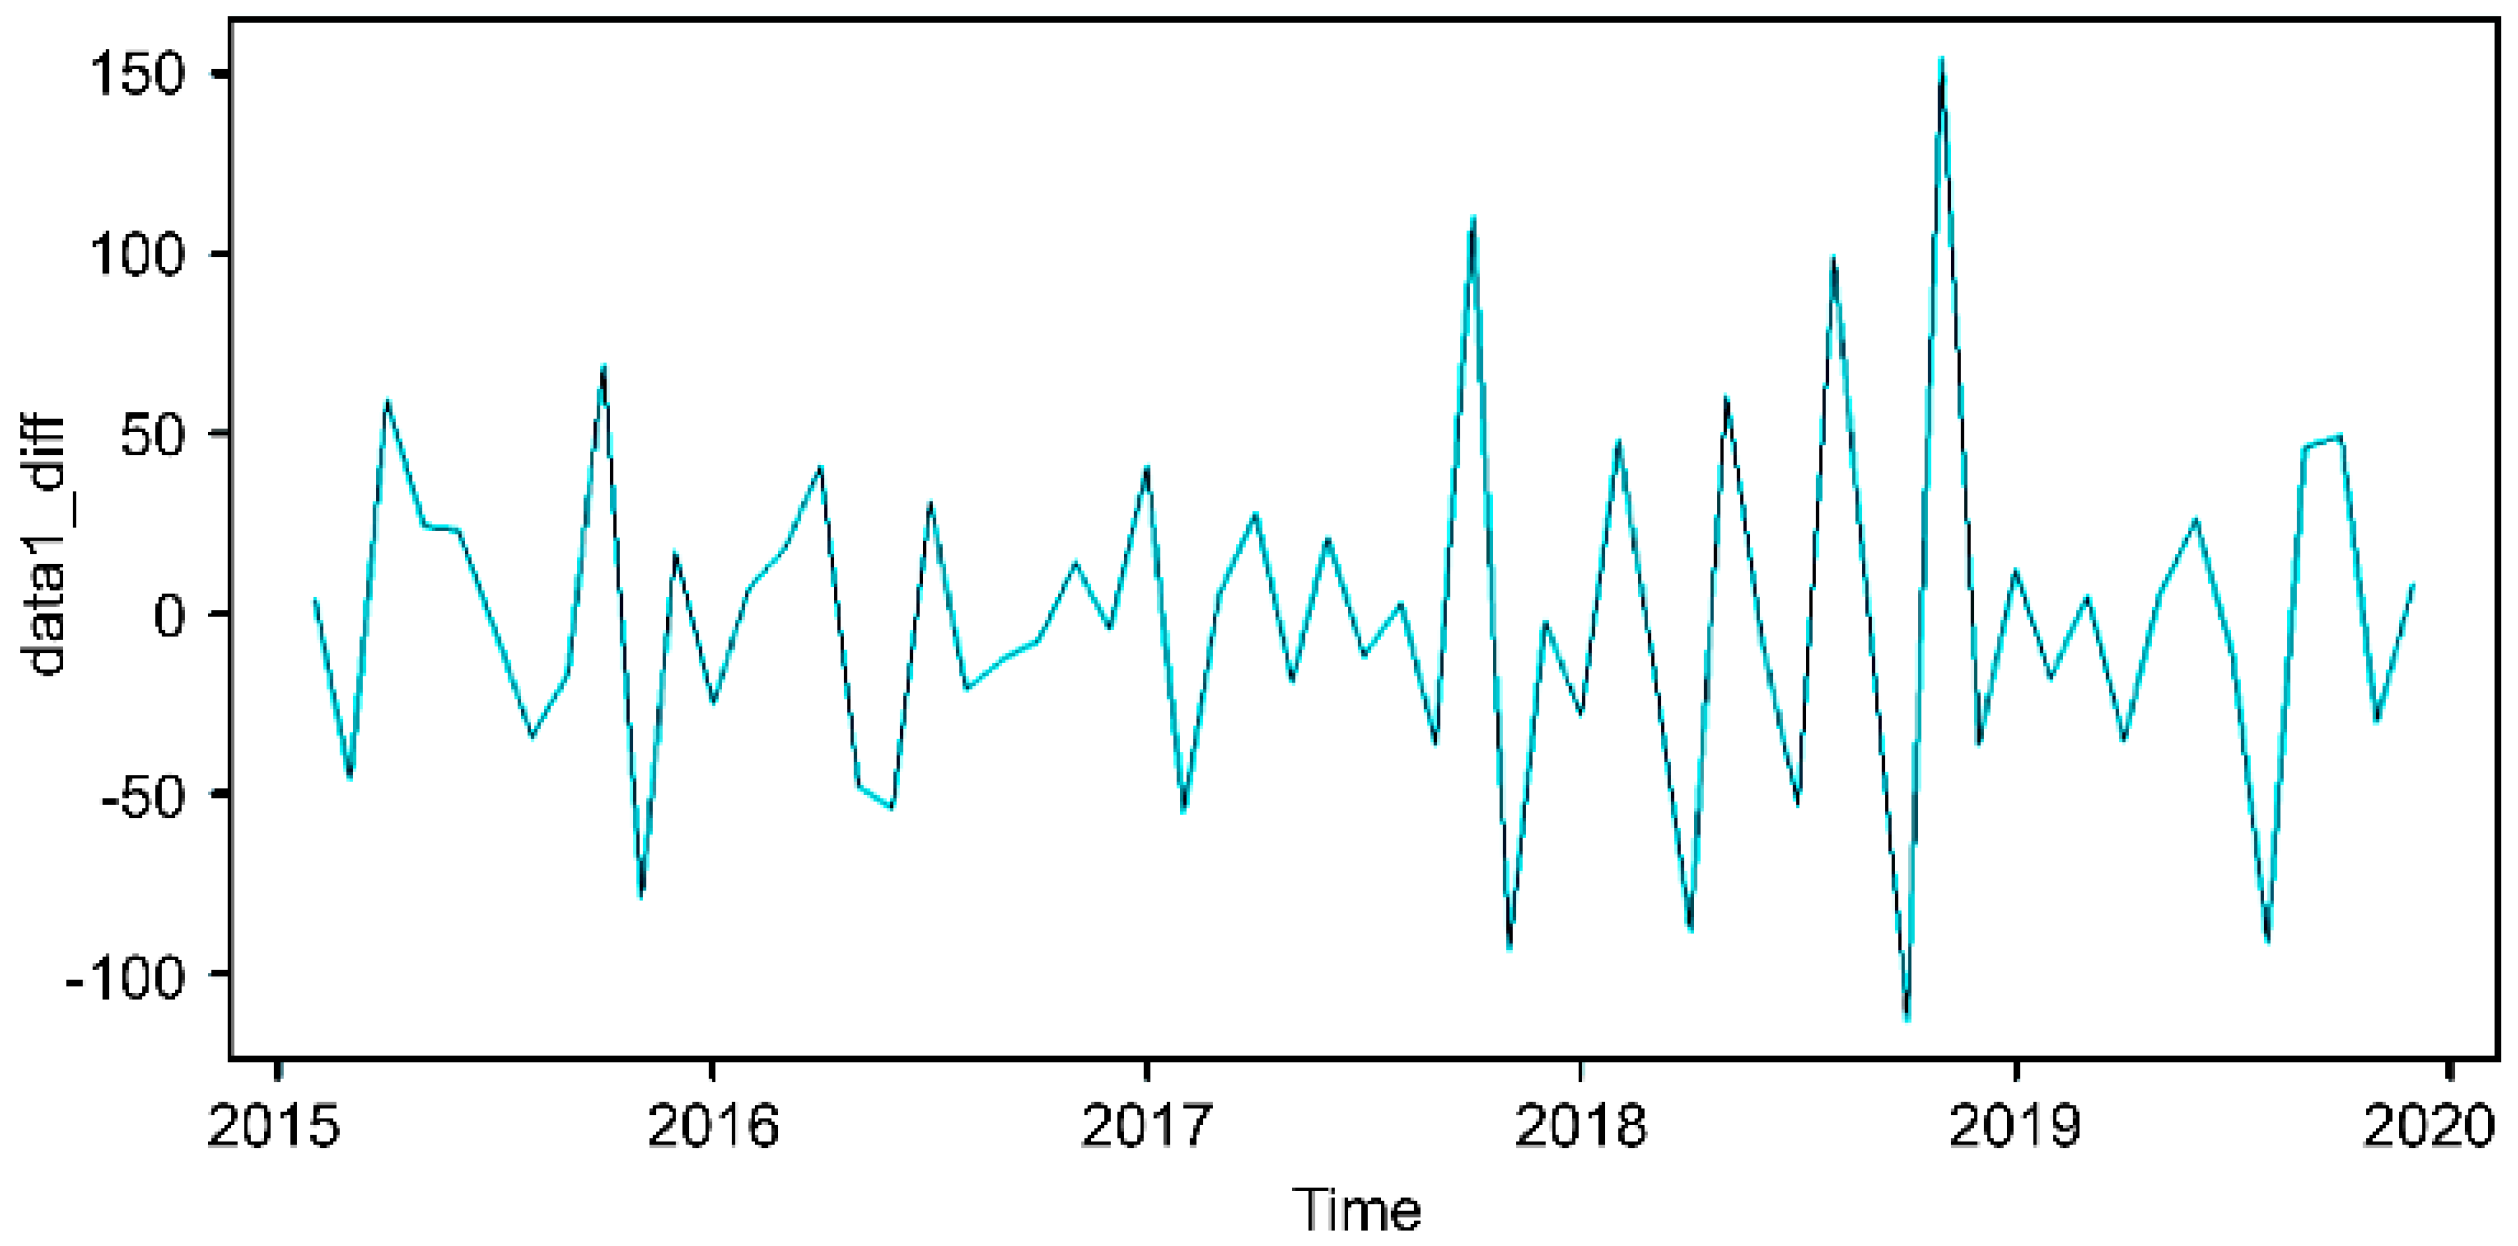
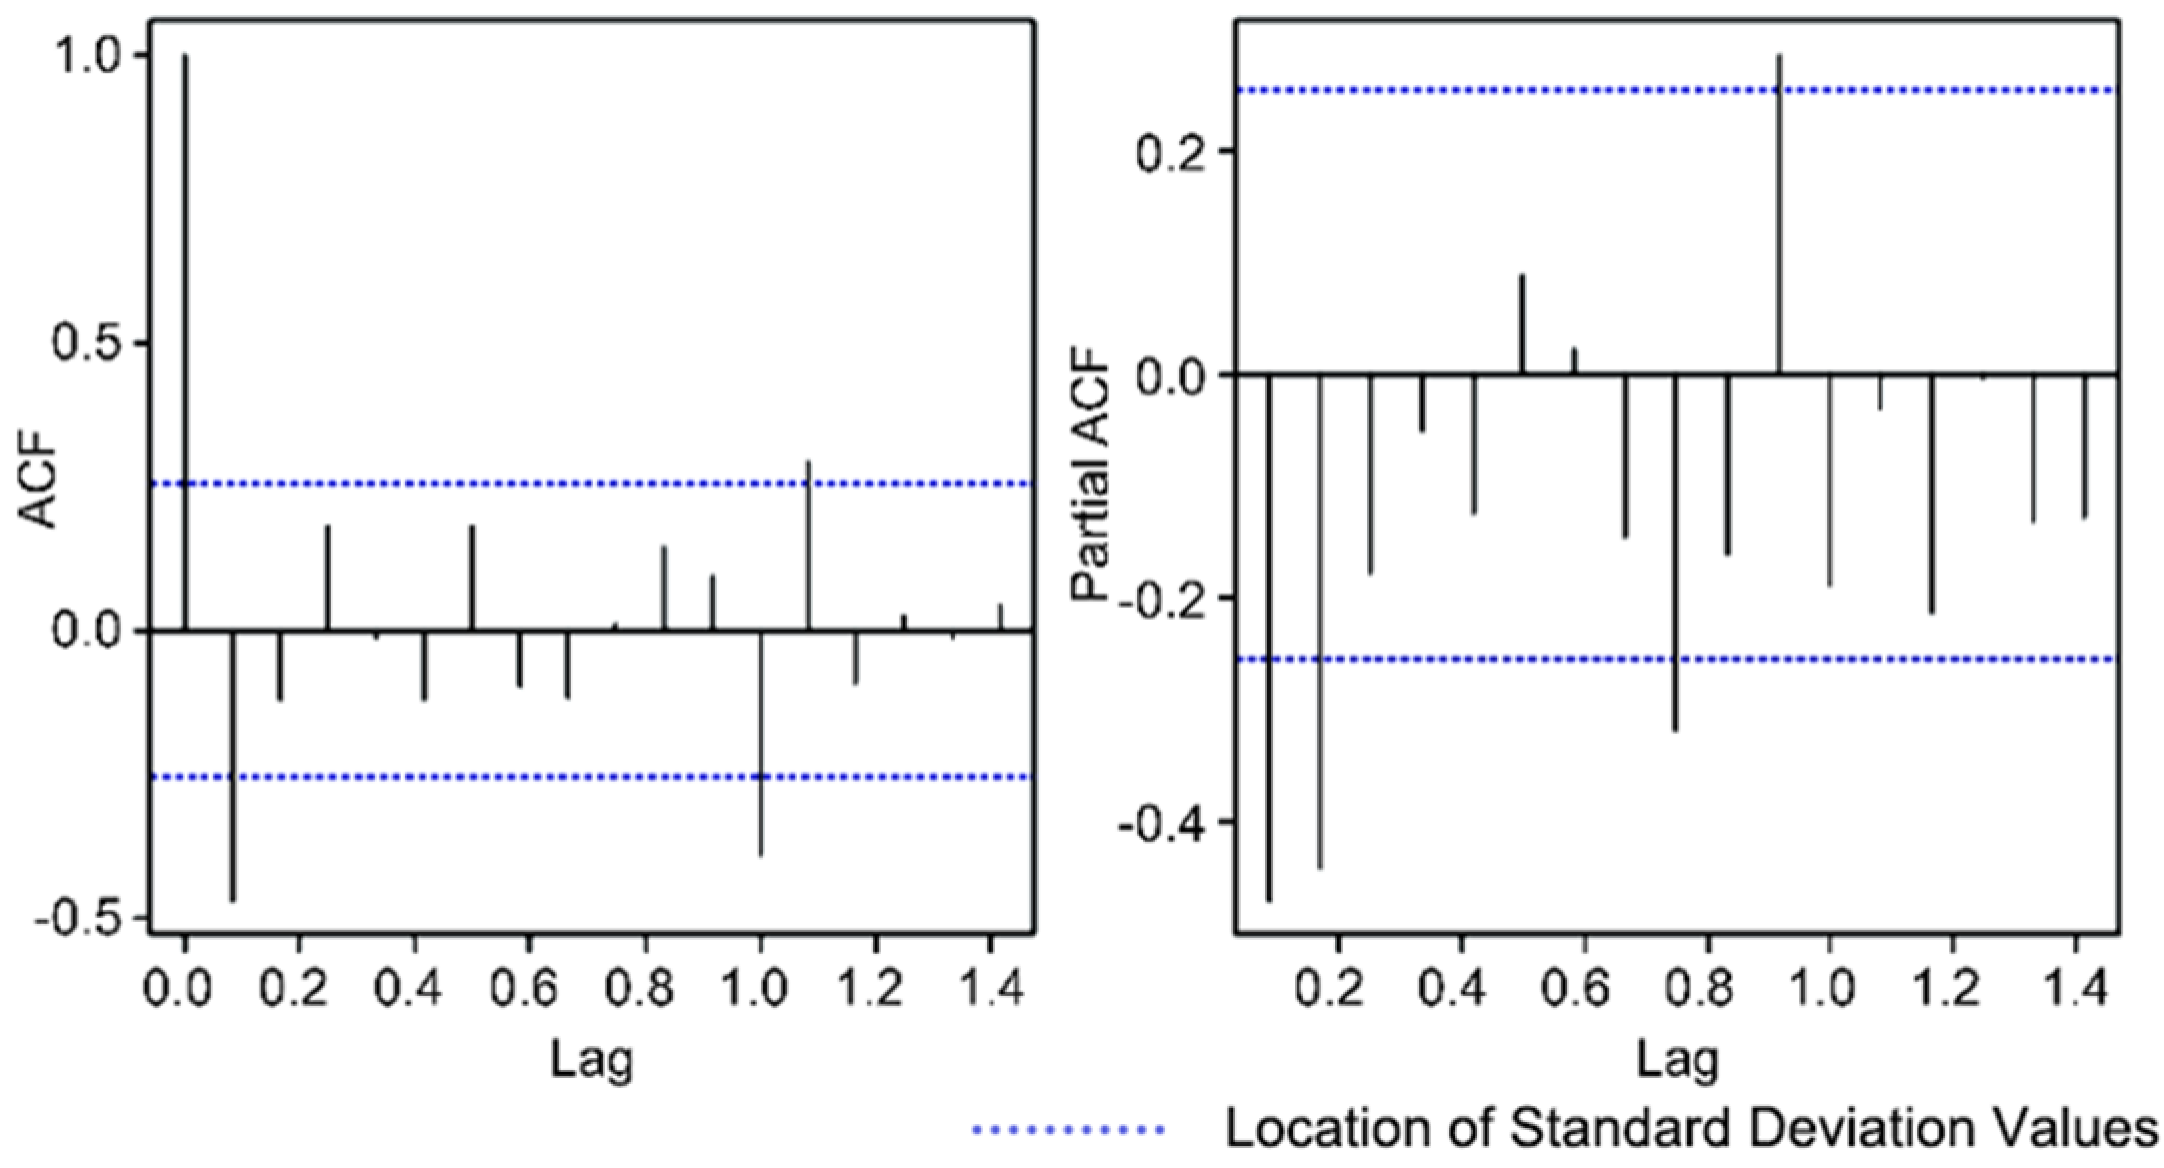
3.3. Results of the Time-Series Modeling
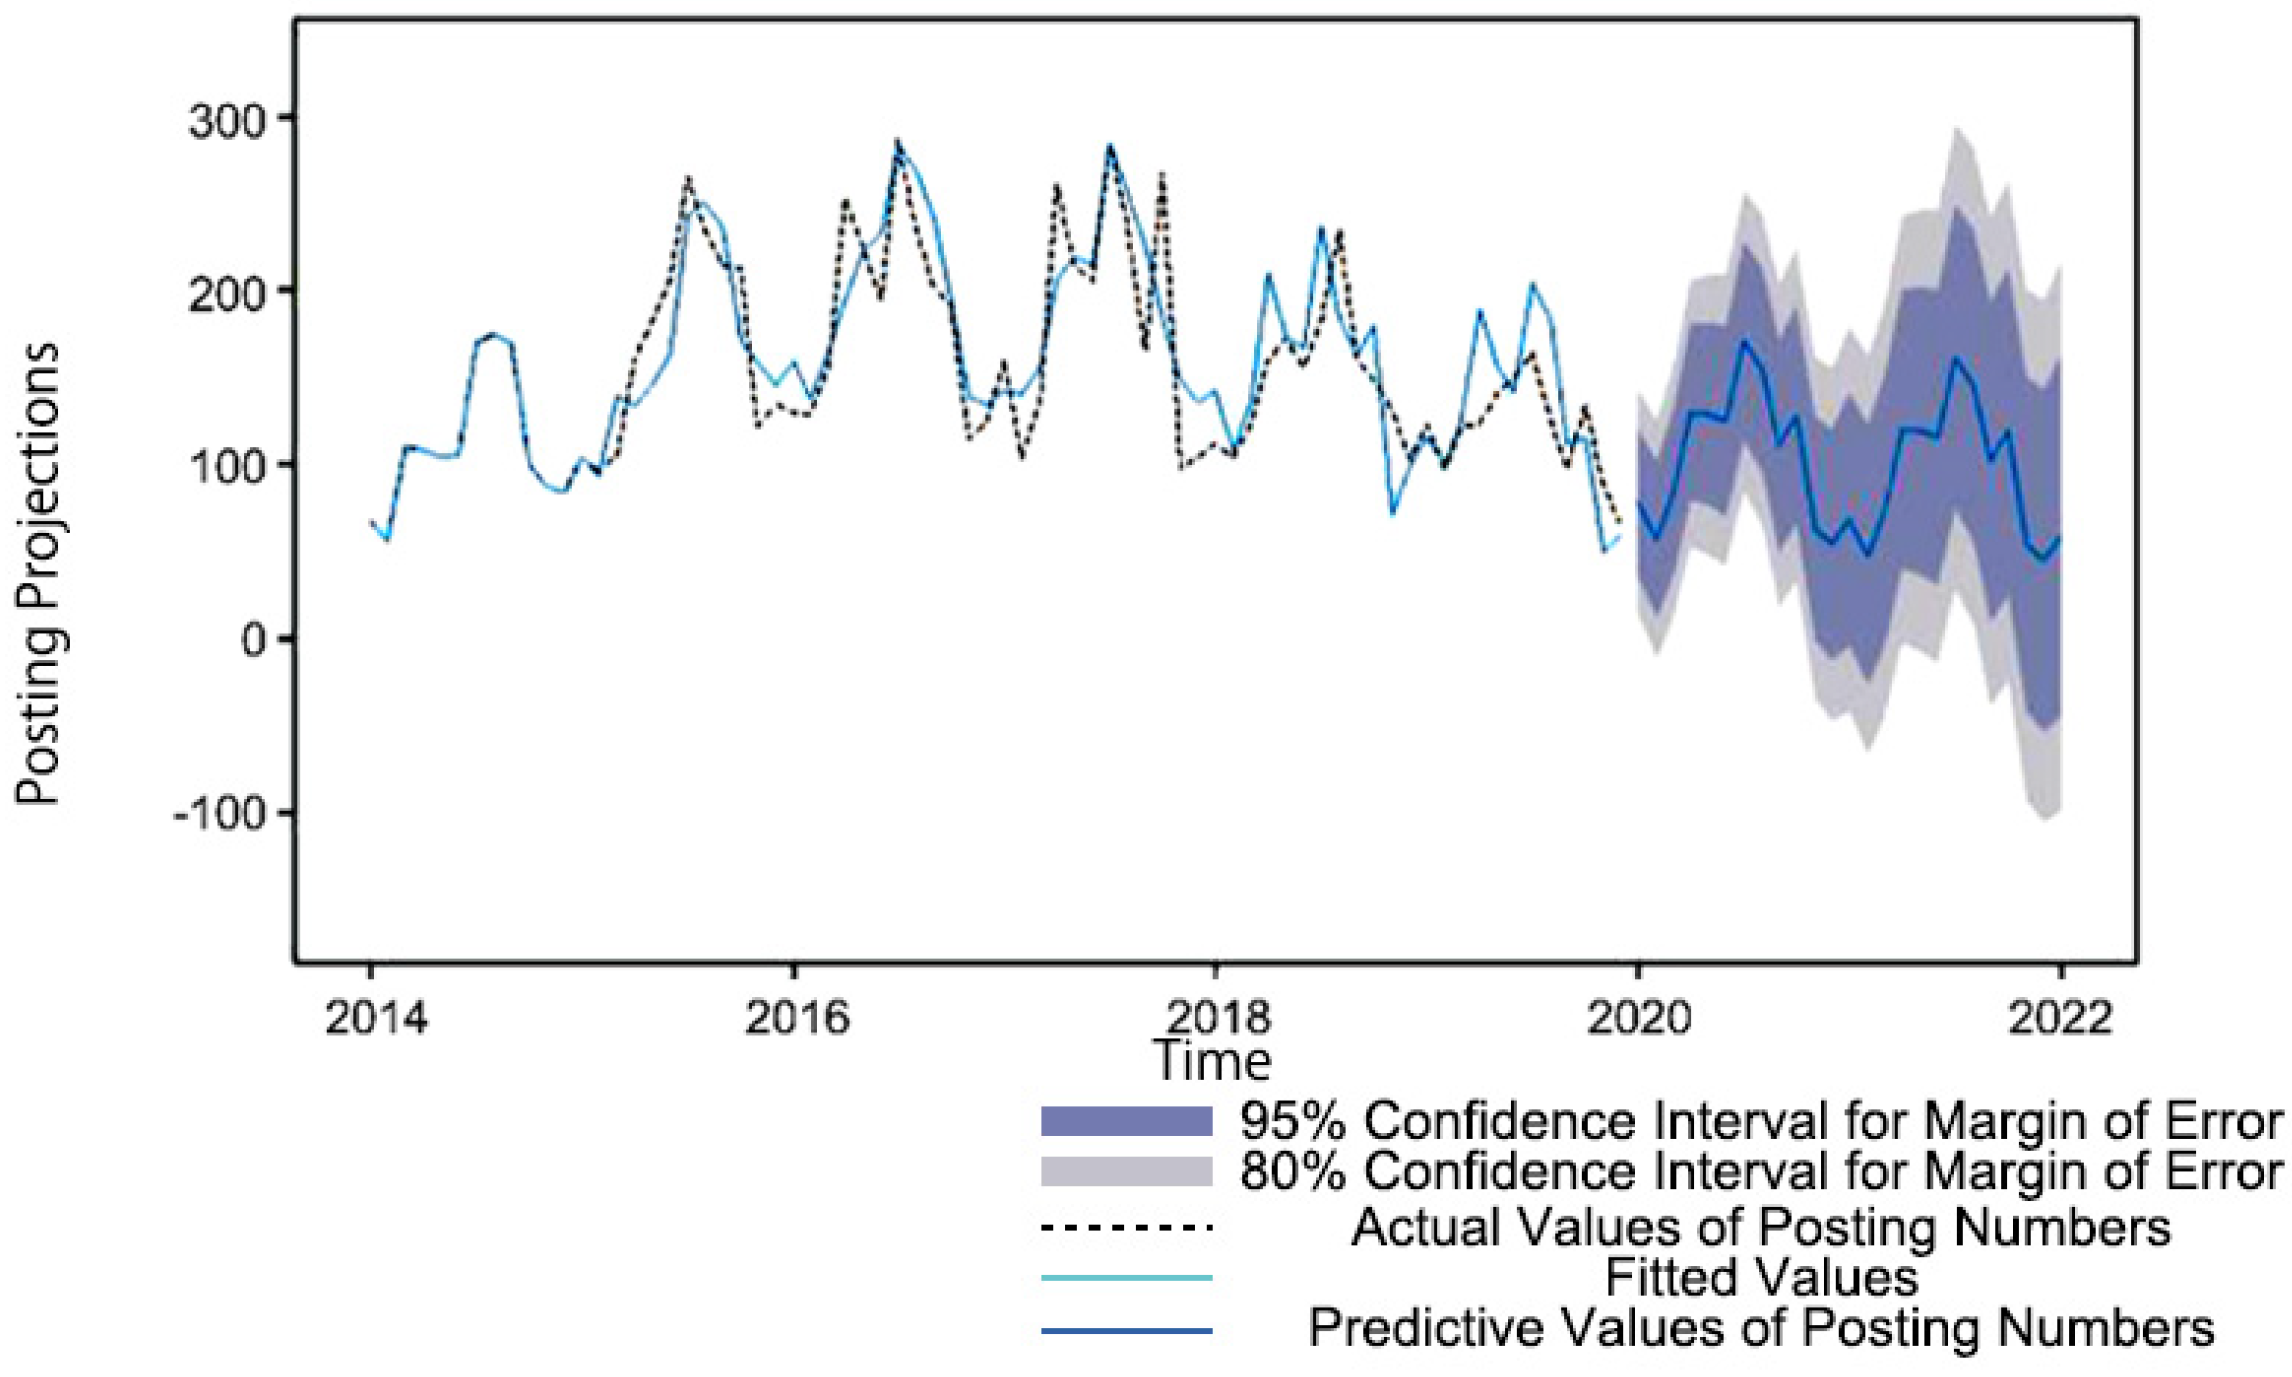
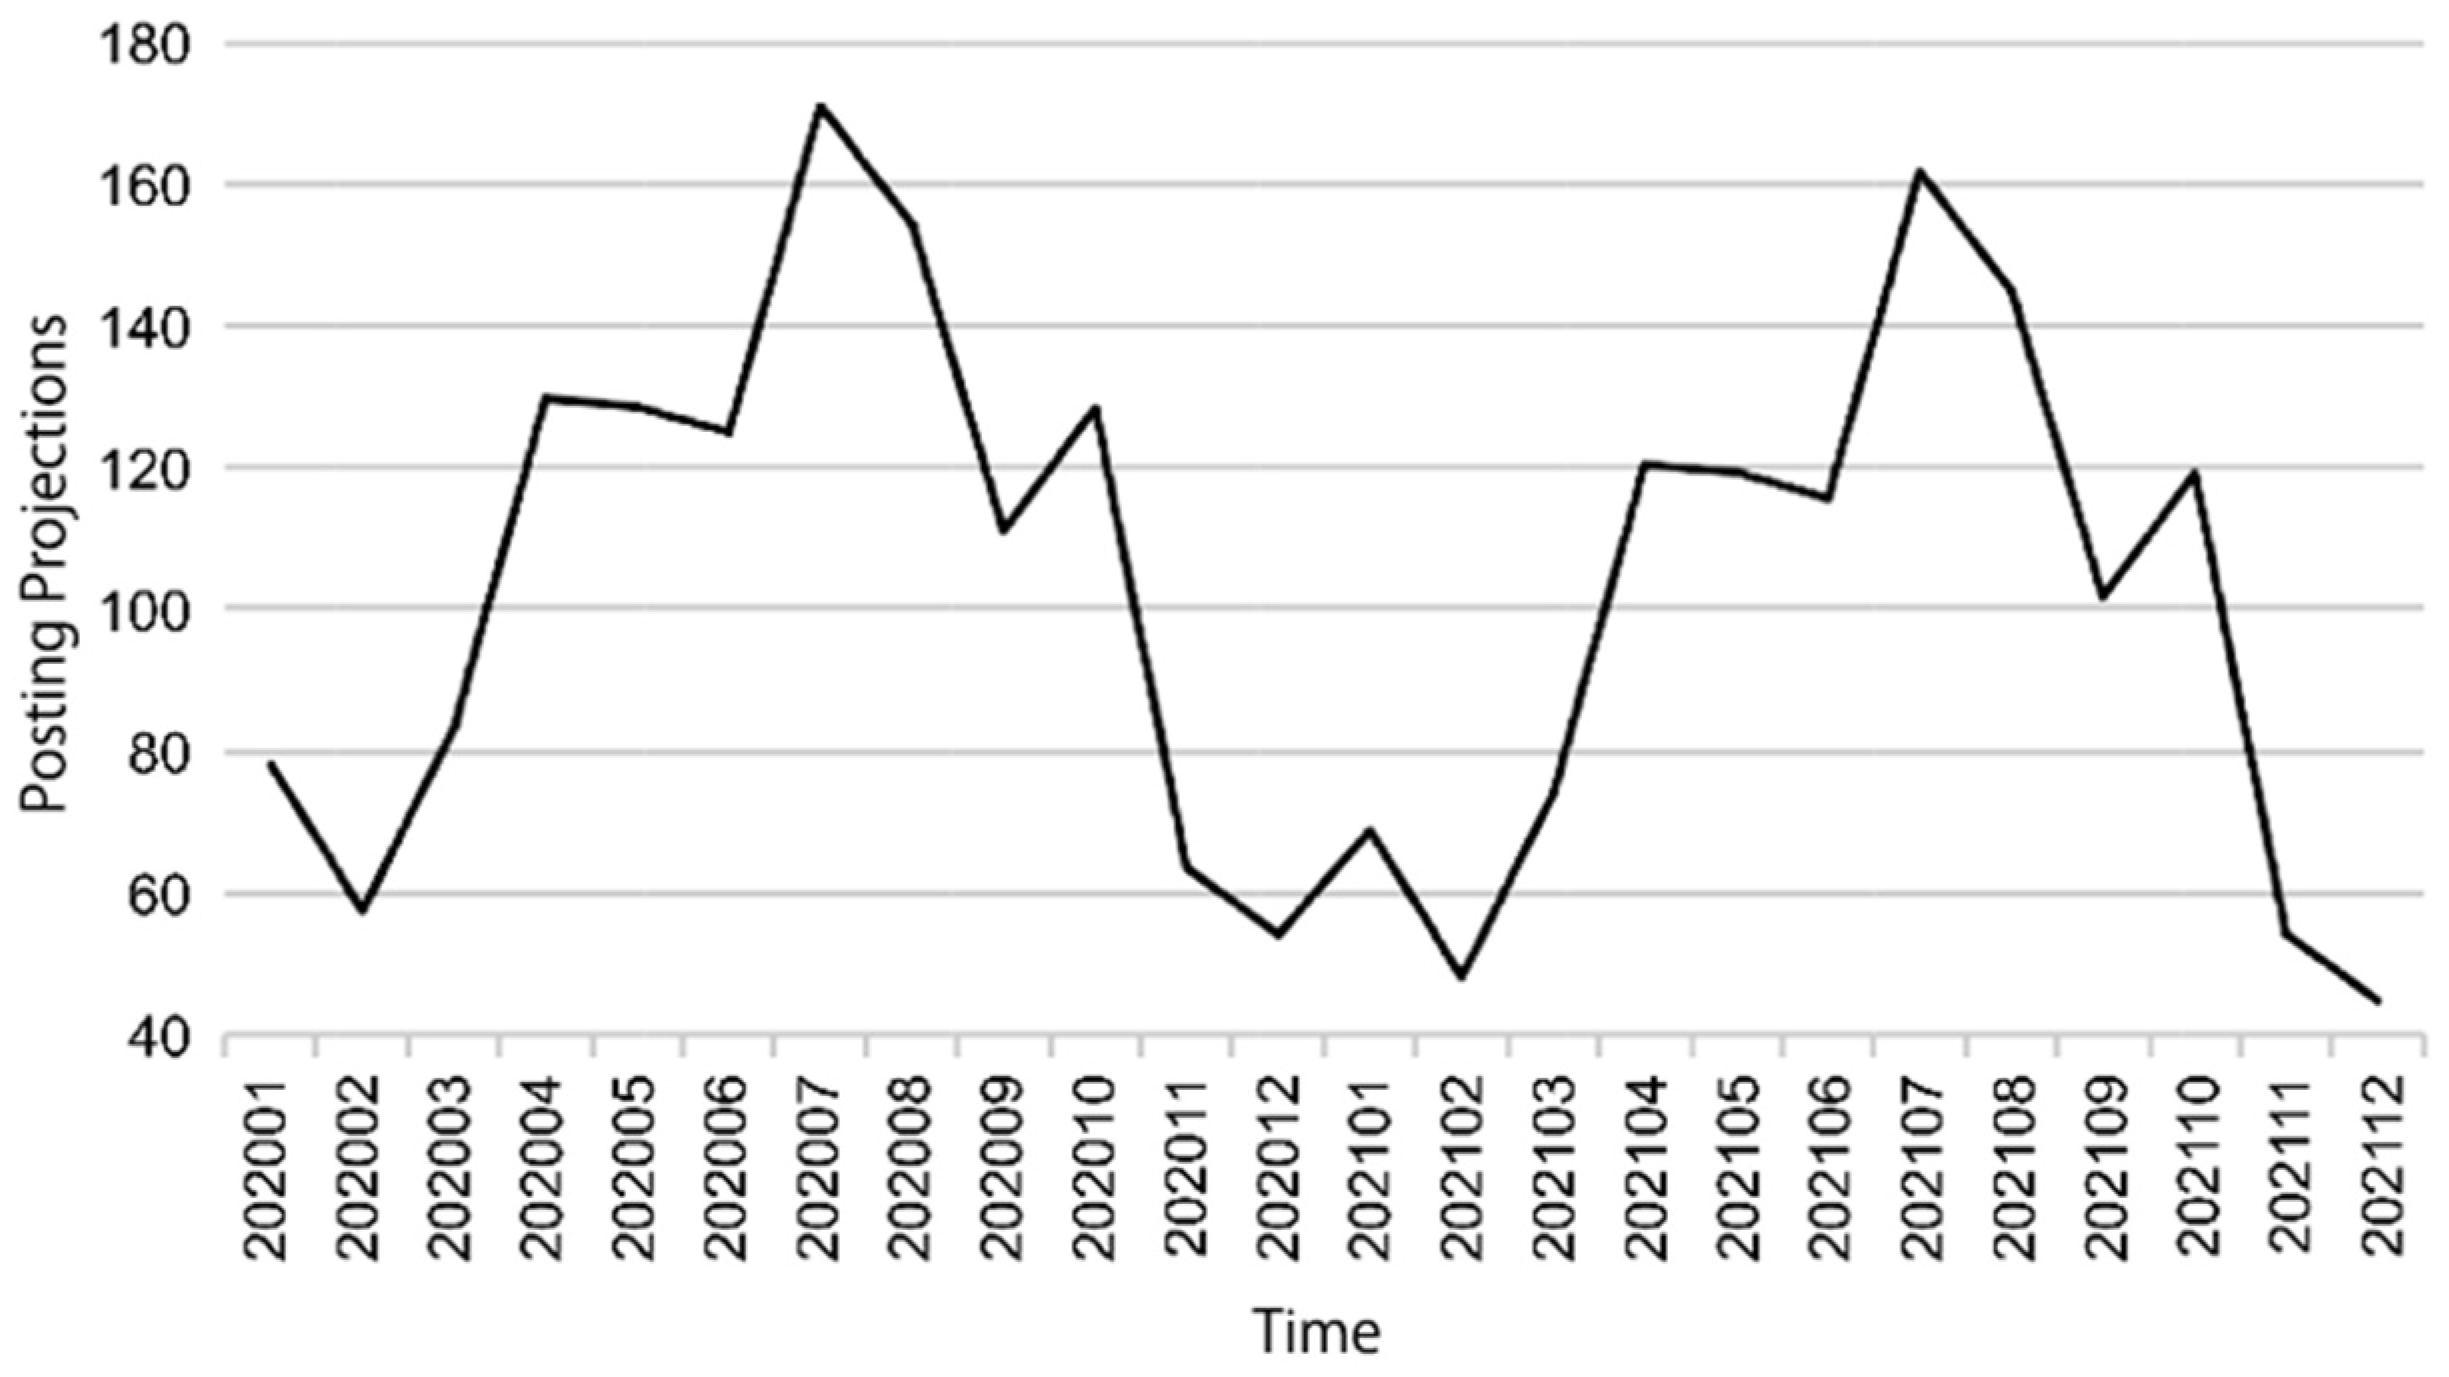
3.3.1. An ARIMA Model for Ocean-Area UGS
- (a)
- Modeling
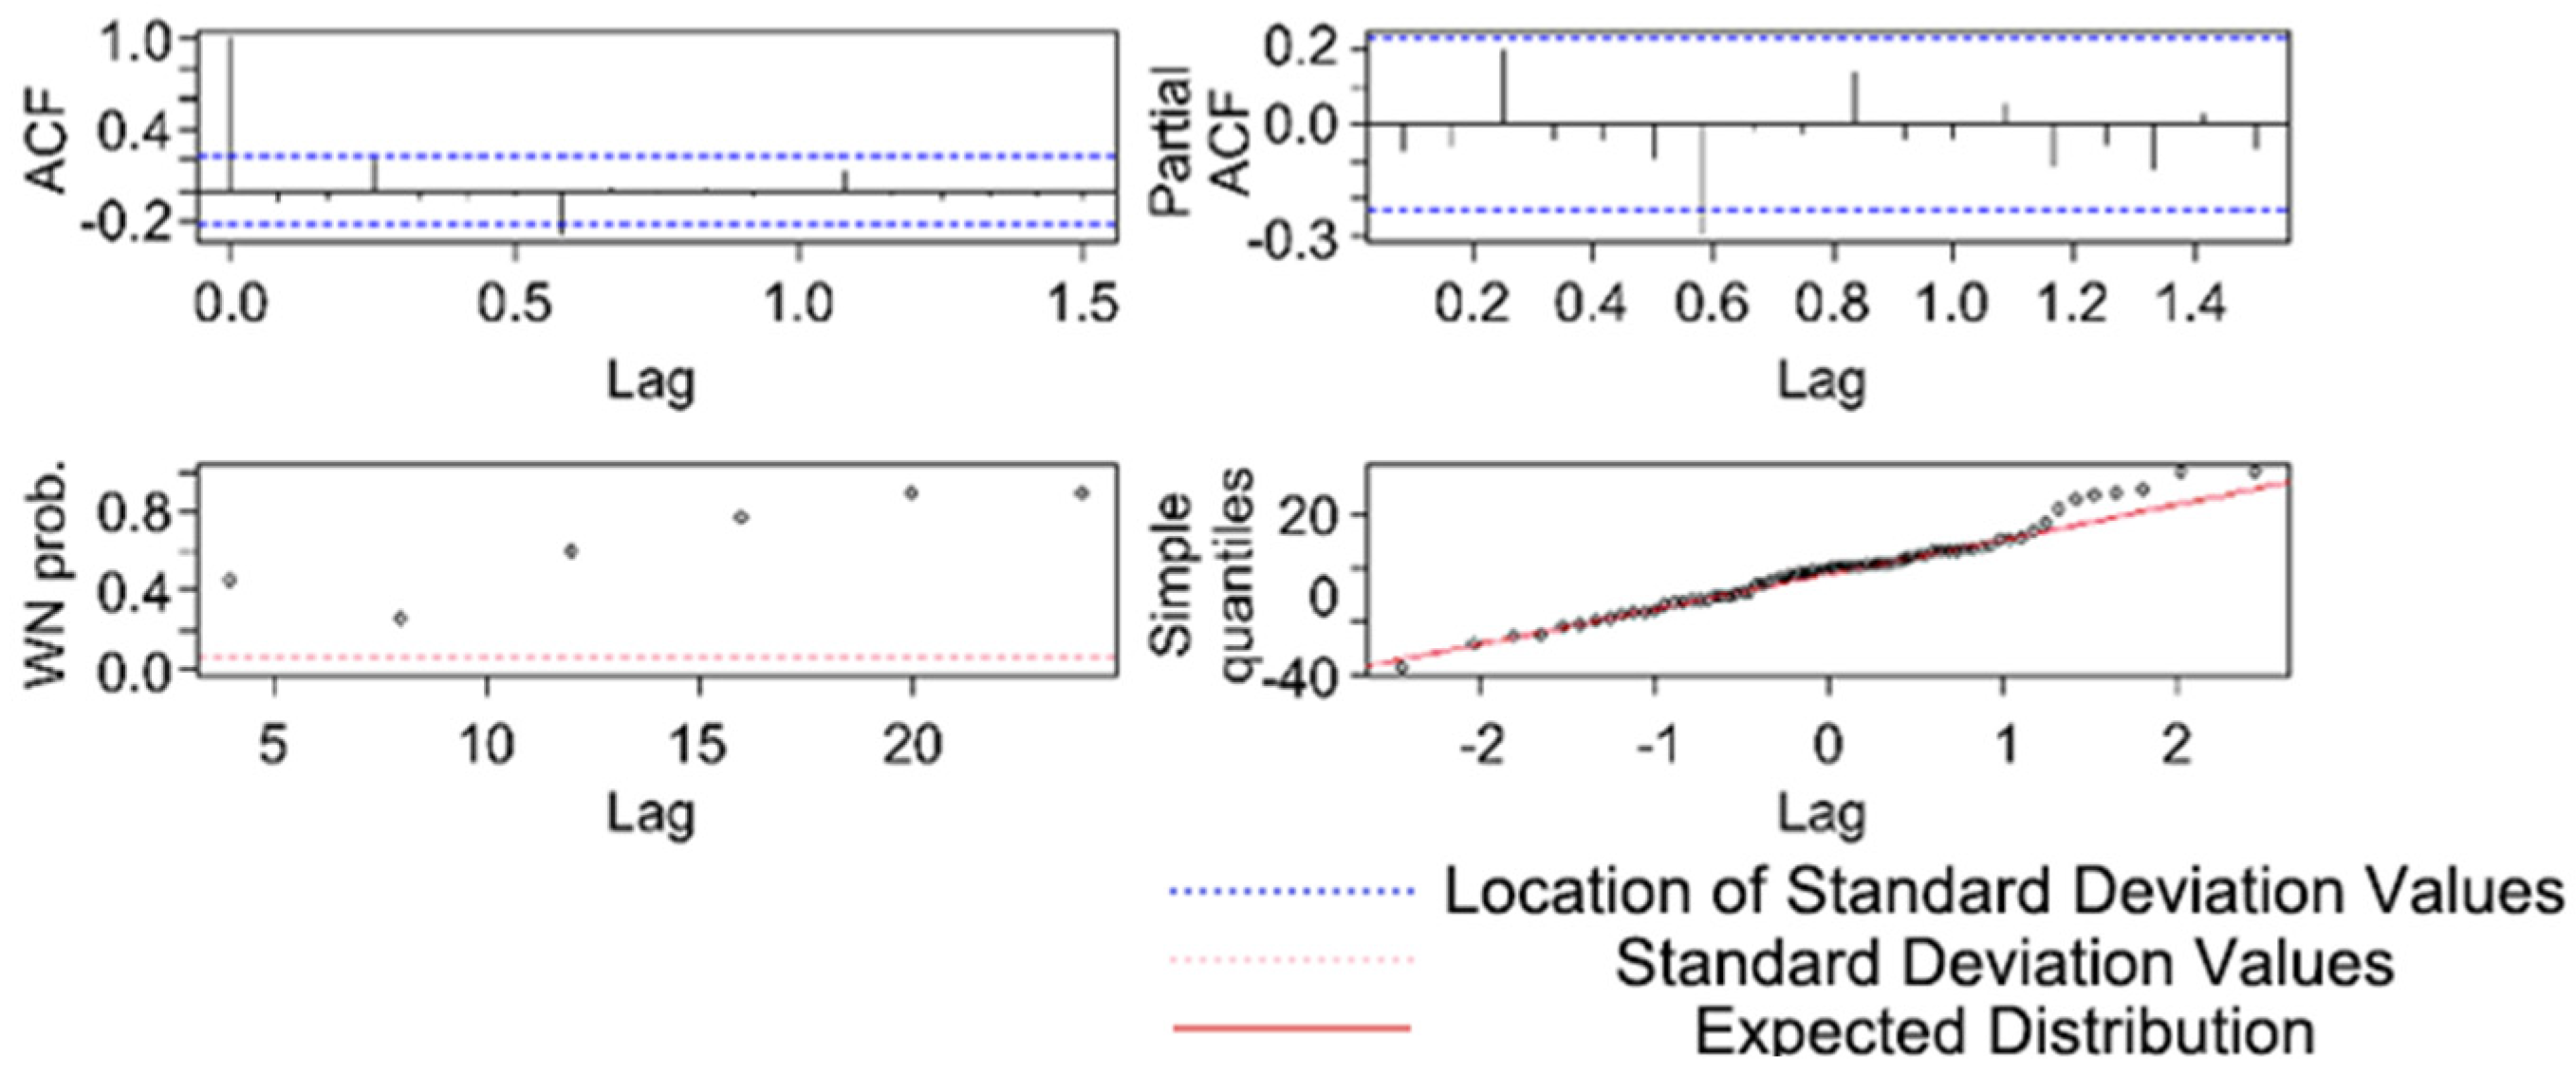
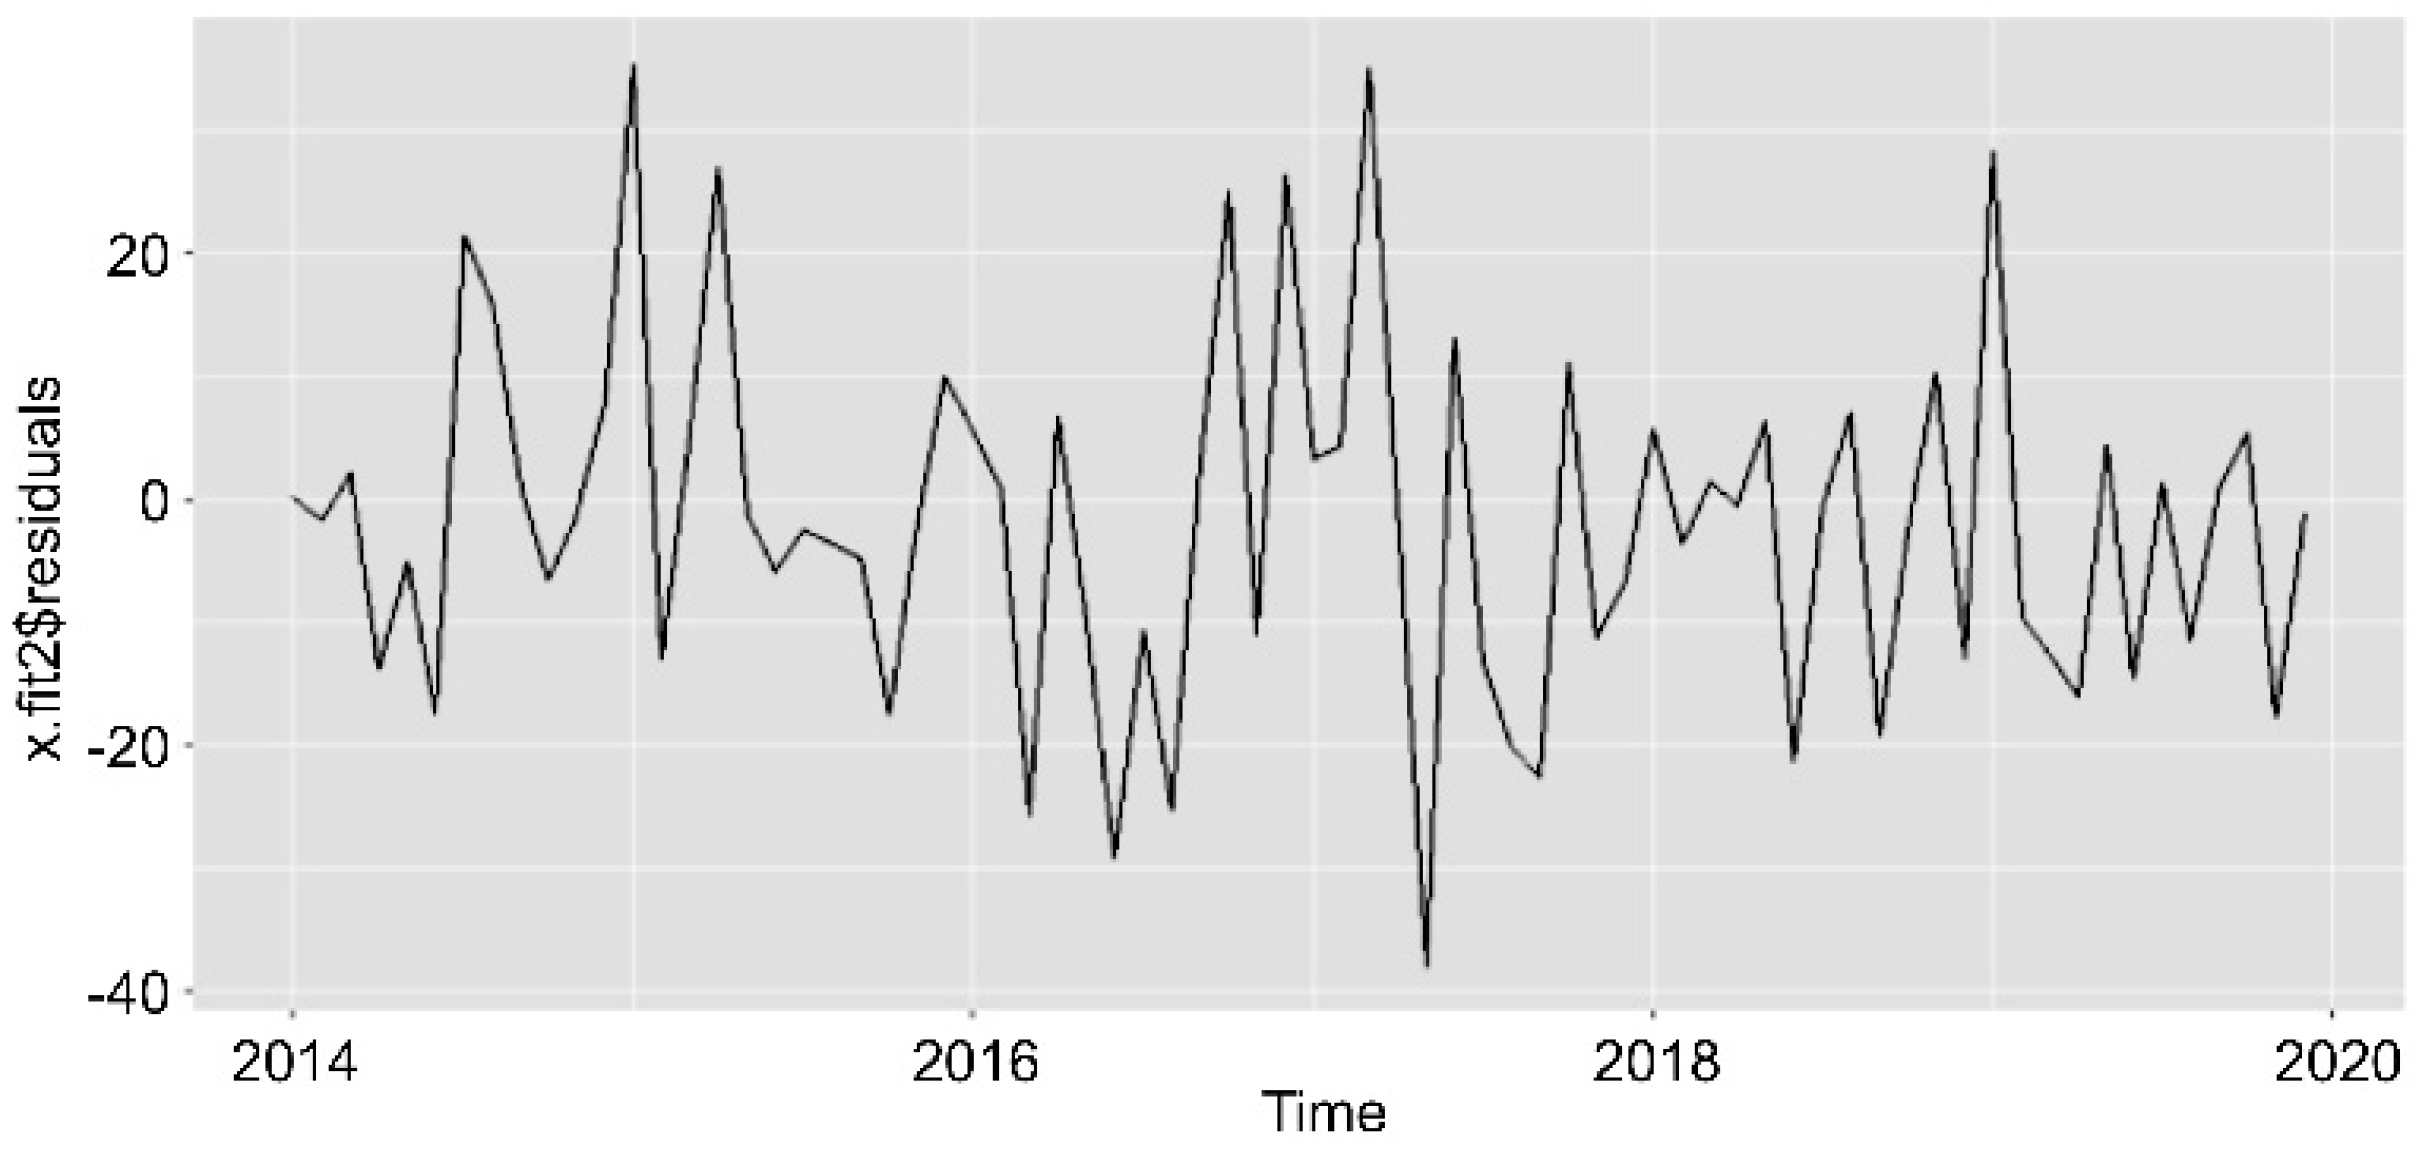
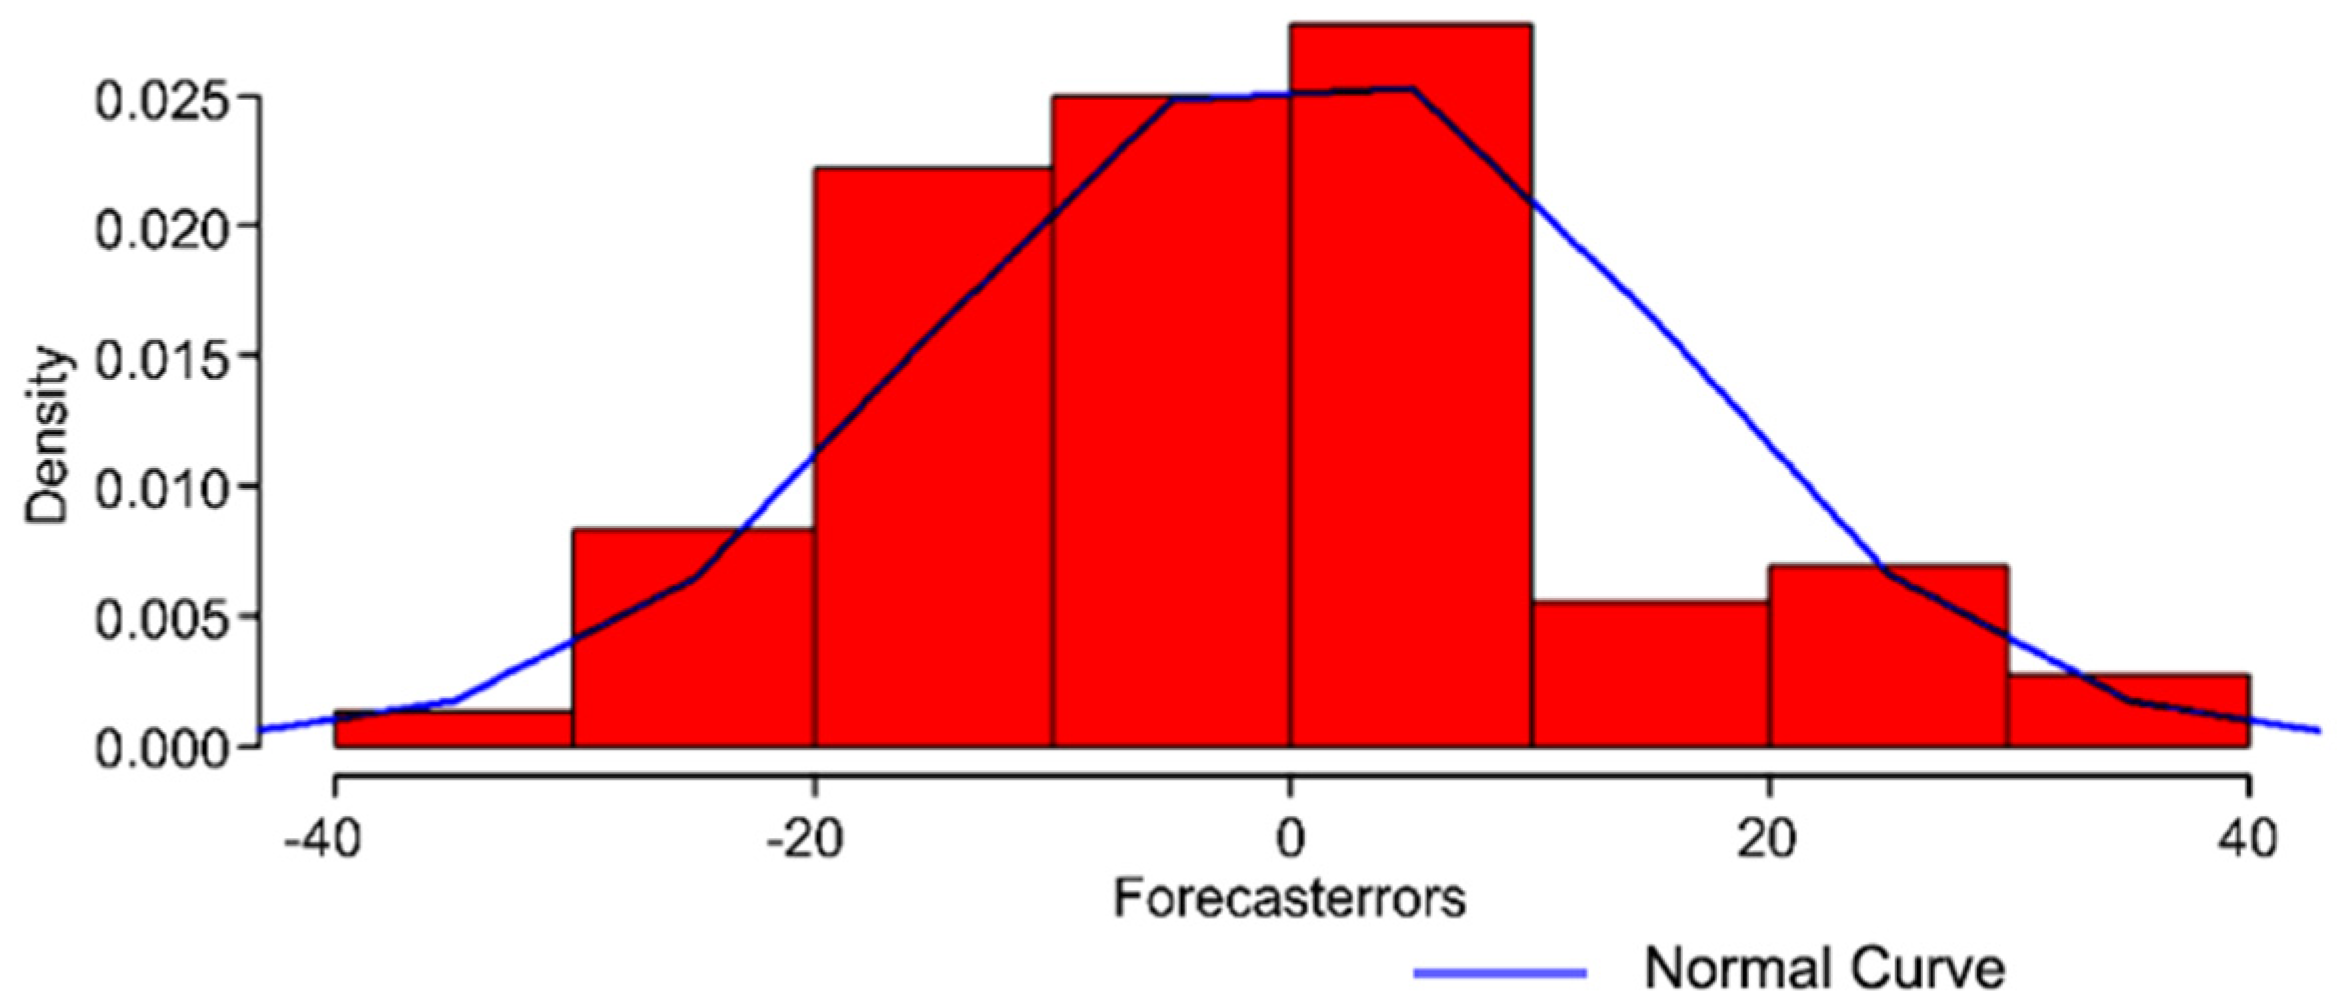
- (b) Testing the Model
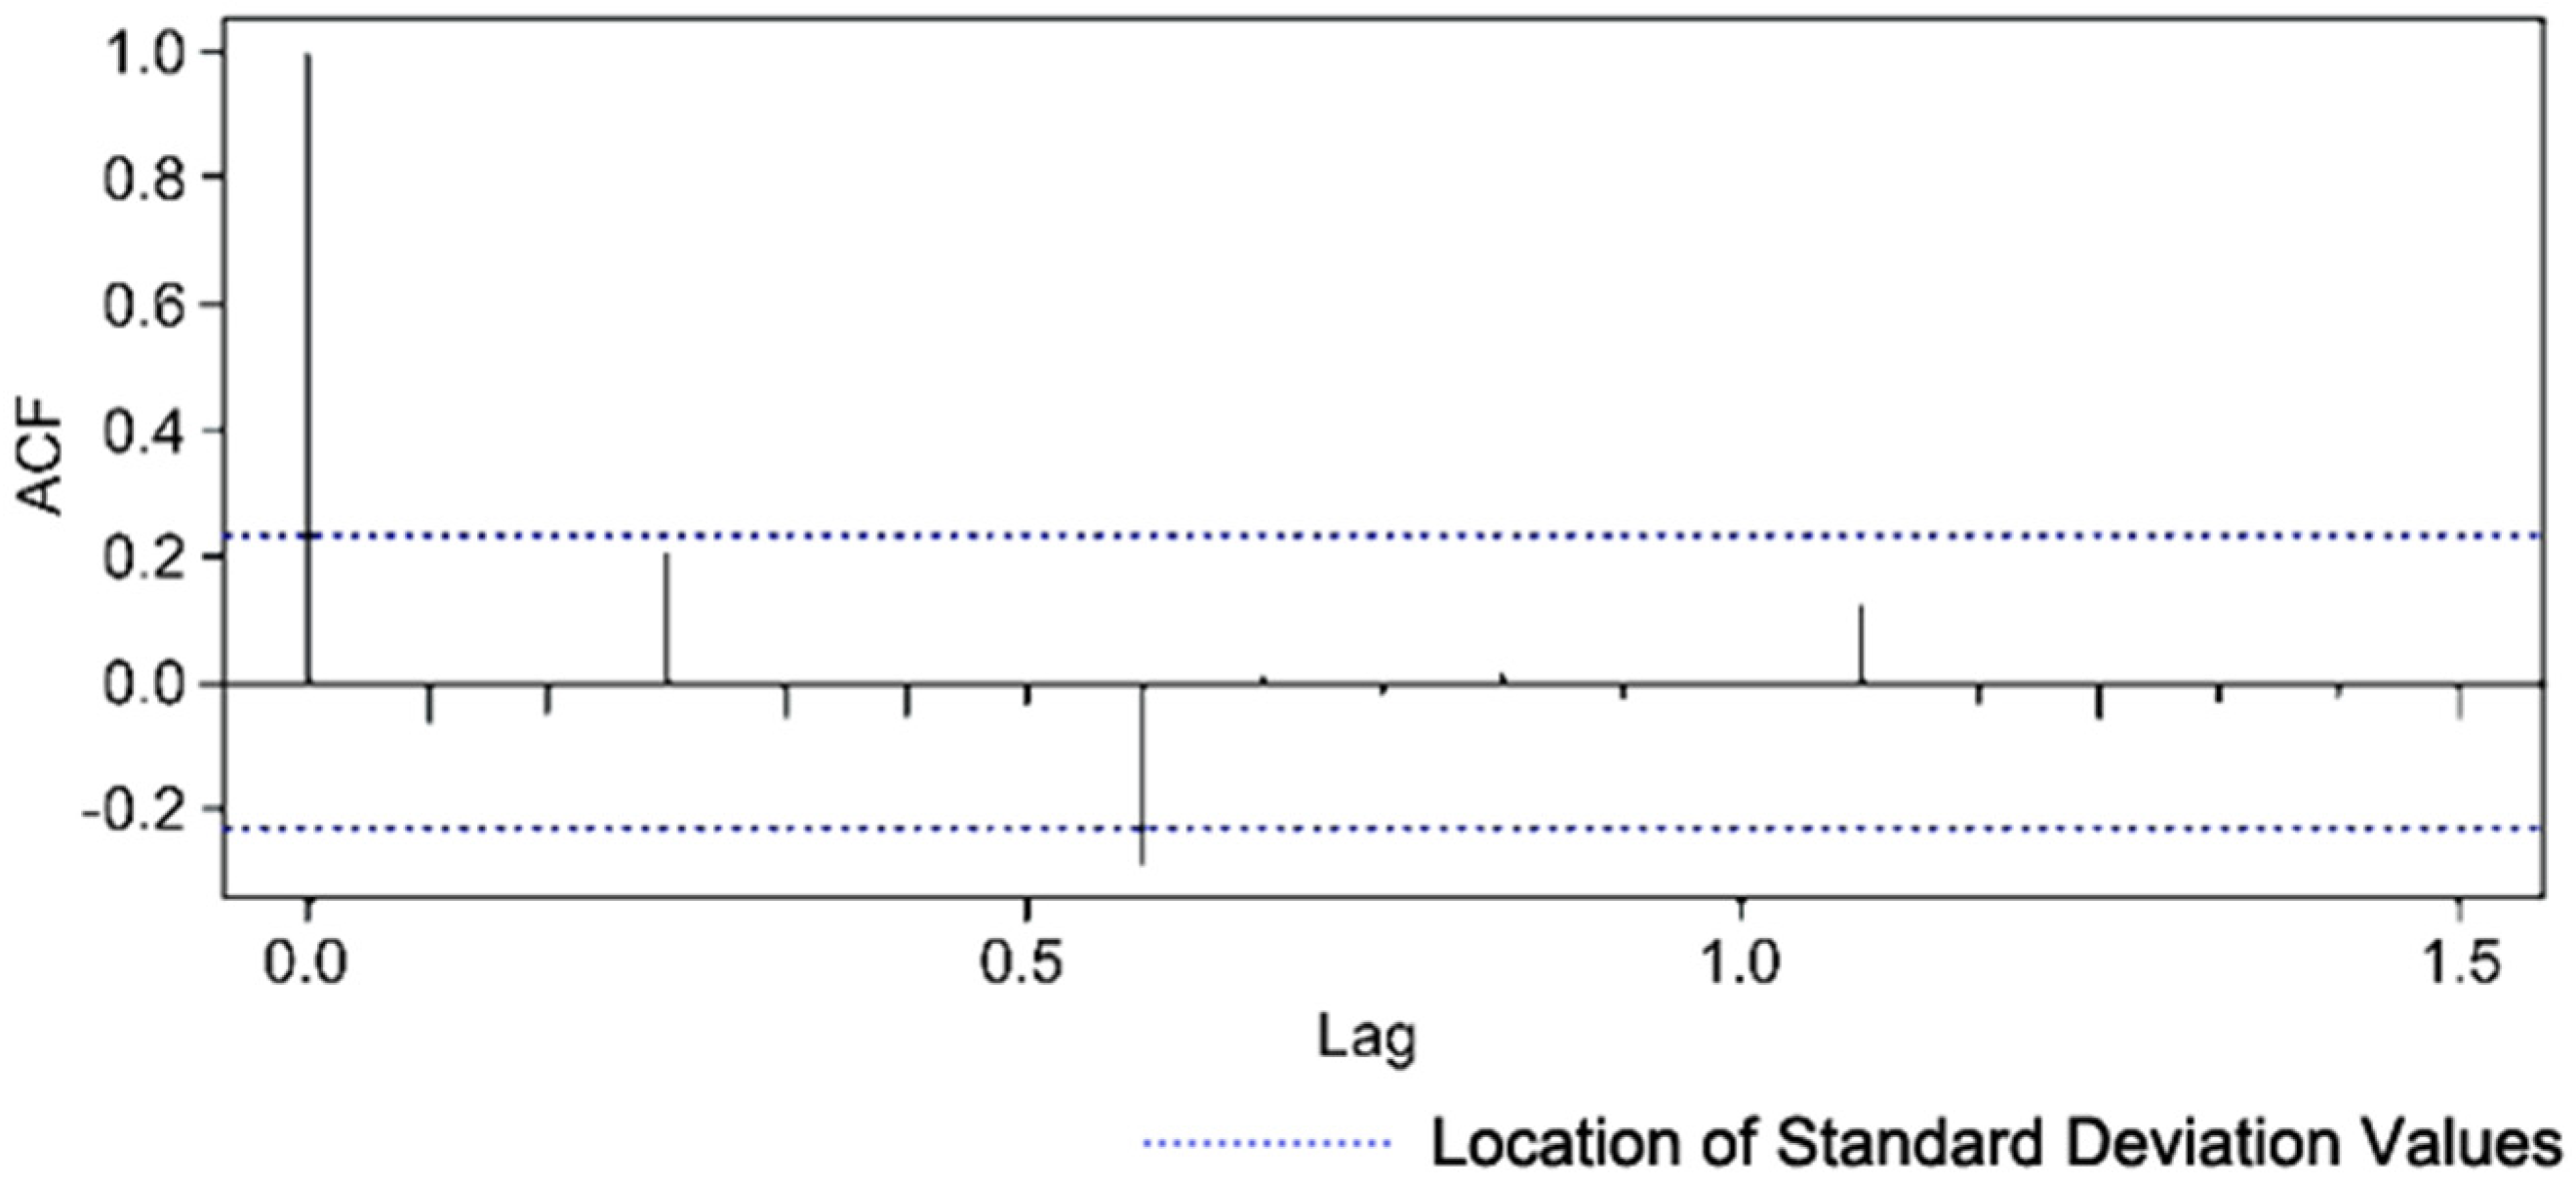
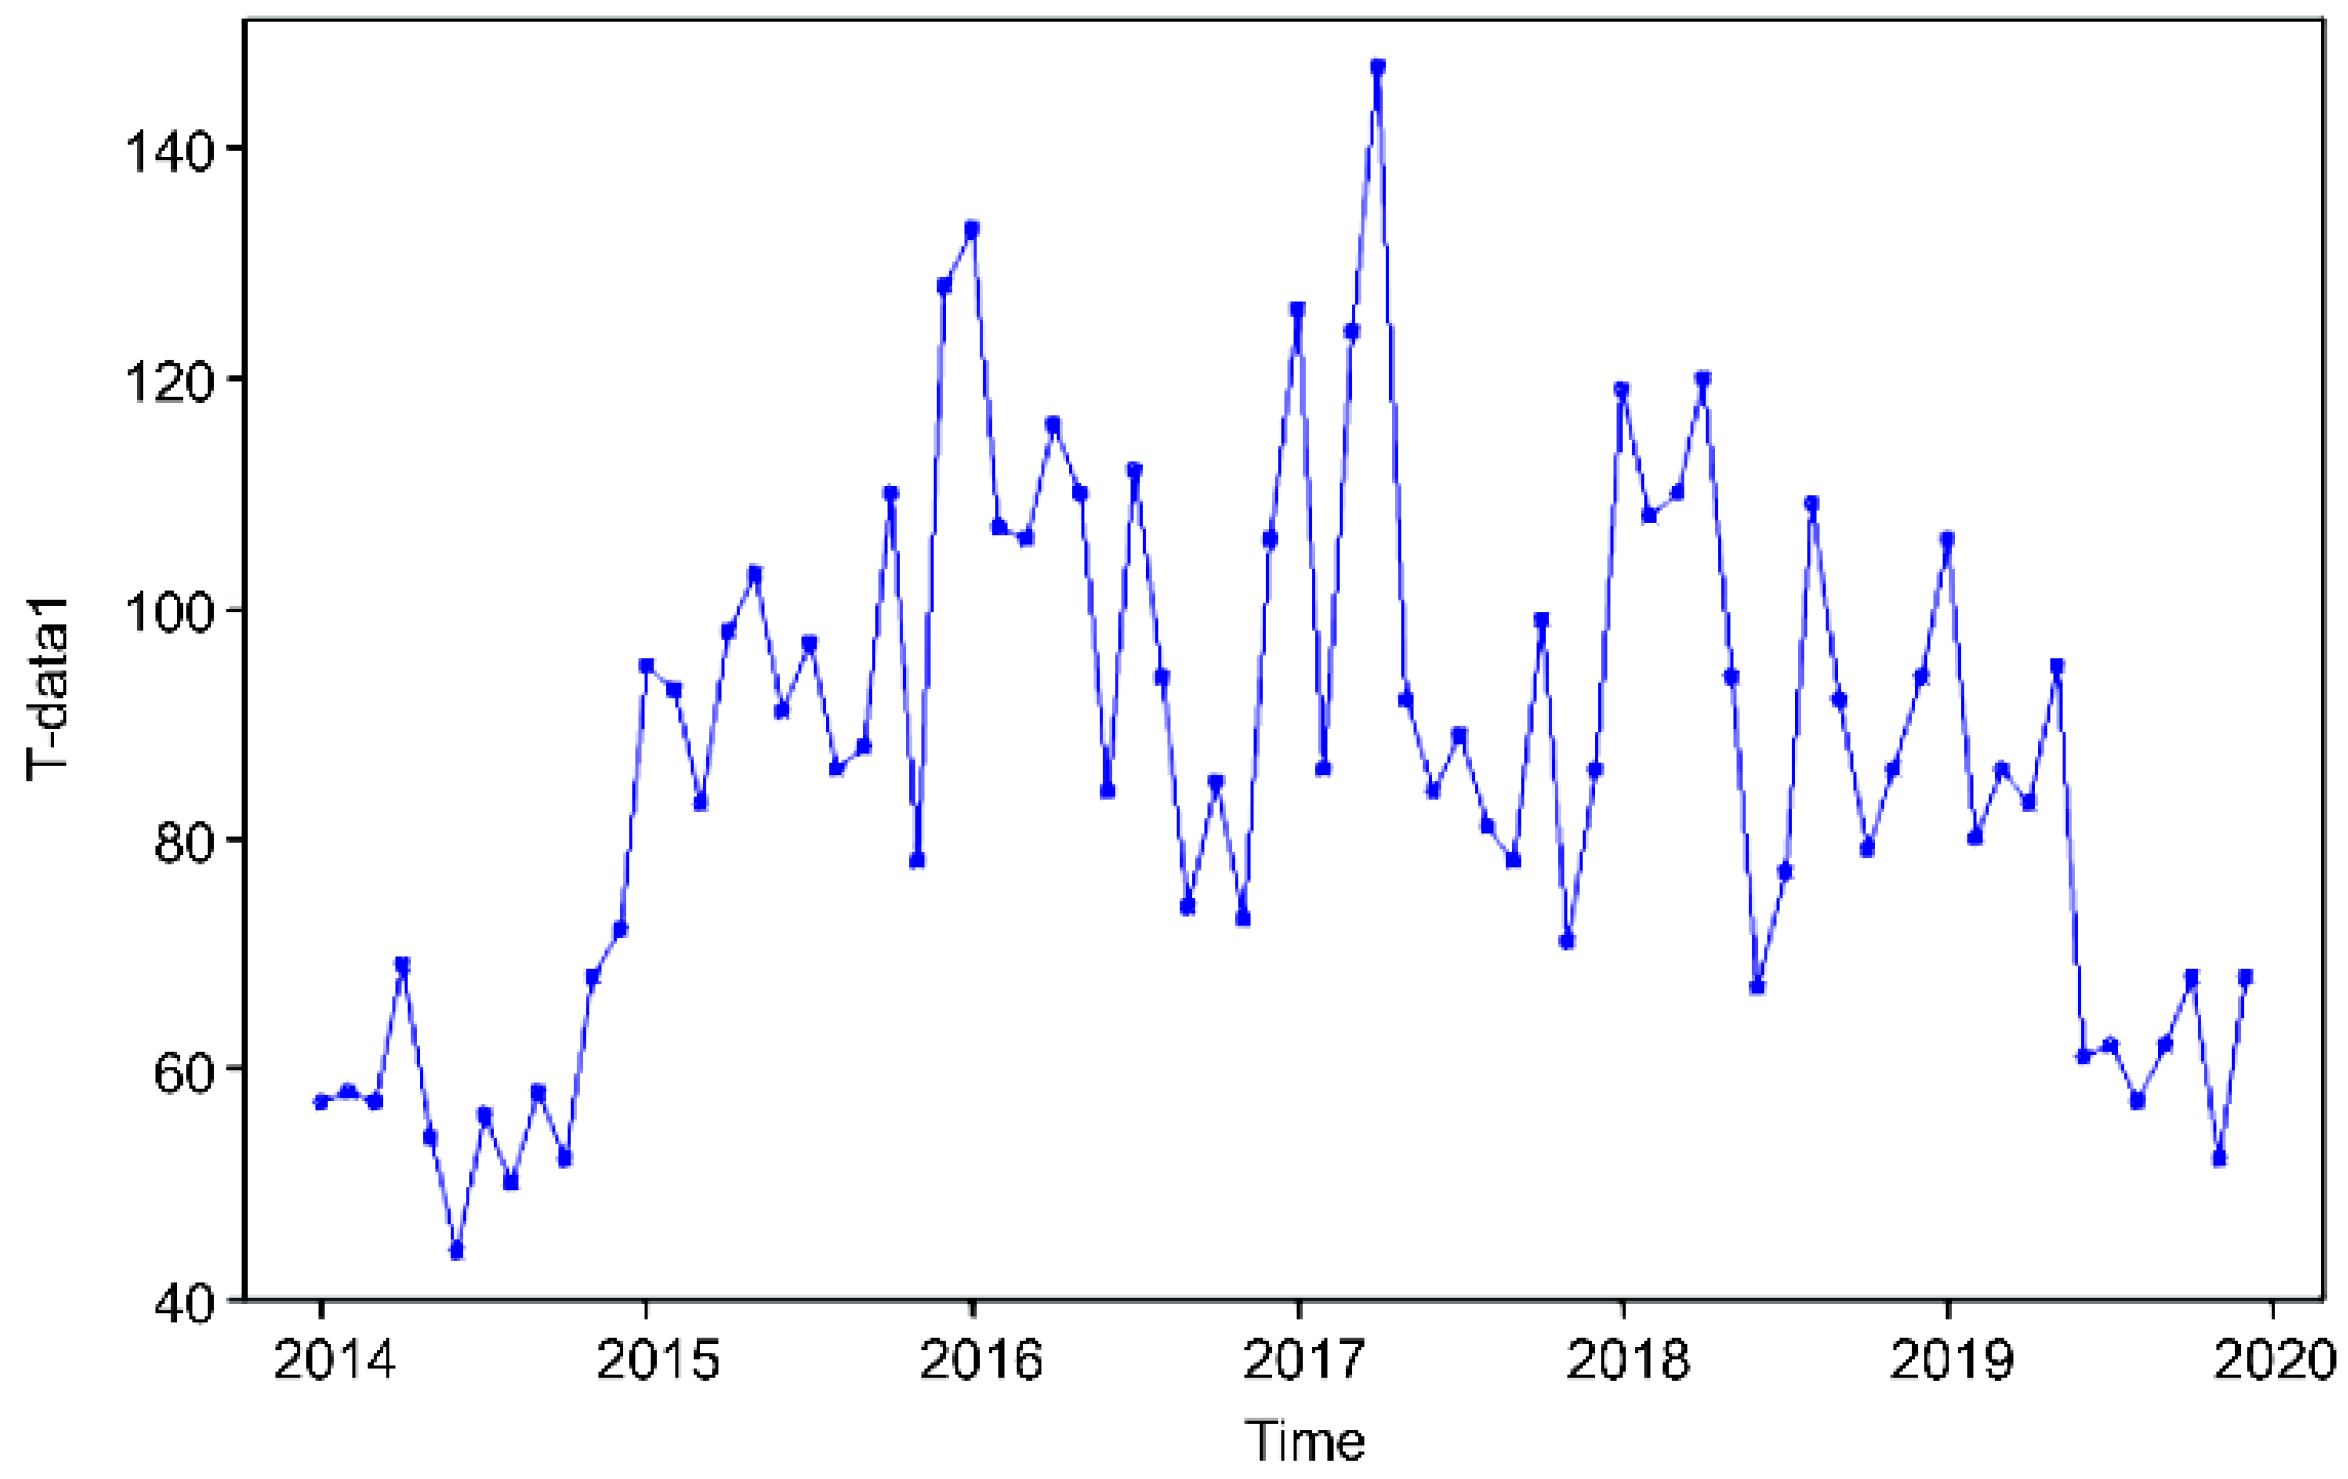
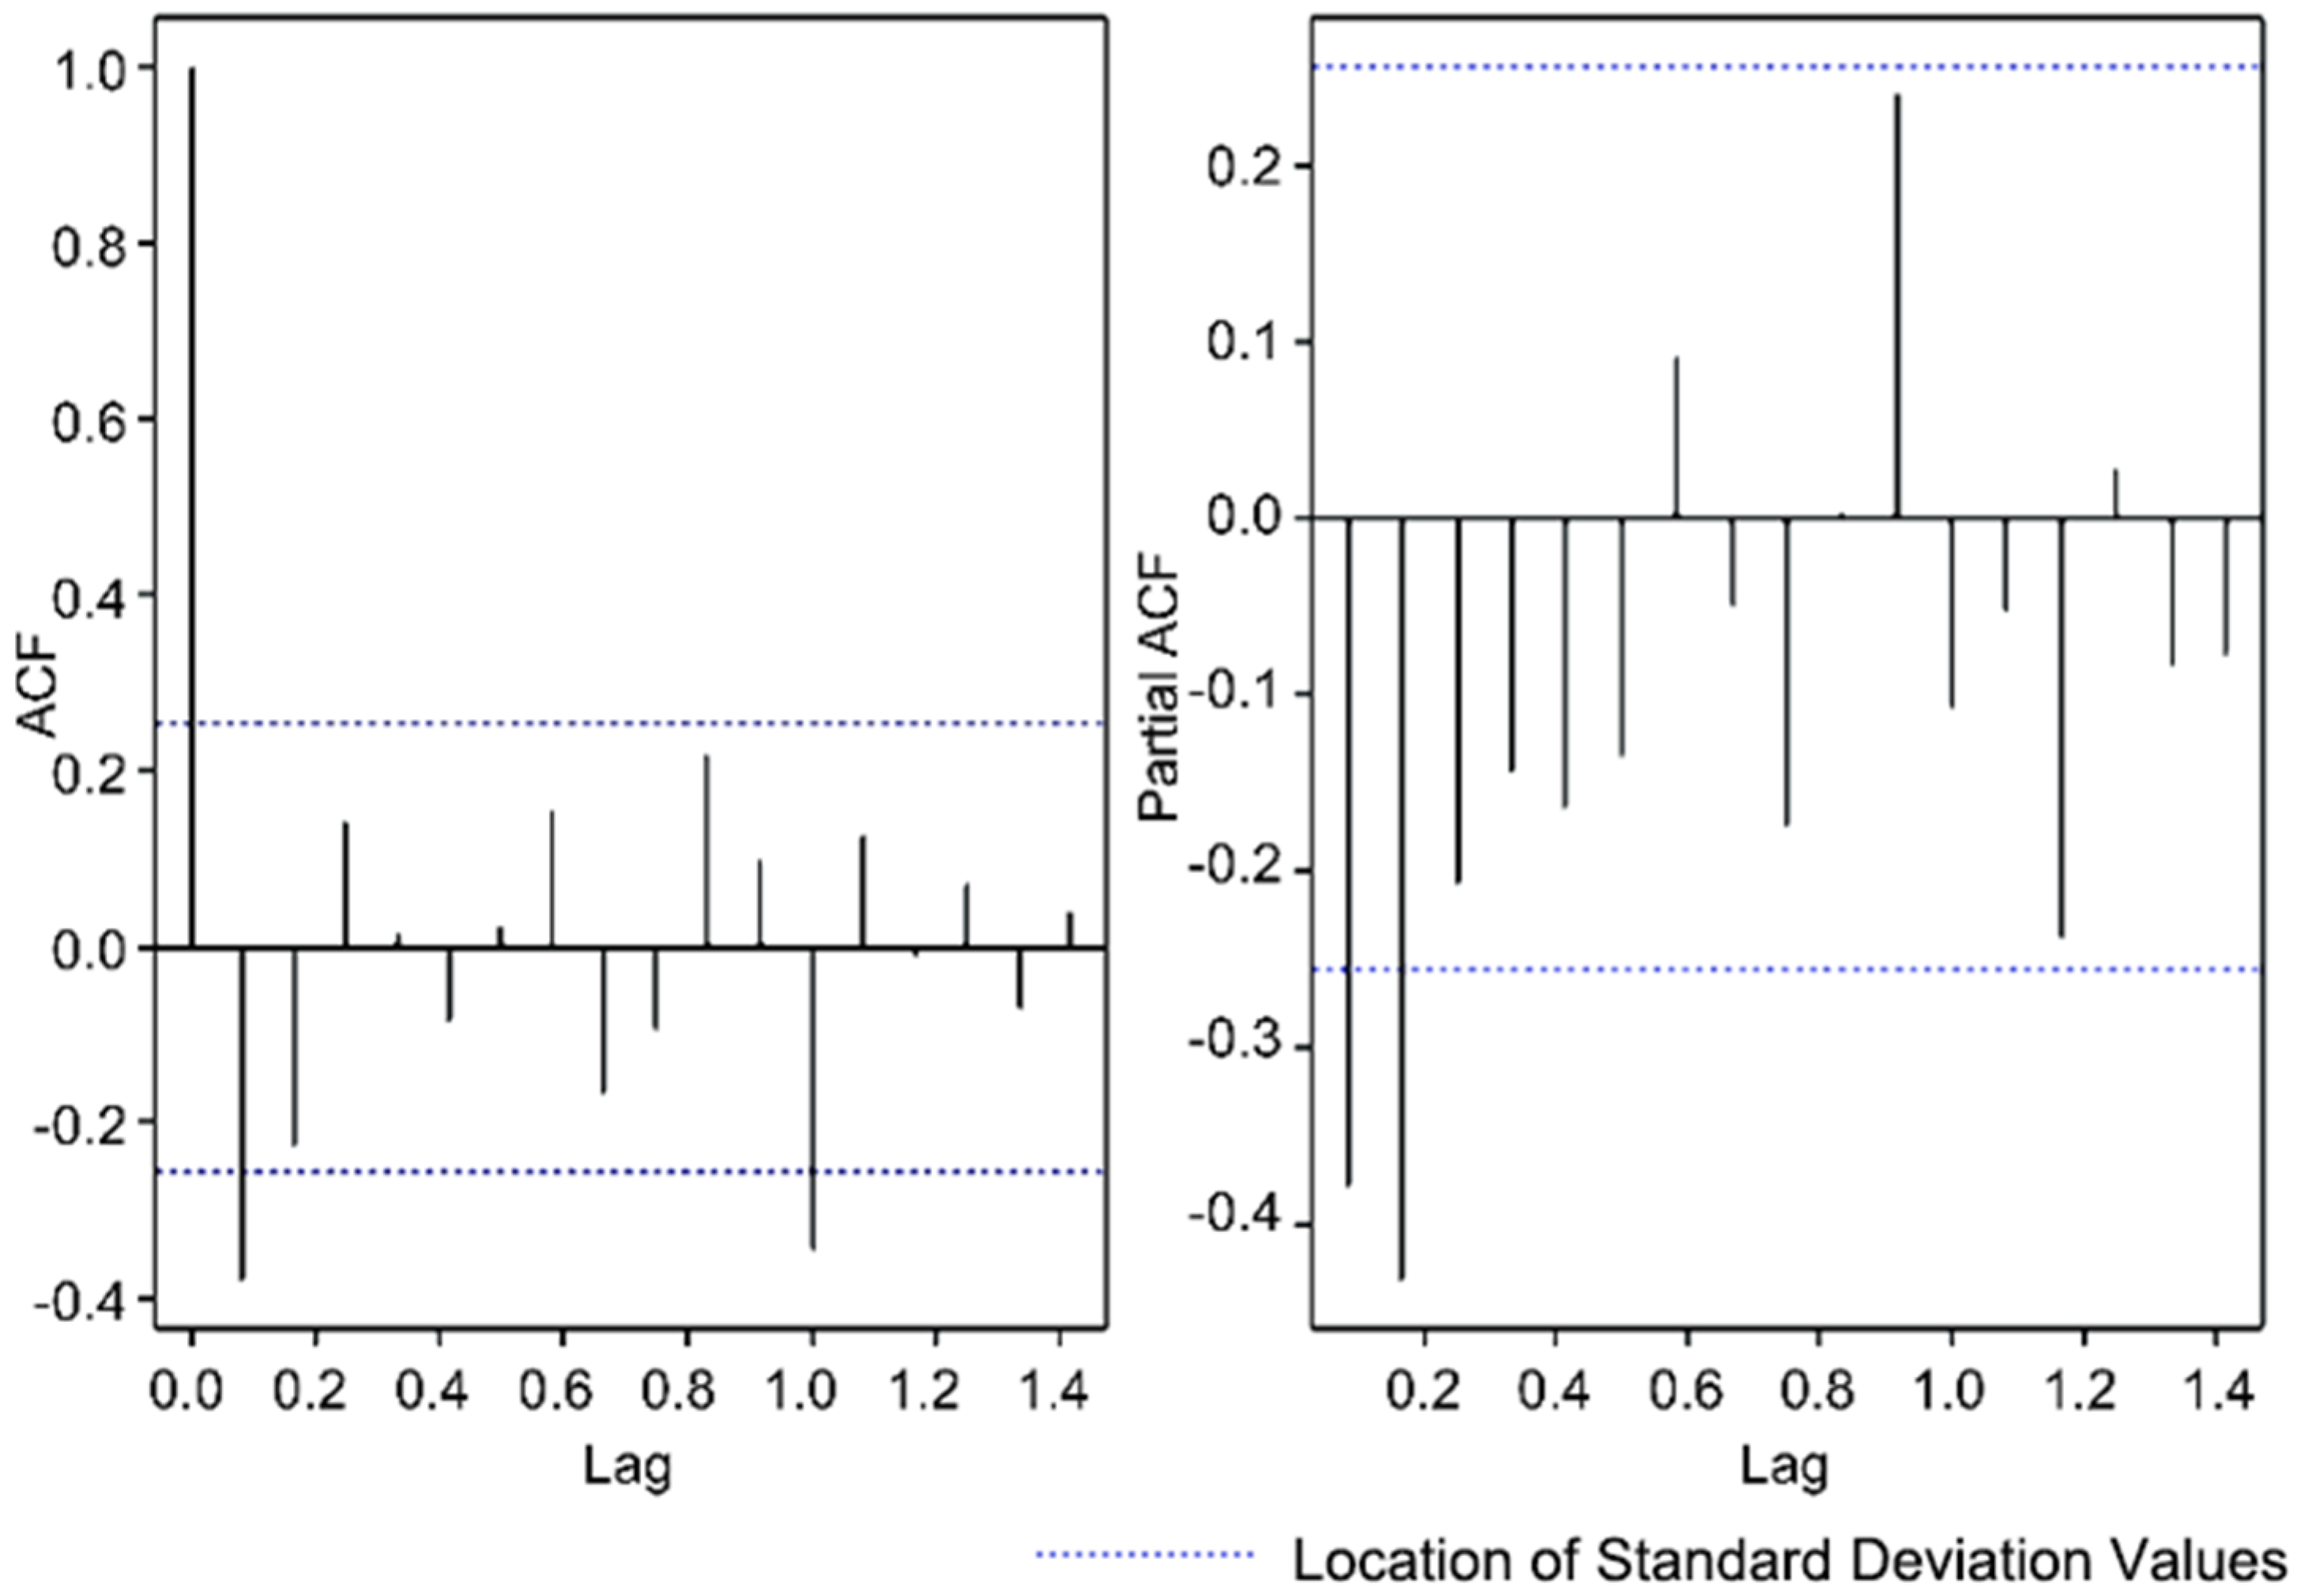
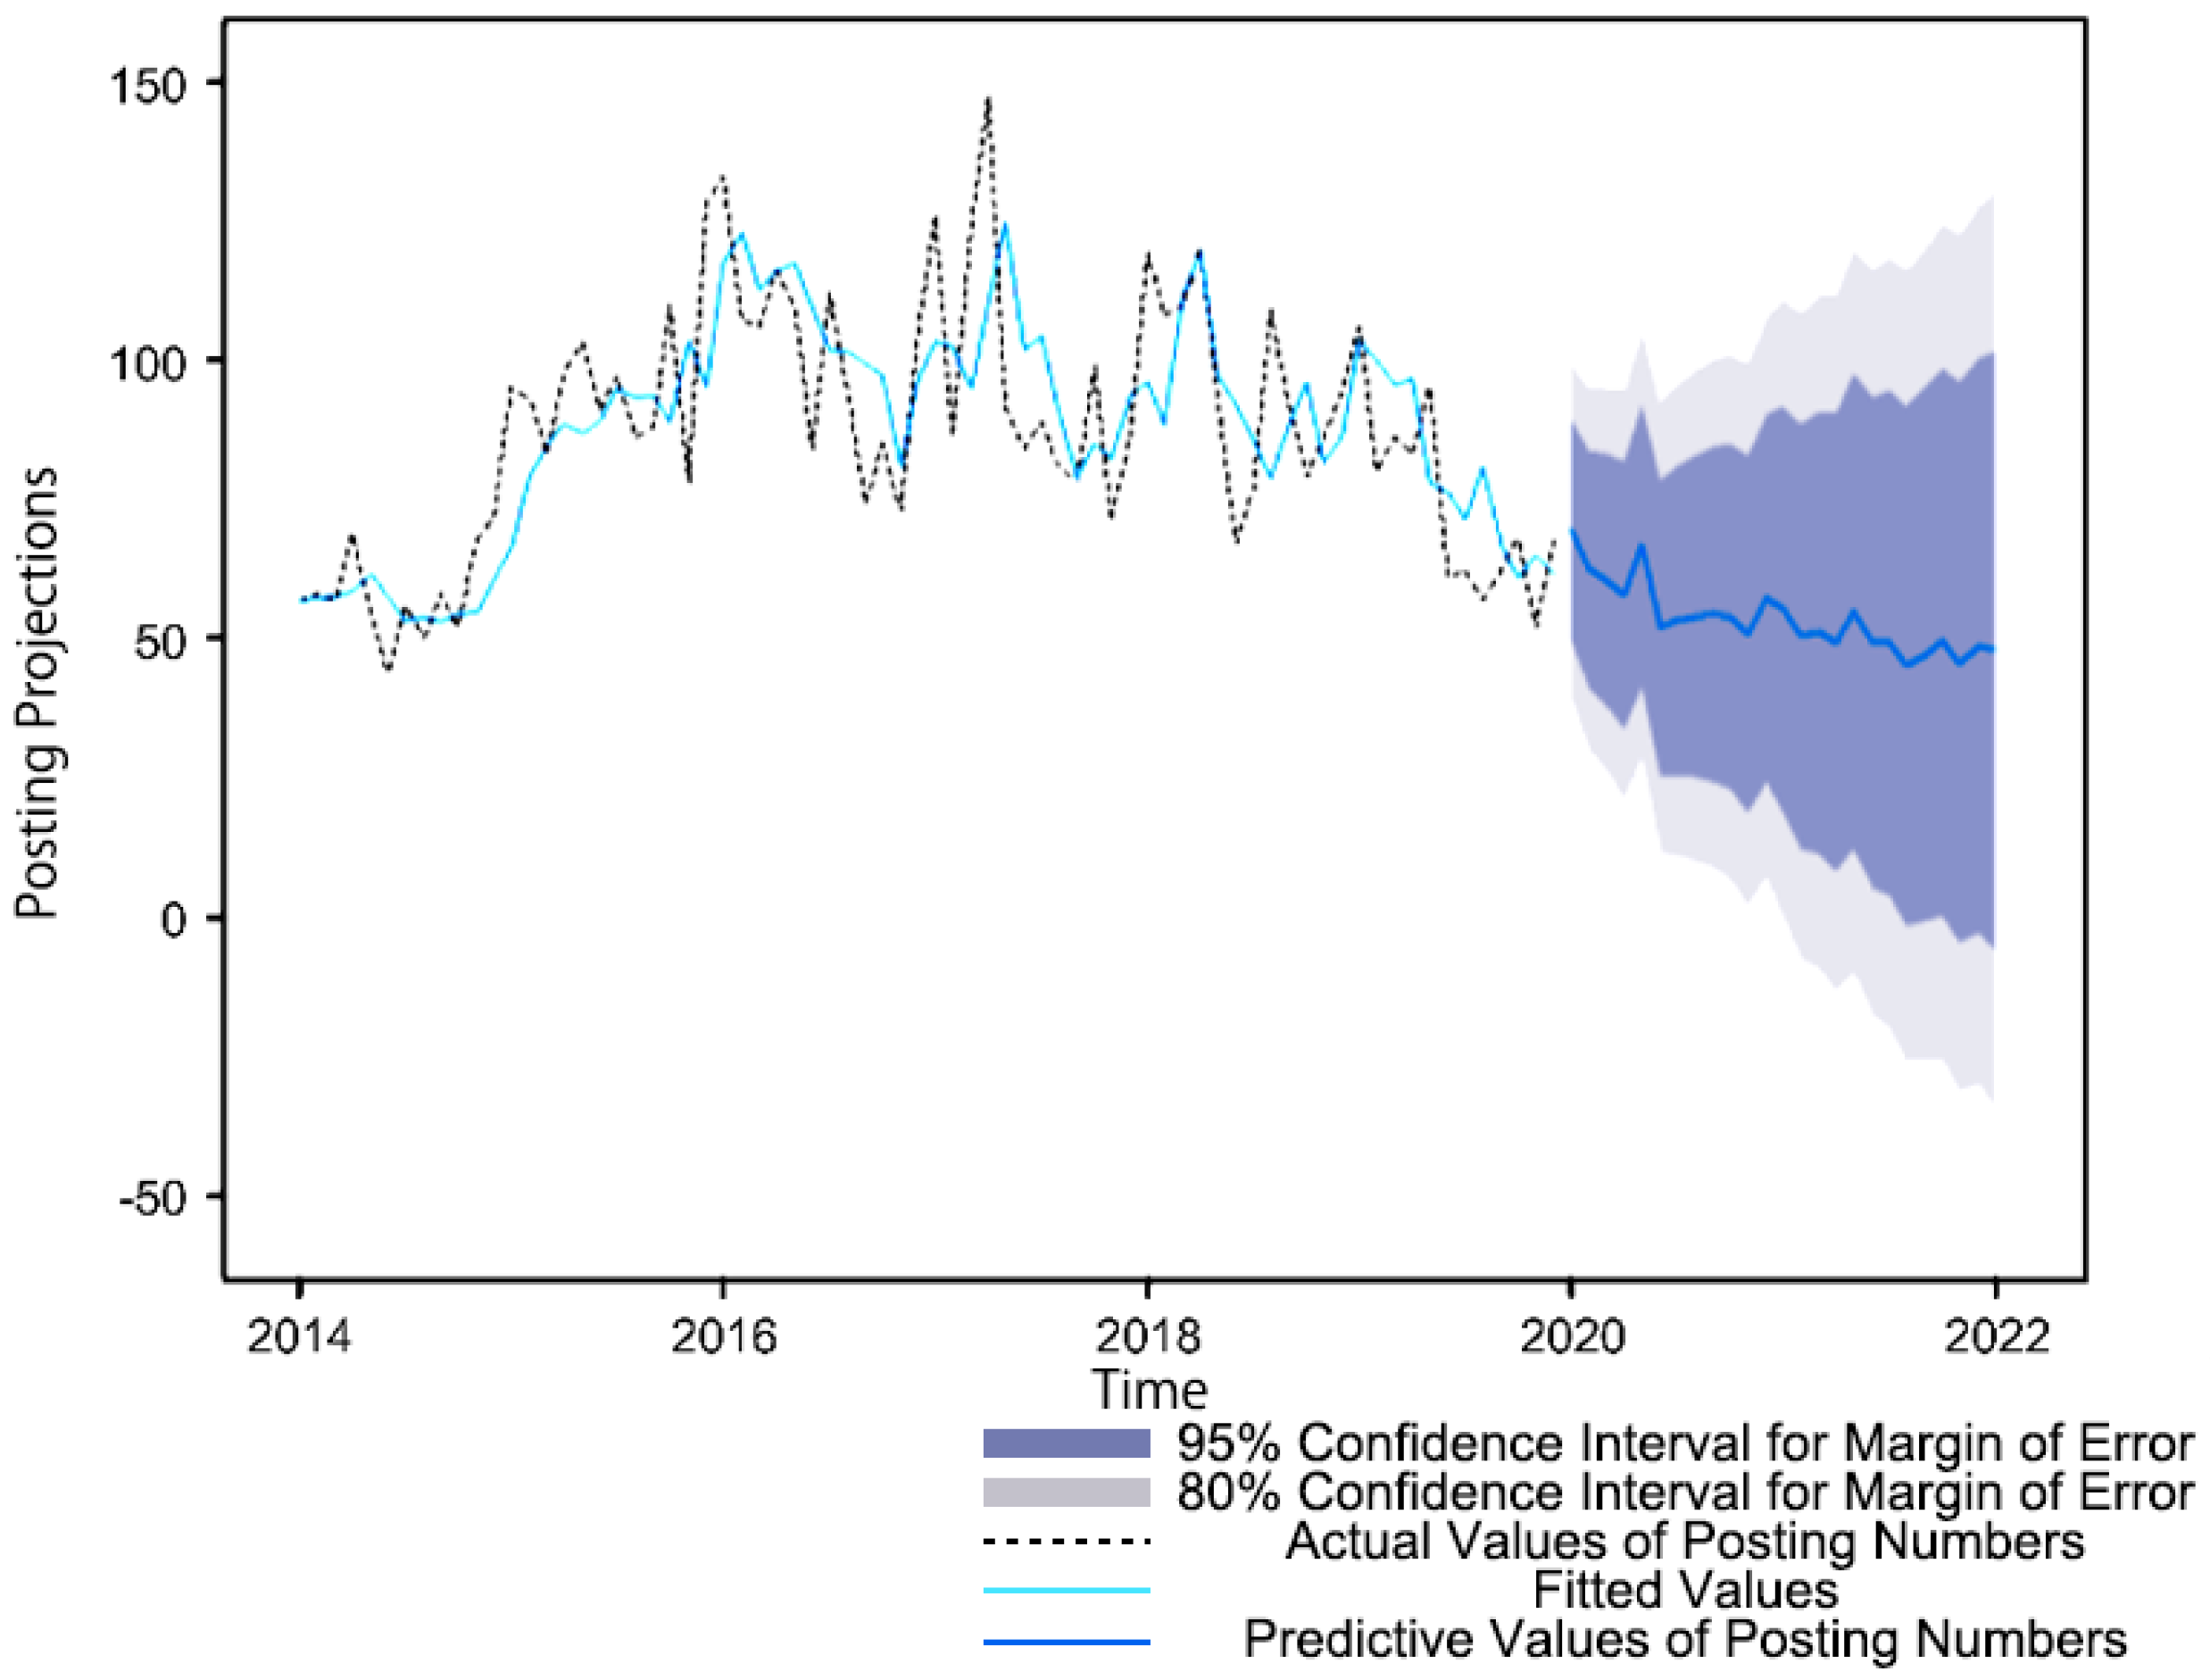
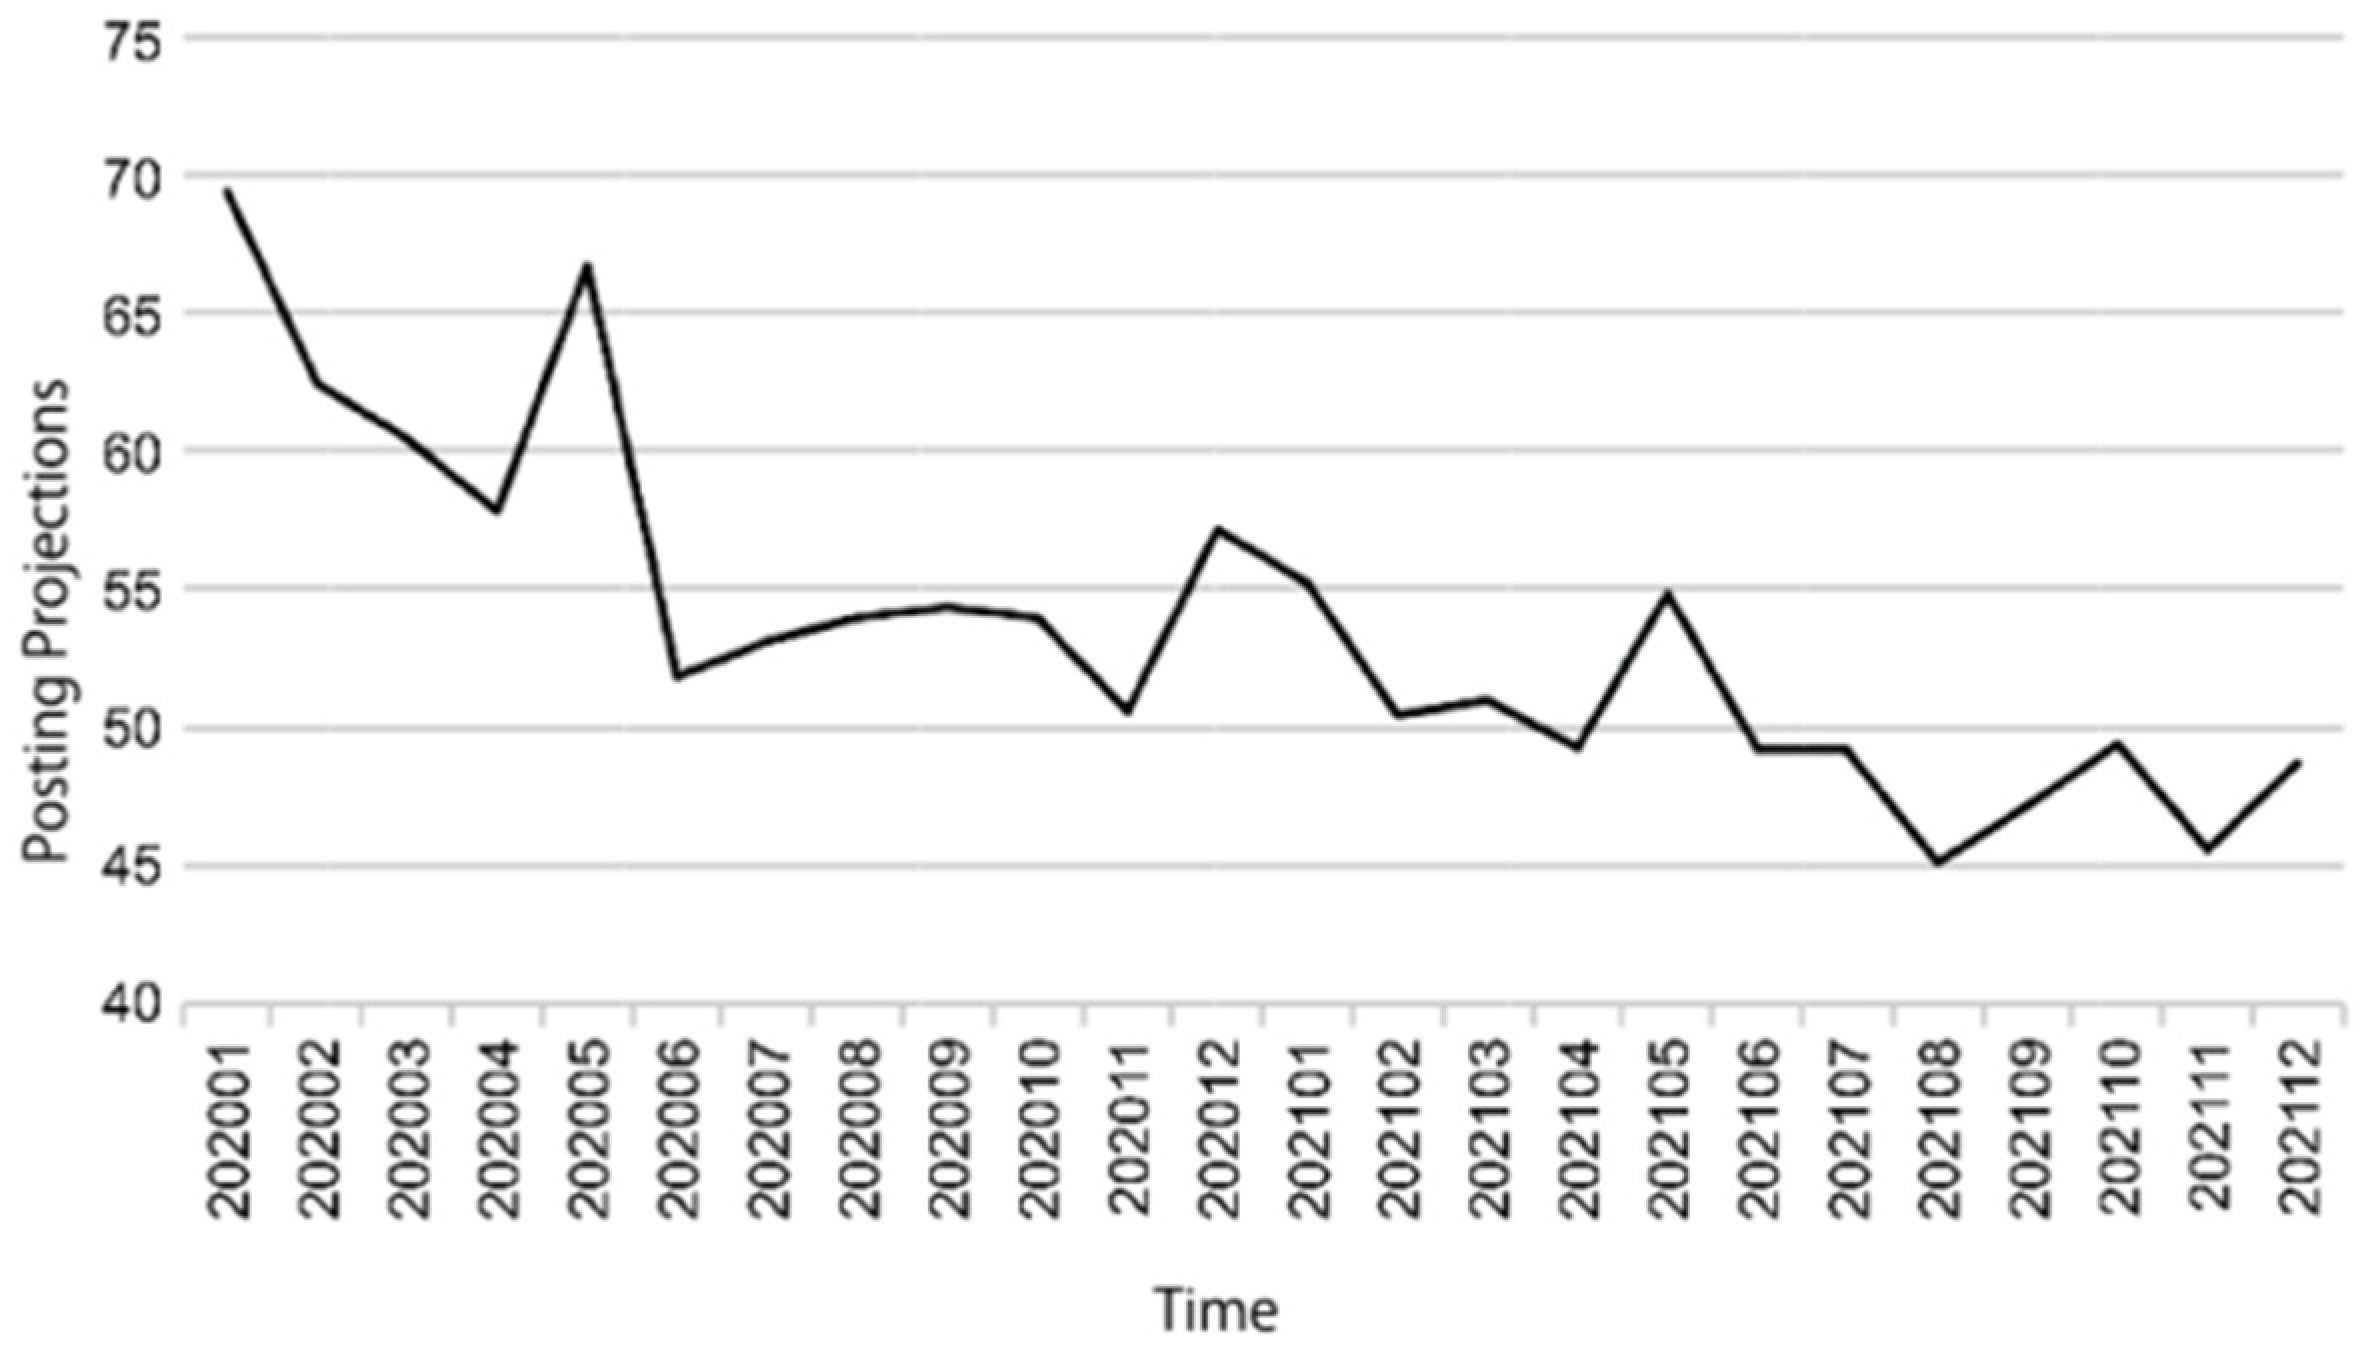
3.3.2. ARIMA Model for Non-Ocean-Area UGS
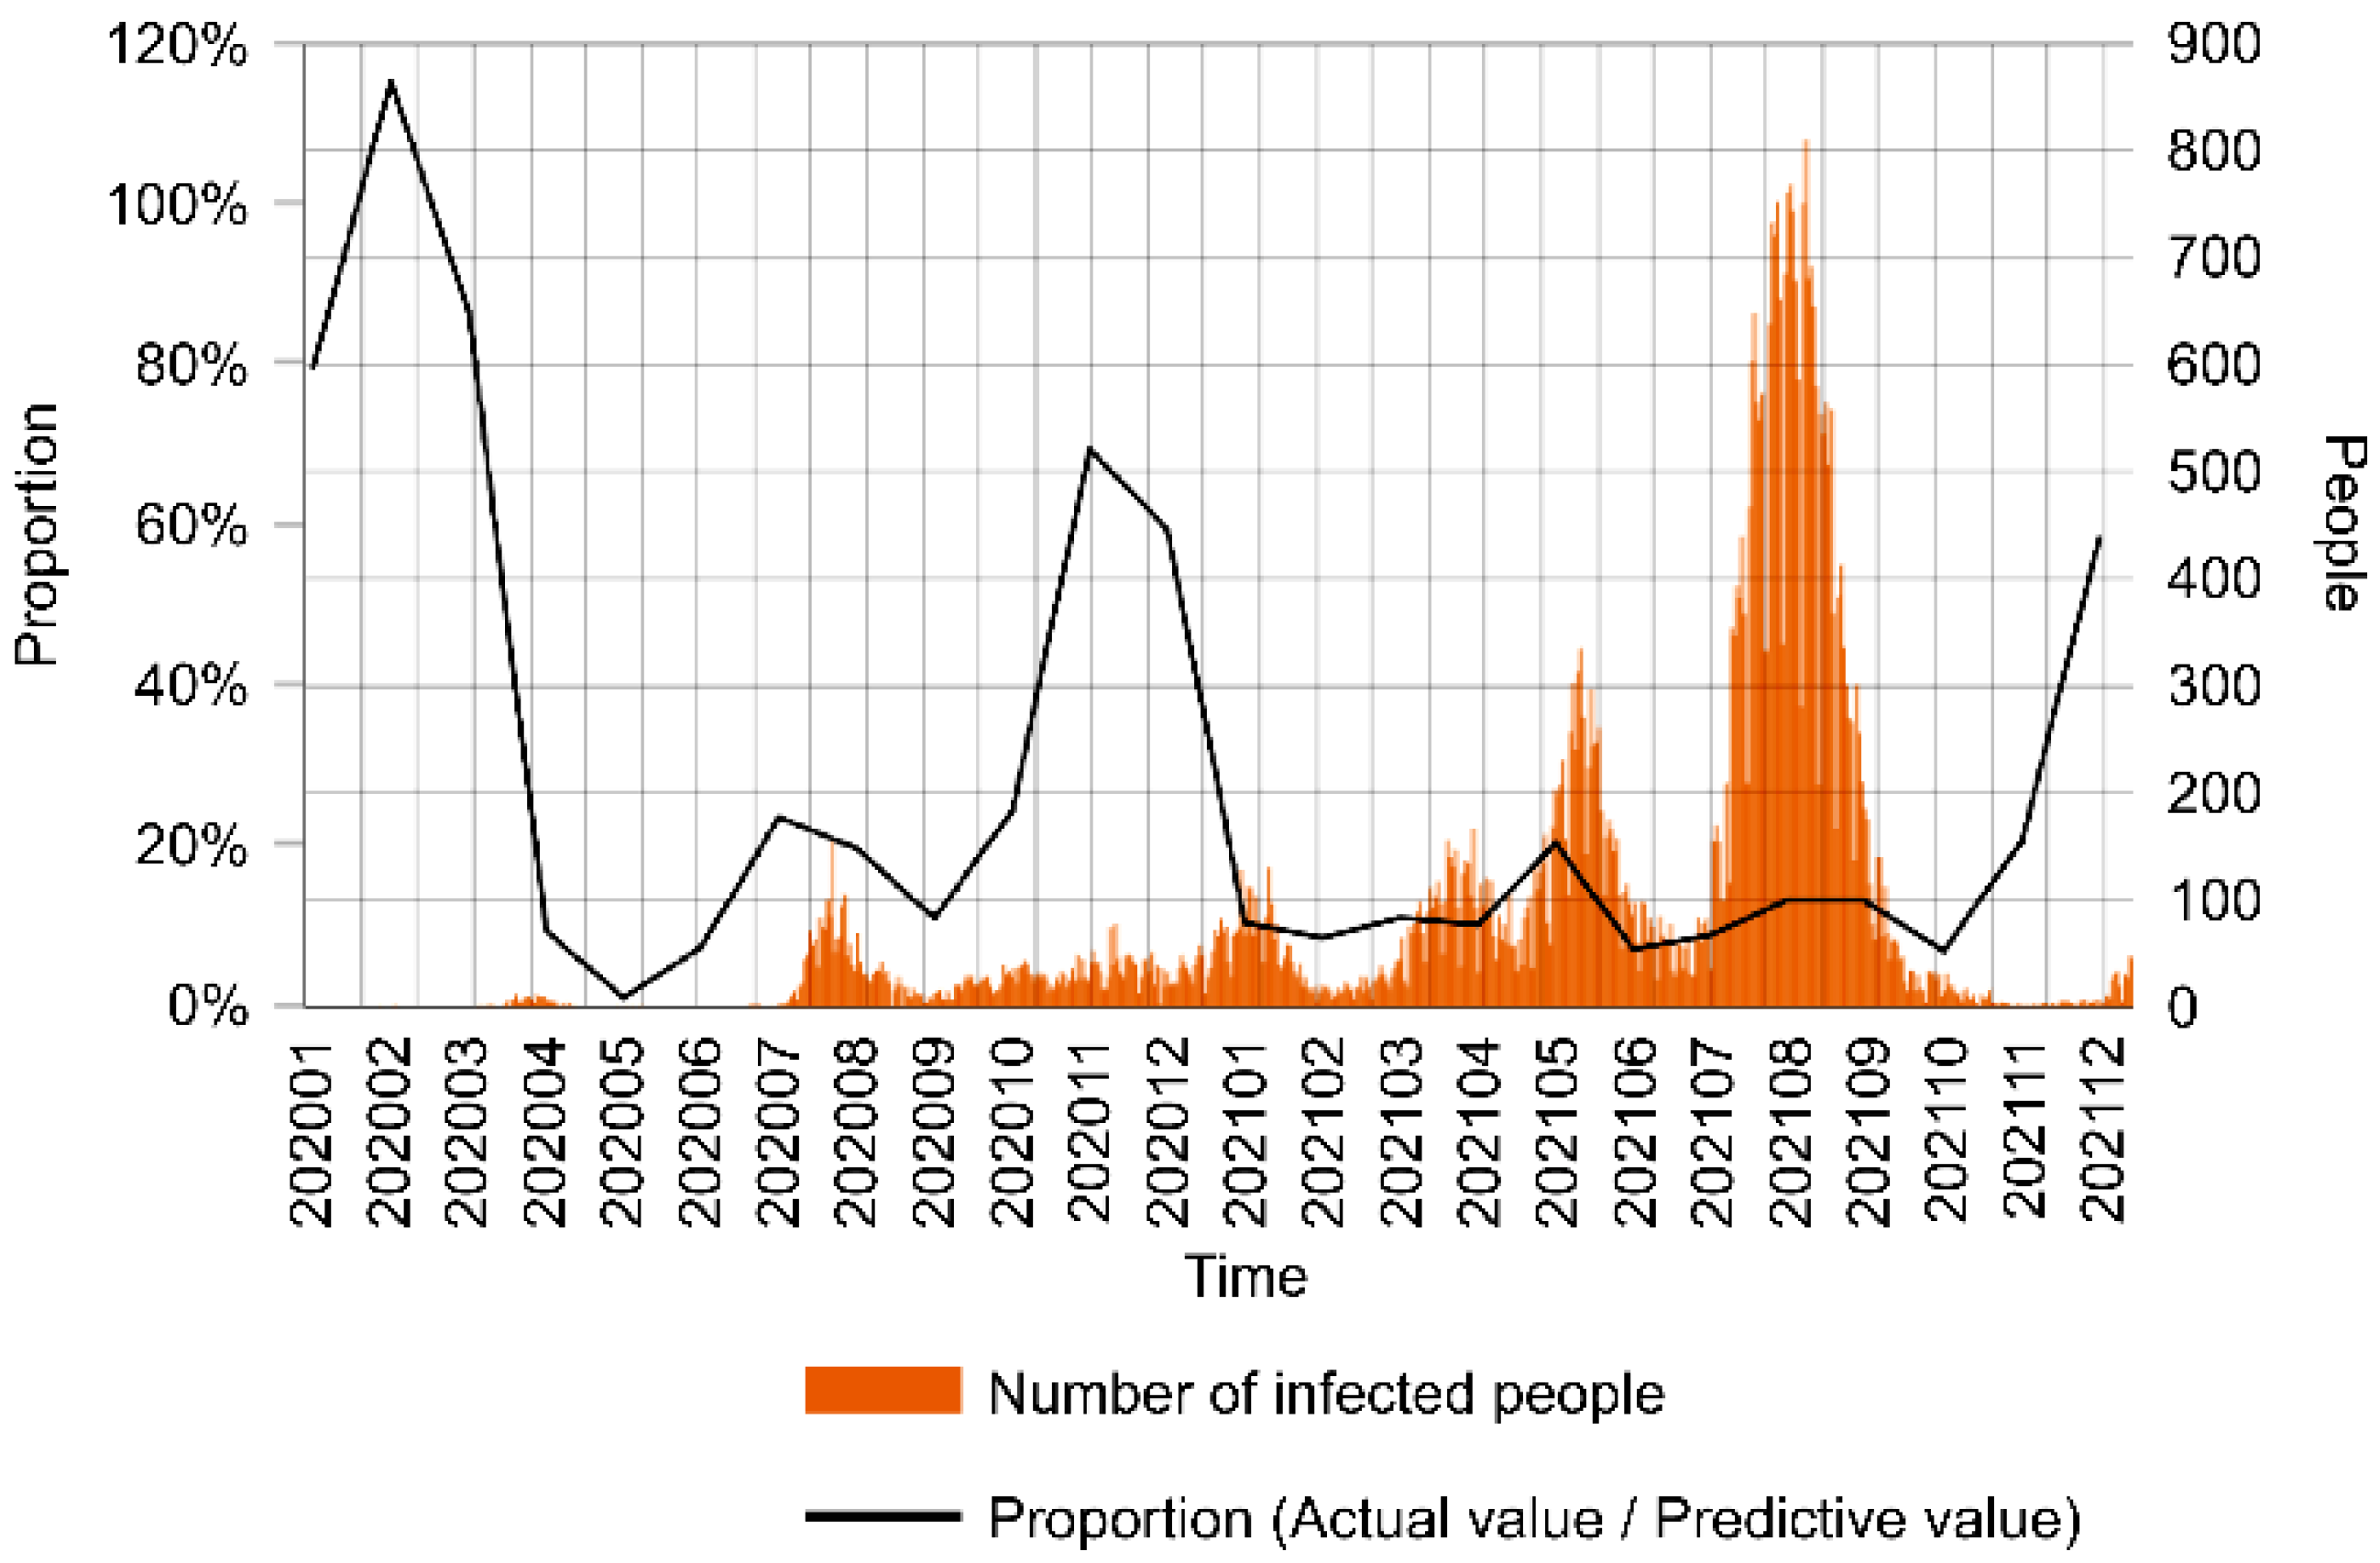
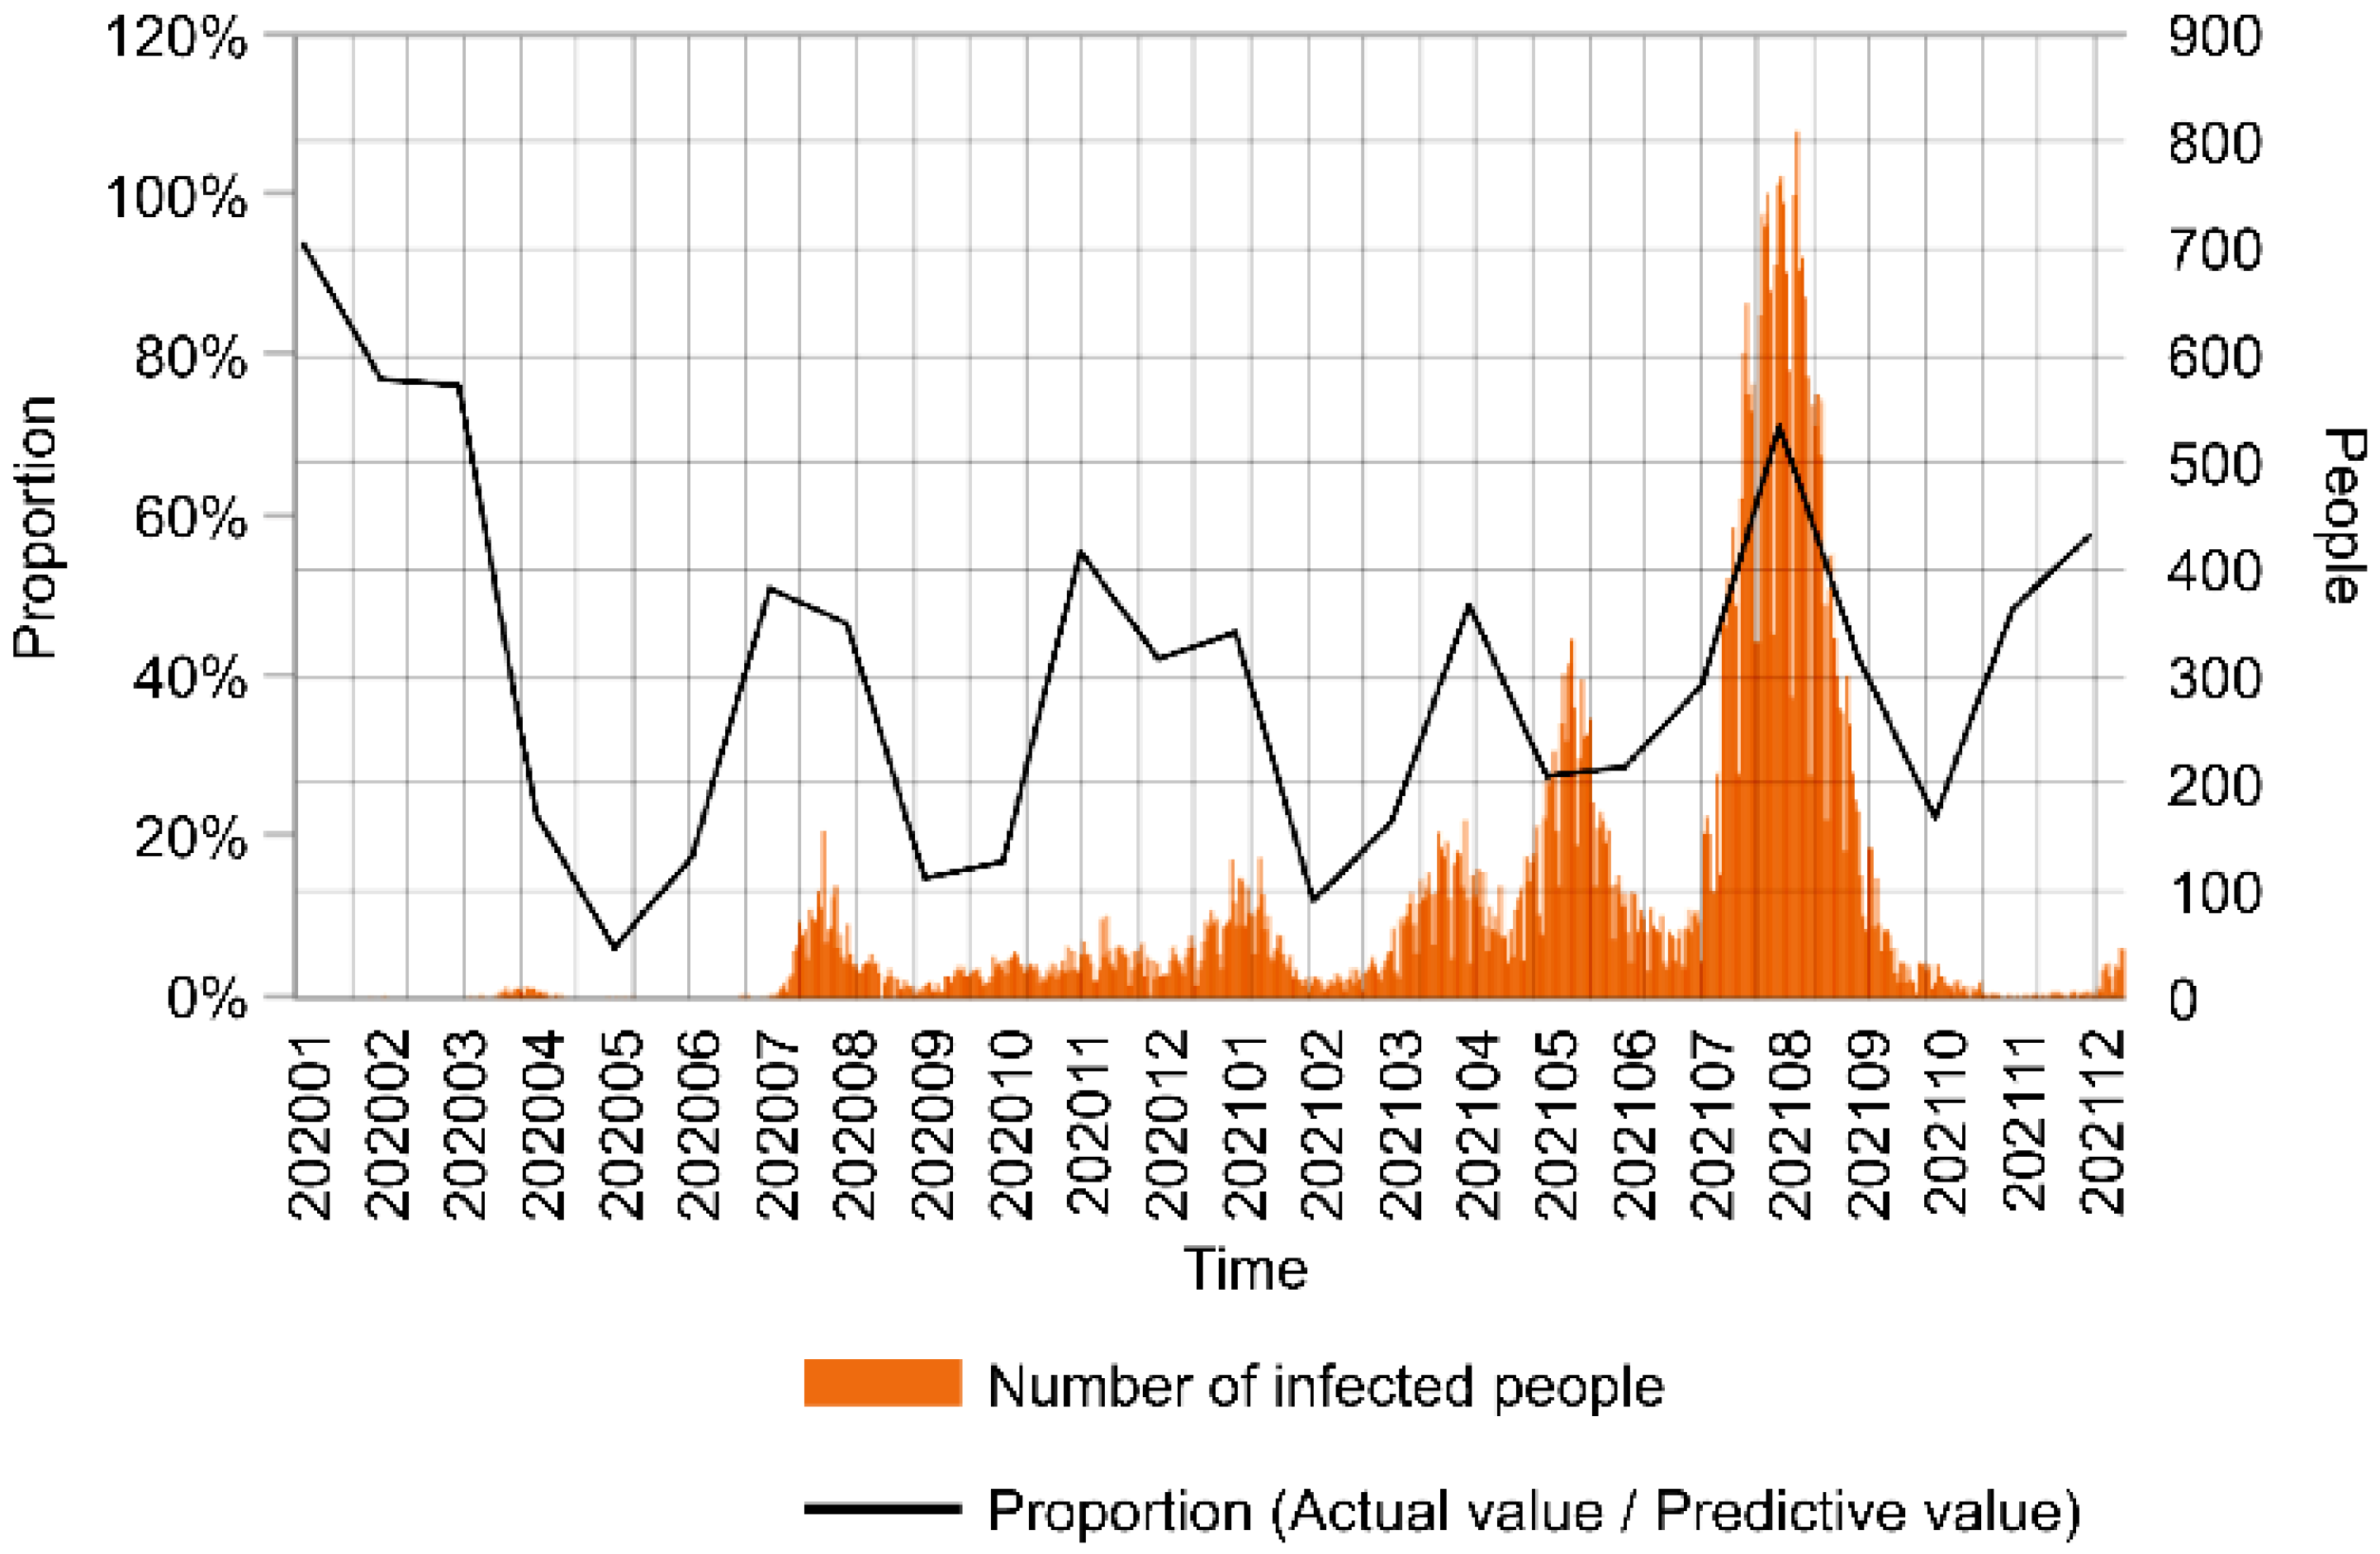
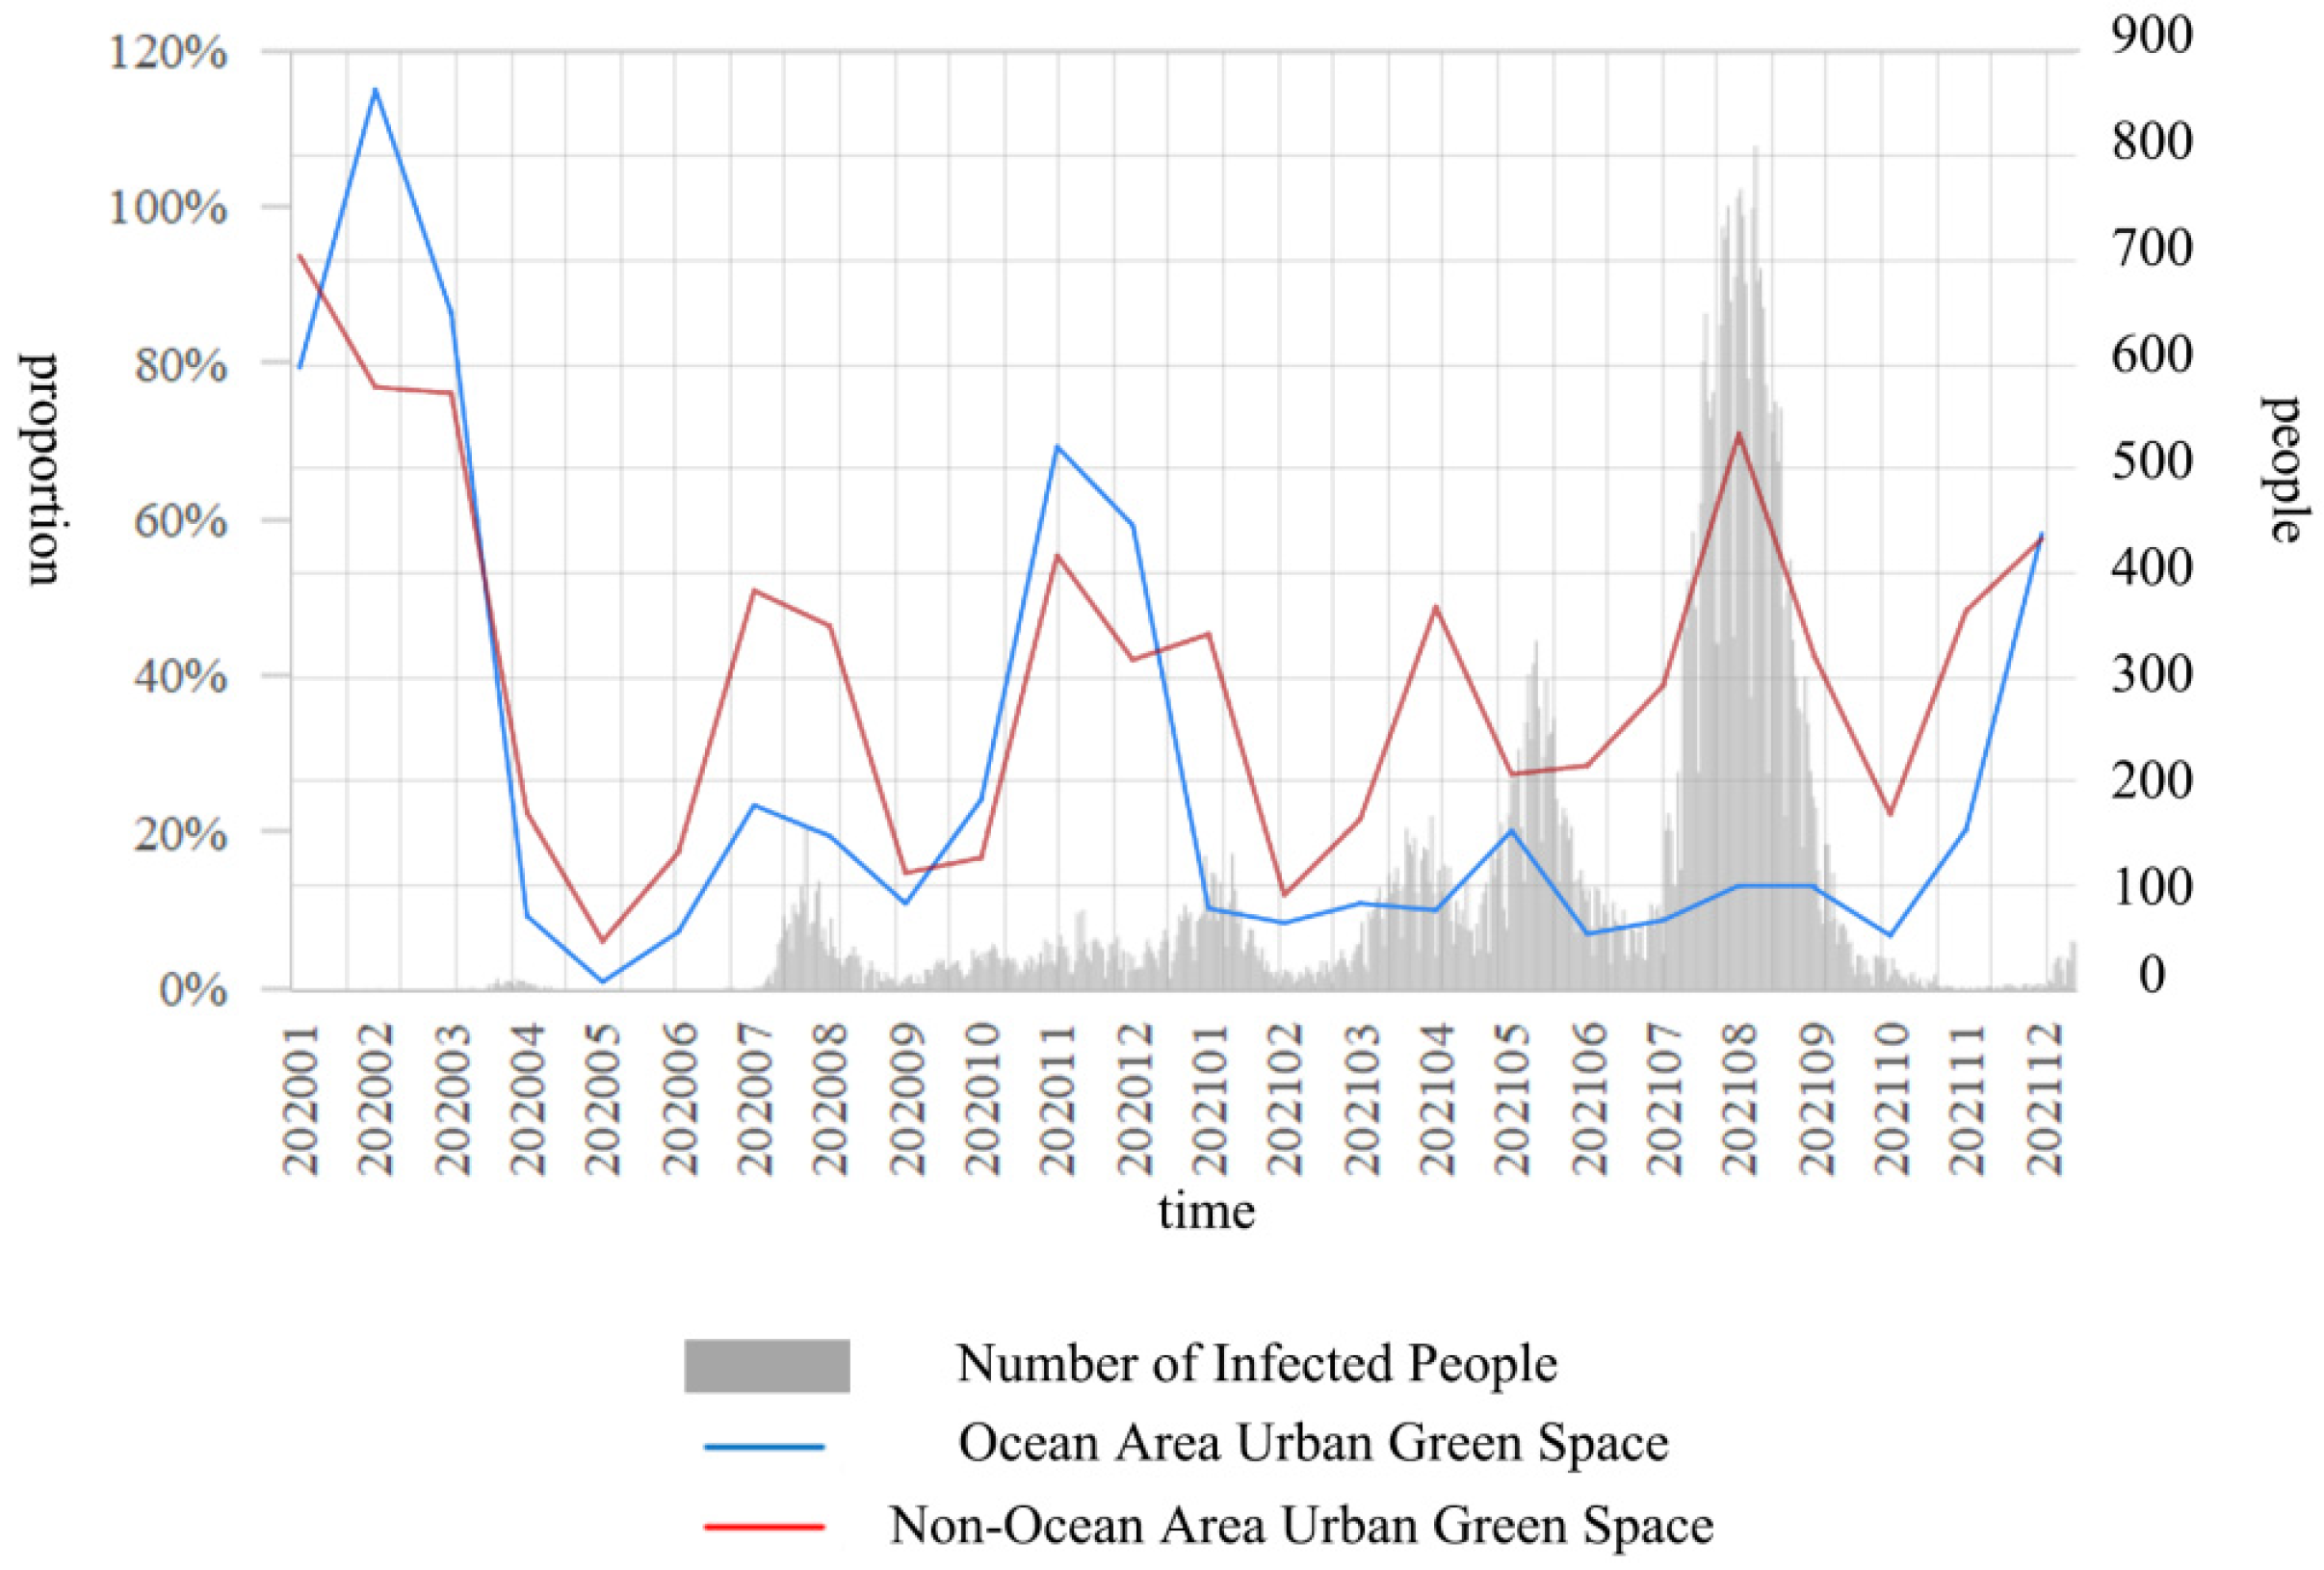
3.3.3. Magnitude of Change in Proportional Relationships
4. Discussion
4.1. Ocean-Area UGS
4.1.1. Exploiting Seasonality
4.1.2. Impact of the Outbreak
4.2. Non-Ocean-Area UGS
4.2.1. Exploiting Seasonality
4.2.2. Impact of the Outbreak
4.3. Comparative Analysis
5. Conclusions
Author Contributions
Funding
Informed Consent Statement
Data Availability Statement
Acknowledgments
Conflicts of Interest
Appendix A

| Site | City | Site | City |
|---|---|---|---|
| Tomori Imugya Beach | Miyakojima | Ginowan Tropical Beach | Ginowan |
| Maehama Beach with Naha | Miyakojima | Ginowan Marina | Ginowan |
| Shinjo Coast | Miyakojima | Bibi Beach Itoman | Itoman |
| Shimodachi Island | Miyakojima | Odohama Beach | Itoman |
| Toriike Pond | Miyakojima | Kadeshi River | Itoman |
| Irabu-jima Island | Miyakojima | Nashiro Beach | Itoman |
| Ikema-jima Island | Miyakojima | Kawahira Bay | Ishigaki |
| Sawada no hama Beach | Miyakojima | Yonehara Beach | Ishigaki |
| Painagama Beach | Miyakojima | Sukuji Beach | Ishigaki |
| Kurimajima Island | Miyakojima | Shiraho Beach | Ishigaki |
| Watanabisama | Miyakojima | Sunset Beach | Ishigaki |
| Yae Ganse | Miyakojima | Maezato Beach | Ishigaki |
| Nakanoshima Beach | Miyakojima | Kabira Ishizaki Manta Scramble | Ishigaki |
| Shigira Beach | Miyakojima | Akashi Beach | Ishigaki |
| Ogami Island | Miyakojima | Maesato Beach | Ishigaki |
| Nagamahama Beach Coast | Miyakojima | Ishigaki-jima Blue Cave | Ishigaki |
| Sand Hill Beach | Miyakojima | Urasoko Bay | Ishigaki |
| Funakusu Beach | Miyakojima | Tomizaki Beach | Ishigaki |
| Hauai Waiwai Beach | Miyakojima | Osaki Hanagoi Reef | Ishigaki |
| Boraga Beach | Miyakojima | Osaki Tutle Reef | Ishigaki |
| Turiba Sunset Beach | Miyakojima | Iharama Okinone | Ishigaki |
| Hora Gyoko no Hama Beach | Miyakojima | Kumoji River | Naha |
| Kagimmi-hama Beach | Miyakojima | Ryutan | Naha |
| Maja Beach | Miyakojima | Naminoue Umisora Park | Naha |
| Opiiwa | Miyakojima | Miigusu Port | Naha |
| Yamatobu Oiwa | Miyakojima | Soongahinja Spring | Naha |
| Muigah Cliff | Miyakojima | Naminoue Beach | Naha |
| Tako Park | Miyakojima | Miigusuku Furusato Coast | Naha |
| Ikizu Beach | Miyakojima | Kudakajima Island | Nanjo |
| Satans Palace | Miyakojima | Ojima Island | Nanjo |
| Arasshisuhida Beach | Miyakojima | Miibaru Beach | Nanjo |
| Urasoko Beach | Miyakojima | Ojima Coast | Nanjo |
| Miyaguni Nnatohama Beach | Miyakojima | Komaka Island | Nanjo |
| Antoni Gaudi | Miyakojima | Azama Sunsun Beach | Nanjo |
| Muikaga | Miyakojima | Mibaru Beach | Nanjo |
| Nakanoshima Water Channel | Miyakojima | Ishiki Beach | Nanjo |
| Kumaza Beach | Miyakojima | Habyan, Cape Kaberu | Nanjo |
| Nagakita Beach | Miyakojima | Ukabijima Island | Nanjo |
| Cross Hole | Miyakojima | Pizza Beach | Nanjo |
| Miyako Sunset Beach | Miyakojima | Busena Beach | Nago |
| Hamahiga Island | Uruma | 21st Century Forest | Nago |
| Ikei Beach | Uruma | Yagaji Island | Nago |
| Odomari Beach | Uruma | Kise Beach | Nago |
| Tsukenjima Island | Uruma | Kanucha Beach | Nago |
| Tonnaha Beach | Uruma | Nago citizen Beach | Nago |
| Muruku Hama Beach | Uruma | Sea Glass Beach | Nago |
| Hamahiga Beach | Uruma | Koki Beach | Nago |
| MIyagijima Island | Uruma | Yagaji Beach | Nago |
| Henza Island | Uruma | Teniya Beach | Nago |
| Tsukenjima Beach | Uruma | Setagashima | Tamagusuku |
| Tomai-hama Beach | Uruma | Toyosaki Kaihin Koen | Tamagusuku |
| Ukibaru-jima Island | Uruma | Chura Sun Beach | Tamagusuku |
| Itsukuma Beach | Uruma | Hija River | Okinawa City |
| Kaneku Beach | Uruma |
| Site | City | Site | City |
|---|---|---|---|
| Miyakojima Marine Park | Miyakojima | Ishigaki Island Science Garden | Ishigaki |
| Imugya Marine Garden | Miyakojima | Hirakubo Sagaribana Gunraku | Ishigaki |
| Shimajiri Mangrove Forests | Miyakojima | Maezato Dam | Ishigaki |
| Hirara Tropical Botanical Garden | Miyakojima | Oura Dam | Ishigaki |
| Hika Road Park | Miyakojima | Kanmuriwashi Observatory | Ishigaki |
| Turiba Seaside Park | Miyakojima | Urasoe Park | Urasoe |
| Nishikaigan Park | Miyakojima | Urasoe Sports Park | Urasoe |
| Kamamamine Park | Miyakojima | Miyagi Park | Urasoe |
| Shiratori Misaki Park | Miyakojima | Ohira Bus Stop Park | Urasoe |
| Nakahara Limestone Cave | Miyakojima | Fukushuen | Naha |
| Stone Garden | Miyakojima | Shikinaen | Naha |
| Tropical Fruits Park | Miyakojima | Onoyama Park | Naha |
| Takenakayama Tembo Park | Miyakojima | Shurikinjocho Oakagi Tree | Naha |
| Fukuzato Underground Dam | Miyakojima | Manko Park | Naha |
| Minafuku Underground Dam Park | Miyakojima | Yogi Park | Naha |
| Painagama Umizora Sukoyaka Park | Miyakojima | Sueyoshi Park | Naha |
| Ogamijima Island Multipurpose Park | Miyakojima | Wakasa Seaside Park | Naha |
| Shiratori Hole | Miyakojima | Kinjo Dam | Naha |
| Panata | Miyakojima | Matsuyama Park | Naha |
| Sunken Ship Irabu | Miyakojima | Midorigaoka Park | Naha |
| Bios Valley | Uruma | Kibogaoka Park | Naha |
| Cave Okinawa | Uruma | Asatogawa Shinsui Park | Naha |
| Zukeran Poultry Farm Minimini Zoo | Uruma | Uenomo Park | Naha |
| Jyane Caves | Uruma | Gajanbira Park | Naha |
| Sea Side Garden Hamahiga | Uruma | Makishi Park | Naha |
| Miten Uza | Uruma | Asahigaoka Park | Naha |
| Kurashiki Dam | Uruma | Shintoshin Park | Naha |
| Uruma Shiminnomori Park | Uruma | Okinawa Cellular Park Naha | Naha |
| Yacho no Mori Nature Park | Uruma | Kuganimui Park | Naha |
| Iha Park | Uruma | Matsuo Park | Naha |
| Heshikiya Takino | Uruma | Uenoya North Park | Naha |
| Hamagyoko Ryokuchi Park | Uruma | Sakiyama Park | Naha |
| Hanaridaki | Uruma | Nami no Ue Chocho House | Naha |
| Ginowa Seaside Park | Ginowan | Ai no Shisa Park | Naha |
| Kakazu Upland Park | Ginowan | Gangala Valley | Nanjo |
| Morikawa Park | Ginowan | Cape Chinen Park | Nanjo |
| Mashiki Pocket Park | Ginowan | Hanayakamura | Nanjo |
| Heiwa Sozo no Mori Park | Itoman | Gusuku Road Park | Nanjo |
| Okinawa Maha Bodhi Garden | Itoman | Chichinga | Nanjo |
| Ishigaki Island Stalactite Cave | Ishigaki | Busena Marine Park | Nago |
| Ishigakijima Banner Park | Ishigaki | NEO PARK OKINAWA | Nago |
| Kawahira Park | Ishigaki | Forest Yanbaru Subtropical | Nago |
| Ibaruma Sabichi Cave | Ishigaki | Nago Castle Historical Park | Nago |
| Nosoko Mape | Ishigaki | Todoroki Falls | Nago |
| Yaeyama Shyonyudo Doshokubutsuen Park | Ishigaki | 21st Century Forest Park | Nago |
| Nosoko Forest Road | Ishigaki | Mt. Tanoudake | Nago |
| Shinei Park | Ishigaki | Fukugawa Falls | Nago |
| Misaki Park | Ishigaki | Haneji Dam | Nago |
| Maezato Park | Ishigaki | Shikuwasa Hana & Green Village | Nago |
| Funakura Park | Ishigaki | Kouki Park | Nago |
| Sokobaru Dam | Ishigaki | Kaigungo Park | Tamagusuku |
| Mr. Isigaki Garden | Ishigaki | Manko Waterbird & Wetland Center | Tamagusuku |
| Ishigaki Dam | Ishigaki | Dmm Kariyushi Aquarium | Tamagusuku |
| Arakawa Falls | Ishigaki | Southeast Botanical Gardens | Okinawa City |
| Nagura Dam | Ishigaki | Okinawa Zoo & Museum | Okinawa City |
| Kids Land Fantasy World | Ishigaki | Okinawa Comprehensive Athletic Park | Okinawa City |
| Manta Park | Ishigaki | Yaeshima Park | Okinawa City |
| Yashima Ryokuchi Park | Ishigaki | Akemichi Park | Okinawa City |
| Yashima Jinko Island | Ishigaki |
References
- Tanaka, T.; Tiku, O.; Takashina, N. Empowering voluntary approaches for environmental sustainability and resilient communities: A case study from Okinawa, Japan. Discov. Sustain. 2022, 3, 27. [Google Scholar] [CrossRef]
- Isa, R. Measuring the environmental impact of tourism on sustainable development: The case of Okinawa. Stud. Reg. Policy 2007, 9, 159–173. Available online: https://iss.ndl.go.jp/books/R000000004-I8767013-00?ar=4e1f (accessed on 1 February 2007).
- Shigetani, Y.; Kakutani, N. Labour productivity of tourism and hospitality industries in Japan: The case studies of hotel industry in Okinawa, Japan. Tour. Manag. 2022, 2, 12–29. [Google Scholar] [CrossRef]
- Environmental Status and Problems in Okinawa. Available online: https://www.pref.okinawa.jp/site/kankyo/seisaku/ (accessed on 26 May 2022).
- Yang, R.; Su, C.; Zhao, J.; Zhang, J. Rural Landscape Perception from the Perspective of Internationalization: A Case Study of Onna Village, Okinawa, Japan. Landsc. Archit. 2022, 09, 107–112. [Google Scholar] [CrossRef]
- Tada, O. Constructing Okinawa as Japan’s Hawaii: From Honeymoon Boom to Resort Paradise. Jpn. Stud. 2015, 35, 287–302. [Google Scholar] [CrossRef]
- Revised Version of the 5th Basic Plan for the Promotion of tourism in the Okinawa Prefecture. Available online: https://www.pref.okinawa.jp/site/bunka-sports/kankoseisaku/dai5ji_kankoshinkokihonkeikakukaitei.html (accessed on 15 June 2020).
- Nagahara, S.; Konoshima, M.; Nishimori, Y.; Ota, I. basic experimental study on the optimal allocation of green space for aesthetic benefits in an urban area: A case study of Urasoe City, Okinawa. J. Environ. Inf. Sci. 2016, 30, 225–230. [Google Scholar] [CrossRef]
- Bimonte, S.; Faralla, V. Does residents’ perceived life satisfaction vary with tourist season? A two-step survey in a Mediterranean destination. Tourism Manag. 2016, 55, 199–208. [Google Scholar] [CrossRef]
- Xu, K.; Zhu, H. Review on seasonality in tourism abroad. Human Geogr. 2010, 25, 12–17. [Google Scholar] [CrossRef]
- Anzai, A.; Nishiura, H. ‘Go to travel’ campaign and travel-associated coronavirus disease 2019 cases: A descriptive analysis, July–August 2020. J. Clin. Med. 2021, 10, 398. [Google Scholar] [CrossRef]
- Geng, X.; Wang, X.; Sun, Q. Survey and analysis of visitor satisfaction and willingness to revisit future agroforestry world in Suzhou. Ecol. Econ. 2010, 6, 119–123. [Google Scholar]
- Zhang, M.; Li, B.; Chen, X. The development experience of medical tourism in Japan and its implications for China. J. Guangxi Vocat. Norm. Univ. 2022, 34, 56–63. [Google Scholar]
- Yao, Y. Seasonal pattern analysis of Chinese tourists to Thailand based on X12-Arima model. Inq. Econ. Issues 2012, 11, 131–135. [Google Scholar]
- Peiris, H. A Seasonal Arima model of tourism forecasting: The case of Sri Lanka. J. Tourism Hosp. Sports 2016, 22, 98–109. Available online: https://www.iiste.org/Journals/index.php/JTHS/article/view/33831 (accessed on 1 February 2016).
- Qin, H.; Tang, Y. Study of tourism seasonality in Sichuan province based on seasonality indexes. Resour. Dev. Mark. 2014, 30, 374–377. [Google Scholar]
- Liu, R.; Liu, L. Analysis and prediction of the number of tourists based on Arima model. Comput. Telecommun. 2019, 1, 1–4. Available online: http://www.cqvip.com/qk/81881a/201901/7001411070.html (accessed on 1 February 2019).
- Park, E.; Park, J.; Hu, M. Tourism demand forecasting with online news data mining. Ann. Tourism Res. 2021, 90, 103273. [Google Scholar] [CrossRef]
- Chipumuro, M.; Chikobvu, D. Modelling tourist arrivals in South Africa to assess the impact of the COVID-19 pandemic on the tourism sector. Afr. J. Hosp. Tourism Leis. 2022, 11, 1387–1394. [Google Scholar]
- Laeeq Razzak Janjua, F.M.; Sukjai, P.; Rehman, A.; Yu, Z. Impact of COVID-19 pandemic on logistics performance, economic growth and tourism industry of Thailand: An empirical forecasting using Arima. Braz. J. Oper. Prod. Manag. 2021, 18, e2021999. [Google Scholar] [CrossRef]
- Prilistya, S.K.; Permanasari, A.E.; Fauziati, A. The effect of the COVID-19 pandemic and Google trends on the forecasting of international tourist arrivals in Indonesia. In Proceedings of the 2021 IEEE Region 10 Symposium (TENSYMP), Jeju, Republic of Korea, 23–25 August 2021; Volume 2021, pp. 106–112. [Google Scholar] [CrossRef]
- Hou, L.L. Impact of COVID-19 on latent emissiveness of residents in China: Based on the X-12-ARIMA additive seasonal adjustment model. J. Comp. Methods Sci. Eng. 2021, 21, 1591–1604. [Google Scholar] [CrossRef]
- Kitsios, F.; Mitsopoulou, E.; Moustaka, E.; Kamariotou, M. User-generated content behavior and digital tourism services: A SEM-neural network model for information trust in social networking sites. Int. J. Inf. Manag. Data Insights 2022, 2, 100056. [Google Scholar] [CrossRef]
- Jato-Espino, D.; Moscardó, V.; Vallina Rodríguez, A.V.; Lázaro, E. Spatial statistical analysis of the relationship between self-reported mental health during the COVID-19 lockdown and closeness to green infrastructure. Urban For. Urban Green. 2022, 68, 127457. [Google Scholar] [CrossRef] [PubMed]
- Zhu, J.; Xu, C. Sina microblog sentiment in Beijing city parks as measure of demand for urban green space during the COVID-19. Urban For. Urban Green. 2021, 58, 126913. [Google Scholar] [CrossRef]
- Orea-Giner, A.; Fuentes-Moraleda, L.; Villacé-Molinero, T.; Munoz-Mazón, A.; Calero-Sanz, J. Does the implementation of robots in hotels influence the overall TripAdvisor rating? A text mining analysis from the Industry 5.0 approach. Tour. Manag. 2022, 93, 104586. [Google Scholar] [CrossRef]
- Morishita, S. The attractiveness of Japanese Ryokan to foreign visitors to Japan: Analysis of Japanese and English reviews of Tripadvisor’s “Japanese inns popular among foreigners”. J. Glob. Tour. Res. 2022, 7, 21–26. [Google Scholar] [CrossRef]
- The Japanese Operation of the TripAdvisor. Available online: https://www.travelvoice.jp/20190826-136481 (accessed on 26 August 2019).
- Matsumoto, K. Research on imagination about travel an examination of technologically simulated trips. Tour. Stud. Rev. 2019, 7, 13–20. [Google Scholar] [CrossRef]
- Numbers of Tourists in Okinawa. Available online: https://www.pref.okinawa.jp/site/bunka-sports/kankoseisaku/14734.html (accessed on 2 February 2023).
- Coronavirus Data in Okinawa Prefecture. Available online: https://www3.nhk.or.jp/news/special/coronavirus/data/pref/okinawa.html (accessed on 2 March 2023).
- El Asikri, M.S.; Knit, S.; Chaib, H. Using web scraping in a knowledge environment to build ontologies using Python and Scrapy. Eur. J. Mol. Clin. Med. 2020, 7, 2020. Available online: https://ejmcm.com/article_1525.html (accessed on 1 February 2020).
- Huang, Q.; Wang, M.; Qiao, S.; Jin, Y.; Wang, C. Research on predicting consumables requisition of anesthesiology department in newly-built general hospital based on R language time series and Arima model. China Med. Devices 2022, 37, 125–127. [Google Scholar]
- Wang, C.; Guo, Q.; Zhou, L. Forecasting the incidence trend of influenza-like illness cases based on Arima model in R language. Chin. J. Dis. Control Prev. 2018, 22, 957–960. [Google Scholar] [CrossRef]
- Measures against COVID-19. Available online: https://www.kantei.go.jp/jp/singi/novel_coronavirus/taisaku_honbu.html (accessed on 10 February 2023).
- Ho, S.L.; Xie, M.; Goh, T.N. A comparative study of neural network and Box-Jenkins Arima modeling in time series prediction. Comput. Ind. Eng. 2002, 42, 371–375. [Google Scholar] [CrossRef]
- Ariyo, A.A.; Adewumi, A.O.; Ayo, C.K. Stock price prediction using the Arima model. In Proceedings of the 2014 UKSim-AMSS 16th International Conference on Computer Modelling and Simulation, Cambridge, UK, 26–28 March 2014; Volume 2014, pp. 106–112. [Google Scholar] [CrossRef]
- Climate of the Okinawa Mainland Region. Available online: https://www.jma-net.go.jp/okinawa/know/kaiyo/tenko/hontoukikou.html (accessed on 10 June 2021).
- Yang, R.; Liu, S.; Zhao, J.; Takeda, S.; Zhang, J. Domestic and international tourists’ experiences with Shurijo castle: Text mining travel reviews. In Proceedings of the 2022nd Conference on Environmental Information Science, Japan, 5–11 December 2022; Volume 36, pp. 150–155. [Google Scholar] [CrossRef]
- Oyadomari, M. The value and conservation of Okinawan Utaki as cultural landscapes. Bull. Edogawa Univ. 2018, 28, 383–396. Available online: http://id.nii.ac.jp/1193/00000791/ (accessed on 1 March 2016).
- Reid, C.E.; Rieves, E.S.; Carlson, K. Perceptions of green space usage, abundance, and quality of green space were associated with better mental health during the COVID-19 pandemic among residents of Denver. PLoS ONE 2022, 17, e0263779. [Google Scholar] [CrossRef] [PubMed]
- Noszczyk, T.; Gorzelany, J.; Kukulska-Kozieł, A.; Hernik, J. The impact of the COVID-19 pandemic on the importance of urban green spaces to the public. Land Use Policy 2022, 113, 105925. [Google Scholar] [CrossRef] [PubMed]
| Years | Volume of Data | Number of Tourists |
|---|---|---|
| 2009 | 87 | 5,690,000 |
| 2010 | 221 | 5,717,900 |
| 2011 | 284 | 5,528,000 |
| 2012 | 575 | 5,924,700 |
| 2013 | 995 | 6,583,000 |
| 2014 | 2034 | 7,169,900 |
| 2015 | 3187 | 7,936,300 |
| 2016 | 3442 | 8,769,200 |
| 2017 | 3398 | 9,579,900 |
| 2018 | 2942 | 10,004,300 |
| 2019 | 2310 | 10,163,900 |
| Time (Month and Year) | Ocean-Area UGS | Non-Ocean-Area UGS |
|---|---|---|
| January 2014 | 68 | 57 |
| February 2014 | 56 | 58 |
| March 2014 | 111 | 57 |
| April 2014 | 108 | 69 |
| May 2014 | 104 | 54 |
| June 2014 | 105 | 44 |
| July 2014 | 170 | 56 |
| August 2014 | 175 | 50 |
| September 2014 | 170 | 58 |
| October 2014 | 100 | 52 |
| November 2014 | 88 | 68 |
| December 2014 | 84 | 72 |
| January 2015 | 104 | 95 |
| February 2015 | 96 | 93 |
| March 2015 | 105 | 83 |
| April 2015 | 161 | 98 |
| May 2015 | 181 | 103 |
| June 2015 | 205 | 91 |
| July 2015 | 265 | 97 |
| August 2015 | 236 | 86 |
| September 2015 | 214 | 88 |
| October 2015 | 213 | 110 |
| November 2015 | 122 | 78 |
| December 2015 | 135 | 128 |
| January 2016 | 130 | 133 |
| February 2016 | 129 | 107 |
| March 2016 | 156 | 106 |
| April 2016 | 253 | 116 |
| May 2016 | 225 | 110 |
| June 2016 | 195 | 84 |
| July 2016 | 286 | 112 |
| August 2016 | 236 | 94 |
| September 2016 | 201 | 74 |
| October 2016 | 192 | 85 |
| November 2016 | 115 | 73 |
| December 2016 | 124 | 106 |
| January 2017 | 160 | 126 |
| February 2017 | 104 | 86 |
| March 2017 | 136 | 124 |
| April 2017 | 261 | 147 |
| May 2017 | 214 | 92 |
| June 2017 | 205 | 84 |
| July 2017 | 284 | 89 |
| August 2017 | 237 | 81 |
| September 2017 | 166 | 78 |
| October 2017 | 267 | 99 |
| November 2017 | 97 | 71 |
| December 2017 | 104 | 86 |
| January 2018 | 112 | 119 |
| February 2018 | 104 | 108 |
| March 2018 | 123 | 110 |
| April 2018 | 160 | 120 |
| May 2018 | 173 | 94 |
| June 2018 | 156 | 67 |
| July 2018 | 182 | 77 |
| August 2018 | 234 | 109 |
| September 2018 | 160 | 92 |
| October 2018 | 148 | 79 |
| November 2018 | 132 | 86 |
| December 2018 | 103 | 94 |
| January 2019 | 123 | 106 |
| February 2019 | 97 | 80 |
| March 2019 | 121 | 86 |
| April 2019 | 123 | 83 |
| May 2019 | 141 | 95 |
| June 2019 | 150 | 61 |
| July 2019 | 164 | 62 |
| August 2019 | 125 | 57 |
| September 2019 | 97 | 62 |
| October 2019 | 134 | 68 |
| November 2019 | 88 | 52 |
| December 2019 | 67 | 68 |
| Time (Month and Year) | Predictive Value (Ocean-Area UGS) |
|---|---|
| January 2020 | 78.08404 |
| February 2020 | 57.38566 |
| March 2020 | 83.26087 |
| April 2020 | 129.76301 |
| May 2020 | 128.58841 |
| June 2020 | 124.91645 |
| July 2020 | 171.0254 |
| August 2020 | 154.29757 |
| September 2020 | 111.09483 |
| October 2020 | 128.38786 |
| November 2020 | 63.48787 |
| December 2020 | 54.03563 |
| January 2021 | 68.76185 |
| February 2021 | 48.06347 |
| March 2021 | 73.93868 |
| April 2021 | 120.44082 |
| May 2021 | 119.26622 |
| June 2021 | 115.59426 |
| July 2021 | 161.70321 |
| August 2021 | 144.97538 |
| September 2021 | 101.77264 |
| October 2021 | 119.06566 |
| November 2021 | 54.16567 |
| December 2021 | 44.71344 |
| Time (Month and Year) | Predictive Value (Non-Ocean-Area UGS) |
|---|---|
| January 2020 | 69.36227 |
| February 2020 | 62.42041 |
| March 2020 | 60.41193 |
| April 2020 | 57.79053 |
| May 2020 | 66.66478 |
| June 2020 | 51.83195 |
| July 2020 | 53.09759 |
| August 2020 | 53.94552 |
| September 2020 | 54.32503 |
| October 2020 | 53.93627 |
| November 2020 | 50.57369 |
| December 2020 | 57.13684 |
| January 2021 | 55.19529 |
| February 2021 | 50.41964 |
| March 2021 | 50.97723 |
| April 2021 | 49.22835 |
| May 2021 | 54.82956 |
| June 2021 | 49.18297 |
| July 2021 | 49.10758 |
| August 2021 | 45.08598 |
| September 2021 | 47.14309 |
| October 2021 | 49.37000 |
| November 2021 | 45.56541 |
| December 2021 | 48.69557 |
| Time (Month and Year) | Actual Value (Ocean-Area UGS) | Actual Value (Non-Ocean-Area UGS) |
|---|---|---|
| January 2020 | 62 | 65 |
| February 2020 | 66 | 48 |
| March 2020 | 72 | 46 |
| April 2020 | 12 | 13 |
| May 2020 | 1 | 4 |
| June 2020 | 9 | 9 |
| July 2020 | 40 | 27 |
| August 2020 | 30 | 25 |
| September 2020 | 12 | 8 |
| October 2020 | 31 | 9 |
| November 2020 | 44 | 28 |
| December 2020 | 32 | 24 |
| January 2021 | 7 | 25 |
| February 2021 | 4 | 6 |
| March 2021 | 8 | 11 |
| April 2021 | 12 | 24 |
| May 2021 | 24 | 15 |
| June 2021 | 8 | 14 |
| July 2021 | 14 | 19 |
| August 2021 | 19 | 32 |
| September 2021 | 13 | 20 |
| October 2021 | 8 | 11 |
| November 2021 | 11 | 22 |
| December 2021 | 26 | 28 |
| Time (Month and Year) | Proportion (Ocean-Area UGS) | Proportion (Non-Ocean-Area UGS) |
|---|---|---|
| January 2020 | 79.40% | 93.71% |
| February 2020 | 115.01% | 76.90% |
| March 2020 | 86.48% | 76.14% |
| April 2020 | 9.25% | 22.50% |
| May 2020 | 0.78% | 6.00% |
| June 2020 | 7.20% | 17.36% |
| July 2020 | 23.39% | 50.85% |
| August 2020 | 19.44% | 46.34% |
| September 2020 | 10.80% | 14.73% |
| October 2020 | 24.15% | 16.69% |
| November 2020 | 69.30% | 55.36% |
| December 2020 | 59.22% | 42.00% |
| January 2021 | 10.18% | 45.29% |
| February 2021 | 8.32% | 11.90% |
| March 2021 | 10.82% | 21.58% |
| April 2021 | 9.96% | 48.75% |
| May 2021 | 20.12% | 27.36% |
| June 2021 | 6.92% | 28.47% |
| July 2021 | 8.66% | 38.69% |
| August 2021 | 13.11% | 70.98% |
| September 2021 | 12.77% | 42.42% |
| October 2021 | 6.72% | 22.28% |
| November 2021 | 20.31% | 48.28% |
| December 2021 | 58.15% | 57.50% |
Disclaimer/Publisher’s Note: The statements, opinions and data contained in all publications are solely those of the individual author(s) and contributor(s) and not of MDPI and/or the editor(s). MDPI and/or the editor(s) disclaim responsibility for any injury to people or property resulting from any ideas, methods, instructions or products referred to in the content. |
© 2023 by the authors. Licensee MDPI, Basel, Switzerland. This article is an open access article distributed under the terms and conditions of the Creative Commons Attribution (CC BY) license (https://creativecommons.org/licenses/by/4.0/).
Share and Cite
Yang, R.; Liu, K.; Su, C.; Takeda, S.; Zhang, J.; Liu, S. Quantitative Analysis of Seasonality and the Impact of COVID-19 on Tourists’ Use of Urban Green Space in Okinawa: An ARIMA Modeling Approach Using Web Review Data. Land 2023, 12, 1075. https://doi.org/10.3390/land12051075
Yang R, Liu K, Su C, Takeda S, Zhang J, Liu S. Quantitative Analysis of Seasonality and the Impact of COVID-19 on Tourists’ Use of Urban Green Space in Okinawa: An ARIMA Modeling Approach Using Web Review Data. Land. 2023; 12(5):1075. https://doi.org/10.3390/land12051075
Chicago/Turabian StyleYang, Ruochen, Kun Liu, Chang Su, Shiro Takeda, Junhua Zhang, and Shuhao Liu. 2023. "Quantitative Analysis of Seasonality and the Impact of COVID-19 on Tourists’ Use of Urban Green Space in Okinawa: An ARIMA Modeling Approach Using Web Review Data" Land 12, no. 5: 1075. https://doi.org/10.3390/land12051075