
Industrial Land Change in Chinese Silk Road Cities and Its Influence on Environments


School of Architecture, Southeast University, Nanjing 210096, China
*
Author to whom correspondence should be addressed.
Land 2021, 10(8), 806; https://doi.org/10.3390/land10080806
Submission received: 1 July 2021
/
Revised: 27 July 2021
/
Accepted: 29 July 2021
/
Published: 31 July 2021
(This article belongs to the Special Issue Integrated Approach to Land Use Change Assessment)
Abstract
:The “Belt and Road” has developed from a Chinese initiative to an international consensus, and Silk Road cities are becoming a strategic step for its high-quality development. From the perspective of industrialization, the “Belt and Road” can be regarded as a “spillover” effect of the industrialization process in China. With the spatial shift of Chinese industries along the “Belt and Road” and their clustering in Silk Road cities, the development and change of industrial land in Silk Road cities has become a new area of concern for governments and scholars. In this paper, the driving mechanism of industrial land change in 129 cities along the Silk Road in China is empirically studied by the GeoDetector method. The findings include: first, the development and changes of industrial land in Silk Road cities are significantly spatially heterogeneous, and the “Belt and Road” reshapes the town system and economic geography along the route by virtue of the differentiated configuration and changes of industrial land, changing the social, political, landscape and spatial relations in cities on the line. Second, the driving forces of industrial land change in Silk Road cities under the influence of the “Belt and Road Initiative” are increasingly diversified and differentiated, with significant two-factor enhancement and non-linear enhancement interaction between two driving factors, and growing complexity of the driving mechanisms, requiring policy makers to design policies based on key factors, comprehensive factors and their interaction. Third, the environmental effect of industrial land change is highly complex. The industrial land quantity has a direct impact on the ecological state parameter and plays a decisive role in the quality of the ecological environment and its changes in Silk Road cities. However, changes in the industrial land affect the ecological state change indirectly, mainly interacting with it through the coupling of pollutant and carbon dioxide emissions, energy use, ecological planning and landscape design and policy interventions. Finally, this study provides a new framework and method for Silk Road scholars to analyze the spatial and temporal evolution characteristics of land use and coverage in cities along the “Belt and Road” and their influence mechanisms, and provides a basis for the government to make decisions on industrial land supply and layout planning and spatial governance policy design, which is of great theoretical significance and practical value.
1. Introduction
1.1. Background
Chinese President Xi Jinping successively proposed to work together towards building the “Silk Road Economic Belt” and the “21st-Century Maritime Silk Road” (hereinafter referred to as the “Belt and Road Initiative”) in 2013 during his visits to Central Asia and Southeast Asia, which received great attention from the international community [1,2,3,4]. The “Belt and Road” has undergone a huge transition from a Chinese initiative to an international consensus, and is becoming a platform for more and more countries and political leaders around the world to explore a new model of global economic governance. The “Belt and Road” initiative aims to optimize the division of labor in industrial chains and the spatial layout of industrial clusters, and to improve the comprehensive industrial competitiveness of countries and cities along the route [5]. The industrialization process is essentially about modernization, and the productive capacity and knowledge accumulation behind the industry are key to the long-term economic development performance of a country. The countries and cities along the “Belt and Road” are still in the process of industrialization in general, but at very different stages [6]. From the perspective of industrialization, the proposal of the “Belt and Road” initiative can be regarded as a greater “spillover” effect that is being produced by China, pursuing a peaceful ascendancy, in the process of industrialization. In other words, by means of industrial capacity cooperation with the regions along the “Belt and Road”, China promotes the industrial upgrading, economic development and further industrialization of the countries and cities along the route, which is of great significance to the advancement of global industrialization [7].
The Vision and Proposed Actions Outlined on Jointly Building Silk Road Economic Belt and 21st-Century Maritime Silk Road released by the Chinese government in 2015 proposed to build the “Belt and Road” “relying on core cities along the route”. UNESCO (United Nations Educational, Scientific and Cultural Organization) introduced the concept of cities along the Silk Road in 2015 from a historical perspective, mainly referring to the major trade and trading hubs on the ancient Silk Road [8]. Tu Qiyu, in 2016, proposed the concept of Silk Road Cities, which are mainly hub cities located in countries and regions along the “Belt and Road” that have a strategic position and influence on the economy, society, culture and foreign economic exchanges of the host countries and regions. In the new era, Silk Road cities, with the function of “cohesion” and “outreach”, have become a strategic starting point and an important spatial support for the construction of the “Belt and Road”. Industrial land is a key production factor and an important spatial carrier in the process of industrialization and urban development, and its input scale, usage, development intensity and spatial layout affect the industrialization process as well as the allocation and utilization efficiency of urban land resources. The impact of industrial land change on the environment and ecology is a global issue and has raised a wide range of concerns from a variety of stakeholders in the era of industrialization and urbanization. The implementation of the “Belt and Road Initiative” has brought a complex impact to the use of energy and resources, ecological construction and environmental protection along the route, and the expansion of capacity cooperation and industrial land has exerted a significant impact on environmental and ecological sustainability. Under the “Belt and Road Initiative”, China has witnessed further speed up in industrial space transfer and capacity cooperation. The study of industrial land use changes in Silk Road cities and their driving mechanisms, and further analysis of the interaction between changes in industrial land and the environment, will help reveal the profound impact of the “Belt and Road Initiative” on the spatial economy and landscape patterns along the route.
1.2. Literature Review
As the “Belt and Road Initiative” has attracted increasing attention and achieved great construction achievements, academic research on the “Belt and Road” is also heating up rapidly. In recent years, the research on resources and environments in cities along the “Belt and Road” has been increasing, and has become an emerging area of interest in geography, planning, resources and environmental science. By reviewing the papers involved, we find the following three features and shortcomings in the existing studies in this area.
First, from the perspective of the research scale, there are abundant research results achieved at the national and regional levels at the macroscale, but the research at the meso- and microscale, such as cities and industrial parks, is in the ascendant and its development still has a long way to go. Research papers at the macroscale account for the largest proportion, mainly focusing on the synergistic effect of sustainable development goals between China and those countries along the “Belt and Road” as well as the strategy for the countries along the route to join the “Belt and Road Initiative” [9], including Kuwait [10], Pakistan [11,12], Myanmar [13], Kenya [14], Singapore [15], Italy [16], Russia [17,18], Europe [19,20,21,22] and the European Union [23,24,25]. However, meso- and microscale research at the level of cities and industrial parks has just emerged, with theoretical summaries and academic research lagging behind practical work. Current exploratory studies include research on the network and urban system of the cities along the “Belt and Road” [26,27], the analysis of the factors influencing urban development [28], and the comparative study on the development strategies of China–Belarus Great Stone Industrial Park [29] and Longjiang Industrial Park [30], as well as industrial parks inside and outside China [31].
Second, from the perspective of the research field, the “Belt and Road Initiative” ranges over a wide field, but there are still few studies on land use and cover changes, especially on land use and its changes for industrial, logistic, residential and other specific purposes in urban areas. There are many research papers regarding the impact of the “Belt and Road Initiative” on economic development [32,33,34], energy cooperation [35,36,37], overseas investment and Mergers and Acquisitions (M&A) [38,39,40], cooperation on production capacity [41,42], cross-border supply chain [43,44] and value chain [45,46] cooperation, international trade [47,48,49,50,51], educational cooperation [52,53], normative influence [54], and urbanization [55,56,57,58], and there are also many research papers regarding vegetation [59], lakes [60], PM2.5 [61], natural disasters [62,63], and ecosystem services valuation [64,65] changes and their driving factors along the “Belt and Road”. It can be said that the research on the “Belt and Road” has been deeply considered in almost all disciplines except basic science [66]. Research on land use and cover changes [67,68], landscape changes [69,70], and factors influencing environment and resources use [71,72] under the “Belt and Road Initiative” has attracted the attention of some scholars, but there is still a gap in the research on land use changes and their driving factors for a particular type of urban land use, except for arable land [73].
Third, from the perspective of ecological and environmental effects, there are a wealth of studies on green development and energy conservation and emission reduction in countries along the “Belt and Road”, but there are fewer analyzing the environmental effects of land use, especially industrial land changes. Studies on green development include research concerning the impact of “Belt and Road” green logistics [74] and green finance [75,76] development, and green energy investment [77] on environmental quality, as well as the evaluation of green development level [78,79]. Studies on energy conservation and emission reduction involve the impact of energy consumption and economic growth [80], international trade [81,82,83], renewable energy use [84], direct Chinese foreign investment [85,86], agricultural development [87,88], manufacturing exports [89], power investment [90,91], and transportation [92,93] on carbon emission and energy conservation in the countries along the “Belt and Road”, as well as the contributions made by countries along the “Belt and Road” to global carbon emission reduction [94], the spatial pattern of carbon emission [95], and the estimation of energy conservation and emission reduction potential [96]. However, there are few studies on spatial environmental protection along the “Belt and Road”. Only Aung [97], Coenen [98], and Fang [99] have now conducted exploratory studies on environmental quality assessment, environmental governance, and the environmental footprints of countries along the “Belt and Road”.
1.3. Aim and Question
Promoting the transfer of the industries in China from the east to the west and their concentration in Silk Road cities, so as to solve the problem of overcapacity and drive international cooperation on production capacity is the core element of the “Belt and Road Initiative” [100,101]. Under the new situation, the contradiction between industrial land development and arable land protection is becoming increasingly prominent with the rapid expansion of industrial land scale in Silk Road cities. This study aims to explore the following questions: What is the difference in industrial land scale in the Silk Road cities? What are the dynamic evolution characteristics of industrial land changes under the “Belt and Road Initiative”? What are their driving forces? What are the impacts on environment and ecology? It will be of great theoretical and practical significance to answer the above questions for understanding the spatial distribution of industrial land and its scale change trend in Silk Road cities, promoting the efficient supply of industrial land and its effective distribution among different cities, and accelerating the industrialization and urbanization as well as modernization process in the regions along the “Belt and Road”. Therefore, this paper empirically investigates the characteristics of industrial land changes and their driving forces in Chinese Silk Road cities from 2014 to 2018 based on GeoDetector and GIS analysis method, taking 129 cities along the China section of the “Belt and Road” as examples. The study provides a basis for policy makers and decision makers in Silk Road cities to understand the complexity of industrial land dynamics and to establish industrial land allocation and spatial distribution patterns to match the high-quality development of the “Belt and Road”.
2. Research Design
2.1. Study Area: China
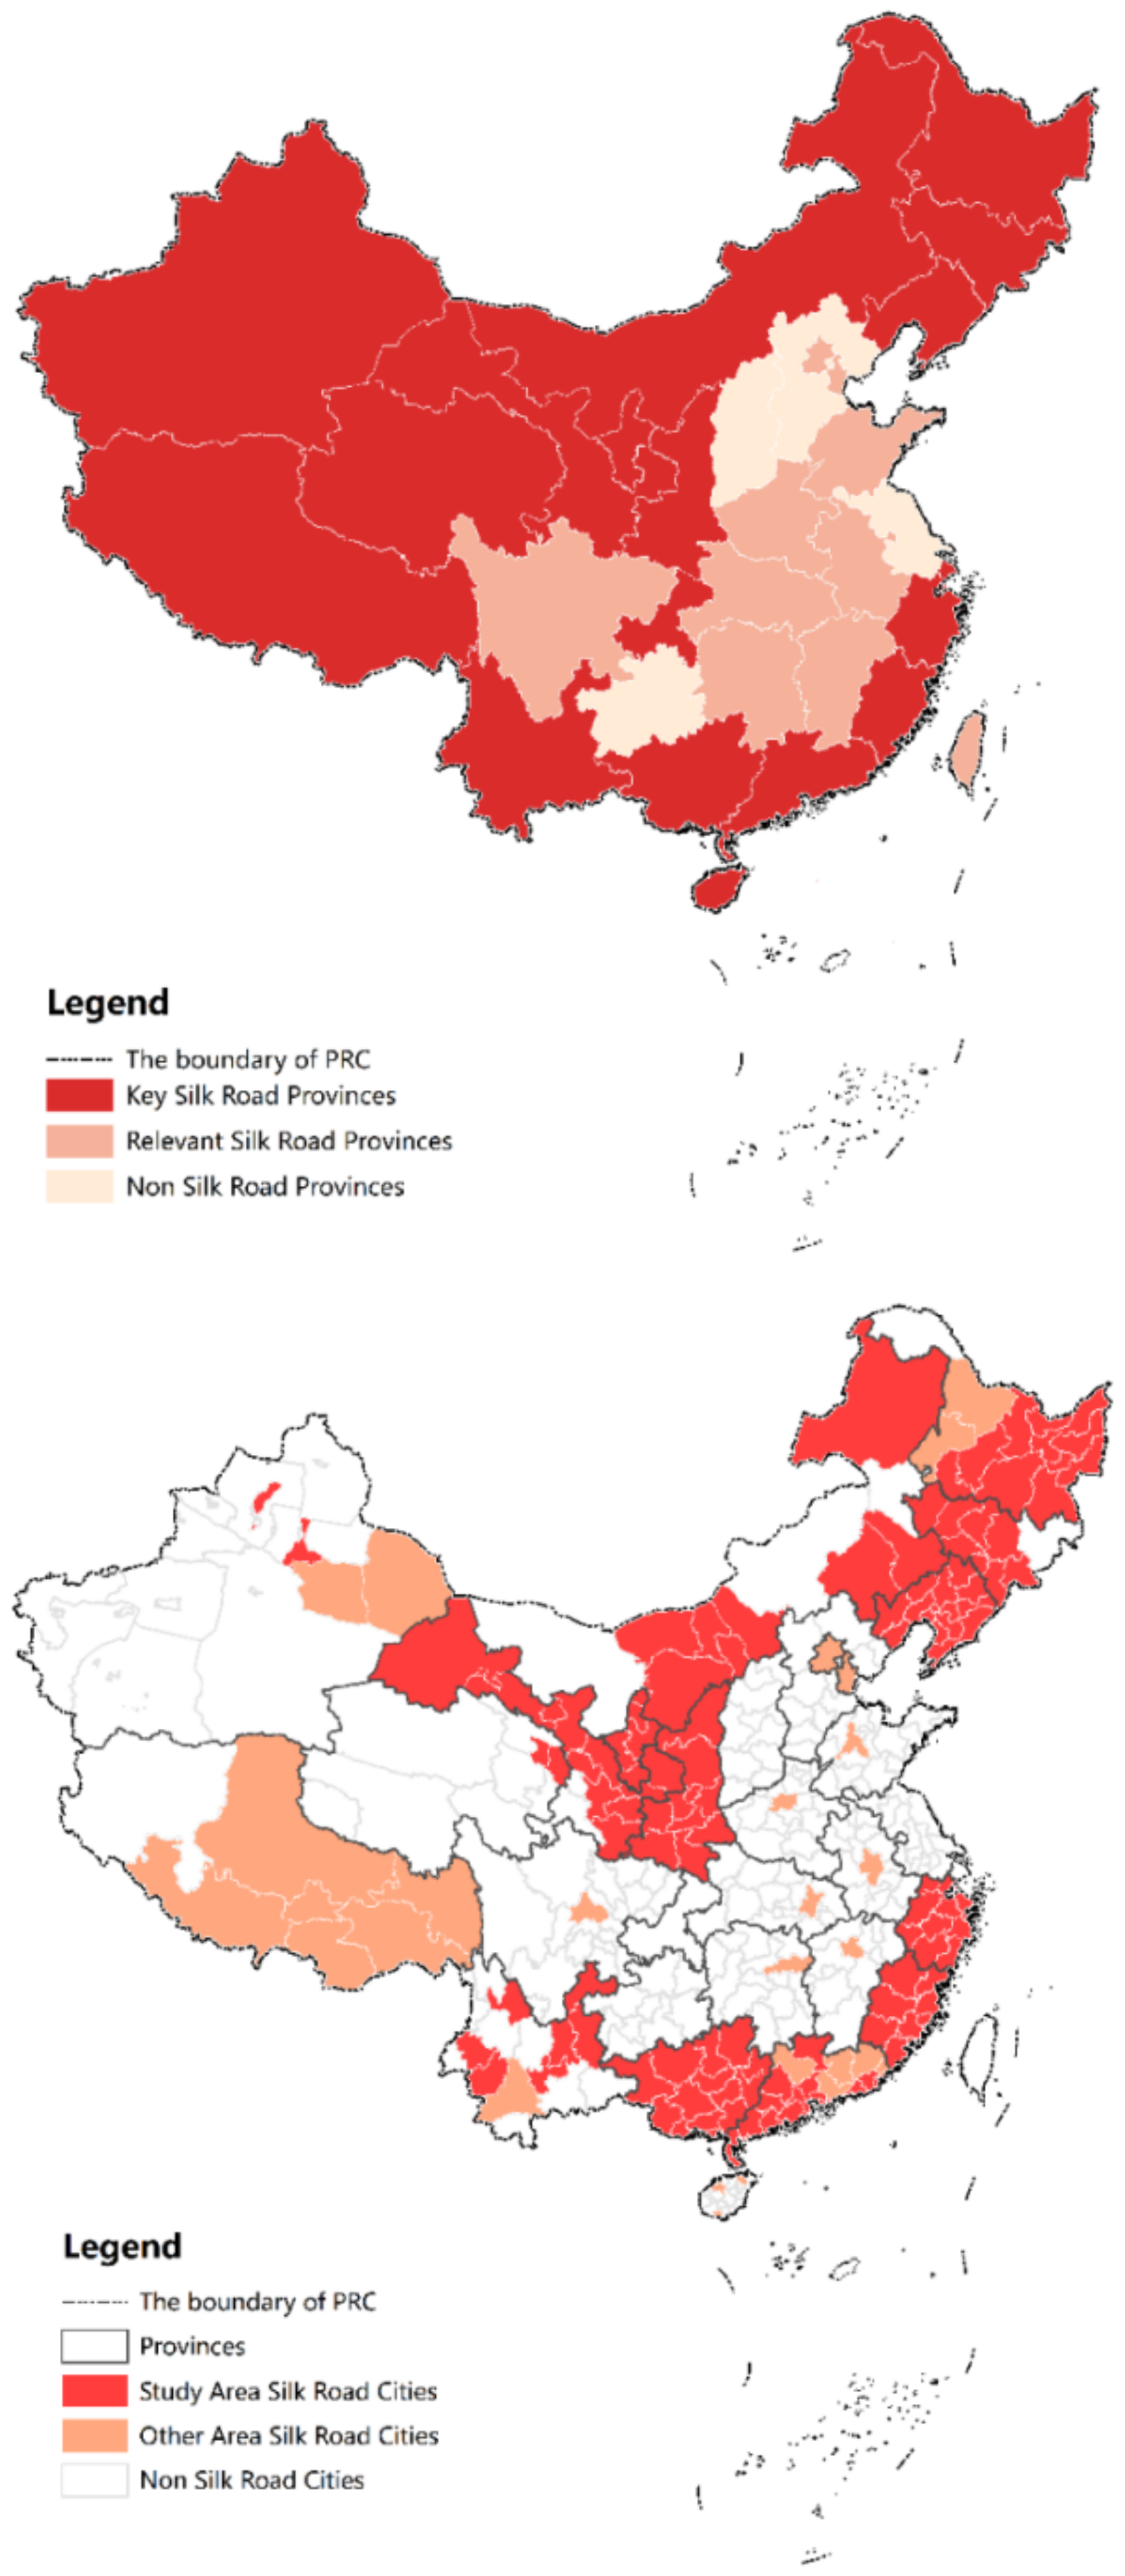
The “Belt and Road” consists of an overseas section and a section in China, and in this paper Silk Road cities along the Chinese section are the study region. Since the “Belt and Road” construction is open and inclusive and welcomes the active participation of all countries, international and regional organizations in the world, the number of countries and regions in the overseas section has been in continuous expansion, and thus the dynamic changes in the number of Silk Road cities make it difficult to acquire accurate data and analyze the spatial and temporal evolution across regions. In contrast, the spatial scope is stable and there are statistics of the same standards available in the China section. The Vision and Proposed Actions Outlined on Jointly Building Silk Road Economic Belt and 21st-Century Maritime Silk Road proposes to “give full play to the comparative advantages of all regions in China”, clearly defines 18 key provinces (autonomous regions and municipalities directly under the Central Government) to jointly promote the construction of the “Belt and Road” [102], and puts forward requirements for Beijing, Shanghai, Hefei, Hong Kong, Macao and Taiwan to participate in the construction of the “Belt and Road”. With the exception of Taiwan (China), whose administrative division differs from that of the Chinese mainland, there are 162 Silk Road cities at the prefecture level and above in the China section. Hainan and Tibet were not included in the study area of the key provinces due to the lack of urban data. Additionally, in view of data comparability, relative spatial continuity, and data integrity, all Silk Road cities in the provinces involved were excluded from the study, so were Turpan, Hami, Qiqihar, Heihe, Pu’er, Qingyuan, Heyuan, Chaozhou, Meizhou, and Huizhou in the key provinces, and finally the study area of this paper consisted of 129 cities in 14 key provinces (see Figure 1 and Table A1).
A number of empirical studies on the development of Silk Road cities in the China section have emerged in recent years, including the evaluation of the performance of Chinese ports along the “Belt and Road” [103] and the study of the differences in their urban financial development [104], and the study of multicity sustainable regional urban growth simulation along the route [105]. As only a very small portion of Silk Road cities (generally no more than 50) are used as research samples in the existing papers, and the study area covers less than 30% of Silk Road cities in China, the accuracy and practicality of the research findings need to be further tested. Compared with the existing studies, the study area in this paper covers 80% of Silk Road cities in China, further improving the precision and application value of the study.
Additionally, from the perspective of industrial land area and its changes, the study area holds an important position in all Silk Road cities and cities in China, which is highly representative (see Table 1). In 2018, the industrial land in the study area accounted for more than 65% of that in Silk Road cities, and 21.80% of the urban construction land in the study area. The growth of industrial land in the study area from 2014 to 2018 accounted for 83% of that in Silk Road cities, and 26.05% of the urban construction land in the study area. The comparative analysis in Table 1 shows that the study area is very representative of Silk Road cities and even cities in China. The industrial land is a major engine driving the urban spatial expansion of Silk Road cities, and thus it has become an important indicator for studying land use changes in Silk Road cities.
2.2. Research Methods
GeoDetector, created by Professor Wang Jinfeng in 2010 and developed through continuous refinement, is an emerging statistical method to detect spatial heterogeneity and reveal its influencing factors [106]. With the characteristics of clear principle, defined meaning, broad application conditions and nonlinear mechanism, this method has been widely used in many natural sciences and humanities disciplines including geography, sociology, economics, ecology, environmental science, landscape science, planning science and even medicine [107]. There have been papers based on the GeoDetector method at present in the field of land use and cover research [108,109,110,111] to explain the spatial divergence and spatial–temporal evolution characteristics of land use and their driving factors. GeoDetector offers 4 functions—factor detector, interaction detector, ecological detector, and risk detector (http://www.geodetector.cn, accessed on 10 March 2021)—and in this paper the first three are used to study the influencing factor forces, and their interaction effects on industrial land changes in Silk Road cities.
Let the independent variable be and the dependent variable be , the value acquired from the differentiation and factor detection can be used to measure the heterogeneity of and to what extent explains the heterogeneity of . The value is in a range of [0, 1], under the condition of passing the significance test, a larger value indicates that has a more obvious heterogeneity and has a stronger power to explain it. Generally speaking, 0.01 is taken as the standard for the significance test under strict conditions, 0.05 under general conditions, and 0.1 under easing conditions. Interaction detection helps identify the interaction between different driving factors ; that is, whether the driving factors and will increase or decrease the explanatory power of the dependent variable when they are involved in the interaction, or whether the influence of these factors on is independent of each other. According to the relationship between , , and under the interaction of the two driving factors, the evaluation results include nonlinear weakening ( < Min (, )), single-factor non-linear weakening (Min () < < Max (, )), dual-factor linear enhancement ( > Max (, )), independence ( = + ), and non-linear enhancement ( > ( + ) [112,113] (see Table 2).
2.3. Index Selection
Inventory and increment are critical parameters for evaluating the current characteristics and changing trends of industrial land development in Silk Road cities. In this paper, three indicators of industrial land area in 2014, industrial land area in 2018, and the change amount of industrial land area from 2014 to 2018 are used as dependent variables, and 20 indicators are used as independent variables from 8 driving factors of population, facilities, cost, investment, innovation, openness, coordination, and greenness, by referring to the research ideas of Wu [114], Zhao [115] and Liu [116], to explore the mechanism driving industrial land changes in Silk Road cities (see Table 3). The independent variables of and are the data of the 20 indicators in 2014 and 2018, and is closely related to the changing scope and the base period duration of the 20 indicators, denoted by change-1 and change-2, respectively. The former represents the amount of change in the independent variable from 2014–2018 and the latter represents the independent variable in 2014.
2.4. Research Steps
Referring to the research method of Zhao [117], the research framework in this paper consists of 3 phases, and the implementation process includes 4 main steps and 9 key points (see Figure 2). The first phase is “Ask Question”, presenting the study objectives and questions based on the research background and literature analysis. The second phase is “Analyze Question”, aiming to analyze and construct the indicator system, collect, process and analyze the data according to the selected research methods and research areas. The last phase is “Solve Question”, summarizing the main findings in this paper, and presents the final conclusions with the help of external verification discussions. The main research steps are as follows:
The first step is “Raw Data and Preprocessing”. ① Develop a complete raw data table based on the data released by the involved statistical websites; ② discrete the continuous data of the independent variables using Python, and divide the 129 Silk Road cities into 10 categories (3–12) by natural breaks to eliminate artificial influence. If none of the 10 schemes meet the requirements, for example, there is only one city in a given category, the 11th data discretization will be performed with the mean value as the criterion.
The second step is “Data Processing”. ③ Calculate the coefficient of variation of the dependent variable using Excel; ④ import the raw data of the dependent variable and the discretized data of the independent variable into GeoDetector to calculate the analysis results.
The third step is “Data Review”. Make a preferred choice among the alternatives in ②; ⑤ use the significance test as a criterion to determine the credibility of the results; and ⑥ select the one with the highest q-value as the final solution when the same or higher level of significance is met. In this paper, 0.05 is taken as the criterion for significance test, or 0.1 in special cases, for an exploratory study under loose constraints.
The fourth step is the result analysis and discussion. ⑦ Determine the explanatory power of the independent variables by ranking them according to the q value; ⑧ analyze the interaction effects of the driving factors; ⑨ calculate the mean value of q for the independent variables that have passed the significance test, calculate the strength of the 8 driving factors, and analyze ecological and environmental effects to further reveal the driving mechanisms and policy implications of industrial land changes in Silk Road cities.
2.5. Data Sources
The data mainly come from China Urban Construction Statistical Yearbook and China City Statistical Yearbook, and individual missing data come from statistical yearbooks, statistical bulletins, government work reports of provinces and cities. Although the “Belt and Road Initiative” was proposed in 2013, land use change is lagging behind, so the base period is set to 2014 in this study. It should be noted that the data years for carbon dioxide emission are 2014 and 2017, because the data for 2018 is not yet available. The industrial land mentioned in this article is consistent with the Urban Land Classification and Planning and Construction Land Standard (GB50137–2011). Industrial land refers to land used for production workshops, warehouses and auxiliary facilities of industrial and mining enterprises, including land used for special railways, wharfs and auxiliary roads, parking lots, etc., excluding land used for open-pit mines. Generally, most industrial land is distributed in industrial parks, which are divided into three categories.
3. Results
3.1. Heterogeneity Analysis
Table 4 shows the results of spatial heterogeneity analysis of industrial land in Silk Road cities.
3.1.1. Inventory
The differences in development stages, resource endowments and location conditions lead to significant heterogeneity in the area of industrial land and its changes in Chinese Silk Road cities. In 2018, the city with the largest industrial land area was Dongguan (398.44 km2), and the city with the smallest industrial land area was Longnan (0.16 km2), with a difference of about 2500 times. Additionally, the variation coefficient of urban industrial land area along the Silk Road is 1.68, much greater than 0.36, showing high heterogeneity [118]. The largest and smallest cities in terms of industrial land area were the same in 2014, but the coefficient of variation was greater (1.80) and the spatial heterogeneity was more significant. Based on the spatial clustering analysis of score digits in GIS, it was found that the distribution pattern of industrial land in the Silk Road cities varied significantly in some regions. In the southwest it mainly changed from High to Low, such as cities in Guangxi and Guangdong; in the northeast it mainly changed from Low to High, such as coastal cities in Liaoning and border cities in Jilin; in the southeast the changes are complicated, with different forms such as “High→Low”, “Medium→Low” and “Low→Medium” appearing at the same time in Zhejiang and Fujian (see Figure 3).
3.1.2. Increment
Very high spatial heterogeneity was found in the change of industrial land use in Chinese Silk Road cities during 2014–2018. Specifically, Zhuhai had the largest industrial land area expansion (75.57 km2) and Shenzhen had the largest industrial land area contraction (−42.69 km2), with a variation coefficient of up to 3.25, indicating high heterogeneity. In the past five years, 69.77% of the cities have achieved positive growth in industrial land, and the cities with positive growth are concentrated in contiguous areas; 11.63% have stayed the same, scattered in distribution and mostly in the northwest and northeast; 18.60% have experienced negative growth, mainly the core cities in the Yangtze River Delta and the Pearl River Delta, facing pressure from the policy of reduced development; while the rest are border cities in the northeast and marginalized cities in the northwest with insufficient development momentum (see Figure 4).
These changes show that the transformation of the economic growth pattern in eastern China, the economic revitalization of the northeast China and the development of the west regions are in full force, both domestic industrial transfer and production capacity cooperation among international communities are making steady progress, and the northeast and western regions that have been long marginalized are embracing great opportunities for development under the guidance of the “Belt and Road Initiatives”. Specifically, in 2016, the central government promulgated and implemented the Several Opinions on the Comprehensive Revitalization of the Northeast Region and Other Old Industrial Bases and the Thirteenth Five-Year Plan for Northeast Revitalization, requiring the northeast region to be actively integrated into and participate in the “Belt and Road Initiatives” to promote industrial upgrading, international production capacity and equipment manufacturing cooperation, and build an important window for opening up to the north and a central hub for cooperation in northeast Asia. Globally, the northeast region has accelerated the promotion of China–Mongolia–Russia economic corridor construction, run China–Mongolia–Russia international container transport freight trains on a regular basis, and built border industrial parks and China–Russia international cooperation demonstration zones in recent years; domestically, by virtue of preferential policies, the northeast region has increased investment in steel, petrochemicals, machinery, machine tools, automobiles and other high-tech manufacturing industries For the western region, besides the great efforts made by the state and provinces or cities to expand the industrial capacity distribution and offer more favorable policies in their “13th Five-Year Plan”, the central government has also specially issued the Guidance on Promoting the Development of the Western Region to Form a New Pattern in the New Era, requiring key support for the construction of international corridors and industrial bases in Xinjiang, Chongqing, Sichuan, Shaanxi, Gansu, Guizhou, Qinghai, Inner Mongolia and other regions to accelerate the pace of industrial transfer from the east to the west and enhance the level of globalization and industrialization in the western region, guided by common construction of “Belt and Road”. As a package of policies are implemented, a large number of projects are planned, and a series of actions are taken, there will inevitably be a huge demand for the transformation of industrial land stock and the development of additional industrial land, resulting in a “positive growth” of industrial land in the northeast and western regions.
3.2. Factor Analysis
Table 5 and Table 6 show the results of the factor detection and the results of the driving factor analysis.
3.2.1. Inventory
In 2014, , , , failed to pass the significance test, and could only pass a loose significance test at the 10% level, while the rest of the factors passed the significance tests at 5% or more stringent levels. At the 5% level of significance, the driving factors were ranked as > > > > > > > > > > > > > > > > > > in intensity, and the driving forces were ranked as Open > Coordination > Innovation > Population > Investment > Green > Industry > Cost in intensity. The mean of the factor forces was 0.45, with 12 exceeding the value. The mean of the driving forces was 0.47, with 5 exceeding the value.
In 2018, , failed to pass the significance test, while the rest of the factors passed the significance tests at 5% or more stringent levels. At the 5% level of significance, the driving factors were ranked as > > > > > > > > > > > > > > > > > > > > > in intensity, and the driving forces were ranked as Open > Population > Coordination > Innovation > Investment > Industry > Green > Cost in intensity. The mean of the factor forces was 0.46, with 13 exceeding the value. The mean of the driving forces was 0.46, with 5 exceeding the value.
3.2.2. Increment
From the perspective of Change-1, , , , , , , , , , , failed to pass the significance test, and , , only passed a loose significance test at the 10% level, while the rest factors passed the significance tests at 5% or more stringent levels. At the 5% level of significance, the driving factors were ranked as > > > > > > > > > in intensity, and the driving forces were ranked as Population > Investment > Innovation > Open > Industry > Coordination > Cost > Green in intensity. The mean value of the factor force was 0.14, with 3 factors exceeding the mean. The mean of the factor forces was 0.14, with 3 exceeding the value. The mean of the driving forces was 0.17, with 2 exceeding the value.
From the perspective of Change-2, , , , , failed to pass the significance test, and , , , , , , , only passed a loose significance test at the 10% level, while the rest factors passed the significance tests at 5% or more stringent levels. At the 5% level of significance, the driving factors were ranked as > > > > > > > > > in intensity, and the driving forces were ranked as Innovation > Investment > Green > Industry > Open > Coordination > Population > Cost in intensity. The mean of the factor forces was 0.21, with 5 exceeding the value. The mean of the driving forces was 0.22, with 3 exceeding the value.
3.3. Interaction Analysis
3.3.1. Inventory
The driving factors were all enhanced with each other, including “Enhance, bi” and “Enhance, nonlinear”, and there was no independent or diminishing relationship (Figure 5 and Figure 6). There were 40 and 54 “Enhance, nonlinear” factor pairs in 2014 and 2018, accounting for 23.39% and 23.38%, respectively. In 2014, the interaction influence of ∩∩∩∩∩∩∩∩∩∩∩∩∩∩∩∩∩∩∩∩∩∩∩∩∩∩∩∩∩∩∩∩∩∩∩∩∩∩∩∩ was greater 0.9, and in particular, and especially that of ∩, ∩, ∩, ∩ was up to 0.97. In 2018, the interaction influence of ∩∩∩∩∩∩∩∩∩∩∩∩∩∩∩∩∩∩∩∩∩∩∩∩∩∩∩∩∩∩∩∩∩∩∩∩∩∩∩∩∩∩∩∩∩∩∩∩∩∩∩∩∩∩∩∩∩∩ was greater 0.9, and especially that of ∩ was up to 0.97.
3.3.2. Increment
The driving factors were also both enhanced with each other, including “Enhance, bi” and “Enhance, nonlinear” (Figure 7 and Figure 8). There were 26 and 53 “Enhance, nonlinear” factor pairs from both change-1 and change-2 perspectives, accounting for 57.78% and 80.30%, respectively. From the perspective of change-1, the interaction influence of ∩, ∩, ∩, ∩, ∩ was greater than 0.6, and especially that of ∩ was up to 0.65. From the perspective of change-2, the interaction impact of ∩∩∩∩∩∩∩∩∩∩∩∩∩∩∩∩∩∩∩∩∩∩∩∩∩∩∩ was greater than 0.6, and especially that of ∩, ∩ was greater 0.8.
4. Discussion
4.1. Significant Differences in the Composition of Stock and Incremental Drivers and Their Influence Intensity
There are many factors influencing the industrial land stock in Silk Road cities, and the intensity of the force varies significantly, and the development of industrial land in Silk Road cities under the influence of the “Belt and Road Initiative” is characterized by diversified driving forces and complex driving mechanisms. Based on the ranking results and mean values, the factors are classified into three categories in this paper (see Figure 9). The first category contains key factors, i.e., the top three factors, which have the greatest impact on the industrial land stock in Silk Road cities. The second category contains important factors, i.e., the factors above the mean, which have a non-negligible impact on the industrial land stock in Silk Road cities. The third category contains general factors, i.e., the factors below the mean, which have an impact on the industrial land stock in Silk Road cities but are largely negligible. Additionally, according to the comparative analysis of driving factors in 2014 and 2018, floating population, resident population, land area for public facilities, loans from financial institutions, city public budget expenditure, city science and technology expenditure, foreign direct investment, land area for logistics and warehousing, added value of tertiary industry, green coverage area, natural gas consumption and industrial wastewater discharge are long-term and influential factors (Table 4), which lends support to the findings of Lee [119], Tian [120] and Lall et al. [121] that factors such as transportation investment, trade and FDI are determinants of the spatiotemporal evolution of Silk Road cities. In general, Open, Population, Coordination, Innovation and Investment are major driving forces determining the size of urban industrial land stock in Silk Road cities, while Industry, Green, and Cost are less influential.
It should be noted that the impact of the population driving force is becoming increasingly complex, with the absolute force going down, but the relative force going up. The absolute force decreased slightly from 2014 to 2018, changing from 0.60 to 0.58. However, the force in the same period was surging rather than falling, from the fourth to the second place. One possible explanation is that with China’s industrial upgrading, the demand for population in the eastern region is decreasing as the level of industrial automation and intelligence is increasing; in contrast, the demand for population is increasing as the industries in the east, especially labor-intensive businesses, are moved to the west and northeast. This phenomenon agrees with the changing dynamics of industrial land use found in Section 3.1.1. In addition, the trend of migrant worker mobility in China also provides material evidence. According to the Monitoring Survey Report on Migrant Workers, the number of migrants employed workers in the eastern region fell by 1.2% in 2018, while it rose by 4.2% in the western region.
The number of industrial land development driving factors in Silk Road cities was larger in 2018 than in 2014, increased from 19 to 22, indicating a growing diversity in driving forces. In particular, Import and Export were transformed from non-driving factors to key driving factors, while Road network density and Road area ratio were transformed from non-driving factors to important driving factors. In conclusion, with the increase in the number of driving factors and the concentration of forces, there are interaction effects of double factor enhancement and non-linear enhancement among the factors, reflecting that the driving forces of industrial land development in Silk Road cities under the “Belt and Road Initiative” are increasingly diversified and the driving mechanisms are increasingly complex.
There are few factors influencing the increment of industrial land in Silk Road cities with weak forces, but there is a significant difference in their intensity. Based on the ranking results, the factors are classified into three categories in this paper (see Figure 10). The first category contains key factors, i.e., the top three factors, which have the greatest impact on the industrial land changes in Silk Road cities. The second category contains important factors, i.e., the top 4–6 factors, which have a non-negligible impact on the industrial land changes in Silk Road cities. The third category contains general factors, i.e., other factors, which have an impact on the industrial land changes in Silk Road cities but are largely negligible. Additionally, according to the comparative analysis of driving factors from the perspective of change-1 and change-2, at the significance level of 0.05, Land area for public facilities, Loans from financial institutions, City public budget expenditure, City science and technology expenditure, Land area for logistics and warehousing have great influence; at the significance level of 0.1, the influences of Electricity consumption for industry, Carbon dioxide emission, Green coverage area, Road network density, Import, Added value of tertiary industry and Industrial NOx emission cannot be ignored (see Table 4). These conclusions are in agreement with some of the findings of Park [122], Huang [123], Tong [124], Yang [125], Chen [126] et al. that FDI and international economic and trade cooperation, as the representation of unblocked trade, and infrastructure investment, as a basis for facility connectivity, have great influence on the spatial changes of Silk Road cities. In general, the change in the corresponding indicators of the driving factors Investment and Innovation and the base period stock have powerful influence on the change of industrial land in Silk Road cities, the driving force Population can only exert great influence relying on the change in corresponding indicators, and the driving force Industry can only exert great influence by virtue of the base period total of corresponding indicators, while other driving forces have less influence.
4.2. Use of Key and Integrated Factors and Their Interactions as a Basis Helps to Achieve Precise Policy Design
This study will be able to identify the influencing factors that drive both the stock and the increment of industrial land in Silk Road cities as integrated factors, and characterize the driving force intensity by summing the q-values. At the significance level of 0.05, the integrated factors are ranked as City public budget expenditure > City science and technology expenditure > Land area for public facilities > Land area for logistics and warehousing > Loans from financial institutions. Floating population, Added value of tertiary industry, Industrial NOx emissions, Green coverage area and other factors cannot be ignored under the loose condition of 0.1 [127,128] (see Figure 11). Similarly, at the significance level of 0.05, the integrated driving forces are ranked as Innovation > Open > Investment > Coordination > Industry. Population and Green also become important integrated driving forces under the loose condition of 0.1 (see Figure 12).
To sum up, Floating population, City public budget expenditure, City science and technology expenditure, Foreign direct investment, and Import and Export are key or integrated factors influencing industrial land and its changes in Silk Road cities [129,130], and Innovation, Open, and Investment are key or integrated driving forces [131,132], which should be given priority attention when developing industrial development plans and spatial governance policies in Silk Road cities (see Figure 13).
It is important to note that the factors were enhanced with each other, and the synergistic driving force between two factors was generally doubled or multiplied even more than 10 times under the effect of non-linear enhancement and two-factor enhancement. For example, the force intensity of in 2014 was 0.07, and that of ∩ was 0.91, an enhancement of 13 times. Therefore, it is important to accurately analyze the factor interactions and effects in policy design, and take advantage of them to further improve policy performance. It is with the help of these factors and their interaction that the “Belt and One Road” initiative promotes the reform of space production mechanisms and the development of the right structures in Chinese Silk Road cities [133,134,135].
4.3. Environmental Effects Caused by Changes in Industrial Land Are Highly Complicated
Industrial land is the land that sees the closest interaction between humans and nature, and the changes in the scale, type, form, structure, development intensity and other attributes of industrial land have a significant impact on the environment and climate change, and even the ecosystem functions and patterns [136]. The change of industrial land plays a decisive role in the quality of the ecological environment and its changes in Silk Road cities. The changes of environmental and ecological effects are mainly achieved through the coupling of pollutant and carbon dioxide emissions, energy utilization, landscape improvement and policy interventions. That is, in these ways, changes in industrial land have a dramatic impact on changes in urban land, air, water, cover, and other natural, ecological, and environmental changes, while environmental changes in turn act on changes in industrial land, thus exerting a constraining effect on new changes in industrial land (scale expansion, type conversion, morphological transformation, structural transformation, intensity enhancement and other evolutions).
First of all, a large amount of arable land, grassland, forest and other land has been developed and transformed into industrial parks, factories and their supporting facilities, bringing changes to the landscape pattern and the appearance of the land [137]. The expansion of industrial land comes along with the reduction in arable land, and the conversion between industrial land and arable land is considered to be unidirectional, that is, it is easy to convert arable land to industrial land, but it is very hard and even impossible to reverse the conversion. When land is used for industrial purposes, occupation and topsoil stripping lead to soil consolidation, structural damage, property alienation (e.g., salinization and sanding), functional degradation, and loss of capacity for agricultural production and plant growth [138]. In addition, special industrial development may also lead to land pollution, especially toxic and radioactive, corrosive, explosive and combustible high-risk industries, such as chemistry, chemical engineering, petroleum and mining. Toxic and harmful industrial products and their supporting items will be infiltrated into the soil during industrial development, and when the industrial land is converted to other uses (such as agricultural, residential, and service land) the “residual toxins” in the soil will slowly evaporate and be released for tens or even hundreds of years, resulting in serious ecological and environmental problems, leading to the final abandonment and discarding of the industrial land at the end of its service life. Therefore, for arable land converted into industrial land, real or potential contamination by harmful toxic or hazardous substances will prevent its reconversion and affect the redevelopment and reuse of the land itself.
In the redevelopment of industrial sites, China has announced the measures of classified renewal and zoning transformation. For previously developed land (PDL) with certain safety or environmental hazards, it is required to first assess the risks, then promote ecological and environmental restoration according to local conditions, and finally implement protective redevelopment. Such industrial land is in general converted into ecological land, parkland, land for transportation, land for firefighting facilities, and land for recreational and open space, but rarely converted into arable land in consideration of food security. For industrial land without safety or environmental hazards, enterprises should be encouraged to promote the transformation of industrial land into storage land, land for scientific research, service land, residential land and land for mixed use, provided that they comply with the planning and safety standards. Urban industrial land is generally transformed into non-arable land, while rural industrial land and suburban industrial land are determined on a case-by-case basis, with a certain percentage of industrial land restored to arable land. Many policies and practical cases have emerged in this area, such as the implementation of the Several Opinions on Supporting Industrial Transfer Industrial Park Land to Enhance the Quality and Efficiency of Land Use in Guangdong Province and the Guidance on Deepening Reform to Accelerate the “Three Old” Transformation for High-Quality Development, besides the pilot project of integrated land use in the Shanghai Free Trade Zone allowing scattered landowners to change the original land use for joint redevelopment under the condition of joint participation, transforming the industrial plant of Jiangsu Changzhou Match-Well Electrical Products Co., Ltd. into Changzhou Tianning Cultural and Creative Industrial Park, and turning the old industrial area of Seg-Hitachi into a landmark urban complex integrating work, entertainment and life.
Secondly, the operation of factories leads to the rapid increase in urban energy consumption, including electricity, natural gas, oil and coal consumption for industry, changing the urban energy utilization system. Industry is the major energy consumer in Silk Road cities, and with the development of international capacity cooperation along the “Belt and Road”, there will be an increase in energy consumption [139]. Electrical power is the main source of energy for industry, and in terms of electricity consumption, for example, the share of industrial consumption of electrical energy in the Silk Road cities increased from 65% in 2014 to 69% in 2018, and the change in industrial consumption of electrical energy accounted for up to 73% of the change in urban electricity consumption. Therefore, industrial development has a significant positive driving effect on the energy consumption in Silk Road cities, and is gradually changing the urban energy utilization system and energy consumption structure.
Thirdly, industrial development has led to climate change and increasing environmental pollution, and has brought about a rapid increase in carbon dioxide emissions, industrial sulfur dioxide emissions, industrial NOx emissions, industrial smoke (dust) emissions, industrial wastewater discharge, and industrial solid waste discharge, which has seriously affected the quality of the residential environment and the sustainable development of the natural ecological environment [140,141,142]. Climate and environmental quality are the most ecologically active factors and are major driving forces for the formation and evolution of ecology. Changes in industrial land use in Silk Road cities affect climate and environmental quality in the following ways: first, increased carbon dioxide emissions due to fossil energy use result in greenhouse effect; second, the conversion of arable land, forests and grasslands into industrial land leads to changes in the nature of the land substrate and land cover, resulting in changes in the thermal and water environments, and thus leading to the heat island effect, the destruction of water cycle and an impact on biodiversity; third, industrial development leads to increased emissions of air pollutants and decreased air quality. On the one hand, emissions of harmful substances such as sulfides, nitrogen compounds and particulate matter have increased; on the other hand, large amounts of arable land, grasslands, forests and wetlands have been converted into industrial land, leading to a weakening of their ability to purify the air and eventually an increase in air pollution.
In the end, for the healthy development of residents, land and ecology, the government has introduced policies and formulated spatial planning to intervene in the change of industrial land use. For example, energy conservation and emission reduction, environmental protection, ecological planning and landscape design have been incorporated into the mandatory policy system to counteract the change of industrial land. On the central government level, the Ministry of Environmental Protection, the Ministry of Foreign Affairs, the National Development and Reform Commission and the Ministry of Commerce have jointly issued the Guidance on Promoting Green “Belt and Road” Construction, requiring “the formulation and implementation of a series of ecological and environmental risk prevention policies and measures”; the General Office of the State Council has issued the Guidance on Scientific Greening, requiring “a combination of artificial restoration and natural restoration, a reasonable layout of greening space, and the integrated protection and restoration of mountains, water, forests, fields, lakes, grasses and sands”, to lay a solid foundation for the construction of the green construction of “Belt and Road”. On the local level, the permanent basic farmland protection lines, ecological conservation redlines and urban development boundary lines should be defined in spatial planning to strictly control conversion of expropriated arable land into industrial land; the overall ecological planning and landscape design of the city should be strengthened during spatial planning, and the content and specific requirements of landscape greening design for industrial land and industrial parks should be clarified.
China has developed and implemented a series of special and comprehensive regulations on arable land protection. The Opinions on Establishing a Territorial Spatial Planning System and Supervising Its Implementation and the Urban and Rural Planning Law require that the spatial planning of provinces and cities must clearly delineate the red line for the protection of permanent primary farmland and increase farmland conservation. The Land Management Law gives further details and requires that for the transformation of arable land into construction land (including industrial land), it must be reported to the State Council for approval as long as the primary farmland is occupied; for arable land other than primary farmland, the occupation of an area over 35 hectares must also be reported to the State Council for approval. It also provides detailed regulations on the composition and amount of compensation expenses for the arable land expropriation. For example, the elements of the expenses include a land compensation fee, a resettlement subsidy and a compensation fee for ground attachment and seedlings, and the land compensation fee is six to ten times the average annual output value of the arable land for the three years before the land is expropriated. Raising the approval authority for arable land, especially primary farmland protection, to the central government and specifying the compensation fee for arable land occupation have increased the cost of converting arable land into construction land, so it is hard for arable land to be converted into industrial land without permission, and arable land is well protected
Besides, in line with the requirements of ecological civilization construction and “carbon neutral” development, the government has changed the regulations concerning arable land protection, energy conservation and emission reduction, and environmental protection as well as other related provisions into mandatory measures in the formulation of local policies. For example, in the 13th and 14th Five-Year Plans, a series of indicators such as arable land quantity, reduction in water consumption per unit of industrial value added, reduction in energy consumption and carbon dioxide emissions per unit of GDP, reduction in total emissions of major pollutants such as sulfur dioxide and nitrogen oxides, ratio of days with good air quality in cities, and forest coverage are set as binding. These binding indicators indicate what the government must do, showing the government’s commitment to the people. They are the targets that the government must achieve, complete or must comply with, and have become hard and key targets for the higher-level governments to assess those at a lower level. It should focus on spatial planning and public policies, with the help of monitoring, statistics, publication, assessment, reward and punishment for ecological- and environmental-effect-related indicators and their changes, to counteract the changes of industrial land, to restrain the development and evolution of industrial land, and to realize the mutual influence and effect between the industrial land change and the ecological environment change.
5. Conclusions
The allocation of land use and its changes are important policy tools for Chinese central and local governments to promote economic growth, industrial upgrading, and job creation, and industrial land has long played a key role in the process [143,144]. Cooperation on production capacity is a key element of the “Belt and Road Initiative”, and industrial land is its most important material support. The study of the driving mechanism of industrial land change in Silk Road cities can explain how the “Belt and Road” reshapes the town system and economic geography along the route with the help of industries and their land use planning, and can even reveal, to a certain extent, how the “Belt and Road” policy is reshaping society, politics, landscape and spatial relations along the route, which is of great theoretical significance and practical value.
From a theoretical perspective, this study provides a framework and method for Silk Road scholars to analyze the spatial–temporal evolution characteristics of land use and coverage and their influence mechanisms in cities along the “Belt and Road”, and helps to seize and reveal the spatial rules of industrial land and its evolution. From a practical perspective, this study helps urban policy makers and decision makers to find a scientific and reasonable industrial land supply model and driving mechanism, provides theoretical support and a decision-making basis for industrial upgrading and layout optimization in the regions along the “Belt and Road”, and puts forward valuable suggestions for long-term industrial land supply planning, differentiated land allocation and spatial governance policy design for governments at all levels. The study methodology and the findings in this paper provide important references for countries along the “Belt and Road” to develop their own Silk Road cities, especially those in Southeast Asia, the Middle East and Africa in the rapid development stage of industrialization and urbanization, such as Vietnam, Thailand, the United Arab Emirates, Iran, Pakistan and Egypt.
In our study, some shortcomings and deficiencies are still observable. For instance, the supply of industrial land in China is greatly influenced by government policies and institutions [145,146], and factors such as the land transfer fee, land value increment tax, government management mechanisms and institutional reforms with great influence are not included in the analysis framework of this study due to the difficulty in data collection. Additionally, as a result of the lack of comparative analysis of non-Silk Road cities in the China segment against the control group of Silk Road cities in the overseas segment, we have only provided geographical conclusions about Chinese Silk Road cities, leading to insufficient awareness of Silk Road cities as a whole.
The “Belt and Road” initiative has already had a complex impact on industrial land changes in the rest of the world, and it is driving cities along the route to develop new industrial land or renovate old industrial land, as evidenced by the more than 100 international cooperative industrial parks that China has built with host countries. For example, the Suez Economic and Trade Cooperation Zone built by China and Egypt has completed the development of a 2 km2 starting area and is now promoting the construction of a 6 km2 expansion area. The development of this industrial land project has achieved huge economic and social benefits. As of the end of December 2020, the industrial project attracted 96 enterprises, with actual investment exceeding USD 1.25 billion, total sales exceeding USD 2.5 billion, tax payments of nearly USD 176 million, direct employment of about 4000 people, and industry-led employment of more than 36,000 people. We will continue to explore this promising new area. We have already traveled to Egypt, the UAE, Belarus and other countries to conduct field research, and we hope we can conduct a more standardized and comprehensive study on it in the future. In the end, we sincerely call for more researchers to join us, which will help provide more accurate knowledge for academic circles and for society.
Author Contributions
Conceptualization, S.Z.; methodology, S.Z. and J.H.; software, J.H.; validation, S.Z.; formal analysis, S.Z. and Y.Y.; investigation, S.Z. and Y.Y.; resources, S.Z.; data curation, S.Z. and Y.Y.; writing—original draft preparation, S.Z. and Y.Y.; writing—review and editing, S.Z. and Y.Y.; visualization, S.Z.; supervision, S.Z.; project administration, S.Z.; funding, S.Z. All authors have read and agreed to the published version of the manuscript.
Funding
This paper and the related research are financially supported by the Guangxi Social Science Fund Project (No. 17FJY017).
Institutional Review Board Statement
Not applicable.
Informed Consent Statement
Not applicable.
Data Availability Statement
The data used in this paper mainly come from the China City Statistical Yearbook, China Statistical Yearbook published national bureau of statistics. and China Urban Construction Statistical Yearbook issued by the Ministry of Housing and Urban–Rural Development of the People’s Republic of China. Most of the data can be obtained by visiting the following links: http://www.mohurd.gov.cn/xytj/tjzljsxytjgb/jstjnj/ and http://www.stats.gov.cn/tjsj/ndsj/ (accessed on 15 January 2021).
Conflicts of Interest
The authors declare no conflict of interest.
Appendix A

Table A1.
The List of Silk Road Cities in China.
| Type | Province | Silk Road Cities | |
|---|---|---|---|
| Study Area | Other Study Area | ||
| Key Silk Road Provinces | Inner Mongolia | Hohhot, Baotou, Wuhai, Chifeng, Tongliao, Ordos, Hulunbeir, Bayannur, Ulanqab | |
| Liaoning | Shenyang, Dalian, Anshan, Fushun, Benxi, Dandong, Jinzhou, Yingkou, Fuxin, Liaoyang, Panjin, Tieling, Chaoyang, Huludao | ||
| Jilin | Changchun, Jilin, Siping, Liaoyuan, Tonghua, Baishan, Songyuan, Baicheng | ||
| Heilongjiang | Harbin, Jixi, Hegang, Shuangyashan, Daqing, Yichun, Jiamusi, Qitaihe, Mudanjiang, Suihua | Qiqihar, Heihe | |
| Zhejiang | Hangzhou, Ningbo, Wenzhou, Jiaxing, Huzhou, Shaoxing, Jinhua, Quzhou, Zhoushan, Taizhou, Lishui | ||
| Fujian | Fuzhou, Xiamen, Putian, Sanming, Quanzhou, Zhangzhou, Nanping, Longyan, Ningde | ||
| Guangdong | Guangzhou, Shaoguan, Shenzhen, Zhuhai, Shantou, Foshan, Jiangmen, Zhanjiang, Maoming, Zhaoqing, Shanwei, Yangjiang, Dongguan, Zhongshan, Jieyang, Yunfu | Qingyuan, Heyuan, Chaozhou, Meizhou, Huizhou | |
| Guangxi | NanNing, Liuzhou, Guilin, Wuzhou, Beihai, Fangchenggang, Qinzhou, Guigang, Yulin, Baise, Hezhou, Hechi, Laibin, Chongzuo | ||
| Yunnan | Kunming, Qujing, Yuxi, Baoshan, Zhaotong, Lijiang, Lincang | Pu’er | |
| Shaanxi | Xi’an, Tongchuan, Baoji, Xianyang, Weinan, Yan’an, Hanzhong, Yulin, Ankang, Shangluo | ||
| Gansu | Lanzhou, Jiayuguan, Jinchang, Baiyin, Tianshui, Wuwei, Zhangye, Pingliang, Jiuquan, Qingyang, Dingxi, Longnan | ||
| Qinghai | Xining, Haidong | ||
| Ningxia | Yinchuan, Shizuishan, Wuzhong, Guyuan, Zhongwei | ||
| Xinjiang | Urumqi, Karamay | Turpan, Hami | |
| Tibet | Lhasa, Xigaze, Qamdo, Nyingchi, Shannan, Nagqu | ||
| Shanghai | Shanghai | ||
| Hainan | Haikou, Sanya, Sansha, Danzhou | ||
| Chongqing | Chongqing | ||
| Relevant Silk Road Provinces | Sichuan | Chengdu | |
| Henan | Zhengzhou | ||
| Hubei | Wuhan | ||
| Hunan | Changsha | ||
| Jiangxi | Nanchang | ||
| Anhui | Hefei | ||
| Shandong | Jinan | ||
| Beijing | Beijing | ||
| Tianjin | Tianjin | ||
| Hong Kong | Hong Kong | ||
| Macao | Macao | ||
| Taiwan | |||
References
- Panibratov, A.; Kalinin, A.; Zhang, Y.G.; Ermolaeva, L.; Korovkin, V.; Nefedov, K.; Selivanovskikh, L. The belt and road initiative: A systematic literature review and future research agenda. Eurasian Geogr. Econ. 2020, 1–34. [Google Scholar] [CrossRef]
- Oliveira, G.D.T.; Murton, G.; Rippa, A.; Harlan, T.; Yang, Y. China’s Belt and Road Initiative: Views Ground. Political Geogr. 2020, 82, 102225. [Google Scholar] [CrossRef]
- Sarsenbayev, M.; Veron, N. European versus American Perspectives on the Belt and Road Initiative. China World Econ. 2020, 28, 84–112. [Google Scholar] [CrossRef]
- Teo, H.C.; Campos-Arceiz, A.; Li, B.V.; Wu, M.Q.; Lechner, A.M. Building a green Belt and Road: A systematic review and comparative assessment of the Chinese and English-language literature. PLoS ONE 2020, 15, e0239009. [Google Scholar] [CrossRef] [PubMed]
- National Development and Reform Commission; Ministry of Foreign Affairs; Ministry of Commerce of the People’s Republic of China. Vision and Actions on Jointly Building Silk Road Economic Belt and 21st-Century Maritime Silk Road (English); Foreign Language Press: Beijing, China, 2015. Available online: https://www.fmprc.gov.cn/mfa_eng/zxxx_662805/t1249618.shtml (accessed on 15 January 2021).
- Huang, Q.H.; Yun, J.; Li, F.F. Blue Book of Indusrrialization: “The Belt and Road” National Indusralization Process Report; Huang, Q.H., Li, F.F., Eds.; Social Science Literature Press: Beijing, China, 2015; Volume 12. [Google Scholar]
- Anwar, A.; Ahmad, N.; Madni, G.R. Industrialization, Freight Transport and Environmental Quality: Evidence from Belt and Road Initiative Economies. Environ. Sci. Pollut. Res. 2019, 27, 7053–7070. [Google Scholar] [CrossRef]
- UNESCO. Cities Alongside the Silk Roads. Available online: https://en.unesco.org/silkroad/silk-road-themes/cities-silk-roads (accessed on 12 April 2021).
- Feng, T.T.; Kang, Q.; Pan, B.B.; Yang, Y.S. Synergies of sustainable development goals between China and countries along the Belt and Road initiative. Curr. Opin. Environ. Sustain. 2019, 39, 167–186. [Google Scholar] [CrossRef]
- Mansour, I. The BRI Is What Small States Make of It: Evaluating Kuwait’s Engagement with China’s Belt and Road Initiative. Middle East J. 2020, 74, 538–558. [Google Scholar] [CrossRef]
- Niazi, K.; Shoaib, M.; Qiulian, S. Micro Impacts of a Macro-Level Trading Partnership: Effects of China’s Belt and Road Initiative in Pakistan. Am. J. Econ. Sociol. 2020, 79, 301–322. [Google Scholar] [CrossRef]
- Menhas, R.; Mahmood, S.; Tanchangya, P.; Safdar, M.N.; Hussain, S. Sustainable Development under Belt and Road Initiative: A Case Study of China-Pakistan Economic Corridor’s Socio-Economic Impact on Pakistan. Sustainability 2019, 11, 6143. [Google Scholar] [CrossRef] [Green Version]
- Zhou, T.D. Aligning the Belt and Road Initiative with Myanmar’s Sustainable Development Plan: Opportunities and Challenges. IDS Bull. Inst. Dev. Stud. 2019, 50, 69–88. [Google Scholar] [CrossRef]
- Gu, J.; Qiu, S. The Belt and Road Initiative and Africa’s Sustainable Development: A Case Study of Kenya. IDS Bull. Inst. Dev. Stud. 2019, 50, 89–108. [Google Scholar] [CrossRef]
- Chan, S. Singapore-China Connectivity and its Role in the Belt and Road Initiative. China Int. J. 2019, 17, 34–49. [Google Scholar]
- Fardella, E.; Prodi, G. The Belt and Road Initiative Impact on Europe: An Italian Perspective. China World Econ. 2017, 25, 125–138. [Google Scholar] [CrossRef]
- Yilmaz, S.; Liu, C.M. Remaking Eurasia: The Belt and Road Initiative and China-Russia strategic partnership. Asia Eur. J. 2020, 18, 259–280. [Google Scholar] [CrossRef]
- Timofeev, I.; Lissovolik, Y.; Filippova, L. Russia’s Vision of the Belt and Road Initiative: From the Rivalry of the Great Powers to Forging a New Cooperation Model in Eurasia. China World Econ. 2017, 25, 62–77. [Google Scholar] [CrossRef]
- Vangeli, A. China’s Engagement with the Sixteen Countries of Central, East and Southeast Europe under the Belt and Road Initiative. China World Econ. 2017, 25, 101–124. [Google Scholar] [CrossRef]
- Tjia, Y.N.L. The Unintended Consequences of Politicization of the Belt and Road’s China-Europe Freight Train Initiative. China J. 2020, 83, 58–78. [Google Scholar] [CrossRef]
- Wen, X.; Ma, H.L.; Choi, T.M.; Sheu, J.B. Impacts of the Belt and Road Initiative on the China-Europe trading route selections. Transp. Res. Part E Logist. Transp. Rev. 2019, 122, 581–604. [Google Scholar] [CrossRef]
- Pardo, R.P. Europe’s financial security and Chinese economic statecraft: The case of the Belt and Road Initiative. Asia Eur. J. 2018, 16, 237–250. [Google Scholar] [CrossRef] [Green Version]
- Baark, E. European Perspectives on the Chinese Belt and Road Initiative. China Int. J. 2019, 17, 76–95. [Google Scholar]
- Duarte, P.A.B.; Ferreira-Pereira, L.C. The Soft Power of China and the European Union in the context of the Belt and Road Initiative and Global Strategy. J. Contemp. Eur. Stud. 2021, 1–15. [Google Scholar] [CrossRef]
- Yu, K. Energy cooperation in the Belt and Road Initiative: EU experience of the Trans-European Networks for Energy. Asia Eur. J. 2018, 16, 251–265. [Google Scholar] [CrossRef]
- Yin, R.R.; Zhao, B.X.; Zhang, M.J.; Wang, C.W. Analyzing the Structure of the Maritime Silk Road Central City Network through the Spatial Distribution of Financial Firms. Emerg. Mark. Financ. Trade 2020, 56, 2656–2678. [Google Scholar] [CrossRef]
- Zhang, L.; Du, H.R.; Zhao, Y.N.; Wu, R.W.; Zhang, X.L. Urban networks among Chinese cities along the Belt and Road: A case of web search activity in cyberspace. PLoS ONE 2017, 12, e0188868. [Google Scholar] [CrossRef] [Green Version]
- Li, F.; Su, Y.; Xie, J.P.; Zhu, W.J.; Wang, Y.H. The Impact of High-Speed Rail Opening on City Economics along the Silk Road Economic Belt. Sustainability 2020, 12, 3176. [Google Scholar] [CrossRef] [Green Version]
- Liu, Z.G.; Dunford, M.; Liu, W.D. Coupling national geo-political economic strategies and the Belt and Road Initiative: The China-Belarus Great Stone Industrial Park. Political Geogr. 2021, 84, 102296. [Google Scholar] [CrossRef]
- Zhao, S.D.; Wang, X.P.; Hu, X.F.; Li, D.X. Evaluation Research on Planning Implementation of Chinese Overseas Economic and Trade Cooperation Zones along the Belt and Road: Evidence from Longjiang Industrial Park, Vietnam. Sustainability 2020, 12, 8488. [Google Scholar] [CrossRef]
- Ye, C.; Li, S.M.; Zhuang, L.; Zhu, X.D. A comparison and case analysis between domestic and overseas industrial parks of China since the Belt and Road Initiative. J. Geogr. Sci. 2020, 30, 1266–1282. [Google Scholar] [CrossRef]
- Bird, J.; Lebrand, M.; Venables, A.J. The Belt and Road Initiative: Reshaping economic geography in Central Asia? J. Dev. Econ. 2020, 144, 102441. [Google Scholar] [CrossRef] [Green Version]
- Wang, L.P.; Zou, Z.H.; Liang, S.; Xu, M. Virtual scarce water flows and economic benefits of the Belt and Road Initiative. J. Clean. Prod. 2020, 253, 119936. [Google Scholar] [CrossRef]
- Dave, B.; Kobayashi, Y. China’s silk road economic belt initiative in Central Asia: Economic and security implications. Asia Eur. J. 2018, 16, 267–281. [Google Scholar] [CrossRef]
- Hao, W.; Shah, S.M.A.; Nawaz, A.; Asad, A.; Iqbal, S.; Zahoor, H.; Maqsoom, A. The Impact of Energy Cooperation and the Role of the One Belt and Road Initiative in Revolutionizing the Geopolitics of Energy among Regional Economic Powers: An Analysis of Infrastructure Development and Project Management. Complexity 2020, 2020, 8820021. [Google Scholar] [CrossRef]
- Shi, B.Y.; Cai, T. Has China’s Oil Investment in Belt and Road Initiative Countries Helped Its Oil Import? Energies 2020, 13, 3176. [Google Scholar] [CrossRef]
- Zhang, C.; Fu, J.S.; Pu, Z.N. A study of the petroleum trade network of countries along The Belt and Road Initiative. J. Clean. Prod. 2019, 222, 593–605. [Google Scholar] [CrossRef]
- Jin, G.; Shen, K.R.; Jiang, Y. Does the Belt and Road Initiative cause more troubled Chinese overseas investments? Int. Rev. Econ. Financ. 2021, 72, 217–232. [Google Scholar] [CrossRef]
- Hu, Z.H.; Liu, C.J.; Lee, P.T.W. China’s Global Investment and Maritime Flows in the Context of the Belt and Road Initiative. J. Contemp. China 2021, 30, 465–480. [Google Scholar] [CrossRef]
- Lin, P.; Lin, B.Q.; Lin, M.T.; Lin, C. Empirical Study of Factors Influencing Performance of Chinese Enterprises in Overseas Mergers and Acquisitions in Context of Belt and Road Initiative-A Perspective Based on Political Connections. Emerg. Mark. Financ. Trade 2020, 56, 1564–1580. [Google Scholar] [CrossRef]
- Chen, D.X.; Yang, Z.Z. Systematic optimization of port clusters along the Maritime Silk Road in the context of industry transfer and production capacity constraints. Transp. Res. Part E Logist. Transp. Rev. 2018, 109, 174–189. [Google Scholar] [CrossRef]
- Tang, B.W.; Sun, Y.Z.; Zhou, N.; Shen, B. Sustainable Development of Power Retailers and Industrial Parks in China’s Belt and Road Initiative. Sustainability 2019, 11, 5427. [Google Scholar] [CrossRef] [Green Version]
- Cui, L.; Gao, M.H.; Sarkis, J.; Lei, Z.M.; Kusi-Sarpong, S. Modeling cross-border supply chain collaboration: The case of the Belt and Road Initiative. Int. Trans. Oper. Res. 2020. [Google Scholar] [CrossRef]
- Ram, J.; Zhang, Z.Y. Belt and road initiative (BRI) supply chain risks: Propositions and model development. Int. J. Logist. Manag. 2020, 31, 777–799. [Google Scholar] [CrossRef]
- Peng, F.; Kang, L.L.; Liu, T.X.; Cheng, J.; Ren, L.X. Trade Agreements and Global Value Chains: New Evidence from China’s Belt and Road Initiative. Sustainability 2020, 12, 1353. [Google Scholar] [CrossRef] [Green Version]
- Wu, Z.H.; Hou, G.S.; Xin, B.G. Has the Belt and Road Initiative Brought New Opportunities to Countries Along the Routes to Participate in Global Value Chains? Sage Open 2020, 10, 2158244020902088. [Google Scholar] [CrossRef] [Green Version]
- Yu, C.J.; Zhang, R.; An, L.; Yu, Z.X. Has China’s Belt and Road Initiative Intensified Bilateral Trade Links between China and the Involved Countries? Sustainability 2020, 12, 6747. [Google Scholar] [CrossRef]
- Yu, L.H.; Zhao, D.; Niu, H.X.; Lu, F.T. Does the belt and road initiative expand China’s export potential to countries along the belt and road? China Econ. Rev. 2020, 60, 101419. [Google Scholar] [CrossRef]
- Kohl, T. The Belt and Road Initiative’s effect on supply-chain trade: Evidence from structural gravity equations. Camb. J. Reg. Econ. Soc. 2019, 12, 77–104. [Google Scholar] [CrossRef] [Green Version]
- Chong, Z.H.; Qin, C.L.; Pan, S. The Evolution of the Belt and Road Trade Network and Its Determinant Factors. Emerg. Mark. Financ. Trade 2019, 55, 3166–3177. [Google Scholar] [CrossRef]
- Herrero, A.G.; Xu, J.W. China’s Belt and Road Initiative: Can Europe Expect Trade Gains? China World Econ. 2017, 25, 84–99. [Google Scholar] [CrossRef] [Green Version]
- Leskina, N.; Sabzalieva, E. Constructing a Eurasian higher education region: “Points of correspondence” between Russia’s Eurasian Economic Union and China’s Belt and Road Initiative in Central Asia. Eurasian Geogr. Econ. 2021, 1–29. [Google Scholar] [CrossRef]
- Gao, S. Sports Trans-Cultural Communication between China and Russia under the Belt and Road Initiative. Int. J. Hist. Sport 2021, 37, 1–17. [Google Scholar] [CrossRef]
- Jakimow, M. Desecuritisation as a soft power strategy: The Belt and Road Initiative, European fragmentation and China’s normative influence in Central-Eastern Europe. Asia Eur. J. 2019, 17, 369–385. [Google Scholar] [CrossRef] [Green Version]
- Ouyang, D.; Zhu, X.; Liu, X.; He, R.; Wan, Q. Spatial Differentiation and Driving Factor Analysis of Urban Construction Land Change in County-Level City of Guangxi, China. Land 2021, 10, 691. [Google Scholar] [CrossRef]
- Jing, C.; Tao, H.; Jiang, T.; Wang, Y.J.; Zhai, J.Q.; Cao, L.G.; Su, B.D. Population, urbanization and economic scenarios over the Belt and Road region under the Shared Socioeconomic Pathways. J. Geogr. Sci. 2020, 30, 68–84. [Google Scholar] [CrossRef] [Green Version]
- Liu, H.M.; Fang, C.L.; Miao, Y.; Ma, H.T.; Zhang, Q.; Zhou, Q. Spatio-temporal evolution of population and urbanization in the countries along the Belt and Road 1950–2050. J. Geogr. Sci. 2018, 28, 919–936. [Google Scholar] [CrossRef] [Green Version]
- Ariken, M.; Zhang, F.; Chan, N.W.; Kung, H.T. Coupling coordination analysis and spatio-temporal heterogeneity between urbanization and eco-environment along the Silk Road Economic Belt in China. Ecol. Indic. 2021, 121, 107014. [Google Scholar] [CrossRef]
- Fan, D.; Ni, L.; Jiang, X.G.; Fang, S.F.; Wu, H.; Zhang, X.P. Spatiotemporal Analysis of Vegetation Changes Along the Belt and Road Initiative Region From 1982 to 2015. IEEE Access 2020, 8, 122579–122588. [Google Scholar] [CrossRef]
- Tan, C.; Guo, B.; Kuang, H.H.; Yang, H.; Ma, M.G. Lake Area Changes and Their Influence on Factors in Arid and Semi-Arid Regions along the Silk Road. Remote Sens. 2018, 10, 595. [Google Scholar] [CrossRef] [Green Version]
- Guan, Q.Y.; Liu, Z.Y.; Yang, L.G.; Luo, H.P.; Yang, Y.Y.; Zhao, R.; Wang, F.F. Variation in PM2.5 source over megacities on the ancient Silk Road, northwestern China. J. Clean. Prod. 2019, 208, 897–903. [Google Scholar] [CrossRef]
- Zuo, Q.T.; Song, Y.X.; Wang, H.J.; Li, J.L.; Han, C.H. Spatial variations of extreme precipitation events and attribution analysis in the main water resource area of the Belt and Road Initiative. Theor. Appl. Climatol. 2021, 144, 535–554. [Google Scholar] [CrossRef]
- Chai, D.L.; Wang, M.; Liu, K. Driving factors of natural disasters in belt and road countries. Int. J. Disaster Risk Reduct. 2020, 51, 101774. [Google Scholar] [CrossRef]
- Zuo, Q.T.; Li, X.; Hao, L.G.; Hao, M.H. Spatiotemporal Evolution of Land-Use and Ecosystem Services Valuation in the Belt and Road Initiative. Sustainability 2020, 12, 6583. [Google Scholar] [CrossRef]
- Xu, J.Y.; Chen, J.X.; Liu, Y.X.; Fan, F.F. Identification of the geographical factors influencing the relationships between ecosystem services in the Belt and Road region from 2010 to 2030. J. Clean. Prod. 2020, 275, 124153. [Google Scholar] [CrossRef]
- Liu, W.D.; Song, Z.Y.; Liu, Z.G.; Yeerken, W.; Song, T.; Niu, F.Q.; Han, M.Y. Progress in research on the Belt and Road Initiative. Acta Geogr. Sin. 2018, 73, 620–636. [Google Scholar] [CrossRef]
- Pan, T.; Kuang, W.H.; Hamdi, R.; Zhang, C.; Zhang, S.; Li, Z.L.; Chen, X. City-Level Comparison of Urban Land-Cover Configurations from 2000-2015 across 65 Countries within the Global Belt and Road. Remote Sens. 2019, 11, 1515. [Google Scholar] [CrossRef] [Green Version]
- Hou, W.; Hou, X.Y. Data Fusion and Accuracy Analysis of Multi-Source Land Use/Land Cover Datasets along Coastal Areas of the Maritime Silk Road. ISPRS Int. J. Geo-Inf. 2019, 8, 557. [Google Scholar] [CrossRef] [Green Version]
- Liu, Y.X.; Zhao, W.W.; Hua, T.; Wang, S.; Fu, B.J. Slower vegetation greening faced faster social development on the landscape of the Belt and Road region. Sci. Total Environ. 2019, 697, 134103. [Google Scholar] [CrossRef]
- Bastian, O.; Roder, M. Assessment of landscape change by land evaluation of past and present situation. Landsc. Urban Plan. 1998, 41, 171–182. [Google Scholar] [CrossRef]
- Tian, X.; Hu, Y.Y.; Yin, H.T.; Geng, Y.; Bleischwitz, R. Trade impacts of China’s Belt and Road Initiative: From resource and environmental perspectives. Resour. Conserv. Recycl. 2019, 150, 104430. [Google Scholar] [CrossRef]
- Hughes, A.C. Understanding and minimizing environmental impacts of the Belt and Road Initiative. Conserv. Biol. 2019, 33, 883–894. [Google Scholar] [CrossRef] [Green Version]
- Chen, D.; Yu, Q.Y.; Hu, Q.; Xiang, M.T.; Zhou, Q.B.; Wu, W.B. Cultivated land change in the Belt and Road Initiative region. J. Geogr. Sci. 2018, 28, 1580–1594. [Google Scholar] [CrossRef] [Green Version]
- Li, X.L.; Sohail, S.; Majeed, M.T.; Ahmad, W. Green logistics, economic growth, and environmental quality: Evidence from one belt and road initiative economies. Environ. Sci. Pollut. Res. 2021, 28, 30664–30674. [Google Scholar] [CrossRef] [PubMed]
- Jian, J.H.; Fan, X.J.; Zhao, S.Y. The Green Incentives and Green Bonds Financing under the Belt and Road Initiative. Emerg. Mark. Financ. Trade 2021, 57, 1–11. [Google Scholar] [CrossRef]
- Hafeez, M.; Yuan, C.H.; Shahzad, K.; Aziz, B.; Iqbal, K.; Raza, S. An empirical evaluation of financial development-carbon footprint nexus in One Belt and Road region. Environ. Sci. Pollut. Res. 2019, 26, 25026–25036. [Google Scholar] [CrossRef] [PubMed]
- Gu, A.; Zhou, X.Y. Emission reduction effects of the green energy investment projects of China in belt and road initiative countries. Ecosyst. Health Sustain. 2020, 6, 1747947. [Google Scholar] [CrossRef] [Green Version]
- Huang, M.X.; Li, S.Y. The analysis of the impact of the Belt and Road initiative on the green development of participating countries. Sci. Total Environ. 2020, 722, 137869. [Google Scholar] [CrossRef]
- Cheng, C.Y.; Ge, C.Z. Green development assessment for countries along the belt and road. J. Environ. Manag. 2020, 263, 110344. [Google Scholar] [CrossRef]
- Kongkuah, M.; Yao, H.X.; Fongjong, B.B.; Agyemang, A.O. The role of CO2 emissions and economic growth in energy consumption: Empirical evidence from Belt and Road and OECD countries. Environ. Sci. Pollut. Res. 2021, 28, 22488–22509. [Google Scholar] [CrossRef]
- Wu, Y.; Chen, C.L.; Hu, C. The impacts of trade intensity with China on carbon emissions in belt and road countries. J. Asia Pac. Econ. 2021, 21, 1–21. [Google Scholar] [CrossRef]
- Hu, J.F.; Shi, H.M.; Huang, Q.H.; Luo, Y.L.; Li, Y.M. The Impacts of Freight Trade on Carbon Emission Efficiency: Evidence from the Countries along the Belt and Road. Complexity 2020, 2020, 2529718. [Google Scholar] [CrossRef]
- Lu, Q.L.; Fang, K.; Heijungs, R.; Feng, K.S.; Li, J.S.; Wen, Q.; Li, Y.M.; Huang, X.J. Imbalance and drivers of carbon emissions embodied in trade along the Belt and Road Initiative. Appl. Energy 2020, 280, 115934. [Google Scholar] [CrossRef]
- Wang, J.D.; Dong, X.C.; Dong, K.Y. How renewable energy reduces CO2 emissions? Decoupling and decomposition analysis for 25 countries along the Belt and Road. Appl. Econ. 2021, 53, 1–17. [Google Scholar] [CrossRef]
- Chen, Z.L.; Yan, T.; Zhao, W.G.; Ni, G.H. Capacity utilization loss of the Belt and Road countries incorporating carbon emission reduction and the impacts of China’s OFDI. J. Clean. Prod. 2020, 280, 123926. [Google Scholar] [CrossRef]
- Mahadevan, R.; Sun, Y.Y. Effects of foreign direct investment on carbon emissions: Evidence from China and its Belt and Road countries. J. Environ. Manag. 2020, 276, 111321. [Google Scholar] [CrossRef] [PubMed]
- Zhou, Y.; Wang, T.; Peng, R.C.; Hu, H.M. Spatial-Temporal Characteristics and Factors of Agricultural Carbon Emissions in the Belt and Road Region of China. Pol. J. Environ. Stud. 2021, 30, 2445–2457. [Google Scholar] [CrossRef]
- Zhang, H.; Guo, S.D.; Qian, Y.B.; Liu, Y.; Lu, C.P. Dynamic analysis of agricultural carbon emissions efficiency in Chinese provinces along the Belt and Road. PLoS ONE 2020, 15, e0228223. [Google Scholar] [CrossRef] [Green Version]
- Li, Y.; Lin, K.Y.; Huang, Q.B. Research on the Measurement and Driving Factors of Manufacturing Export Embodied Carbon between China and the Countries along the Belt and Road. Pol. J. Environ. Stud. 2021, 30, 727–737. [Google Scholar] [CrossRef]
- Tao, Y.H.; Liang, H.M.; Celia, M.A. Electric power development associated with the Belt and Road Initiative and its carbon emissions implications. Appl. Energy 2020, 267, 114784. [Google Scholar] [CrossRef]
- Zhang, X.P.; Zhang, H.N.; Zhao, C.H.; Yuan, J.H. Carbon emission intensity of electricity generation in Belt and Road Initiative countries: A benchmarking analysis. Environ. Sci. Pollut. Res. 2019, 26, 15057–15068. [Google Scholar] [CrossRef]
- Akbar, U.; Popp, J.; Khan, H.; Khan, M.A.; Olah, J. Energy Efficiency in Transportation along with the Belt and Road Countries. Energies 2020, 13, 2607. [Google Scholar] [CrossRef]
- Zhu, C.Z.; Gao, D.W. A Research on the Factors Influencing Carbon Emission of Transportation Industry in the Belt and Road Initiative Countries Based on Panel Data. Energies 2019, 12, 2405. [Google Scholar] [CrossRef] [Green Version]
- Chen, Y.; Liu, S.; Wu, H.; Zhang, X.; Zhou, Q. How can Belt and Road countries contribute to glocal low-carbon development? J. Clean. Prod. 2020, 256, 120717. [Google Scholar] [CrossRef]
- Han, M.Y.; Lao, J.M.; Yao, Q.H.; Zhang, B.; Meng, J. Carbon inequality and economic development across the Belt and Road regions. J. Environ. Manag. 2020, 262, 110250. [Google Scholar] [CrossRef]
- Zhang, Y.J.; Jin, Y.L.; Shen, B. Measuring the Energy Saving and CO2 Emissions Reduction Potential Under China’s Belt and Road Initiative. Comput. Econ. 2020, 55, 1095–1116. [Google Scholar] [CrossRef]
- Aung, T.S.; Fischer, T.B. Quality of environmental impact assessment systems and economic growth in countries participating in the belt and road initiatives. Impact Assess. Proj. Apprais. 2020, 38, 502–520. [Google Scholar] [CrossRef]
- Coenen, J.; Bager, S.; Meyfroidt, P.; Newig, J.; Challies, E. Environmental Governance of China’s Belt and Road Initiative. Environ. Policy Gov. 2020, 31, 3–17. [Google Scholar] [CrossRef]
- Fang, K.; Wang, S.Q.; He, J.J.; Song, J.N.; Fang, C.L.; Jia, X.P. Mapping the environmental footprints of nations partnering the Belt and Road Initiative. Resour. Conserv. Recycl. 2021, 164, 105068. [Google Scholar] [CrossRef]
- Ni, Z.X.; Lu, X.; Xue, W.J. Does the belt and road initiative resolve the steel overcapacity in China? Evidence from a dynamic model averaging approach. Empir. Econ. 2021, 61, 279–307. [Google Scholar] [CrossRef]
- Visvizi, A.; Lytras, M.D.; Jin, P.Q. Belt and Road Initiative (BRI): New Forms of International and Cross-Industry Collaboration for Sustainable Growth and Development. Sustainability 2020, 12, 193. [Google Scholar] [CrossRef] [Green Version]
- Zhao, Z.; Wang, J.H.; Zhao, J. A spatial analysis of urban economic connections among the node cities along the "One Belt and One Road” in China. J. Arid Land Resour. Environ. 2018, 32, 12–18. [Google Scholar] [CrossRef]
- Wang, P.; Zhang, Q. Marine Shipping Performance Evaluation of 34 Coastal Ports in China under the One Belt and One Road Initiative. J. Coast. Res. 2020, 109, 132–138. [Google Scholar] [CrossRef]
- Guo, H.W.; Zhou, Y.H.; Cui, W. An Empirical Study on the Financial Development Differences of Chinese Port Cities along the New Maritime Silk Road. J. Coast. Res. 2020, 107, 341–346. [Google Scholar] [CrossRef]
- Xie, Y.C.; Fan, S.Y. Multi-city sustainable regional urban growth simulation-MSRUGS: A case study along the mid-section of Silk Road of China. Stoch. Environ. Res. Risk Assess. 2014, 28, 829–841. [Google Scholar] [CrossRef]
- Wang, J.F.; Li, X.H.; Christakos, G.; Liao, Y.L.; Zhang, T.; Gu, X.; Zheng, X.Y. Geographical detectors-based health risk assessment and its application in the neural tube defects study of the Heshun region, China. Int. J. Geogr. Inf. Sci. 2010, 24, 107–127. [Google Scholar] [CrossRef]
- Wang, J.F.; Xu, C.D. Geodetector: Principle and prospective. Acta Geogr. Sin. 2017, 72, 116–134. [Google Scholar]
- Liu, C.L.; Li, W.L.; Zhu, G.F.; Zhou, H.K.; Yan, H.P.; Xue, P.F. Land use/land cover changes and their driving factors in the Northeastern Tibetan Plateau based on Geographical Detectors and Google Earth Engine: A case study in Gannan Prefecture. Remote Sens. 2020, 12, 3139. [Google Scholar] [CrossRef]
- Huang, H.; Zhou, Y.; Qian, M.J.; Zeng, Z.Q. Land use transition and driving forces in Chinese Loess Plateau: A case study from Pu County, Shanxi Province. Land 2021, 10, 67. [Google Scholar] [CrossRef]
- Zhang, H.W.; Wang, Z.Q.; Yang, B.; Chai, J.; Wei, C. Spatial–temporal characteristics of illegal land use and its driving factors in China from 2004 to 2017. Int. J. Environ. Res. Public Health 2021, 18, 1336. [Google Scholar] [CrossRef] [PubMed]
- Zhu, M.Q.; Zhuang, D.C.; Zhang, H.X.; Wen, J.Q. Research on spatial differentiation and influencing factors of rural land use functions in the counties of Guangdong province. China Land Sci. 2021, 57, 79–87. [Google Scholar]
- Chen, L.; Mu, F.Y. Spatiotemporal characteristics and driving forces of terrorist attacks in Belt and Road regions. PLoS ONE 2021, 16, e0248063. [Google Scholar] [CrossRef]
- Wang, J.F.; Hu, Y. Environmental health risk detection with GeogDetector. Environ. Model. Softw. 2012, 33, 114–115. [Google Scholar] [CrossRef]
- Wu, W.; Huang, C.P.; Zhano, X.J.; Hu, X.Y.; Wang, N. Spatial expansion characteristics and mechanism of urban land use in different modes: A case study of Ganzhou. Urban Dev. Stud. 2018, 25, 1–6. [Google Scholar]
- Zhao, X.F.; Liu, M.L.; Wang, B.Y. Spatio-Temporal disparity of urban construction land and its impact factors in China based on Geodetector. China Land Sci. 2018, 32, 29–35. [Google Scholar]
- Liu, Y.W.; Cao, X.S.; Li, T. Identifying driving forces of built-up land expansion based on the geographical detector: A case study of Pearl River Delta urban agglomeration. Int. Environ. Res. Public Health 2020, 17, 1759. [Google Scholar] [CrossRef] [Green Version]
- Zhao, S.; Zhang, C.; Qi, J. The Key Factors Driving the Development of New Towns by Mother Cities and Regions: Evidence from China. ISPRS Int. J. Geo-Inf. 2021, 10, 223. [Google Scholar] [CrossRef]
- Guan, X.Y.; Wang, S.L.; Gao, Z.Y.; Lv, Y.; Fu, X.J. Spatio-temporal variability of soil salinity and its relationship with the depth to groundwater in salinization irrigation district. Acta Ecol. Sin. 2012, 32, 198–206. [Google Scholar]
- Lee, P.T.W.; Zhang, Q.; Suthiwartnarueput, K.; Zhang, D.; Yang, Z.Z. Research trends in Belt and Road Initiative studies on logistics, supply chains, and transportation sector. Int. J. Logist. Res. Appl. 2020, 23, 525–543. [Google Scholar] [CrossRef]
- Tian, J.J.; Liu, Y.J.; Yin, Z.D. Relationship between Foreign Direct Investment and China’s Industrial Upgrading in the Background of the Belt and Road Initiative: An Empirical Study of the Marine Silk Route Enterprises. J. Coast. Res. 2020, 104, 695–699. [Google Scholar] [CrossRef]
- Lall, S.V.; Lebrand, M. Who wins, who loses? Understanding the spatially differentiated effects of the belt and road initiative. J. Dev. Econ. 2020, 146, 102496. [Google Scholar] [CrossRef]
- Park, J.I.; Leigh, N.G. Urban Industrial Land Loss and Foreign Direct Investment-Related Manufacturing Job Sprawl: An Atlanta, Georgia MSA Case Study. J. Urban Technol. 2017, 24, 95–113. [Google Scholar] [CrossRef]
- Huang, Q.S.; Zhu, X.G.; Liu, C.H.; Wu, W.; Liu, F.B.; Zhang, X.Y. Spatial-temporal Evolution and Determinants of the Belt and Road Initiative: A Maximum Entropy Gravity Model Approach. Chin. Geogr. Sci. 2020, 30, 839–854. [Google Scholar] [CrossRef]
- Tong, S.Y.; Yi, Z. The Belt and Road Initiative and China’s Trade Development. China Int. J. 2019, 17, 50–61. [Google Scholar]
- Yang, G.J.; Huang, X.H.; Huang, J.H.; Chen, H.Y. Assessment of the effects of infrastructure investment under the belt and road initiative. China Econ. Rev. 2020, 60, 101418. [Google Scholar] [CrossRef]
- Chen, Y.W.; Fan, Z.J.; Zhang, J.; Mo, M. Does the Connectivity of the Belt and Road Initiative Contribute to the Economic Growth of the Belt and Road Countries? Emerg. Mark. Financ. Trade 2019, 55, 3227–3240. [Google Scholar] [CrossRef]
- Li, Y.; Shou, Y.Y.; Ding, R.G.; Sun, T.; Zho, Q. Has China’s Belt and Road Initiative promoted its green total factor productivity?—Evidence from primary provinces along the route. Transp. Res. Part E Logist. Transp. Rev. 2019, 126, 212–226. [Google Scholar] [CrossRef]
- Li, Y.; Chen, X.G.; Tang, B.S.; Wong, S.W. From project to policy: Adaptive reuse and urban industrial land restructuring in Guangzhou City, China. Cities 2018, 82, 68–76. [Google Scholar] [CrossRef]
- Xiong, C.; Lu, J.Y.; Niu, F.Q. Urban Industrial Land Expansion and Its Influencing Factors in Shunde: 1995–2017. Complexity 2020, 2020, 6769176. [Google Scholar] [CrossRef]
- Zhang, J.F.; Zhang, D.X.; Huang, L.Y.; Wen, H.Z.; Zhao, G.C.; Zhan, D.S. Spatial distribution and influential factors of industrial land productivity in China’s rapid urbanization. J. Clean. Prod. 2019, 234, 1287–1295. [Google Scholar] [CrossRef]
- Cinar, E.M.; Johnson, J.; Geusz, K. Estimating Chinese Trade Relationships with the Silk Road Countries. China World Econ. 2016, 24, 85–103. [Google Scholar] [CrossRef]
- Kuang, W.H.; Liu, J.Y.; Dong, J.W.; Chi, W.F.; Zhang, C. The rapid and massive urban and industrial land expansions in China between 1990 and 2010: A CLUD-based analysis of their trajectories, patterns, and drivers. Landsc. Urban Plan. 2016, 145, 21–33. [Google Scholar] [CrossRef]
- Zhang, M.Z.; He, S.J. From Dissensus to Consensus: State Rescaling and Modalities of Power under the Belt and Road Initiative in Western China. Ann. Am. Assoc. Geogr. 2021, 111, 1519–1538. [Google Scholar] [CrossRef]
- Lai, H.Y. The Rationale and Effects of China’s Belt and Road Initiative: Reducing Vulnerabilities in Domestic Political Economy. J. Contemp. China 2021, 30, 330–347. [Google Scholar] [CrossRef]
- Sun, Z.C.; Yu, S.S.; Guo, H.D.; Wang, C.Z.; Zhang, Z.X.; Xu, R. Assessing 40 years of spatial dynamics and patterns in megacities along the Belt and Road region using satellite imagery. Int. J. Digit. Earth 2021, 14, 71–87. [Google Scholar] [CrossRef] [Green Version]
- Kumpula, T.; Pajunen, A.; Kaarlejarvi, E.; Forbes, B.C.; Stammler, F. Land use and land cover change in Arctic Russia: Ecological and social implications of industrial development. Glob. Environ. Chang. Hum. Policy Dimens. 2011, 21, 550–562. [Google Scholar] [CrossRef]
- Hu, P.P.; Li, F.; Sun, X.; Liu, Y.L.; Chen, X.C.; Hu, D. Assessment of Land-Use/Cover Changes and Its Ecological Effect in Rapidly Urbanized Areas-Taking Pearl River Delta Urban Agglomeration as a Case. Sustainability 2021, 13, 5075. [Google Scholar] [CrossRef]
- Saad, R.; Margni, M.; Koellner, T.; Wittstock, B.; Deschenes, L. Assessment of land use impacts on soil ecological functions: Development of spatially differentiated characterization factors within a Canadian context. Int. J. Life Cycle Assess. 2011, 16, 198–211. [Google Scholar] [CrossRef]
- Sun, X.H.; Chenggang, Y.; Khan, A.; Hussain, J.; Bano, S. The role of tourism, and natural resources in the energy-pollution-growth nexus: An analysis of belt and road initiative countries. J. Environ. Plan. Manag. 2021, 64, 999–1020. [Google Scholar] [CrossRef]
- Wang, Z.S.; Zhao, J.; Lin, S.J.; Liu, Y. Identification of Industrial Land Parcels and Its Implications for Environmental Risk Management in the Beijing-Tianjin-Hebei Urban Agglomeration. Sustainability 2020, 12, 174. [Google Scholar] [CrossRef] [Green Version]
- Meng, Y.J.; Wang, K.; Lin, Y.Y. The Role of Land Use Transition on Industrial Pollution Reduction in the Context of Innovation-Driven: The Case of 30 Provinces in China. Land 2021, 10, 353. [Google Scholar] [CrossRef]
- Tularam, H.; Ramsay, L.F.; Muttoo, S.; Brunekreef, B.; Meliefste, K.; de Hoogh, K.; Naidoo, R.N. A hybrid air pollution/land use regression model for predicting air pollution concentrations in Durban, South Africa. Environ. Pollut. 2021, 274, 116513. [Google Scholar] [CrossRef]
- Vandermeer, M.C.; Halleux, J.M. Evaluation of the spatial and economic effectiveness of industrial land policies in northwest Europe. Eur. Plan. Stud. 2017, 25, 1454–1475. [Google Scholar] [CrossRef] [Green Version]
- Chapple, K. The Highest and Best Use? Urban Industrial Land and Job Creation. Econ. Dev. Q. 2014, 28, 300–313. [Google Scholar] [CrossRef] [Green Version]
- Wang, Q.; Wang, Y.A.; Chen, W.; Zhou, X.; Zhao, M.J. Factors affecting industrial land use efficiency in China: Analysis from government and land market. Environ. Dev. Sustain. 2020, 23, 10973–10993. [Google Scholar] [CrossRef]
- Brigham, A.M. Land reform: A foundation for industrial growth in developing countries? Sociol. Res. Online 2000, 5, U20–U35. [Google Scholar] [CrossRef]
Figure 1.
Study area.

Figure 2.
Research framework and steps.

Figure 3.
Cluster analysis of industrial land in Silk Road cities (2014 and 2018).

Figure 4.
Cluster analysis of industrial land change in Silk Road cities (2014–2018).

Figure 5.
Analysis of interaction detector in 2014.

Figure 6.
Analysis of interaction detector in 2018.

Figure 7.
Analysis of interaction detector for change-1.

Figure 8.
Analysis of interaction detector for change-2.

Figure 9.
Classification of driving factors for Inventory.

Figure 10.
Classification of driving factors for Increment.

Figure 11.
Comparative analysis of driving factors for Inventory and Increment.

Figure 12.
Classification of driving factors for Increment.

Figure 13.
The influence mechanism of industrial land change in Silk Road cities.

Table 1.
Descriptive analysis of the study area.
| Index | 2014 | 2018 | Change | |
|---|---|---|---|---|
| Value of industrial land area (Km2) | Study Area | 3413.33 | 4112.91 | 699.58 |
| Silk Road Cities | 5464.39 | 6310.11 | 845.72 | |
| China | 8635.91 | 9654.64 | 1018.73 | |
| Proportion of industrial land area (%) | Study Area/China | 39.52 | 42.60 | 68.67 |
| Study Area/Silk Road Cities | 62.46 | 65.18 | 82.72 | |
| Silk Road Cities/China | 63.28 | 65.36 | 83.02 | |
| Proportion of industrial land in urban construction land (%) | Study Area | 21.10 | 21.80 | 26.05 |
| Silk Road Cities | 20.54 | 21.13 | 25.98 | |
| China | 20.63 | 20.45 | 19.00 | |
Table 2.
Interaction between Explanatory Variables ( and ).
| Graphical Representation | Description | Interaction |
|---|---|---|
 | q (∩) < Min (q (), q ()) | Weaken, nonlinear |
 | Min (q (), q ()) < q (∩) < Max (q ()), q ()) | Weaken, uni- |
 | q (∩) > Max (q (), q ()) | Enhance, bi- |
 | q (∩) = q () + q () | Independent |
 | q (∩) > q () + q () | Enhance, nonlinear |
Legend: ![Land 10 00806 i006]() Min (q (), q ();
Min (q (), q (); ![Land 10 00806 i007]() Max (q (), q ());
Max (q (), q ()); ![Land 10 00806 i008]() q () + q ();
q () + q (); ![Land 10 00806 i009]() q (∩
).
q (∩
).
 Min (q (), q ();
  Max (q (), q ());
  q () + q ();
  q (∩
).
q (∩
).Table 3.
Model variable description.
| Variable | Index | Code | Type |
|---|---|---|---|
| Dependent variable | Industry land area in 2014 | Inventory | |
| Industry land area in 2018 | Inventory | ||
| Industry land area change from 2014 to 2018 | Increment | ||
| Independent variable | Floating population | Population driving force | |
| Resident population | |||
| Road network density | Industry driving force | ||
| Road area ratio | |||
| Water supply pipeline density | |||
| Drainage pipeline density | |||
| Land area for public facilities | |||
| Average wage of employees | Cost driving force | ||
| Fixed asset investment in urban municipal public facilities | Investment driving force | ||
| Loans from financial institutions | |||
| City public budget expenditure | |||
| City science and technology expenditure | Innovation driving force | ||
| Foreign direct investment | Open driving force | ||
| Import | |||
| Export | |||
| Land area for logistics and warehousing | Coordination driving force | ||
| Added value of tertiary industry | |||
| Industrial wastewater discharge | Green driving force | ||
| Industrial sulfur dioxide emission | |||
| Industrial NOx emission | |||
| Electricity consumption for industry | |||
| Natural gas consumption | |||
| Green coverage area | |||
| Carbon dioxide emission |
Table 4.
Analysis of spatial heterogeneity of industrial land and its change.
| Index | 2014 | 2018 | Change |
|---|---|---|---|
| Max | 349.68 | 398.44 | 75.57 |
| Min | 0.16 | 0.16 | −42.69 |
| Max–Min | 349.52 | 398.28 | 118.26 |
| Max/Min | 2185.5 | 2490.25 | -- |
| Average | 26.47 | 30.63 | 4.16 |
| Standard Deviation | 47.54 | 51.44 | 13.54 |
| Coefficient of Variation (CV) | 1.80 | 1.68 | 3.25 |
Table 5.
Analysis of factor detector.
| Index | ||||||||
|---|---|---|---|---|---|---|---|---|
| q Statistic | p Value | q Statistic | p Value | q Statistic | p Value | q Statistic | p Value | |
| 0.72 | 0.000 | 0.69 | 0.000 | 0.47 | 0.000 | 0.10 | 0.096 | |
| 0.47 | 0.000 | 0.46 | 0.000 | 0.08 | 0.150 | 0.09 | 0.059 | |
| 0.12 | 0.061 | 0.34 | 0.024 | 0.08 | 0.030 | 0.16 | 0.051 | |
| 0.12 | 0.232 | 0.33 | 0.005 | 0.04 | 0.024 | 0.13 | 0.154 | |
| 0.03 | 0.155 | 0.11 | 0.258 | 0.04 | 0.225 | 0.13 | 0.075 | |
| 0.07 | 0.050 | 0.07 | 0.165 | 0.03 | 0.192 | 0.04 | 0.106 | |
| 0.57 | 0.000 | 0.58 | 0.000 | 0.09 | 0.002 | 0.26 | 0.026 | |
| 0.10 | 0.006 | 0.16 | 0.013 | 0.03 | 0.571 | 0.07 | 0.201 | |
| 0.35 | 0.008 | 0.30 | 0.000 | 0.04 | 0.171 | 0.17 | 0.201 | |
| 0.51 | 0.000 | 0.59 | 0.000 | 0.13 | 0.002 | 0.19 | 0.046 | |
| 0.62 | 0.000 | 0.57 | 0.000 | 0.23 | 0.000 | 0.27 | 0.000 | |
| 0.60 | 0.000 | 0.50 | 0.000 | 0.16 | 0.013 | 0.35 | 0.003 | |
| 0.66 | 0.000 | 0.48 | 0.000 | 0.00 | 0.999 | 0.17 | 0.010 | |
| 0.07 | 0.240 | 0.75 | 0.000 | 0.04 | 0.044 | 0.08 | 0.098 | |
| 0.03 | 0.405 | 0.68 | 0.000 | 0.12 | 0.013 | 0.08 | 0.179 | |
| 0.68 | 0.000 | 0.62 | 0.000 | 0.04 | 0.047 | 0.11 | 0.010 | |
| 0.57 | 0.000 | 0.44 | 0.000 | 0.03 | 0.067 | 0.17 | 0.006 | |
| 0.36 | 0.000 | 0.48 | 0.000 | 0.01 | 0.253 | 0.05 | 0.092 | |
| 0.06 | 0.053 | 0.10 | 0.026 | 0.02 | 0.133 | 0.13 | 0.040 | |
| 0.08 | 0.010 | 0.14 | 0.007 | 0.11 | 0.059 | 0.19 | 0.027 | |
| 0.67 | 0.000 | 0.40 | 0.000 | 0.04 | 0.115 | 0.21 | 0.000 | |
| 0.45 | 0.000 | 0.46 | 0.000 | 0.00 | 0.633 | 0.07 | 0.102 | |
| 0.62 | 0.000 | 0.62 | 0.000 | 0.05 | 0.066 | 0.35 | 0.000 | |
| 0.36 | 0.000 | 0.31 | 0.002 | 0.06 | 0.449 | 0.17 | 0.088 | |
Table 6.
Analysis of driving force.
| Driving Force | 0.05 Significance Level | 0.1 Significance Level | ||||||
|---|---|---|---|---|---|---|---|---|
| 2014 | 2018 | Change-1 | Change-2 | 2014 | 2018 | Change-1 | Change-2 | |
| Population | 0.59 | 0.57 | 0.47 | -- | 0.59 | 0.57 | 0.47 | 0.09 |
| Industry | 0.32 | 0.42 | 0.07 | 0.21 | 0.25 | 0.42 | 0.07 | 0.18 |
| Cost | 0.10 | 0.16 | -- | -- | 0.10 | 0.16 | -- | -- |
| Investment | 0.50 | 0.48 | 0.18 | 0.23 | 0.50 | 0.48 | 0.18 | 0.23 |
| Innovation | 0.60 | 0.50 | 0.16 | 0.35 | 0.60 | 0.50 | 0.16 | 0.35 |
| Open | 0.66 | 0.64 | 0.08 | 0.17 | 0.66 | 0.64 | 0.08 | 0.12 |
| Coordination | 0.62 | 0.53 | 0.04 | 0.14 | 0.62 | 0.53 | 0.03 | 0.14 |
| Green | 0.37 | 0.36 | -- | 0.22 | 0.37 | 0.36 | 0.08 | 0.17 |
| Average | 0.47 | 0.46 | 0.17 | 0.22 | 0.46 | 0.46 | 0.15 | 0.18 |
Publisher’s Note: MDPI stays neutral with regard to jurisdictional claims in published maps and institutional affiliations. |
© 2021 by the authors. Licensee MDPI, Basel, Switzerland. This article is an open access article distributed under the terms and conditions of the Creative Commons Attribution (CC BY) license (https://creativecommons.org/licenses/by/4.0/).
Share and Cite
MDPI and ACS Style
Zhao, S.; Yan, Y.; Han, J. Industrial Land Change in Chinese Silk Road Cities and Its Influence on Environments. Land 2021, 10, 806. https://doi.org/10.3390/land10080806
AMA Style
Zhao S, Yan Y, Han J. Industrial Land Change in Chinese Silk Road Cities and Its Influence on Environments. Land. 2021; 10(8):806. https://doi.org/10.3390/land10080806
Chicago/Turabian StyleZhao, Sidong, Yiran Yan, and Jing Han. 2021. "Industrial Land Change in Chinese Silk Road Cities and Its Influence on Environments" Land 10, no. 8: 806. https://doi.org/10.3390/land10080806
Note that from the first issue of 2016, this journal uses article numbers instead of page numbers. See further details here.