Refuge Lake Reclassification in 620 Minnesota Cisco Lakes under Future Climate Scenarios


1
Department of General Engineering, Montana Tech, Butte, MT 59701-8923, USA
2
Department of Civil Engineering, Auburn University, Auburn, AL 36849-5337, USA
3
College of Hydrology and Water Resources, Hohai University, No. 1 Xikang Road, Nanjing 210098, China
*
Author to whom correspondence should be addressed.
Water 2017, 9(9), 675; https://doi.org/10.3390/w9090675
Submission received: 2 August 2017
/
Revised: 1 September 2017
/
Accepted: 4 September 2017
/
Published: 7 September 2017
(This article belongs to the Special Issue Water Quality Monitoring and Modeling in Lakes)
Abstract
:Cisco (Coregonus artedi) is the most common coldwater stenothermal fish in Minnesota lakes. Water temperature (T) and dissolved oxygen (DO) in lakes are important controls of fish growth and reproduction and likely change with future climate warming. Built upon a previous study, this study uses a modified method to identify which of 620 cisco lakes in Minnesota can still support cisco populations under future climate and therefore be classified as cisco refuge lakes. The previous study used oxythermal stress parameter TDO3, the temperature at DO of 3 mg/L, simulated only from deep virtual lakes to classify 620 cisco lakes. Using four categories of virtual but representative cisco lakes in modified method, a one-dimensional water quality model MINLAKE2012 was used to simulate daily T and DO profiles in 82 virtual lakes under the past (1961–2008) and two future climate scenarios. A multiyear average of 31-day largest TDO3 over variable benchmark (VB) periods, AvgATDO3VB, was calculated from simulated T and DO profiles using FishHabitat2013. Contour plots of AvgATDO3VB for four categories of virtual lakes were then developed to reclassify 620 cisco lakes into Tier 1 (AvgATDO3VB < 11 °C) or Tier 2 refuge lakes, and Tier 3 non-refuge lakes (AvgATDO3VB > 17 °C). About 20% of 620 cisco lakes are projected to be refuge lakes under future climate scenarios, which is a more accurate projection (improving the prediction accuracy by ~6.5% from the previous study) since AvgATDO3VB was found to vary by lake categories.
1. Introduction
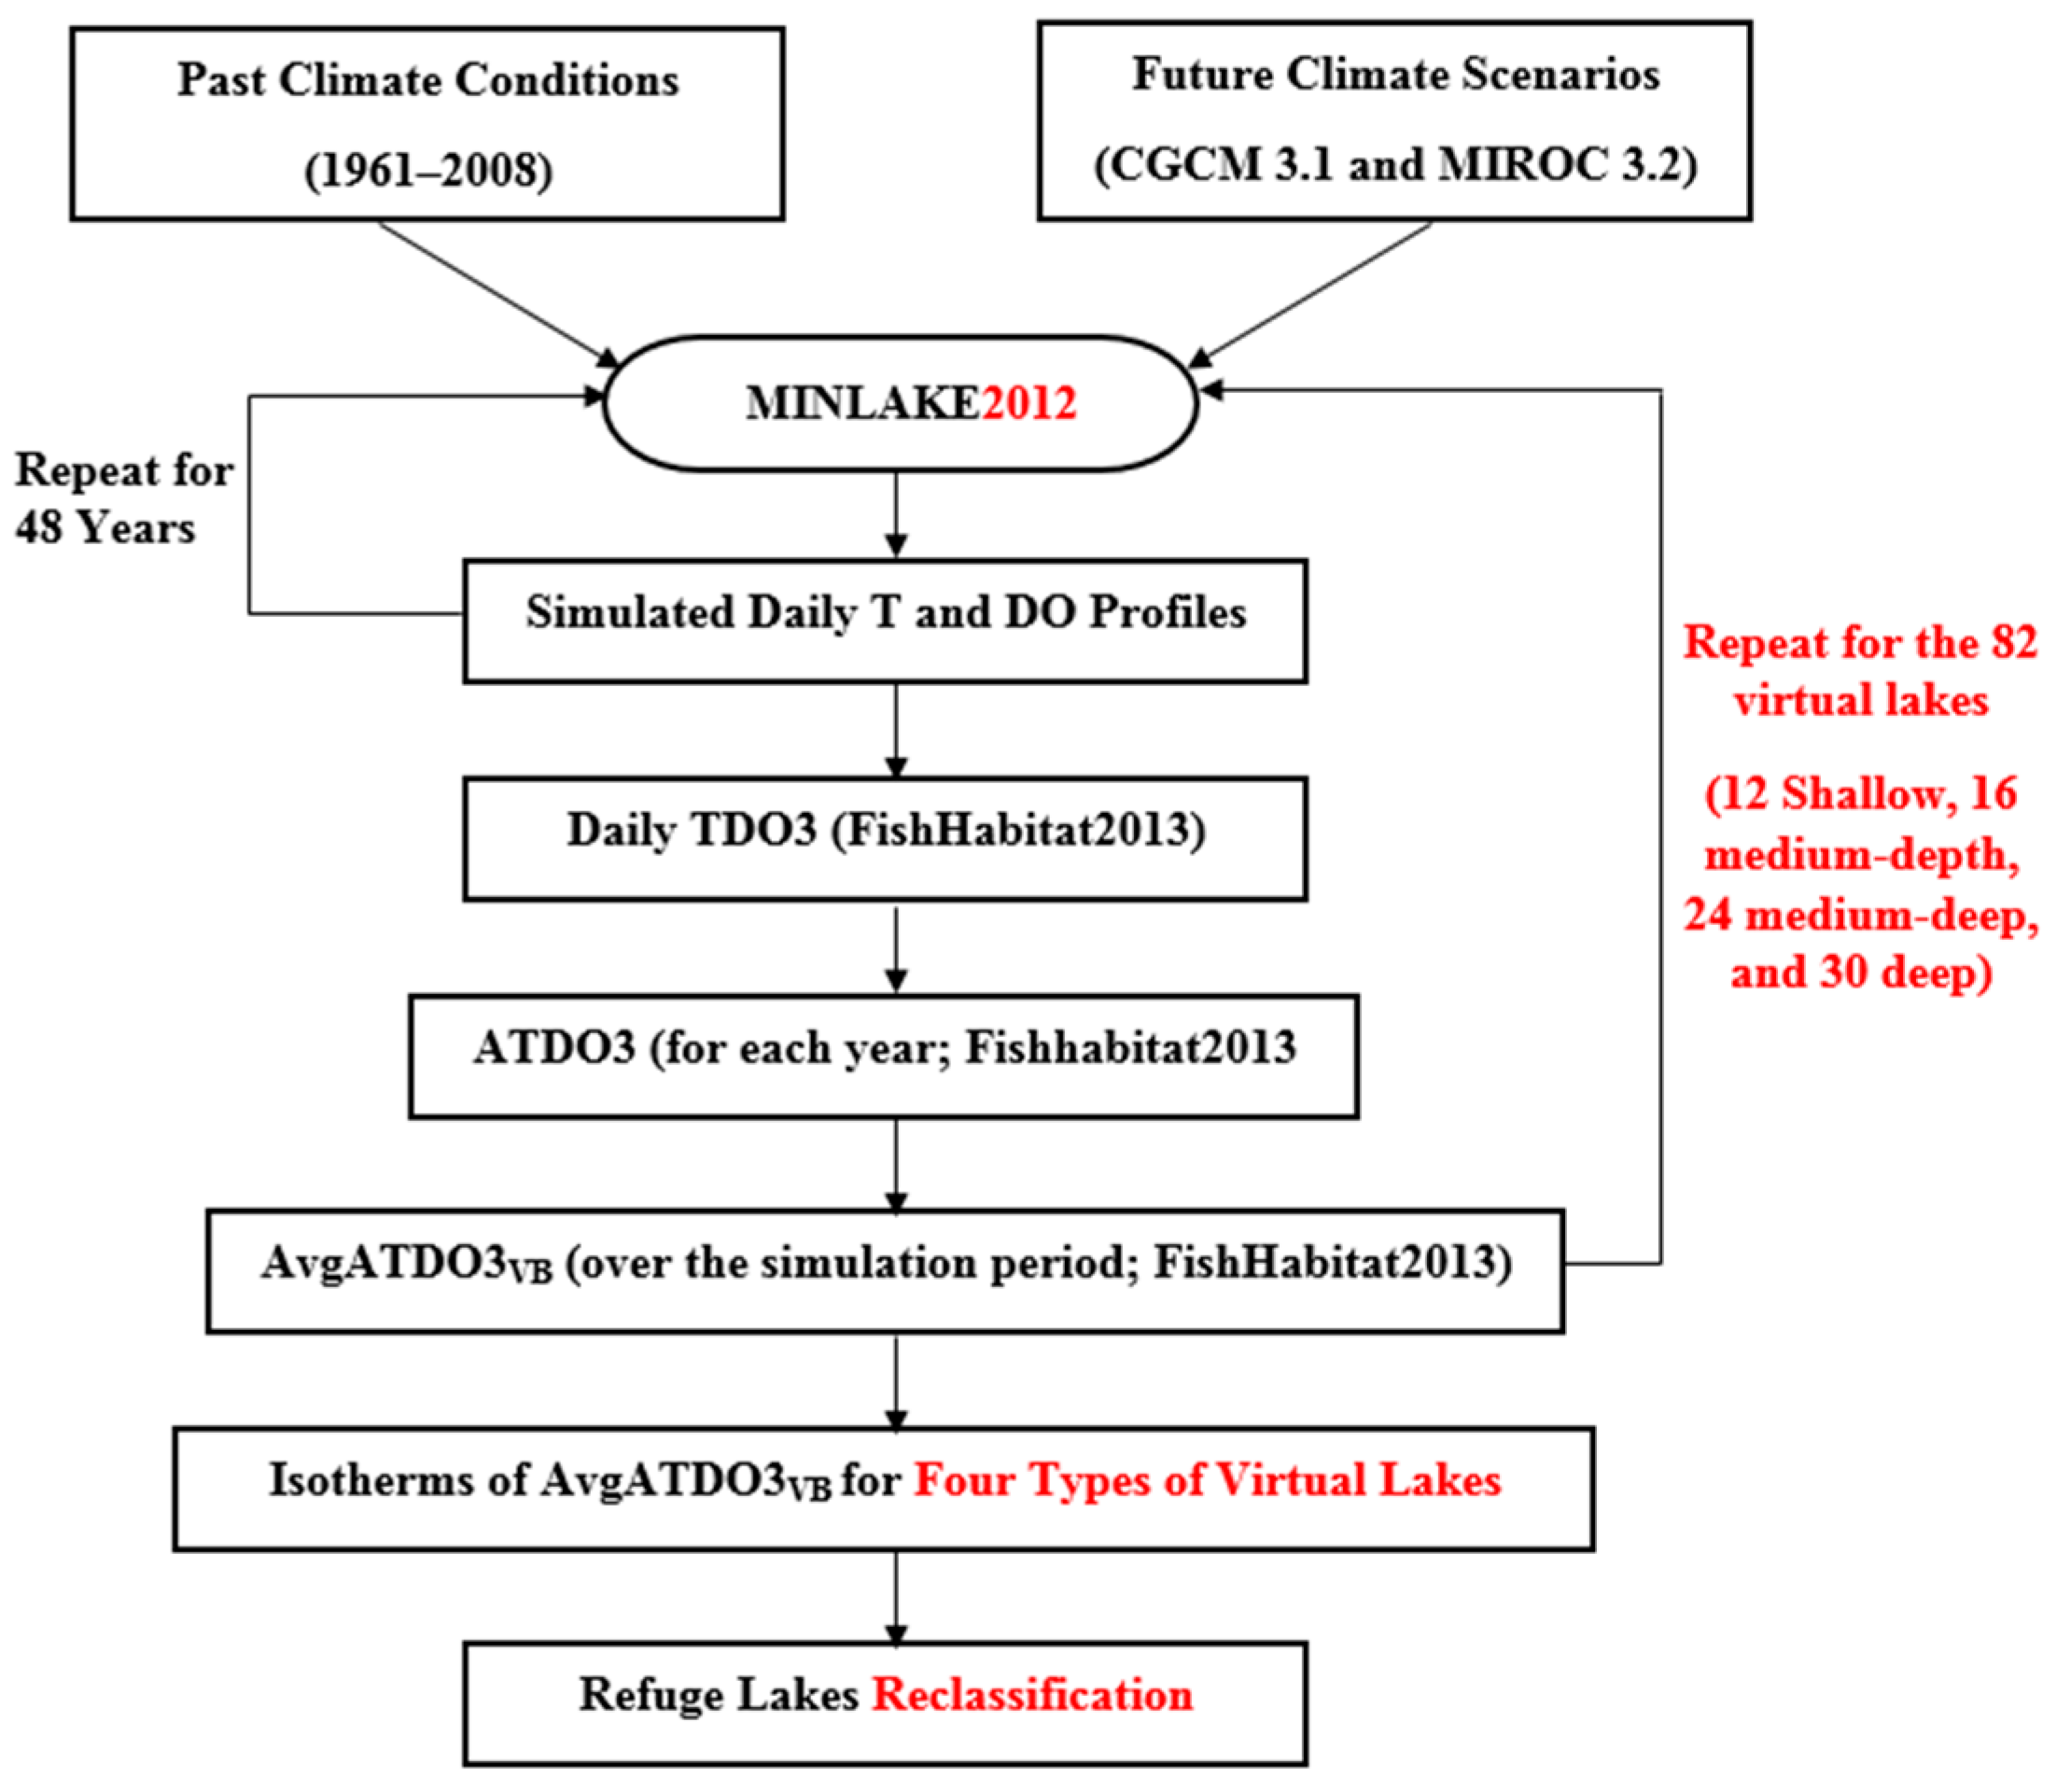
Water temperature (T, Table 1) and available dissolved oxygen (DO) in lakes are two important water quality parameters that control fish growth and reproduction [1,2]. Both T and DO are projected to change with future climate warming [3,4,5,6,7], thus affect fish habitat in lakes and reservoirs. Protecting fish habitat in lakes is important to local economy and tourism, and also benefits people living in lake areas. Studying fish habitat in lakes using observed or simulated T and DO daily profiles is necessary. Observed T and DO profiles are available from some lakes in weekly, bi-weekly, monthly or random time intervals and have been used for calibration and validation of lake water quality models [8,9], but typically no daily profiles are available for us to identify fish habitat in lakes. Therefore, T and DO daily profiles were simulated in different lakes to calculate various fish habitat parameters [10,11,12,13]. Many temperature models [14] and some water quality models [9,11,15,16,17] have been developed and applied to simulate T and DO profiles in lakes. MINLAKE96 [18], and later version MINLAKE2010 [19], a one-dimensional year-round water quality model originally designed to perform water quality simulation in Minnesota lakes, was applied in the previous studies [11,13]. Building on a previous study by Jiang et al. [10] where T and DO were simulated for deep virtual lakes only using MINLAKE2010, T and DO were simulated for four categories of virtual lakes (Table 1) using MINLAKE2012 [20] in this study. A conceptual flowchart of steps used for this study is presented in Figure 1. The steps used in both the previous study and this study are given in normal black color text and those modified steps used only in this study are given in the red color text in Figure 1.
Cisco (Coregonus artedi) is a stenothermal coldwater fish species that distributes widely in lakes at the central and northern Minnesota (Figure 2) and requires cold and oxygenated water to survive [1,21]. Cisco also exists in Wisconsin and Michigan and is typically very sensitive to climate change [22]. For instance, in an unusually warm summer of 2006, Minnesota DNR (Department of Natural Resources) reported cisco kill in 18 Minnesota lakes [1]. Therefore, water resource managers and fish biologists in Minnesota DNR wanted to project whether current 620 cisco lakes in Minnesota (Figure 2) can still provide fish habitat under future climate warming scenarios. Lakes that currently serve as cisco habitat and will still do so under future climate warming scenarios are called the refuge lakes [10,12]. The purpose of identifying cisco refuge lakes is to help Minnesota DNR invest available funds to purchase land (conservation strategy) from watersheds surrounding top tiered refuge lakes after considering the threat (potential changes in land use) and the investment efficiency (total surface area of refuge lakes protected per amount invested) to protect lake water quality [23,24].
Fang et al. [12] and Jiang et al. [10] used a single oxythermal habitat variable TDO3 (water temperature at 3 mg/L of DO, Figure 3) to identify the refuge lakes from 620 cisco lakes in Minnesota. When TDO3 is low, a lake has suitable oxygen available at low water temperatures, likely at the deep depths within the hypolimnion; this represents good oxythermal habitat. When TDO3 is high, a lake only has suitable oxygen available at high water temperatures, likely at the shallower depths often within the metalimnion or epilimnion when hypolimnion is hypoxic; this represents poor oxythermal habitat [23]. TDO3 was originally proposed and used by Jacobson et al. [25] to study oxythermal habitat of burbot (Lota lota), cisco, lake trout (Salvelinus namaycush), and lake whitefish (Coregonus clupeaformis), and which was connected and correlated with total phosphorus, summer air temperature, and relative depth of lakes. Multiyear average TDO3 simulated in 30 deep virtual lakes (maximum depth Hmax = 24 m) were used to identify and classify 620 Minnesota cisco lakes into three tiers of refuge lakes [10,12]. The lake geometry ratio (GR = As0.25/Hmax, where As is lake surface area in m2, and Hmax in m) and Secchi depth (SD in m), related to lake stratification and trophic status, were basic lake parameters used to describe and represent individual cisco lakes and the virtual lakes [10,12].
Daily T and DO profiles were simulated for the virtual lakes using MINLAKE2010, for both past (1961–2008) and two future (CGCM 3.1 and MIROC 3.2, Table 1 and Figure 2) climate scenarios [26,27,28]. To identify refuge lakes [10], a fish habitat model, FishHabitat2013 (data analysis program), was previously developed by the authors to calculate TDO3 using simulated daily T and DO profiles from MINLAKE2010 as inputs (Figure 3). In general, the higher the TDO3 is, the greater oxythermal stress cisco feel [22]. For each simulated year, the fixed [12] or variable [10] benchmark periods with the greatest oxythermal stress for coldwater fish [10,12] were used to determine the 31-day average TDO3 (ATDO3). The average of ATDO3 for the whole simulation period (1961–2008) for the past climate conditions was called AvgATDO3, i.e., multiyear average ATDO3 (Table 1).
From the analysis of measured T and DO profiles, Jacobson et al. [25] concluded that the highest probability of cisco occurrence was at a late-summer TDO3 of 9.0 °C, and the central species response borders ranged from 4.0 to 16.9 °C. To identify which lake is an acceptable cisco refuge lake, limits of TDO3 had to be specified. The criteria to select cisco refuge lakes used by Fang et al. [12] and Jiang et al. [10] were: (1) the Tier 1 refuge lake has AvgATDO3VB < 11 °C (the subscript VB stands for variable benchmark period); (2) the Tier 2 refuge lake has 11 °C ≤ AvgATDO3VB ≤ 17 °C ≥ 11 °C and ≤ 17 °C; and (3) the non-refuge lake has AvgATDO3VB > 17 °C.
The VB period contains the maximum daily TDO3 and has the maximum 31-day average TDO3 or ATDO3 in each simulation year [10]. Using simulated AvgATDO3 (Table 1) in 30 deep virtual lakes, a contour plot of AvgATDO3 were developed using GR and SD as x and y axes for each virtual lake and included the contour lines of 11 °C and 17 °C of AvgATDO3 (light blue and red contour lines in Figure 4 and from [10]). Using GR and SD as coordinates, 620 cisco lakes were superimposed on the contour plot, and then the above selection criteria were used to classify 620 cisco lakes into three tiered refuge lakes [10,12]. Figure 4b shows 132 deep lakes (blue dots) near Duluth, Minnesota; and those few lakes left of the 11 °C contour line of AvgATDO3 (light blue contour line) were classified as Tier 1 refuge lakes. Those lakes between 11 °C and 17 °C contour lines of AvgATDO3 were classified as Tier 2 refuge lakes. Other lakes right of the 17 °C contour line of AvgATDO3 (red contour line) were classified as Tier 3 or non-refuge lakes. Jiang et al. [10] identified 160 or 164 of 620 cisco lakes as the Tier 1 or Tier 2 refuge lakes under two future climate scenarios. The cisco refuge lake classification by Jiang et al. [10] was done by grouping 620 cisco lakes into three climate regions in Minnesota (Figure 2) based on cisco lake distribution by latitude and available weather data: International Falls weather for 166 northern cisco lakes (Table 1), Duluth for 399 mid-latitude cisco lakes, and St. Cloud for 55 southern cisco lakes [10]. The latitude boundaries used for previous and current studies are 46.10° N and 47.65° N [10] (Figure 2).
Previous cisco refuge lake classification studies by Jiang et al. [10] and Fang et al. [12] used the 30 deep virtual lakes to simulate T and DO profiles and then developed AvgATDO3 contour lines to classify the 620 cisco lakes in Minnesota. The Hmax of the 620 cisco lakes ranges from 3.0 to 64.9 m [29], whereas Hmax of the 30 deep virtual lakes is 24 m; therefore, only using the contour lines of AvgATDO3 simulated from deep lakes to classify the refuge lakes may not be accurate for shallower lakes. Jiang et al. [11] used constant survival limits of T and DO (i.e., lethal temperature and DO limit for cisco) to study the “total number of years with cisco kills” (Figure 4) and the “average cisco kill days for the years with kills” of three different types of virtual lakes (shallow Hmax = 4 m, medium-depth Hmax = 13 m, and deep Hmax = 24 m) and found that above two simulated variables have a big jump from shallow and medium-depth virtual lakes to deep virtual lakes. This further indicates that, to better represent 620 cisco lakes, more types of virtual lakes need to be used for developing contour lines of AvgATDO3 and then classifying refuge lakes. The hypothesis of the study is that using more types of virtual lakes of different Hmax can more accurately classify 620 cisco lakes in Minnesota into refuge lakes.
The goal of the study is to reclassify the 620 cisco lakes in Minnesota (Figure 2) into three tiers of refuge lakes by using four types of virtual lakes with different Hmax. Twelve shallow (Hmax = 4 m), 16 medium-depth (Hmax = 13 m), 28 medium-deep (Hmax = 18 m), and 30 deep (Hmax = 24 m) virtual lakes; 82 in total were therefore used to better represent 620 cisco lakes since it is not efficient or feasible to simulate all 620 lakes.
2. Methodology
2.1. Methodology Overview
This study followed a similar method used by Jiang et al. [10] to identify cisco refuge lakes from 620 Minnesota lakes, but the method was revised and improved. Figure 1 shows the flowchart of the steps used for the study, and revised steps of the method are marked in red and listed as follows: (1) using the updated MINLAKE2012 model [20] to perform water quality simulation; (2) using 82 virtual lakes to represent 620 cisco lakes; and (3) classifying refuge lakes by virtual lake types, which are discussed in detail in the Section 2.2.
Both past and future climate conditions are required input data for MINLAKE2012 to simulate T and DO profiles under different climate scenarios (Figure 1). Projected future daily climate warming conditions were generated by applying the mean monthly increments from the outputs of two Coupled General Circulation Models (CGCMs) of the earth’s atmosphere and oceans (CGCM 3.1 and MIROC 3.2) to measured daily climate conditions from 1961 to 2008. Three class I National Weather Service’s weather stations, International Falls, Duluth, and St. Cloud, were used for the model to represent climate conditions for the northern, mid-latitude, and southern cisco lakes in Minnesota (Figure 2) [10]. The output of the MIROC 3.2 model [26], which was developed by the Center for Climate System Research, University of Tokyo; the National Institute for Environmental Studies; and the Frontier Research Center for Global Change—Japan Agency for Marine-Earth Science and Technology, has a high spatial surface grid resolution of roughly 1.12 degrees latitude and longitude (approximately 120 km) in Minnesota. Each of the three weather stations has a close grid center point (Figure 2) to provide monthly increments of weather parameters for the future MIROC climate scenario. The output of the CGCM 3.1 [27,28], which is the third generation CGCM from the Canadian Climate Centre for Climate Modeling and Analysis, has a surface grid resolution of about 3.75 degrees latitude and longitude; therefore, it has only one grid center in Minnesota (Figure 2). Monthly air temperature increases projected by CGCM 3.1 has a range from 2.89 to 8.09 °C with annual averages of 4.07 to 4.14 °C for three weather stations. The monthly increments of climate parameters under these two future climate scenarios are the projected 30-year (2070–2099) averages when the projected atmospheric CO2 concentration in 2070–2099 would be double of what it was in the base period (1990).
MINLAKE2012 was updated from MINLAKE2010 [19] and MINLAKE96 model [18] to apply for deeper and more transparent cisco lakes in Minnesota. MINLAKE2012 allows the model to run in hourly and daily time steps but MINLAKE2010 can only run in daily time steps. Another update from MINLAKE2010 to MINLAKE2012 is the conversion to a user-friendly Excel spreadsheet for managing model input, running the model, and displaying basic results using Excel VBA coding. MINLAKE2012 solves the one-dimensional heat transfer (including heat exchange on the water surface and through bottom-sediments) and DO transport equations numerically for layer thicknesses from 0.02 m (near the water surface) to 1.0 m (for depths greater than 1.0 m) using an implicit finite difference scheme and a Gaussian elimination method. MINLAKE2012 uses bathymetry data (As, Hmax, and horizontal areas versus depths), lake trophic status (Secchi depth), corresponding model parameters [18], and daily weather data (depending on lake location) as model input. MINLAKE2012 was calibrated using 23 Minnesota lakes (18 with and 5 without cisco mortality in 2006) [11]. After calibration for T and DO in 23 lakes, the average root-mean-square errors (RMSE) are 1.57 °C and 1.72 mg/L, and the average Nash–Sutcliff model efficiency (NSE) are 0.86 and 0.66, respectively [11]. Simulated T and DO have good agreement with measured T and DO in 23 lakes [11]. In this study, MINLAKE2012 was run for 48 years in daily time steps for both open-water and ice-cover seasons under the past and two future climate scenarios for 82 virtual lakes. These virtual lakes (12 shallow, 16 medium-depth, 24 medium-deep, and 30 deep virtual lakes, Table 1), which will be discussed in detail in Section 2.2, were used to represent 620 cisco lakes (Table 3).
The oxythermal variable TDO3 was then determined in each simulation day from MINLAKE2012 simulated T and DO profiles for the cisco fish habitat study using FishHabitat2013 (Figure 1). Figure 3 shows an example how TDO3 was determined from the measured T and DO profiles in Andrusia Lake on 28 July 2006 and from simulated/projected T and DO profiles for MIROC 3.2 future climate scenario. The calculated TDO3 is 24.1 °C on 28 July 2006 and 27.6 °C for MIROC 3.2 future climate scenario, with an increase of 3.5 °C.
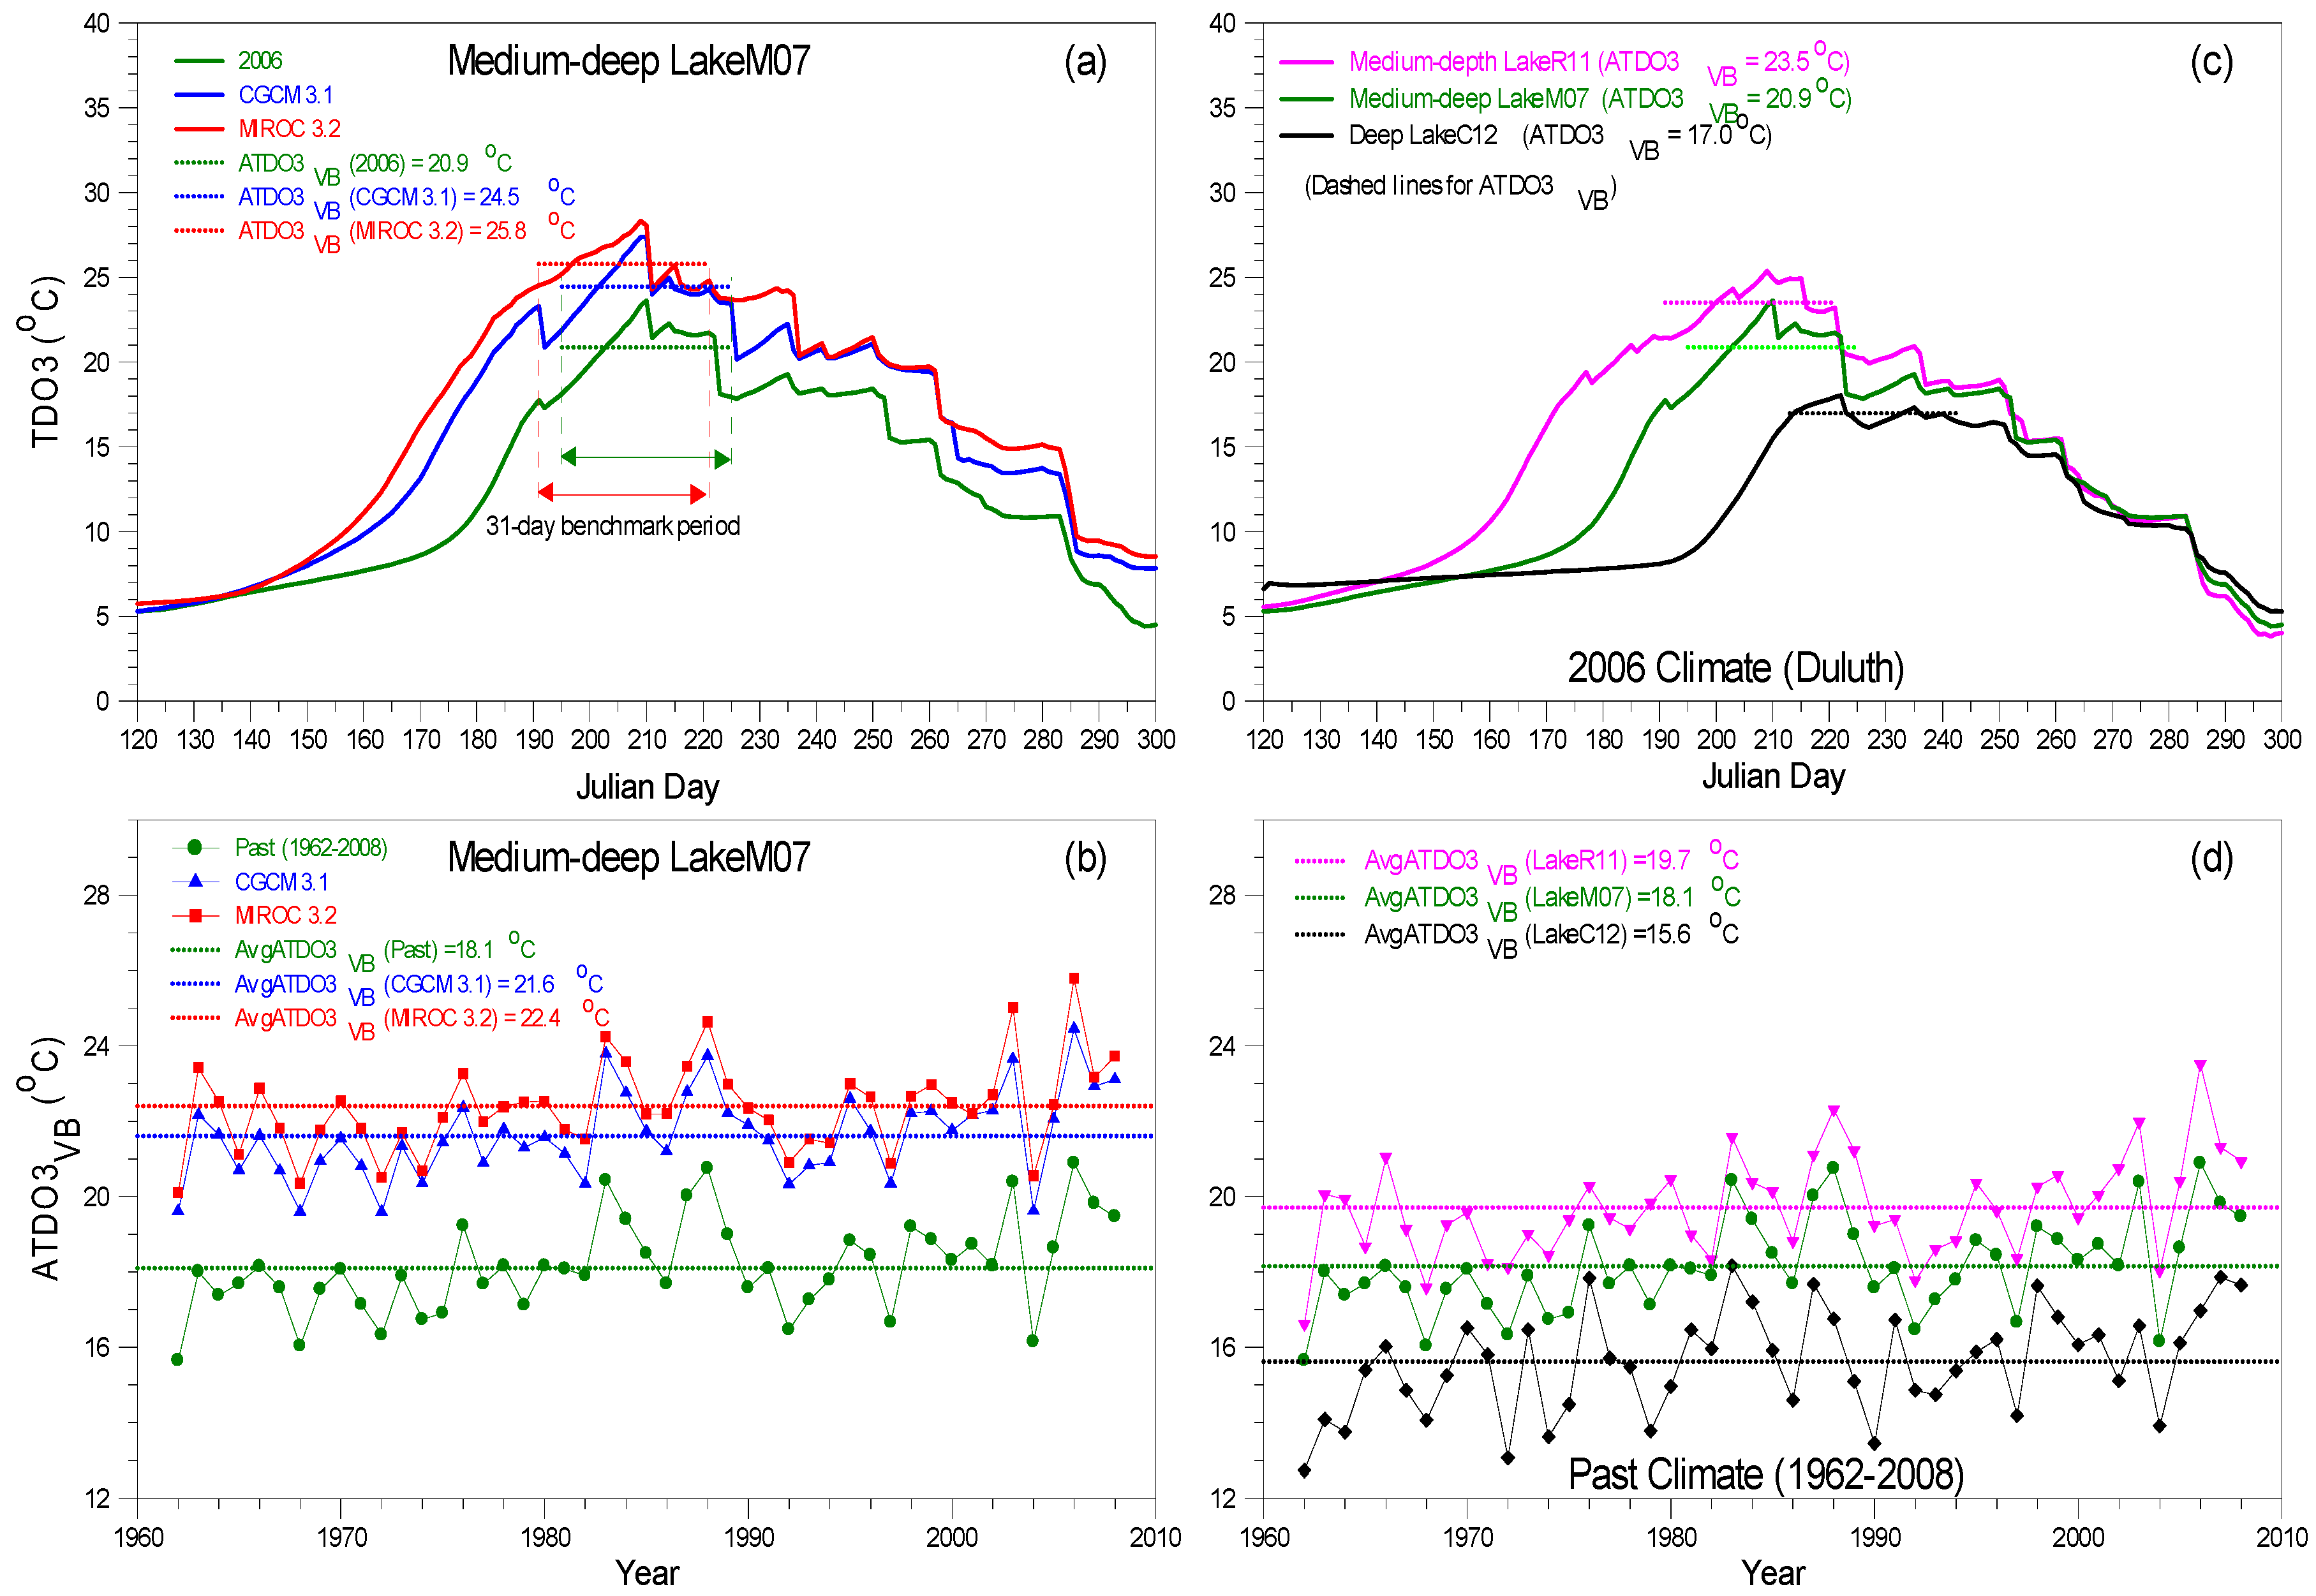
The fish habitat model (FishHabitat2013) was used in this study to calculate and analyze TDO3 and other oxythermal variables (i.e., ATDO3VB and AvgATDO3VB) derived from daily TDO3 (Figure 1, Table 1). FishHabitat2013 can use a 31-day sliding window to calculate ATDO3VB that is the maximum 31-day average TDO3, and the 31-day period must also contain the maximum TDO3 for each simulated year (Figure 5a) [10]. AvgATDO3VB is the average of annual ATDO3VB over 48 simulation years, e.g., from 1961 to 2008 for the past climate conditions (Figure 5b). AvgATDO3VB was then calculated for all 82 virtual lakes and used for cisco refuge lake reclassification (Figure 1). Figure 5a shows an example of the daily TDO3 time series of one medium-deep virtual lake (LakeM07, Table 2) under both the 2006 and two future climate scenarios at Duluth, Minnesota; and corresponding ATDO3VB determined from daily TDO3 are 20.9 °C (2006), 24.5 °C (CGCM 3.1), and 25.8 °C (MIROC 3.2), respectively. LakeM07 has Hmax = 18 m and GR = 1.48 (Table 2). Figure 5b shows an example of the annual ATDO3VB time serious of LakeM07 for the past and future climate scenarios over the 48-year simulation period, and corresponding calculated AvgATDO3VB determined from annual ATDO3VB are 18.1 °C (past), 21.6 °C (CGCM 3.1), and 22.4 °C (MIROC 3.2), respectively. The annual ATDO3VB in LakeM07 ranged from 15.7 to 20.9 °C in 1961–2008 (Figure 5b), but only the long-term average, i.e., AvgATDO3VB, is used to quantify overall oxythermal stress to cisco for classifying refuge lakes since the standard deviations from the averages of AvgATDO3VB are about 1.1–1.2 °C for LakeM07.
The selection criteria for Tier 1 and Tier 2 cisco refuge lakes and Tier 3 non-refuge lakes [10] (Table 1) are first applied to each virtual lake category (shallow, medium-depth, medium-deep, and deep) by analyzing calculated AvgATDO3VB. If all AvgATDO3VB values for all virtual lakes in a lake category are greater than 17 °C, then it is projected that all the cisco lakes in that lake category are reclassified as non-refuge lakes. If AvgATDO3VB for some virtual lakes in a lake category is less than 17 °C, isotherms or contours of AvgATDO3VB of the virtual lakes in a lake category are created using GR and SD as coordinates (Figure 4). Cisco lakes in corresponding lake type are superimposed on the same contour plot using their GR and SD as axes, the 11 °C and 17 °C contour lines of AvgATDO3VB are then used to regroup/reclassify cisco lakes into Tier 1 and Tier 2 refuge lakes and Tier 3 non-refuge lakes (Table 1). The method of reclassification by lake types grouped by the maximum depth was repeated for each climate region of Minnesota (northern, mid-latitude, and southern, Figure 2), which is associated with three weather stations (International Falls, Duluth, and St. Cloud).
2.2. Four Types of Virtual Lakes Representing 620 Cisco Lakes in Minnesota
A Minnesota DNR lake database contains 620 cisco lakes that were used for the analysis and the reclassification of refuge lakes in this study. Figure 2 shows the geographic distribution of the 620 cisco lakes grouped by latitude and the maximum depth for modeling purposes. These 620 lakes are scattered throughout much of the central and northern part of Minnesota. Hmax for 620 cisco lakes ranges from 3.0 to 64.9 m, AS ranges from 0.04 to 3847.8 km2, and the mean summer SD ranges from 0.7 to 9.5 m [10]. Oligotrophic lakes are poorly nourished, have less nutrients (nitrogen and phosphorus) for the growth of algae and lower biomass or chlorophyll-a concentration, and are more clear or transparent; therefore, Secchi depth is larger, e.g., SD > 4 m [30]. In contrast, eutrophic lakes are over nourished, have high nutrient concentrations and smaller Secchi depth (SD < 2 m [30]). On average, Minnesota’s cisco lakes are deeper, more transparent, and less trophic than other lakes in Minnesota [5].
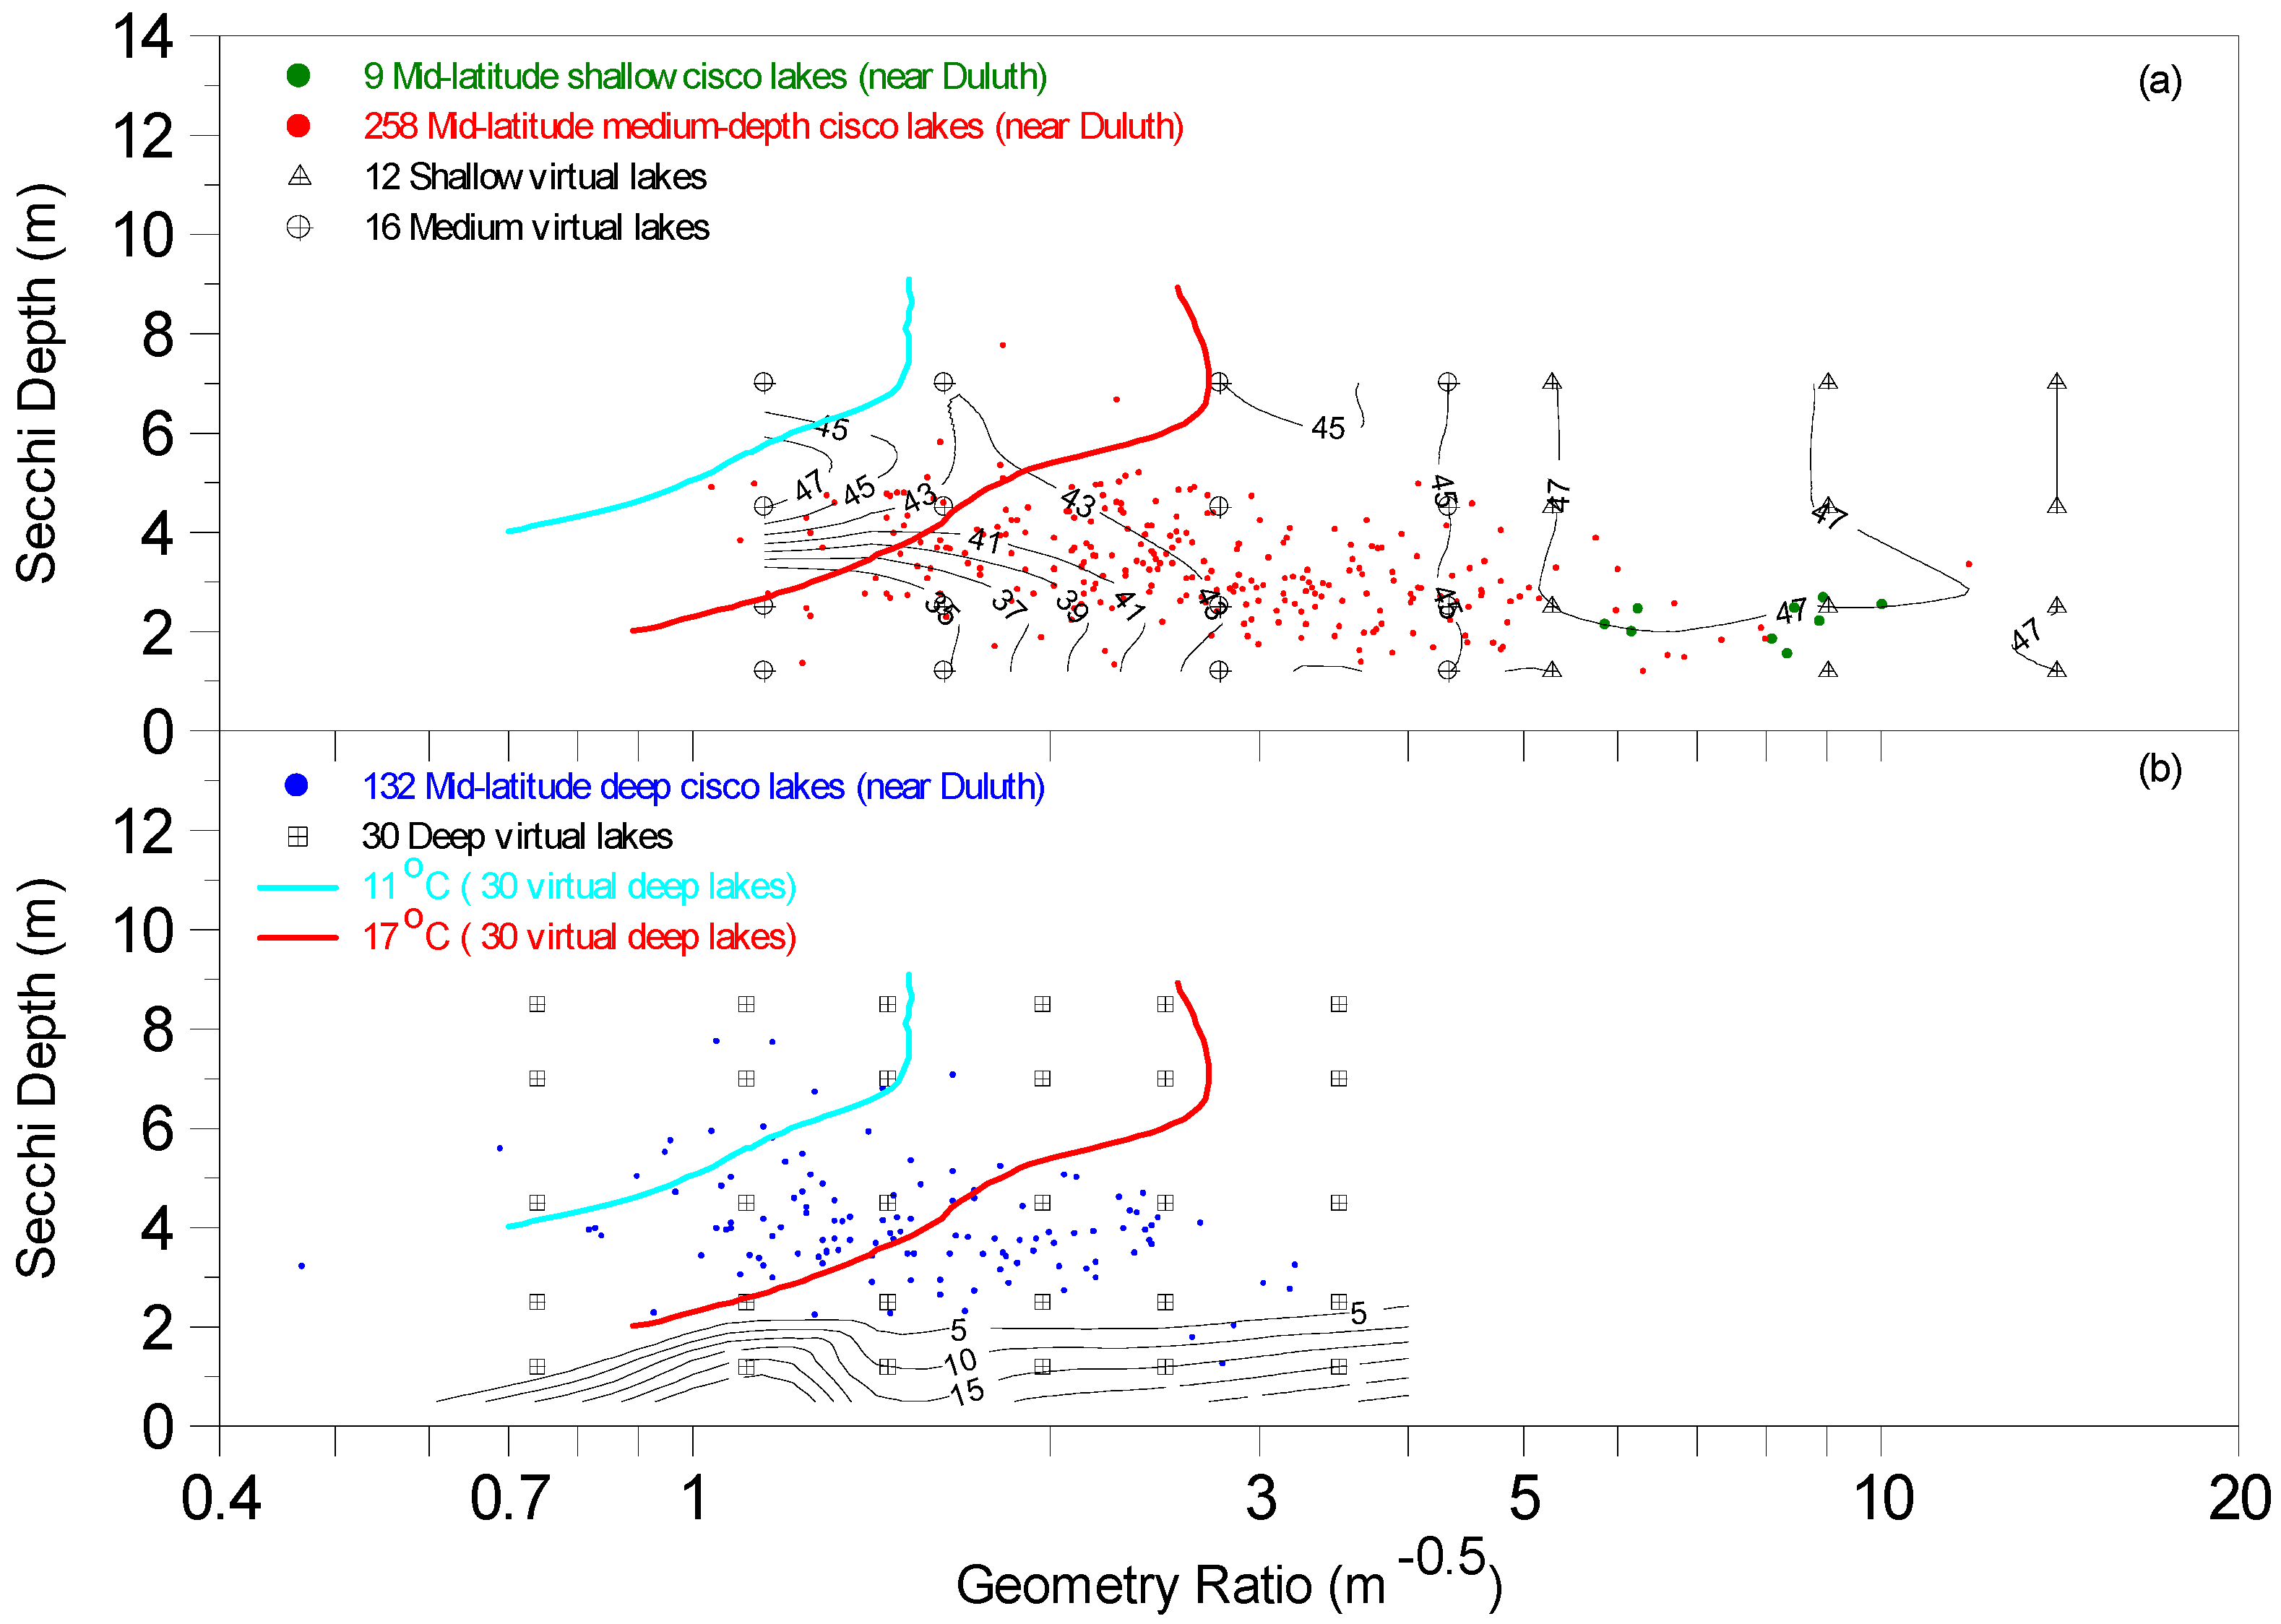
To study the climate warming impact on T and DO in Minnesota lakes [4] and lakes over the contiguous USA [5,6], lakes have been grouped into three categories by the maximum depth: shallow lakes with Hmax ≤ 5 m, medium-depth lakes with 5 m < Hmax ≤ 20 m, and deep lakes with Hmax > 20 m [31]. Jiang and Fang [11] studied the cisco lethal conditions in Minnesota lakes using the following three types of virtual lakes: 12 shallow lakes (Hmax = 4 m), 16 medium-depth lakes (Hmax = 13 m), and 30 deep lakes (Hmax = 24 m) to represent 620 cisco lakes (14 shallow lakes, 385 medium-depth lakes, and 221 deep lakes, Table 3) in Minnesota. The contour lines of a total number of kill years for above 58 virtual lakes during the 47-year simulation period under MIROC 3.2 future climate scenario using Duluth weather station from Jiang and Fang [11] are shown in Figure 4. It can be found that the total number of kill years for shallow and medium-depth virtual lakes range from 35 to 47 years (Figure 4a), whereas the total number of kill years for the deep virtual lakes range from 5 to 15 (Figure 4b). There is a huge gap of the total kill years between shallow and medium-depth virtual lakes and deep virtual lakes, which indicates that another group of virtual lakes needs to be created for this study.
The 11 °C and 17 °C contour lines of AvgATDO3VB generated using the 30 deep virtual lakes to classify cisco refuge lakes by Jiang et al. [10] were also plotted on Figure 4 to further illustrate the necessity of creating a new group of virtual lakes. Figure 4 shows that some of the medium-depth cisco lakes were classified as Tier 2 refuge lakes and have a total number of cisco kill years more than 35 out of 47 simulation years. Similarly, some deep lakes with less than five cisco-kill years were classified as non-refuge lakes by Jiang et al. [10] (Figure 4b). These conflicts indicate that some of the cisco lakes were possibly misclassified as refuge lakes by only using the contour lines of AvgATDO3VB generated from the 30 deep virtual lakes, hence it further proves that a new group of virtual lakes is necessary for cisco lake reclassification.
As needed and also suggested by Jiang and Fang [11], a new set of medium-deep virtual lakes with the maximum depth of 18 m has been developed and used for T and DO simulations and then the refuge lake reclassification in this study. The 24 medium-deep virtual cisco lakes (Table 2) comprise of lakes with four different SD values (1.2 m, 2.5 m, 4.5 m, and 7.0 m) and six different surface areas (0.1 km2, 0.5 km2, 1.5 km2, 5.0 km2, 13.0 km2, and 50 km2). These combinations of the maximum depth and surface areas give six different lake GRs for the 24 medium-deep virtual lakes, i.e., 0.99, 1.48, 1.94, 2.63, 3.34, and 4.67 m−0.5 (Table 2) from strongly stratified (GR < 2 m−0.5) to relatively weakly stratified (GR > 4 m−0.5) lakes. The strength of the seasonal lake stratification is related to the lake geometry ratio [32]. Polymictic lakes have the highest GR numbers (typically GR > 10 m−0.5), while strongly stratified dimictic lakes have the lowest GR; the transition of the stratification occurs for GR between 3 and 5 [32]. The medium-deep lakes do not include polymictic lakes because GR = 10 m−0.5 and Hmax = 18 m require the surface area of 1050 km2, and there are no lakes with similar lake geometry out of the 620 cisco lakes.
The 24 medium-deep virtual lakes (Table 2), together with the 12 shallow, 16 medium-depth, and 30 deep virtual lakes, used in the previous study [11] form the four types of virtual lakes that were used to perform refuge lake reclassification in this study. The 620 cisco lakes were first divided into four corresponding categories based on the lake maximum depth. A maximum depth of 15 m was introduced as a new limit to group or separate the medium-depth and the medium-deep cisco lakes (Table 3). For 620 cisco lakes in Minnesota, there are 14 shallow (Hmax ≤ 5 m), 245 medium-depth (5 m < Hmax ≤ 15 m), 140 medium-deep (15 m < Hmax ≤ 20 m), and 221 deep (Hmax > 20 m) cisco lakes, and they will be studied separately for the refuge lake reclassification. Considering the three weather stations used in this study (Figure 2), lakes in each group are further divided into three geographic subcategories based on lake latitude (northern, mid-latitude, and southern, Figure 2). For example, there are 38, 90, and 140 medium-depth lakes associated with International Falls, Duluth, and St. Cloud weather station, respectively. Overall, there are 166, 399, and 55 cisco lakes associated with International Falls (northern), Duluth (mid-latitude), and St. Cloud (southern), respectively.
Distributions of 12 shallow, 16 medium-depth, 24 medium-deep, and 30 deep virtual lakes are plotted separately with 14 shallow, 245 medium-depth, 140 medium-deep, and 221 deep cisco lakes, respectively, out of 620 cisco lakes in Minnesota using SD and GR (0.44–30, log scale) as independent variables (Figure 6). The 14 shallow lakes are mesotrophic or eutrophic lakes that are well represented by 12 shallow virtual lakes (Figure 6a). The 24 medium-deep and 30 deep virtual lakes are representative of the 140 medium-deep and 221 deep cisco lakes, respectively (Figure 6c,d). The 245 medium-depth cisco lakes (Figure 6b) have the surface area ranging from 0.04 to 536.5 km2 and the maximum depth ranging from 5.18 to 14.93 m; therefore, GR ranges from 1.1 to 22.7 m−0.5 including two lakes GR > 10 m−0.5 (GR = 22.7 m−0.5 for Lake of the Woods, Hmax = 11.0 m and As = 3847.8 km2 and GR = 11.89 m−0.5 for Mille Lacs Lake, Hmax = 12.8 m and As = 536 km2). There are 26 lakes with GR > 5 m−0.5 (Figure 6b) that seem outside of the coverage of the 16 medium-depth virtual lakes, but the results of AvgATDO3VB will show that the mismatch does not affect the reclassification of refuge lakes. Even though the selection of lake geometric parameters (AS and Hmax) and Secchi depths for all virtual lakes was subjective, it can be seen in Figure 6 that the 82 virtual lakes represent the 620 lakes by four maximum-depth categories well.
3. Results and Discussion
3.1. Variable Benchmark Periods
The daily TDO3 increases from spring to summer and has a maximum value in July–August, as shown in Figure 5a for one selected medium-deep virtual lake for the past and two future climate scenarios. To compare and understand the overall oxythermal stress to cisco, the benchmark period, which is the period of the greatest oxythermal stress for coldwater fish [10,12], was used and studied by Jacobson et al. [22]. It was defined as the month (31-day period) with the highest TDO3 in late summer [22]. From a total of 9521 measured T and DO profiles for the years 1993 to 2005 in 1623 Minnesota lakes and the computed associated maximum TDO3 values, Jacobson et al. [22] determined that the period of the greatest oxythermal stress for coldwater fish differed by stratification status of a lake. The stress occurred earlier in unstratified lakes (GR > 4) [22]. The 31-day benchmark period of the greatest oxythermal stress went from 13 July to 12 August (date of year (DOY) 194–224) for unstratified lakes, and from 28 July to 27 August (DOY 209–239) for stratified lakes. These fixed benchmark (FB) periods were previously used by Fang et al. [12] for all 30 deep virtual lakes for all simulation years to determine AvgATDO3FB for the refuge lake classification.
Jiang et al. [10] used a variable benchmark (VB) period or sliding window of 31 days to determine ATDOVB since it was found that the periods of the greatest oxythermal stress using TDO3 are different from different years and different lakes. The 31-day VB period retained for each simulation year in FishHabitat2013 must not only have the highest average of 31-day TDO3 (i.e., ATDO3VB) but must also contain the maximum daily TDO3 in that year. For LakeM07 (Figure 5a), the beginning dates of the VB periods for the past and future climate scenarios are DOY 195 (14 July) (same for the past and CGCM 3.1) and 191 (10 July). Jiang et al. [10] calculated averages of the beginning dates of the VB periods for ATDO3VB for the 30 deep virtual lakes (Hmax = 24 m), and the averages ranged from DOY 207 (26 July) to DOY 269 (26 September) under the past climate conditions (1962–2008). Figure 7 plots time series of the beginning dates of the VB periods for ATDO3VB from 1962 to 2008 in four types of virtual lakes with similar lake geometry ratio: shallow LakeR02, medium-depth LakeR17, medium-deep LakeM27, and deep LakeC27. These are mesotrophic lakes with SD = 2.5 m. Average of the beginning dates is DOY 190 (9 July) in the shallow lake (weakly stratified) and DOY 219 (7 August) in the deep lake. There is a difference of one to a few days in the beginning dates between the past and the future climate scenario, but the difference is smaller than the annual variations of the beginning dates (Figure 7). The variable benchmark period method was therefore used in this study to find the highest average daily TDO3 or ATDO3VB over the 31-day period in each simulated year. Figure 5b shows an example of annual variations of ATDO3VB in LakeM07 from 1962 to 2008 and for two future climate scenarios, and the standard deviations from the mean (i.e., AvgATDO3VB) are about 1.1–1.2 °C. The annual variations were not further studied and only AvgATDO3VB was used for the reclassification of the cisco refuge lakes.
3.2. AvgATDO3VB of Four Types Virtual Lakes
The oxythermal habitat parameter TDO3 and annual ATDO3 in all 82 virtual lakes over a 47-year simulation period (1962 to 2008 for the past climate) were calculated using FishHabitat2013. The T and DO profiles simulated for the first year (i.e., 1961) were not used to extract TDO3 values to avoid possible effects of assumed initial T and DO conditions for MINLAKE2012 simulations. From 47 annual ATDO3VB, AvgATDO3VB was then calculated for all 82 virtual lakes. The statistics of AvgATDO3VB for the 12 shallow and 16 medium-depth virtual cisco lakes are listed in Table 4 for the past and two future climate scenarios at three weather stations (International Falls, Duluth, and St. Cloud). For the 12 shallow lakes, the minimum AvgATDO3VB for the past and future climate scenarios are 20.79 °C and 23.56 °C, respectively. It means AvgATDO3VB in all shallow lakes are greater than 17 °C, the highest oxythermal stress for Tier 1 and Tier 2 refuge lakes. The mean AvgATDO3VB values under different climate scenarios and geographic regions (northern, mid-latitude, and southern) range from 21.65 °C (Duluth) to 27.03 °C (St. Cloud) with a standard deviation of 0.36–0.65 °C. Due to small variations, no contour plots such as Figure 8 were created for shallow lakes. Mean AvgATDO3VB for 12 shallow lakes are projected to increase 2.44–3.40 °C under MIROC 3.2 future climate scenario. This corresponds to monthly air temperature increases projected by MIROC 3.2 ranging from 3.53 °C to 4.70 °C with annual averages of 4.00 °C to 4.24 °C for the three weather stations.
For the 16 medium-depth virtual lakes, the minimum AvgATDO3VB for the past and future climate scenarios are 19.86 °C and 22.82 °C (Table 4), respectively; and both are greater than the 17 °C oxythermal stress limit for cisco. Small variations with low standard deviations (≤0.45 °C) are almost the same as those in the 12 shallow lakes.
For the 24 medium-deep lakes (Table 5), the AvgATDO3VB values range from 12.19 to 23.53 °C under the past climate conditions and from 13.07 to 26.72 °C under the two future climate scenarios at three geographic regions. Standard deviations of AvgATDO3VB are much larger than ones for the shallow and medium-depth lakes (Table 4) and range from 2.14 to 2.65 °C (Table 5). Figure 8 shows contour plots of AvgATDO3VB under the MIROC 3.2 future climate scenario and does not have the contour line of 11 °C for AvgATDO3VB that is used to identify Tier 1 refuge cisco lakes. These contours were derived by interpolation from simulated AvgATDO3VB data points for the 24 medium-deep virtual lakes (Figure 8a, Table 2). Similar contour plots were also developed for the past climate conditions (1962–2008) and the CGCM 3.1 future climate scenario and then used to do the refuge lake reclassification (Table 6).
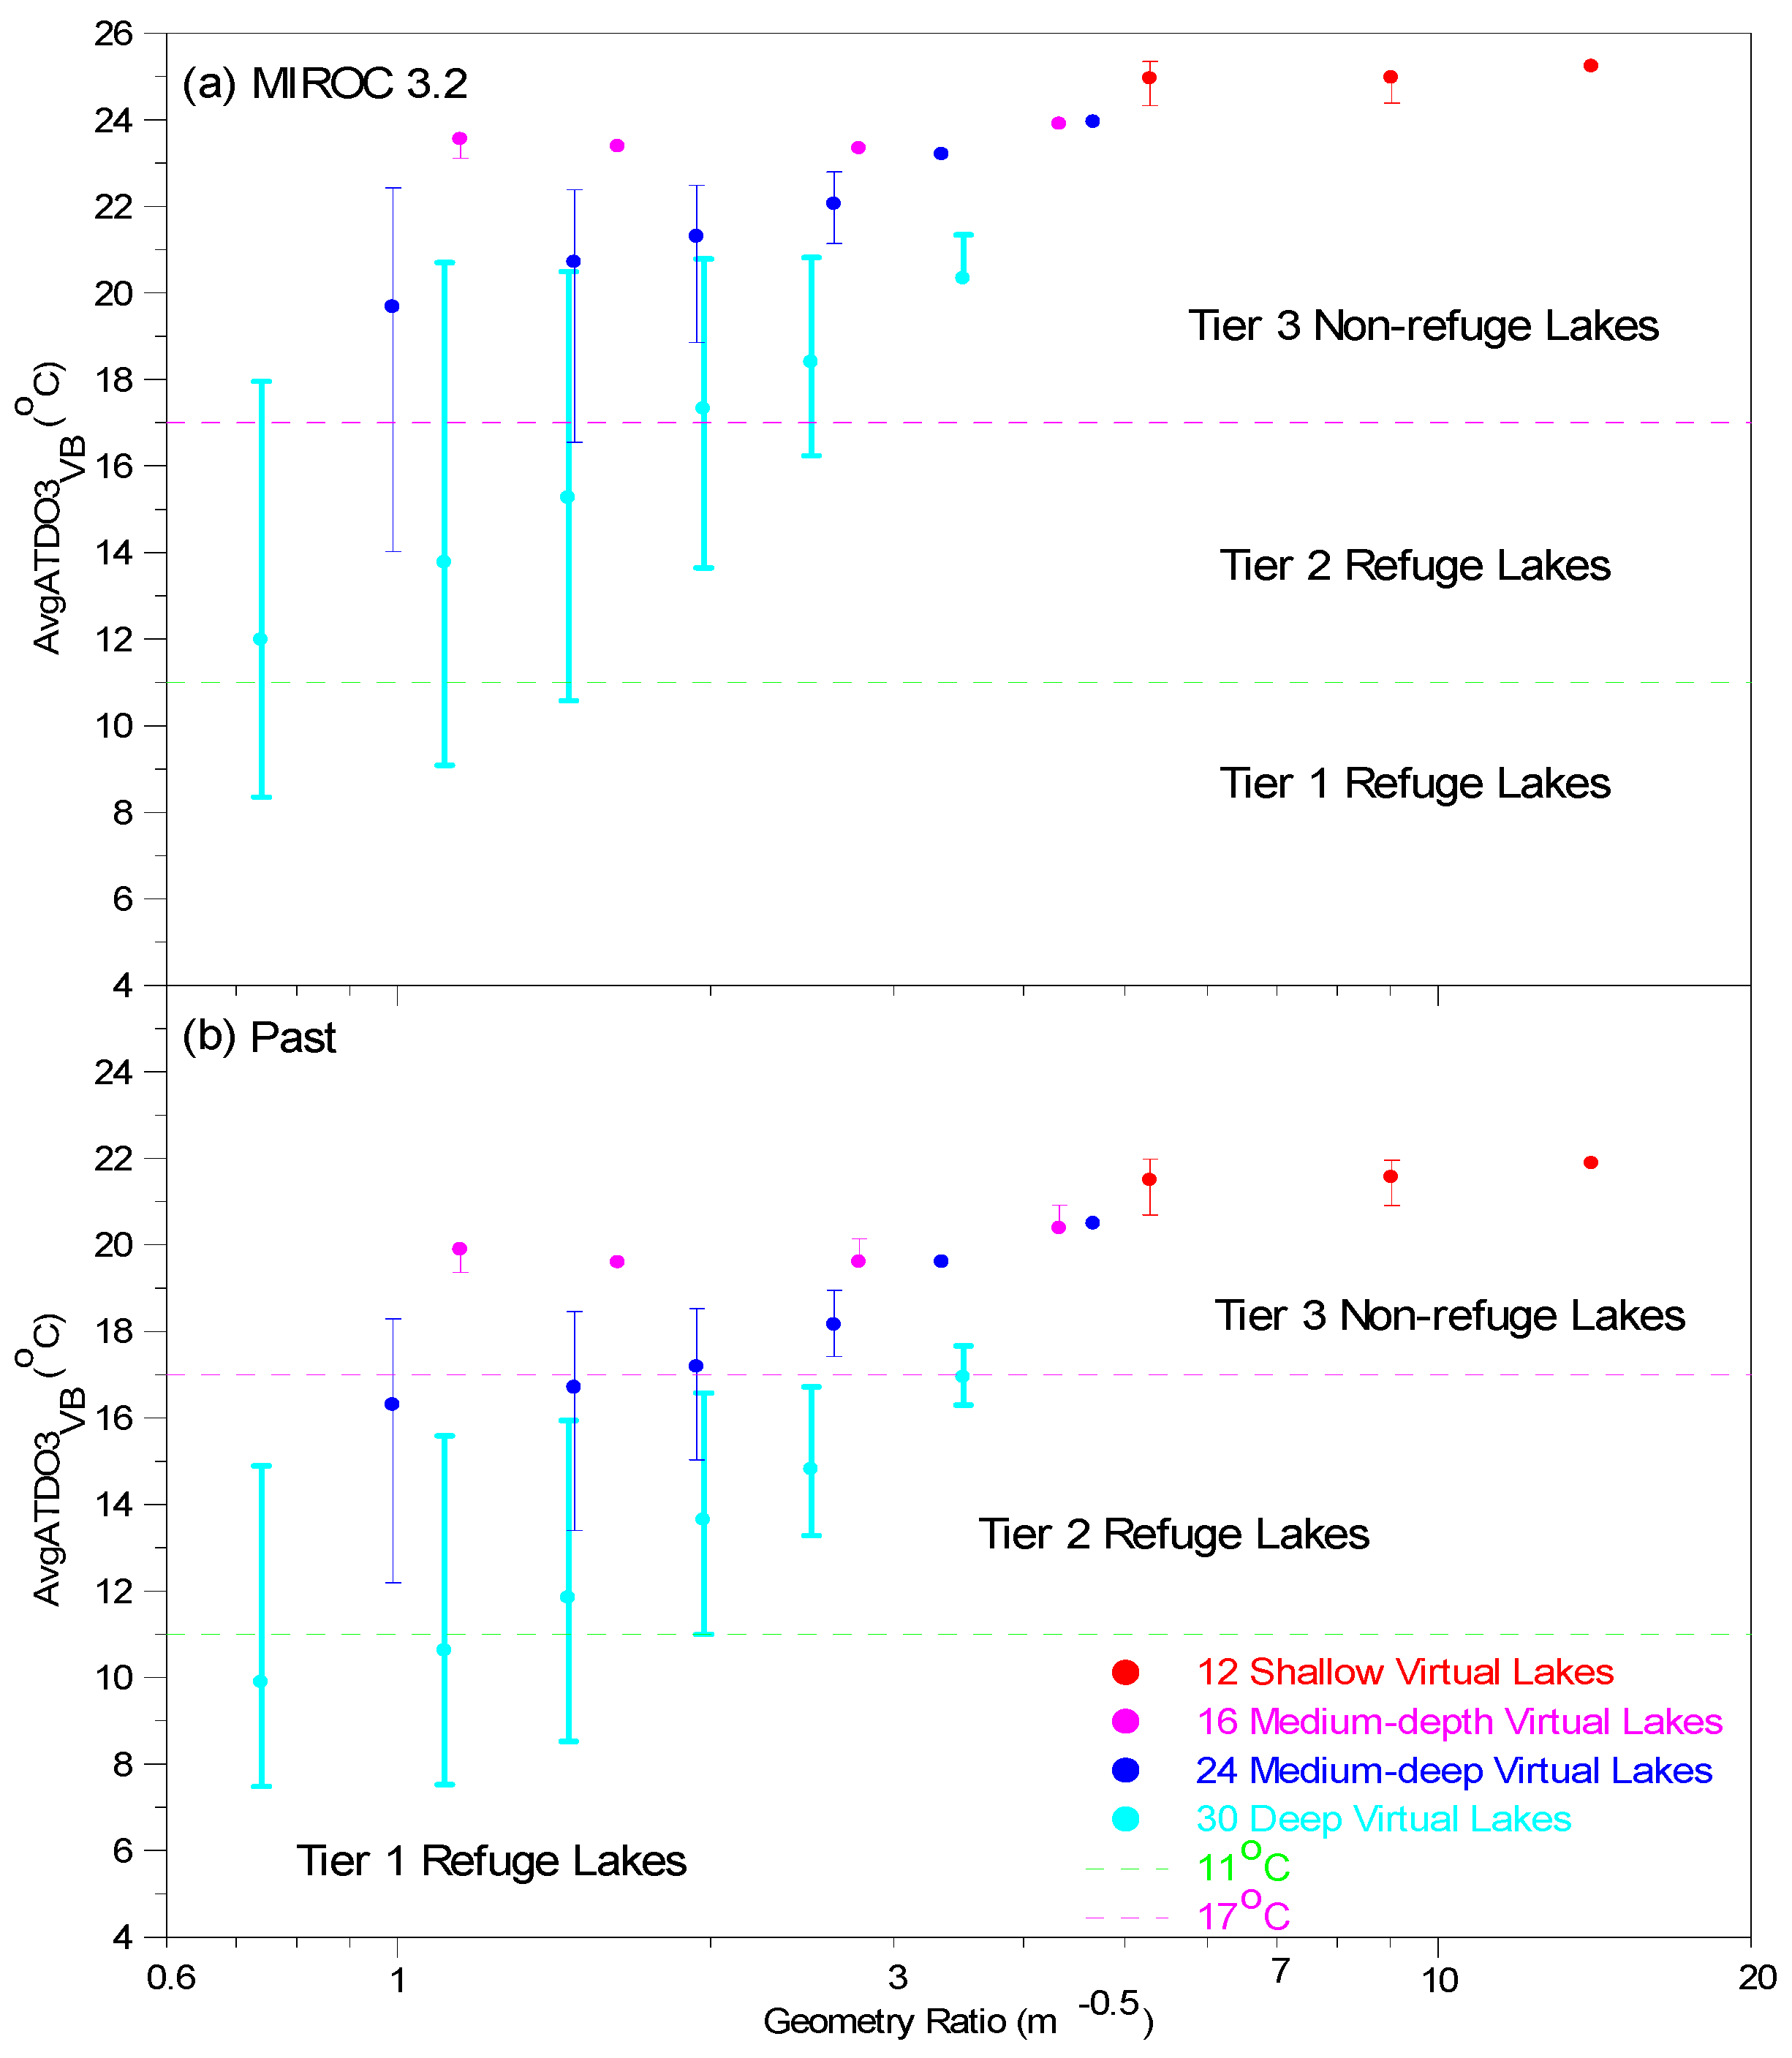
AvgATDO3VB and contour plots of AvgATDO3VB for the 30 deep virtual lakes were calculated and created in the previous study [10], but they were also used in this study to identify the refuge lakes from 221 deep cisco lakes only. Mean, maximum and minimum values of AvgATDO3VB for different trophic status (3 or 4 Secchi depths) for the four types of mid-latitude virtual lakes (near Duluth) were calculated and plotted versus lake geometry ratio for the past and MIROC 3.2 future climate scenarios (Figure 9). For some lakes with the same GR, the mean AvgATDO3VB is very close to either the maximum or the minimum or both so that those minimum and maximum do not show up in Figure 9. The variations due to trophic status are larger for strongly stratified deep or most medium-deep (GR < 3 m−0.5) lakes but very small for shallow and medium-depth lakes. Means of AvgATDO3VB are about ~20–25 °C for medium-depth and shallow lakes near Duluth (Figure 9 and Table 4). For the strongest stratified lakes (smallest GR) of medium-depth, medium-deep, and deep lakes, their geometry ratios are similar (around 1.0 m−0.5), but means of AvgATDO3VB are 23.6, 19.7, and 12.0 °C under MIROC 3.2 climate scenario, respectively. This further supports identifying refuge lakes using TDO3 should be done by the four lake types based on the maximum depths in addition to the lake geometry ratio and Secchi depth. This means the reclassification of refuge lakes by the four lake types (Figure 1) would be more accurate. Figure 9 also includes the 11 °C and 17 °C AvgATDO3VB lines as the reference so that one can project which virtual lakes could be Tier 1 or Tier 2 refuge lakes, and it clearly shows that all shallow and medium-depth lakes are non-refuge lakes.
ATDO3 in 2006 and AvgATDO3VB in three lakes: medium-depth LakeR11 [11], medium-deep LakeM07, and deep LakeC12 [10], were further studied (Figure 5c,d). These three virtual lakes have the same Secchi depth (2.5 m), which has an attenuation coefficient for solar radiation of 0.47 m−1 (=1.84/SD [33]) and similar lake geometry ratio (stratification status) of GR = 1.63, 1.48, and 1.46 m−0.5, respectively. ATDO3VB in 2006 are 23.5, 20.9, and 17.0 °C (Figure 5c), respectively, under Duluth climate condition and decreases as the maximum depth increases. The corresponding AvgATDO3VB over 1962–2008 are 19.7, 18.1, and 15.6 °C (Figure 5d), respectively. All three lakes with similar GR were under the same climate condition, and the decrease of ATDO3 and AvgATDO3VB with Hmax are linked to the lake volume, the amount of water that is heated by the same solar radiation. The lake volumes of LakeR11, LakeM07, and LakeC12 are 0.69 × 10⁶, 2.2 × 10⁶, and 12.04 × 10⁶ m3, and the mean depths (volume divided by the surface area) are 3.45, 5.93, and 8.02 m, respectively. The percent of solar radiation that reaches the mean depth for these lakes, which was calculated using Beer–Lambert law [33], is 7.88%, 1.27%, and 0.27% of the surface radiation, respectively, when SD = 2.5 m. This would partially explain lower ATDO3 in deeper lakes, and MINLAKE2012 includes all physical processes and chemical/biological reactions to model daily temperature and dissolved oxygen profiles that accurately project TDO3 in each lake.
3.3. Validation of Refuge Lake Reclassification
The current method was further verified and cross validated on 18 cisco lakes with observed adult cisco mortality during the unusually warm summer of 2006 [22]. These 18 lakes are listed in Table 6 by increasing Hmax, and the mortality dates in 2006 are given in DOY and date. All 18 lakes were previously calibrated against observed T and DO profiles and simulated from 1961 or 1991 to 2012 based on available climate data from the closest weather station by Jiang and Fang [11], and various TDO3 characteristics were determined using FishHabitat2013 for this study and reported in Table 6. ATDO3VB in 2006 was on average 2.73 °C (ranging 2.02–4.84 °C) greater than AvgATDO3VB (ranging 13.4–22.2 °C, the column (3) in Table 6), which is the multiyear average. Comparing with the range of ATDO3VB (Table 6), ATDO3VB in 2006 for 14 lakes was the highest over the simulation period and for other four lakes just 0.33 ± 0.17 °C lower than the highest ATDO3VB. Therefore, 2006 indeed had an unusually warm summer, and that is why cisco mortality occurred in these 18 lakes.
Eight of these 18 lakes are medium-depth lakes (Hmax < 15 m) and emerged as non-refuge lakes under the past climate since AvgATDO3VB in medium-deep virtual lakes is greater than 19.3 °C > 17 °C (Table 4). Four lakes, viz., Woman, Andrusia, Straight, and Little Pine at Otter Tail County (Table 6), are medium-deep lakes (15 m < Hmax < 20 m) and also reclassified as non-refuge lakes under the past climate. The remaining six deep lakes, viz., Bemidji, Star, Pine Mountain, Gull, Long, and Carlos, emerged as Tier 2 refuge lakes using AvgATDO3VB. Actually, Lake Bemidji and Long Lake studied by Jacobson et al. [22] are not in the 620 cisco lake database [10,12]. The mean summer SD for Bemidji and Long are 2.9 and 3.0 m, respectively, determined from SD data available from the MN DNR LakeFinder web site (http://www.dnr.state.mn.us/lakefind/index.html). The geometry ratio (GR) for Bemidji and Long are 3.13 and 1.22 m−0.5, respectively (Table 6); therefore, the reclassification of Bemidji and Long into refuge lakes was done by plotting them in Figure 4b and using the 11 and 17 °C contour lines created by 30 deep virtual lakes. AvgATDO3VB as the average of ATDO3VB over 47 years (1962–2008) would be expected to underestimate the oxythermal stress in the unusually warm summer of 2006 and would, therefore, cause these six lakes to be classified as Tier 2 refuge lakes. It was found that calculated ATDO3VB in 2006 for Lake Carlos was 15.4 °C and for other five deep lakes ranged from 21.1 to 25.1 °C (Table 6). Therefore, except Carlos, all other 17 lakes were reclassified as non-refuge lakes in 2006 by the current method, and this overall remarkable agreement between model predictions of non-refuge lakes and observed adult cisco mortality events in 2006 is better than the validation from the previous studies using the contour lines determined from the 30 deep virtual lakes for the classification [10,12]. In the previous method, three medium-deep lakes (Lake Andrusia, Little Pine at Otter Tail County, and Straight) and two medium-depth lakes (Lake Little Pine at Crow Wing County and Seventh Crow Wing) were classified as Tier 2 refuge lakes [10]. Lake Carlos was classified as Tier 2 refuge lakes by all the methods, and Jacobson et al. [22] stated ciscoes in Lake Carlos might have experienced a more chronic oxythermal stress over a longer period and lethal temperatures under chronic oxythermal stress can be lower than for fish under acute thermal stress.
The beginning and ending dates of the VB periods in 2006 were determined for all 18 lakes and reported in Table 6. Except for Lake Mille Lacs and Lake Carlos, the cisco mortality date for each of the 16 lakes is included by the corresponding VB period, and this is a very good agreement between the mortality date and the greatest oxythermal stress period. For instance, the cisco mortality date of Lake Cotton was 24 July 2006 (DOY 205), and the 2006 VB period of Lake Cotton was DOY 195–225 (Table 6), which covered DOY 205. For Lake Carlos and Mille Lacs, the mortality date was 1 and 12 days before the beginning date of the VB period, respectively. The mean TDO3 in 3, 7, and 15 days before the mortality date were also determined for each lake (Table 6) to quantify what was the oxythermal stress to cisco before the mortality. For Mille Lacs, they are 21.9, 21.7, and 21.1 °C, respectively. This high oxythermal stress indeed created unfavorable habitat condition for cisco in Mille Lacs. The mean TDO3 in 3, 7, and 15 days before the mortality date (Table 6) decreased slightly with the longer average period, and indicates that the oxythermal stress kept increasing towards the mortality date. Excluding Lake Carlos, average 3-day TDO3 before the mortality date was 23.5 °C with a standard deviation of 2.0 °C, which is very close the lethal temperature of 22.1 °C at DO survival limit of 3 mg/L determined by Jiang and Fang [11] and further confirmed why the mortality occurred in 2006.
3.4. Cisco Lakes Reclassification in Minnesota
Table 4 shows that AvgATDO3VB for shallow virtual lakes are greater than 20.69 °C and for medium-depth virtual lakes are greater than 19.26 °C > 17 °C, therefore, 14 shallow and 245 medium-depth cisco lakes are reclassified as non-refuge lakes, which are summarized in Table 7 by three geographic regions and three climate conditions.
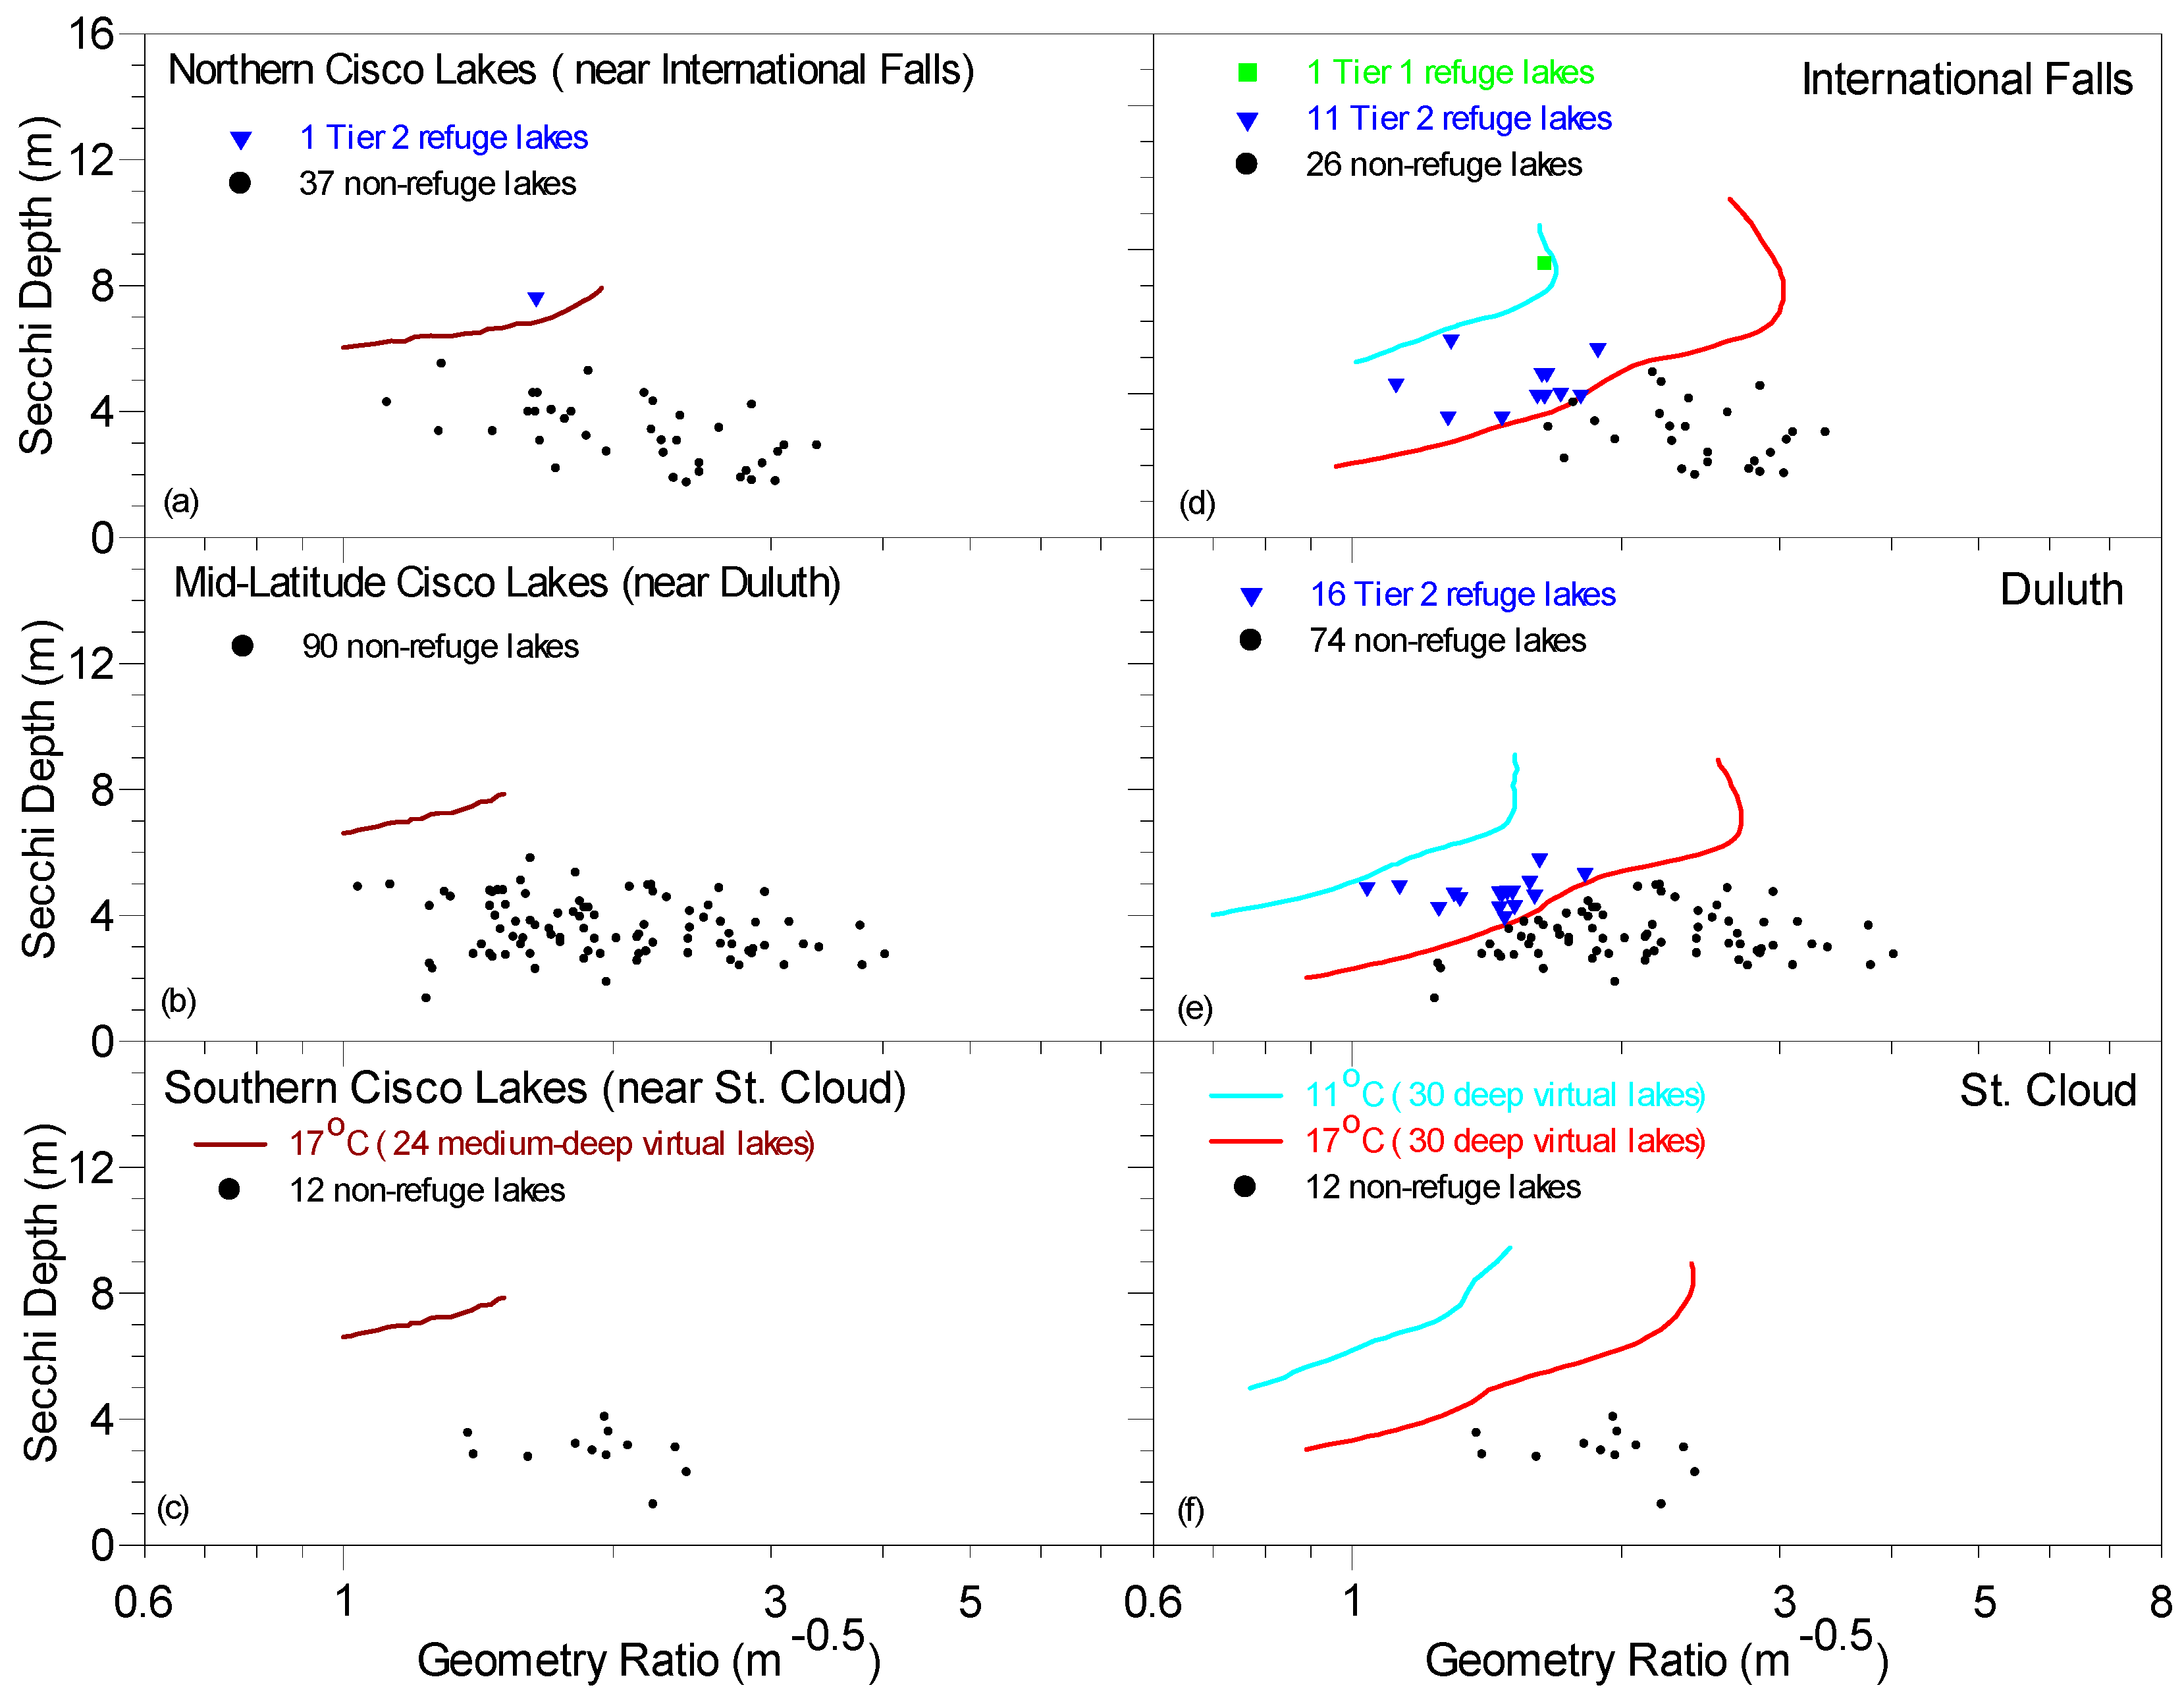
For medium-deep cisco lakes, the 17 °C contour lines of AvgATDO3VB were created using AvgATDO3VB simulated from the 24 medium-deep virtual lakes (Table 2) for three climate scenarios. Contour lines for MIROC 3.2 and cisco lakes by three geographic regions are shown in Figure 10a–c (left panels) for International Falls, Duluth, and St. Cloud weather station, respectively. Only one lake out of 38 northern cisco lakes associated with International Falls weather station was reclassified as Tier 2 refuge lake. None of the 90 mid-latitude and 12 southern cisco lakes (associated with Duluth and St. Cloud weather station) were reclassified as Tier 1 or Tier 2 refuge lakes, which means, under MIROC 3.2 future climate scenario, except one lake classified as Tier 2 refuge lake, all other 139 medium-deep lakes were reclassified as Tier 3 non-refuge lakes (Table 7).
Reclassification of 140 medium-deep cisco lakes into refuge lakes under the past and CGCM 3.1 future climate scenario are also projected and summarized in Table 7. Under the past climate condition (1962–2008), 30 of 140 medium-deep cisco lakes (5 in northern and 25 in mid-latitude regions) had lower oxythermal stress (11 °C ≤ AvgATDO3VB ≤ 17 °C) and were reclassified as Tier 2 refuge lakes. The reclassification of 140 medium-deep cisco lakes under CGCM 3.1 is the same as that under MIROC 3.2 (Table 7).
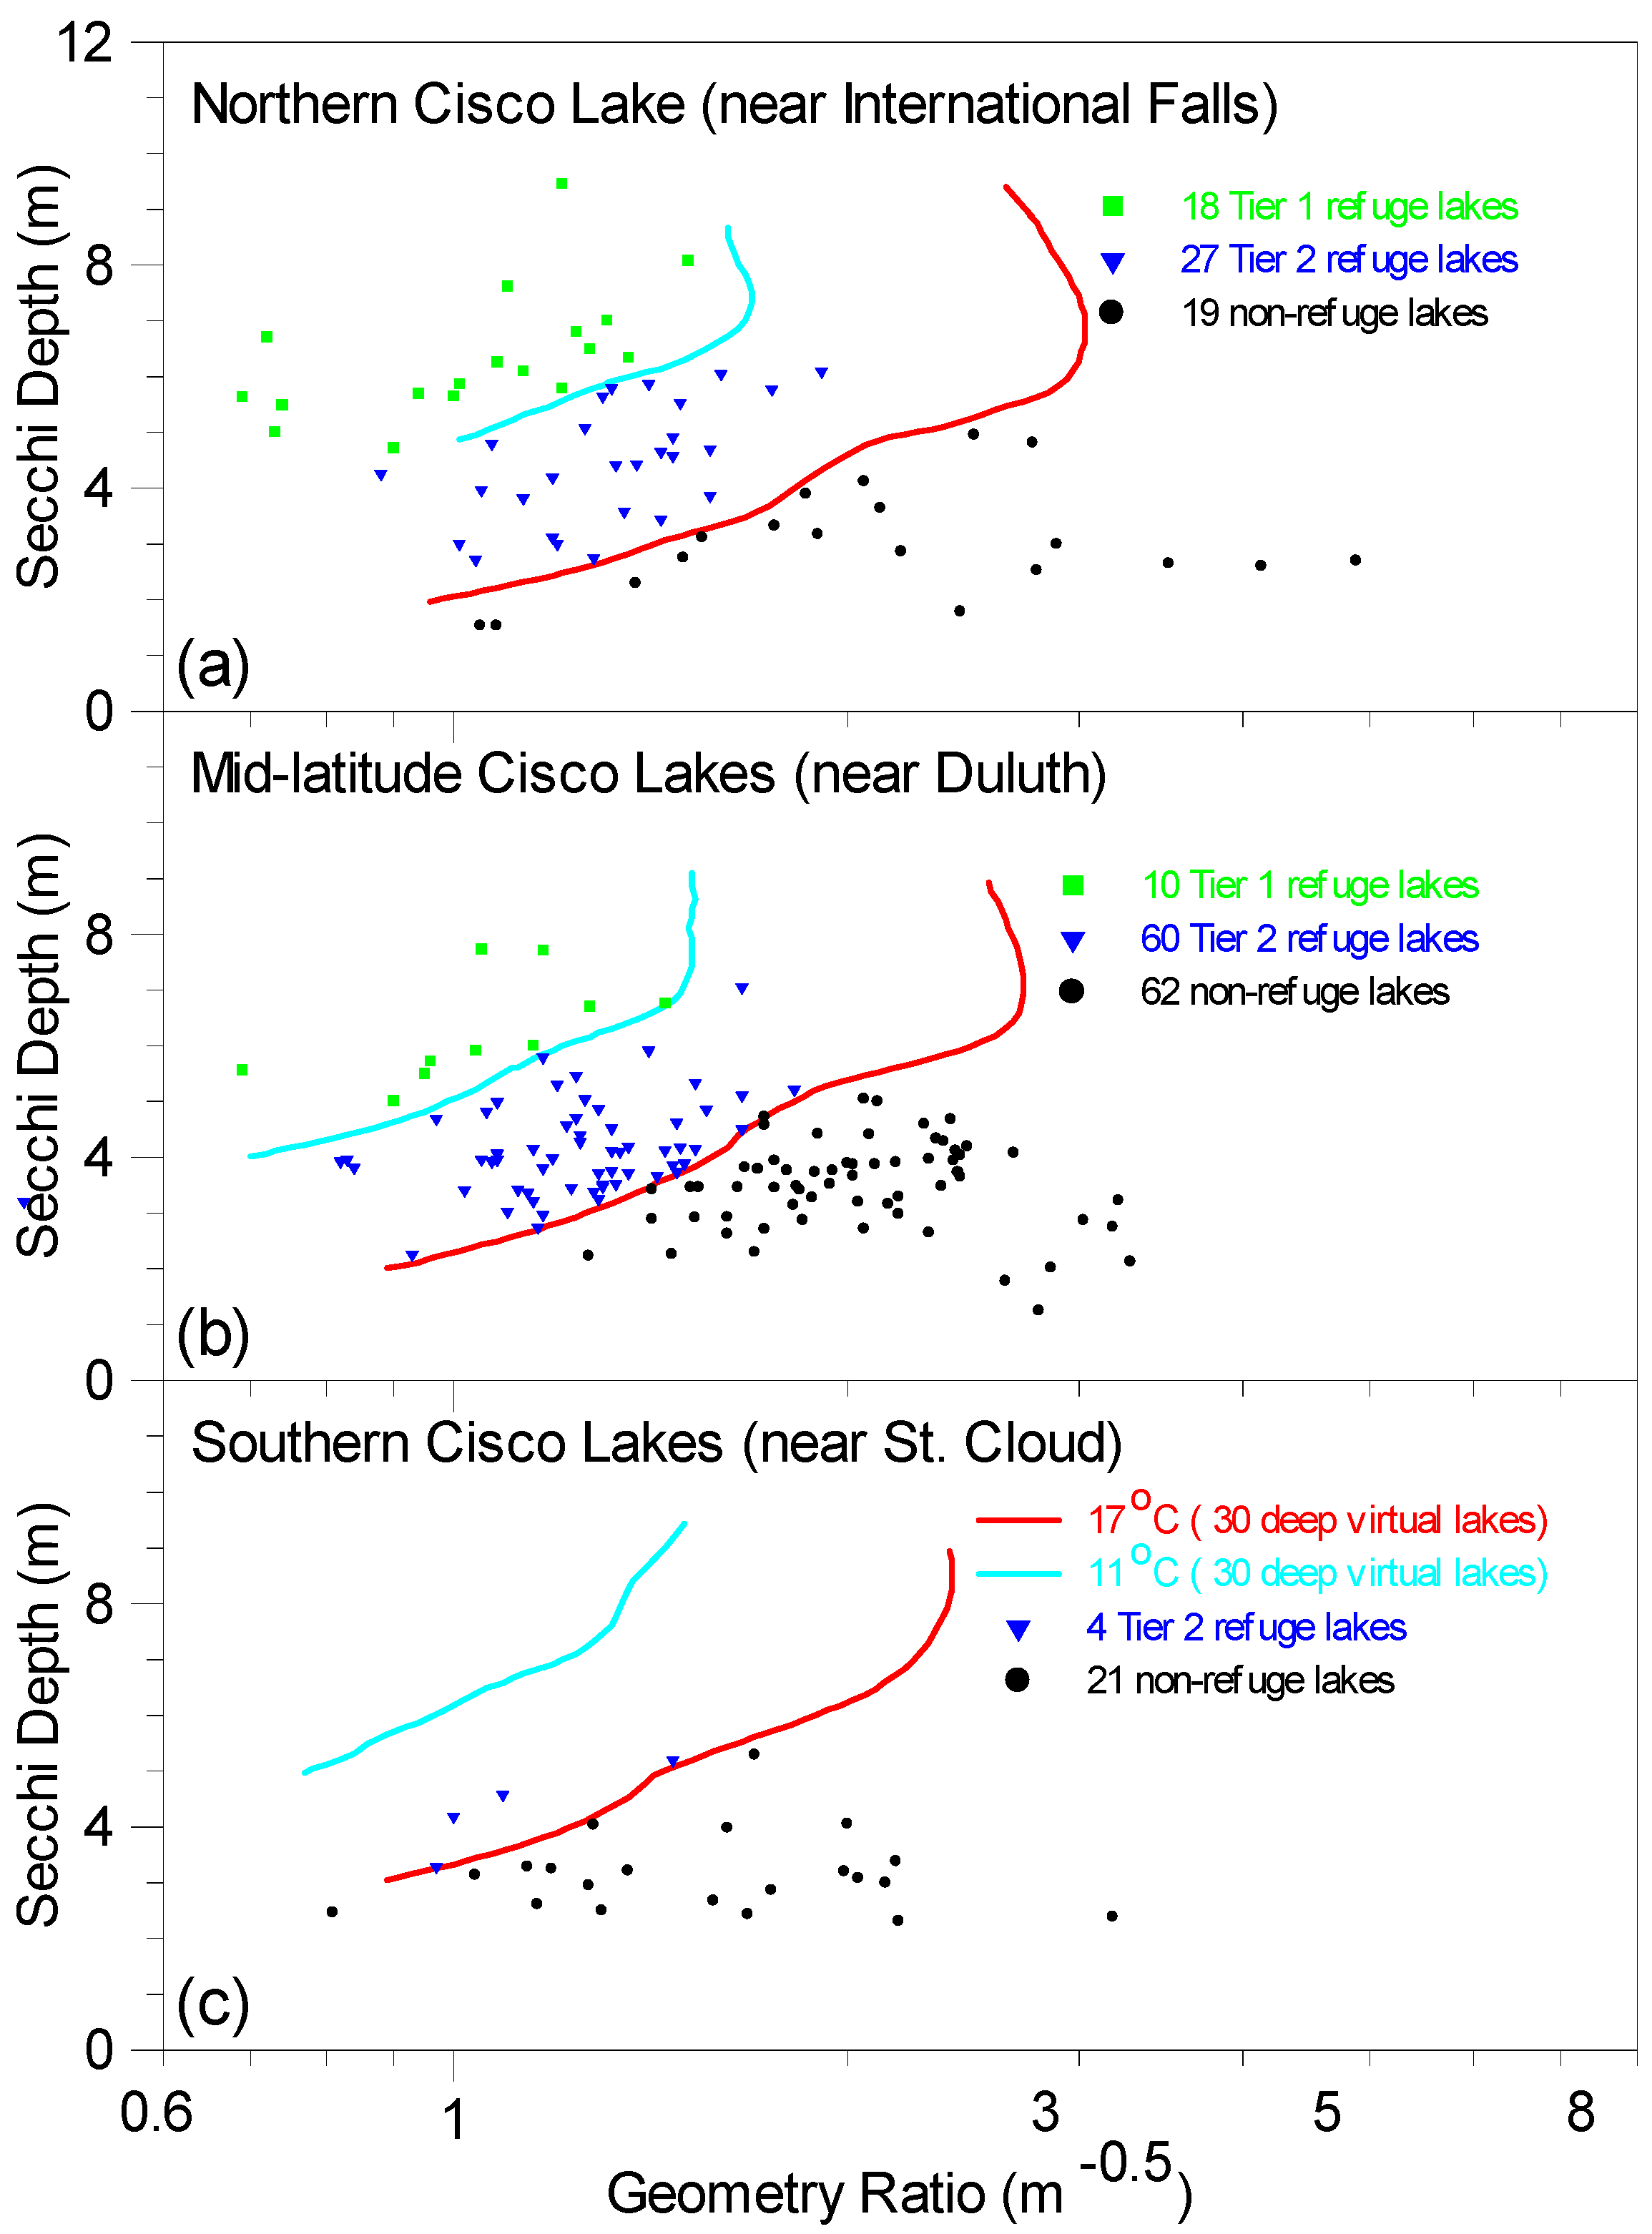
For 221 deep cisco lakes in Minnesota, the same contour lines of AvgATDO3VB created using AvgATDO3VB simulated from the 30 deep virtual lakes from the previous study by Jiang et al. [10] were used to do the reclassification. For 64 northern cisco lakes, under MIROC 3.2 future climate scenario, 18, 27, and 19 cisco lakes were classified as Tier 1, Tier 2, and Tier 3, respectively (Figure 11). Detailed reclassification results for 221 deep cisco lakes in other regions and under other climate conditions are summarized in Table 7. The reclassification under CGCM 3.1 is similar to that under MIROC 3.2 with the maximum difference of only five lakes (23 instead of 18 for Tier 1 refuge lakes).
By geographic regions, there are 46 northern, 70 mid-latitude, and four southern cisco lakes that were reclassified as Tier 1 or Tier 2 refuge lakes under MIROC 3.2 future climate scenario (Table 7). For all 620 cisco lakes, 28, 92, and 500 cisco lakes were reclassified as Tier 1, Tier 2, and Tier 3 refuge lakes under MIROC 3.2 future climate scenario, respectively (Table 7). A total of 120 cisco lakes or 19.4% of the 620 cisco lakes were reclassified as either Tier 1 or Tier 2 refuge lakes, and 80.6% other cisco lakes are non-refuge lakes. Under CGCM 3.1 future climate scenario, 123 cisco lakes (19.8%) are projected as either Tier 1 or Tier 2 refuge lakes. Under the past climate conditions, 245 cisco lakes (39.5%) had lower oxythermal stress and could be Tier 1 or Tier 2 refuge lakes. The classification of about 80% of cisco lakes as non-refuge lakes is higher than 67% as non-refuge lakes in Wisconsin studied by Sharma et al. [34] using a different methodology. Regardless, both studies indicate cisco habitat conditions are projected greatly affected by the climate warming in the future. Sharma et al. [34] used seven environmental variables for the refuge lake selection that included surface area, maximum depth, and Secchi depth, which are used in our studies, plus perimeter, pH, conductivity, and mean annual air temperatures.
3.5. Comparison and Discussion of Reclassification with Results in the Previous Study
In the previous study [10], all 14 shallow lakes were classified as non-refuge lakes, which is the same result as the reclassification using AvgATDO3VB from the 12 shallow virtual lakes. This is also consistent with simulated total number of years with cisco kill and average cisco kill days reported by Jiang and Fang [11]: under MIROC 3.2 future climate scenario, shallow lakes are projected to have cisco kill almost every year (45–47 out of 47 years, Figure 4) and more than average 30 days with cisco kill conditions in those years.
When the 11 °C and 17 °C contour lines of AvgATDO3VB created by using AvgATDO3VB simulated from the 30 deep virtual lakes (Hmax = 24 m) were used to classify 245 medium-depth cisco lakes, five northern and eight mid-latitude medium-depth cisco lakes were previously classified as Tier 2 refuge lakes (Table 8) under MIROC 3.2 future climate scenario. These 13 medium-depth lakes were all reclassified as Tier 3 non-refuge lakes (Table 7) using AvgATDO3VB simulated from the 16 medium-depth virtual lakes (Hmax = 13 m). The reclassification for these medium-depth lakes as non-refuge lakes is more accurate as also supported by projected cisco kill characteristics from the previous study [11] and Figure 4, which indicates 25–45 years of cisco kill (contour lines below 35 were not shown in Figure 4a).
For 140 medium-deep cisco lakes, if the 11 °C and 17 °C contour lines generated in the previous study [10], i.e., using AvgATDO3VB simulated from the 30 deep virtual lakes, were used to classify them into refuge lakes; under MIROC 3.2 future climate scenario, one northern cisco lake (Figure 10d) could be projected as Tier 1 refuge lake, and 11 northern and 16 mid-latitude cisco lakes (Figure 10d,e) could be projected as Tier 2 refuge lakes (Table 8). In contrast, only one northern cisco lake was reclassified as Tier 2 refuge lakes when the contour lines from the 24 medium-deep virtual lakes were used (Figure 10a–c).
Table 8 summarizes the classification results for 620 cisco lakes using the 11 and 17 °C contour lines of AvgATDO3VB generated from the 30 deep virtual lakes for the past and two future climate scenarios. For MIROC 3.2 future climate scenario, 62, 94, and 4 lakes are classified as Tier 1 or Tier 2 refuge lakes among 166 northern, 399 mid-latitude, and 55 southern cisco lakes (associated with weather stations at International Falls, Duluth, and St. Cloud), respectively (Table 8). Therefore, 160 (25.8%) and 164 (26.5%) cisco lakes were classified as refuge lakes under MIROC 3.2 and CGCM 3.1 future climate scenarios (Table 8) [10], respectively. For the reclassification done in this study using the contour lines created by the four lake types (total 82 virtual lakes) grouped by the maximum depth, 40 (i.e., 160–120, 6.5% of the 620 cisco lakes, Appendix A) and 41 (164–123) cisco lakes under MIROC 3.2 and CGCM 3.1 future climate scenarios were reclassified as non-refuge lakes, but they were classified as Tier 1 (one lake) or Tier 2 (39 or 40) refuge lakes using the method from the previous study [10].
For comparison purpose, Table 9 summarizes the refuge lake classification (selection) results using two different methods, i.e., the previous method using the 11 and 17 °C contour lines of AvgATDO3VB created from the 30 deep virtual lakes and the current method using those contour lines created from the four types of virtual lakes grouped by the maximum depth (total 82 lakes), to perform the classification.
Under the past climate conditions (1962–2008), the current method only reclassified 79 and 166 cisco lakes as Tier 1 and Tier 2 refuge lakes (Table 7), respectively; while the previous method [10] had 94 Tier 1 and 412 Tier 2 refuge lakes (Table 8). The large differences of refuge lake selection are for 245 medium-depth and 140 medium-deep cisco lakes since all medium-depth and majority (110 out of 140) of medium-deep cisco lakes were reclassified as non-refuge lakes by the current method (Table 7). Under the previous method, 37 (1 + 36) northern, 116 (3 + 113) mid-latitude, and three southern medium-depth cisco lakes were classified as Tier 1 or Tier 2 refuge lakes (Table 8); and 38 (3 + 35) northern, 89 (8 + 81) mid-latitude, and eight southern medium-deep cisco lakes were classified as Tier 1 or Tier 2 refuge lakes (Table 8).
A number of Tier 1 refuge lakes selected for two future climate scenarios by using the two methods are about the same (34 and 33 for CGCM 3.1, 29 and 28 for MIROC 3.2, Table 9). The selection results for Tier 2 refuge lakes using the two methods have big differences: about 40 more lakes under the future climate and 246 more lakes under the past climate conditions by the previous classification method.
In Figure 9, the 11 and 17 °C reference lines of AvgATDO3VB were added so that virtual lakes grouped by different maximum depths are linked with refuge lake classification; this clearly indicates using the contour lines derived from the 30 deep virtual lakes are not appropriate for classifying medium-depth and medium-deep cisco lakes into tiered refuge lakes.
Twenty-four medium-deep virtual lakes (Table 2) were introduced for this study for the first time. Based on the previous method to group lakes [35], 385 lakes having 5 < Hmax ≤ 20 m were represented by the 13 m medium-depth virtual lakes. Under the two future climate scenarios (MIROC 3.2 and CGCM 3.1) using the information in Table 4, all 385 cisco lakes would be classified as Tier 3 non-refuge lakes, while after introducing 24 medium-deep virtual lakes, only one lake was reclassified as Tier 2 refuge lakes, all 245 medium-depth lakes and 139 medium-deep were still reclassified as non-refuge lakes under future climate scenarios. For the refuge lake classification point of view, introducing 24 medium-deep virtual lakes did not make much difference on the results of number of refuge lakes, but it did make the difference on understanding oxythermal stress to cisco under the past climate conditions, which was just discussed in the previous paragraph (results in Table 8). Figure 8 and Figure 9 also clearly show oxythermal stress parameter AvgATDO3VB determined for the 24 medium-deep lakes is different from the 16 medium-depth and 30 deep virtual lakes when GR < ~3 m−0.5.
Since only Lake Ashigan (Appendix A) that was classified as Tier 1 refuge lake in the previous study [10] was reclassified as Tier 2 refuge lake in this study, the statistics of lake parameters (Hmax, As, SD, and GR) for Tier 1 refuge lakes is basically same as summarized previously. Since 39 cisco lakes were reclassified from Tier 2 refuge lakes to Tier 3 non-refuge lakes under MIROC 3.2 future climate scenario, the GR and Hmax for the previous 131 Tier 2 refuge lakes are < 2.55 m−0.5 and > 13.11 m, and for the current 93 Tier 2 refuge lakes are < 1.91 m−0.5 and > 17.98 m, respectively. Therefore, Tier 2 refuge lakes are projected to have stronger stratification and deeper depth because of not including medium-depth cisco lakes.
Previously, both Fang et al. [12] and Jiang et al. [10] found using TDO3 of 11 °C and 17 °C to classify the cisco lakes into Tiers 1, 2, and 3 is considered fairly stringent. When a lake is classified as Tier 3 non-refuge lakes, it does not mean the lake cannot support cisco at all; only oxythermal stress to ciscoes are relatively high. Except for Lake Carlos, average three-day TDO3 before the cisco mortality date in 2006 in 17 lakes ranged from 19.0 to 26.2 °C (Table 6), which indicates the adult cisco kill temperature at DO = 3 mg/L was much higher than 17 °C. As Jacobson et al. [25] stated, therefore, ciscoes can persist in lakes with TDO3 > 17 °C but at a reduced probability of occurrence.
4. Summary and Conclusions
This is an extension of a previous study of the refuge lake selection from the 620 cisco lakes in Minnesota under future climate warming scenarios, and the classification of refuge lakes were previously done using the contour lines of multiyear average of the highest TDO3 oxythermal parameter (i.e., AvgATDO3VB) derived from the 30 deep virtual lakes [10]. In this study, a modified method was developed to reclassify the refuge lakes based on the contour lines of AvgATDO3VB derived from the four types of virtual lakes. The 30 deep virtual lakes were only used to reclassify 221 deep lakes (Hmax > 20 m) out of the 620 cisco lakes. Twenty-four 18 m medium-deep virtual lakes were created in this study to better represent 140 medium-deep cisco lakes (15 m < Hmax ≤ 20 m). The 12 shallow and 16 medium-depth virtual lakes created for other studies [11,13] were used to present 14 shallow cisco lakes (Hmax ≤ 5 m) and 245 medium-depth cisco lakes (5 m < Hmax ≤ 15 m) in Minnesota. The same oxythermal variable AvgATDO3VB and the refuge lake selection criteria used in the previous study [10] were used in this study but were applied to three more types of virtual lakes (shallow, medium, and medium-deep) to get more accurate refuge lake projection in Minnesota under two future climate scenarios.
This reclassification method was first validated in 18 Minnesota lakes with the cisco mortality in 2006. Among these 18 lakes, all eight medium-depth lakes and four medium-deep were reclassified as non-refuge lakes; six deep lakes were reclassified as Tier 2 refuge lakes using AvgATDO3VB; and five deep lakes were reclassified as non-refuge lakes if ATDO3VB in 2006 were used. This is an overall remarkable agreement between observed cisco mortality and reclassification. Compared with about 25.8–26.5% in the previous study [10], only about 19.4–19.8% of the 620 cisco lakes are projected as refuge lakes (Tier 1 and Tier 2) under two future climate scenarios using the current classification method. Forty (listed in Appendix A) or forty-one lakes (6.4–6.6%) that were classified as either Tier 1 or Tier 2 refuge lakes by the previous study under MIROC 3.2 climate scenario were reclassified as non-refuge lakes. Therefore, the modified method presented in this paper improved the prediction accuracy of classifying refuge lakes by ~6.5%. Variations of AvgATDO3VB with SD and four types of virtual lakes (Figure 9) clearly indicate that the current study can provide more accurate results on refuge lake reclassification because the 620 cisco lakes are better represented using four different types of virtual cisco lakes. AvgATDO3VB increases with the decrease of the maximum depth at the same or similar geometry ratio, e.g., AvgATDO3VB was 15.6 °C in deep LakeC12 and 19.7 °C in medium-depth LakeR11 (Figure 4d), under the past climate (1962–2008). Tier 1 and Tier 2 refuge lakes reclassified by the current method have a lake geometry ratio less than 2.0 m−0.5 and the maximum depth greater than 18 m.
Acknowledgments
Original MINLAKE2012 and FishHabitat2013 model enhancement were supported by a research project from Minnesota Department of Natural Resources.
Author Contributions
Authors collaborated together for the completion of this work. Liping Jiang planned the study, applied MINLAKE2012 and FishHabitat2013 model for refuge lakes selection study; Liping Jiang ran the model for all different cases, performed data analyses of model results and wrote the first draft of the manuscript; Xing Fang provided valuable instructions on study design, supervised the data analyses, and reviewed and revised the manuscript; and Gang Chen provided review comments to improve the paper and did some data analysis. All authors contributed in obtaining results and writing the manuscript.
Conflicts of Interest
The authors declare no conflict of interest.
Appendix A
Table A1 lists the information on 40 cisco lakes that were reclassified as Tier 3 non-refuge lakes when the 11 and 17 °C contour lines of AvgATDO3VB were determined from the four lake types grouped by the maximum depth (Table 2). Ashigan Lake near International Falls was classified as Tier 1 and other 39 lakes were classified as Tier 2 refuge lakes using the previous method [10], i.e., when the 11 and 17 °C contour lines of AvgATDO3VB were determined from the 30 deep lakes only but used to classify all 620 cisco lakes.
Basic statistical parameters (maximum, minimum, mean, and standard deviations) of lake geometry parameters were calculated; however, the trend information was not clear. The maximum depth ranges from 13 to 18 m, which are medium-depth or medium-deep lakes (M or MD in Table A1). When a graph of Secchi depth (SD) versus lake geometric ratio (GR) was plotted for these 40 lakes, it shows that SD has a strong correction with GR: a linear trendline (SD = 1.88 × GR + 1.74) has a correlation coefficient R2 = 0.44 and a power trendline (SD = 3.29 GR0.787) has a slightly high correlation coefficient R2 = 0.64. SD ranges from 3.35 to 7.74 m, GR ranges from 1.04 to 2.55 m−0.5, and SD is larger when GR is high.

Table A1.
Forty cisco lakes and geometry characteristics with different refuge lake classifications using the previous and current method.
Table A1.
Forty cisco lakes and geometry characteristics with different refuge lake classifications using the previous and current method.
| Lake Type (Region) 1 | Lake ID 2 | Name | As (ha) | Hmax (m) | GR (m−0.5) | SD (m) |
|---|---|---|---|---|---|---|
| M (Nor) | 38071500 | Triangle | 125.10 | 13.11 | 2.55 | 5.42 |
| M (Mid) | 11086600 | Tamarack | 4.33 | 13.11 | 1.10 | 3.81 |
| M (Nor) | 16058000 | Granite | 8.10 | 13.72 | 1.23 | 4.25 |
| M (Nor) | 38052400 | Portage | 27.94 | 13.72 | 1.68 | 4.27 |
| M (Nor) | 69006600 | Little Long | 118.62 | 13.72 | 2.41 | 5.56 |
| M (Mid) | 11046900 | Anway | 8.91 | 13.72 | 1.26 | 3.96 |
| M (Mid) | 11004700 | Mule | 25.10 | 13.72 | 1.63 | 4.57 |
| M (Mid) | 18021100 | Blue | 39.27 | 13.72 | 1.83 | 7.74 |
| M (Mid) | 31077500 | No-ta-she-bun | 96.36 | 13.72 | 2.28 | 6.65 |
| M (Mid) | 18020800 | Allen | 20.24 | 14.02 | 1.51 | 4.11 |
| M (Mid) | 18035800 | Bass | 46.96 | 14.32 | 1.83 | 5.06 |
| M (Mid) | 16002700 | McFarland | 155.47 | 14.93 | 2.36 | 5.26 |
| M (Mid) | 1005700 | Little Ball Bluff | 13.77 | 14.93 | 1.29 | 3.66 |
| MD (Nor) | 16061600 | Devils Elbow | 35.99 | 15.24 | 1.61 | 3.96 |
| MD (Nor) | 31019600 | Poplar | 39.27 | 15.24 | 1.64 | 3.96 |
| MD (Mid) | 31027800 | Barwise | 37.25 | 15.24 | 1.62 | 5.79 |
| MD (Nor) | 38071400 | Section Twelve | 17.41 | 15.85 | 1.29 | 5.49 |
| MD (Mid) | 18003000 | Barbour | 20.65 | 16.46 | 1.30 | 4.72 |
| MD (Nor) | 69033700 | Thumb | 21.05 | 16.76 | 1.28 | 3.35 |
| MD (Nor) | 69048000 | Beartrack | 68.26 | 16.76 | 1.71 | 4.02 |
| MD (Nor) | 38049100 | Vera | 99.19 | 16.76 | 1.88 | 5.26 |
| MD (Mid) | 31021800 | Shamrock | 23.89 | 16.76 | 1.32 | 4.57 |
| MD (Mid) | 11006900 | Bass | 86.23 | 16.76 | 1.82 | 5.33 |
| MD (Nor) | 69021300 | Toe | 67.21 | 17.37 | 1.65 | 4.57 |
| MD (Mid) | 31039900 | Little Wabana | 42.11 | 17.37 | 1.47 | 4.71 |
| MD (Nor) | 38050200 | Ashigan | 76.52 | 17.98 | 1.64 | 7.62 |
| MD (Mid) | 11048200 | May | 49.80 | 17.98 | 1.48 | 3.96 |
| MD (Nor) | 31091100 | Hamrey | 17.81 | 18.29 | 1.12 | 4.27 |
| MD (Nor) | 69076100 | Spring | 78.54 | 18.29 | 1.63 | 4.57 |
| MD (Nor) | 69034800 | Finger | 116.19 | 18.29 | 1.80 | 3.96 |
| MD (Mid) | 11046600 | Fifth | 18.46 | 18.29 | 1.13 | 4.95 |
| MD (Mid) | 31077800 | Little Too Much | 27.13 | 18.29 | 1.25 | 4.27 |
| MD (Mid) | 31046600 | Horseshoe | 51.42 | 18.29 | 1.46 | 4.27 |
| MD (Mid) | 31037300 | Hale | 57.49 | 18.29 | 1.51 | 4.77 |
| MD (Mid) | 31057500 | Little Bass | 62.75 | 18.90 | 1.49 | 4.77 |
| MD (Mid) | 56082900 | Pebble | 68.42 | 18.90 | 1.52 | 4.31 |
| MD (Mid) | 29023700 | Newman | 15.79 | 19.20 | 1.04 | 4.88 |
| MD (Mid) | 18039600 | Edna | 61.94 | 19.20 | 1.46 | 4.75 |
| MD (Mid) | 18036400 | Clear | 89.07 | 19.20 | 1.60 | 4.65 |
| MD (Nor) | 69047300 | Eugene | 67.21 | 19.51 | 1.47 | 3.35 |
| MD (Mid) | 18029800 | East Fox | 96.76 | 19.81 | 1.58 | 5.08 |
Notes: 1 M stands for medium-depth lakes (5 m < Hmax ≤ 15 m), MD for medium-deep lakes (15 m < Hmax ≤ 20 m); Nor for northern cisco lakes near International Falls; and Mid for mid-latitude cisco lakes near Duluth. 2 Each lake has a unique lake ID so that the lake can be identified under MN DNR LakeFinder database and web site: http://www.dnr.state.mn.us/lakefind/index.html.
References
- Frey, D.G. Distributional ecology of the cisco, Coregonus artedi, in Indiana. Investig. Indiana Lakes Streams 1955, 4, 177–228. [Google Scholar]
- Fry, E.F.J. The Effect of Environmental Factors on the Physiology of Fish; Academic Press: New York, NY, USA, 1971; Volume 6. [Google Scholar]
- Blumberg, A.F.; Di Toro, D.M. Effects of climate warming on dissolved oxygen concentrations in Lake Erie. Trans. Am. Fish. Soc. 1990, 119, 210–223. [Google Scholar] [CrossRef]
- Stefan, H.G.; Hondzo, M.; Fang, X.; Eaton, J.G.; McCormick, J.H. Simulated long-term temperature and dissolved oxygen characteristics of lakes in the north-central United States and associated fish habitat limits. Limnol. Oceanogr. 1996, 41, 1124–1135. [Google Scholar] [CrossRef]
- Fang, X.; Stefan, H.G. Projection of climate change effects on water temperature characteristics of small lakes in the contiguous U.S. Clim. Chang. 1999, 42, 377–412. [Google Scholar] [CrossRef]
- Fang, X.; Stefan, H.G. Projected climate change effects on winterkill in shallow lakes in the northern U.S. Environ. Manag. 2000, 25, 291–304. [Google Scholar] [CrossRef]
- Livingstone, D.M. Impact of secular climate change on the thermal structure of a large temperate central European lake. Clim. Chang. 2003, 57, 205–225. [Google Scholar] [CrossRef]
- Hamilton, D.P.; Schladow, S.G. Prediction of water quality in lakes and reservoirs. Part I—Model description. Ecol. Model. 1997, 96, 91–110. [Google Scholar] [CrossRef]
- Cole, T.M.; Wells, S.A. CE-QUAL-W2: A Two-Dimensional, Laterally Averaged, Hydrodynamic and Water Quality Model, Version 3.6 User Manual; Department of Civil and Environmental Engineering, Portland State University: Portland, OR, USA, 2010. [Google Scholar]
- Jiang, L.; Fang, X.; Stefan, H.G.; Jacobson, P.C.; Pereira, D.L. Identifying cisco refuge lakes in Minnesota under future climate scenarios using variable benchmark periods. Ecol. Model. 2012, 232, 14–27. [Google Scholar] [CrossRef]
- Jiang, L.; Fang, X. Simulations and validation of cisco lethal conditions in Minnesota lakes under past and future climate scenarios using constant survival limits. Water 2016, 8, 279. [Google Scholar] [CrossRef]
- Fang, X.; Jiang, L.; Jacobson, P.C.; Stefan, H.G.; Alam, S.R.; Pereira, D.L. Identifying cisco refuge lakes in Minnesota under future climate scenarios. Trans. Am. Fish. Soc. 2012, 141, 1608–1621. [Google Scholar] [CrossRef]
- Fang, X.; Jiang, L.; Jacobson, P.C.; Fang, N.Z. Simulation and validation of cisco habitat in Minnesota lakes using the lethal-niche-boundary curve. Br. J. Environ. Clim. Chang. 2014, 4, 444–470. [Google Scholar] [CrossRef] [PubMed]
- Benyahya, L.; Caissie, D.; St-Hilaire, A.; Ouarda, T.B.; Bobée, B. A review of statistical water temperature models. Can. Water Resour. J. 2007, 32, 179–192. [Google Scholar] [CrossRef]
- Imberger, J.; Patterson, J.C. A dynamic reservoir simulation model—DYRESM. In Transport Models for Inland and Coastal Waters; Fischer, H.B., Ed.; Academic Press: New York, NY, USA, 1981; Chapter 9; p. 483. [Google Scholar]
- Ambrose, R.; Wool, T.; Martin, J. WASP 5, The Water Quality Analysis Simulation Program Version 5.00; AscI Corporation: Athens, GA, USA, 1993. [Google Scholar]
- Craig, P.M. User's Manual for EFDC_Explorer 7: A Pre/Post Processor for the Environmental Fluid Dynamics Code; Dynamic Solutions-International, LLC: Edmonds, WA, USA, 2012. [Google Scholar]
- Fang, X.; Stefan, H.G. Development and Validation of the Water Quality Model MINLAKE96 with Winter Data; St. Anthony Falls Laboratory, University of Minnesota: Minneapolis, MN, USA, 1996. [Google Scholar]
- Fang, X.; Alam, S.R.; Jacobson, P.; Pereira, D.; Stefan, H.G. Simulations of Water Quality in Cisco Lakes in Minnesota; St. Anthony Falls Laboratory, University of Minnesota: Minneapolis, MN, USA, 2010. [Google Scholar]
- Thiery, W.; Stepanenko, V.M.; Fang, X.; Jöhnk, K.D.; Li, Z.; Martynov, A.; Perroud, M.; Subin, Z.M.; Darchambeau, F.; Mironov, D.; et al. LakeMIP Kivu: Evaluating the representation of a large, deep tropical lake by a set of one-dimensional lake models. Tellus A 2014, 2014, 21390. [Google Scholar] [CrossRef] [Green Version]
- Cahn, A.R. An ecological study of southern Wisconsin fishes, the brook silverside and the cisco, in their relation to the region. Ill. Biol. Monogr. 1927, 11, 1–151. [Google Scholar]
- Jacobson, P.C.; Jones, T.S.; Rivers, P.; Pereira, D.L. Field estimation of a lethal oxythermal niche boundary for adult ciscoes in Minnesota lakes. Trans. Am. Fish. Soc. 2008, 137, 1464–1474. [Google Scholar] [CrossRef]
- Jacobson, P.C.; Fang, X.; Stefan, H.G.; Pereira, D.L. Protecting cisco (Coregonus Artedi Lesueur) oxythermal habitat from climate change: Building resilience in deep lakes using a landscape approach. Adv. Limnol. 2013, 64, 323–332. [Google Scholar] [CrossRef]
- Ramstack, J.M.; Fritz, S.C.; Engstrom, D.R. Twentieth century water quality trends in Minnesota lakes compared with presettlement variability. Can. J. Fish. Aquat. Sci. 2004, 261, 561–576. [Google Scholar] [CrossRef]
- Jacobson, P.C.; Stefan, H.G.; Pereira, D.L. Coldwater fish oxythermal habitat in Minnesota lakes: Influence of total phosphorus, July air temperature, and relative depth. Can. J. Fish. Aquat. Sci. 2010, 67, 2003–2013. [Google Scholar]
- Hasumi, H.; Emori, S. K-1 Coupled GCM (MIROC) Description; Center for Climate System Research, University of Tokyo: Tokyo, Japan, 2004; p. 34. [Google Scholar]
- Kim, S.-J.; Flato, G.M.; Boer, G.J.; McFarlane, N.A. A coupled climate model simulation of the last glacial maximum, Part 1: Transient multi-decadal response. Clim. Dyn. 2002, 19, 515–537. [Google Scholar]
- Kim, S.-J.; Flato, G.M.; Boer, G.J. A coupled climate model simulation of the last glacial maximum, Part 2: Approach to equilibrium. Clim. Dyn. 2003, 20, 635–661. [Google Scholar]
- Fang, X.; Stefan, H.G. Simulations of climate effects on water temperature, dissolved oxygen, and ice and snow covers in lakes of the contiguous United States under past and future climate scenarios. Limnol. Oceangr. 2009, 54, 2359–2370. [Google Scholar] [CrossRef]
- USEPA. The Relationships of Phosphorus and Nitrogen to the Trophic State of Northeast and North-Central Lakes and Reservoirs; National Eutrophic Survey Working Paper No. 23; U.S. Environmental Protection Agency (USEPA): Washington, DC, USA, 1974.
- Stefan, H.G.; Hondzo, M.; Fang, X. Lake water quality modeling for projected future climate scenarios. J. Environ. Qual. 1993, 22, 417–431. [Google Scholar] [CrossRef]
- Gorham, E.; Boyce, F.M. Influence of lake surface area and depth upon thermal stratification and the depth of the summer thermocline. J. Gt. Lakes Res. 1989, 15, 233–245. [Google Scholar] [CrossRef]
- Chapra, S.C. Surface Water-Quality Modeling; McGraw-Hill: New York, NY, USA, 1997; p. 844. [Google Scholar]
- Sharma, S.; Zanden, M.J.V.; Magnuson, J.J.; Lyons, J. Comparing climate change and species invasions as drivers of coldwater fish population extirpations. PLoS ONE 2011, 6, e22906. [Google Scholar] [CrossRef] [PubMed]
- Stefan, H.G.; Fang, X. Dissolved oxygen model for regional lake analysis. Ecol. Model. 1994, 71, 37–68. [Google Scholar] [CrossRef]
Figure 1.
Conceptual flowchart of steps for the study to reclassify 620 cisco lakes into refuge lakes using AvgATDO3VB derived from 82 virtual lakes: 12 shallow, 16 medium-depth, 24 medium-deep, and 30 deep virtual lakes (Table 1).
Figure 1.
Conceptual flowchart of steps for the study to reclassify 620 cisco lakes into refuge lakes using AvgATDO3VB derived from 82 virtual lakes: 12 shallow, 16 medium-depth, 24 medium-deep, and 30 deep virtual lakes (Table 1).

Figure 2.
Geographic distribution of 620 cisco lakes grouped by latitude and maximum depth, three weather stations (International Falls, Duluth, and St. Cloud) and associated grid center points of future climate scenarios (CGCM3.1 and MIROC 3.2, Table 1) used for model simulations.
Figure 2.
Geographic distribution of 620 cisco lakes grouped by latitude and maximum depth, three weather stations (International Falls, Duluth, and St. Cloud) and associated grid center points of future climate scenarios (CGCM3.1 and MIROC 3.2, Table 1) used for model simulations.
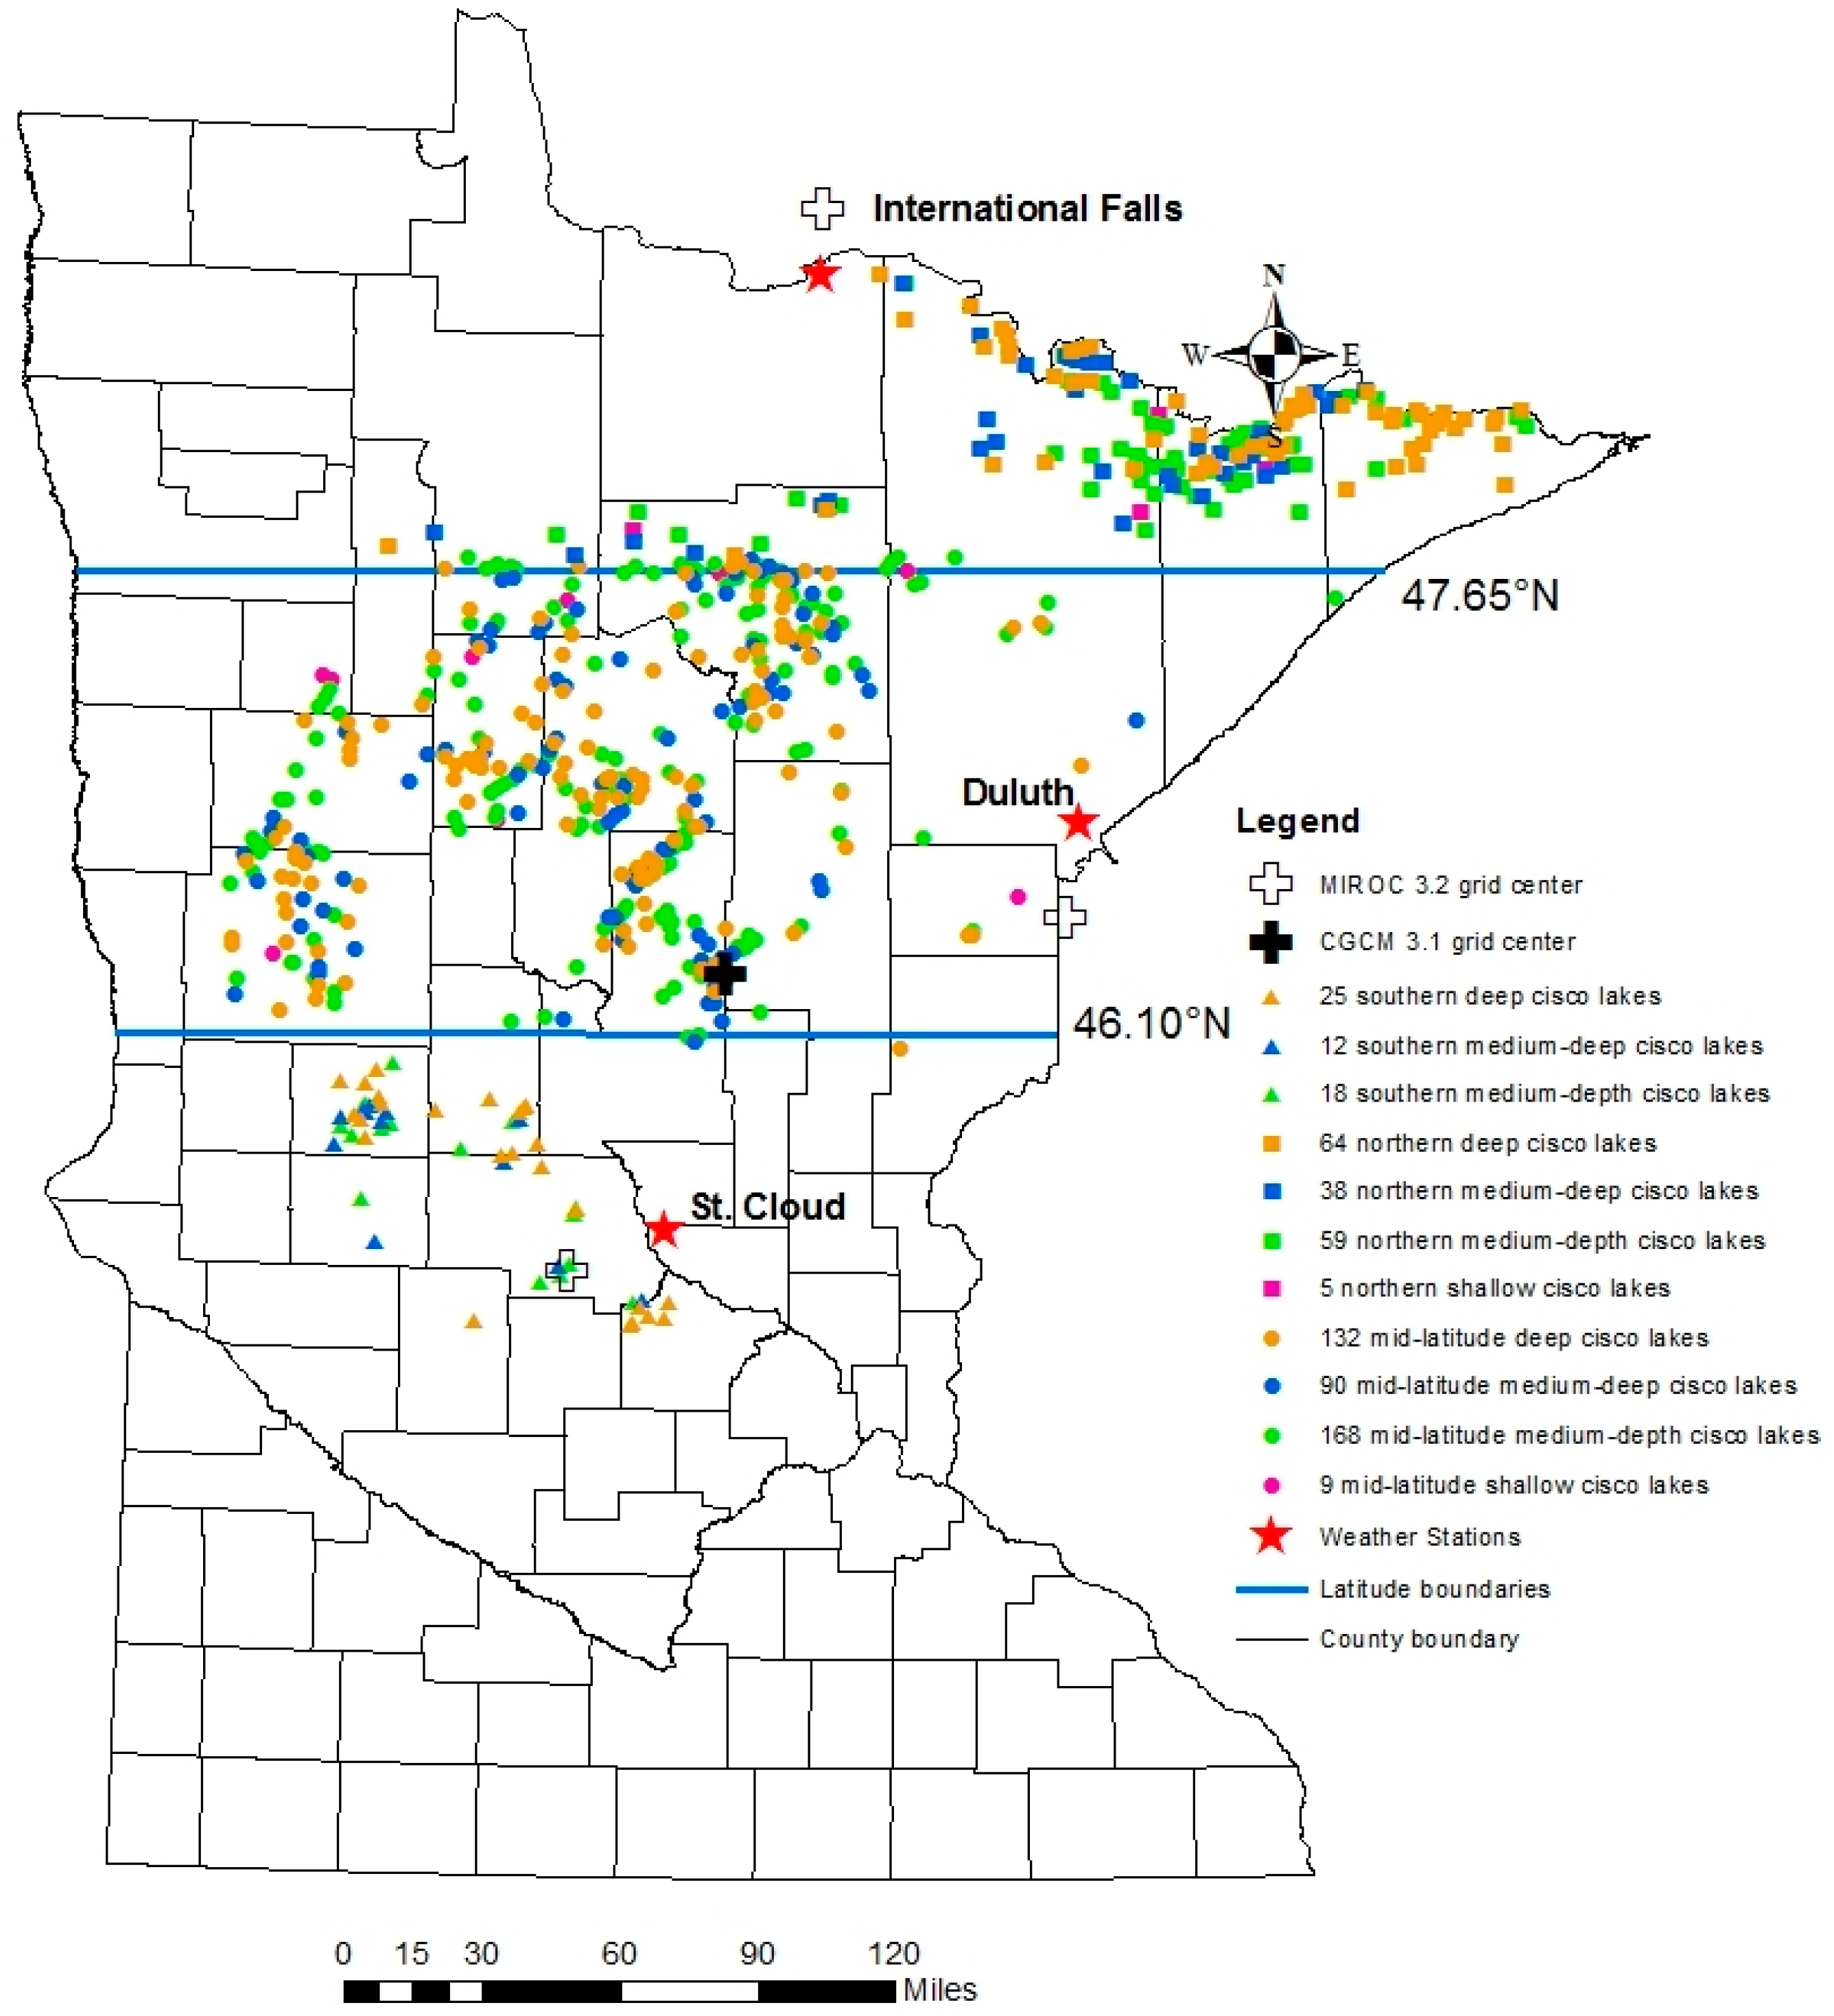
Figure 3.
Observed and simulated temperature and dissolved oxygen profiles in Andrusia Lake for (a) 28 July 2006 and (b) MIROC 3.2 with calculated TDO3 equal to 24.1 °C and 27.6 °C, respectively. The depth is from the lake surface.
Figure 3.
Observed and simulated temperature and dissolved oxygen profiles in Andrusia Lake for (a) 28 July 2006 and (b) MIROC 3.2 with calculated TDO3 equal to 24.1 °C and 27.6 °C, respectively. The depth is from the lake surface.
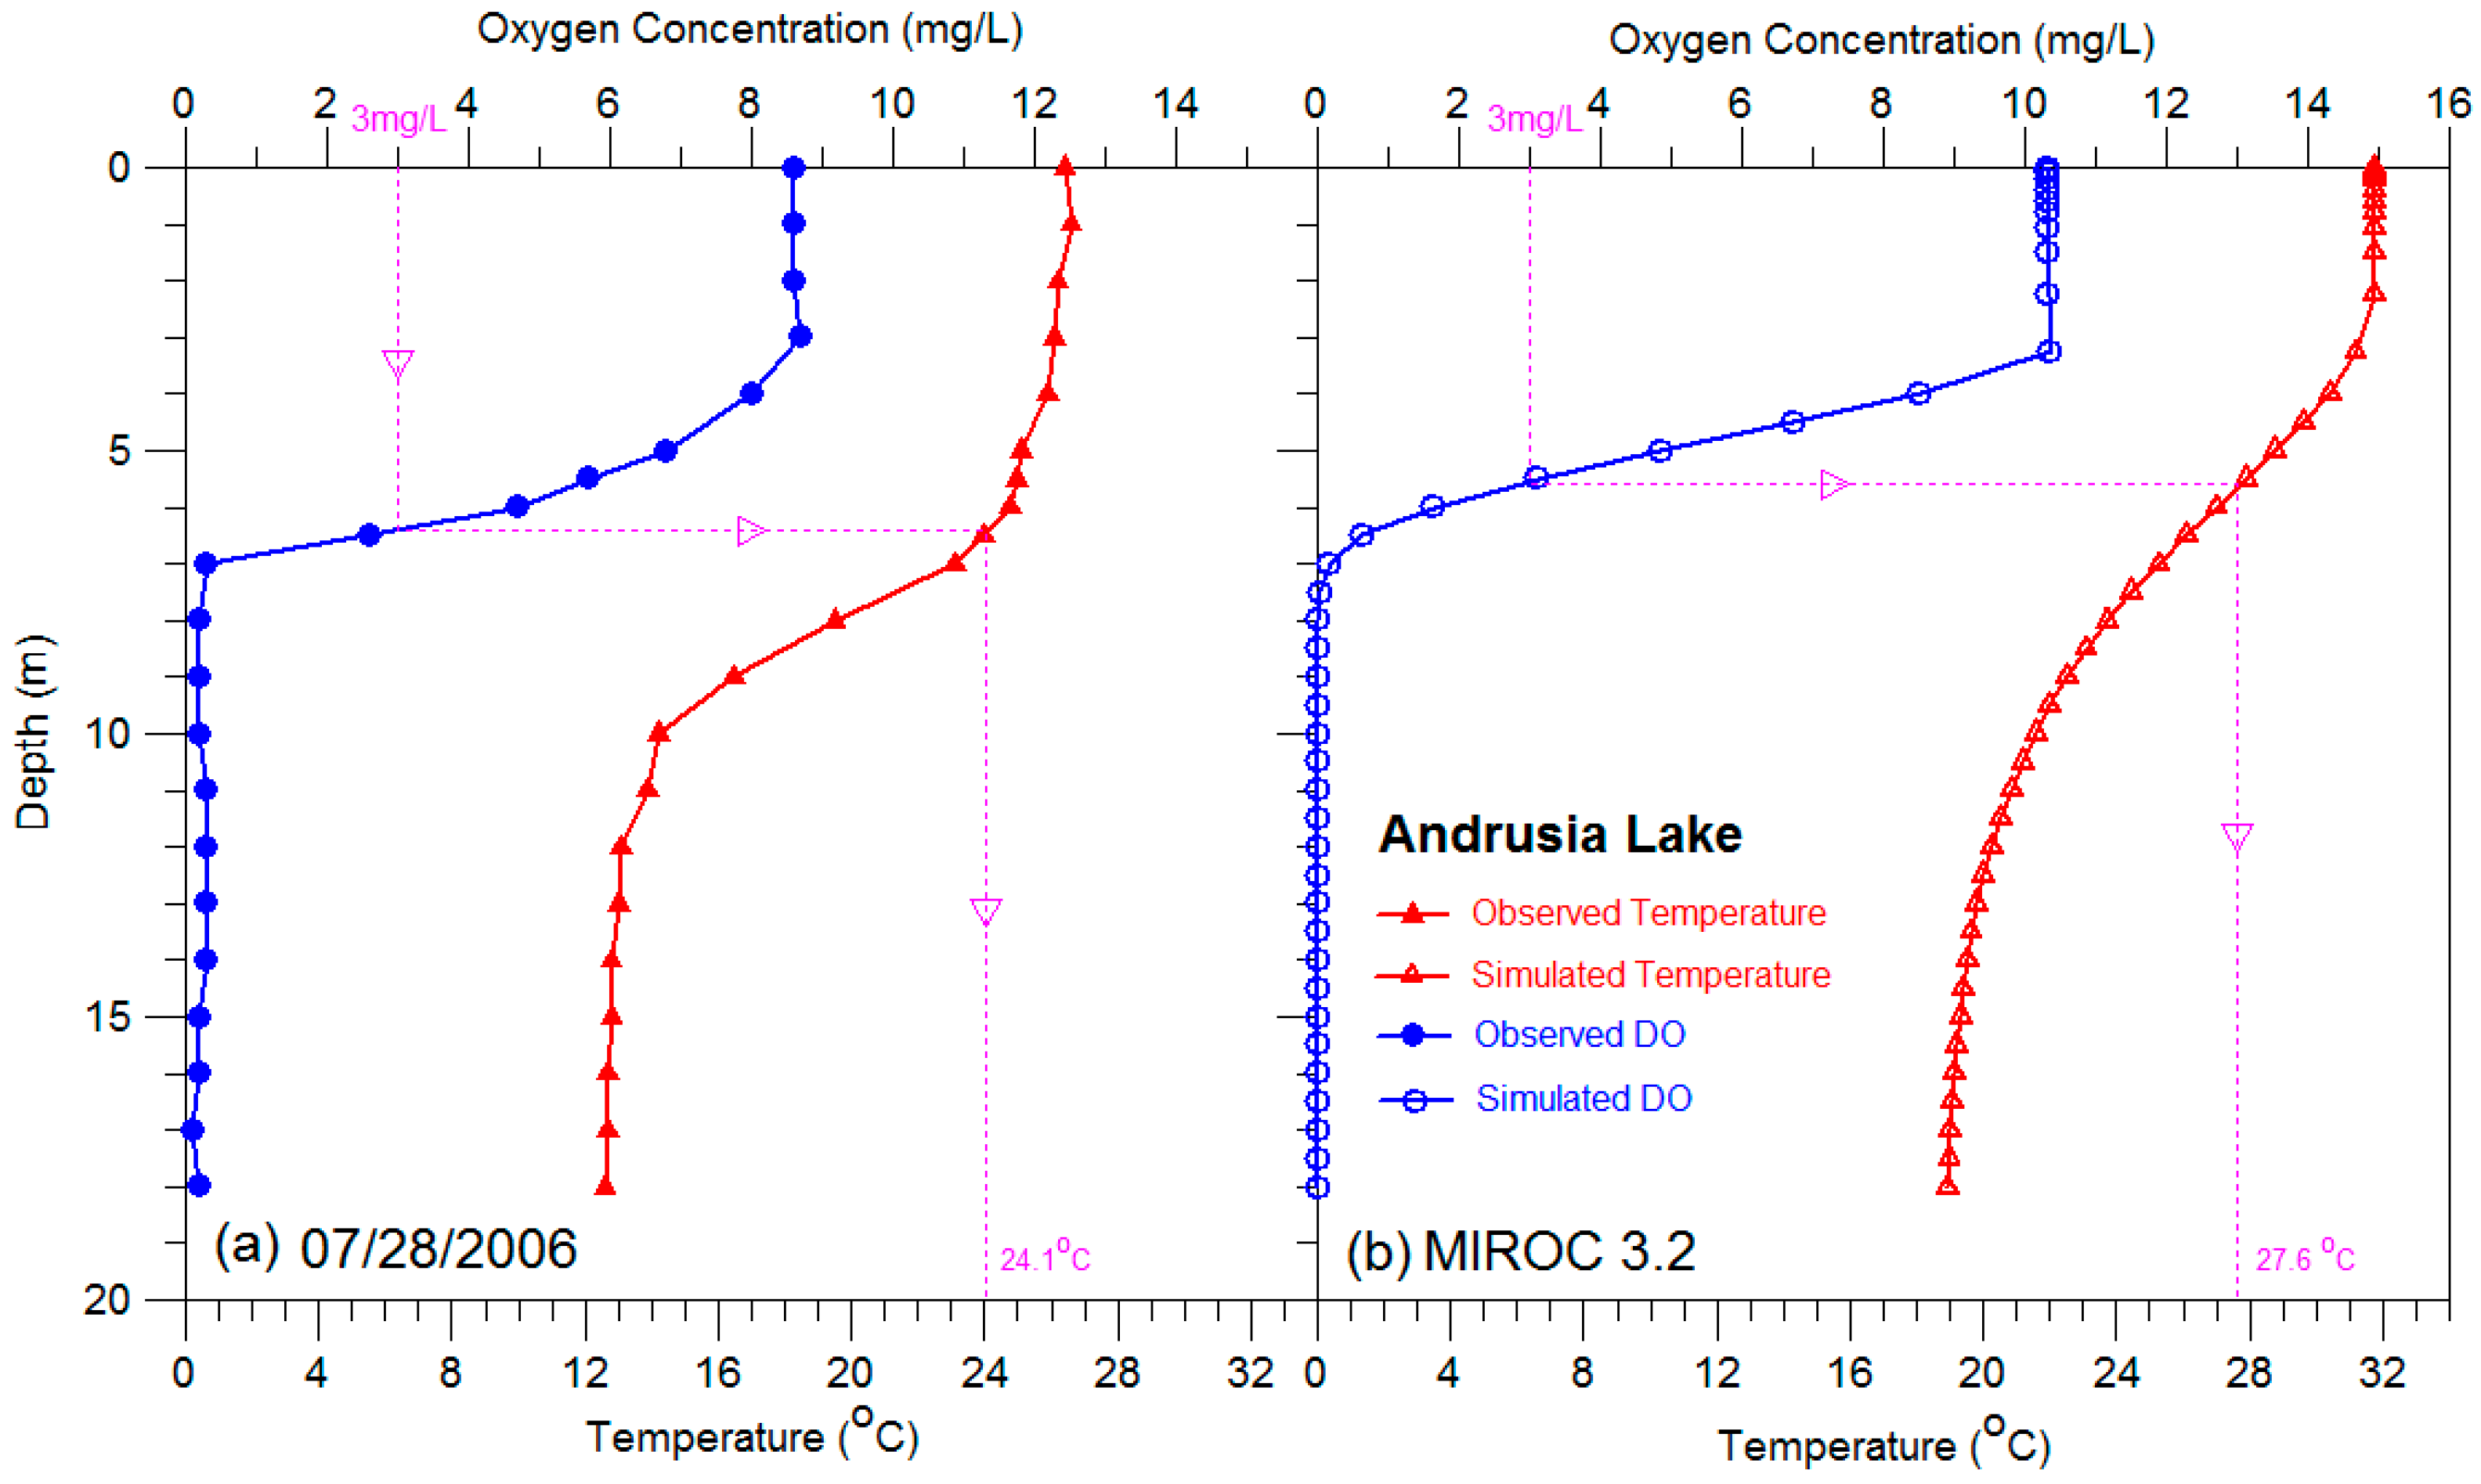
Figure 4.
Contour plots of a total number of years with cisco kill under future MIROC3.2 climate scenario from Jiang and Fang’s study [11]. Duluth weather data were used for model simulations, and contours were derived by interpolation from simulated points for (a) 12 shallow and 16 medium-depth virtual lakes, and (b) 30 deep virtual lakes. The 11 and 17 °C contours of AvgATDO3VB from Jiang et al. [10] are included. The simulation results in the first year 1961 were not used to extract TDO3 to avoid possible effects of initial conditions used in MINLAKE2010.

Figure 5.
(a) Time series of simulated daily TDO3 for LakeM07 in 2006 with dashed lines of ATDO3VB; (b) time series of ATDO3VB in LakeM07 with dashed lines of AvgATDO3VB for the past (1962–2008) and two future climate scenarios; (c) time series of simulated daily TDO3 for LakeC12, LakeM07, and LakeR11 in 2006 with dashed lines of ATDO3VB; and (d) time series of ATDO3VB in LakeC12, LakeM07, and LakeR11 with dashed lines of AvgATDO3VB for the past climate (1962–2008). The weather station used for simulations is Duluth.

Figure 6.
Distribution of: (a) 14 shallow-depth lakes; (b) 245 medium-depth lakes; (c) 140 medium-deep lakes; and (c) 221 deep lakes of 620 cisco lakes in Minnesota including: (a) 12 shallow virtual lakes; (b) 16 medium-depth virtual lakes; (c) 24 medium-deep virtual lakes; and (d) 30 deep virtual lakes plotted using Secchi depth and lake geometry ratio as independent variables.
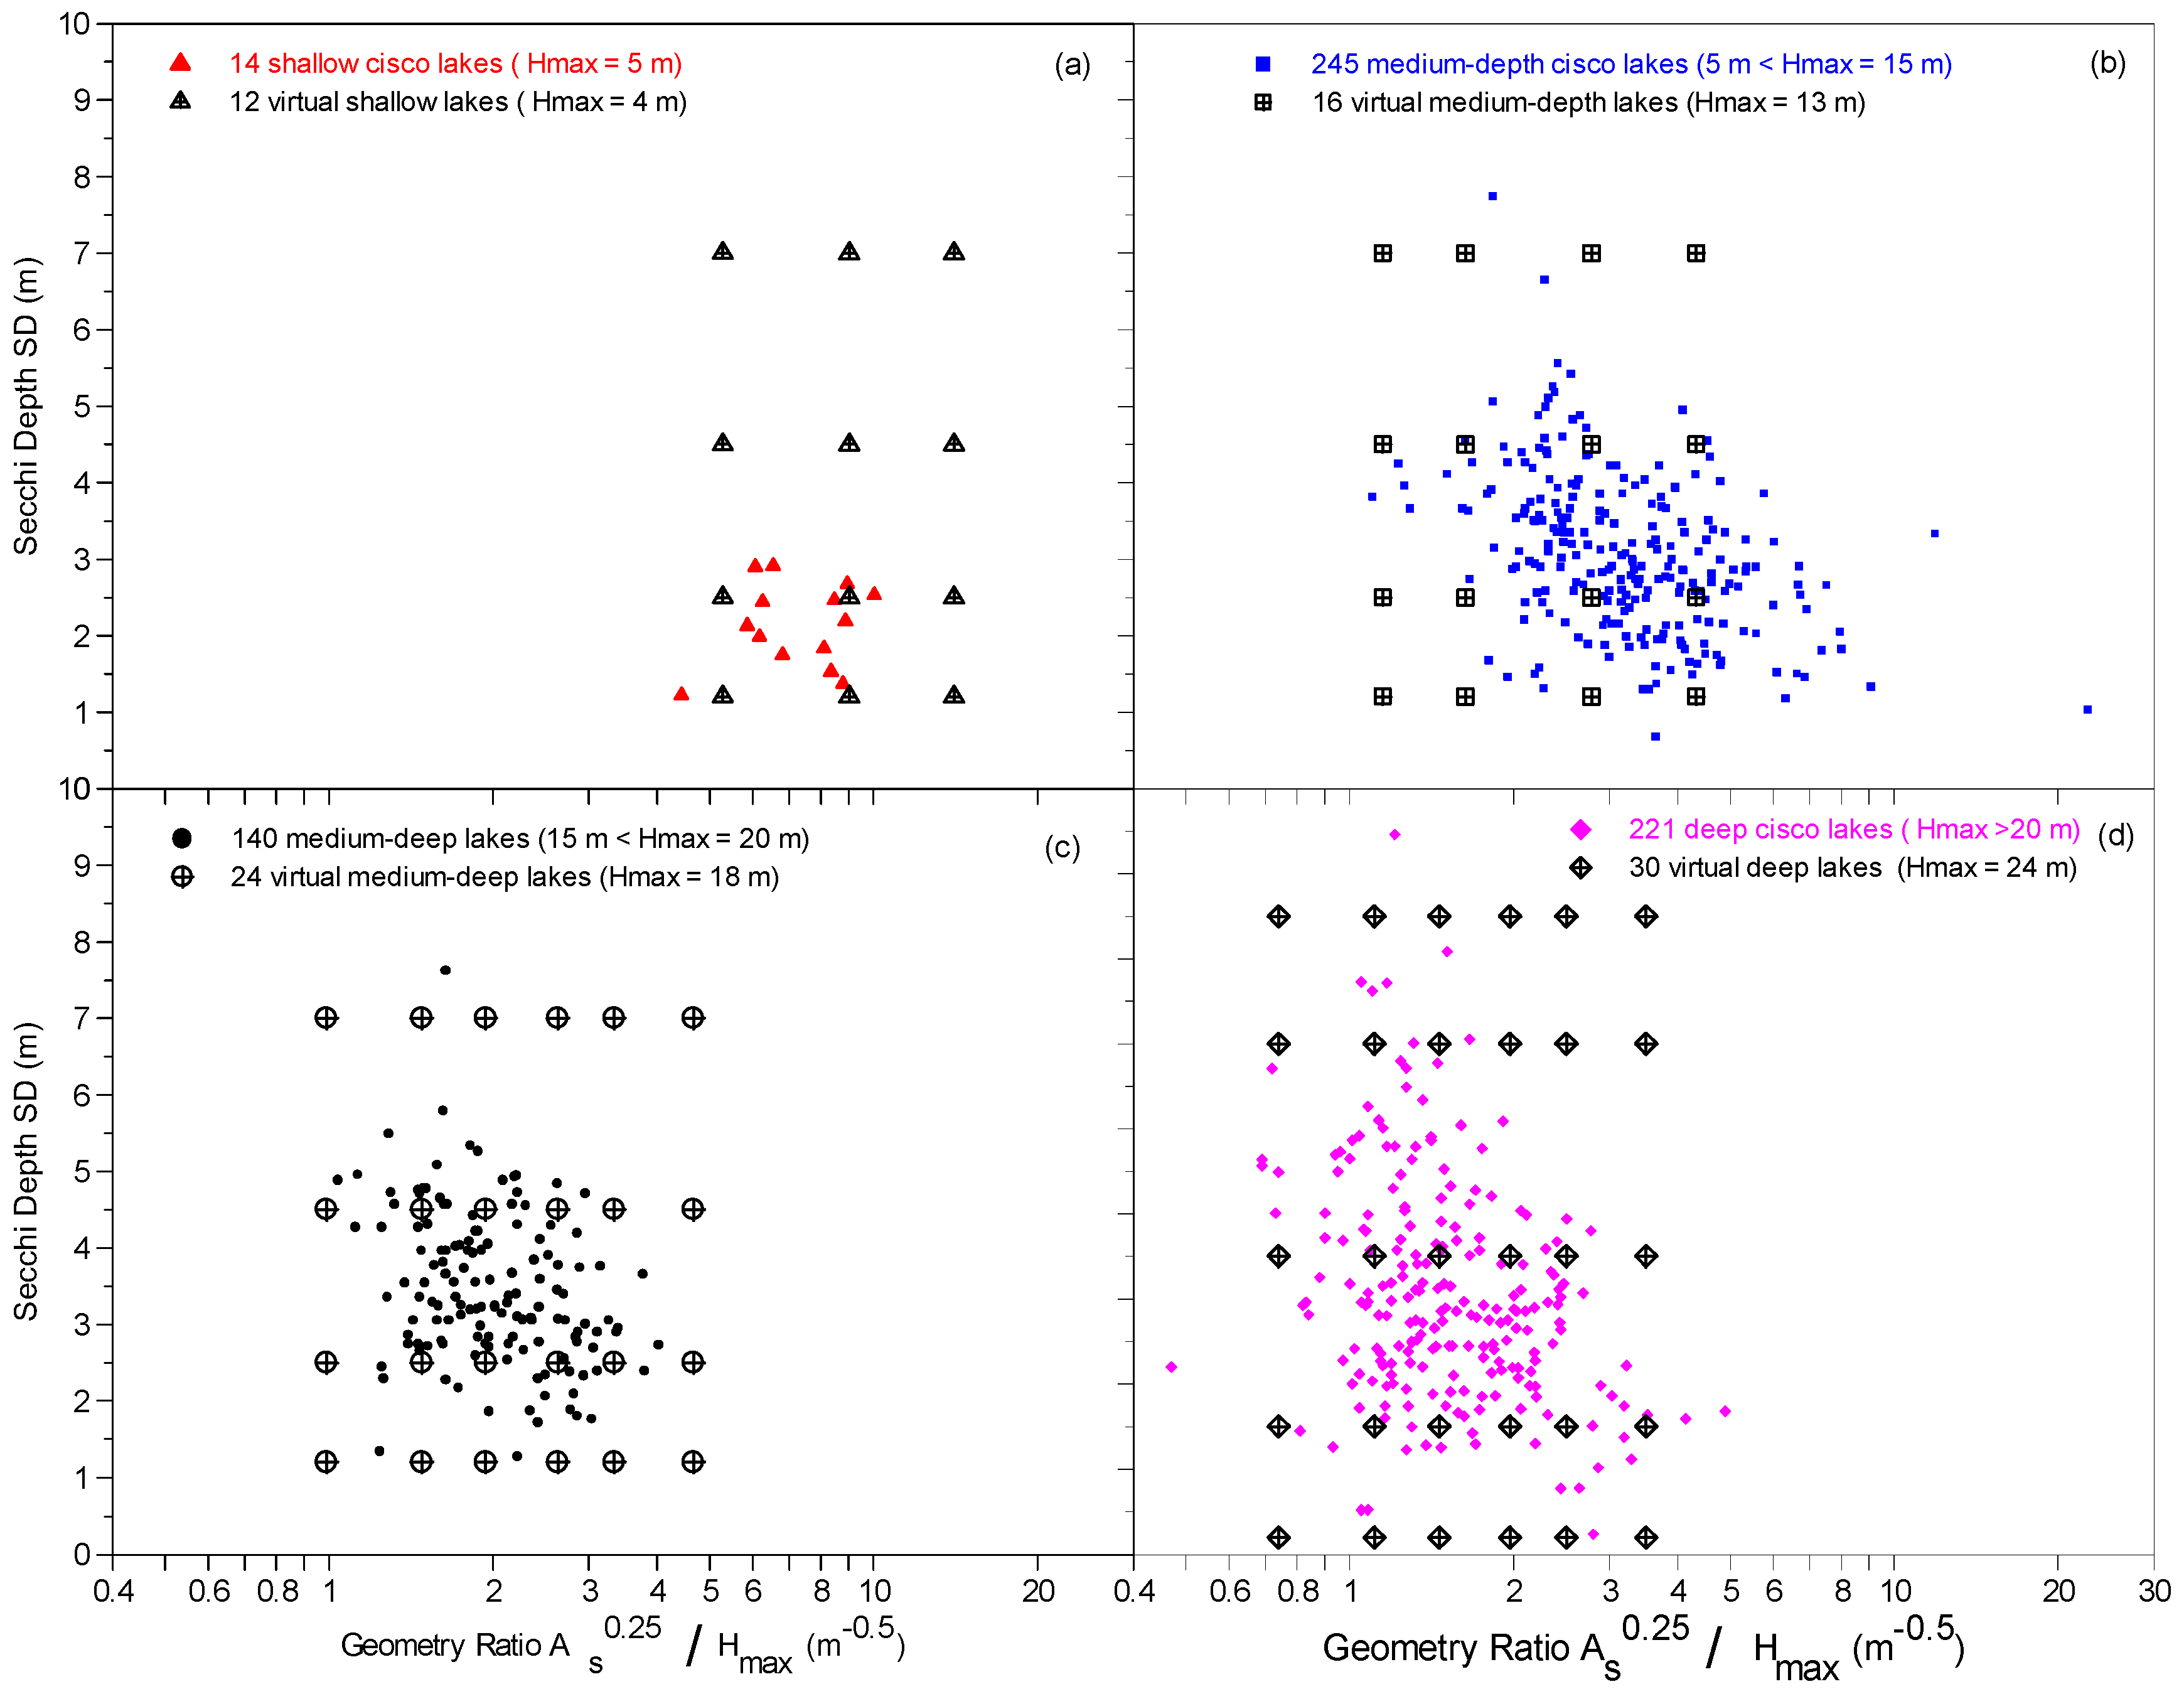
Figure 7.
Time series of the beginning dates of the VB periods for ATDO3VB in four types of virtual lakes (a) LakeR02, (b) LakeR17, (c) LakeM27, and (d) LakeC27 under the past climate conditions and MIROC 3.2 future climate scenario.
Figure 7.
Time series of the beginning dates of the VB periods for ATDO3VB in four types of virtual lakes (a) LakeR02, (b) LakeR17, (c) LakeM27, and (d) LakeC27 under the past climate conditions and MIROC 3.2 future climate scenario.
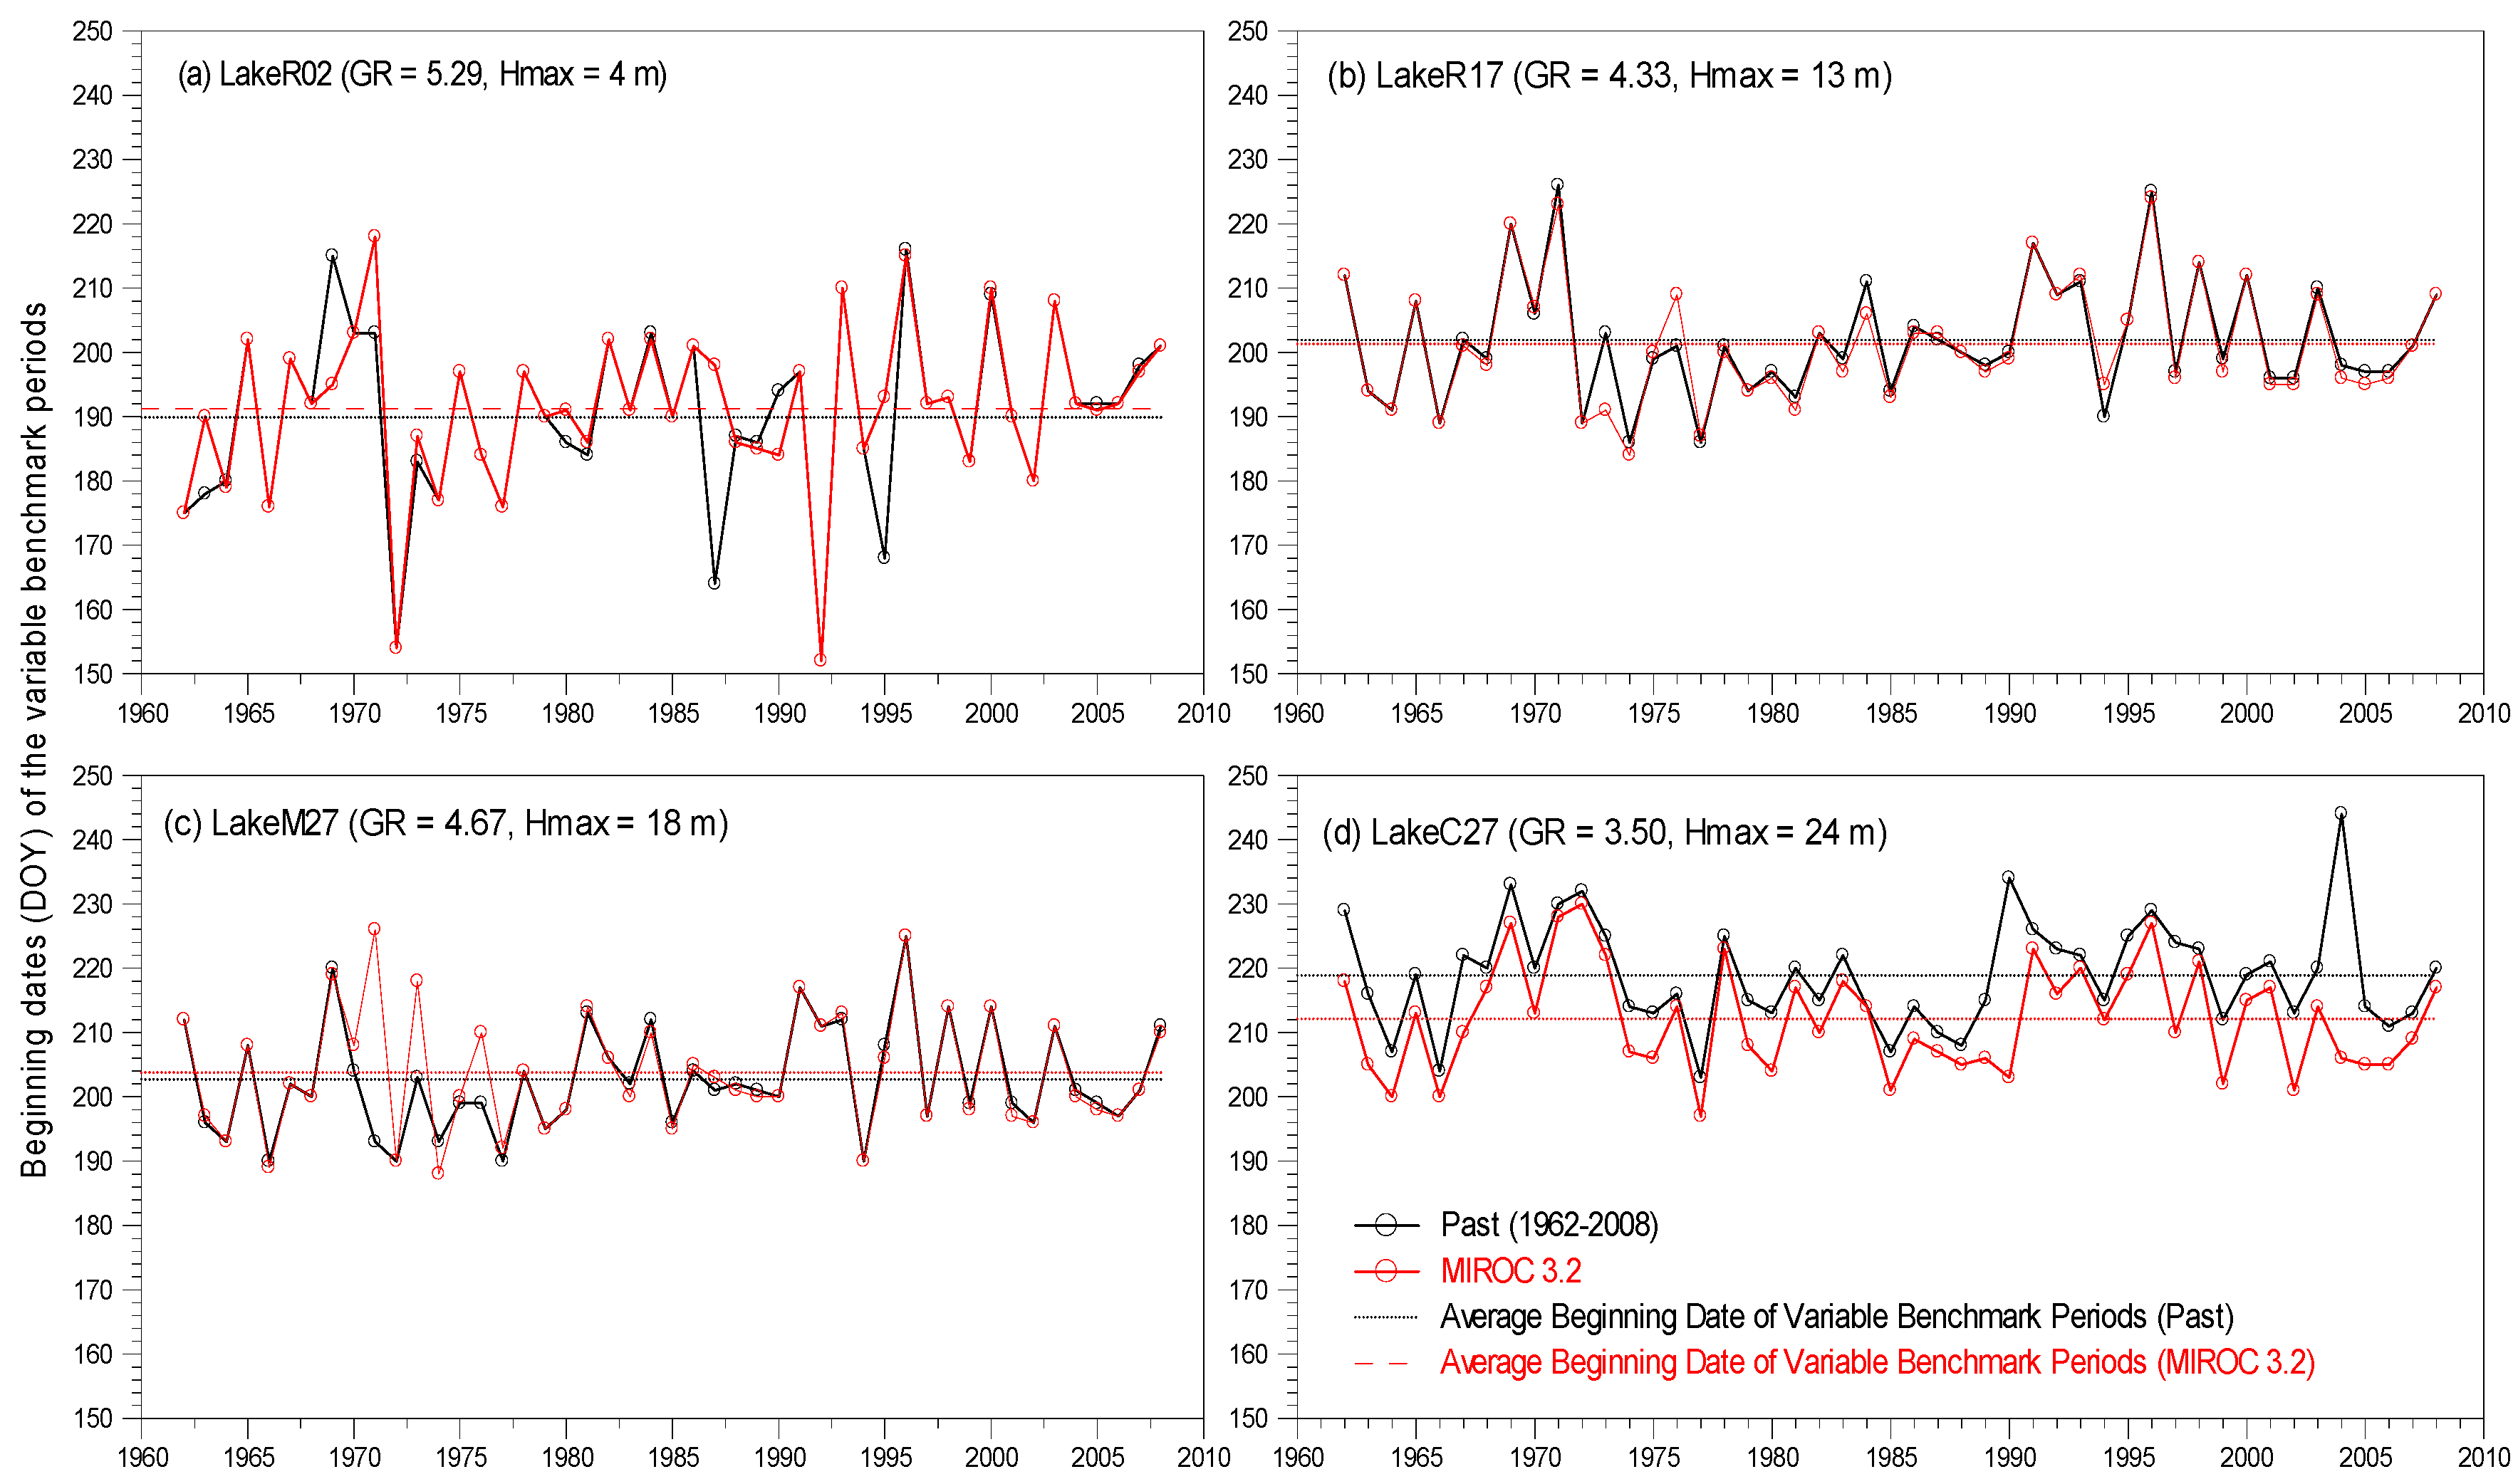
Figure 8.
Contour plots of multiyear averages of the highest mean daily TDO3 over variable benchmark periods (i.e., AvgATDO3VB) under MIROC 3.2 future climate scenario. (a) International Falls, (b) Duluth, and (c) St. Cloud weather data were used for the model simulations. Contours were derived by interpolation from simulated points for 24 medium-deep virtual lakes.
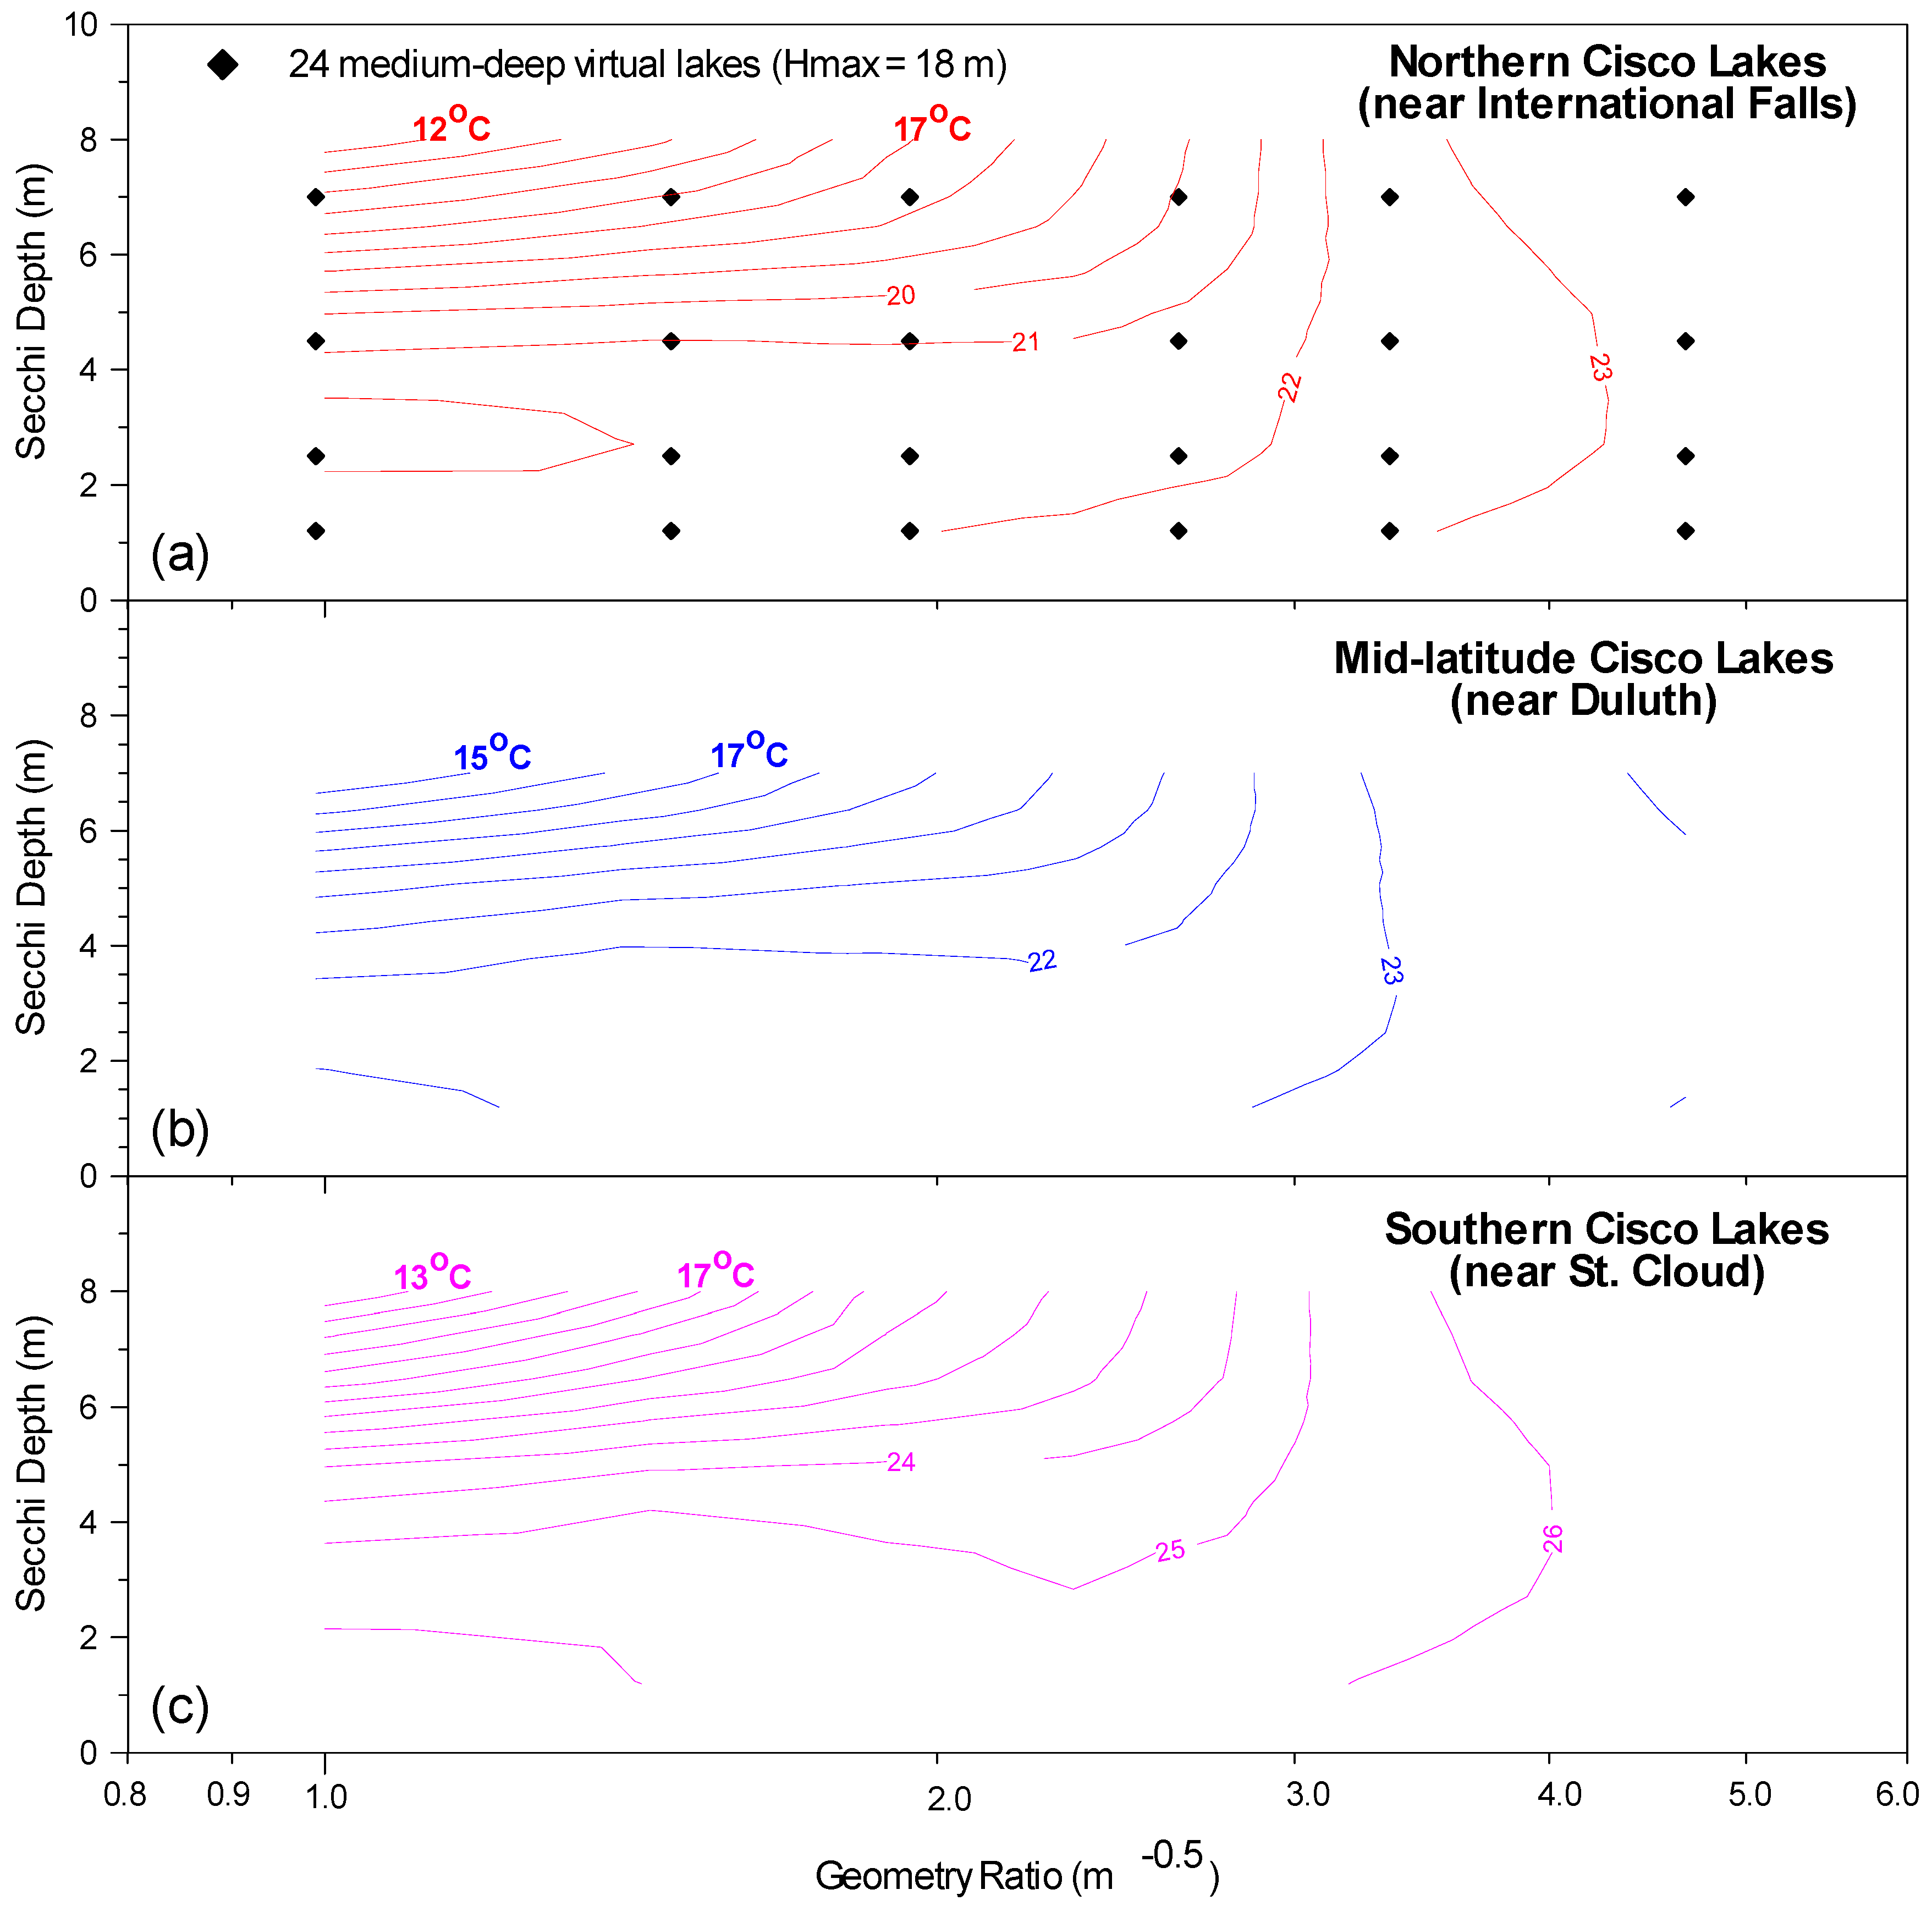
Figure 9.
Mean (points), maximum and minimum values of AvgATDO3VB for different trophic status (Secchi depths) for the four types of mid-latitude virtual lakes (near Duluth) versus lake geometry ratio under (a) the MIROC 3.2 future and (b) past climate scenarios.
Figure 9.
Mean (points), maximum and minimum values of AvgATDO3VB for different trophic status (Secchi depths) for the four types of mid-latitude virtual lakes (near Duluth) versus lake geometry ratio under (a) the MIROC 3.2 future and (b) past climate scenarios.

Figure 10.
Distribution of Tier 1 and Tier 2 refuge lakes, and Tier 3 non-refuge lakes out of 140 medium-deep cisco lakes using Secchi depth and lake geometry ratio as axes. The boundary contour lines of AvgATDO3VB were derived from variable benchmark periods simulated for: the 24 medium-deep virtual lakes (a–c); and the 30 deep virtual lakes (d–f), under MIROC 3.2 future climate scenario. International Falls (a,d), Duluth (b,e), and St. Cloud (c,f) weather data were used for the model simulations.

Figure 11.
Distribution of Tier 1 and Tier 2 refuge lakes, and Tier 3 non-refuge lakes out of 221 deep cisco lakes using Secchi depth and lake geometry ratio as axes. The boundary contour lines of AvgATDO3VB were derived for variable benchmark periods simulated for the 30 deep virtual lakes under MIROC 3.2 future climate scenario. (a) International Falls; (b) Duluth; and (c) St. Cloud weather data were used for the model simulations.

Table 1.
Abbreviations of symbols and terms used in the paper.
| Abbreviation | Description |
|---|---|
| T | Water temperature (°C) |
| DO | Dissolved oxygen (mg/L) |
| TDO3 | Water temperature where DO equals to 3 mg/L |
| CGCM 3.1 | Coupled General Circulation Model (CGCM) of the earth’s atmosphere and oceans developed by the Canadian Centre for Climate Modeling and Analysis (version 3.1) |
| MIROC 3.2 | The Model for Interdisciplinary Research on Climate (MIROC), a CGCM developed by several Japanese agencies (version 3.2, see the Section 2.1) |
| VB | 31-day variable benchmark period (may vary by lake and by year) when ATDO3 is the highest |
| FB | 31-day fixed bench mark period |
| ATDO3 | Average daily TDO3 over 31-day benchmark period in a simulation year |
| ATDO3FB | Average daily TDO3 over the 31-day fixed benchmark period |
| ATDO3VB | Average daily TDO3 over the 31-day variable benchmark period |
| AvgATDO3 | Multiyear average of ATDO3 over a simulation period |
| AvgATDO3FB | Multiyear average of ATDO3FB over a simulation period (e.g., 1961–2008) |
| AvgATDO3VB | Multiyear average of ATDO3FB over a simulation period |
| AS | Lake surface area (m2 or km2) |
| Hmax | Lake maximum depth (m) |
| GR | Lake geometry ratio = As0.25/Hmax (m−0.5) |
| SD | Lake Secchi depth (m) |
| NSE | Nash–Sutcliff model efficiency |
| RMSE | Root-mean-square errors |
| DOY | Julian day, day of year |
| T1 | Tier 1 refuge lakes (AvgATDO3 < 11 °C) |
| T2 | Tier 2 refuge lakes (11 °C ≤ AvgATDO3 ≤ 17 °C) |
| T3 | Tier 3 non-refuge lakes (AvgATDO3 > 17 °C) |
| Northern cisco lakes | Cisco lakes by latitude near International Falls weather station (Figure 2) |
| Mid-latitude cisco lakes | Cisco lakes by latitude near Duluth weather station (Figure 2) |
| Southern cisco lakes | Cisco lakes by latitude near St. Cloud weather station (Figure 2) |
| Shallow virtual lakes | 12 lakes with maximum depth equal to 4 m [11] |
| Medium-depth virtual lakes | 16 lakes with maximum depth equal to 13 m [11] |
| Medium-deep virtual lakes | 24 lakes with maximum depth equal to 18 m (Table 2) |
| Deep virtual lakes | 30 lakes with maximum depth equal to 24 m [10] |
| 82 virtual lakes | 12 shallow, 16 medium-depth, 24 medium-deep, and 30 deep virtual lakes |
Table 2.
Morphometric characteristics and “names” of the 24 medium-deep virtual lakes simulated with the MINLAKE2012 model (maximum lake depth Hmax = 18 m).
Table 2.
Morphometric characteristics and “names” of the 24 medium-deep virtual lakes simulated with the MINLAKE2012 model (maximum lake depth Hmax = 18 m).
| Surface Area AS (km2) | Secchi Depth SD (m) | Geometry Ratio GR = As0.25/Hmax (m−0.5) | |||
|---|---|---|---|---|---|
| 1.2 1 | 2.5 2 | 4.5 3 | 7.0 3 | ||
| 0.1 | LakeM01 | LakeM02 | LakeM03 | LakeM04 | 0.99 |
| 0.5 | LakeM06 | LakeM07 | LakeM08 | LakeM09 | 1.48 |
| 1.5 | LakeM11 | LakeM12 | LakeM13 | LakeM14 | 1.94 |
| 5.0 | LakeM16 | LakeM17 | LakeM18 | LakeM19 | 2.63 |
| 13.0 | LakeM21 | LakeM22 | LakeM23 | LakeM24 | 3.34 |
| 50.0 | LakeM26 | LakeM27 | LakeM28 | LakeM29 | 4.67 |
Notes: 1 eutrophic lakes; 2 mesotrophic lakes; and 3 oligotrophic lakes.
Table 3.
620 cisco lakes in Minnesota, grouped by three weather stations (Duluth, International Falls, and St. Cloud) and lake maximum depth in four categories: shallow cisco lakes (Hmax ≤ 5 m), medium-depth cisco lakes (5 m < Hmax ≤ 15 m), medium-deep cisco lakes (15 m < Hmax ≤ 20 m) and deep cisco lakes (Hmax > 20 m).
| Shallow Cisco Lakes | Medium-Depth Cisco Lakes | Medium-Deep Cisco Lakes | Deep Cisco Lakes | Total Cisco Lakes | |
|---|---|---|---|---|---|
| International Falls | 5 | 59 | 38 | 64 | 166 |
| Duluth | 9 | 168 | 90 | 132 | 399 |
| St. Cloud | 0 | 18 | 12 | 25 | 55 |
| Total | 14 | 245 | 140 | 221 | 620 |
Table 4.
Statistics of AvgATDO3VB (°C) under the past climate conditions (1962–2008) and the future climate scenarios CGCM 3.1 and MIROC 3.2 for the 12 shallow and 16 medium-depth virtual lakes. Simulations and analysis were made with weather data input from weather stations in International Falls, Duluth, and St. Cloud.
| 12 Shallow Virtual Lakes | International Falls (Northern) | Duluth (Mid-Latitude) | St. Cloud (Southern) | ||||||
|---|---|---|---|---|---|---|---|---|---|
| PAST | CGCM | MIROC | PAST | CGCM | MIROC | PAST | CGCM | MIROC | |
| Maximum | 22.74 | 25.70 | 25.75 | 22.00 | 24.70 | 25.35 | 24.98 | 27.38 | 27.91 |
| Minimum | 21.40 | 24.28 | 24.21 | 20.69 | 23.56 | 24.33 | 23.81 | 26.17 | 26.18 |
| Mean | 22.34 | 25.29 | 25.32 | 21.65 | 24.41 | 25.05 | 24.59 | 27.03 | 27.45 |
| STDEV 1 | 0.48 | 0.49 | 0.54 | 0.44 | 0.37 | 0.36 | 0.41 | 0.43 | 0.65 |
| 16 Medium-Depth Virtual Lakes | |||||||||
| Maximum | 21.41 | 24.36 | 24.49 | 20.92 | 23.66 | 24.27 | 23.65 | 26.17 | 26.71 |
| Minimum | 20.07 | 23.22 | 23.52 | 19.26 | 22.33 | 23.09 | 22.48 | 25.18 | 25.83 |
| Mean | 20.55 | 23.70 | 23.88 | 19.86 | 22.82 | 23.54 | 22.92 | 25.58 | 26.23 |
| STDEV | 0.37 | 0.31 | 0.28 | 0.45 | 0.36 | 0.32 | 0.33 | 0.28 | 0.25 |
Note: 1 STDEV stands for standard deviation.
Table 5.
Statistics of AvgATDO3VB (°C) under the past climate conditions (1962–2008) and the future climate scenarios CGCM 3.1 and MIROC 3.2 for the 24 medium-deep virtual lakes. Simulations and analysis were made with weather data input from weather stations in International Falls, Duluth, and St. Cloud.
| International Falls (Northern) | Duluth (Mid-Latitude) | St. Cloud (Southern) | |||||||
|---|---|---|---|---|---|---|---|---|---|
| PAST | CGCM | MIROC | PAST | CGCM | MIROC | PAST | CGCM | MIROC | |
| Maximum | 21.34 | 24.26 | 24.40 | 20.85 | 23.57 | 24.19 | 23.53 | 26.09 | 26.72 |
| Minimum | 12.75 | 13.98 | 14.44 | 12.19 | 13.07 | 14.03 | 13.92 | 14.52 | 15.64 |
| Mean | 18.56 | 21.53 | 22.01 | 18.07 | 21.12 | 21.81 | 20.96 | 23.79 | 24.48 |
| STDEV | 2.20 | 2.65 | 2.44 | 2.14 | 2.38 | 2.36 | 2.37 | 2.65 | 2.53 |
Table 6.
Oxythermal stress parameters in 18 cisco lakes in Minnesota for the validation of the refuge lake reclassification method.
Table 6.
Oxythermal stress parameters in 18 cisco lakes in Minnesota for the validation of the refuge lake reclassification method.
| (1) | (2) | (3) | (4) | (5) | (6) | (7) |
|---|---|---|---|---|---|---|
| Lake Name (Hmax, GR) 1 | Mortality Date in 2006 | AvgATDO3VB 4 | Range 6 | ATDO3VB (2006) | VB (2006) | Mean TDO3 in 3, 7, 15 Days 7 |
| Cotton (8.5, 6.07) | 205 (24 July) | 22.2 ± 1.3 | 19.4–25.1 | 25.1 | 195–225 | 25.0, 24.9, 24.3 |
| Little Turtle (8.8, 4.21) | 200 (19 July) | 21.8 ± 1.6 | 18.7–25.0 | 25.0 | 192–222 | 24.4, 24.0, 23.2 |
| 8th Crow Wing (9.1, 4.11) | 216 (04 August) | 21.8 ± 1.3 | 19.1–24.6 | 24.6 | 196–226 | 25.8, 25.6, 25.1 |
| Little Pine 2 (11.1, 2.9) | 214 (02 August) | 21.6 ± 1.5 | 19.1–24.6 | 24.6 | 195–225 | 26.2, 26.1, 25.2 |
| Itasca (12.2, 3.32) | 209 (28 July) | 21.3 ± 1.3 | 18.6–24.3 | 24.3 | 195–225 | 24.7, 24.3, 24.0 |
| 7th Crow Wing (12.8, 2.49) | 216 (04 August) | 20.3 ± 1.4 | 18.0–22.5 | 22.5 | 187–217 | 23.7, 23.9, 23.6 |
| Leech (13.0, 10.91) | 211 (30 July) | 21.1 ± 1.4 | 18.2–23.9 | 23.9 | 189–219 | 25.2, 24.6, 24.2 |
| Mille Lacs (13.0, 11.89) | 204 (23 July) | 22.1 ± 1.1 | 19.6–24.2 | 24.2 | 216–246 | 21.9, 21.7, 21.1 |
| Woman (16.5, 4.02) | 210 (29 July) | 21.7 ± 1.5 | 18.5–25.1 | 25.1 | 195–225 | 26.1, 25.6, 24.8 |
| Andrusia (18.3, 2.75) | 202 (21 July) | 21.3 ± 1.3 | 18.9–24.2 | 24.2 | 198–228 | 23.5, 23.1, 22.5 |
| Straight (19.2, 1.94) | 213 (01 August) | 16.2 ± 1.5 | 13.7–21.1 | 21.1 | 198–228 | 19.0, 18.3, 17.1 |
| Little Pine 3 (19.2, 2.77) | 203 (22 July) | 19.8 ± 1.2 5 | 17.1–22.1 | 21.8 | 194–224 | 21.7, 21.3, 20.2 |
| Bemidji (23.2, 3.13) | 208 (27 July) | 19.3 ± 1.0 | 17.8–21.4 | 21.4 | 204–234 | 21.3, 21.0, 20.3 |
| Gull (24.4, 3.26) | 210 (29 July) | 19.9 ± 1.2 | 18.0–22.5 | 22.5 | 205–235 | 22.5, 22.2, 21.5 |
| Pine Mountain (24.4, 2.11) | 207 (26 July) | 21.8 ± 1.3 | 19.6–24.3 | 24.2 | 195–225 | 24.5, 23.9, 23.3 |
| Star (28.7, 2.26) | 200 (19 July) | 20.0 ± 1.1 5 | 17.6–22.4 | 22.4 | 197–227 | 21.6, 21.0, 20.4 |
| Long (39, 1.22) | 218 (06 August) | 18.8 ± 1.3 5 | 16.6–21.7 | 21.1 | 203–233 | 21.9, 21.9, 21.5 |
| Carlos (49.7, 1.15) | 239 (27 August) | 13.4 ± 1.1 5 | 11.2–15.7 | 15.4 | 240–270 | 13.8, 13.4, 12.5 |
Notes: 1 Hmax is the maximum depth in m, 2 Little Pine at Crow Wing County, 3 Little Pine at Otter Tail County, 4 AvgATDO3VB with standard deviation over the simulation period (1992–2012), 5 the simulation period for these lakes are 1961–2012, 6 Range gives the minimum and maximum 31-day ATDO3VB over the simulation periods, and 7 average TDO3 in 3, 7, or 15 days before the mortality date in 2006.
Table 7.
Number of lakes selected as Tier 1 (T1) and Tier 2 (T2) refuge lakes and Tier 3 (T3) non-refuge lakes from the 620 cisco lakes grouped by maximum depth and latitude using AvgATDO3VB contour lines derived from 12 shallow, 16 medium-depth, 24 medium-deep, and 30 deep virtual lakes, respectively. Three principle weather stations (International Falls, Duluth, and St. Cloud) were used for the simulations of cisco lakes associated with three geographic regions (range of latitudes) in Minnesota (Figure 2).
| Region (Weather Station) | Lake Categories | Past | MIROC 3.2 | CGCM 3.1 | ||||||
|---|---|---|---|---|---|---|---|---|---|---|
| T1 | T2 | T3 | T1 | T2 | T3 | T1 | T2 | T3 | ||
| Northern Cisco Lakes (near International Falls) | Shallow | 0 | 0 | 5 | 0 | 0 | 5 | 0 | 0 | 5 |
| Medium-depth | 0 | 0 | 59 | 0 | 0 | 59 | 0 | 0 | 59 | |
| Medium-deep | 0 | 5 | 33 | 0 | 1 | 37 | 0 | 1 | 37 | |
| Deep | 37 | 25 | 2 | 18 | 27 | 19 | 23 | 23 | 18 | |
| Total | 37 | 30 | 99 | 18 | 28 | 120 | 23 | 24 | 119 | |
| Mid-latitude Cisco Lakes (near Duluth) | Shallow | 0 | 0 | 9 | 0 | 0 | 9 | 0 | 0 | 9 |
| Medium-depth | 0 | 0 | 168 | 0 | 0 | 168 | 0 | 0 | 168 | |
| Medium-deep | 0 | 25 | 65 | 0 | 0 | 90 | 0 | 3 | 87 | |
| Deep | 41 | 91 | 0 | 10 | 60 | 62 | 10 | 59 | 63 | |
| Total | 41 | 116 | 242 | 10 | 60 | 329 | 10 | 62 | 327 | |
| Southern Cisco Lakes (near St. Cloud) | Shallow | 0 | 0 | 0 | 0 | 0 | 0 | 0 | 0 | 0 |
| Medium-depth | 0 | 0 | 18 | 0 | 0 | 18 | 0 | 0 | 18 | |
| Medium-deep | 0 | 0 | 12 | 0 | 0 | 12 | 0 | 0 | 12 | |
| Deep | 1 | 20 | 4 | 0 | 4 | 21 | 0 | 4 | 21 | |
| Total | 1 | 20 | 34 | 0 | 4 | 51 | 0 | 4 | 51 | |
| All Three Regions | Total | 79 | 166 | 375 | 28 | 92 | 500 | 33 | 90 | 497 |
Table 8.
Number of lakes selected as Tier 1 (T1) and Tier 2 (T2) refuge lakes and Tier 3 (T3) non-refuge lakes from the 620 cisco lakes grouped by maximum depth and latitude when the contour lines of AvgATDO3VB simulated from the 30 deep virtual lakes were used.
Table 8.
Number of lakes selected as Tier 1 (T1) and Tier 2 (T2) refuge lakes and Tier 3 (T3) non-refuge lakes from the 620 cisco lakes grouped by maximum depth and latitude when the contour lines of AvgATDO3VB simulated from the 30 deep virtual lakes were used.
| Region (Weather Station) | Lake Categories | Past | MIROC 3.2 | CGCM 3.1 | ||||||
|---|---|---|---|---|---|---|---|---|---|---|
| T1 | T2 | T3 | T1 | T2 | T3 | T1 | T2 | T3 | ||
| Northern Cisco Lakes (near International Falls) | Shallow | 0 | 0 | 5 | 0 | 0 | 5 | 0 | 0 | 5 |
| Medium-depth | 1 | 36 | 22 | 0 | 5 | 54 | 0 | 8 | 51 | |
| Medium-deep | 3 | 35 | 0 | 1 | 11 | 26 | 1 | 12 | 25 | |
| Deep | 37 | 25 | 2 | 18 | 27 | 19 | 23 | 23 | 18 | |
| Total | 41 | 96 | 29 | 19 | 43 | 104 | 24 | 43 | 99 | |
| Mid-latitude Cisco Lakes (near Duluth) | Shallow | 0 | 0 | 9 | 0 | 0 | 9 | 0 | 0 | 9 |
| Medium-depth | 3 | 113 | 52 | 0 | 8 | 160 | 0 | 8 | 160 | |
| Medium-deep | 8 | 81 | 1 | 0 | 16 | 74 | 0 | 16 | 74 | |
| Deep | 41 | 91 | 0 | 10 | 60 | 62 | 10 | 59 | 63 | |
| Total | 52 | 285 | 62 | 10 | 84 | 305 | 10 | 83 | 306 | |
| Southern Cisco Lakes (near St. Cloud) | Shallow | 0 | 0 | 0 | 0 | 0 | 0 | 0 | 0 | 0 |
| Medium-depth | 0 | 3 | 15 | 0 | 0 | 18 | 0 | 0 | 18 | |
| Medium-deep | 0 | 8 | 4 | 0 | 0 | 12 | 0 | 0 | 12 | |
| Deep | 1 | 20 | 4 | 0 | 4 | 21 | 0 | 4 | 21 | |
| Total | 1 | 31 | 23 | 0 | 4 | 51 | 0 | 4 | 51 | |
| All Three Regions | Total | 94 | 412 | 114 | 29 | 131 | 460 | 34 | 130 | 456 |
Table 9.
Number (%) of cisco lakes selected as Tier 1 and Tier 2 refuge lakes and Tier 3 non-refuge lakes from the 620 cisco lakes using the two methods.
Table 9.
Number (%) of cisco lakes selected as Tier 1 and Tier 2 refuge lakes and Tier 3 non-refuge lakes from the 620 cisco lakes using the two methods.
| Climate Scenarios | Method | Tier 1 Refuge Lakes | Tier 2 Refuge Lakes | Total Refuge Lakes | Tier 3 Non-Refuge Lakes |
|---|---|---|---|---|---|
| Past | previous 1 | 94 (15.2%) | 412 (66.5%) | 506 (81.6%) | 114 (18.4%) |
| current | 79 (12.7%) | 166 (26.8%) | 245 (39.5%) | 375 (60.5%) | |
| CGCM 3.1 | previous | 34 (5.5%) | 130 (21.0%) | 164 (26.5%) | 456 (73.6%) |
| current | 33 (5.3%) | 90 (14.5%) | 123 (19.8%) | 497 (80.2%) | |
| MIROC 3.2 | previous | 29 (4.7%) | 131 (21.1%) | 160 (25.8%) | 460 (74.2%) |
| current | 28 (4.5%) | 92 (14.8%) | 120 (19.4%) | 500 (80.7%) |
Note: 1 stands for the method using by Jiang et al., 2012 [10].
© 2017 by the authors. Licensee MDPI, Basel, Switzerland. This article is an open access article distributed under the terms and conditions of the Creative Commons Attribution (CC BY) license (http://creativecommons.org/licenses/by/4.0/).
Share and Cite
MDPI and ACS Style
Jiang, L.; Fang, X.; Chen, G. Refuge Lake Reclassification in 620 Minnesota Cisco Lakes under Future Climate Scenarios. Water 2017, 9, 675. https://doi.org/10.3390/w9090675
AMA Style
Jiang L, Fang X, Chen G. Refuge Lake Reclassification in 620 Minnesota Cisco Lakes under Future Climate Scenarios. Water. 2017; 9(9):675. https://doi.org/10.3390/w9090675
Chicago/Turabian StyleJiang, Liping, Xing Fang, and Gang Chen. 2017. "Refuge Lake Reclassification in 620 Minnesota Cisco Lakes under Future Climate Scenarios" Water 9, no. 9: 675. https://doi.org/10.3390/w9090675
Note that from the first issue of 2016, this journal uses article numbers instead of page numbers. See further details here.