Abstract
Freshwater resources in the North China Plain (NCP) are near depletion due to the unceasing overexploitation of deep groundwater, by far the most significant source of freshwater in the region. To deal with the deepening freshwater crisis, brackish water (rich but largely unused water in agriculture) is increasingly being used in irrigation in the region. However, inappropriate irrigation with brackish water could lead to soil salinization and cropland degradation. To evaluate such negative impacts, the HYDRUS-1D model was used to simulate soil salt transport and accumulation under 15 years of irrigation with brackish water. The irrigation scenarios included brackish water irrigation during the wintering and jointing stages of winter wheat and then freshwater irrigation just before the sowing of summer maize. Freshwater irrigation was done to leach out soil salts, which is particularly vital in dry years. For the littoral region of the plain, HYDRUS-ID was used to simulate the irrigated cropping system stated above for a total period of 15 years. The results showed that it was feasible to use brackish water twice in one year, provided freshwater irrigation was performed before sowing summer maize. Freshwater irrigation, in conjunction with precipitation, leached out soil salts from the 100 cm root-zone depth. The maximum salt accumulation was in the 160–220 cm soil layer, which ensured that root-zone soil was free of restrictive salinity for crop growth. Precipitation was a critical determinant of the rate and depth leaching of soil salt. Heavy rainfall (>100 mm) caused significant leaching of soluble salts in the 0–200 cm soil profile. Salt concentration under brackish water irrigation had no significant effect on the variations in the trend of soil salt transport in the soil profile. The variations of soil salinity were mainly affected by hydrological year type, for which the buried depth of soil salt was higher in wet years than in dry years. The study suggested that 15 years of irrigation with brackish water is a reliable and feasible mode of crop production in coastal regions with a thick soil column above the water table. The scheme proposed in this study allowed the use of brackish water in irrigation without undue salinization of the crop soil layer, an intuitive way of resolving the deepening water crisis in the NCP study area and beyond.
1. Introduction
A deepening water shortage is gradually developing into one of the most pressing global crises. Nearly 1.7 billion of the world’s population are faced with groundwater shortage, and it is projected that half of the world will face this worsening crisis by 2030 [1]. The growing population and expanding economies will increase the conflict between water demand and supply and is particularly challenging in the agricultural sector where irrigation water alone accounts for 70% of global water consumption [2]. The North China Plain (NCP), the India Ganges Plain and the High Plains of the United States are among the most intensively irrigated and highly productive areas in the world [3,4,5]. Over-pumping of water for crop production has resulted in rapid depletion of these aquifers, which are the largest in the world [6].
While the area of salinization under cultivated lands accounts for 6.62% of total cultivated lands in China [7], the NCP is the single largest saline region in the country. The plain is also one of the most important grain production regions, with a pervasive water scarcity driven by excessive groundwater exploitation. Based on analysis of research studies [8,9], agriculture is the main sector with chronic over-exploitation of groundwater resources in the plain region [10]. The annual over-exploitation of groundwater in the NCP region is estimated at 4 billion m3 [11]. The coastal plain in the east of the NCP is a classic groundwater resource depletion zone, where water levels in both the shallow and deep aquifers have been rapidly declining for decades now, and deep aquifer water levels have fallen by 110 m [12,13].
However, an annual exploitable saline water resource of 4.2 billion m3 is available in the coastal plain of North China, accounting for 36% of the total amount of groundwater resources in the region [14,15]. Thus, the Chinese government launched a project a few years ago aimed at increasing the utilization of brackish water resources via irrigation of grain fields to boost production in medium-to-low-yielding farmlands in the region. Although freshwater irrigation is an effective way of reducing soil salinity, the extensive use of it since the 1970s in the NCP, Inner Mongolia and Gansu has proven increasingly unsustainable. To alleviate the looming water crisis in the region, the use of brackish water in agricultural irrigation in the coastal plains is gaining significant attention.
Extensive research has been carried out to explore the most suitable mode of brackish water irrigation in agricultural production. Based on an experimental study, Chen et al. [16] noted that there was no significant difference in winter wheat yield between treatments with brackish water irrigation and those with freshwater irrigation at the jointing stage. In fact, yield under both freshwater and brackish water irrigation treatments was 10–30% higher than that under rain-fed conditions. Liu et al. [17] confirmed that brackish water irrigation at the jointing stage of winter wheat and freshwater irrigation at the time of summer maize sowing was effective in terms of yield and saving scarce freshwater resources in wheat-maize cropping systems in the NCP.
However, there have been difficulties with the current use of brackish water in irrigation, including increased soil salt, abnormal crop growth, unsustainable land resource development and groundwater quality deterioration. Wang et al. [18] noted that soil salinity in the upper soil layers (0–40 cm) increased at winter wheat harvest under brackish water irrigation, and grain yield decreased with increasing water salinity. In a field experiment on brackish water irrigation of a winter-wheat/summer-maize cultivation system from 1997 to 2005, Ma et al. [19] showed that soil salinity in the 0–100 cm soil layer was as high as 133% over the initial conditions in dry years. Tarek et al. [20] observed that soil salinity was not only generally high with significant salt accumulation in the surface soil layer, but that soil salinity actually increased with increasing salt concentration in irrigation water. Experiments on the effects of different salt concentrations of crops irrigated with brackish water revealed that the relative yield of winter wheat and summer maize decreased obviously under irrigation with highly quality water or frequent irrigation [21,22]. Thus, brackish water irrigation can potentially induce soil salinity that will in turn degrade croplands in the long run.
Due to the limited durations of most experiments and sampling depths, results on the effects of saline water irrigation for both soils and crops are inconclusive in terms of long-term effects. In the last few decades, analytical and numerical models have been developed to predict the effects of irrigation water quality on soil [23,24]. HYDRUS, as one such model, is used to simulate not only soil water and salt flux but also to analyze the impact of meteorological, soil and management conditions as well as brackish water irrigation on soil [25,26,27,28]. Using HYDRUS-1D to analyze the effect of different salt concentrations in irrigation water on salt transport, Goncalves et al. [29] showed that although low concentrations of brackish water (with a conductivity of 1.6 dS/m) caused no surface soil salinization, soil salinity, however, increased with increasing concentration of brackish water. Modeling salt balance across a 4-m-depth soil profile for salinization under brackish water irrigation, Kanzari et al. [30] observed high salt accumulation and salinity at a clay-silt interface approximately 2 m into the soil profile. Using HYDRUS-ID modeling coupled with a crop growth model for brackish water irrigation, Wang et al. [31] found that winter wheat yield decreased by 10% and soil salinity increased above the initial value. Optimal irrigation strategies have also been determined with the joint use of HYDRUS-1D and statistical analysis of soil salt leaching under different irrigation regimes [32].
The objective of this study was to confirm the suitability of long-term irrigation with brackish water. To do this, HYDRUS was used to simulate a suitable irrigation mode that can offset the negative effects of brackish water irrigation (including soil salt accumulation and the related driving factors) in the coastal plains of North China.
2. Materials and Methods
2.1. Study Area
The study was conducted at the Nanpi Eco-Agricultural Experimental Station (latitude 38.00° N, longitude 116°40′ E and elevation 11.0 m a.s.l.), which is located in the Hebei Low Plains west of the Bohai Gulf that borders the Pacific Ocean (Figure 1). The region has a typical semi-humid monsoon climate with a long-term annual mean air temperature of 12.4 °C and precipitation of 530 mm, 70% of which occurs in June through August. Winter wheat and summer maize are the most widely cultivated crops in the study area, which is a medium-to-low yield production region. The soil type is mainly fluvo-aquic and saline fluvo-aquic, with the latter covering 22% [33] of the region. The range of the soil salt content is 0.8–1.5 g/kg. Although 44 million m3/year of deep groundwater is over-exploited for irrigation in Nanpi County (where the experimental station is located), there also exists a rich brackish water resource in the shallow aquifer, which is estimated at 60 million m3/year. This shallow aquifer of saline water is considered a natural phenomenon, and the depth to shallow groundwater in the region is 5–7 m, with salt concentrations of 2 g/L (18%), 2–3 g/L (33%), 3–5 g/L (24%) and over 5 g/L (25%) in different areas of the coastal region [34].
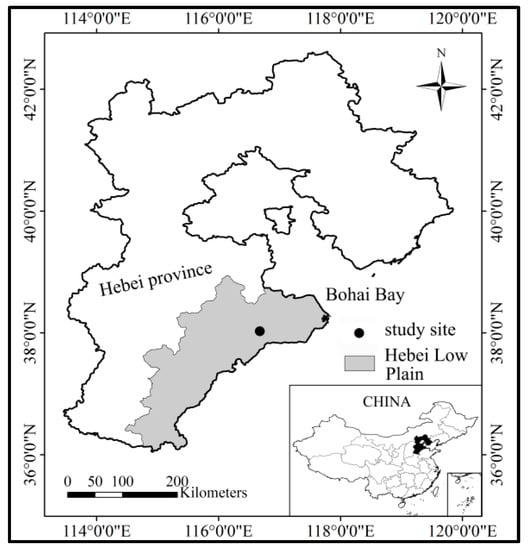
Figure 1.
A map depicting the location of the study site in Hebei Low Plains in North China.
2.2. Methods
The Hydrus-1D model was used to simulate a one-dimensional water flow and solute transport in the variably saturated media [35]. The selected model has been used and verified in a number of studies in the NCP [36,37,38,39], where this study was also conducted. Assuming that soil water flow and salt transport are one-dimensional, vertically downward fluxes, a uniform (equilibrium) water flow in a partially saturated rigid porous medium can be described by a modified form of the Richards equation [40]. The thermal gradient module was not considered in this study.
The soil texture at the experimental site is presented in Table 1. The van Genuchten [41] parametric functions were used to calculate the hydraulic properties of the soil profile.

Table 1.
Soil texture and particle size distribution in Hebei Low Plains in North China.
The simulated soil profile depth was 400 cm, and the minimum and maximum time steps were 0.00001 d and 5 d, respectively. The initial soil water content and salt concentration were measured from soil samples collected at a depth interval of 20 cm. The upper boundary (the soil surface) was set at atmospheric conditions using daily precipitation, irrigation and evapotranspiration data. Free drainage was set at the bottom boundary, but groundwater had no impact on the simulated soil column as it lay below the depth of 5 m in the study area. For solute transport, the upper and lower boundary conditions were concentration flux and zero concentration gradient, respectively. Root water uptake was described as a dimensionless function of soil water pressure head (0 ≤ α ≤ 1) [42], assumed to be a set of empirical parameters proposed by Wesseling et al. [43] (Table 2); plant solute uptake was neglected because its effects were considered to be insignificant in the study area.
Table 2.
Parameters of crop root water uptake in Hebei Low Plains in North China.
Meteorological data (temperature, sunshine duration, wind speed and relative humidity) were collected at the Nanpi weather station. Potential evaporation (Ep) and potential transpiration (Tp), required by HYDUS-1D, were calculated using Equations (1) and (2) as follows:
where k is the crop canopy extinction coefficient, which is 0.60 for winter wheat [44,45], and 0.438 for maize [46]; LAI is leaf area index, which was measured every two weeks [47,48]; and ETp is reference crop evapotranspiration, which was estimated using Equation (3) as follows:
where ET0 is reference evapotranspiration, determined by the Penman–Monteith equation [49], and Kc is the crop coefficient. Under standard conditions (e.g., air humidity and wind speed at 45% and 2 m/s, respectively), respective Kc values for the three stages (early, mid- and late seasons) were 0.7 (0.4 over-wintering), 1.15 and 0.4 for wheat, and 0.3, 1.2 and 0.6 for maize [49]. The values of Kc under real conditions were modified by the local climatic, crop and soil parameters using the algorithms proposed by Duan et al. [50].
The relationship between electrical conductivity of a 1:5 soil/water extraction (EC1:5) (dS/m) and the mass salt content of soil (S, g/kg) was set based on the values derived from an analysis of 40 soil samples collected from different soil layers at the experimental station. Carbonate and bicarbonate ions were analyzed using the double-indicator neutral method, and the other soluble ions were determined via ion chromatography. A plot of the linear fit of the two factors is presented in Figure 2, and the empirical formula is given in Equation (4) as follows:
where S is the soil salt content (g/kg).

Figure 2.
Relational plot between salt content and EC of the soil water extract (1:5) in the Hebei Low Plains study area in North China.
It was necessary to convert EC1:5 to EC of the saturated extract (ECe), an international standard for brackish water irrigation that indicates the salt tolerance threshold of crops [51,52], using Equation (5) [53] as follows:
2.3. Model Calibration and Validation
The 2009–2014 data used for the model calibration and validation were collected at the same experimental site [16,54]. The hydrologic parameters for the 0–4-m soil profile were primarily estimated from particle size distribution and bulk density of the soil using the ROSETTA module [55] of the HYDRUS-1D model. Then, the hydrologic parameters of the 0–2-m soil layer were further optimized using the inverse solution and calibrated and validated based on measured soil salt data. For solute transport, the hydrodynamic dispersion coefficient was described in the model via longitudinal dispersion, a parameter measured in the field experiments as 5–20 cm [56] on the assumption that the molecular diffusion coefficient for free water was negligible.
The experiment for the calibration analysis included three treatments in 2009–2010: 60 mm of freshwater (with 0.84 g/L of total dissolved solids (TDS)) irrigation at the wintering stage and 70 mm of a second brackish water irrigation treatment at the jointing stage (with 0.84 g/L, 2 g/L and 4 g/L of TDS in the A0, A2 and A4 treatments, respectively). The experiment for the validation analysis included three treatments (B21, B31 and B41) in 2013–2014, denoting one irrigation event at the jointing stage of winter wheat with irrigation water TDS of 2 g/L, 3 g/L and 4 g/L, respectively, and then 70 mm of freshwater irrigation of summer maize before sowing. While winter wheat grows from October to early June the following year in the study area, summer maize grows from mid-June to the end of September. The salt content in the 0–100-cm soil layer was measured before the maize harvest in all treatments. The coefficient of determination (R2), root mean square error (RMSE) and mean absolute error (MAE) were used to evaluate the model performance. The simulated and measured soil salt contents for the 0–100-cm soil profile are plotted in Figure 3.
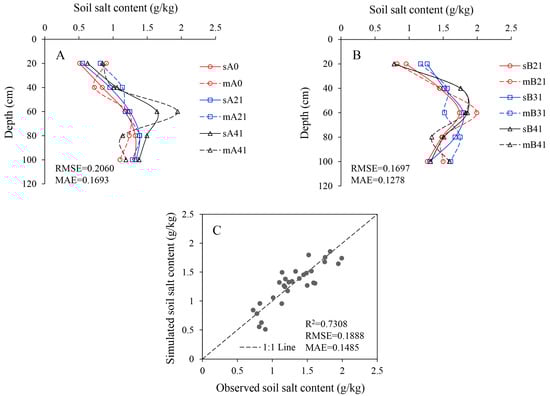
Figure 3.
Plots of the results of calibration and validation analyses of the HYDRUS-ID model applied to the Hebei Low Plains study area in North China. Solid and dashed lines in A and B denote simulated and observed values, respectively; (A,B) are the calibrated and validated salt contents, respectively, at different soil depths at the time of the maize harvest; and (C) is the simulated and observed 1:1 goodness-of-fit line for the salt content at the time of the summer maize harvest.
The simulated soil salt contents at different depths agreed well with the measured values in the calibration and validation analyses (Figure 3A,B), with average ranges for RMSE and MAE of 0.1697–0.2060 and 0.1278–0.1693, respectively. Comparisons between the simulated and observed salt contents in the 0–100-cm soil layer in all the treatments under the calibration and validation analyses are plotted in Figure 3C (R2 = 0.731), indicating that the model reliably reflected the changes in soil salt flux in the study area. The final hydrologic parameters for each of the soil layers are given in Table 3.
Table 3.
Final soil hydrologic parameters for the different soil layers in the Hebei Low Plains study area in North China.
2.4. Long-Term Irrigation Scheme Design
The irrigation scheme is given in Table 4. Two irrigation events were applied in each of the treatments before soil freeze in winter and at the jointing stage of winter wheat. Irrigation at the flowering and grain-filling stages of winter wheat was applied based on the soil moisture condition, as influenced by rainfall. The water quality or salt content of the water applied in each irrigation event is given in parentheses in Table 4. Four irrigation scenarios (S1, S2, S3 and S4) were set up based on salt concentration (TDS) in irrigation water at the jointing stage of winter wheat, i.e., 2 g/L, 3 g/L, 4 g/L and 5 g/L, respectively.
Table 4.
Irrigation scenarios designed for different irrigation amounts (mm) and water quality (g/L) (in parentheses) at different growth stages of winter wheat and summer maize in Hebei Low Plains in North China.
Irrigation quotas for wheat and maize were 60 mm and 70 mm, respectively, which were based on the local practices [17,57].
To offset the effect of the variation in annual rainfall on salt leaching, 15-year meteorological data (from 13 October 2000 to 2 October 2015) were used to test the developed hypothesis on the effects of brackish water irrigation on salt accumulation in the soil. For winter wheat, sowing and harvest dates were 13 October and 7 June, respectively; for summer maize, sowing and harvest dates were 10 June and 2 October, respectively.
3. Results
3.1. Soil Profile Salinity Variation
The effect of the 15-year brackish water irrigation on the distribution of soil salinity (ECe) is illustrated in Figure 4. It shows that whereas ECe varied with time for the 0–200-cm soil layer under all the scenarios, it was almost constant for the 200–400-cm soil layer. The soil profile was divided into two sub-layers based on the salt tolerance capacity of winter wheat and summer maize. The layer above the white line with ECe < 1.7 dS/m [51] (threshold for summer maize) was the Safety Zone (SZ) for the growth of both maize and wheat. The other layer between the two red lines with ECe > 6.0 dS/m [58] (threshold for winter wheat) was the High Risk Zone (HRZ) for the growth of both maize and wheat. The distribution of SZ and HRZ varied with the type of simulation scenario. HRZ was much larger in S4 than in S1, which implied that the higher the salt concentration of irrigation water, the higher the risk for crop growth. In the first two years, the maximum depth of HRZ was 80 cm, and the maximum ECe was 6.5 dS/m. In 2003–2004, HRZ gradually dissipated while SZ grew in thickness, which enhanced the normal growth of summer maize and winter wheat. Starting from the fifth year going into the eighth year, HRZ gradually built up and then stabilized in the 100–140-cm soil layer at a maximum ECe of 9.5 dS/m—a high salt stress for maize. The maximum depth of SZ extended to 100 cm and HRZ moved down to the 160–220-cm soil layer from the ninth year onward. The shift in the depth of HRZ favored the growth of winter wheat and summer maize, except in the 2014 maize season.

Figure 4.
Electrical conductivity of saturated soil extracts at different depths under the four simulated irrigation scenarios in the Hebei Low Plains study area in North China. White and red lines represent respective salt tolerance thresholds of summer maize and winter wheat.
After 5 years of brackish water irrigation, the soil salt content increased in the layers above the 220-cm soil depth, and there was no salt accumulation in the layers below that (Figure 5). An average salt increase of 0.8 kg occurred in the 100–160-cm soil layer under the brackish water irrigation scenarios, accounting for about 70% of the total increase in soil salt. The salt content in the 0–100-cm soil layer decreased after 10 years of brackish water irrigation. There was more salt reduction in the upper 0–100-cm soil layer and more increase below the 100-cm depth from the 10th year to the 15th year of brackish water irrigation. Salt increase (1.9 kg) in the 160–220-cm soil layer accounted for 46% of the total salt increase. This indicated that salt gradually moved down to the lower soil layers, mainly the 160–220-cm soil layer and especially the 180–200-cm soil layer. The higher the salt concentration of brackish water, the more salt accumulation occurred. For instance, the highest salt increase (2.0 kg) was under scenario S4 (with irrigation water TDS of 5 g/L), compared with scenario S1 (1.6 kg) with irrigation water TDS of 2 g/L in the 15th year.
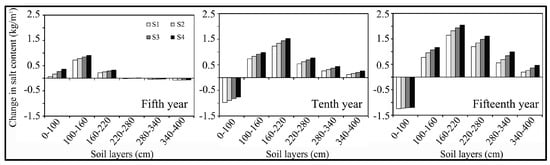
Figure 5.
Change in salt content (kg/m2) at maize harvest in a given layer compared to that during the initial years (increased salt content per square meter). S1–S4 are the simulated irrigation scenarios.
3.2. Effect of Precipitation on Salt Leaching
The depth of maximum ECe at maize harvest under the different irrigation scenarios varied consistently with precipitation, implying that salt leaching was driven mainly by hydrological year (Figure 6). In wet years (especially in 2003 with 707.2 mm and in 2009 with 852.8 mm of precipitation, both of which far exceeded the mean annual precipitation of 545 mm), the depth of maximum ECe shifted downwards from an initial depth of 80 cm to 140 cm and eventually reached 190 cm. There was an upward trend in salinity for dry years, including 2002, 2005, 2007 and 2014. The fluctuation of the layer with maximum ECe was positively correlated with annual precipitation (R2 = 0.624, p < 0.05). However, there was no significant difference in the fluctuation of the maximum ECe layer among the different irrigation scenarios, indicating that the degree of salinity of irrigation water had no effect on the depth of maximum ECe.
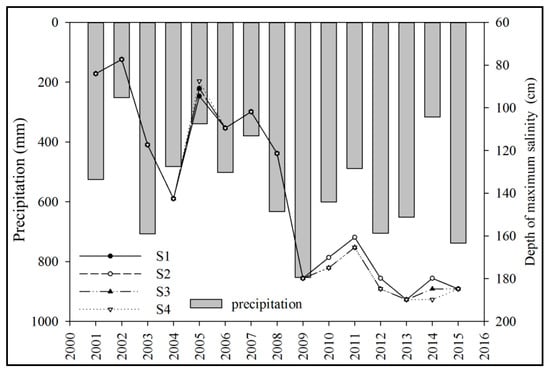
Figure 6.
Variation in the depth of maximum ECe in the soil profile at maize harvest along with precipitation over a 15-year period of winter wheat-summer maize growing seasons in Hebei Low Plains in North China.
The salt content in the 0–60-cm soil layer increased during the wheat season but decreased during the maize season (Figure 7). Annual fluctuation of salt content in the 0–100-cm soil layer was driven by salt accumulation in dry years (2002, 2005, 2007 and 2014) and salt leaching in wet years (2003, 2008, 2009, 2010, 2012, 2013 and 2015). The salt content in the 0–200-cm soil layer apparently decreased during the rainy season in wet years, but that in the 0–400-cm soil layer gradually increased for most of the time, except in 2009 (Figure 7). The salt content in the 0–60-cm and 0–100-cm soil layers was generally acceptable for crop cultivation at maize harvest, compared with that at the beginning of the growing season, which decreased by 0.9 kg and 1.3 kg, respectively, at the end of the simulation period. This suggested that rainfall during the maize growing season was critical for leaching salt out of the 0–100-cm soil layer. However, the salt content in the 0–200-cm, 200–400-cm and 0–400-cm soil layers increased on average by 1.2 kg, 2.9 kg and 4.1 kg, respectively.

Figure 7.
Dynamics of precipitation during the crop growing season under 15 years of brackish water irrigation and the salt content in the 0–60-cm, 0–100-cm, 0–200-cm and 0–400-cm soil layers at wheat and maize harvests.
Because there was no significant difference between the shift in trend in the salt content under the different scenarios, scenario S2 (3 g/L brackish water) was randomly selected to analyze for the effect of heavy rainfall on leaching of salt in the study area (Figure 8). The time of the significant increase in salt in the 2–4-m soil profile and of intense infiltration was consistent with the time of heavy rain in summer of 2003, 2009, 2012, 2013 and 2015. In each of the five years, there was more than one heavy rainfall event (above 100 mm in a day) in the maize season (except in 2013), which was a critical factor for leaching of salt down to the 2-m depth of the soil profile.

Figure 8.
Comparisons between salt content in the 2–4 m soil layer, water infiltration at 2 m observation depth and daily precipitation for the 15-year period in Hebei Low Plains in North China.
To further analyze the effects of rainfall on salt leaching, a total of six heavy rainfall events in excess of 100 mm/d (which occurred once in 2003, three times in 2009, once in 2012 and once in 2015) were used to simulate the difference in soil salt flux with or without heavy rainfall. Figure 9A shows a continuous increase in salt content in the 0–200 cm soil layer, but there was no apparent effect in the 200–400-cm soil layer. A much thicker and higher salt concentration zone formed in the 60–180-cm soil layer (Figure 9B), where the effect of heavy rainfall on soil salt leaching was clear.
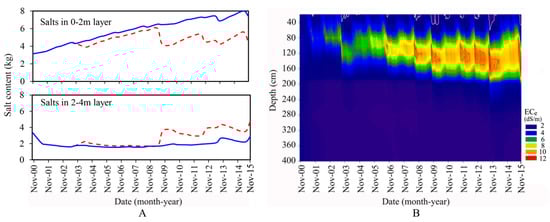
Figure 9.
Comparison of salt content between S2 and S2 irrigation scenarios without heavy rainfall (>100 mm/d). (A) is the comparison of salt content for the 0–2-m and 2–4-m soil layers in the Hebei Low Plains study area in North China. The blue solid line represents S2 irrigation scenario without heavy rainfall; the red dashed line represents that of S2 scenario; and (B) is salt distribution without heavy rainfall.
3.3. Soil Water Deficit and Critical Salt Leaching Season
Soil water deficit (cm3/cm3) is defined as the difference between field capacity and actual water content. As shown in Figure 10, the soil water deficit below the 2-m soil layer was close to zero. A more severe water deficit occurred in the 0–2-m soil layer, and the maximum water deficit (0.2 cm3/cm3) was in the 40–100-cm soil layer from the flowering to grain-filling stages of winter wheat. Figure 10 shows three critical periods with lower water deficit and excess field water capacity. The periods were the rainy seasons in the wet years of 2003, 2009 and 2015. Besides, soil water deficit was lowest at the wintering and jointing stages of winter wheat and at the harvest of summer maize (Figure 11). Water deficit in the 0–20-cm topsoil was 20 mm, which had the potential to easily reach field capacity under 60 mm of artificial irrigation, and the same trend existed for the 0–60-cm root zone. This implied that conventional irrigation (of 60 mm) can ensure water replenishment in the root-zone soil layer. Compared with the 0–20-cm or 0–60-cm soil layers, desalination of the 0–100-cm soil layer was not possible. Although soil salt deficiency at the wintering and jointing stages of winter wheat and at the harvest of summer maize was lower, only the periods of winter wheat wintering and summer maize harvest were critical for salt leaching. The quantification of salt balance in the 0–100-cm soil layer for the crop growth stages showed that the salt content in the 0–100-cm soil layer decreased by 100 g at wheat wintering and maize harvest in wet or normal years under the S2 scenario. However, the salt content increased by 100–180 g at the jointing stage. This suggested that although artificial irrigation could prevent a water deficit in the 0–100-cm soil layer, desalination was still not achievable due to increased crop evapotranspiration at the jointing stage of winter wheat when growth was rapid.

Figure 10.
Changes in soil water deficit at different soil depths under the S2 scenario with 15 years of brackish water irrigation in the Hebei Low Plains study area in North China.

Figure 11.
Soil water deficit at different crop growth stages in different soil layers under the S2 scenario of brackish water irrigation in the Hebei Low Plains study area in North China.
4. Discussions
4.1. Brackish Water Irrigation Reliability
As brackish water use increases in space and time, the risk of soil salinization in arable lands will inevitably increase. Thus, evaluating the impact of brackish water irrigation on soil quality is necessary for sustainable agricultural production. This research showed that the type of hydrological year was probably the most determinant factor in terms of the risk of soil salt accumulation under brackish water irrigation. In normal and wet years, there was no obvious risk of salt accumulation in the 0–100-cm soil layer, and soil salinity was maintained below the threshold salt tolerance of winter wheat and summer maize. Although in dry years there was actually the risk of soil salinization under brackish water irrigation, soil salt accumulation was reversible. Rameshwaran et al. [59] noted that soil salinity in the root zone was easily reversed by factors such as seasonal rainfall and climate variability. For the 15-year simulation period under brackish water irrigation, there was an increasing trend in soil salinity for the period from wheat harvest to maize sowing. During this period, salt concentration increased significantly and there was intensive salt accumulation in the upper soil layer due to water shortage and strong evaporation.
Although salt accumulation and concentration increased at the start [60], the effect of high rainfall and timely freshwater irrigation before sowing summer maize effectively flushed soil salts to deeper layers below the 1-m soil depth. Similar results were obtained by Bajwa et al. [22] and Pang et al. [61]. In addition, Kiremit and Arslan [62] noted that with appropriate leaching and drainage systems, brackish water can be used to irrigate with little or no soil damage or even minimal reduction in crop yield. Li et al. [63] suggested that brackish water irrigation has a positive effect on the normal growth of adaptable crops, a condition that was attributed to increased soil particle aggregation and stability. These field experiments showed that brackish water irrigation was an applicable mode of cultivation, at least in the short-term, provided there was sufficient rainfall and freshwater irrigation [64]. However, no conclusive results exist on the long-term effect of brackish water irrigation on soil. The results of this study proved the successful use of brackish water irrigation and its effectiveness as a substitute for freshwater irrigation in areas with limited water resources. Based on the variations in the trends of salinity along the soil profile for the 15-year simulation period and also on the quality of available shallow groundwater in the study area, a suitable brackish water irrigation scheme was proposed for the Hebei Low Plains in North China. The scheme included pre-winter irrigation with brackish water of less than 2 g/L salt concentration combined with irrigation at the jointing stage of winter wheat with 2–3 g/L brackish water, and then a timely freshwater irrigation before sowing of summer maize.
4.2. Heavy Rains Critical for Leaching Salt
The findings of this study showed that the salinity of irrigation water had no significant effect on soil salt accumulation [65]. Rainfall, on the other hand, was critical for leaching out soil salts, including both leaching depth and amount. Annual average rainfall for the 15-year simulation period was 530 mm, which was close to the average annual rainfall for the 40 years from 1976 to 2015 (550 mm). Rainfall intensity was higher than was required for leaching out soil salts. Heavy rainfall (>100 mm) in rainy seasons can wash out a significant amount of soil salt (especially in the 0–200-cm soil profile) down to the deeper soil layers (Figure 8, Figure 9 and Figure 10). Based on the local meteorological data for forty years, the probability of occurrence of heavy rainfall (>100 mm) in every year was 47.5%, which is only slightly higher than the value noted in this simulation period (40%). This therefore suggested that rainfall during the simulation period can be used to represent the long-term conditions in the study area. Ma et al. [64] observed soil salt leaching to the depth of 150 cm during heavy precipitation events. In addition, Chen et al. [66] observed salinity distribution in a soil profile in a 3-year field experiment on brackish water irrigation in an arid region. In the study, a heavy flood irrigation after crop harvest significantly reduced salt accumulation in the 0–100-cm soil layer. This practice was far more efficient for controlling soil salinity in croplands. The results of this study also showed that 15 years of brackish water irrigation had little effect on the quality of shallow groundwater. Because the variation in salt content in the 0‒400-cm soil layer was basically the cumulative trend for the 15-year period (Figure 7), only a small amount of soil salt was leached out of the soil profile. The shallow groundwater quality was generally within the 1‒3 g/L range and was mainly affected by seasonal rainfall. However, the quality of shallow groundwater may be influenced by the leaching of salt from the 200‒400-cm soil layer under long-term brackish water irrigation and higher rainfall intensity. The 15 years of weather data used in this study showed that in wet years, heavy rainfall was frequent from the end of June to the start of October—as it was observed in 2003, 2009 and 2015. This period was the most valuable window for leaching out soil salts. Even with more consecutive dry years than in the 15-year simulation period, it is highly likely that artificial irrigation soon after heavy rainfall can effectively flush out accumulated excess of salts in root-zone soils. This will maintain soil salinity within the limit suitable for sustainable cultivation of crops.
4.3. Other Considerations
Soil hydraulic parameters are important in simulating soil water and solute transport. In this study, these parameters (Table 3) were obtained based on soil texture at different depths and then optimized with field data using the HYDRUS-1D inverse module. This approach is widely used in simulations involving gains in soil hydraulic parameters [67,68,69]. Electrical conductivity of saturated soil extract (ECe) was used as a proxy for soil salinity and simulated as a non-reactive solute. This consideration was reasonable because measured ion composition in the study area was unsaturated with respect to calcite and gypsum [26]. The transport and reactions between major ions were insufficient to change the soil structure; thus, the effect of any variation in soil chemistry on soil hydraulic parameters was assumed to be negligible in the study area. The reduction in root water uptake due to salinity stress was quantified by a threshold-slope model [21]. The threshold value is the ECe at which a decrease in crop yield begins, and the slope value describes the percent yield loss per increase in ECe in excess of the threshold level. The threshold and slope values were constant as soil salinity varied [70,71].
In this study, the effects of thermal and density gradients on both hydraulic and root uptake parameters were not considered because of limited experimental conditions. The effect of the soil temperature gradient can change root uptake and soil hydraulic properties, including kinematic viscosity and surface tension [72,73]. Studies show that as temperature increases, hydraulic conductivity also increases because of decreasing water viscosity, suggesting a reduction in soil water-holding capacity [74,75]. As the thermal gradient is directly related to hydraulic conductivity, it could indirectly affect solute transport processes, partly due to convection and dispersion. Therefore, high temperature could lead to a high hydraulic conductivity and infiltration rate that could in turn enhance solute transport [76]. The thermal gradient in this study was considered to be negligible, especially in winter when soil temperature was low and water flow limited. In addition, leaching of salts only happens in soil profiles with contents lower in summer due to high temperatures and abundant rains. Irrespective, thermal and density gradients can affect soil solute transport and therefore need further research in future studies.
5. Conclusions
This study investigated the effect of 15 years of brackish water irrigation on soil salt balance in the 4-m depth of a soil profile under a double cropping system (wheat and maize) in the coastal plain of North China using the HYDRUS-1D model. The results showed that two brackish water irrigation events (one in early winter and the other at the jointing stage of winter wheat) and one freshwater irrigation event (before sowing maize) can support crop cultivation in the top 1 m of the soil profile. After 5 years of brackish water irrigation, salt started to accumulate below the 1 m depth (below the root-zone layer), which was in the 180–200 cm soil layer. After 15 years of irrigation, the amount of salt in the 200–400-cm soil layer accounted for ~75% of the total added salt through brackish water irrigation. Precipitation in rainy seasons was critical for salt leaching. Heavy rains higher than 100 mm per day can effectively flush soluble salts out of the root-zone layer into the deeper soil layers. Even though consecutive dry years increase the risk of soil salinization, rainy seasons are still the best window for washing down soil salts via natural freshwater processes. This mode is effective for controlling salinization in the soil rooting zone in irrigated regions that use brackish water.
Acknowledgments
This study was funded by the Science and Technology Service Network (STS) Program of Chinese Academy of Sciences (KFJ-STS-ZDTP-001) and the International Collaborative Project (GJHZ1647) of Chinese Academy of Sciences. The authors are grateful to the sponsors/staff of the Hebei Science and Technology Special Fund for the “Bohai Granary” Project. Thanks are extended to Huilong Li and Xinyao Zhou for the significant input during data processing.
Author Contributions
Yanmin Yang, Yonghui Yang and Xiaojing Liu conceived and designed the study. Suying Chen conducted the experiments. Qiuli Hu and Feng Gao conceived the analytical tools used. Kangkang He analyzed the data and wrote the paper.
Conflicts of Interest
The authors declare that there is no conflict of interest regarding the publication of this work.
References
- Gleeson, T.; Wada, Y.; Bierkens, M.F.P. Water balance of global aquifers revealed by groundwater footprint. Nature 2012, 488, 196–200. [Google Scholar] [CrossRef] [PubMed]
- Tatalovic, M. Irrigation reform needed in Asia. Nature 2009. [Google Scholar] [CrossRef]
- Foster, S. Quaternary Aquifer of the North China Plain-assessing and achieving groundwater resource sustainability. Hydrogeol. J. 2004, 12, 81–93. [Google Scholar] [CrossRef]
- Rodell, M.; Velicogna, I.; Famiglietti, J.S. Satellite-based estimates of groundwater depletion in India. Nature 2009, 460, 999–1002. [Google Scholar] [CrossRef] [PubMed]
- Sophocleous, M. Review: Groundwater management practices, challenges, and innovations in the High Plains aquifer, USA-lessons and recommended actions. Hydrogeol. J. 2010, 18, 559–575. [Google Scholar] [CrossRef]
- Famiglietti, J.S. The global groundwater crisis. Nat. Clim. Chang. 2014, 4, 945–948. [Google Scholar] [CrossRef]
- Yang, J.S. The Development and Prospect of Saline Soil Research in China. Acta Geol. Sin. 2008, 45, 837–843. (In Chinese) [Google Scholar]
- Wada, Y.; van Beek, L.P.H.; Bierkens, M.F.P. Non-sustainable groundwater sustaining irrigation: A global assessment. Water Resour. Res. 2012, 48, 335–344. [Google Scholar] [CrossRef]
- Liu, J.; Cao, G.L.; Zheng, C.M. Sustainability of groundwater resources in the North China Plain. In Sustaining Groundwater Resources; Anthony, J., Ed.; Springer: Dordrecht, The Netherlands, 2011; pp. 69–87. [Google Scholar]
- Qiu, J. China faces up to groundwater crisis. Nature 2010, 466. [Google Scholar] [CrossRef] [PubMed]
- Moiwo, J.P.; Yang, Y.H.; Li, H.L. Comparison of GRACE with in situ hydrological measurement data shows storage depletion in Hai River basin, Northern China. Water SA 2009, 35, 663–670. [Google Scholar] [CrossRef]
- Cao, G.L.; Scanlon, B.R.; Han, D.M. Impacts of thickening unsaturated zone on groundwater recharge in the North China Plain. J. Hydrol. 2016, 537, 260–270. [Google Scholar] [CrossRef]
- Zheng, C.; Liu, J.; Cao, G.; Kendy, E.; Wang, H.; Jia, Y. Can China cope with its water crisis?—Perspectives from the North China Plain. Groundwater 2010, 48, 350–354. [Google Scholar] [CrossRef] [PubMed]
- Qian, Y.; Zhang, Z.J.; Fei, Y.H. Sustainable exploitable potential of shallow groundwater in the North China Plain. Chin. J. Eco-Agric. 2014, 22, 890–897. (In Chinese) [Google Scholar]
- Zhang, Z.J. Study and Assessment on Sustainable Utilization of Groundwater in North China Plain; Geological Publishing House: Beijing, China, 2009; pp. 362–370. (In Chinese) [Google Scholar]
- Chen, S.Y.; Shao, L.W.; Sun, H.Y. Effect of brackish water irrigation on soil salt balance and yield of both winter wheat and summer maize. Chin. J. Eco-Agric. 2016, 24, 1049–1058. (In Chinese) [Google Scholar]
- Liu, X.W.; Til, F.K.; Chen, S.Y. Effects of saline irrigation on soil salt accumulation and grain yield in the winter wheat-summer maize double cropping system in the low plain of North China. J. Integr. Agric. 2016, 15, 2886–2898. [Google Scholar] [CrossRef]
- Wang, X.P.; Yang, J.S.; Liu, G.M.; Yao, R.J.; Yu, S.P. Impact of irrigation volume and water salinity on winter wheat productivity and soil salinity distribution. Agric. Water Manag. 2015, 149, 44–54. [Google Scholar] [CrossRef]
- Ma, W.J.; Chen, Q.J.; Li, L.T.; Yu, Z.R.; Niu, L. Effect of slight saline water irrigation on soil salinity and yield of crop. Trans. CSAE 2010, 26, 73–80. [Google Scholar]
- Tarek, S.; Berndtsson, R.; Magnus, P.; Ahmed, M. Influence of geometric design of alternate partial root-zone subsurface drip irrigation (APRSDI) with brackish water on soil moisture and salinity distribution. Agric. Water Manag. 2012, 103, 182–190. [Google Scholar]
- Mass, E.V.; Hoffman, G.J. Crop salt tolerance-current assessment. J. Irrig. Drain Div. 1977, 103, 115–134. [Google Scholar]
- Bajwa, M.S.; Josan, A.S.; Hira, G.S.; Singh, N.T. Effect of sustained saline irrigation on soil salinity and crop yields. Irrig Sci. 1986, 7, 27–35. [Google Scholar] [CrossRef]
- Askri, B.; Ahmed, A.T.; Abichou, T. Effects of shallow water table, salinity and frequency of irrigation water on the date palm water use. J. Hydrol. 2014, 513, 81–90. [Google Scholar] [CrossRef]
- Assefa, K.A.; Woodbury, A.D. Transient, spatially varied groundwater recharge modeling. Water Resour. Res. 2013, 49, 4593–4606. [Google Scholar] [CrossRef]
- Simunek, J.; Van Genuchten, M.T.; Sejna, M. HYDRUS: Model use, calibration, and validation. Trans. ASABE 2012, 55, 1261–1274. [Google Scholar]
- Ramos, T.B.; Simunek, J.; Gonçalves, M.C.; Martins, J.C.; Prazeres, A.; Castanheira, N.L.; Pereira, L.S. Field evaluation of a multicomponent solute transport model in soils irrigated with saline waters. J. Hydrol. 2011, 407, 129–144. [Google Scholar] [CrossRef]
- Shang, F.Z.; Ren, S.M.; Yang, P.L.; Huang, L.M. Modeling the risk of the salt for polluting groundwater irrigation with recycled water and ground water using HYDRUS-1D. Water Air Soil Pollut. 2016, 227, 1–22. [Google Scholar] [CrossRef]
- Yu, G.J.; Huang, J.S.; Gao, Z.Y. Study on water and salt transportation of different irrigation modes by the simulation of HYDRUS model. J. Hydraul. Eng. 2013, 44, 826–834. [Google Scholar]
- Goncalves, M.C.; Šimůnek, J.; Tiago, B.; Pires, F.P. Multicomponent solute transport in soil lysimeters irrigated with waters of different quality. Water Resour. Res. 2006, 42. [Google Scholar] [CrossRef]
- Kanzari, S.; Hachicha, M.; Bouhlila, R. Characterization and modeling of water movement and salts transfer in a semi-arid region of Tunisia (BouHajla, Kairouan)—Salinization risk of soils and aquifers. Comput. Electron. Agric. 2012, 86, 34–42. [Google Scholar] [CrossRef]
- Wang, X.P.; Liu, G.M.; Yang, J.S.; Huang, G.H.; Yao, R.J. Evaluating the effects of irrigation water salinity on water movement, crop yield and water use efficiency by means of a coupled hydrologic/crop growth model. Agric. Water Manag. 2017, 185, 13–26. [Google Scholar] [CrossRef]
- Xu, C.; Zeng, W.Z.; Wu, J.W. Effects of different irrigation strategies on soil water, salt, and nitrate nitrogen transport. Ecol. Chem. Eng. 2015, 22, 589–609. [Google Scholar] [CrossRef]
- Ding, D.Z. Hebei Soil Species; Hebei Science and Technology Publishing: Shijiazhuang, China, 1992. (In Chinese) [Google Scholar]
- Fang, S.; Chen, X.L. Study on the utilization and transformation of shallow groundwater. Hebei Hydraul. Sci. Technol. 1999, 20, 6–11. (In Chinese) [Google Scholar]
- Šimůnek, J.; Šejna, M.; Van Genuchten, M.T. The Hydrus-1D Software Package for Simulating the One-dimensional Movement of Water, Heat, and Multiple Solutes in Variably-saturated Media; University of California-Riverside Research Reports: Riverside, CA, USA, 2005. [Google Scholar]
- Zeng, W.; Xu, C.; Wu, J.; Huang, J. Soil salt leaching under different irrigation regimes: HYDRUS-1D modelling and analysis. J. Arid Land. 2014, 6, 44–58. [Google Scholar] [CrossRef]
- Min, L.L.; Shen, Y.J.; Pei, H.W. Estimating groundwater recharge using deep vadose zone data under typical irrigated cropland in the piedmont region of the North China Plain. J. Hydrol. 2015, 527, 305–315. [Google Scholar] [CrossRef]
- He, K.K.; Yang, Y.M.; Yang, Y.H. HYDRUS-1D model simulation of soil water and salt movement under various brackish water use schemes in North China Low-plain. Chin. J. Eco-Agric. 2016, 24, 1059–1070. (In Chinese) [Google Scholar]
- Li, H.J.; Yi, J.; Zhang, J.G.; Zhao, Y.; Si, B.C.; Hill, R.L.; Cui, L.L.; Liu, X.Y. Modeling of Soil Water and Salt Dynamics and Its Effects on Root Water Uptake in Heihe Arid Wetland, Gansu, China. Water 2015, 7, 2382–2401. [Google Scholar] [CrossRef]
- Richards, L.A. Capillary conduction of liquids through porous mediums. J. Appl. Phys. 1931, 1, 318–333. [Google Scholar] [CrossRef]
- Van Genuchtenn, M.T. A closed-form equation for predicting the hydraulic conductivity of unsaturated soils. Soil Sci. Soc. Am. J. 1980, 44, 892–898. [Google Scholar] [CrossRef]
- Feddes, R.A.; Kowalik, P.J.; Zaradny, H. Simulation of Field Water Use and Crop Yield; John Wiley & Sons: New York, NY, USA, 1978. [Google Scholar]
- Wesseling, J.G.; Elbers, J.A.; Kabat, P. SWATRE: Instructions for Input, Internal Note, Winand Staring Centre, Wageningen, the Netherlands; International Water Logging and Salinity Research Institute: Lahore, Pakistan, 1991. [Google Scholar]
- Belmans, C.; Wesseling, J.G.; Feddes, R.A. Simulation model of the water balance of a cropped soil: SWATRE. J. Hydrol. 1983, 63, 271–286. [Google Scholar] [CrossRef]
- Hay, R.K.M.; Porter, J.R. The Physiology of Crop Yield, 2nd ed.; Blackwell Publishing: Oxford, UK, 2006. [Google Scholar]
- Childs, S.W.; Gilley, J.R.; Splinter, W.E. A simplified model of corn growth under moisture stress. Trans. ASAE 1977, 20, 858–865. [Google Scholar] [CrossRef]
- Wu, Z.D.; Wang, Q.J. Response to salt stress about winter wheat in Huanghuaihai Plain. Trans. CSAM 2010, 41, 99–104. (In Chinese) [Google Scholar]
- Zhang, X.Y.; Chen, S.Y.; Pei, D. Evapotranspiration, yield and crop coefficient of irrigated maize under straw mulch conditions. Prog. Geol. 2002, 21, 583–592. (In Chinese) [Google Scholar]
- Allen, R.G.; Pereira, L.S.; Raes, D.; Smith, M. Crop Evapotranspiration—Guidelines for Computing Crop Water Requirements; FAO Irrigation and Drainage Paper No. 56; Food and Agriculture Organization of the United Nations (FAO): Rome, Italy, 1998. [Google Scholar]
- Duan, A.W.; Sun, J.S.; Liu, Y. Irrigation Water Quota of Main Crops in North China; China Agricultural Science and Technology Publishing House: Beijing, China, 2004; pp. 60–63. (In Chinese) [Google Scholar]
- Rhoades, J.D.; Kandiah, A.; Mashali, A.M. The Use of Saline Waters for Crop Production; FAO Irrigation and Drainage Paper 48; Food and Agriculture Organization of the United Nations (FAO): Rome, Italy, 1992. [Google Scholar]
- Bresler, E.; McNeal, B.L.; Carter, D.L. Saline and Sodic Soils: Principles Dynamics-modeling; Springer: Berlin, Germany, 1982. [Google Scholar]
- Xin, J.F.; Zhang, G.Y.; Li, Y.Z. Comparative and relationship of the different methods to expressing soil salinity. In Movement of Water and Salt in Saline Soil; Beijing Agricultural University Press: Beijing, China, 1986; pp. 57–60. (In Chinese) [Google Scholar]
- Chen, S.Y.; Zhang, X.Y.; Shao, L.W.; Sun, H.; Liu, X.W. Effect of deficit irrigation with brackish water on growth and yield of winter wheat and summer maize. Chin. J. Eco-Agric. 2011, 19, 579–585. (In Chinese) [Google Scholar] [CrossRef]
- Schaap, M.G.; Leij, F.J.; van Genuchten, M.T. Rosetta: A computer program for estimating soil hydraulic parameters with hierarchical pedotransfer functions. J. Hydrol. 2001, 251, 163–176. [Google Scholar] [CrossRef]
- Shao, M.A.; Wang, Q.J.; Huang, M.B. Soil Physics; High Education Press: Beijing, China, 2006; pp. 203–205. (In Chinese) [Google Scholar]
- Sun, H.Y.; Shen, Y.J.; Yu, Q. Effect of precipitation change on water balance and WUE of the winter wheat–summer maize rotation in the North China Plain. Agric. Water Manag. 2010, 97, 1139–1145. [Google Scholar] [CrossRef]
- Ayers, R.S.; Westcot, D.W. Water Quality for Agriculture; FAO Irrigation and drainage paper 29 Rev. 1; Food and Agriculture Organization of the United Nations (FAO): Rome, Italy, 1976. [Google Scholar]
- Rameshwaran, P.; Tepe, A.; Yazar, A.; Ragab, R. Effects of drip-irrigation regimes with saline water on pepper productivity and soil salinity under greenhouse conditions. Sci. Hortic. 2016, 199, 114–123. [Google Scholar] [CrossRef]
- Wang, Q.M.; Huo, Z.L.; Zhang, L.D. Impact of saline water irrigation on water use efficiency and soil salt accumulation for spring maize in arid regions of China. Agric. Water Manag. 2016, 163, 125–138. [Google Scholar] [CrossRef]
- Pang, H.C.; Li, Y.Y.; Yang, J.S. Effect of brackish water irrigation and straw mulching on soil salinity and crop yields under monsoonal climatic conditions. Agric. Water Manag. 2010, 97, 1971–1977. [Google Scholar] [CrossRef]
- Kiremit, M.S.; Arslan, H. Effects of irrigation water salinity on drainage water salinity, evapotranspiration and other leek (Allium porrum L.) plant parameters. Sci. Hortic. 2016, 201, 211–217. [Google Scholar] [CrossRef]
- Li, C.J.; Lei, J.Q.; Zhao, Y. Effect of saline water irrigation on soil development and plant growth in the Taklimakan Desert Highway shelterbelt. Soil Till. Res. 2015, 146, 99–107. [Google Scholar] [CrossRef]
- Ma, W.J.; Mao, Z.Q.; Yu, Z.R.; Driessen, P.M. Effects of saline water irrigation on soil salinity and yield of winter wheat–maize in North China Plain. Irrig. Drain. Syst. 2008, 22, 3–18. [Google Scholar] [CrossRef]
- Li, X.B.; Kang, Y.H.; Wan, S.Q. Reclamation of very heavy coastal saline soil using drip-irrigation with saline water on salt-sensitive plants. Soil Till. Res. 2015, 146, 159–173. [Google Scholar] [CrossRef]
- Chen, W.P.; Hou, Z.N.; Wu, L.S. Evaluating salinity distribution in soil irrigated with saline water in arid regions of northwest China. Agric. Water Manag. 2010, 97, 2001–2008. [Google Scholar] [CrossRef]
- Lai, J.B.; Li, R. Estimation of effective hydraulic parameters in heterogeneous soils at field scale. Geoderma 2016, 264, 28–41. [Google Scholar] [CrossRef]
- Karimov, A.K.; Šimůnek, J.; Hanjra, M.A.; Avliyakulov, M.; Forkutsa, I. Effects of the shallow water table on water use of winter wheat and ecosystem health: Implications for unlocking the potential of groundwater in the Fergana Valley (Central Asia). Agric. Water Manag. 2014, 131, 57–69. [Google Scholar] [CrossRef]
- Han, M.; Zhao, C.Y.; Šimůnek, J.; Feng, G. Evaluating the impact of groundwater on cotton growth and root zone water balance using Hydrus-1D coupled with a crop growth model. Agric. Water Manag. 2015, 160, 64–75. [Google Scholar] [CrossRef]
- Shouse, P.J.; Ayars, J.E.; Simunek, J. Simulating root water uptake from a shallow saline groundwater resource. Agric. Water Manag. 2011, 98, 784–790. [Google Scholar] [CrossRef]
- Lekakis, E.H.; Antonopoulos, V.Z. Modeling the effects of different irrigation water salinity on soil water movement, uptake and multicomponent solute transport. J. Hydrol. 2015, 530, 431–446. [Google Scholar] [CrossRef]
- Gao, H.B.; Shao, M.A. Effects of temperature changes on soil hydraulic properties. Soil Till. Res. 2015, 153, 145–154. [Google Scholar] [CrossRef]
- Grant, S.A.; Bachmann, J. Effect of temperature on capillary pressure. In Environmental Mechanics: Water, Mass and Energy Transfer in the Biosphere: The Philip Volume; American Geophysical Union: Washington, DC, USA, 2002; pp. 199–212. [Google Scholar] [CrossRef]
- Haridasan, M.; Jensen, R.D. Effect of temperature on pressure head–water content relationship and conductivity of two soils. Soil Sci. Soc. Am. J. 1972, 36, 703–708. [Google Scholar] [CrossRef]
- Duke, H.R. Water temperature fluctuations and effect on irrigation infiltration. Trans. ASAE 1992, 35, 193–199. [Google Scholar] [CrossRef]
- Gharabaghi, B.; Safadoust, A.; Mahboubi, A.A.; Mosaddeghi, M.R.; Unc, A.; Ahrens, B.; Sayyad, G. Temperature effect on the transport of bromide and E. coli NAR in saturated soils. J. Hydrol. 2015, 522, 418–427. [Google Scholar] [CrossRef]
© 2017 by the authors. Licensee MDPI, Basel, Switzerland. This article is an open access article distributed under the terms and conditions of the Creative Commons Attribution (CC BY) license (http://creativecommons.org/licenses/by/4.0/).