Article

Understanding the Role of Groundwater in a Remote Transboundary Lake (Hulun Lake, China)

1
College of Water Resources and Civil Engineering, Inner Mongolia Agricultural University, 306 Zhaowuda Rd., Hohhot 010018, China
2
Department of Geoscience, University of Calgary, Calgary, AB T2L 1N4, Canada
*
Author to whom correspondence should be addressed.
Water 2017, 9(5), 363; https://doi.org/10.3390/w9050363
Submission received: 14 January 2017 / Revised: 8 April 2017 / Accepted: 4 May 2017 / Published: 22 May 2017
(This article belongs to the Special Issue Isotopes in Hydrology and Hydrogeology)

Abstract

:
Hulun Lake, located in a remote, semi-arid area in the northeast part of Inner Mongolia, China, shares a transboundary basin with Mongolia and supports a unique wetland ecosystem that includes many endangered species. Decadal scale decreases in the lake stage and increased salinity make an understanding of the lake’s water and salt sources critical for appropriate design of strategies to protect and manage the lake. Multiple tracers (chloride, and δ18O and δ2H in water) in samples collected from lake water, rivers, and nearby water wells were used in conjunction with an annual water balance based on historic data to better understand the lake’s major water and salt sources. The average annual water balance was conducted for two time periods: 1981–2000 and 2001–2013. The contribution of river discharge to the annual lake input decreased by half (from 64% to 31%) between the two time periods, while the volumetric contribution of groundwater discharge increased four-fold (from about 11% to about 50% of the total lake input). Significant evaporation was apparent in the stable isotope composition of the present-day lake water, however, evaporation alone could not account for the high lake water chloride concentrations. Limited domestic well water sampling, a regional salinity survey, and saline soils suggest that high chloride groundwater concentrations exist in the region south of the lake. The chloride mass balance suggested that groundwater currently contributes more than 90% of the annual chloride loading to the lake, which is likely four times greater than the earlier period (1981–2000) with lower groundwater input. The use of water and chloride mass balances combined with water isotope analyses could be applied to other watersheds where hydrologic information is scarce.

1. Introduction

Lakes and reservoirs are critical water resources for local ecosystem conservation and socioeconomic development, especially in arid and semi-arid regions. However, climatic changes and recent overallocation of water resources have affected the hydrological cycle of these water systems, leading to decreased water availability, decreasing water levels (in groundwater and surface water), water quality deterioration, and land desertification [1,2]. Sustainable management of water resources requires an understanding of the inputs and outputs to a water system and the dynamics of how groundwater and surface water interact with each other.
Hulun Lake, located in a remote, semi-arid area in the northeast part of Inner Mongolia, China (Figure 1a), is the fifth largest lake in China. It supports a unique wetland ecosystem that includes many endangered species, and is a Ramsar Wetland of International Importance included within UNESCO’s World Network of Biosphere Reserves [3]. An approximately four-meter water level decline (observed since 2001) has resulted in a rapidly shrinking lake size [4]. Sparse discharge data indicate inflow from the two rivers (Kelulun River and Wuerxun River) that flow into the lake has decreased from 1.75 billion m3 in 1999 to 0.25 billion m3 in 2011 [5]. Low river flows have contributed to decreased water levels, which have caused Hulun Lake to become endorheic (i.e., lacking any surface water outflow). No outflow has occurred through Hulun Lake’s outlet (the Xinkai River) since 2000 [3], and lake water salinity has increased from 1466 mg/L in 1999 to 2395 mg/L in 2011 [6]. Moreover, the lake has suffered from visible eutrophication, impacting its ecological function [7].
Concern over the declining lake water level and deteriorated water quality have prompted research [3,5,8,9,10,11] which has linked decreased water level to climate change. However, few lake water budget studies were conducted due to sparseness of available hydrologic and geologic information. Although a significant groundwater contribution to Hulun Lake’s annual water balance has been implicated [8,9,10], no clear lines of evidence have been used to evaluate the relative magnitude of groundwater contribution to lake input, nor the potential groundwater contribution to increasing lake salinity. In particular, although the stable isotopes of water can provide good insight into lake water balances and associated processes [12,13,14], they have not been applied to the Hulun Lake watershed.
Isotopic investigations are widely acknowledged as powerful approaches to study the hydrologic cycle in ungauged or poorly gauged watersheds [15]. A combination of hydrochemical tracers and stable isotopes approaches can provide insight into hydrological processes, including apportionment between water sources (including groundwater contribution), and their contribution to lake water balances [16,17,18,19,20,21,22]. In particular, the increase in the values of stable isotopes in water (δ2H and δ18O) with the increasing extent of evaporative losses [23] can be incorporated into isotope-mass balance determinations to quantify water balances [24]. Similarly, conservative ions, such as chloride, can provide an independent line of evidence to estimate evaporative loss when it is reasonable to assume increased chloride concentrations result from evaporation only [25].
The objective of this study was to advance the understanding of the role of groundwater in the Hulun Lake water balance and how this role has changed over time, and to evaluate the relative sources of salt, or chloride, to the present-day lake. The sparse hydrologic data were applied to construct water budgets over two time periods. The sparse historic data were combined with stable isotopic composition and chloride concentrations in samples collected from the lake, nearby wells, and the two inflowing rivers in 2014.

2. Materials and Methods
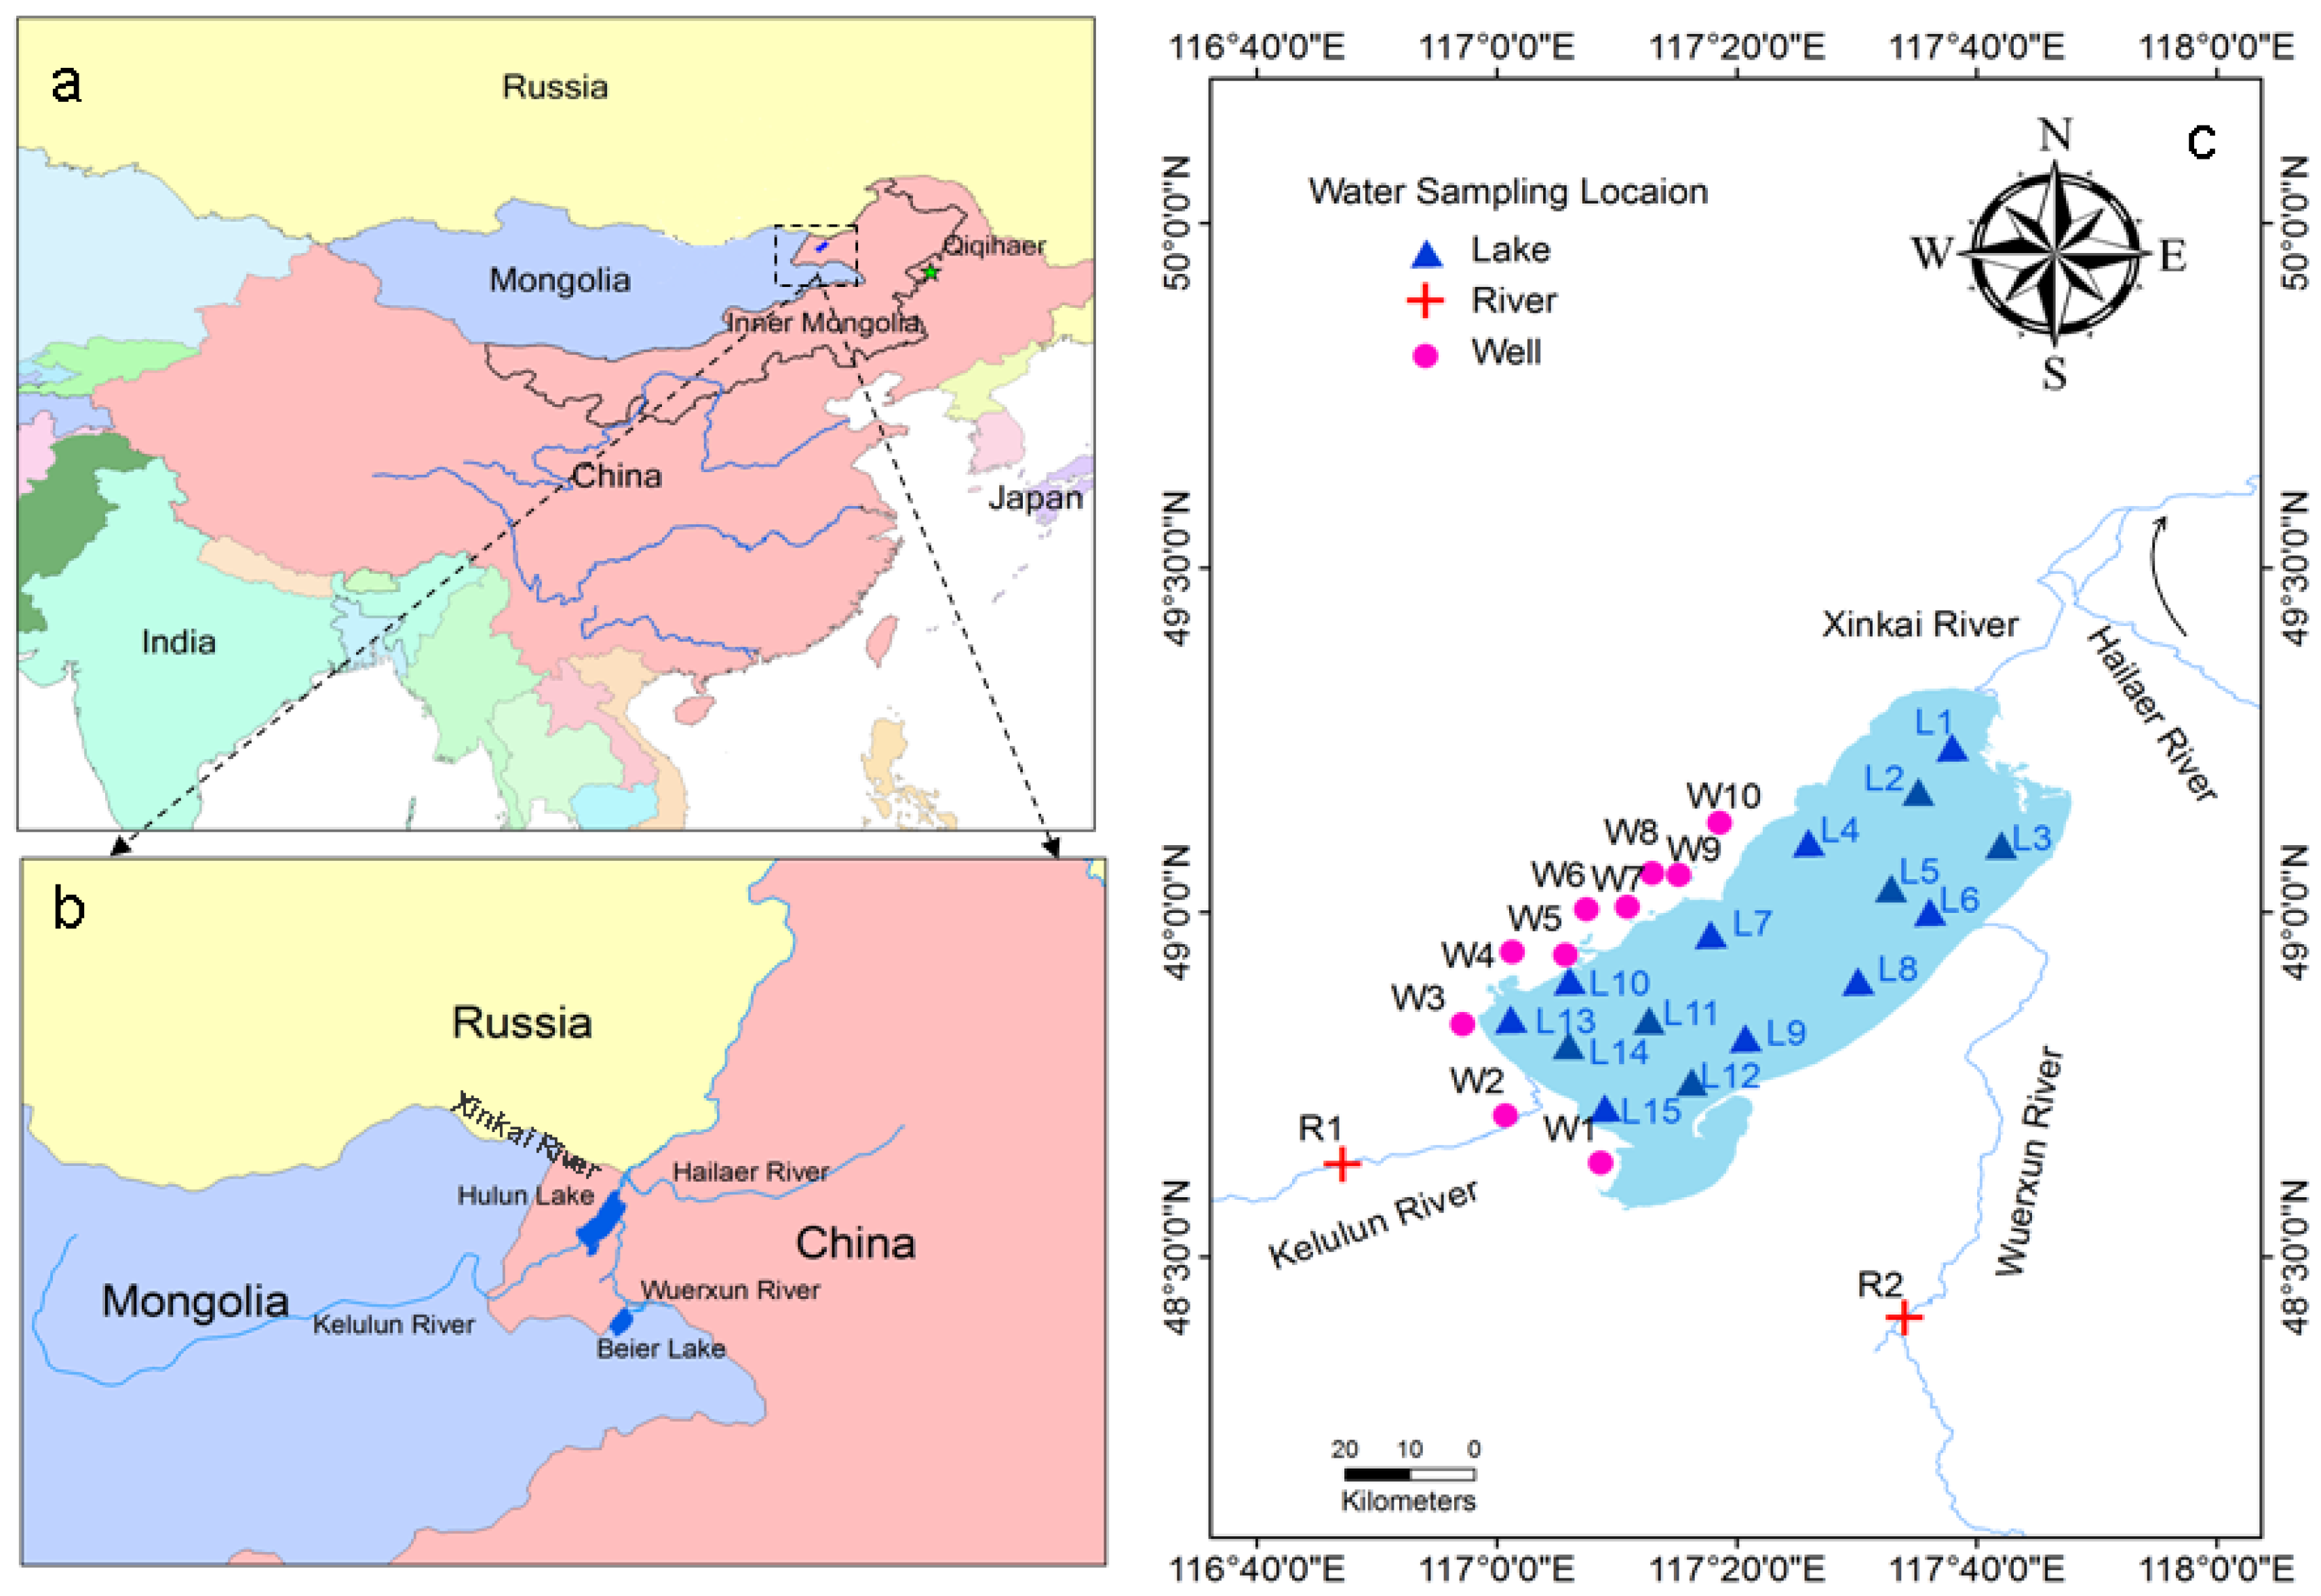
2.1. Study Area

Hulun Lake, located in a remote, semi-arid area in the northeast part of Inner Mongolia, China (Figure 1a), is the fifth largest lake in China, with a maximum area of 2339 km2 and a maximum water depth of 8 m in 1963 [26]. Although the lake is located in China, about 64% of the lake’s total basin is located in Mongolia [27]. Lake level data between 1981 and 2013 showed variable, but overall steady levels between 1981 and 2000, and steadily decreasing levels between 2000 and 2011, with a total lake level decrease of about four meters [4].
Although largely ungauged, discharges from Kelulun and Wuerxun Rivers (Figure 1b) are the main lake water sources, and have been historically thought to be the main control on the lake water level and size [9]. Most of the Kelulun River’s basin is located within the Khentii Mountains in Mongolia. The Wuerxun River’s source is Beier Lake, which is an important natural fishery (Figure 1). The intermittent Xinkai River, located at the northeastern extent of Hulun Lake (Figure 1c), provides a sporadic outlet from Hulun Lake, transmitting the lake discharge to the Hailaer River, which flows north from its intersection with the Xinkai River, marking the border between China and Russia. The Xinkai River outlet occurs when Hulun Lake’s elevation exceeds 544.8 m a.s.l. (above sea level) [21]. At lower lake water levels, there is no lake outlet, and Hulun Lake is a closed, or endorheic basin, with evaporation providing the main source of water loss. There has been no outflow from Hulun Lake since 2000 [3].
The study area is located in a semi-arid steppe area of the mid-temperate zone, with a climate influenced by the prevailing westerly winds and the East Asian monsoon. In the past 50 years, mean annual precipitation ranged between 247 and 319 mm, with 80%–86% of the annual precipitation falling between June and September. Mean annual air temperature is 0.3 °C, with the highest average monthly temperature in July 20.3 °C, and the lowest average monthly temperature in January −21.2 °C. Mean annual evaporation ranged between 1400 and 1900 mm, which is 5–6 times greater than the mean annual precipitation [28].
Hulun Lake is mainly surrounded by broad lacustrine and alluvial plains scattered with stable and semi-stable sand dunes along the southern and eastern shores. Mesozoic volcanic rocks form low mountains (maximum elevation of 850 m a.s.l.) that are located along a fault system on the northwest axis of the lake [28]. Extensive wetlands in the peripheral lake areas and shallow (hand-dug) domestic water wells suggest that a shallow groundwater table is present in the lake periphery.

2.2. Field Sampling and Analytical Methods

Water samples were collected from the lake, the two inflowing rivers, and the domestic water wells west and south of the lake between June and August of 2014 (Figure 1c). The samples were field filtered through 0.45-μm filters and stored in tightly capped plastic bottles for transport. Chloride analyses were conducted by ion chromatography using an ICS-90 chromatograph (Dionex, Sunnyvale, CA, USA) with an analytical uncertainly of ±1%. The hydrogen and oxygen stable isotope analyses were conducted using a CO2–H2 equilibration unit coupled with an Isotope Ratio Mass Spectrometer (IRMS; Finnigan MAT Delta S, ThermoFisher, Waltham, MA, USA). The standard deviation in this analysis was 0.1 for δ18O and 1.0 for δ2H. The isotope values are expressed as deviations in per mill (‰) relative to standard values of Vienna Standard Mean Ocean Water (VSMOW), shown as below:
δ [ ] = [ R s a m p l e / R s t a n d a r d 1 ] × 1000
Although the Kelulun River was sampled at one location (Figure 1) on four dates, the Wuerxun River (which is not easily accessed) was sampled only once.

2.3. Average Annual Lake Water Balance

An average annual water balance was conducted on Hulun Lake using available hydrologic data to evaluate the role of groundwater in the lake hydrological system. Historic river discharge data for the Kelulun and Wuerxun Rivers, monthly pan evaporation, and precipitation data were available from the Hulunbeier Hydrological Station in Inner Mongolia, China (Supplementary data). Surface water runoff in the Hulun Lake basin was assumed to be negligible given the high degree of vegetation coverage, permeable soils in this area, and absence of visual evidence. The lake inflow thus includes precipitation, two rivers (Kelulun and Wuerxun), and groundwater. Lake water outflow consists of mainly evaporation and periodic discharge via the Xinkai River (i.e., when the Hulun Lake stage elevation exceeds 544.8 m a.s.l.). The average annual water balance equation of Hulun Lake can be expressed as:
ΔS=(PE)A+ Q in Q out +ΔV
where ΔS is the variation in annual lake water storage (m3), estimated as the change in lake level multiplied by the lake area; A is the lake area (m2) interpreted by Landsat image; P is the annual volume of precipitation (m); E is the annual volume of lake evaporation (m); Qin, is total annual river discharge (m3) from the Kherlen and Wuerxun Rivers as interpolated by sparse data; Qout is the annual discharge of the Xinkai River (which was assumed to have an annual discharge of 1.44 × 10⁸ m3 when the lake level exceeded 544.8 m [26]); and ΔV (m3) is the annual groundwater component of the water balance, which is the only component that cannot be directly measured or indirectly estimated using available data.
Hulun Lake evaporation was estimated by using monthly pan-evaporation data from the Hulunbeier Hydrological Station, and an empirical correlation coefficient of 0.61 estimated from measured pan evaporation and open lake evaporation during a long-term field experiment at Hulun Lake from 1974 to 1984 [8].

2.4. Estimation of Evaporative Loss Based on the Stable Isotope Composition

The use of stable isotopes in water to quantify evaporative losses is essential in remote and semi-arid areas, where evaporative losses are significant and data are scarce. This approach takes advantage of the fractionation effect on hydrogen and oxygen that occurs at the interface between liquid and vapour during evaporation. The calculation of evaporative loss based on stable isotopes in residual water was initially founded on the Craig–Gordon model [29], which described the change in stable isotope composition of residual water and vapour during the evaporation process. The Craig–Gordon model has been reformulated to express these changes as a ratio of evaporation (E) to inflow (I) [30,31,32,33]. In this reformulated case, the ratio of evaporation to inflow in a lake is:
E / I = [ ( δ L δ I ) ( δ * δ L ) × m ]
where δL is the isotopic composition of residual lake water (i.e., Hulun Lake, ‰), δI is the isotopic composition of inflowing water (‰), δ* is the limiting isotope composition (or the isotopic composition after which further evaporation does not result in increased isotopic enrichment of the residual water, defined below, in ‰), and m is the slope calculation factor (also defined below) [34,35].
The limiting isotopic composition enrichment factor, δ*, which is a function of air humidity (h), the isotope composition of moisture in ambient air (δA), and the enrichment factor (ε), is defined as [34,35]:
δ * = h × δ A + ε h ε 1000
Since the isotopic composition of moisture in ambient air (δA in Equation (4)) is difficult to measure in the field, the value is usually estimated from the isotopic composition of local precipitation (δP) based the isotopic equilibrium between δP and δA [31,32,33,34,35,36].
δ A = ( δ P ε + ) / α +
where α+ is the equilibrium liquid–vapour isotope fractionation factor, and ε+ is the temperature-dependent equilibrium isotope fractionation factor.
The slope calculation factor (m) in Equation (3) is defined [37,38] as:
m = h ε 1000 1 h + ε k 1000
where εk is the kinetic isotope fractionation factor [30].
In Equations (4) and (6), ε is a “total isotope fractionation factor, equal to the sum of the equilibrium isotope fractionation factor (ε+) and the kinetic isotope fractionation factor (εk)” [39]:
ε = ε + + ε k
The temperature-dependent equilibrium isotope fractionation factor, ε, is defined as ε = 1000(1 − α+), where α + is given below as a function of the interface temperature (°K) [40] for each isotope as follows:
10 3 ln ( α + ) = 1158.8 × ( T 3 10 9 ) 1620.1 × ( T 2 10 6 ) + 794.84 × ( T 10 3 ) 161.04 + 2.9992 × ( 10 9 T 3 )
for δ2H, and
10 3 ln ( α + ) = 7.685 + 6.7123 × ( 10 3 T ) 1.6664 × ( 10 6 T 2 ) + 0.35041 × ( 10 9 T 3 )
for δ18O.
The kinetic enrichment factors for each isotope, εk, are dependent on the boundary layer conditions and the humidity deficit:
ε k = 12.5 ( 1 h ) × 10 3
for δ2H, and
ε k = 14.2 ( 1 h ) × 10 3
for δ18O.
A freely available and validated software, Hydrocalculator, was used to calculate the evaporative loss from lake water based on the equations above [41]. The stable isotopic composition of precipitation (δP) was estimated as average values measured in precipitation from the nearest International Association of Atomic Energy’s Global Network of Isotopes in Precipitation station (Qiqihar, China (Figure 1); δP2H = –113.94‰, δP18O = −15.00‰ [42]). The isotopic compositions of inflowing water for Hulun Lake was estimated as the intersection of the evaporation line with the LMWL (Local Meteoric Water Line) (δI2H = −88.94‰, δI18O = −11.70‰), which was taken to represent the weighted mean composition of water input to the lake [24]. Values for mean air temperature (T = 0.3 °C) and relative humidity (h = 0.6) measured at the Hulunbeier Hydrological Station were used. The stable isotopic composition of moisture in ambient air (δA) was estimated by ε+ and α +, where ε+ was 111.31‰ for δ2H and 11.78‰ for δ18O, α+ was 1.1113 for δ2H and 1.0118 for δ18O.

3. Results and Discussion

3.1. Changes in Hydrological Budget and Net Groundwater

Lake water level variations between 1981 and 2013 were separated into two periods: 1981–2000 (when lake levels were relatively stable [4]) and 2001–2013 (when lake levels showed an overall decline of about 4 m) for the water balance calculations (Table 1). The water was balance reflected in the lake level changes, and was significantly different for the two periods. In particular, the annual difference in water storage (ΔS) changed from a surplus in the earlier period (when outflow to the Xinkai River occurred sporadically) to a deficit in the later period, when outflow to the Xinkai River was infrequent, and lake levels gradually declined. The contribution of river water to the annual lake inputs (Qin) decreased from 63.6% in the earlier period to 30.7% in the later period. The relative contribution of precipitation to the annual water budget decreased slightly from 24.9% in the earlier period to 19.4% in the later period. In contrast, evaporation increased by 8%, from 20.4 × 10⁸ m3 in the earlier period, to 22.0 × 10⁸ m3 in the latter period.
Although the calculated contribution of groundwater (ΔV) increased from 11.4% in the earlier period to 49.9% in the later period (Table 1), the increase was apparently insufficient to mitigate lake water storage losses (ΔS) in the face of significantly decreased river flows, decreased precipitation, and increased evaporation. The increased contribution of groundwater in the latter period, when the lake level was lower, reflected an increased hydraulic gradient between regional groundwater table and lower lake level.

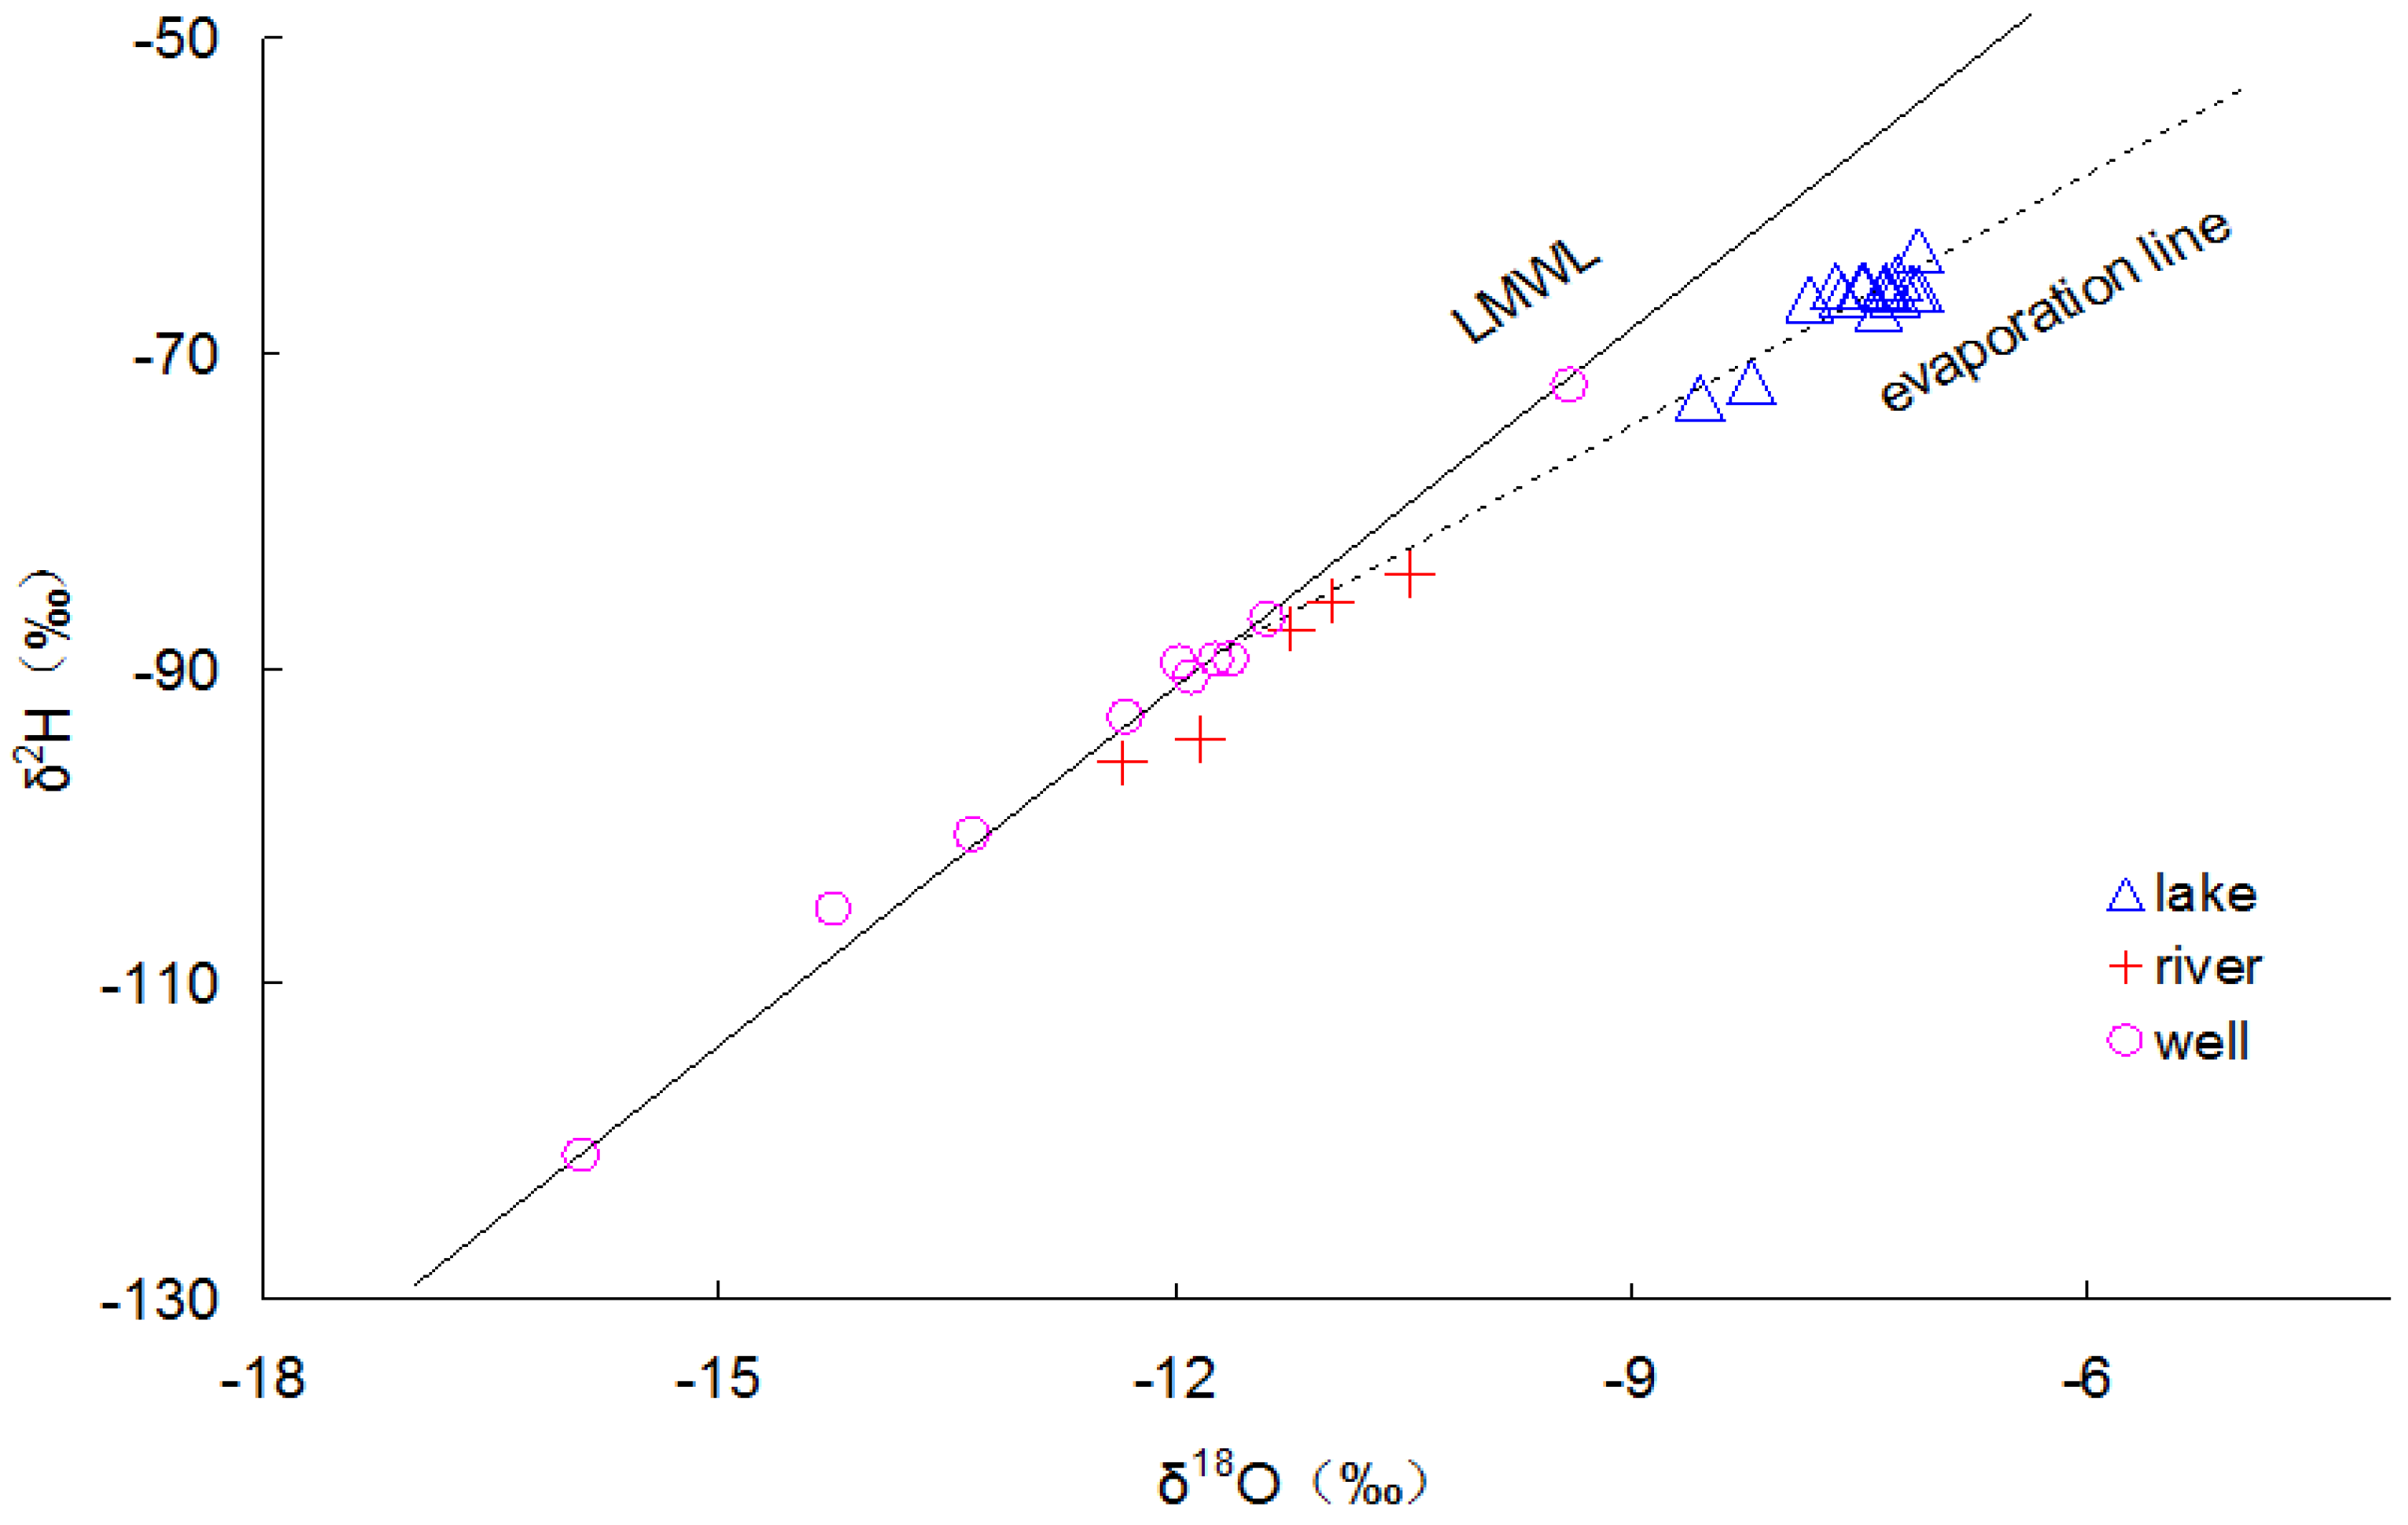
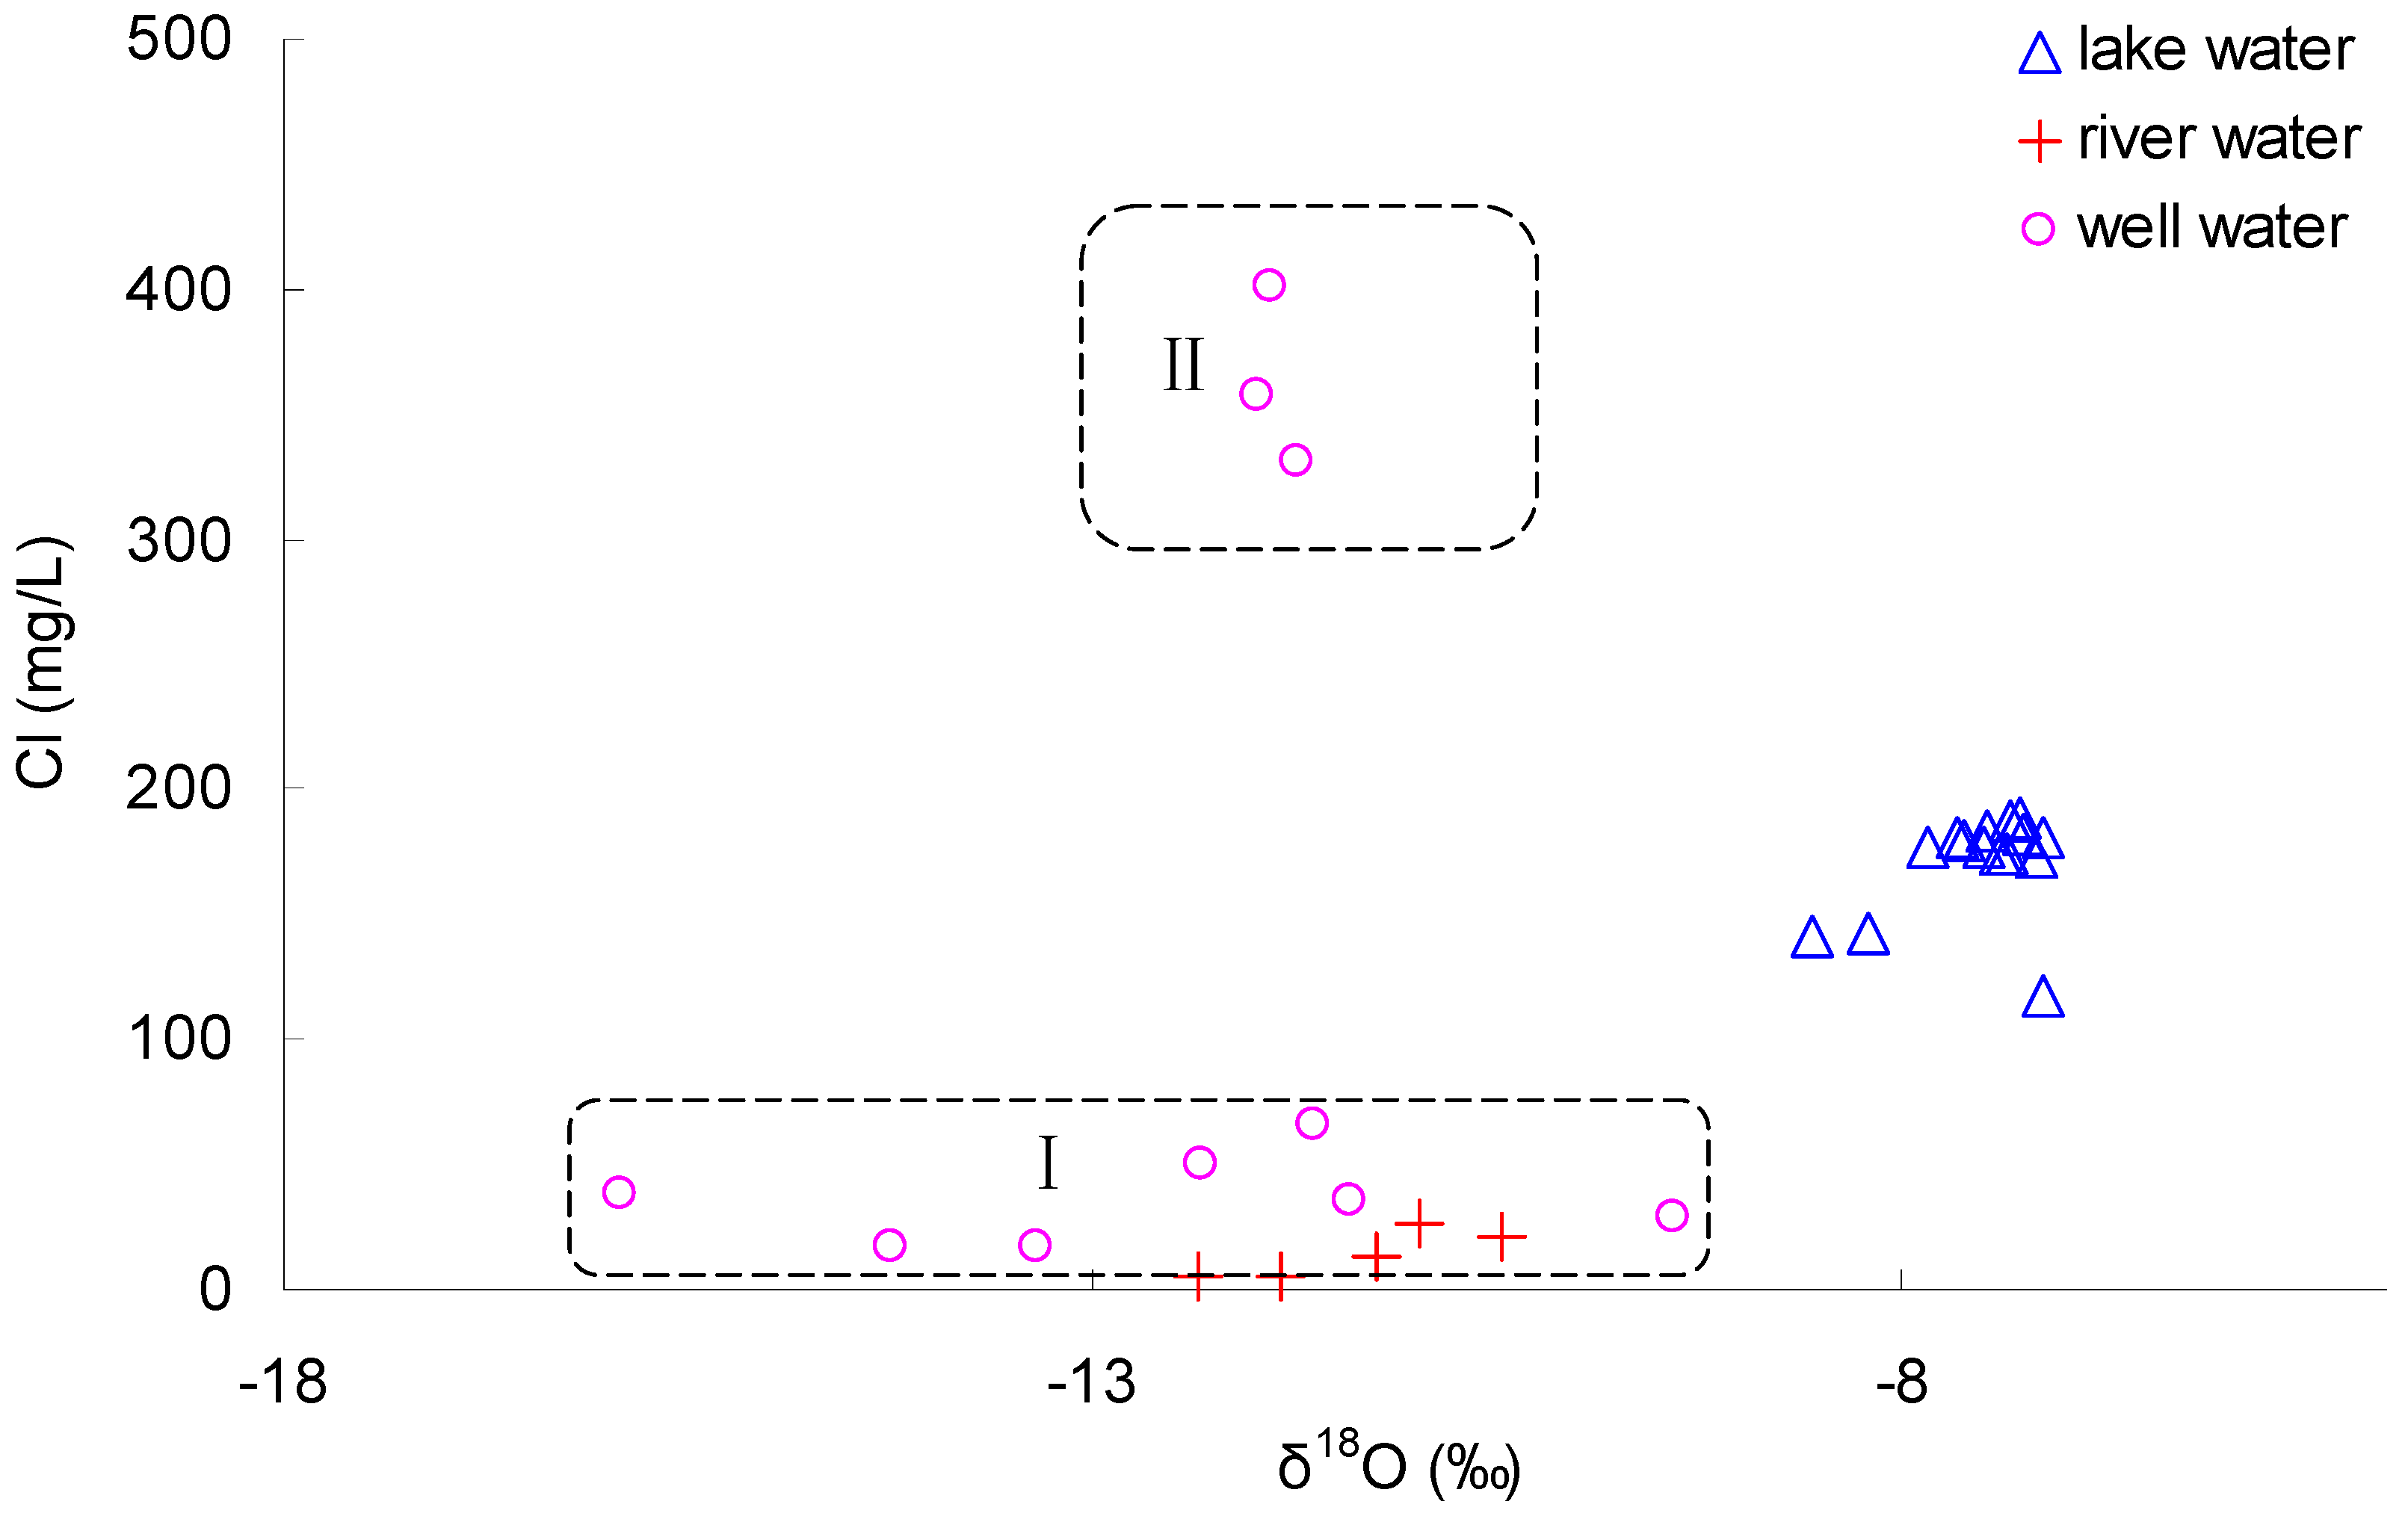
3.2. Isotopic Composition and Chloride Concentrations in Present Day Hulun Lake and Its Water Sources

The chloride concentrations and isotopic (δ18O and δ2H) compositions of lake, river, and well water are shown in Table 2, and a dual isotope plot of δ18O and δ2H is shown in Figure 2. The LMWL is defined by the precipitation data from the nearest International Association of Atomic Energy’s Global Network of Isotopes in Precipitation station in Qiqihar, China [42]. The three types of water samples are plotted distinctly on the dual isotope plot. The domestic water well samples are plotted along the LMWL, reflecting meteoric water that has recharged the groundwater without undergoing any significant precipitation. The wide range in domestic well water isotopic composition (i.e., δ18O values ranging from –15.91‰ to −9.41‰, and δ2H values ranging from −120.87‰ to −72.02‰) suggested groundwater has been recharged at varying temperatures or elevations, with the samples with lower values (e.g., W9 and W10) likely representing groundwater that was recharged at significantly higher elevation [43], perhaps in the mountains northwest of Hulun Lake. Six domestic well water samples form a cluster on the dual isotope diagram (i.e., with δ18O values ranging from ~–12.33‰ to −11.40‰, and δ2H values ranging from –93.05‰ to –86.86‰) near the river water samples, and seem to represent more local recharge. The lake water samples fall on a line that originates from the cluster of domestic well water and river water samples, with a slope (5.32) that is less than that of the meteoric water line (7.59) and is consistent with lake evaporation in a semi-arid climate [44].
A cross plot of chloride concentrations vs. δ18O values of lake, river, and domestic well water samples is shown in Figure 3. Higher chloride concentrations and δ18O values were found in the lake relative to the rivers, which is consistent with more extensive evaporation of the lake water relative to the rivers. The domestic well water samples, which did not show any evidence of evaporation (Figure 2), are plotted in two zones in Figure 3. Zone I contains domestic well water samples with a wide variety of isotopic compositions (thought to represent varying recharge elevation) but consistently low chloride concentrations (i.e., less than 70 mg/L). These samples (W4 to W10 in Table 2) are from domestic water wells on the west side of Hulun Lake. In Zone II, relatively high chloride values (>330 mg/L) occurred in three wells south of the lake (W1 to W3 in Table 2), however, the stable isotope values are not different from the samples in Zone I (Figure 2). The high chloride concentrations in the Zone II water samples reflect another source of chloride such as rock–water interaction in regional groundwater flow. A similar effect was studied in Australia, where researchers distinguished between evaporation-induced increases in chloride concentrations and rock–water interaction using a suite of isotopic and geochemical tools [45,46,47]. The southern region of Hulun Lake has salt-rich solonchak soil, suggesting the discharge of, and potential presence of, salt-rich groundwater [26]. The possibility of high chloride concentrations in the south of Hulun Lake is discussed after the chloride mass balance below.

3.3. Evaporative Loss Calculations as an Indication of Saline Groundwater Discharge to Hulun Lake

3.3.1. Evaporative Loss Calculations and Their Uncertainty

The ratio of evaporation to inflow (E/I) was calculated using each of δ2H and δ18O (Table 3). The mean E/I ratios ranged from 0.20 to 0.51 in samples taken from different locations on the lake, which are consistent with relatively high evaporation rates relative to inflow in lakes [41]. Although the E/I values vary between δ2H and δ18O, they were linearly correlated with one another (with an R2 value of 0.72), and differences between E/I values calculated with δ2H and δ18O are common studies on evaporative loss [34,35,36,37,38,39,40]. In general, the values calculated using δ18O (in this case, ranging between 0.20 and 0.33; Table 3) are considered more reliable than those calculated using δ2H [40,41], and are used below.
The E/I values calculated using Hydrocalculator [41] were not particularly sensitive to climatic values. The calculated values of E/I only differed by ~0.009 for δ2H, and ~0.001 for δ18O, for each degree of temperature change. A similar, small range of uncertainty occurred when humidity was varied, where difference of 1% resulted in a difference in the E/I value of ~0.005 for δ18O and ~0.017 for δ2H. The assumption of isotopic equilibrium between precipitation (δP) and moisture in ambient air (δA) is a source of uncertainty in E/I. However, the dependence lies primarily in the limiting isotope enrichment factor (δ*) and moisture in ambient air (δA) [41,42]. In our case, change in δA estimation of 10‰ in δ2H input values caused a difference in the E/I value of 0.147, and a change in δA input values of 1‰ in δ18O caused a difference in the E/I value of 0.020.

3.3.2. Evidence of Groundwater Discharge with High Salinity to Hulun Lake

Chloride can be used as a conservative tracer to indicate evaporation of water since it is not affected by geochemical processes except at very high concentrations, i.e., when chloride mineral solubilities are exceeded. Assuming that dissolved chloride and stable isotopes are transported in a similar manner in the lake, and their concentration variations depend only on evaporation and mixing of the lake water sources, then the relationship between calculated evaporative loss from lake water (E/I) and chloride concentration can be estimated as follows [48]:
E / I = [ 1 C l I / C l L ]
where ClI and ClL are chloride concentrations in the inflow and lake water respectively. Using the E/I ratios calculated from the water isotope data, the initial weighted mean chloride concentration in inflowing water from all water sources can be estimated as:
C l I = ( 1 E / I ) × C l L
Since the use of δ18O is more reliable than δ2H for evaporation calculations (as discussed above), the E/I ratios calculated using δ18O (Table 3) were used to estimate the average chloride concentrations of Hulun Lake’s total inflow. The resulting calculated chloride concentrations for the combined input from rivers, precipitation, and groundwater ranged from 78.4 to 131.2 mg/L, with an average value of 120.1 mg/L (Table 3).
The estimated average chloride concentration for total inflow to the lake (i.e., 120.1 mg/L) is much higher than the measured river chloride concentrations (i.e., average of 14.4 mg/L (std. dev. 10.6, n = 4) in the Kelulun River, and 12.6 mg/L for a single sample the Wuerxun River; Table 1), and also higher than chloride concentrations in precipitation (e.g., 5.8 mg/L measured in northern China) [48]. Recent lake sediment sampling in Hulun Lake revealed low sediment chloride concentrations do not indicate lake bottom sediments as a chloride source [49]. The remaining component of lake water input that could be responsible for relatively high lake water chloride concentrations is groundwater discharge, which is estimated to be 24.8% of total annual input (Table 1, 1981–2013). As discussed above, the three domestic water wells sampled south of the lake (W1, W2, and W3; Figure 1) had elevated chloride concentrations ranging from 330 to 400 mg/L (Table 2), with an average value of 363 mg/L, suggesting groundwater discharge to Hulun Lake could be a significant source of chloride. This is discussed below in the context of a chloride mass balance.

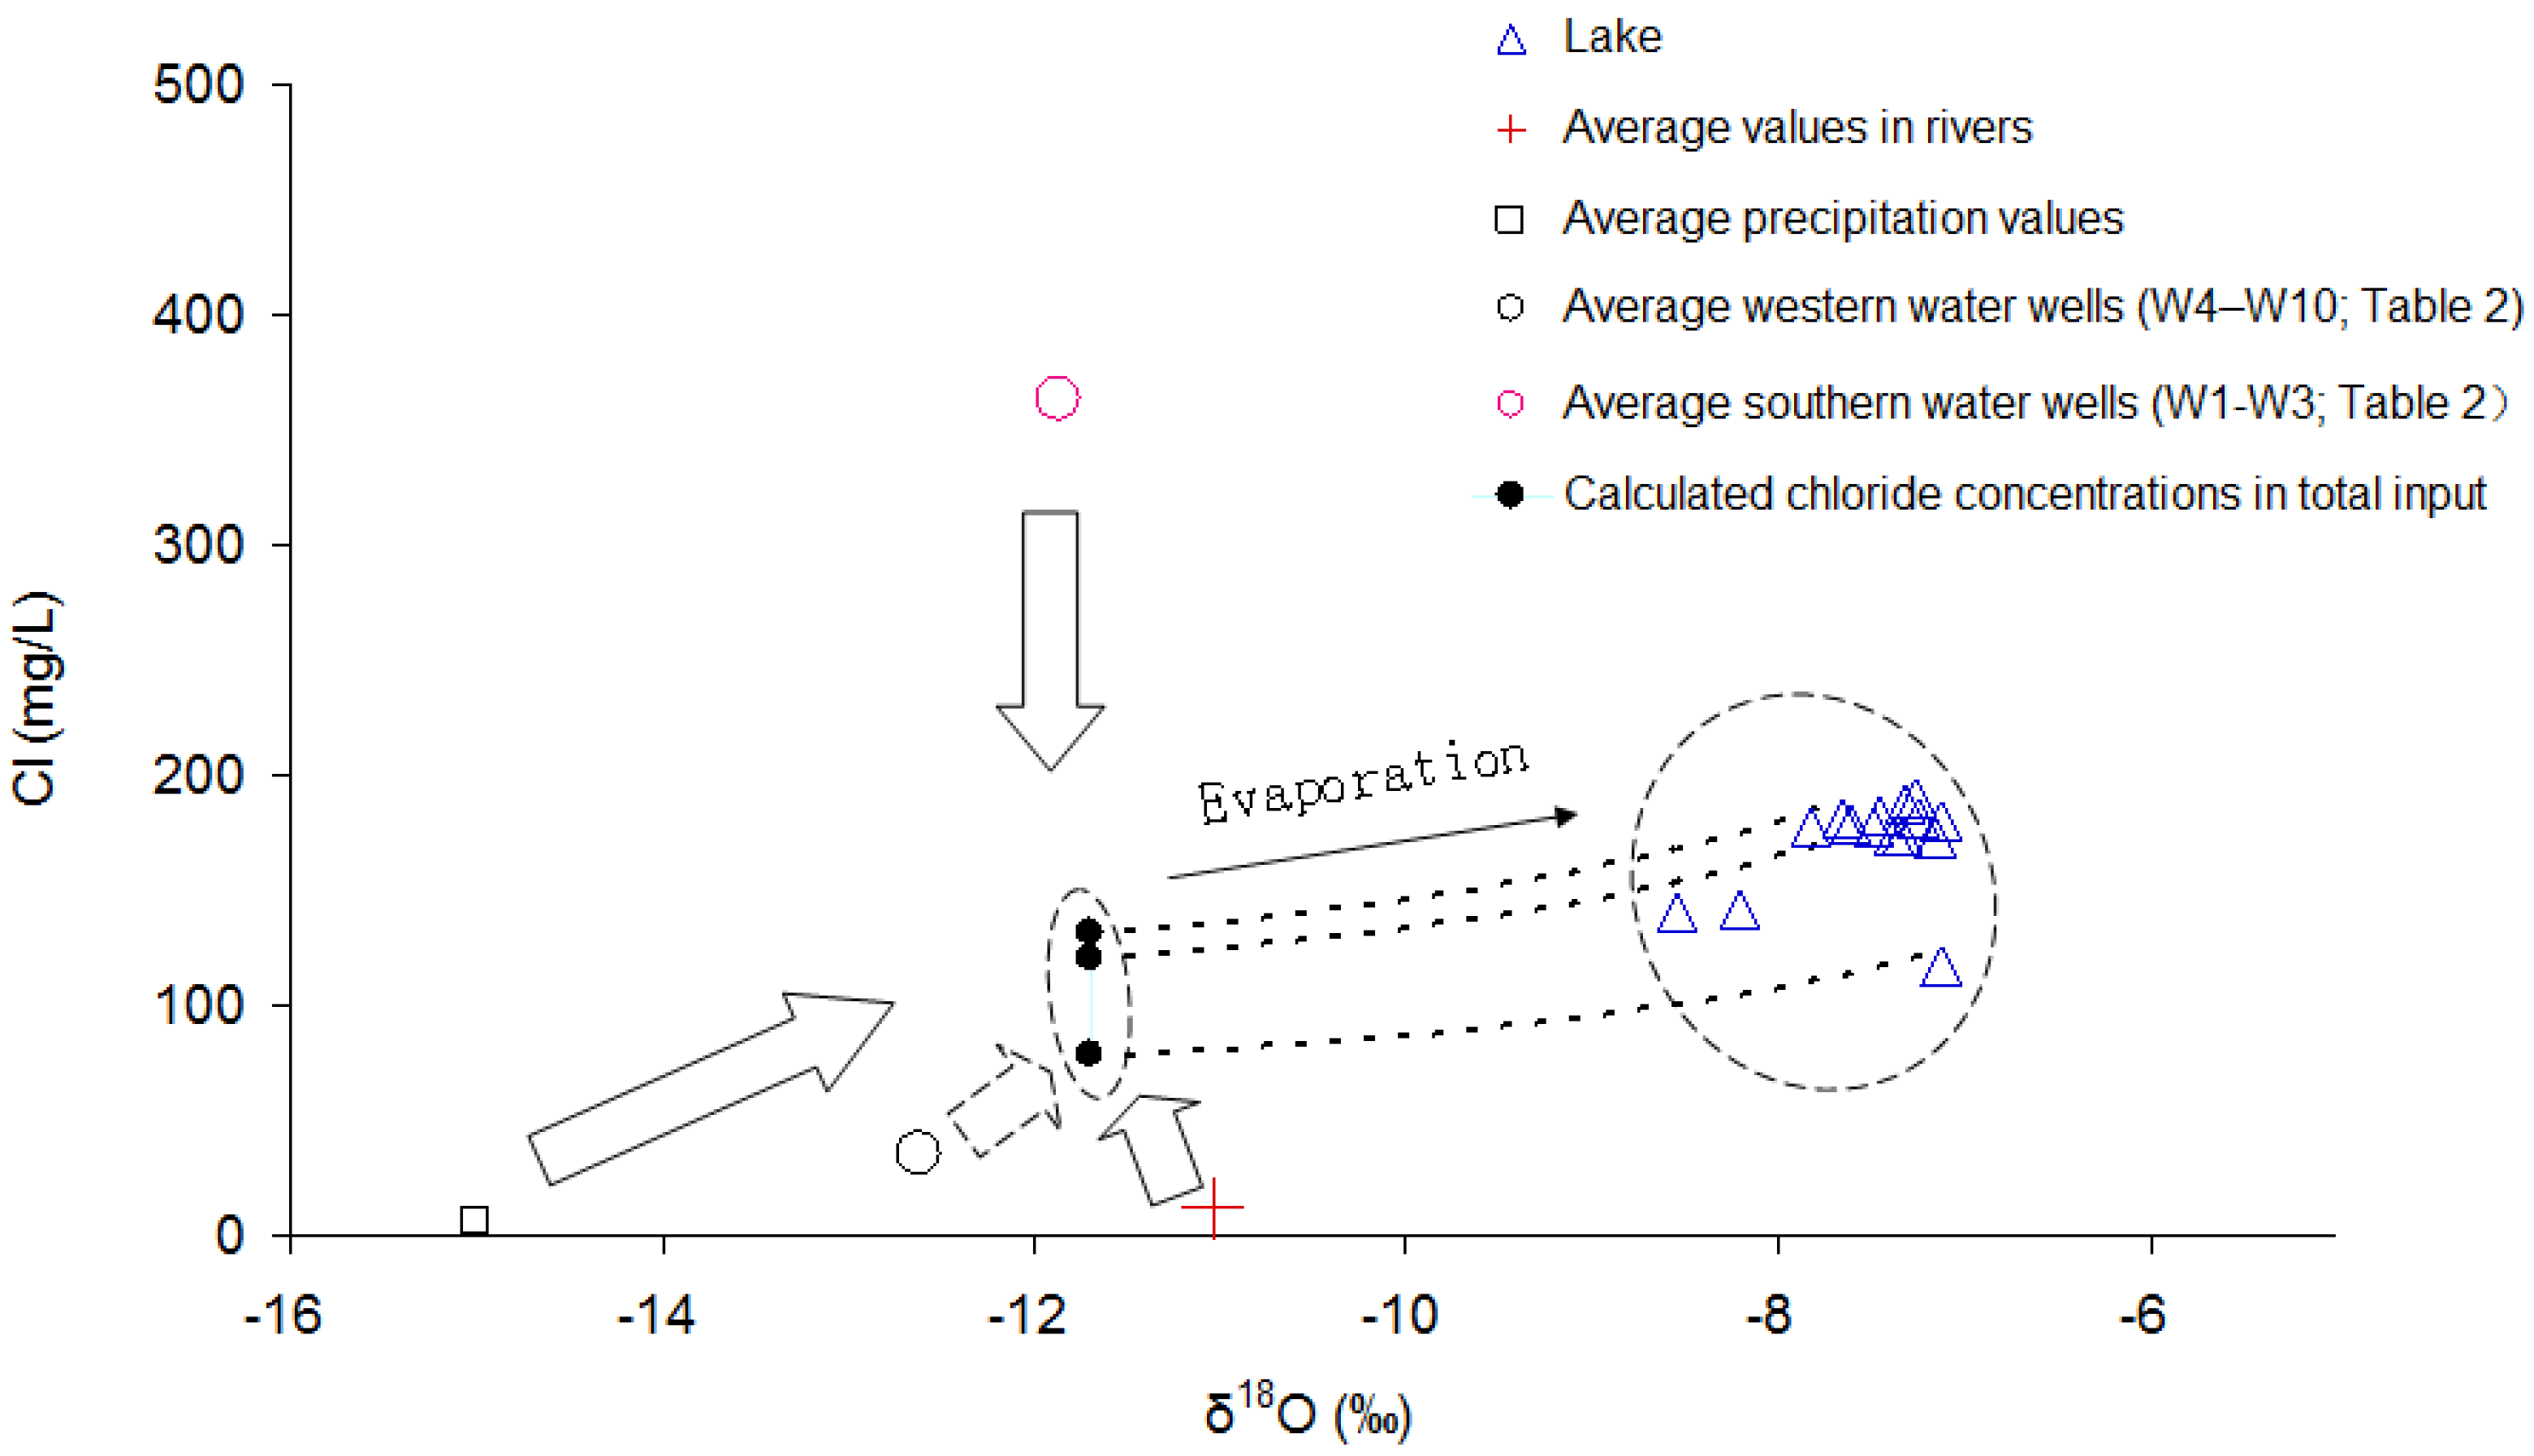
3.4. The Chloride Mass Balance on Hulun Lake Inflow

Inflow to Hulun Lake is thought to be comprised of three main water sources: precipitation, the two rivers and groundwater. As the chloride concentration in precipitation and the two rivers were measured, and the estimated volumetric contribution of each of the three main sources of water to the lake have been estimated (2000–2013; Table 1); a chloride mass balance can be used to estimate an average chloride concentration in groundwater discharge to the lake as follows:
C l G W = Q I × C l I Q R × C l R Q P × C l P Q G W
where ClI, ClGW, ClR, ClP are chloride concentrations of the total combined inflow, groundwater, river water, and precipitation, respectively. Similarly, QI, QGW, QR, QP are the relative contributions (%) of total inflow, groundwater, river water (QR = Qin), and precipitation, respectively. The annual water budget estimated the relative contributions of river discharge (52.2%), precipitation (23.0%), and groundwater (24.8%) for the period of 1981 to 2013 (Table 1), and an average chloride concentration of 120.1 mg/L for total inflow (Table 3) was previously calculated. The average chloride concentration in river water average was 12.5 mg/L (Table 2) and in precipitation the average value was estimated as 5.80 mg/L [49].
An average chloride concentration of 452.5 mg/L was calculated for groundwater based on the chloride mass balance (Equation (14)), which is reasonably similar to the average observed value of 363 mg/L in groundwater in the southwest of the lake. Thus, groundwater apparently contributes most of the annual loading of chloride to Hulun Lake (93.5%) relative to precipitation (1.1%) and river flow (5.4%). Assuming the average chloride groundwater concentration has not changed since 1981, the four-fold increase in groundwater discharge to Hulun Lake in the period from 2001 to 2013 has been associated with a four-fold increase groundwater loading of chloride (Table 1). This corresponds to an increase from an estimated 1.18 × 10⁵ tons (1981–2000) to 4.03 × 10⁵ tons (2001–2013).
Finally, when the range of chloride concentrations and δ18O values for the combined lake input (i.e. the minimum, maximum, and average; Table 3) are subjected to evaporation (which affects chloride concentration and water isotopes differently), the range of predicted values is similar to that measured in lake samples (Figure 4), consistent with the water and chloride balances presented here.

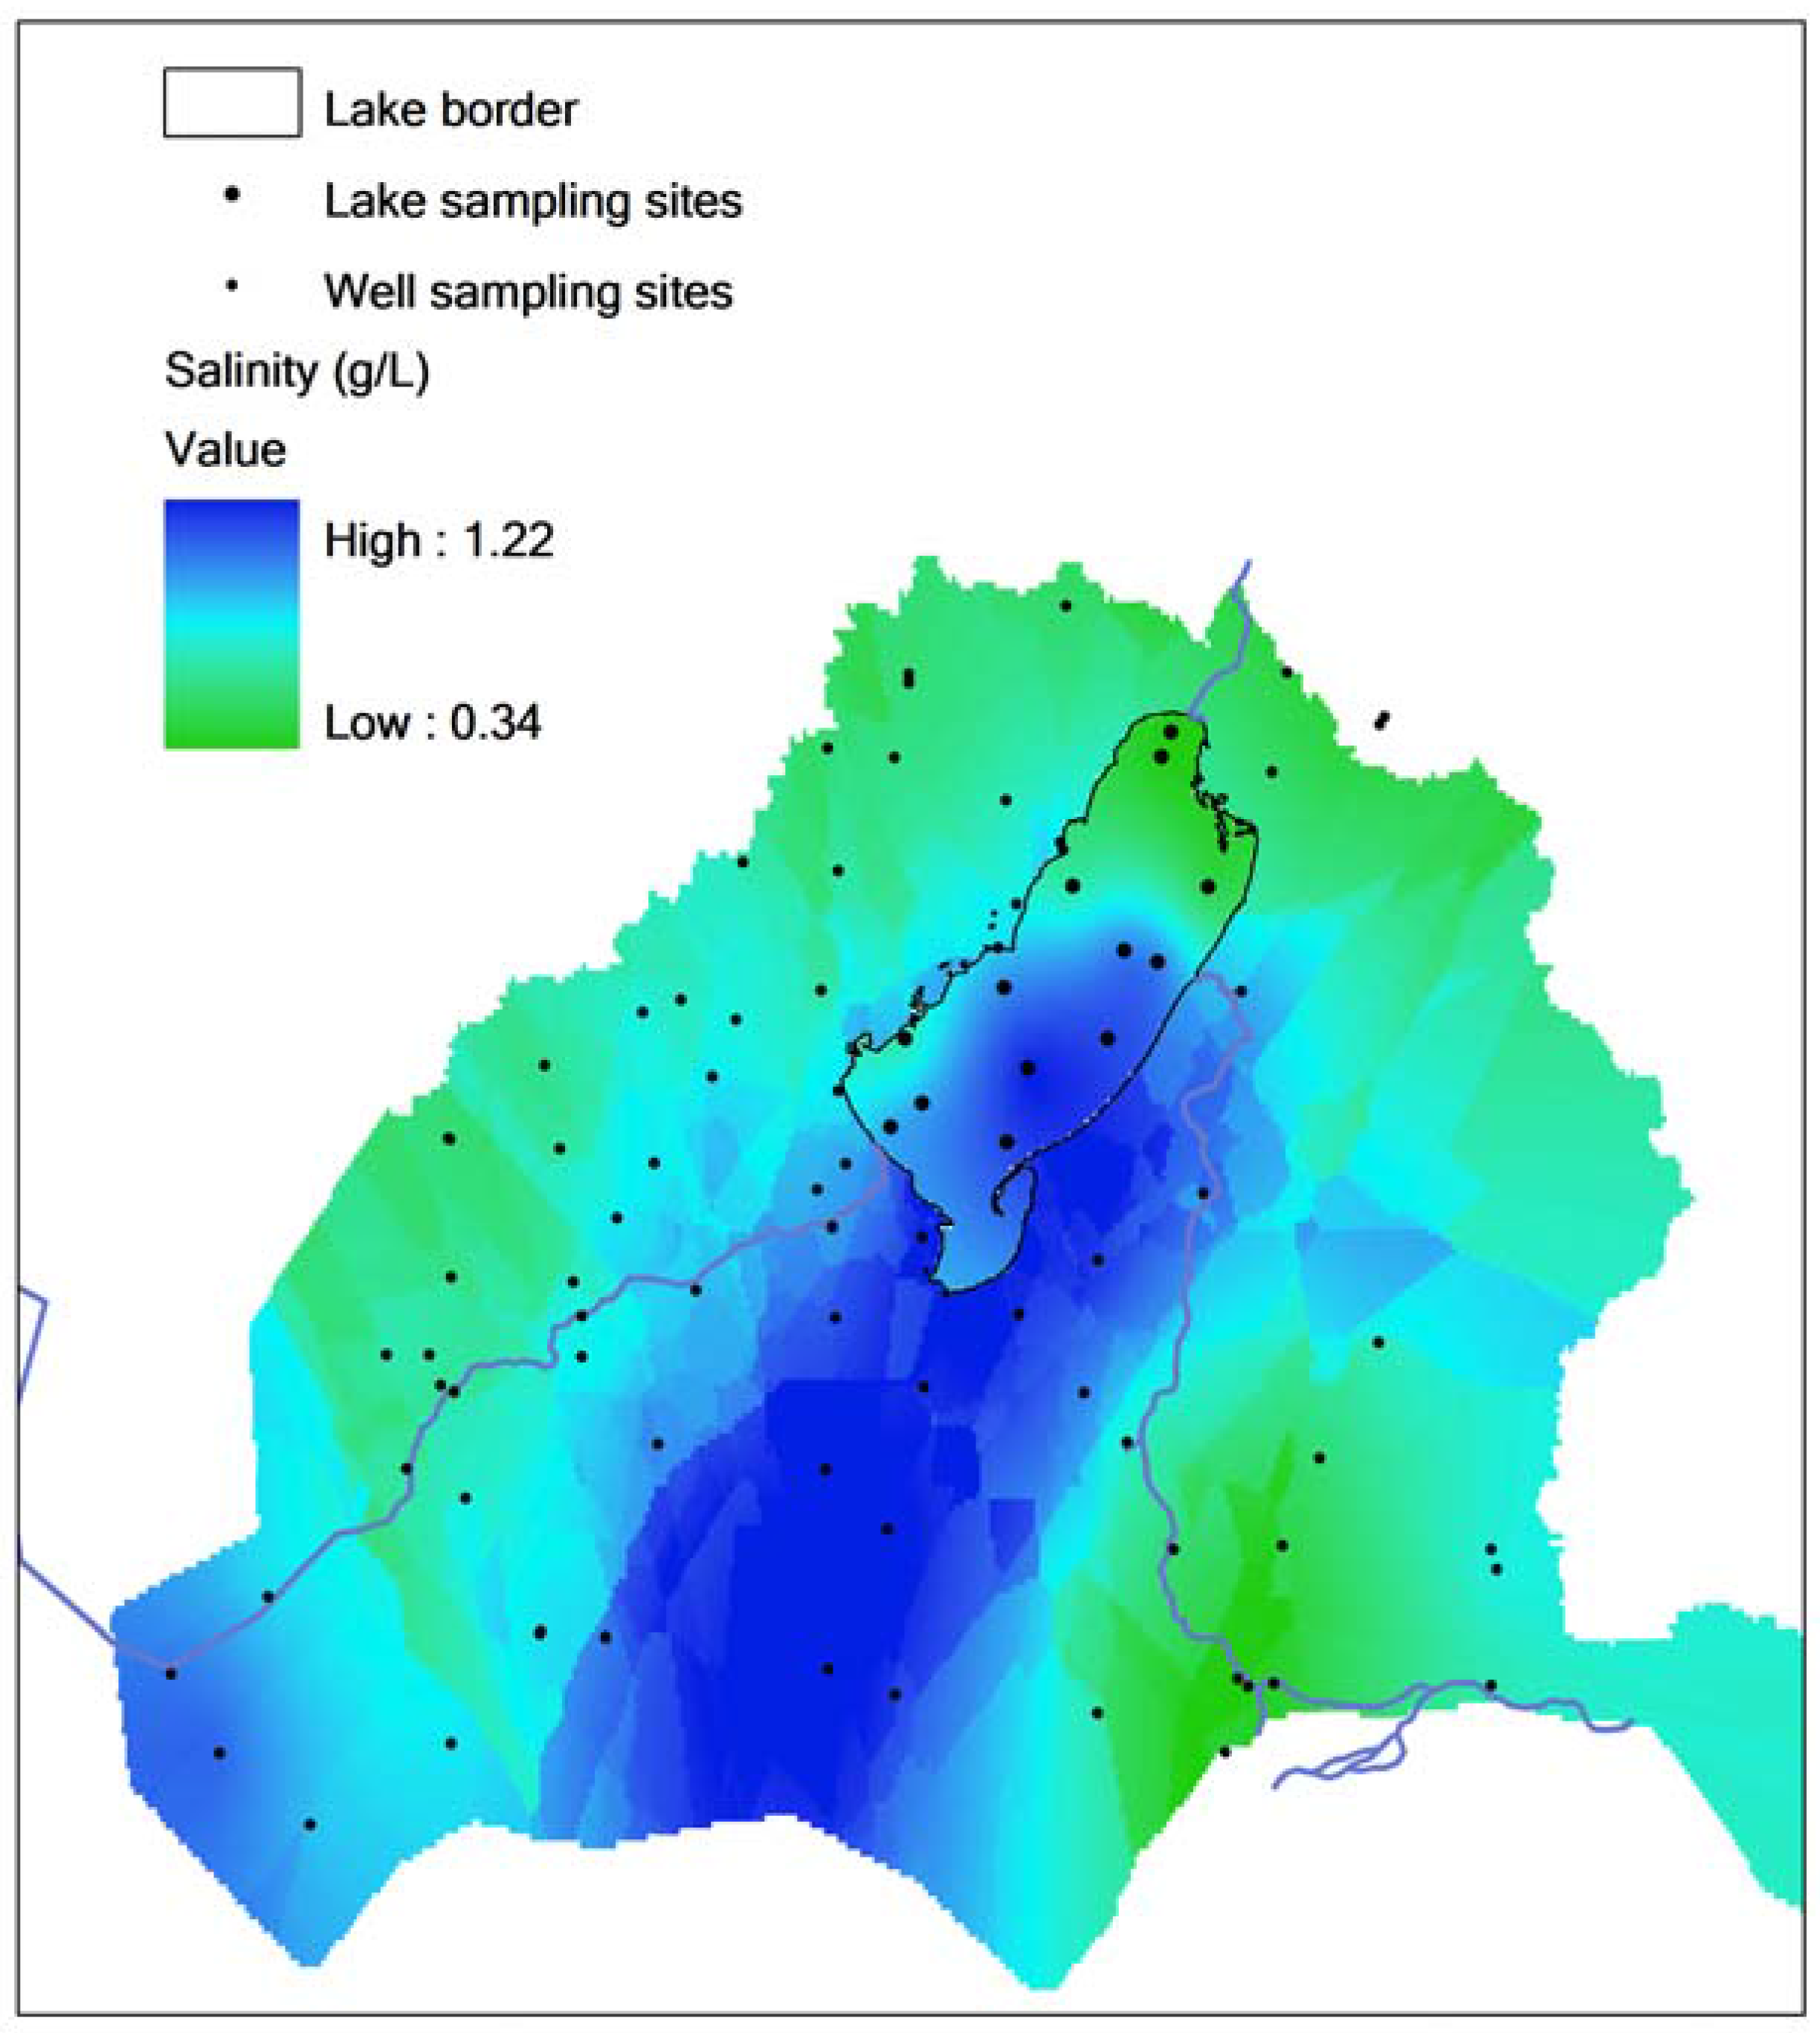
3.5. Additional Evidence for High Chloride in Groundwater Supplies South of Hulun Lake

The evidence of high chloride concentrations occurring in groundwater south of Hulun Lake is supported by a previous study that mapped salinity in groundwater and lake water by field measurements of salinity in domestic water well samples and in Hulun Lake (Figure 5). This study measured relatively high salinity in domestic water wells in the region south of the lake, which is consistent with high chloride concentrations in groundwater in this region, and a significant contribution of chloride in groundwater discharge to Hulun Lake. Although the source of salinity is not known, its widespread nature suggests rock–water interaction.

4. Conclusions

(1) The estimated average annual water budget for Hulun Lake was significantly different between the two time periods that were evaluated (1981–2000 and 2001–2013). The later time period was characterized by decreased average annual contributions of river discharge (from 63.6% to 30.7%) and precipitation (from 24.9% to 19.4%) to the lake, an increased evaporative loss from the lake (from 20.4 to 22.0 × 10⁸ m3), and decreased lake storage. As a result of the changes in lake inputs, the estimated proportion of the annual contribution of groundwater to the lake increased almost four-fold (from 11.4% to 49.9%) between the two periods.
(2) Although the relatively high δ18O and δ2H values for the present-day lake were consistent with significant evaporation of water from combined total input water from rivers, precipitation, and groundwater, the chloride concentrations were higher than could be accounted for by evaporation alone.
(3) A chloride mass balance suggested high chloride concentrations in groundwater discharge is responsible for more than 90% of the annual chloride loaded into the lake. Elevated chloride concentrations in domestic water well samples from the region south of Hulun Lake and a regional groundwater salinity survey suggest high groundwater chloride concentrations occur in the region south of Hulun Lake.
(4) The combined use of stable isotopes in water, in combination with water and chloride mass balances, could be applied to other watersheds where hydrologic information is scarce.

Supplementary Materials

The following are available online at www.mdpi.com/2073-4441/9/5/363/s1.

Acknowledgments

We would like to thank Cairui Fan, Jinyan Guo, Jingjie Wang and Yao Fu from the Water Environment Protection and Restoration Group of Inner Mongolia Agriculture University for sampling assistance. This work was supported by the Chinese National Natural Science Foundation (Nos. 51169011, 51339002, 51169017, 51069007, 51269016 and 51269017), Natural Science Foundation of Inner Mongolia (Nos. 2012MS0612, 20091408, 20080105), and China Scholarship Council (No. 201408150013). David Bethune (University of Calgary, Canada) is acknowledged for providing valuable input, and Dongnan Zhu for many collegial discussions. Finally, three anonymous reviewers and editor (Rachel Lu) are acknowledged for providing professional revising advice and helpful comments.

Author Contributions

Hongbin Gao, M. Cathryn Ryan and Changyou Li designed and performed research. Hongbin Gao wrote the paper, Biao Sun assisted with experimental data and provided comments.

Conflicts of Interest

The authors declare no conflict of interest.

References

  1. Helfer, F.; Lemckert, C.; Zhang, H. Impacts of climate change on temperature and evaporation from a large reservoir in Australia. J. Hydrol. 2012, 475, 365–378. [Google Scholar] [CrossRef]
  2. Song, C.Q.; Huang, B.; Ke, L.H.; Richards, K.S. Remote sensing of alpine lake water environment changes on the Tibetan Plateau and surroundings: A review. ISPRS. J. Photogramm. 2014, 92, 26–37. [Google Scholar] [CrossRef]
  3. Cai, Z.; Jin, T.; Li, C.; Ofterdinger, U.; Zhang, S.; Ding, Aizhong.; Li, J. Is China’s fifth-largest inland lake to dry-up? Incorporated hydrological and satellite-based methods for forecasting Hulun lake water levels. Adv. Water Resour. 2016, 94, 185–199. [Google Scholar] [CrossRef]
  4. Chen, X.; Chuai, X.; Yang, L.; Zhao, H. Climatic warming and overgrazing induced the high concentration of organic matter in Lake Hulun, a large shallow eutrophic steppe lake in northern China. Sci. Total Environ. 2012, 431, 332–338. [Google Scholar] [CrossRef] [PubMed]
  5. Chuai, X.; Chen, X.; Yang, L.; Zeng, J.; Miao, A.; Zhao, H. Effects of climatic changes and anthropogenic activities on lake eutrophication in different ecoregions. Int. J. Environ. Sci. Technol. 2012, 9, 503–514. [Google Scholar] [CrossRef]
  6. Wang, J.; Feng, W.; Zhang, L.; Zong, Z.; Meng, H.; Peng, B.; Li, Z. Monitoring and evaluation on water quality and biology resource quantity in Hulun lake. J. Hydroecology 2011, 32, 64–68. (In Chinese) [Google Scholar]
  7. Li, Z.; Zhang, Z.; Jiang, F.; Wang, S.; Wang, F. Annals of Hulun Lake (Ⅱ); Inner Mongolia Culture: Inner Mongolia, China, 2008. (In Chinese) [Google Scholar]
  8. Li, C.; Ma, W.; Ye, B.; Liao, W. Estimation of water evaporation and water balance in ungauged Hulun lake. J. China Hydrol. 2006, 26, 41–44. (In Chinese) [Google Scholar]
  9. Yan, D.; Yan, H.; Deng, W.; Wang, M. Influences of eco-hydrological process to water environmental system in Hulun Lake basin. Bull. Soil Water Conserv. 2001, 21, 1–5. (In Chinese) [Google Scholar]
  10. Yu, G.; Shen, H. Lake water changes in response to climate change in northern China: Simulation and uncertainty analysis. Quatern. Int. 2010, 212, 44–56. [Google Scholar] [CrossRef]
  11. Zhang, G.; Xie, H.; Yao, T.; Kang, S. Water balance estimates of ten greatest lakes in China using ICESat and Landsat data. Sci. Bull. 2013, 58, 3815–3829. [Google Scholar] [CrossRef]
  12. Zuber, A. On the environmental isotope method for determining the water balance of some lakes. J. Hydrol. 1983, 6, 409–427. [Google Scholar] [CrossRef]
  13. Krabbenhoft, D.P.; Bowser, C.J.; Anderson, M.P.; Valley, J.W. Estimating groundwater exchange with lakes 1. The stable isotope mass balance method. Water Resour. Res. 1990, 26, 2445–2453. [Google Scholar] [CrossRef]
  14. Gibson, J.J.; Prepas, E.E.; McEachern, P. Quantitative comparison of lake throughflow, residency, and catchment runoff using stable isotopes: Modelling and results from a survey of boreal lakes. J. Hydrol. 2002, 262, 128–144. [Google Scholar] [CrossRef]
  15. Bennett, K.E.; Gibson, J.J.; McEachern, P. Water yield estimates for critical loadings assessment: Comparisons of gauging methods vs. an isotopic approach. Can. J. Fish. Aquat. Sci. 2008, 65, 83–99. [Google Scholar] [CrossRef]
  16. Alyamani, M.S. Isotopic composition of rainfall and groundwater recharge in the western province of Saudi Arabia. J. Arid Environ. 2001, 49, 751–760. [Google Scholar] [CrossRef]
  17. Gibson, J.; Edwards, T.; Birks, S.; Amour, N.; Buhay, W.; McEachern, P.; Wolfe, B.; Peters, D. Progress in isotope tracer hydrology in Canada. Hydrol. Process. 2005, 19, 303–327. [Google Scholar] [CrossRef]
  18. Carol, E.; Kruse, E.; Mas-Pla, J. Hydrochemical and isotopical evidence of ground water salinization processes on the coastal plain of Samborombo´n Bay, Argentina. J. Hydrol. 2009, 365, 335–345. [Google Scholar] [CrossRef]
  19. Wassenaar, L.I.; Athanasopoulos, P.; Hendry, M.J. Isotope hydrology of precipitation, surface and ground waters in the Okanagan Valley, British Columbia. Can. J. Hydrol. 2011, 411, 37–48. [Google Scholar] [CrossRef]
  20. Kanduc, T.; Mori, N.; Kocman, D.; Stibilj, V.; Grassa, F. Hydrogeochemistry of Alpine springs from North Slovenia: insights from stable isotopes. Chem. Geol. 2012, 300, 40–54. [Google Scholar] [CrossRef]
  21. Cui, B.; Li, X. Characteristics of stable isotope and hydrochemistry of the groundwater around Qinghai Lake, NE Qinghai-Tibet Plateau, China. Environ. Earth Sci. 2014, 71, 1159–1167. [Google Scholar] [CrossRef]
  22. Currell, M.J.; Dahlhaus, P.; Ii, H. Stable isotopes as indicators of water and salinity sources in a southeast Australian coastal wetland: Identifying relict marine water, and implications for future change. Hydrogeol. J. 2015, 23, 235–248. [Google Scholar] [CrossRef]
  23. Clark, I.D.; Frjtz, P. Environmental Isotopes in Hydrogeology; Lewis Publishers: New York, NY, USA, 1997. [Google Scholar]
  24. Gibson, J.J.; Edwards, T.W.D.; Bursey, G.G. Estimating evaporation using stable isotopes. Nord. Hydrol. 1993, 24, 79–94. [Google Scholar]
  25. Kirchner, J.; Tetzlaff, D.; Soulsby, C. Comparing chloride and water isotopes as hydrological tracers in two Scottish catchments. Hydrol. Process. 2010, 24, 1631–1645. [Google Scholar] [CrossRef]
  26. Xu, Z.; Jiang, F.; Zhao, H.; Zhang, Z; Sun, L. Annals of Hulun Lake; Jilin Literature and History Publishing House Press: Jilin, China, 1989; pp. 691–692. (In Chinese) [Google Scholar]
  27. Sun, B.; Li, C.; Zhang, S.; Zhao, S. Analysis of Hulun digital basin based on spatial information technology. Environ. Pollut. Control. 2010, 32, 5–19. (In Chinese) [Google Scholar]
  28. Wen, R.; Xiao, J.; Chang, Z.; Zhai, D.; Xu, Q.; Li, Y.; Itoh, S.; Lomtatidze, Z. Holocene climate changes in the mid-high-latitude-monsoon margin reflected by the pollen record from Hulun Lake, northeastern Inner Mongolia. Quatern, Res. 2010, 73, 293–303. [Google Scholar] [CrossRef]
  29. Craig, H.; Gordon, L.I. Deuterium and oxygen 18 variations in the ocean and the marine atmosphere. In Stable Isotopes in Oceanographic Studies and Paleotemperatures; Ongiorgi, E., Ed.; Laboratorio di Geologia Nucleare: Pisa, Italy, 1965; pp. 9–130. [Google Scholar]
  30. Gonfiantini, R. Environmental isotopes in lake studies. In Handbook of Environmental Isotope Geochemistry; Volume 2: The Terrestrial Environment; Fritz, P., Ed.; Elsevier: Amsterdam, The Netherlands, 1986; pp. 113–163. [Google Scholar]
  31. Gat, J.R. Stable isotopes of fresh and saline lakes. In Physics and Chemistry of Lakes; Lerman, D.I., Ed.; Springer: Berlin, Germany, 1995; pp. 139–165. [Google Scholar]
  32. Gibson, J.J. Short-term evaporation and water budget comparisons in shallow Arctic lakes using non-steady isotope mass balance. J. Hydrol. 2002, 264, 242–261. [Google Scholar] [CrossRef]
  33. Horita, J.; Rozanski, K.; Cohen, S. Isotope effects in the evaporation of water: A status report of the Craig–Gordon model. Isot. Environ. Health Stud. 2008, 44, 23–49. [Google Scholar] [CrossRef] [PubMed]
  34. Gat, J.R.; Levy, Y. Isotope hydrology of inland Sabkhas in the Bardawil area. Sinai. Limnol. Oceanogr. 1978, 23, 841–850. [Google Scholar] [CrossRef]
  35. Gat, J.R. Properties of the isotopic species of water: the ‘‘isotope effect’’. In Stable Isotope Hydrology, Deuterium and Oxygen-18 in the Water Cycle; Gat, J.R., Gonfiantini, R., Eds.; IAEA Tech. Rep. Ser. No. 210; IAEA: Vienna, Austria, 1981; pp. 7–19. [Google Scholar]
  36. Gibson, J.J.; Reid, R. Water balance a chain of tundra lakes: a 20-years isotopic perspective. J. Hydrol. 2014, 519, 2148–2164. [Google Scholar] [CrossRef]
  37. Welhan, J.A.; Fritz, P. Evaporation pan isotopic behaviour as an index of isotopic evaporation conditions. Geochim. Cosmochim. Acta. 1977, 41, 682–686. [Google Scholar] [CrossRef]
  38. Allison, G.B.; Leaney, F.W. Estimation of isotopic exchange parameters using constant-feed pans. J. Hydrol. 1982, 55, 151–161. [Google Scholar] [CrossRef]
  39. Gibson, J.J.; Reid, R. Stable isotope fingerprint of open-water evaporative losses and effective drainage area fluctuations in a subarctic shield watershed. J. Hydrol. 2010, 381, 142–150. [Google Scholar] [CrossRef]
  40. Horita, J.; Wesolowski, D.J. Liquid-vapor fractionation of oxygen and hydrogen isotopes of water from the freezing to the critical temperature. Geochim. Cosmochim. Acta 1994, 58, 3425–3437. [Google Scholar] [CrossRef]
  41. Skrzypek, G.; Mydłowski, A.; Dogramaci, S.; Hedley, P.; Gibson, J.J.; Grierson, P.F. Estimation of evaporative loss based on the stable isotope composition of water using Hydrocalculator. J. Hydrol. 2015, 523, 781–789. [Google Scholar] [CrossRef]
  42. IAEA Global Network of isotopes in precipitation. The GNIP database, 2017. Available online: http://www.iaea.org/water (accessed on 16 May 2017).
  43. Mulligan, B.M.; Ryan, M.C.; Cámbara, T.P. Delineating volcanic aquifer recharge areas using geochemical and isotopic tools. Hydrogeol. J. 2011, 19, 1335–1347. [Google Scholar] [CrossRef]
  44. Craig, H. Isotope variations in meteoric waters. Science 1961, 133, 1702–1703. [Google Scholar] [CrossRef] [PubMed]
  45. Herczeg, A.L.; Dogramaci, S.S.; Leaney, F.W.J. Origin of dissolved salts in a large, semi-arid groundwater system: Murray Basin, Australia. Mar. Freshwatyer. Res. 2001, 52, 41–52. [Google Scholar] [CrossRef]
  46. Cartwright, I.; Weaver, T.R.; Fifield, L.K. Cl/Br ratios and environmental isotopes as indicators of recharge variability and groundwater flow: An example from the southeast Murray Basin, Australia. Chem. Geol. 2006, 231, 38–56. [Google Scholar] [CrossRef]
  47. Dogramaci, S.; Firmani, G.; Hedley, P.; Skrzypek, G.; Grierson, P.F. Evaluating recharge to an ephemeral dryland stream using a hydraulic model and water, chloride and isotope mass balance. J. Hydrol. 2015, 521, 520–532. [Google Scholar] [CrossRef]
  48. Lin, D.; Jin, M.; Liang, X.; Zhan, H. Estimating groundwater recharge beneath irrigated farmland using environmental tracers fluoride, chloride and sulfate. Hydrogeol. J. 2013, 21, 1469–1480. [Google Scholar] [CrossRef]
  49. Gao, H.; Li, C.; Sun, B.; Shi, X.; Fan, C. Solutes transport between lake water and sediment pore water during the lake water level fluctuation. J. Lake Sci. 2017, (unpublished; accepted). [Google Scholar]
Figure 1. (a) Study area in country-scale map, with a green star indicating the location of the International Atomic Energy Agency’s Global Network of Isotopes in Precipitation (Qiqihar station); (b) Hulun Lake basin showing two major rivers (Kelulun River and Wuerxun River) that flow into Hulun Lake, and the Xinkai River, which intermittently provides an outlet for Hulun Lake to the Hailaer River; (c) River, domestic water well, and lake sampling site locations. The arrow near Hailaer River shows the flow direction of Hailaer River. The Xinkai River is an intermittent connection between Hulun Lake and the Hailaer River.
Water 09 00363 g001
Figure 2. Dual isotope diagram of δ18O and δ2H in lake, river, and domestic water well samples. The local meteoric water line (LMWL) is shown for the International Atomic Energy Agency’s Global Network of Isotopes in Precipitation, Qiqihar station [42].
Water 09 00363 g002
Figure 3. A cross plot of δ18O values and chloride concentrations in lakes, rivers and wells. Zone I and Zone II are divided based on the significant difference in chloride concentrations in western and southern wells, respectively.
Water 09 00363 g003
Figure 4. δ18O vs. chloride concentrations including the minimum, average, and maximum values for total input into Hulun Lake (filled black symbols; Table 3), measured Hulun Lake values, and average values for each of the main three inputs (precipitation, river flow, and groundwater) that are thought to contribute to the combined input (with solid arrows indicating likely inputs, and the dashed arrow represents potential sources). The dashed lines represent δ18O and chloride concentration evolution with increasing evaporation modeled by E/I ratios as described in Section 2.4 (with T = 0.3 °C, and humidity = 60%).
Water 09 00363 g004
Figure 5. The spatial distribution of salinity (g/L) in domestic water well samples around Hulun Lake. Unpublished data (collected in 2008), College of Water Resources and Civil Engineering, Inner Mongolia Agricultural University.
Water 09 00363 g005
Table 1. Average annual water budget components in the entire period of 1981–2013, and also separated into two periods (1981–2000 (when lake stage was stable), 2001–2013 (when lake stage was declining)) for Hulun Lake (in 108 m3). The change in lake storage (ΔS), volume of river discharge into the lake (Qin), volume of river outflow discharge (Qout), contribution from precipitation (P), and loss from evaporation (E) are considered. The residual amount is the estimated contribution from groundwater discharge into the lake ΔV (GW). Negative values for storage mean a net decrease in storage over the year. The fraction of total lake input is included for the three main lake water sources (Qin, P, and ΔV (GW)).
Year Δ SQinQoutPEΔ V (GW)
1981–2013Water budget (108 m3)−0.610.80.34.821.15.2
% of total lake input-- *52.2--23.0--24.8
1981–2000Water budget (108 m3)1.814.50.65.720.424.8
% of total lake input--63.6--24.9--11.4
2001–2013Water budget (108 m3)−4.35.4--3.522.08.9
% of total lake input--30.7--19.4--49.9
* -- indicates that the values do not apply.
Table 2. Measured δ18O, δ2H and Cl for lake, river, and domestic well water samples. Sample locations are shown in Figure 1. Lake water samples were collected on 4 July 2014, and domestic well water samples were collected on 30 July 2014.
Sample Type (and Date)δ18O (‰)δ2H (‰)Cl (mg/L)
   Lake water
L1−72.83−8.55140.6
L2−71.87−8.21141.9
L3−66.23−7.27189.3
L4−66.59−7.83177.3
L5−65.88−7.16172.6
L6−65.71−7.66181.1
L7−66.36−7.61179.1
L8−65.97 −7.34 173.7
L9−65.71−7.33187.2
L10−65.7−7.47182.9
L11−65.91−7.12180.3
L12−67.24−7.38173.5
L13−65.75−7.49176.8
L14−63.44−7.12116.9
L15−65.21−7.25181.6
Kelulun River
R1 (25 June 2014)−11.84−94.485.0
R1 (26 June 2014)−12.35−95.995.7
R1 (4 July 2014)−10.98−85.7225.8
R1 (3 August 2014)−10.46−84.0021.0
Wuerxun River
R2 (4 July 2014)−11.24−87.5612.6
Domestic well water (south of Hulun Lake)
W1−11.74−89.43330.7
W2−11.90−90.52400.7
W3−11.98−89.61357.8
Domestic well water (west of Hulun Lake)
W4−11.40−86.8635.6
W5−9.41−72.0228.7
W6−12.33−93.0549.8
W7−13.34−100.5417.0
W8−11.64−89.3865.6
W9−14.25−105.2417.2
W10−15.91−120.8738.4
Table 3. The evaporation to inflow (E/I) ratios calculated by δ2H and δ18O values in Hulun Lake with mean values and potential error estimated as absolute value of differences between E/I for δ2H and δ18O. The calculated Cl is the average chloride concentration of all inputs, as deduced by the E/I ratios of δ18O.
Site NameE/ICalculated Total Inflow [Cl] (mg/L)
Calculated using δ2HCalculated using δ18OMean
L10.330.200.27112.5
L20.360.230.30109.3
L30.560.320.44128.7
L40.550.260.41131.2
L50.580.330.46115.6
L60.590.280.44130.4
L70.560.280.42129.0
L80.570.310.44119.8
L90.590.310.45129.2
L100.590.30.45128.0
L110.580.330.46120.8
L120.520.310.42119.7
L130.580.290.44125.5
L140.690.330.5178.4
L150.610.320.47123.5
Average0.550.290.42120.1

