
Identification of Waters Incorporated in Laguna Lake, Republic of the Philippines, Based on Oxygen and Hydrogen Isotopic Ratios

1
Kyoto Fission-Track Co., Ltd., 44-4 Oomiyaminamitajiri-cho, Kita-ku, Kyoto 603-8832, Japan
2
The Institute of Scientific and Industrial Research, Osaka University, 8-1 Mihogaoka, Ibaraki, Osaka 567-0047, Japan
*
Author to whom correspondence should be addressed.
Water 2017, 9(5), 328; https://doi.org/10.3390/w9050328
Submission received: 21 January 2017
/
Revised: 3 May 2017
/
Accepted: 3 May 2017
/
Published: 6 May 2017
(This article belongs to the Special Issue Isotopes in Hydrology and Hydrogeology)
Abstract
:We examined the oxygen and hydrogen isotopic ratios of surface waters and groundwaters in the catchment of Laguna Lake, Republic of the Philippines, to identify the types of water that combine and control these ratios in the lake water. The oxygen and hydrogen isotopic ratios of water samples collected from rivers, lakes, springs, and irrigation canals were determined using cavity ring-down spectroscopy. The lake water data deviated from the meteoric line of the Philippines by between −13.5‰ and −10‰, and between −11.5‰ and −1.5‰ in the dry and wet seasons, respectively. The values for the groundwaters and surface waters were mainly between −8‰ and 3‰ throughout the year. In addition to rainwater, evaporative concentration, which may have an almost constant effect throughout the year, was the main control on the oxygen and hydrogen isotopic properties of Laguna Lake. The contributions of the surface waters and groundwaters to the oxygen and hydrogen isotopic ratios of the lake were relatively constant. Based on their isotopic properties, the waters within the water catchment area of Laguna Lake can be roughly divided into lake water with heavier isotopic ratios, and groundwater and surface water with lighter isotopic ratios.
1. Introduction
Fresh water resources, which account for only 2.5% of the Earth’s surface water [1], are continuously consumed by human activities. The spatial and temporal distributions of precipitation, a source of freshwater, are specific to individual regions worldwide. Numerous hydrological, chemical, and meteorological studies have been carried out to obtain information about the characteristics of water resources [2]. These studies provide fundamental and essential information that can support water resource management, planning, and regulation.
Laguna Lake is an inland lake in the southwest of Metropolitan Manila (Metro Manila) on Luzon Island, Republic of the Philippines. The lake is one of the largest in Asia, covering an area of ~900 km2. The average depth and length of the shoreline of Laguna Lake are 2.8 m and 220 km, respectively. More than 100 rivers flow into Laguna Lake, but the Napindan Channel of the Pasig River is the output through which lake water drains to Manila Bay [3,4]. Therefore, for the purposes of water resource management, Laguna Lake can be considered a semi-closed system. The Laguna Lake Development Authority (LLDA) is responsible for research into, and operational management of, Laguna Lake and surrounding lakes and their catchment areas [5].
- The water resources of Laguna Lake are used for various competing purposes, including agriculture, industry, cultivation, drinking, transportation, and leisure. Therefore, it is increasingly important to develop water resource management policies.
- Rapid urbanization and development of industry and commerce from the northwestern to the western shores of Laguna Lake have led to land use changes that have resulted in water pollution and ecosystem degradation.
The main causes of water pollution of Laguna Lake are surface sources such as domestic wastewater and inorganic materials from industrial activity [9]. The hydrological behavior of the lake and the groundwater and surface water in the water catchment area needs to be investigated and monitored continuously to deal with the various problems related to the above-mentioned human activities. However, previous studies of Laguna Lake may have suffered from problems of information-sharing and data quality. The lake has been the focus of development aid programs of various associations, such as the Japan International Cooperation Agency (JICA), which has supported the conservation of selected rivers [10]. However, in most cases the agencies involved may not have considered sharing information with local stakeholders. In addition, because of insufficient funding and human resources, it may have been difficult to collect data and maintain monitoring instruments, resulting in problems with the observation data.
Nakagiri et al. [11] showed that oxygen and hydrogen isotopic ratios (hereafter referred to as “water isotopic ratios”) could be used as stable isotopic tracers to estimate evapotranspiration. The water isotopic properties of various types of waters (e.g., rivers, lakes, and springs) from individual sampling points can be used to provide information on the characteristics of the inflows and outflows of a specific lake and its water catchment area. The water isotopic properties can also be used as an indicator of the hydrological cycle of the Laguna Lake catchment.
Studies of Laguna Lake have mainly focused on the concentrations of organic/inorganic substances and water turbidity [12,13,14,15]. However, these data indicate nothing more than the water quality of individual sampling points. Furthermore, to date the LLDA has not presented systematic information about the water isotopic properties of Laguna Lake and its water catchment area. In other words, systematic information about the water isotopic properties of the surface water and groundwater of Laguna Lake and of its catchment area is not presently available.
In this paper, we present information on temporal and spatial variations in the water isotopic ratios of the waters from Laguna Lake and its catchment area in the wet and dry seasons, and discuss the processes that produced these variations. The objective of this study is to produce a summary review of the isotopic properties of the waters of Laguna Lake and its catchment area Our analysis showed that the water isotopic properties of Laguna Lake are controlled .mainly by rainwater that is directly incorporated into the lake water and evaporative concentration, which has an almost constant effect throughout the year.
2. Materials and Methods
2.1. Water Samples
In the Philippines, the wet season is from June to November, with the other months making up the dry season. The monthly average temperatures in the dry and wet seasons in Manila range from 26 to 30 °C and from 27 to 28 °C, respectively [16]. The monthly average precipitation ranges from 7 to 129 mm and from 114 to 474 mm in the dry and wet seasons, respectively [16].
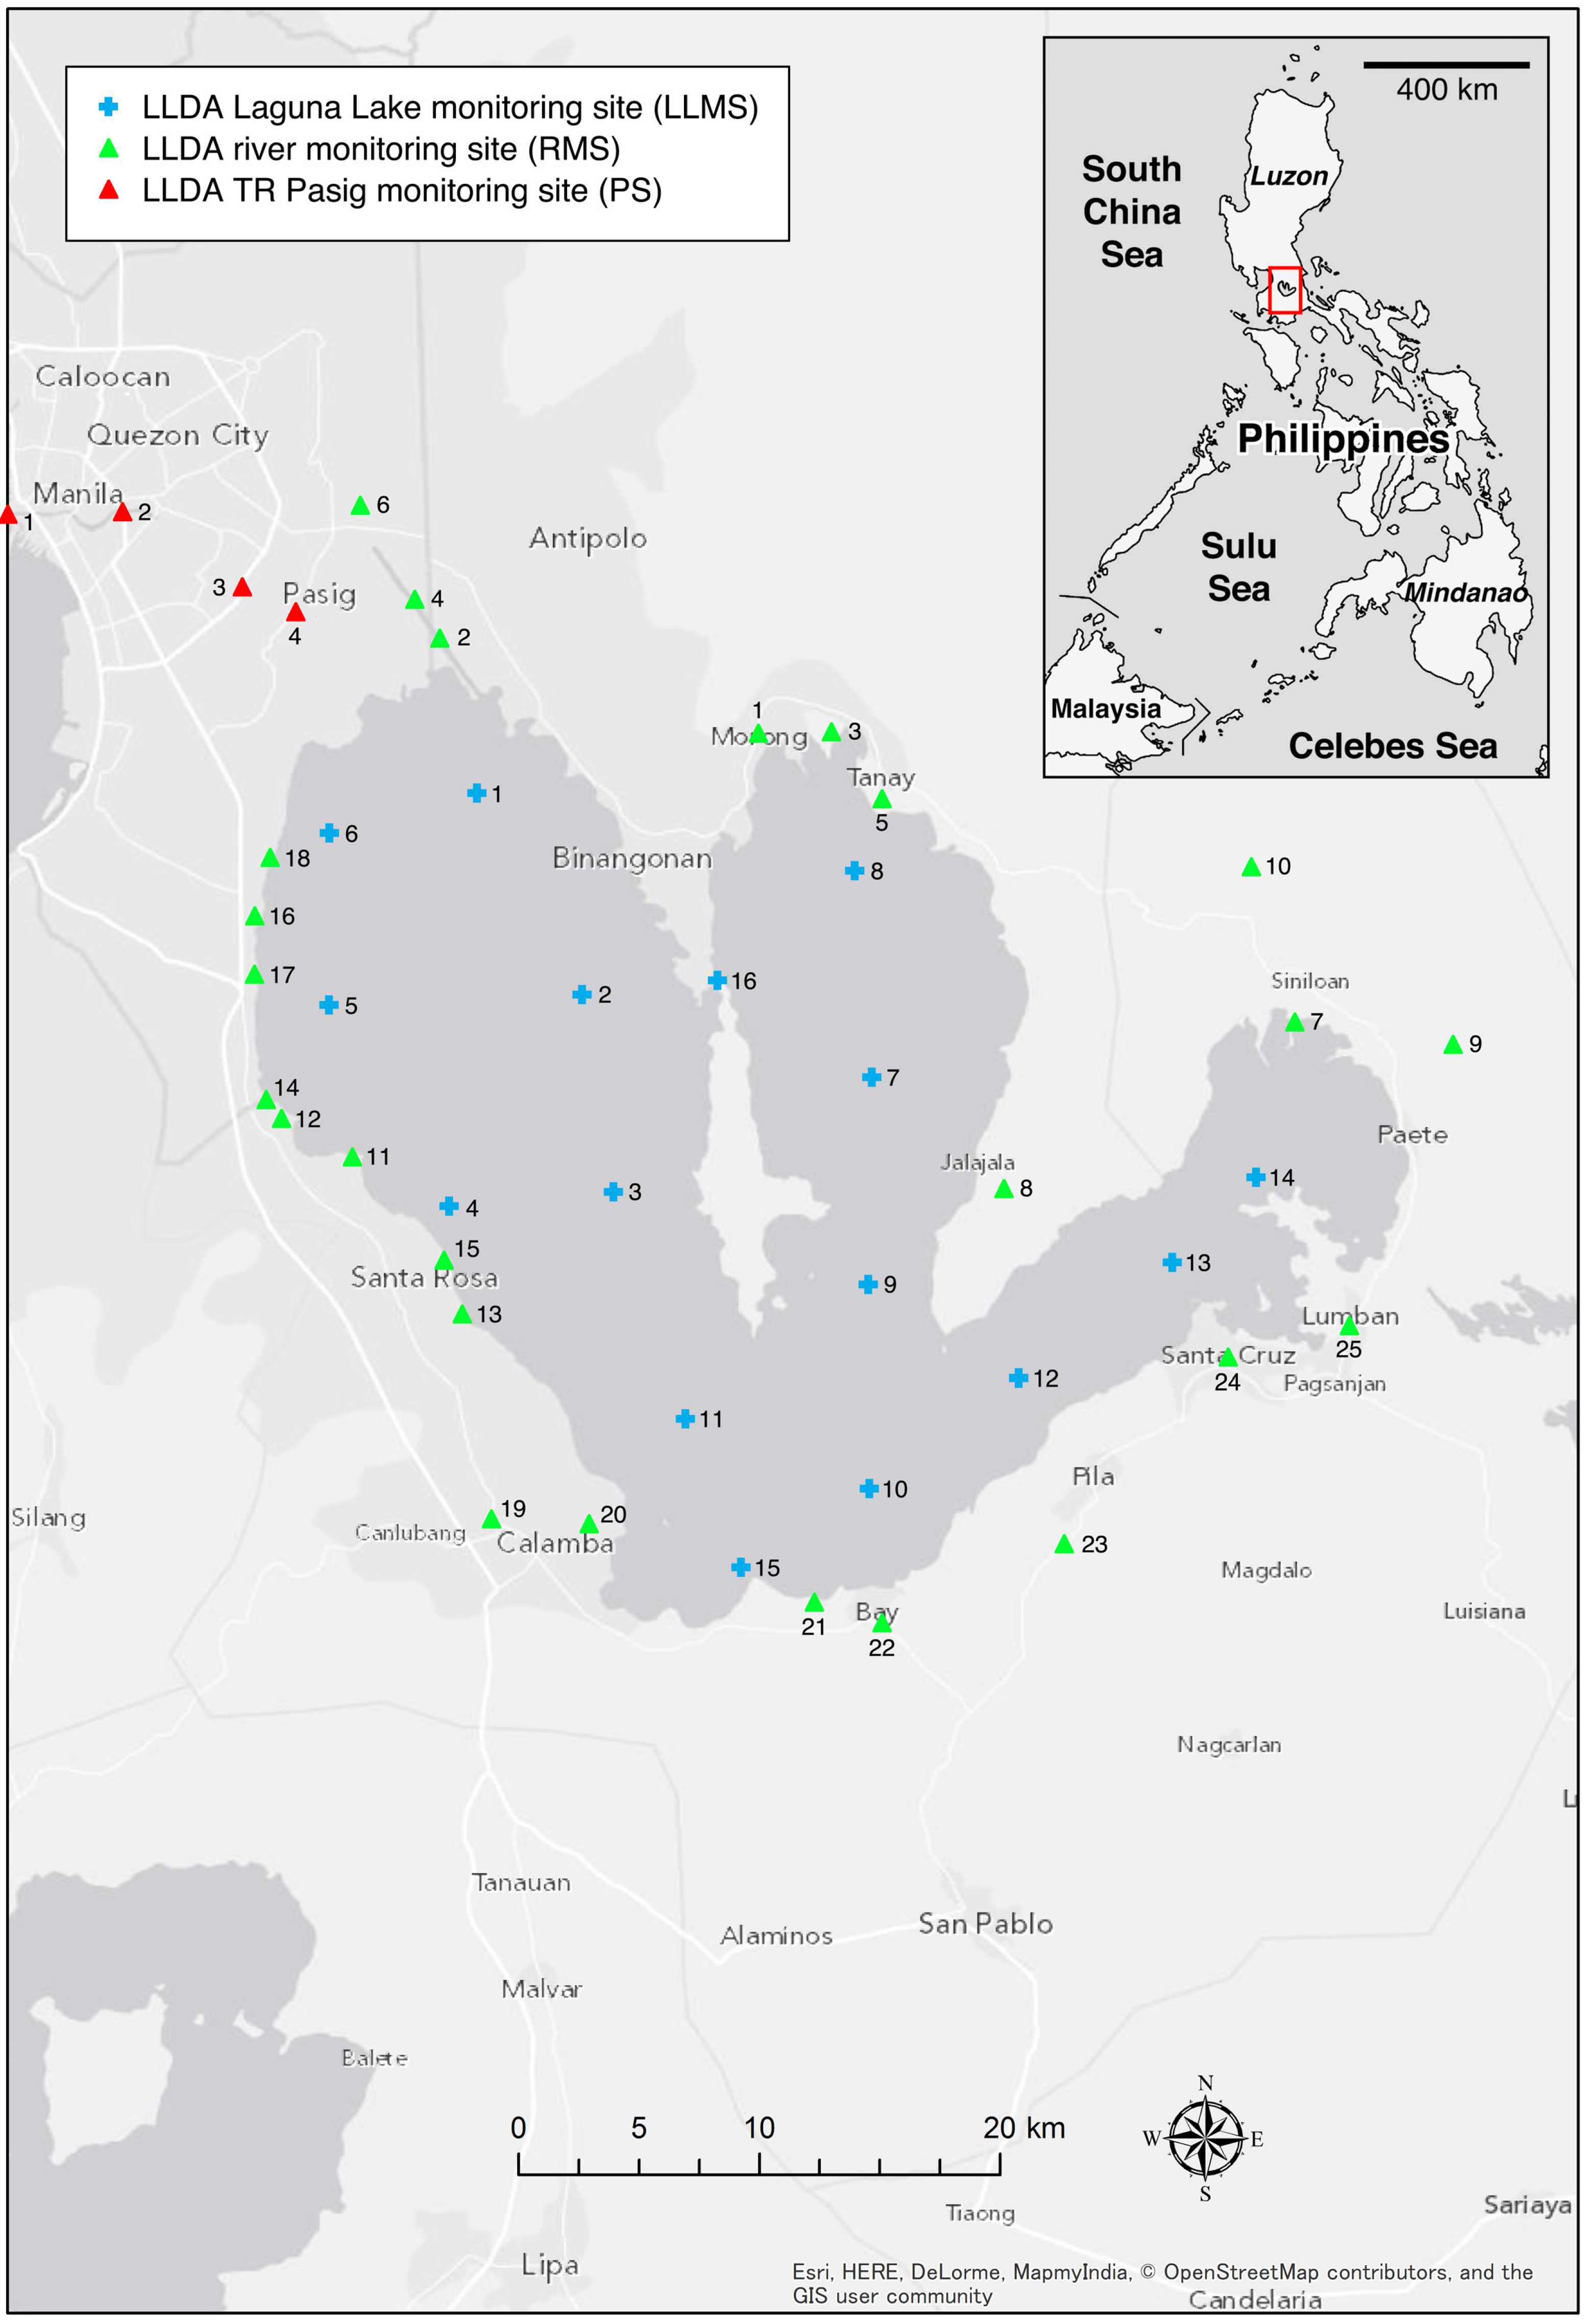
A total of 510 water samples were collected from Laguna Lake, and from the groundwater, irrigation canals, and rivers in the areas surrounding the lake in March and May of the dry season; and in August, October, and November of the wet season of 2011; as part of the R-06 project of the Research Institute for Humanity and Nature (RIHN). The numbers of water samples of each sample type are listed in Table 1. The water samples were filtered through 0.22 µm-mesh membrane filters and stored in glass vials (6 mL in volume). Just before the analyses, each water sample was transferred into a 2-mL glass vial that fitted into the auto sampler of the analytical instrument. The LLDA monitoring sites of the rivers and Laguna Lake from which samples were obtained are shown in Figure 1. Sampling points that were not part of the LLDA monitoring network are shown in Figure S1.
We also determined the water isotopic ratios of a further 19 water samples that were collected in December 2011 and January 2012 as part of the R-06 research project. These samples were collected from a limited number of sites in and around Cabuyao City, facing the southwest shore of Laguna Lake, but did not provide sufficient data to permit a discussion of the isotopic properties of the individual types of water samples.
2.2. Analytical Procedures
A cavity ring-down spectrometer (CRDS, Picarro L2120-i) coupled with a liquid autosampler (CTC LC-PAL) was used for simultaneous analysis of the water isotopic ratios of the water samples at RIHN. We followed the analytical procedures described by Maruyama and Tada [17].
The water isotopic ratios of the unknown sample are represented as the ratios (in per mil deviation) of 18O:16O or D (deuterium; 2H):1H from the isotopic ratios of the standard material, for which the Vienna Standard Mean Ocean Water (VSMOM) distributed by the International Atomic Energy Agency (IAEA) is normally used. The water isotopic ratios commonly reported as δ values are calculated as follows:
where RSample and RVSMOW represent the ratio of the heavy isotope to the light isotope (i.e., 18O/16O or D/H) in the sampled water and VSMOW, respectively.
Three working standards distributed by Los Gatos Research Inc. (#3, #4, and #5) that covered δD measurements from −79.0‰ to −9.8‰ and δ18O measurements from −11.54‰ to −2.96‰ were used to calibrate the analytical results of the water isotopic ratios [17]. The isotopic ratios are listed in Tables S1−S5. The suffixes attached to the sample numbers represent the sampling months as follows: A = March (Table S1), B = May (Table S2), C = August (Table S3), D = October (Table S4), and E = November of 2011 (Table S5). The standard errors (1σmean) of the analytical values of δD and δ18O obtained in this study were typically <0.2‰ and <0.07‰, respectively (Tables S1–S5). These were almost completely consistent with those obtained with an off-axis integrated cavity output spectrometer (OA-ICOS) (0.2‰–0.3‰ for δD and 0.05‰–0.10‰ for δ18O) [18] and a dual-inlet isotopic ratio mass spectrometer (IRMS) with a H2O-reduction system and a CO2-water equilibration system (<0.2‰ for δD and <0.03‰ for δ18O) [17]. Additional details of the IRMS analyses are described by Maruyama and Tada [17].
2.3. Meteoric Water Line and Deuterium Excess
The meteoric line represents the relationship between δD and δ18O in rainwaters, and is regarded as the reference for evaluating processes that modify isotopes, including the vaporization, condensation, and mixing of two isotopically different waters that can affect the water isotopic ratios of groundwaters and surface waters. Craig [19] reported the meteoric line for rainwaters sampled worldwide. This meteoric line is called the “Global Meteoric Water Line” (GMWL), and is expressed as follows:
δD = 8 δ18O + 10
The slope and intercept of the meteoric water line vary slightly by location [20]. The meteoric line of the Philippines (hereafter abbreviated as PMWL) defined by Salonga [21] is expressed as follows:
δD = 8 δ18O + 12.5 ± 0.5
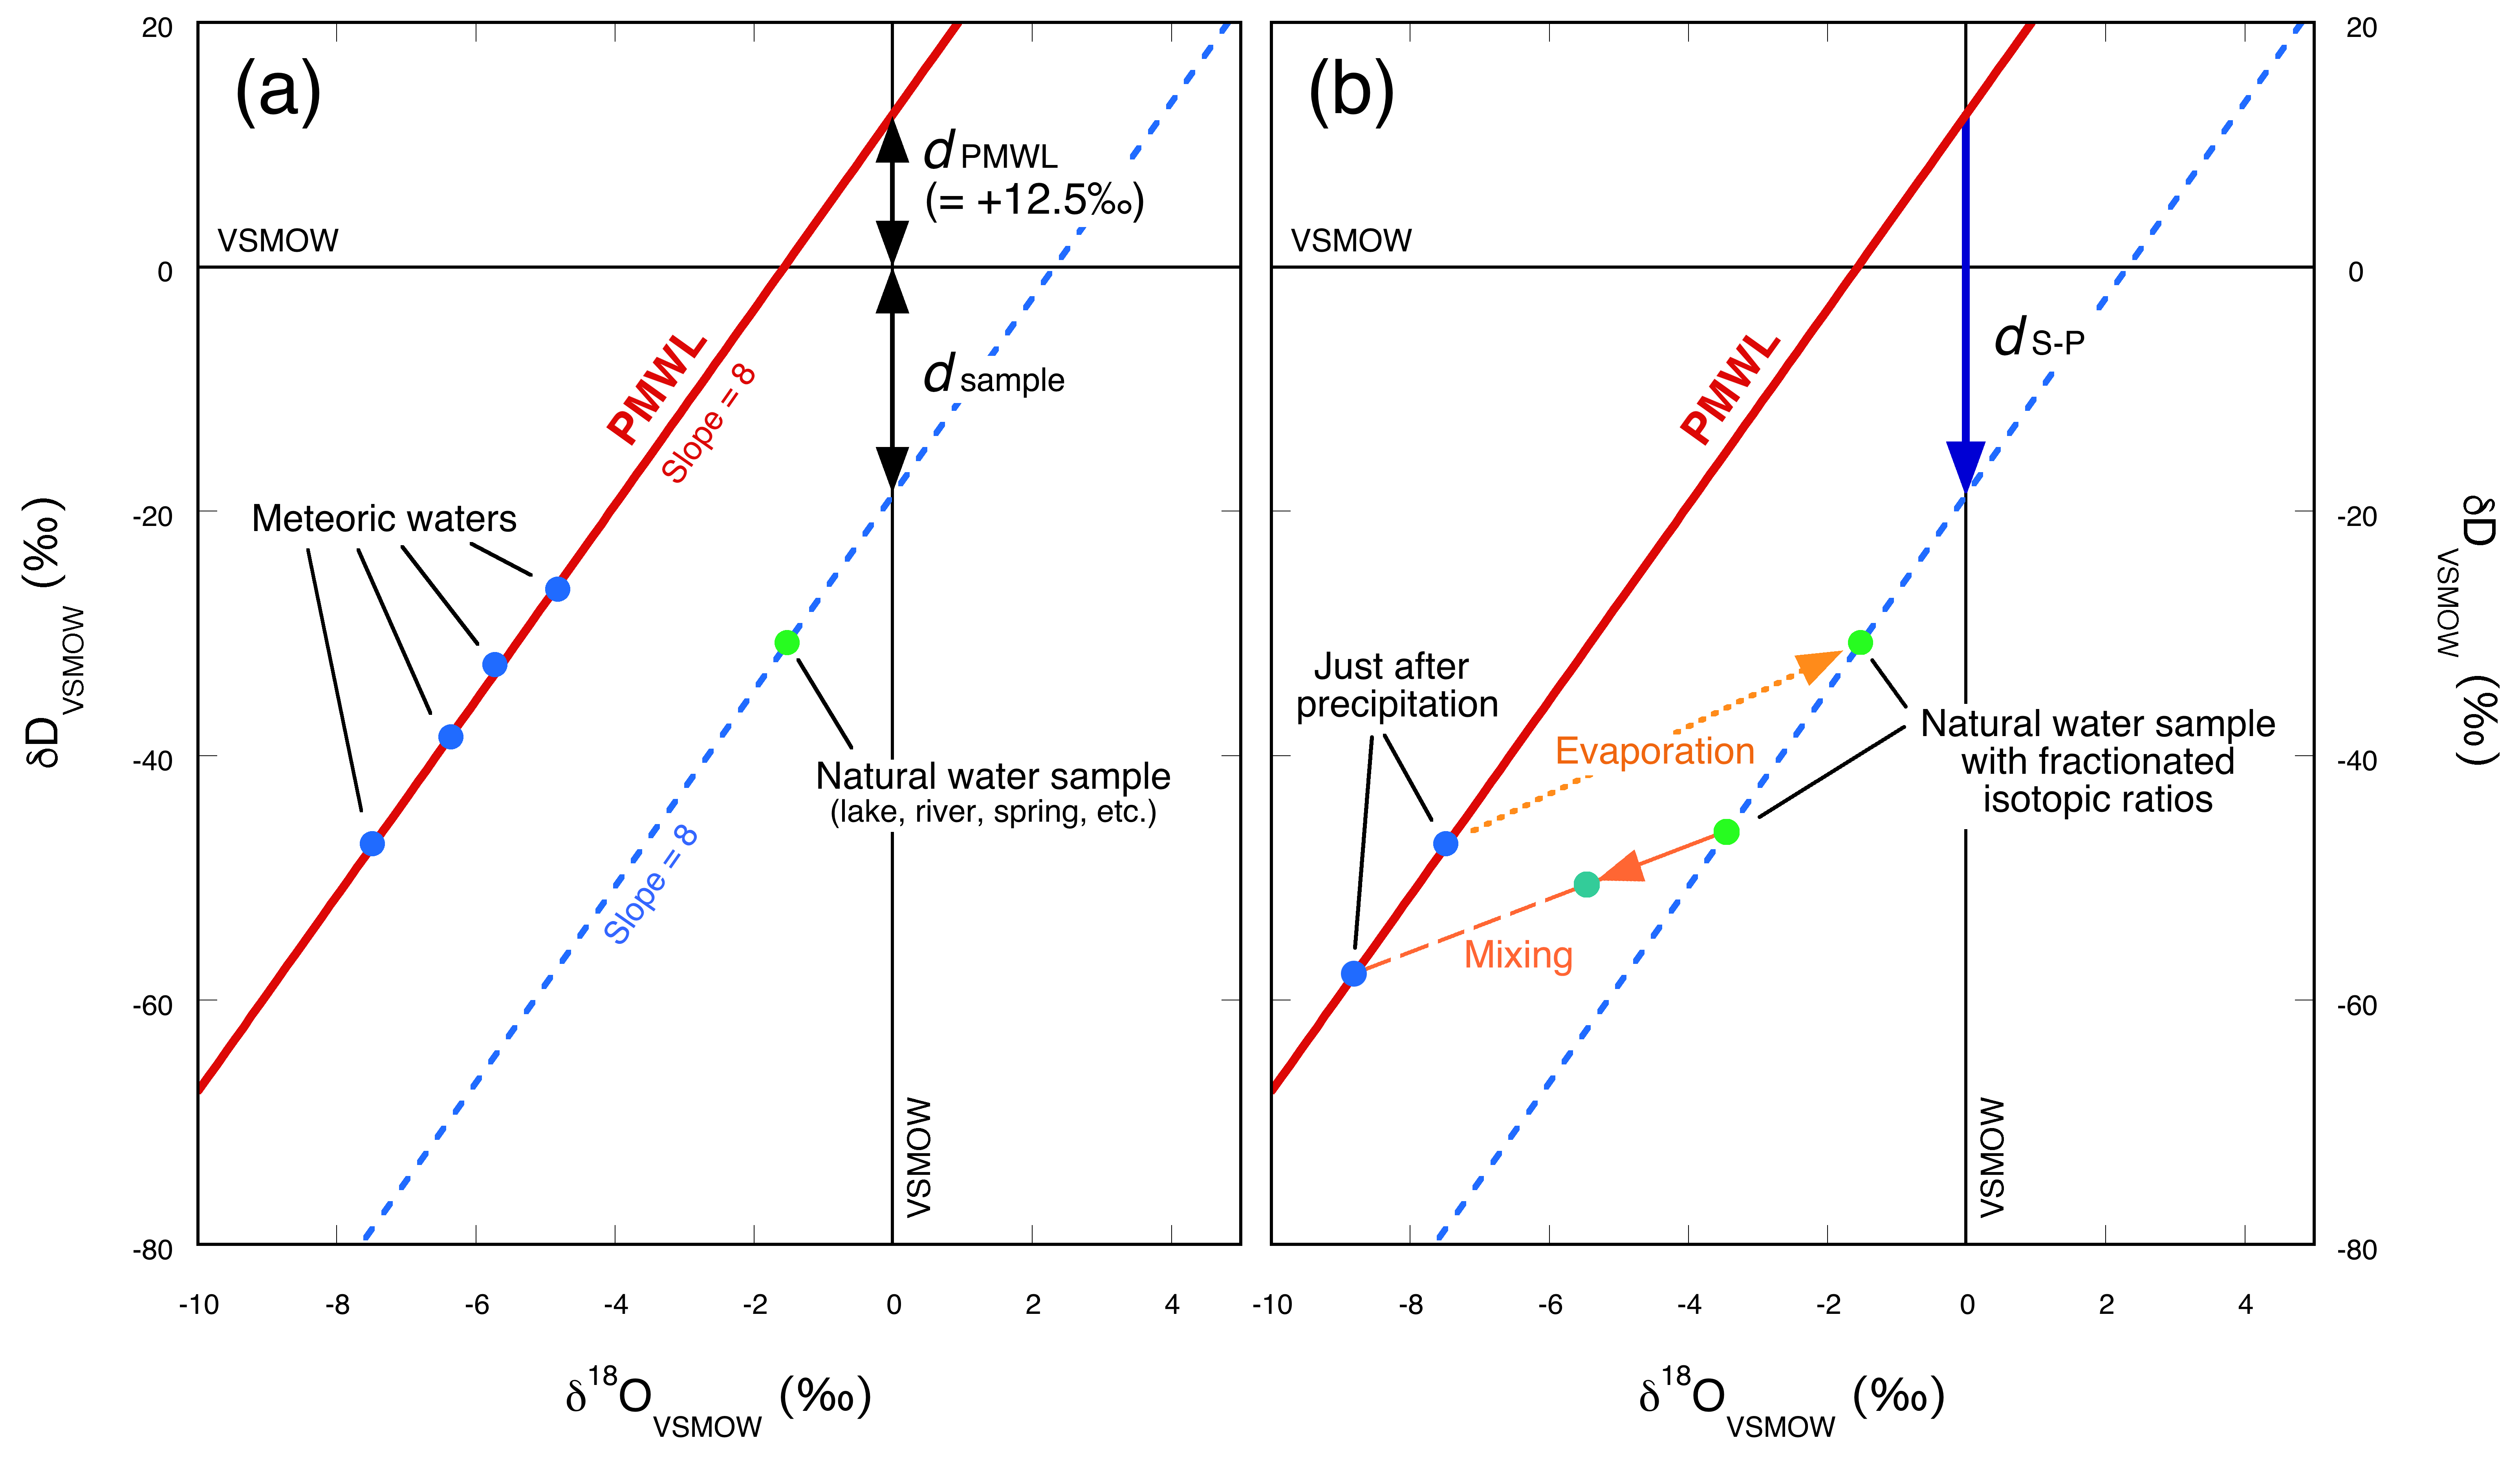
The intercept values of Equations (2) and (3) are called the deuterium excess (d-excess, hereafter abbreviated as d) [22]. The d value of a sample is defined as follows:
dsample = δDsample − 8 δ18Osample
The water isotope properties of precipitaton in Quezon City, Metro Manila (near the upper left corner of Figure 1) are available to the public on the IAEA website (GNIP) [23]. The slope and the intercept (i.e., the d value) are 7.24 ± 0.21 and 3.77 ± 1.47, respectively, for a precipitation amount weighted least squares regression (PWLSR) [23]. These values are different from those of the Equation (3) obtained by Salonga [21]. However, Gerardo-Abaya [23] pointed out that the meteoric line obtained from the data of Metro Manila (δD = 7 δ18O + 2 ± 1.8) differed noticeably from the lines for the other regions of the Philippines, which had slopes of 8 and intercepts from 10 to 13. When the data from Metro Manila were excluded, Gerard-Abaya [24] obtained a PMWL (δD = 8 δ18O + 12) that was similar to that of Salonga [21]. Given the peculiar water isotopic signature of precipitation in Metro Manila, we therefore used the PMWL obtained by Salonga [21] as the reference meteoric line in this study.
In this study, the deviation of the water isotopic ratios of the water relative to the PMWL is referred to as “the d value relative to the PMWL” (hereafter dS-P). The dS-P is defined by the d value of the PMWL (dPMWL; +12.5‰) as follows:
dS-P = dsample − dPMWL
The degree of deviation in the water samples of the Philippines can be expressed by the dS-P value. A negative dS-P value means that the water isotopic ratios of the sample have been made heavier than the PMWL by kinetic isotope effects and/or mixing of waters with distinct isotopic ratios after rainfall. Judging from the typical sizes of the standard errors (1σmean) of the water isotopic ratios, we can say that the water isotopic ratio of a water sample with a dPMWL value within about ±0.8‰ is on the PMWL.
The PMWL, the dPMWL, the dsample, and the dS-P are explained schematically in Figure 2. The water isotopic ratios of meteoric waters are along the PMWL (Figure 2a). Groundwater and river and lake waters affected by a kinetic isotope effect (i.e., evaporation after rainfall) have water isotopic ratios that deviate from the PMWL to heavier isotopic ratios (Figure 2b), because the evaporation process results in enrichment of the heavy isotopic species [25]. Various factors, including the amount of insolation, wind speed, temperature, and relative humidity (RH), affect the evaporation process [26,27]. The d value of the fractionated water sample is the intercept of the blue dotted line parallel to the PMWL (see Figure 2). In this case, the d value of the isotopically fractionated water is lower than that of the PMWL (12.5), and the dS-P takes a negative value.
The isotopically fractionated surface waters and groundwaters can be subsequently modified; e.g., their water isotopic ratios can be changed and moved toward the PMWL when other water(s), such as rainwater, is incorporated (Figure 2b). The degree of alteration of the water isotopic ratio generally depends on the mixing ratio of the waters and their water isotopic ratios.
3. Results
3.1. Dry Season
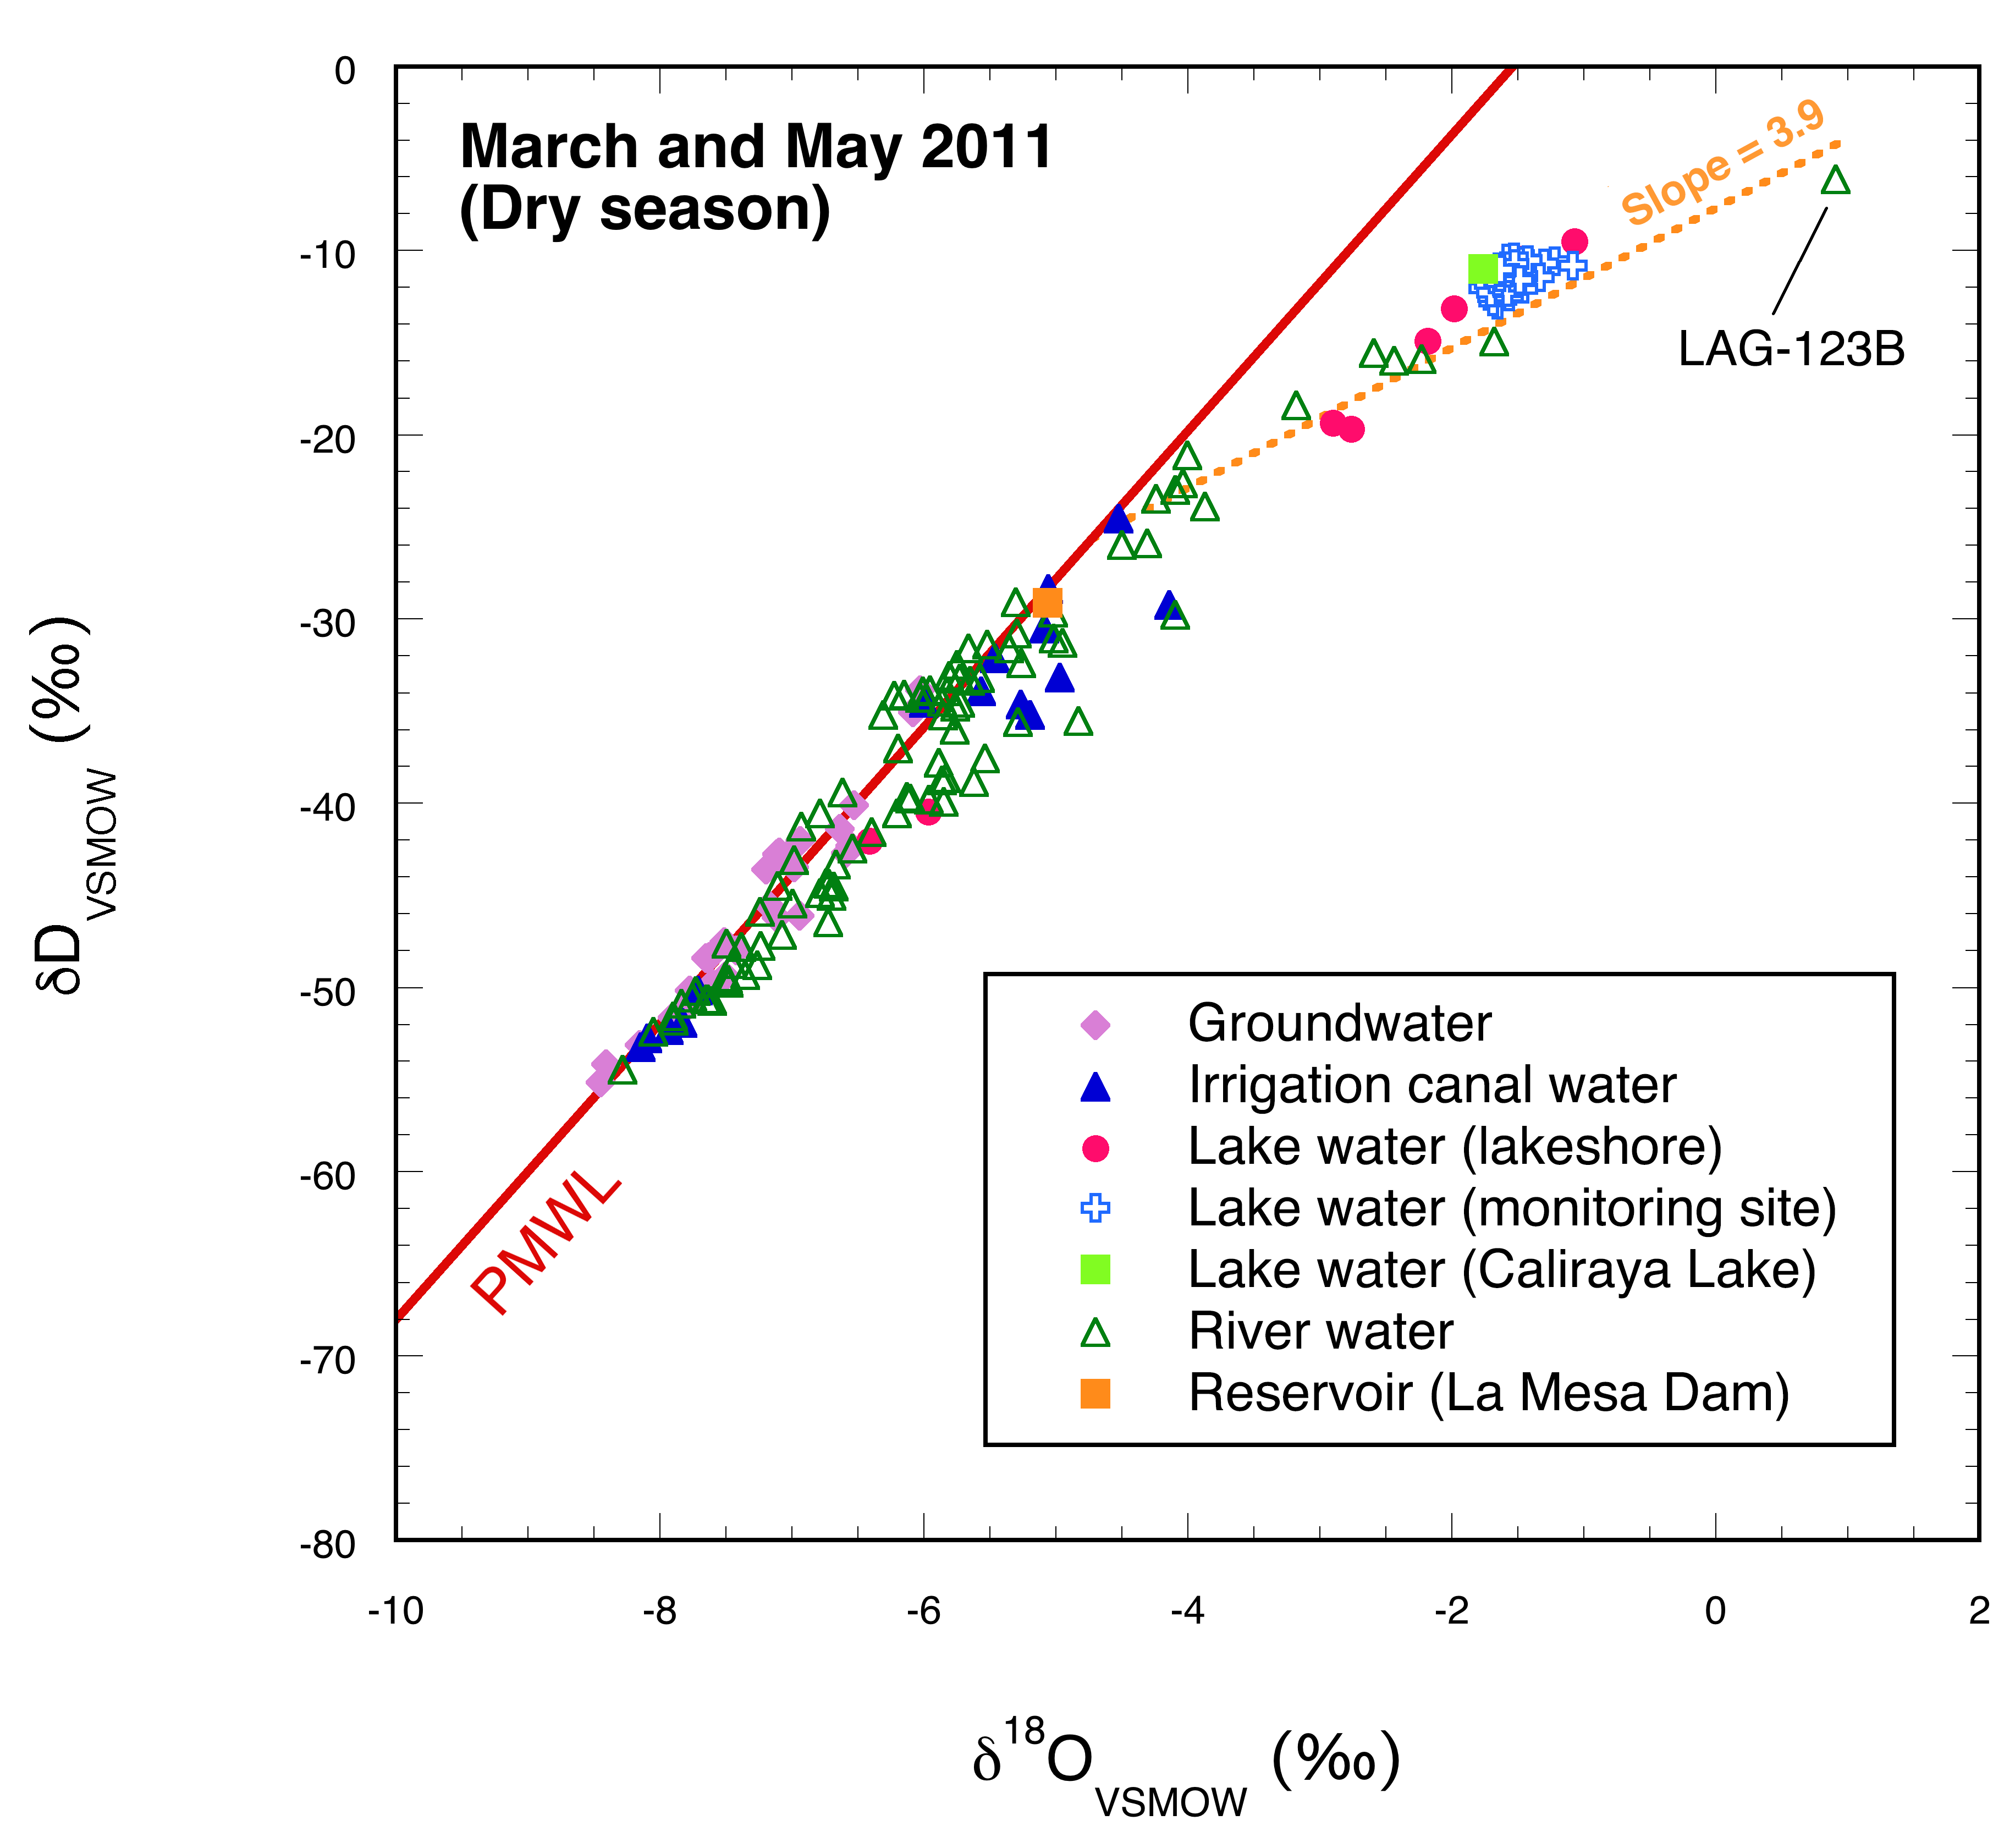
The water isotopic ratios of the groundwater and surface water samples obtained in March and May (the dry season) are summarized in Tables S1 and S2, respectively. The water isotopic ratios of the groundwaters, which were sampled from wells and springs, generally plot along the PMWL and range from −8.5‰ to −6.0‰ δ18O (Figure 3). Those of many of the irrigation canal waters lie along the PMWL. However, some analytical values deviate from the PMWL (Figure 3), and these samples yield dS-P values that range from −8.6‰ (LAG-47B) to −5.0‰ (LAG-51B).
There was no specific trend in the isotopic deviation from the PMWL for any of the rivers. In other words, the values of some water samples for a single river plotted along the PMWL, while those of others plotted away from the PMWL. The water isotopic ratios of the river waters had a tendency to deviate from the PMWL toward the heavier isotopic region (i.e., the upper right region of the δ18O-δD plot). Those that tended to deviate from the PMWL were up to 3.2‰ heavier in δ18O (LAG-123B; Table S2), corresponding to a dS-P value of −25.9‰. The trend in the deviation from the PMWL was obtained from the data of the waters from rivers (orange dotted line in Figure 2) and is defined as δD = 3.9 δ18O − 7.7.
The water isotopic ratios of the lake water samples obtained at the lakeshore (Figure S1c) are between 0.4‰ and 1.7‰ heavier in δ18O than the PMWL (Figure 3), and this range corresponds to dS-P values from −13.4‰ to −3.2‰. Their water isotopic ratios are widely distributed from δ18O = −6.4‰ to δ18O = −1.1‰ (Figure 3). The water isotopic ratios of the lake waters obtained from the 14 LLDA monitoring sites in Laguna Lake are within a much smaller range (2.5‰ for δD and 0.68‰ for δ18O; Figure 3) than those of the lake waters from the lakeshore. The mean dS-P value of the lake water samples from the monitoring sites is −11.7 ± 0.9‰ (1σ).
The water samples from each LLDA monitoring site in May 2011 were obtained at a depth of 1 m below the water surface (Table S2). The samples from different depths at each monitoring site form an individual group of water isotopic ratios that vary by <1‰ for δD and <0.3‰ for δ18O (Table S2). There is no consistent relationship between water isotopic ratios and sampling depth.
The water isotopic ratios of water samples from Caliraya Lake, an artificial lake to the east of Laguna Lake (LAG-59B; Figure S1c), are similar to those of waters from the lake monitoring sites (Figure 3), and deviate from the PMWL at −9.4‰ of the dS-P. On the other hand, as shown in Figure 3, those of the reservoir of the La Mesa Dam in Quezon City (LAG-98B; Figure S1c) are very close to the PMWL (dS-P = −1.1‰; Table S2).
3.2. Wet Season
3.2.1. August 2011
In August 2011, water samples from Laguna Lake and rivers were collected mainly from the LLDA monitoring sites (Table S3). The water isotopic ratios of the waters obtained in August are shown in Figure 3. The water isotopic ratios of the river waters are distributed in the isotopically lighter region of the δ18O–δD plot (i.e., the lower left region). The δ18O range of ~3.3‰ (Figure 4) for these samples is about 1/3 of the range for the dry season (~9.2‰; Figure 2). The dS-P values of the river waters range from −6.5‰ to 2.0‰ (Table S3).
The δ18O values of the lake waters from the LLDA monitoring sites are widely scattered from −6.1‰ to −3.3‰ and differ from those obtained in the dry season (Figure 3). The dS-P values range from −4.6‰ to −11.4‰ (Table S3). At LLMS-2, -12, -15, and -16, water samples were collected from the surface and from depths of between 2 and 8 m. The water isotopic ratios are not significantly related to sampling depth, and the ranges of δD and δ18O values from the various sites are within ~0.1‰ and ~0.32‰, respectively (Table S3). The water isotopic ratios vary slightly among the monitoring sites. The water isotopic ratios of 12 samples collected from the lake water monitoring sites show a linear trend defined by the following equation: δD = 6.0 δ18O − 4.8 (R2 = 0.98) (Figure 4).
3.2.2. October and November 2011
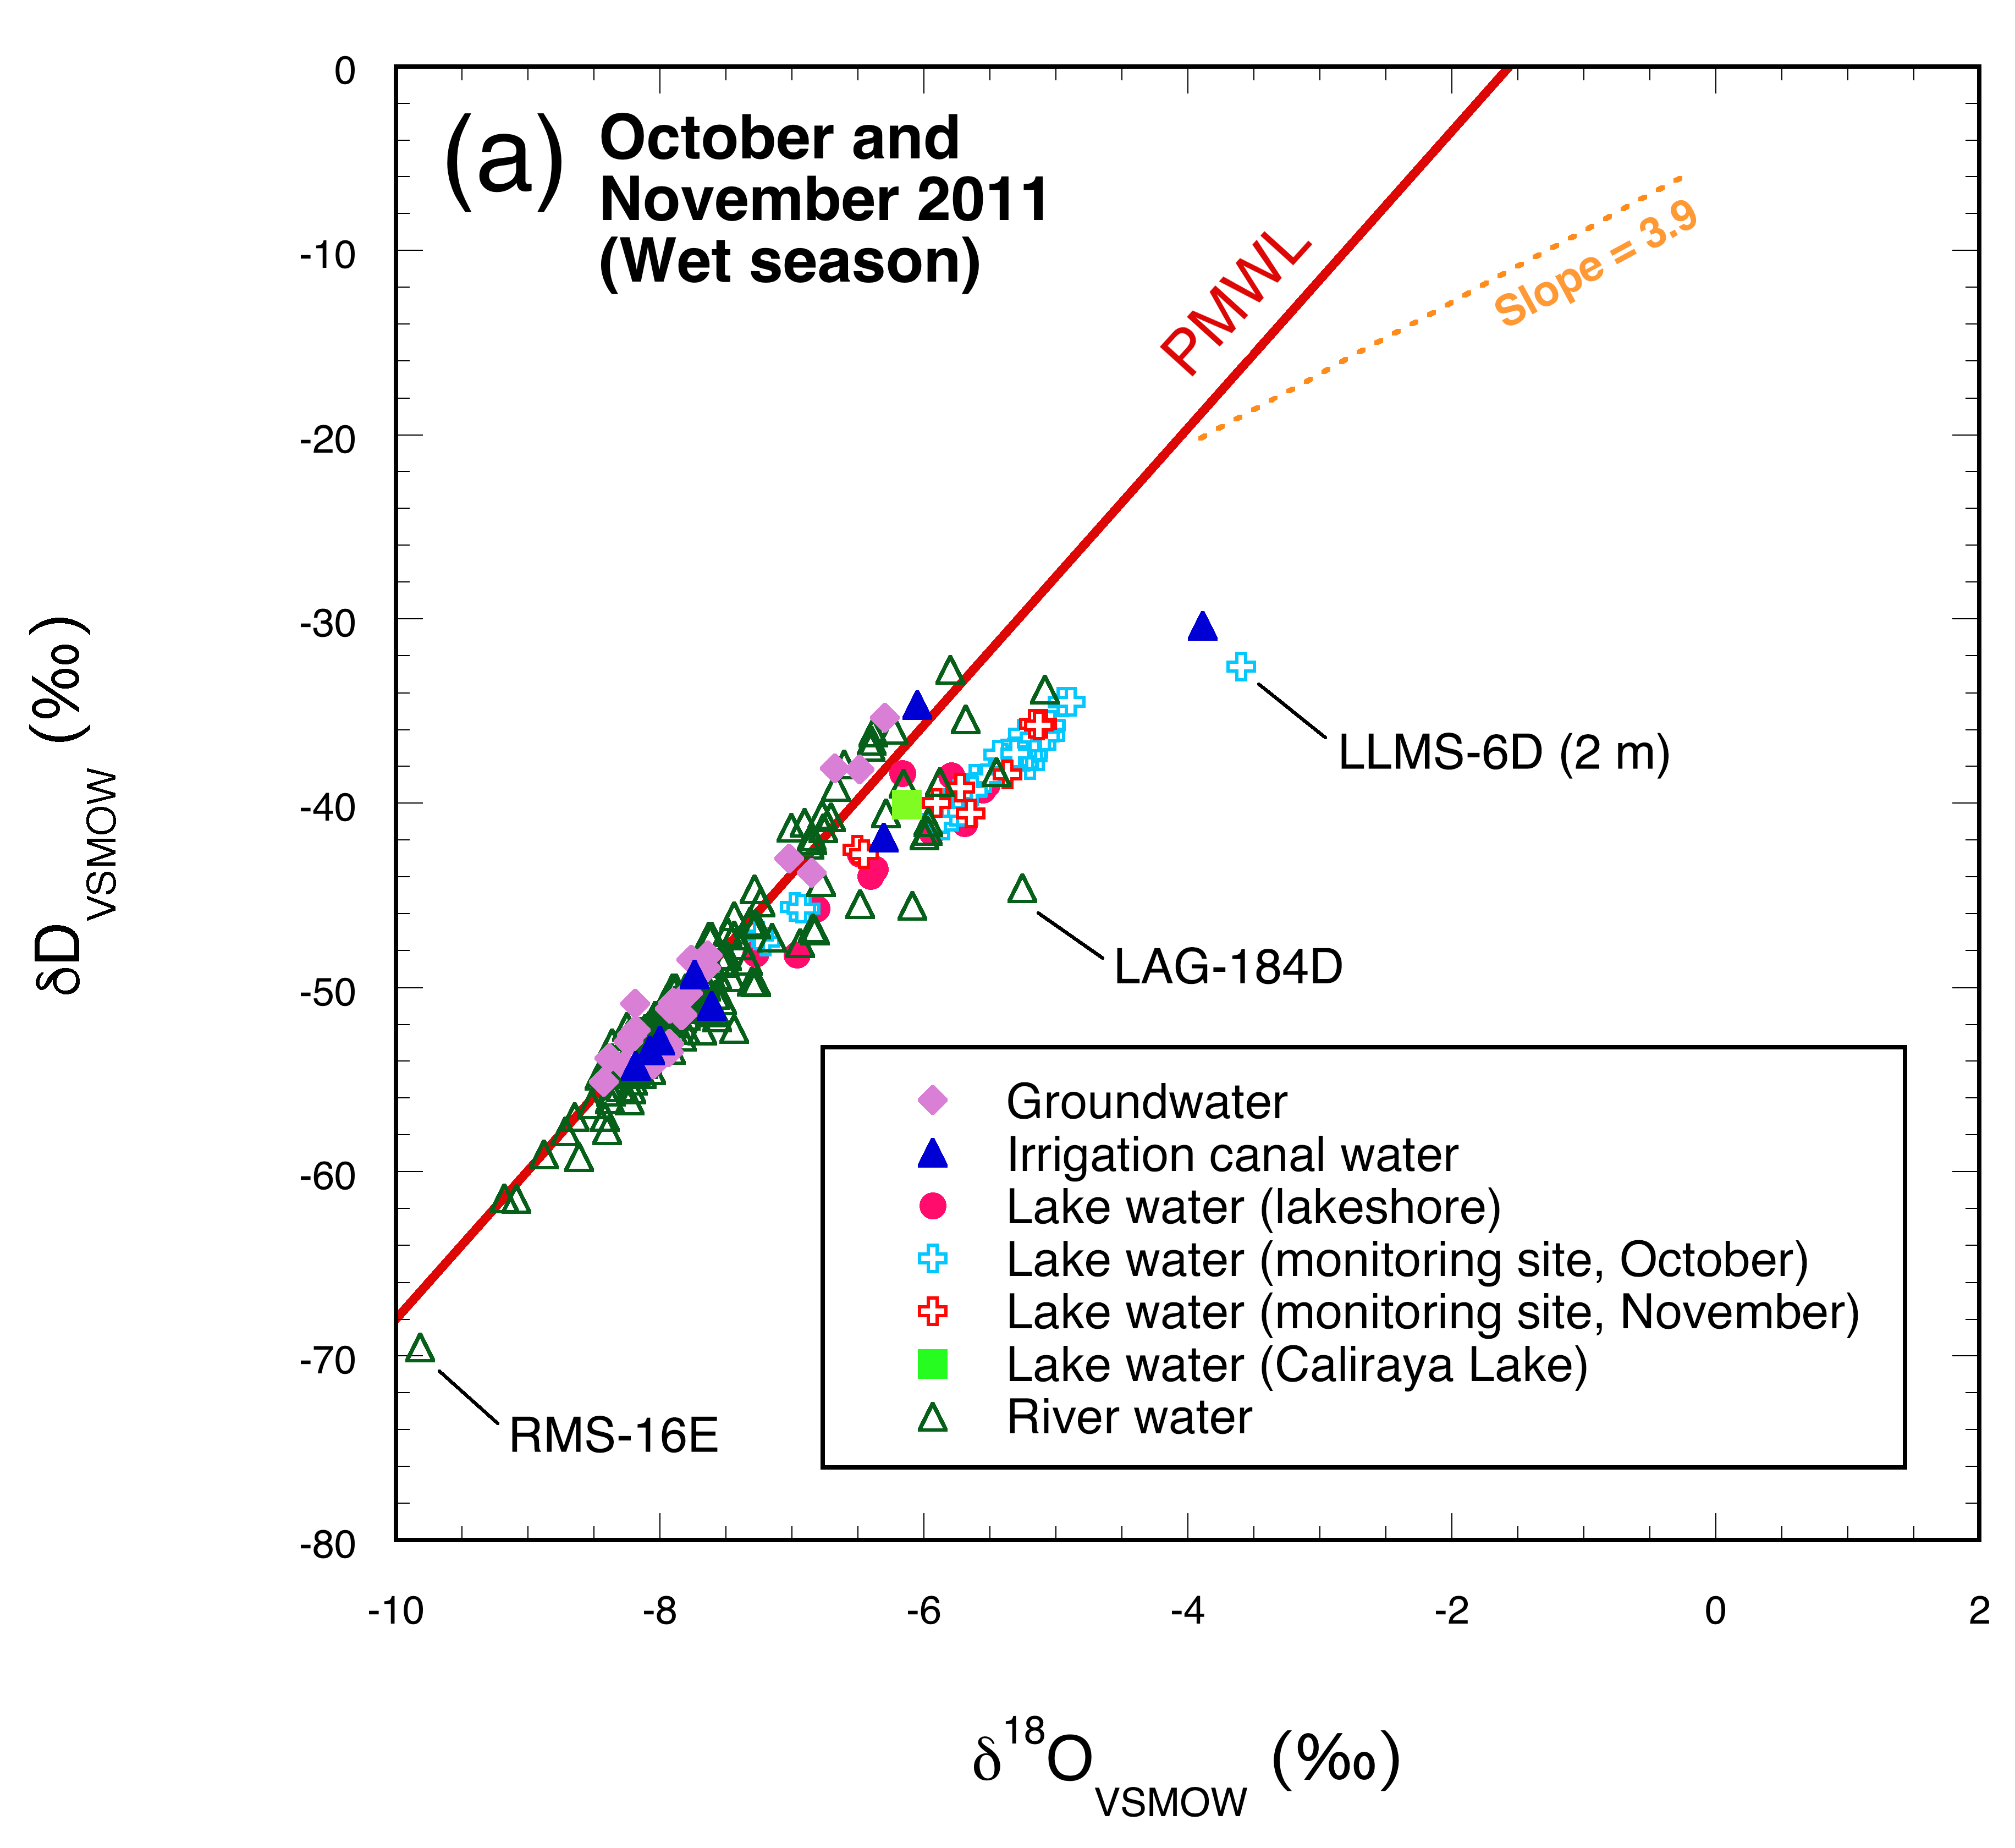
The water isotopic ratios of the groundwaters collected in October and November 2011 show δ18O values between −8.4‰ and −6.3‰, and are generally along the PMWL with dS-P values between −2.6‰ and 2.8‰ (Figure 5a, Tables S4 and S5). This isotopic distribution is similar to that of the dry season (Figure 3). The water isotopic ratios of irrigation canal waters show δ18O values between −8.2‰ and −3.9‰ (Figure 5a, Tables S4 and S5). The dS-P value of the isotopically heaviest sample is −11.8‰ (LAG-47D; Table S4), which is slightly lower than the heaviest value for the dry season (−8.6‰; LAG-47B in Table S2).
The water isotopic ratios of the lake waters collected at the lakeshore plot more closely to the PMWL, and the δ18O values are within a narrower range (−8.1‰ to −5.5‰) than in the dry season (Figure 5a). The dS-P values range from −8.1‰ to −1.6‰ (Tables S4 and S5).
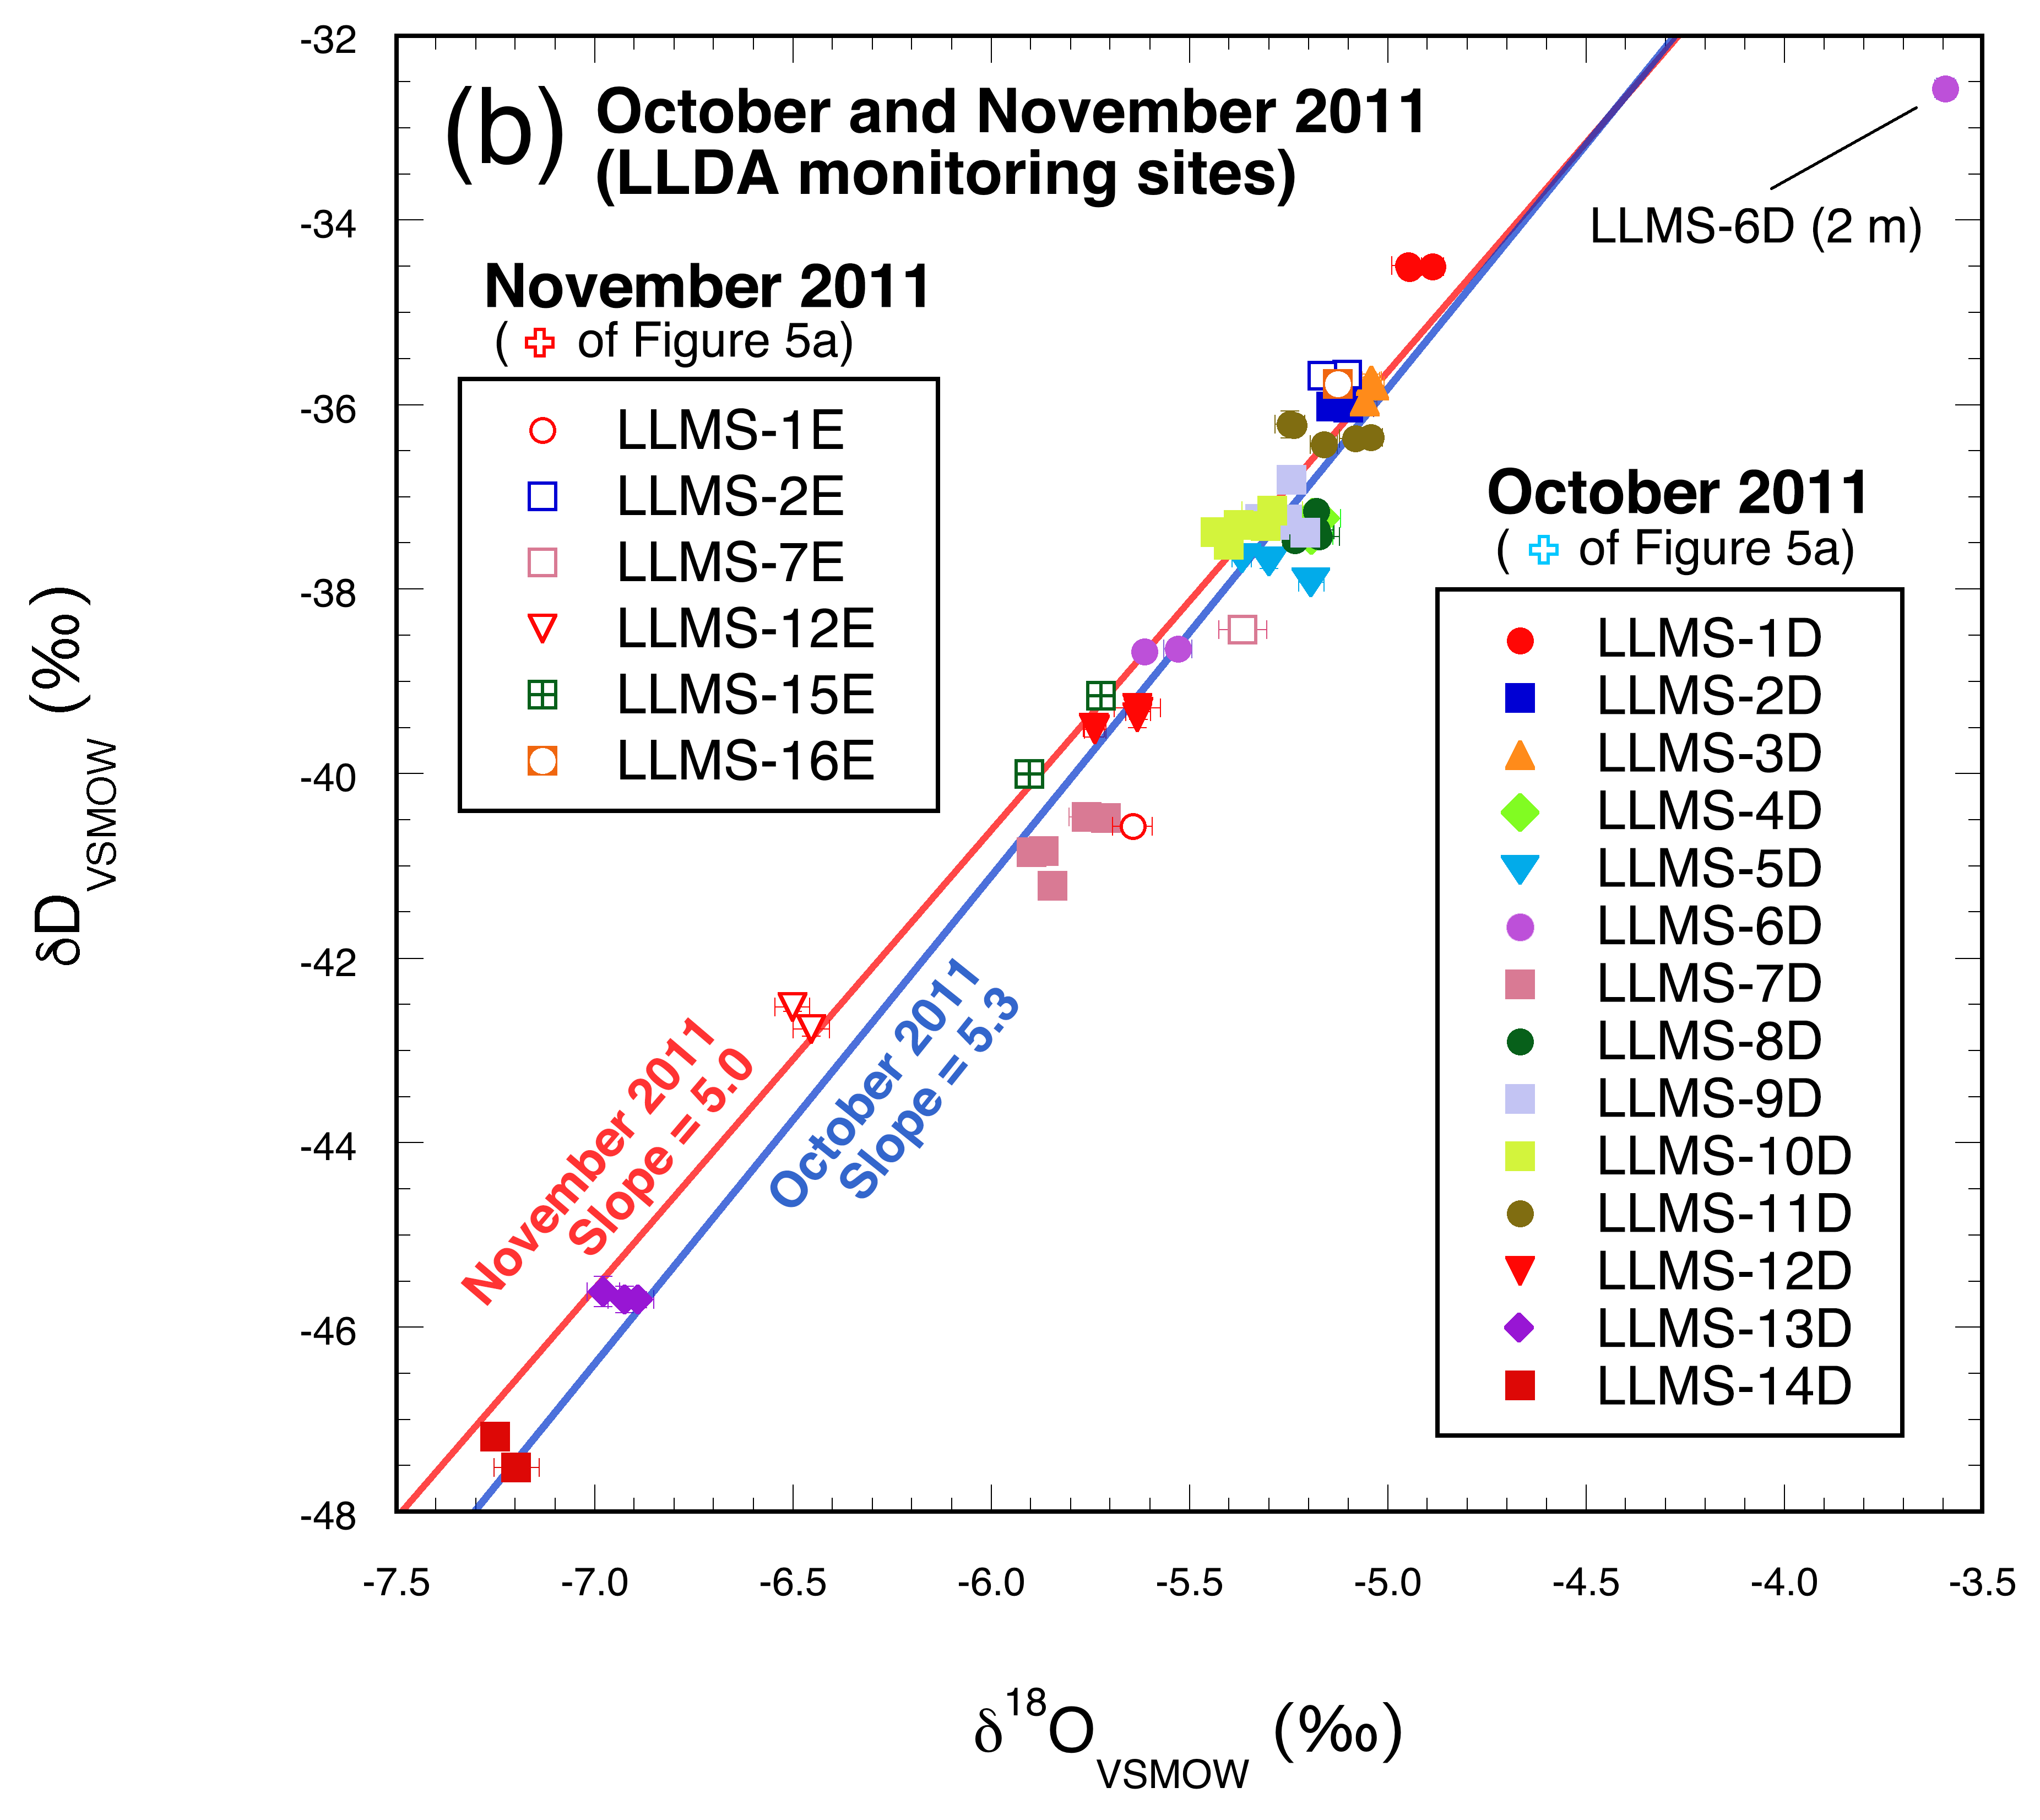
The water isotopic ratios of the lake waters collected from the LLDA monitoring sites in August, October, and November 2011 are generally similar. Those of October 2011 are widely scattered and show δ18O values between −7.2‰ and −5.0‰ (Figure 5b). With the exception of the sample collected from a depth of 2 m at monitoring site 6, the water isotopic ratios from the different depths at the individual monitoring sites show δD values between 0.1‰ and 0.2‰, and δ18O values between 0.03‰ and 0.75‰. For the dry season, the water isotopic ratios of the samples from the individual monitoring sites fall into distinct groups. The ratios of the waters from monitoring sites 13 and 14 are 1‰−2‰ lighter in δ18O than those from the other monitoring sites (Table S4). The waters from sites 13 and 14 (with dS-P values from −1.7‰ to −3.1‰) differ markedly from those from the other monitoring sites. The dS-P values of the samples from monitoring sites 1–12 range from −6.1‰ to −8.9‰ (Table S4). Water from a depth of 2 m at monitoring site 6 yields a value of −16.3‰. With the exception of this sample, the water isotopic ratios of 54 samples from the lake water monitoring sites fall along a line defined by the following Equation: δD = 5.3 δ18O − 9.3 (R2 = 0.97) (the blue line of Figure 5b). The slope is shallower than that for August (6.0).
The water isotopic ratios of 9 samples collected from the LLDA lake water monitoring sites in November 2011 are within the range of those for October 2011 (Figure 5b), and differences in water isotopic ratios (δ18O) related to sampling depth at each monitoring site are within 0.1‰ (Table S5). They fall along the line defined by the following equation: δD = 5.0 δ18O − 10.8 (R2 = 0.91) (the red line of Figure 5b). The slope is not as steep as that defined by the lake water samples collected in October (5.3; Figure 5b).
The distributions of water isotopic ratios of river waters for October and November 2011 are similar to the distribution for August 2011 (Figure 4 and Figure 5). The water isotopic ratios of LAG-184D show the greatest deviation from the PMWL (~1.9‰ heavier in δ18O; dS-P = −15.1‰; Table S4). Of the waters collected in the wet and dry seasons, the ratio was lightest in the water collected from the LLDA river monitoring site at Buli (RMS-16E; Figure 1) in November 2011 (Figure 5a, Table S5). When this sample is excluded, the isotopic ratios of river water samples collected in October and November 2011 were within similar ranges (~3.4‰ for δ18O; Figure 5a, Tables S4 and S5). The water isotopic ratios of the water samples from Caliraya Lake are ~4.4‰ lighter in δ18O than those obtained in the dry season (Figure 2 and Figure 5a) and are closer to the PMWL (dS-P = −3.6‰; Table S4).
4. Discussion
4.1. Dry Season
The isotopic ratios of groundwaters collected in the dry season generally fall along the PMWL, and the dS-P values lie within a narrow range (−3.1‰ to 1.8‰; Tables S1 and S2). Fifteen samples of irrigation canal waters also fall along the PMWL and, with the exception of four samples (i.e., LAG-42B, -47B, -48B, and -51B; Table S2), show dS-P values between −2.3‰ and 0.9‰. The relatively narrow range of dS-P values around the PMWL suggests that the groundwaters and irrigation canal waters were not strongly affected by evaporation. However, the water isotopic ratios of the four irrigation canal water samples, with dS-P values from −8.6‰ to −5.0‰, may have become heavier because of evaporative concentration.
The water isotopic ratios of the river waters are widely dispersed along the PMWL, and those of some river water samples have a tendency to deviate from the PMWL in the isotopically heavier region of the δ18O–δD plot (orange dotted line in Figure 3). This fractionation line can be regarded as the evaporation line for the dry season. The slope of this evaporation line (3.9) is somewhat smaller than that calculated for surface waters (~5.6) by Salonga [21], but is similar to that of sulphate springs (~4.0), also calculated by Salonga [21].
The water isotopic ratios of the LLDA lake monitoring sites are similar (Figure 3), and the water isotopic ratios do not correlate with the sampling depths (Table S2). This result suggests that during the dry season, the lake water is almost homogeneous throughout the whole area, including from the surface to the bottom of the lake. In the dry season, the effect of evaporative concentration on the water of Laguna Lake is similar throughout the lake. Laguna Lake is only ~3 m deep on average, so it may be difficult to achieve significant isotopic heterogeneity by depth in the lake. A previous study also reported that Laguna Lake was thermally unstratified throughout the year [28]. In other words, the physicochemical conditions in Laguna Lake may not reflect vertical stratification throughout the year.
On the other hand, the water isotopic ratios of the lake waters obtained at the lakeshore fall within a wider range (Figure 3). The lake waters close to the lakeshore may have been more strongly affected by mixing with river waters with variable water isotopic ratios than those collected far from the lakeshore. Consequently, the isotopic ratios of the lake waters at the lakeshore may display more heterogeneity than those of lake waters obtained far from the lakeshore (i.e., those obtained from the LLDA monitoring sites). The isotopic data of lake waters from the monitoring sites and those from the lakeshore suggest that the isotopic contribution from river waters was restricted to the narrow zone along the lakeshore in the dry season. To estimate the isotopic contribution of river waters and isotopic zoning in Laguna Lake, we would need to sample water at regular spatial intervals (probably several tens of meters) from the lakeshore to the center of the lake.
As with Laguna Lake, the isotope ratios of Caliraya Lake may have been affected by the evaporative concentration, which may explain why the isotopic ratios of Caliraya Lake are similar to those of Laguna Lake (Figure 3). The isotopic ratios of water from the reservoir of the La Mesa Dam fall close to the PMWL (Figure 3). The reservoir water was apparently significantly affected by evaporation, probably because the water was replaced frequently and/or rainwater was incorporated just before sampling.
4.2. Wet season
Notable findings of this study are the narrow distribution of isotopic ratios for the river and lake waters from near the lakeshore and the highly dispersed distribution of lake waters from the monitoring sites in the wet season (Figure 4 and Figure 5).
While the isotopic ratios of the river waters and lake waters from near the lakeshore are always subject to evaporative concentration, the narrow distribution of the isotopic ratios of these waters may be attributable to a greater contribution from rainwater just after rainfall. The evaporative concentration effect may be weakened by the contribution from rainwater to the river water in the wet season. The wider distribution of the water isotopic ratios of the lake waters from the monitoring sites may also have resulted from the combined effects of isotopically heterogeneous precipitation falling directly on Laguna Lake. Unlike the river waters, which flow continuously, the water isotopic ratios of the lake water are more strongly affected by evaporative concentration, and change in a direction away from the PMWL. The wider variations in the water isotopic ratios of the lake water may also be caused by isotopically heterogeneous rainwater. The slopes of the correlations of the water isotopic ratios of the lake waters from the monitoring sites become less steep over time (from 6.0 to 5.0) (Figure 4 and Figure 5). This trend may reflect a gradual increase in the evaporation effect on the isotopes of Laguna Lake throughout the wet season.
The dry season in the Philippines normally starts in December, when the isotopic ratios of lake waters would be expected to move towards those shown in Figure 3. However, we were unable to trace the water isotopic variations in the lake waters from the end of the wet season to the beginning of the dry season because there are no usable data for December 2011.
The water isotopic distributions of the groundwaters and irrigation canal waters in the wet and dry seasons are similar, falling mainly along the PMWL (Figure 3 and Figure 5). Many of the groundwaters were not strongly affected by evaporative concentration because, being under the ground, they were not subjected to significant evaporation after rainfall and infiltration. The large deviation from the PMWL of the water isotopic ratios of some irrigation canal water samples resulted from the effect of evaporative concentration or mixing with highly fractionated river waters.
4.3. Factors Controlling the Isotopic Properties of Laguna Lake
The water isotopic ratios of Laguna Lake may be controlled by the following factors.
- Water from the original Laguna Lake system.
- Surface waters from rivers and irrigation canals.
- Groundwater incorporated into the rivers and that was directly incorporated into Laguna Lake.
- Rainwater falling directly onto Laguna Lake that was incorporated into the groundwater and surface water in the catchment area of the lake.
- Evaporative concentration of the water isotopes of Laguna Lake and of the groundwater and surface water in the water catchment area.
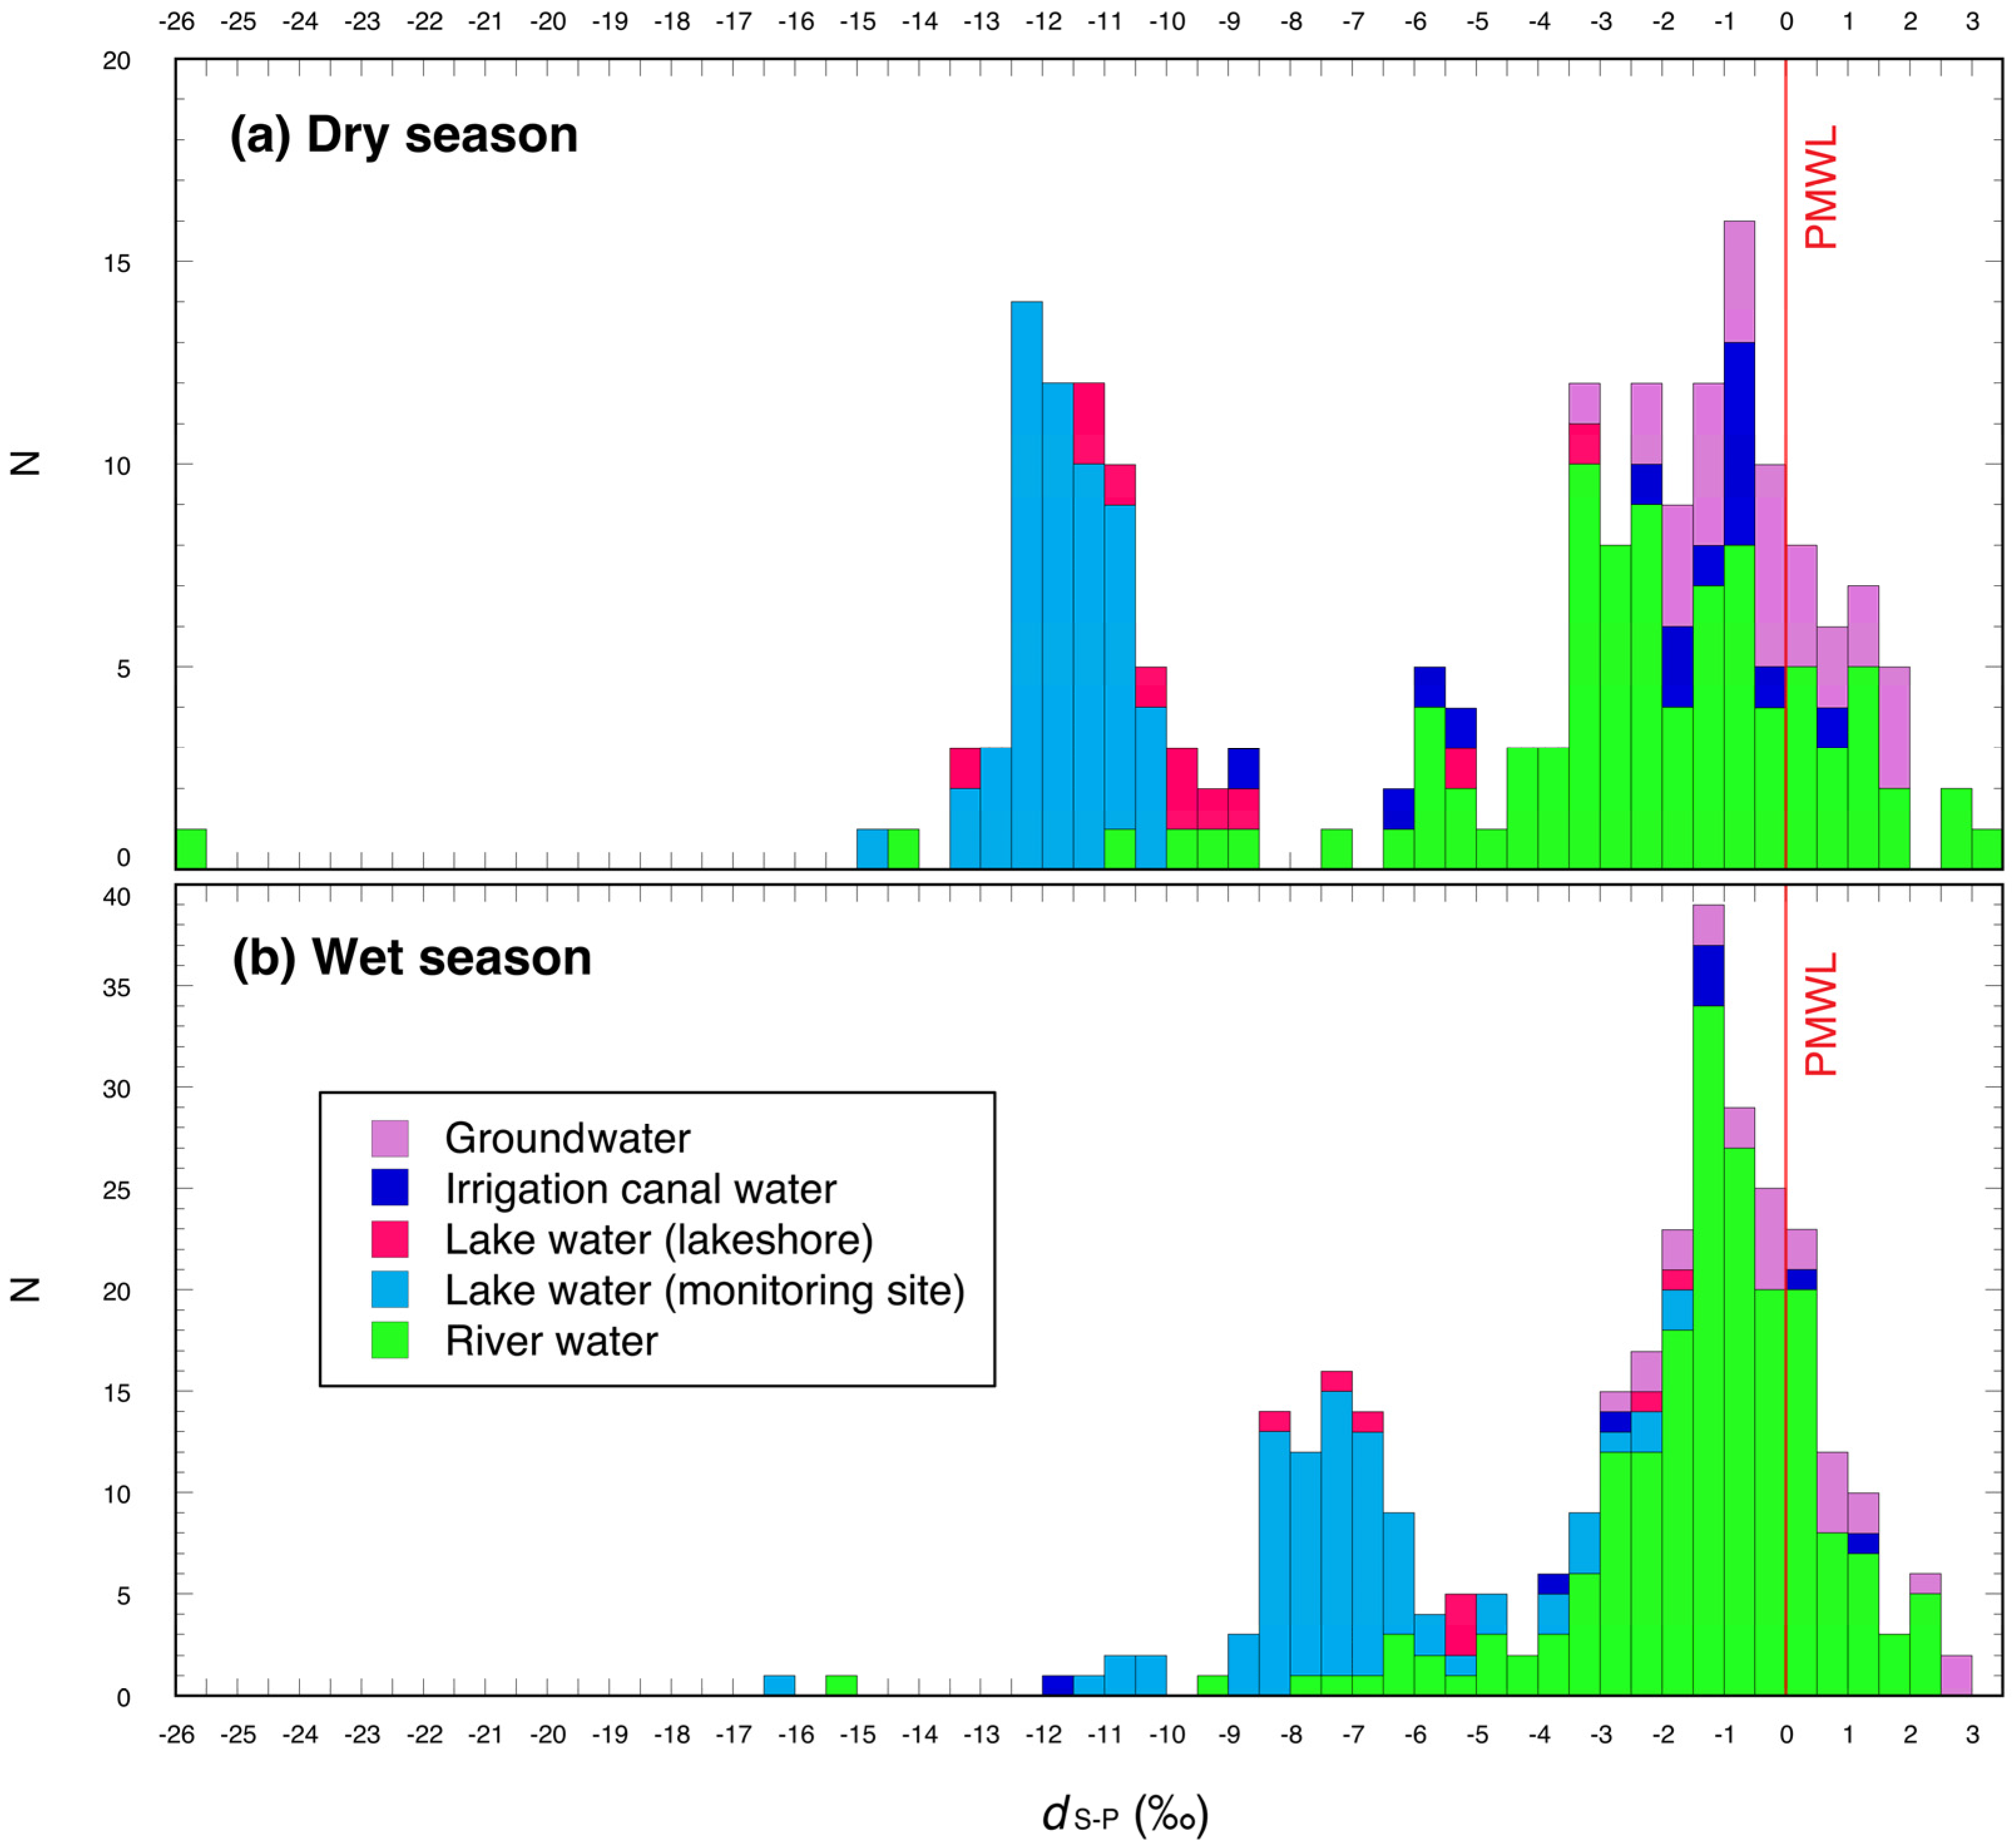
Figure 6 shows the distributions of the dS-P values in the dry and wet seasons. The distributions of the dS-P values of the groundwaters and river waters in the dry season (Figure 6a) are generally similar to those in the wet season (Figure 6b). Most of the dS-P values of the river waters are between −8‰ and 2.5‰, and those of the groundwaters are between −3‰ and 3‰ (Figure 6). The distributions of the dS-P values of the irrigation canal waters in both the dry and the wet seasons generally overlap with those of the river waters and groundwaters. The distribution of the surface water dS-P values tends to be wider in the dry season than in the wet season; however, the distributions are fairly constant throughout the year. The differences in these distributions may reflect the contributions of isotopically fractionated rainwater and evaporative concentration.
In contrast to the groundwater and surface water, the distributions of the dS-P values of the lake water differ between the dry and wet seasons (Figure 6). The dry season values are mainly between −13.5‰ and −10‰, whereas the wet season values are mainly between −1.5‰ and −11.5‰. Moreover, the dry season values of the lake water are largely distinct from those of the groundwater and surface water, which suggests that groundwater and surface water make a limited contribution to the lake water in the dry season (Figure 6a). On the other hand, the dS-P values of Laguna Lake for the wet season are slightly heavier than those for the dry season, and the distribution overlaps with the range of surface waters (Figure 6b). This isotopic feature of the wet season may reflect the incorporation of surface waters (mainly river water) that were isotopically affected by evaporative concentration. However, the modes of the dS-P values (−9‰ to −6‰) lie at the margin of the distribution of the river water values (Figure 6b). In addition, the fact that the distributions of the water isotopic ratios of Laguna Lake are distinct from those of the groundwater and river water (Figure 4 and Figure 5) suggests that the relationship between the water isotopic ratios of the groundwater and surface water and those of the lake water is limited. On the other hand, the dS-P values of the lake waters from the lakeshore have a wider distribution than those of the lake waters from the LLDA monitoring sites in the dry season (Figure 6a), but are within a similar range in the wet season (Figure 6b). These distributions indicate that the influence of river water is stronger at the lakeshore sites than at the LLDA monitoring sites.
The distributions of the dS-P values shown in Figure 6 suggest that the water isotopic ratios of the lake may be controlled mainly by the incorporation of rainwater with water isotopic ratios that fall along the PMWL and by the evaporative concentration of water isotopes throughout the year. The water isotopes of the lake water might be preferentially fractionated under limited conditions, such that the lake water can only flow out via the Pasig River or be directly evaporated from the lake surface [3,4], meaning that the lake water has isotopic ratios that are distinct from those of the ground and surface waters in the water catchment area (Figure 3, Figure 4, Figure 5 and Figure 6). Therefore, Laguna Lake can be regarded as a semi-enclosed system from the perspectives of both water resource management [3,4] and its geochemical and hydrological properties.
The incorporation of isotopically-fractionated groundwater from the bottom of the lake may also affect the water isotopic ratios of the lake water, however its effect on the lake water is still unknown. The water isotopic ratios of the groundwaters (Figure 3 and Figure 5) indicate that their contribution may be also limited, but may be relatively constant throughout the year. Moreover, even though samples were collected from the whole area around Laguna Lake, none of the water isotopic ratios of the rivers were overly irregular. That said, there may be isotopically anomalous river(s). However, the analytical data of this study suggest that, if actually present, the contribution of isotopically amomalous rivers to the water isotopic ratios of the lake water may be limited.
As with the lake water, the river water is isotopically affected by rainwater. In the dry season, the range of dS-P values of the river water is ~30‰ (Figure 6a), with dS-P values up to −26‰ from the PMWL (LAG-123B; Table S2). The range in the wet season is only ~18‰ (Figure 6b), with dS-P values up to −15‰ from the PMWL (LAG-184D; Table S4). The contribution of rainwater to river water is smaller in the dry season than in the wet season, meaning that evaporative concentration can affect the water isotopic ratios of the river water during the dry season with little disturbance from rainwater with water isotopic ratios along the PMWL. This is also reflected in the width and distribution of the water isotopic ratios of the irrigation canal waters (Figure 6). The water isotopic ratios of the lake water in the dry season were distributed near the fractionation line produced by those of the river water (the orange dotted line of Figure 3). As mentioned above, isotopically-fractionated river water may have had some effect on the water isotopic distribution of the lake waters along the lakeshore.
The distributions of dS-P values of groundwaters and surface waters in the wet and dry seasons are generally similar (Figure 6). Therefore, the effect of evaporative concentration, another essential factor that controls the water isotopic ratios, may be constant throughout the year in the catchment area of Laguna Lake. The almost constant effect of evaporative concentration may correspond closely to the temperature, which also has a narrow range throughout the year (26–30 °C in Manila) [16].
5. Conclusions
As shown in Figure 6., the waters in Laguna Lake and its water catchment area can be roughly divided into two types, namely lake water from Laguna Lake with heavier water isotopic ratios, and ground and surface waters with lighter ratios. The water isotopic ratios of Laguna Lake are controlled mainly by rainwater and evaporative concentration. The contributions from groundwaters and surface waters may be relatively constant throughout the year.
The results presented in this study indicate that the water of Laguna Lake and its catchment area clearly falls into two water-isotopic types. These results will provide the basis for discussions of the data obtained in various studies of the waters from Laguna Lake and its catchment area, including our research on the health risks from drinking water. Moreover, they will be helpful for re-examining the results of previous studies. However, further detailed studies on the water isotopic properties, including evaluations of meteoric lines from various regions around the lake, are needed to provide a complete picture of the water isotopic properties of Laguna Lake and the groundwaters and surface waters of its catchment area throughout the year.
Supplementary Materials
The following are available online at www.mdpi.com/2073-4441/9/5/328/s1, Table S1: isotopic ratios of water samples collected in 13–16 March 2011 (dry season); Table S2: isotopic ratios of water samples collected in 2–9 May 2011 (dry season); Table S3: isotopic ratios of water samples collected in 1–17 August 2011 (wet season); Table S4: isotopic ratios of water samples collected in 17–31 October 2011 (wet season); Table S5: isotopic ratios of water samples collected in 2–17 November 2011 (wet season); Figure S1: sampling points of groundwaters and surface waters used in the R-06 research project.
Acknowledgments
We thank Ryohei Kada, the project leader of the R-06 research project entitled “Managing Environmental Risks to Food and Health Security in the Southeast Asia Watersheds” (FY 2011–2013), at the Research Institute for Humanity and Nature (RIHN) in Kyoto, Japan, for allowing us to use the water isotope data of the water sampled from Laguna Lake and surrounding areas, which were not used in the R-06 research project. We also thank all the other members of the R-06 research project for sampling and transporting the water samples from the Philippines. We are also grateful to the members of the Center for Coordination, Promotion, and Communication (CCPC) of RIHN for allowing us to use their valuable instruments and generously providing consumables, electricity, and water. We are grateful to Kyoto Fission-Track Co., Ltd. and the Risk Management Laboratory of the Japan University of Economics for their support of our study. Stallard Scientific Editing improved the quality of English of the article and is deeply appreciated. This study was partly supported by a Grant-in-Aid for Scientific Research to HK (15K00672, FY 2015–2017) from the Ministry of Education, Culture, Sports, Science and Technology of Japan.
Author Contributions
Seiji Maruyama carried out the water isotopic ratio analysis of the water samples collected during the R-06 research project; Seiji Maruyama processed the analytical data; Seiji Maruyama and Hisaaki Kato conceived the idea to use the unused analytical data as basic background information for their research into health risks in the Philippines, and Seiji Maruyama obtained permission from the R-06 project leader, Ryohei Kada, on 25 November 2015; Seiji Maruyama analyzed the geochemical analytical data; Hisaaki Kato examined the analytical data from hydrological and social science perspectives; Hisaaki Kato integrated the information of the sampling points and made the maps of the sampling points; Seiji Maruyama wrote the paper.
Conflicts of Interest
The authors declare no conflict of interest.
Abbreviations
The following abbreviations are used in this manuscript:
| CRDS | Cavity Ring-Down Spectrometer |
| GMWL | Global Meteoric Water Line |
| IRMS | Isotope Ratio Mass Spectrometer |
| IAEA | International Atomic Energy Agency |
| JICA | Japan International Cooperation Agency |
| LLDA | Laguna Lake Development Authority |
| PMWL | Philippines Meteoric Water Line |
| RIHN | Research Institute for Humanity and Nature |
| OA-ICOS | Off-Axis Integrated Cavity Output Spectrometer |
| VSMOW | Vienna Standard Mean Ocean Water |
References
- Shikiomanov, I.A. Chapter 2 World fresh water resources. In Water in Crisis: A Guide to the World’s Fresh Water Resources; Gleick, P.H., Ed.; Oxford University Press: Oxford, UK, 1993; pp. 13–24. [Google Scholar]
- Nakagami, K.; Kubota, J.; Setiawan, B.I. (Eds.) Sustainable Water Management; Springer: Singapore, 2016; p. 189. [Google Scholar]
- Kashiwagi, S.; Abe, M. International contribution to restore ecosystem services at inland waters environment: In the case of Laguna Lake in the Philippines. Jpn. Riverfront Res. Cent. Rep. 2012, 23, 127–128. (In Japanese) [Google Scholar]
- Laguna Lake Development Authority (LLDA). Available online: http://www.llda.gov.ph/index.php?option=com_content&view=article&id=74&Itemid=475 (accessed on 27 March 2017).
- Duyanen, J.P.; Siringan, F.P.; Santos, M.G.D.; Jaraula, C.M.B. Data Base and Methodology. In Sedimentation Patterns, Sediment Quality and Bathymetry of Laguna de Bay: Establishing Environmental Baselines for Lake Management Using the Sediment Record, Final Report; National Institute of Geological Sciences University of the Philippines Diliman and U. P. Science Research Foundation: Quezon City, Philippines, 2000; pp. 2–22. [Google Scholar]
- National Water Resources Council. Philippine Water Resources, First Assessment; Report No. 19; National Water Resources Council: Quezon City, Philippines, 1976.
- National Statistical Coordination Board. Philippine Water Resources. In Philippine Asset Accounts: Forest, Land/Soil, Fishery, Mineral, and Water Resources; Bartelmus, P., Alfieri, A., Eds.; ENRA Report No., 2; National Statistical Coordination Board: Manila, Philippines, 1998; pp. 171–227. [Google Scholar]
- Greenpeace. The State of Water Resources in the Philippines; Greenpeace Southeast Asia: Quezon City, Philippines, 2007; p. 49. [Google Scholar]
- Santos-Borja, A.; Nepomuceno, D.N. Laguna de Bay: Institutional development and charge for lake basin management. Lakes Reserv. Res. Manag. 2006, 11, 257–269. [Google Scholar] [CrossRef]
- Department of Public Works and Highways (DPWH) of JICA. Manual on flood control planning. Project for the Enhancement of Capabilities in Flood Control and Sabo Engineering of the DPWH. 2003, p. 123. Available online: https://www.jica.go.jp/project/philippines/0600933/04/pdf/Manual_on_FC_Planning.pdf (accessed on 27 March 2017).
- Nakagiri, T.; Kato, H.; Maruyama, S.; Hashimoto, S. Hydrogeochemical Assessment of the Contribution of Caldera Lake and Paddy Irrigation to River Water Stability. In Sustainable Water Management: New Perspectives, Design, and Practices; Nakagami, K., Kubota, J., Setiawan, B.I., Eds.; Springer: Singapore, 2016; pp. 81–95. [Google Scholar]
- Santos, M.S., Jr.; Rabanal, H.R. The Napindan hydraulic control structure and its effects on fish production on Laguna Lake Philippines. J. Aquacult. Trop. 1988, 3, 47–62. [Google Scholar]
- Barril, C.R.; Tumlos, E.T.; Moraga, W.C. Seasonal variations in water quality of Laguna de Bay, Philippines: Trends and implications. Philipp. Agric. Sci. 2001, 84, 19–25. [Google Scholar]
- Barril, C.R.; Tumlos, E.T. Water quality trends and trophic state assessment of Laguna de Bay, Philippines. Aquat. Ecosyst. Health Manag. 2002, 5, 115–126. [Google Scholar] [CrossRef]
- Varca, L.M. Pesticide residues in surface waters of Pagsanjan-Lumban catchment of Laguna de Bay, Philippines. Agric. Water Manag. 2012, 106, 35–41. [Google Scholar] [CrossRef]
- Manila, Luzon Climate Manila, Luzon Temperatures Manila, Luzon Weather Averages. Available online: http://www.manila.climatemps.com/ (accessed on 27 March 2017).
- Maruyama, S.; Tada, Y. Comparison of cavity ring-down spectroscopy with isotope ratio mass spectrometry for measurements of water isotopes. Geochem. J. 2014, 48, 105–109. [Google Scholar] [CrossRef]
- Maruyama, S.; Tanaka, Y.; Hirayama, S.; Kusakabe, M.; Zhang, J.; Nakano, T. High-precision measurements of water isotopes using laser absorption spectroscopy. Geochem. J. 2013, 47, 675–682. [Google Scholar] [CrossRef]
- Craig, H. Isotopic variations in meteoric waters. Science 1961, 133, 1702–1703. [Google Scholar] [CrossRef] [PubMed]
- Rozanski, K.; Araguás-Araguás, L.; Gonfiantini, R. Isotopic patterns in modern global precipitation. In Climate Change in Continental Isotopic Records; Swart, P.K., Lohmann, K.C., McKenzie, J., Savin, S., Eds.; Geophysical Monograph No. 78; American Geophysical Union: Washington, DC, USA, 1993; pp. 1–36. [Google Scholar]
- Salonga, N.D. Estimating the Isotopic Composition of Meteoric Water Index in Geothermal Fields in the Philippines. In Proceedings of the World Geothermal Congress 2015, Melbourne, Australia, 19–25 April 2015; p. 7. [Google Scholar]
- Dansgaard, W. Stable isotopes in precipitation. Tellus 1964, 16, 436–468. [Google Scholar] [CrossRef]
- IAEA Global Network for Isotopes in Precipitation (GNIP). Available online: https://nucleus.iaea.org/Pages/GNIPR.aspx (accessed on 27 March 2017).
- Gerardo-Abaya, J. Determination of recharge from stable isotope data to the hydrological systems in the southern Negros geothermal field and its environs, Philippines. In Proceedings of the World Geothermal Congress 2005, Antalya, Turkey, 24–29 April 2005; p. 8. [Google Scholar]
- Gat, J.R. The stable isotope composition of Dead Sea waters. Earth Planet. Sci. Lett. 1984, 71, 361–376. [Google Scholar] [CrossRef]
- Allison, G.B.; Brown, R.M.; Fritz, P. Estimation of the isotopic composition of lake evaporate. J. Hydrol. 1979, 42, 109–127. [Google Scholar] [CrossRef]
- Miyahara, S.; Hiroyuki, II; Dahlhaus, P. Proposal of measurement method for evaporation rate for surface water using oxygen isotope in dry area. J. Jpn. Soc. Civ. Eng. Ser. B1 2014, 70, I_1603–I_1608. (In Japanese) [Google Scholar]
- Cunanan, A.M.; Salvacion, J.W.L. Analysis of water temperature of Laguna Lake using EFDC model. Int. J. Sci. Technol. Res. 2014, 3, 68–76. [Google Scholar]
Figure 1.
River and lake water sampling points in Laguna Lake and the surrounding areas. The latitude and longitude of each sampling point are listed in Tables S2–S5. The red rectangle in the inset indicates the study area.
Figure 1.
River and lake water sampling points in Laguna Lake and the surrounding areas. The latitude and longitude of each sampling point are listed in Tables S2–S5. The red rectangle in the inset indicates the study area.

Figure 2.
Schematic diagrams showing (a) PMWL and d, and (b) dS-P values. As shown in (b), the size of the dPMWL value corresponds to the difference between the dsample and dS-P values (blue arrow).
Figure 2.
Schematic diagrams showing (a) PMWL and d, and (b) dS-P values. As shown in (b), the size of the dPMWL value corresponds to the difference between the dsample and dS-P values (blue arrow).
Figure 3.
Water isotopic ratios of groundwaters and surface waters obtained in March and May 2011. The solid red line is the PMWL defined by Salonga [21]. The errors (1σmean) are similar to or smaller than the symbols. The orange dotted line represents the trend in the deviation of the water isotopic ratios of the river waters from the PMWL.

Figure 4.
Water isotopic ratios of surface waters sampled in August 2011. The errors (1σmean) are similar to or smaller than the symbols. The solid red line is the PMWL defined by Salonga [21]. The blue line represents the water isotopic ratios of the samples from the LLDA lake water monitoring sites. The orange dotted lines represent the trend of the deviation from the PMWL implied by the data of the river waters for the dry season (Figure 3).
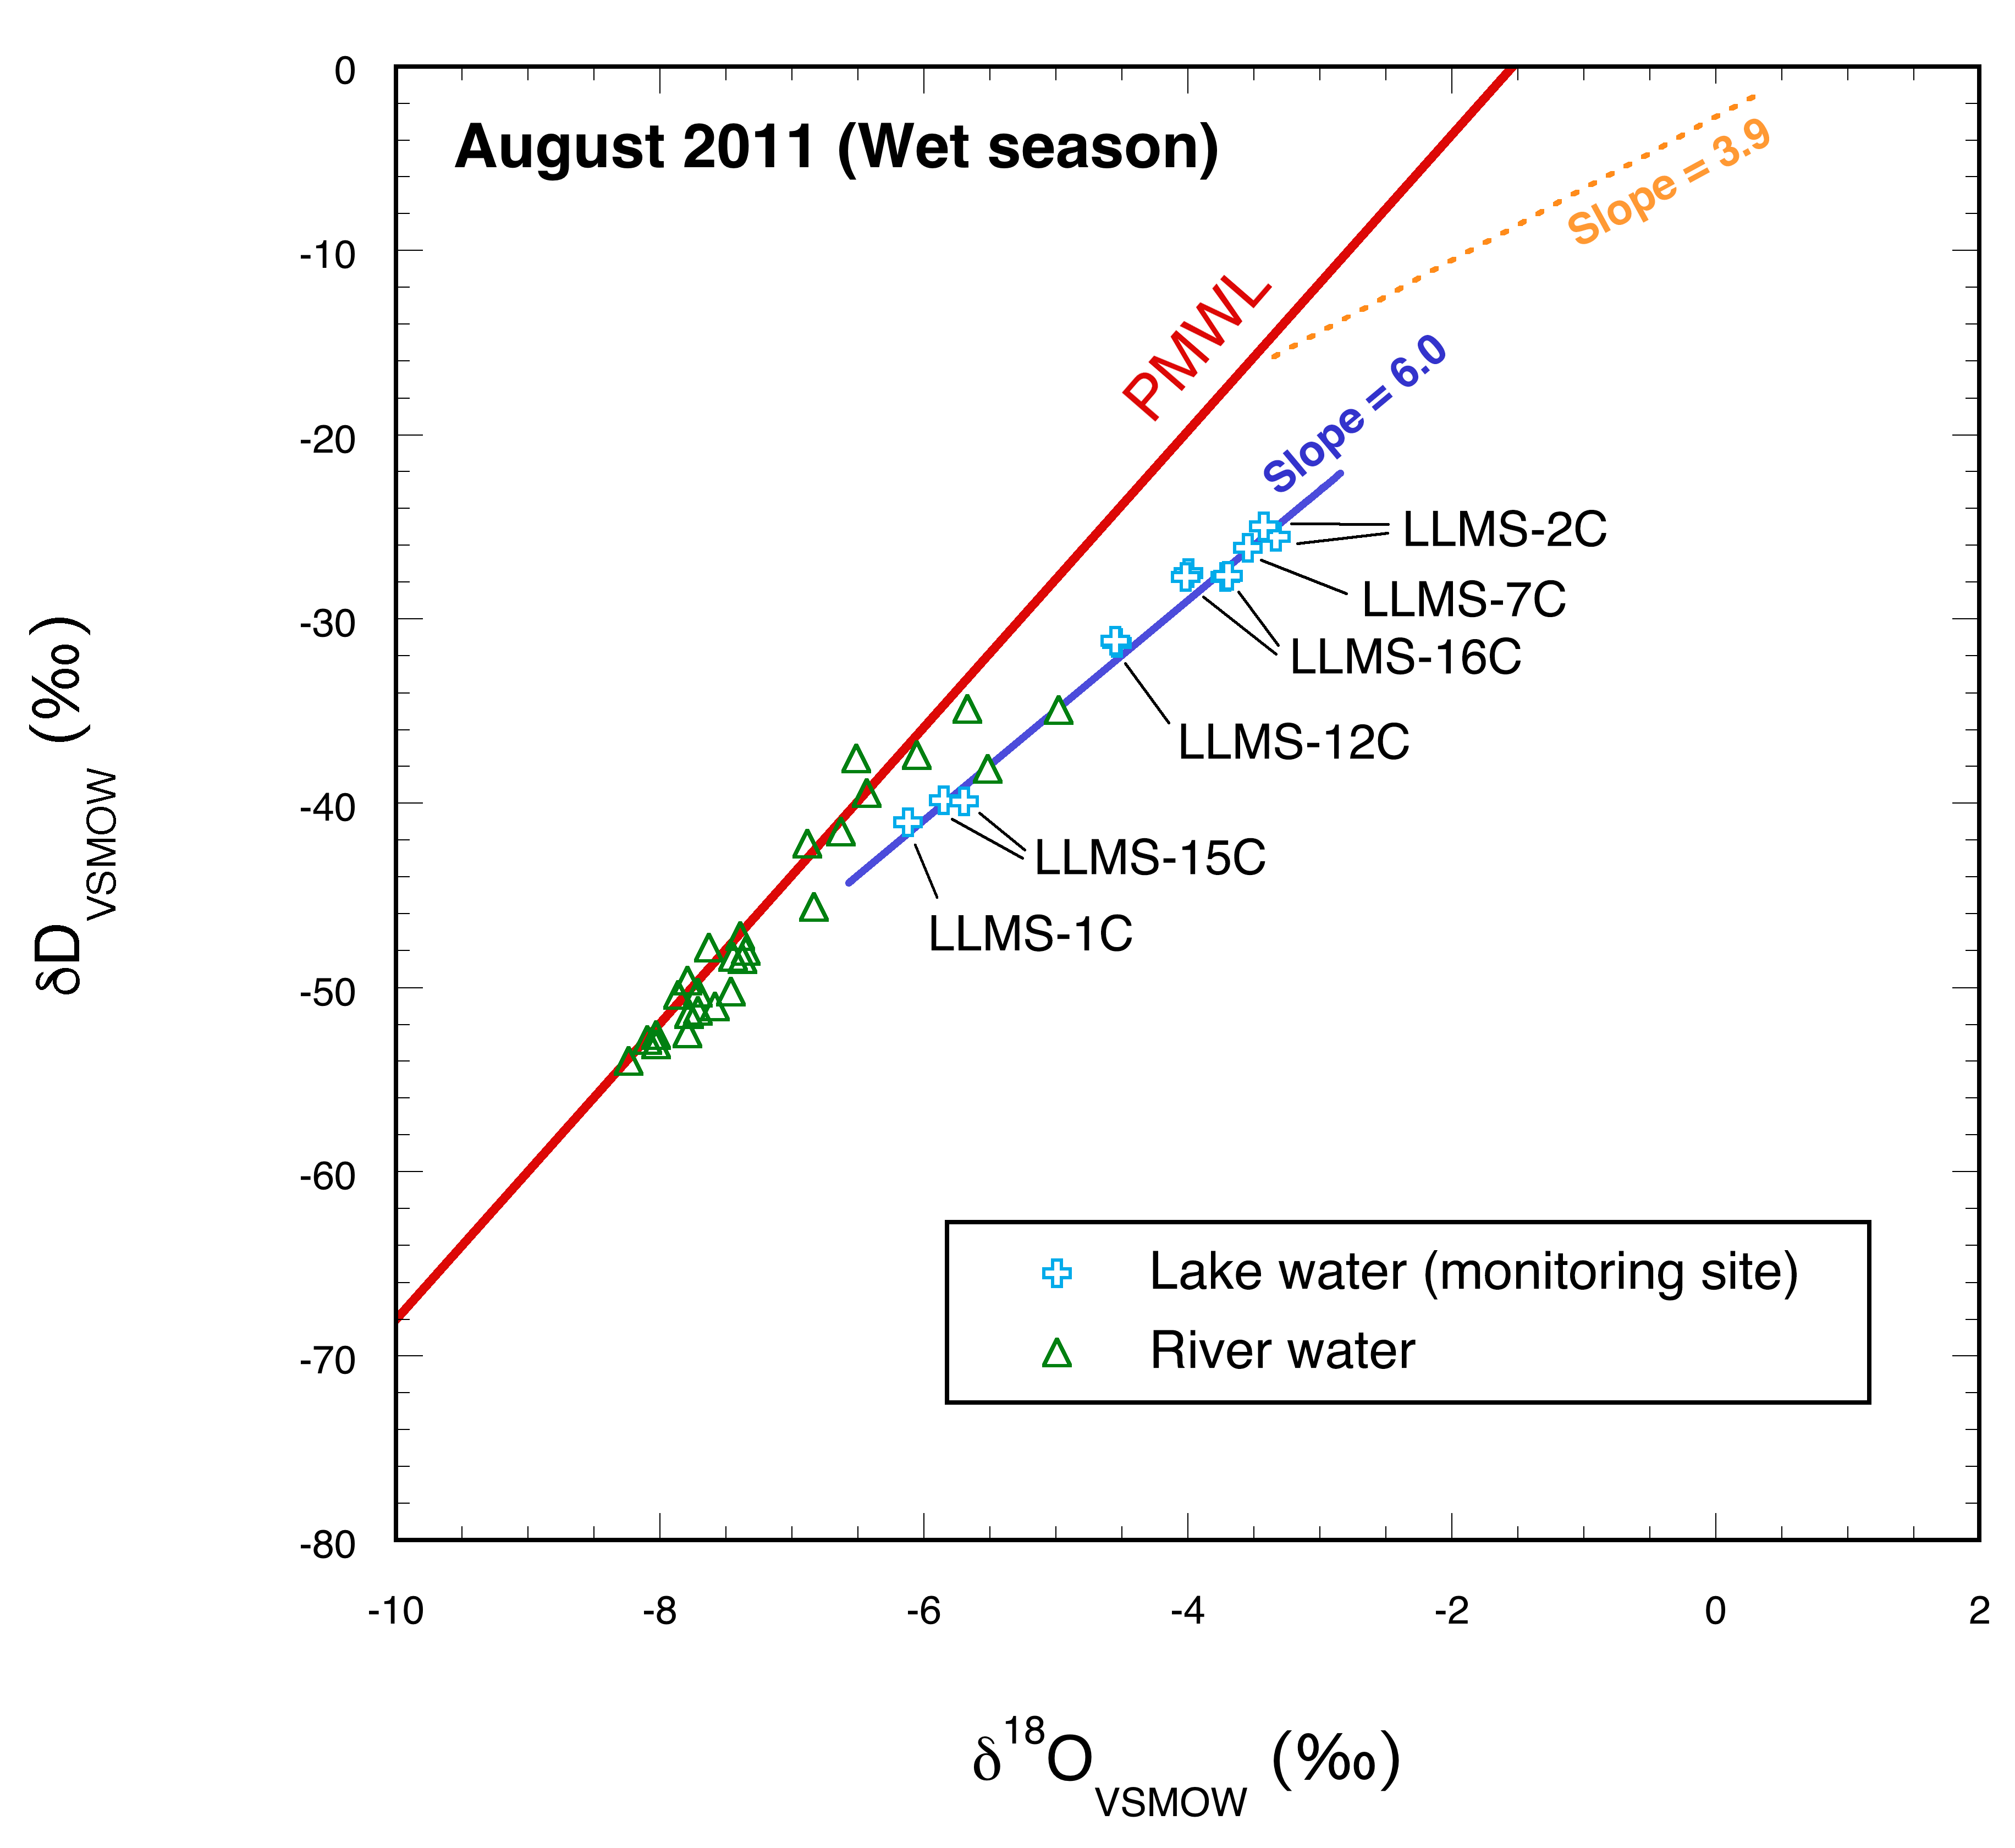
Figure 5.
Isotopic ratios of groundwaters and surface waters collected in October and November 2011. The sizes of the errors (1σmean) are similar to or smaller than the symbols. The water isotopic ratios of all the water samples are shown in (a). The solid red line is the PMWL defined by Salonga [21], and the orange dotted lines represent the trend of the deviation from the PMWL assumed from the river waters in the dry season (Figure 3). The water isotopic ratios of the lake water samples from the LLDA monitoring sites in October and November 2011 are shown in (b). All errors are 1σmean. With the exception of a sample from a depth of 2 m at site 6, the samples from various depths at the individual monitoring sites in October 2011 have similar water isotopic ratios. The blue and red lines are the regression lines for the data of October and November 2011, respectively.

Figure 6.
Distributions of dS-P values of water samples for (a) the dry season and (b) the wet season. The vertical red lines represent the position of the PMWL line (i.e., dS-P = 0).
Figure 6.
Distributions of dS-P values of water samples for (a) the dry season and (b) the wet season. The vertical red lines represent the position of the PMWL line (i.e., dS-P = 0).


Table 1.
Number of water samples collected during the R-06 project in 2011.
| Season/Month | Groundwater | River Water | Irrigation Canal Water | Lake Water (Monitoring Site) | Lake Water (Lakeshore) | Lake Water (Caliraya Lake) | Reservoir (La Mesa Dam) |
|---|---|---|---|---|---|---|---|
| Dry season | |||||||
| March | 7 | 20 | 4 | 0 | 3 | 0 | 0 |
| May | 21 | 69 | 11 | 54 | 7 | 1 | 1 |
| Wet season | |||||||
| August | 0 | 26 | 0 | 12 | 0 | 0 | 0 |
| October | 18 | 87 | 4 | 54 | 12 | 1 | 0 |
| November | 7 | 77 | 4 | 9 | 1 | 0 | 0 |
| Total (Dry) | 28 | 89 | 15 | 54 | 10 | 1 | 1 |
| Total (Wet) | 25 | 190 | 8 | 75 | 13 | 1 | 0 |
| Total | 53 | 279 | 23 | 129 | 23 | 2 | 1 |
© 2017 by the authors. Licensee MDPI, Basel, Switzerland. This article is an open access article distributed under the terms and conditions of the Creative Commons Attribution (CC BY) license (http://creativecommons.org/licenses/by/4.0/).
Share and Cite
MDPI and ACS Style
Maruyama, S.; Kato, H. Identification of Waters Incorporated in Laguna Lake, Republic of the Philippines, Based on Oxygen and Hydrogen Isotopic Ratios. Water 2017, 9, 328. https://doi.org/10.3390/w9050328
AMA Style
Maruyama S, Kato H. Identification of Waters Incorporated in Laguna Lake, Republic of the Philippines, Based on Oxygen and Hydrogen Isotopic Ratios. Water. 2017; 9(5):328. https://doi.org/10.3390/w9050328
Chicago/Turabian StyleMaruyama, Seiji, and Hisaaki Kato. 2017. "Identification of Waters Incorporated in Laguna Lake, Republic of the Philippines, Based on Oxygen and Hydrogen Isotopic Ratios" Water 9, no. 5: 328. https://doi.org/10.3390/w9050328
Note that from the first issue of 2016, this journal uses article numbers instead of page numbers. See further details here.