Article

A Thermodynamical Approach for Evaluating Energy Consumption of the Forward Osmosis Process Using Various Draw Solutes

Beijing Key Laboratory of Membrane Materials and Engineering, Department of Chemical Engineering, Tsinghua University, Beijing 100084, China
*
Author to whom correspondence should be addressed.
Water 2017, 9(3), 189; https://doi.org/10.3390/w9030189
Submission received: 26 December 2016 / Accepted: 2 March 2017 / Published: 6 March 2017
(This article belongs to the Special Issue Advanced Membranes for Water Treatment)

Abstract

:
The forward-osmosis (FO) processes have received much attention in past years as an energy saving desalination process. A typical FO process should inclu de a draw solute recovery step which contributes to the main operation costs of the process. Therefore, investigating the energy consumption is very important for the development and employment of the forward osmosis process. In this work, NH3-CO2, Na2SO4, propylene glycol mono-butyl ether, and dipropylamine were selected as draw solutes. The FO processes of different draw solute recovery approaches were simulated by Aspen PlusTM with a customized FO unit model. The electrolyte Non-Random Two-Liquid (Electrolyte-NRTL) and Universal Quasi Chemical (UNIQUAC) models were employed to calculate the thermodynamic properties of the feed and draw solutions. The simulation results indicated that the FO performance decreased under high feed concentration, while the energy consumption was improved at high draw solution concentration. The FO process using Na2SO4 showed the lowest energy consumption, followed by NH3-CO2, and dipropylamine. The propylene glycol mono-butyl ether process exhibited the highest energy consumption due to its low solubility in water. Finally, in order to compare the equivalent work of the FO processes, the thermal energy requirements were converted to electrical work.

1. Introduction

The shortage of freshwater has become a main challenge in the 21st century as a consequence of world population growth, increasing industrial consumption and pollution, development of agriculture, climate change, etc. [1,2]. The commercialized desalination technologies such as reverse osmosis (RO), multi-effect distillation (MED), and multi-stage flash (MSF) have been widely used, which still have the common problem of high energy consumption [3,4,5]. In recent years, Forward Osmosis (FO) has received much attention as a low energy cost desalination technology when compared with the above traditional processes [6,7,8]. In FO, the water molecules from the feed solution move to the draw side through a semipermeable membrane as a result of an osmotic pressure difference across the membrane. As the osmotic pressure of the draw solution drops due to the dilution, the draw solute recovery step is often necessary to regain the osmotic pressure after the FO operation [9].
The recovery of draw solutes in an FO process contributes to the major the energy consumption of the FO process. The selection of draw solutes significantly affects the performance of an FO process. Over the past decades, various draw solutes have been proposed [10]. One of the most commonly used draw solute is ammonia–carbon dioxide (NH3-CO2), which was first commercialized by HTI Inc., Powell, OH, USA [11,12,13]. In the NH3-CO2 FO process, ammonium salts such as ammonium bicarbonate, ammonium carbonate, and ammonium carbamate are used as draw solutes. After FO, the ammonium salts in the diluted draw solution can be thermo-decomposed into NH3 and CO2 gases at elevated temperature, and then the concentrated ammonium salt solution is regenerated from the mixture of NH3 and CO2 gases. Switchable polarity solvent (SPS), which is capable of changing its solubility in water by the addition and removal of CO2, was proposed as a new FO draw solute [14,15,16]. By heating up the SPS solution, CO2 is driven off and the hydrophobic form of SPS is separated from the diluted draw solution. Other examples of utilizing low-grade heat in draw solute recovery are the solutes with a lower critical solution temperature (LCST) point that exhibit liquid-liquid phase separation with water at high temperature. For example, Nakayama et al. demonstrated that some types of glycol ethers including di(ethylene glycol) n-hexyl ether (DEH), propylene glycol n-butyl ether (PB) and di(propylene glycol) n-propyl ether (DPP) can be used as draw solutes [17]. LCST ionic liquids as draw solutes were reported to be able to treat feed solutions with NaCl concentrations of up to 1.6 mol·L−1 by Cai et al. [18]. Besides using heat sources, the recovery of draw solutes can also be achieved by cooling. Zhong et al. employed ionic liquid with an upper critical solution temperature as the draw solute [19]. In the proposed process by Zhong et al., the FO process is operated at 60 °C while the draw solute recovery is carried out via cooling to room temperature. From the above discussions, it can be seen that many types of draw solutes with different recovery schemes are available for the FO process. So, it is important to evaluate the performance of the FO process for the selection of draw solutes.
For the FO process with NH3-CO2 draw solute, the modeling results from McGinnis et al. by chemical modeling software HYSYS showed that the FO process had the lowest equivalent work requirement among MSF, MED, and RO desalination when a low-grade heat was available [20]. Mazlan et al. compared the energy consumption of FO with nanofiltration (NF) or ultrafiltration (UF) draw solute recovery and reverse osmosis (RO) [21]. The results suggest that there is practically no difference in the specific energy consumption of FO-NF (or FO-UF) and RO even if the membrane is theoretically perfect. The switchable polarity solvent forward osmosis process modelled by Wendt et al. was found to be a competitive desalination technology that could be applied to a feed solution with NaCl concentrations of up to 4.0 molal [14]. Park et al. integrated the FO process with the gas turbine cycle so the recovery step could utilize the waste heat from the turbine to improve the energy efficiency of the integrated process [22]. According to their simulation results, the FO-gas turbine system has an advantage on gain output ratio (GOR) and water production capacity compared with the MSF-gas turbine system. Although there are some existing works on modeling the FO process, a comprehensive platform is still lacking for the evaluation of the FO performance using different draw solutes. A directly comparison of the performance of various draw solutes has not been investigated comprehensively, but this comparison important in the future development of draw solutes.
In the presented work, thermodynamic simulation based on Aspen Plus software was adopted to model the FO process. Several draw solutes including NH3-CO2, sodium sulfate (Na2SO4), and organic solutes with LCST points were selected. For each draw solute, different recovery methods were designed with respect to their properties. For example, the distillation column was used for the recovery of NH3-CO2 draw solute. The simulations were carried out at different feed and draw solution concentrations to study the influence of concentrations on the energy consumption of the FO process using specific draw solutes. The energy consumptions as well as the equivalent works were calculated to give a basic comparisons among those draw solutes.

2. Materials and Methods

2.1. FO Unit Operation Model

This study was mainly focused on evaluating the energy consumption of the FO process using certain draw solutes under ideal conditions. Therefore, this work did not involve the analysis of membrane permeability for reducing the complexity of the simulation. The membrane was assumed to be theoretically perfect and completely rejecting the solutes, so internal concentration polarization and the back-leak of draw solutes were not considered. The following equation was applied to estimate the theoretical minimum energy consumption for an FO process:
π d r a w = π f e e d + π min
where π d r a w represents the osmotic pressure of the draw solution side, π f e e d is the osmotic pressure of feed side. π min is the minimum osmotic pressure difference above which noticeable flow rate could be observed. The term π min ensures the osmotic pressure of the draw solution side is always larger than the feed side.
The mathematical model for the customized FO unit operation was built with the Fortran programming interface of the Aspen Plus software. The concentrations of inlet streams in the customized FO model which are the initial concentrations of the feed and draw solutions, were given by the simulation flowsheet. The concentrations of outlet streams are manipulated by changing the amount of water migrated from the feed to the draw side, until osmotic equilibrium is reached. The osmotic pressure was calculated by the activity of water which will be discussed in the next Section 2.2. Taking the thermodynamic restriction and draw solution recovery into consideration, the simulation approach with this customized FO unit model can achieve rigorous evaluation of the energy consumption of the FO process with different draw solutes.
For a better understanding on the influence of draw solutes on the FO performance, the term “RWATER” was used, as shown below:
RWATER = moles of water transferred moles of water in draw solution
Considering an FO process with draw solution recovery, energy must be used to change the state of the diluted draw solution, i.e., thermal energy is required for heating up the diluted NH3-CO2 solution for thermal decomposition. In this process, not only does the transferred water result in energy consumption, so too does the water in the draw solution. If the FO process is operated at steady-state, the amount of transferred water would be equal to the quantity of produced water. So RWATER can be used to evaluate the energy efficiency of the FO process. Higher RWATER values means more energy is used for desalination rather than being wasted on draw solution.

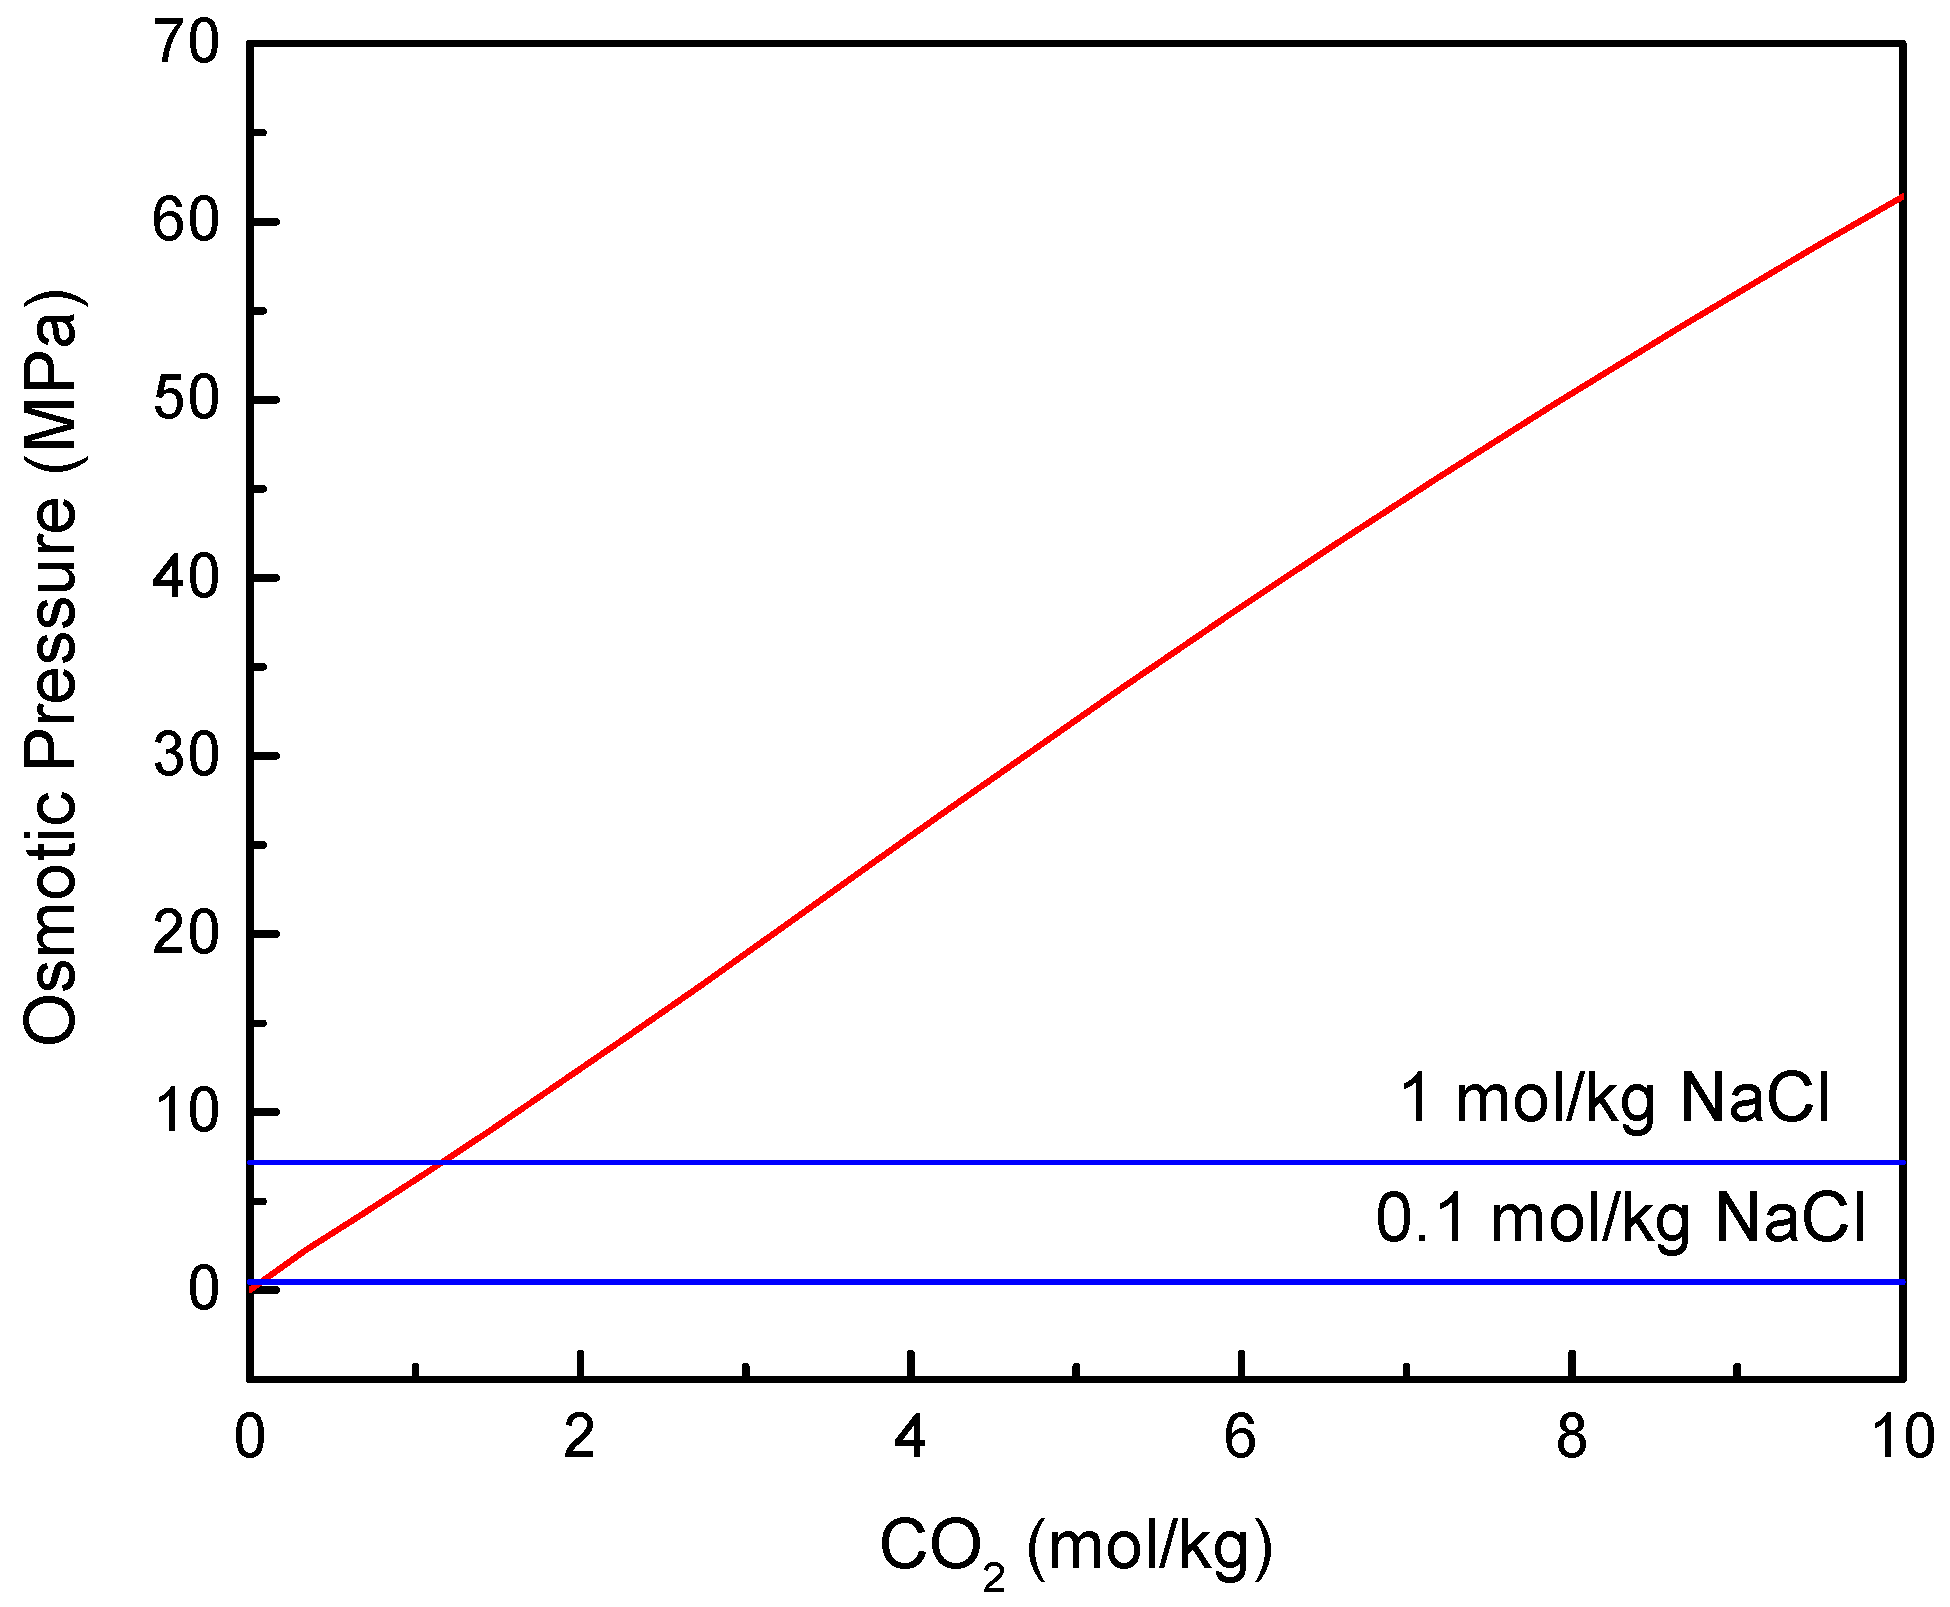
2.2. Osmotic Pressure

The prediction of osmotic pressure is vital for modeling the FO process. The most commonly used method in the previous studies is based on the van’t Hoff theory, which the osmotic pressure is calculated by the following equation:
π = n C R T
where n is the van’t Hoff factor representing the number of moles of a solute dissociated in the solution (for example, n = 2 for NaCl and n = 3 for MgCl2). C is the molar concentration (mol·L−1) of the solution. R is the gas constant which is equivalent to 8.314 J·mol−1·K−1 and T is the absolute temperature (in Kelvin). However, the van’t Hoff equation is only suitable for dilute solutions. When dealing with concentrated solutions or solutions with multi components, noticeable deviations may be encountered if the van’t Hoff equation is employed to calculate the osmotic pressure. Besides the van’t Hoff equation, the osmotic pressure is defined as a function of the activity of water in thermodynamics:
π = ( R T / V w ¯ ) ln a w
where V w ¯ is the partial molar volume of water and a w represents the activity of water. This thermodynamic approach allows the determination of osmotic pressure in concentrated electrolyte solution and even the solution with multiple solvents.
The activity of water is calculated by thermodynamic models. The Electrolyte-NRTL [23] (eNRTL) model was employed for electrolyte systems, while the UNIQUAC [24] model was used for systems containing organic solvents. The eNRTL model, developed by Chen and his coworkers, has been successfully applied to many electrolyte systems. Detailed description of the eNRTL model can be found elsewhere [25,26], so only a brief introduction is presented in this paper. The excess Gibbs free energy in the eNRTL model is expressed as a sum of three terms:
G NRTL * e x R T = G PDH * e x R T + G Born * e x R T + G lc * e x R T
where the notation “*” indicates that the excess Gibbs free energy is the unsymmetrical. The subscripted PDH, Born, and lc represent Pitzer-Debye-Huckel, Born, and local composition contributions, respectively.
There are three types of binary parameters in the eNRTL model: molecule-molecule, molecule-electrolyte, and electrolyte-electrolyte binary parameters. Here, an “electrolyte” does not mean the salt dissolved into the solution, but an ion pair composed of a cation and an anion. For an electrolyte system, the binary parameters are expressed as a and τ . Normally, the symmetric nonrandom factor parameter a is ranges from 0.1 to 0.5, and often is set to 0.2 for molecule-electrolyte interaction. While the unsymmetrical binary interaction energy parameter τ is dependent on temperature:
τ = C + D T + E [ T 0 T T + ln ( T T 0 ) ]
The reference temperature T 0 is 273.15 K. C , D , and E are adjustable parameters. Thus, for modeling a draw solution containing electrolytes, the adjustable parameters C , D , and E for each type of binary interaction energy parameters τ (molecule-molecule, molecule-electrolyte, and electrolyte-electrolyte) would need to be regressed with respect to experimental thermodynamic data.
Although eNRTL can also be used to calculate the thermodynamic properties of organic solution, we found that the UNIQUAC model based on group contribution theory was more convenient and provided better results for calculating the osmotic pressure of water in organic solutions. Besides, the UNIQUAC model enables us to do a rough estimation of the model parameters from the structure of organic solvents when there are no experimental data available to do regression. So the UNIQUAC model was employed for the aqueous propylene glycol mono-butyl ether and dipropylamine solutions.
In the UNIQUAC model, the excess Gibbs free energy is calculated as a sum of a combinatorial and a residual term:
G UNIQUAC e x R T = G combinatorial e x R T + G residual e x R T
And the combinatorial term is expressed as:
G combinatorial e x R T = ( i n i ) [ i x i ln ϕ i x i + Z 2 i q i x i ln θ i ϕ i ]
The residual term is expressed as:
G residual e x R T = ( i n i ) [ i q i x i ln ( j θ j τ i j ) ]
where:
θ i = q i x i j q j x j
ϕ i = r i x i j r j x j
τ i j = exp ( a i j + b i j / T + c i j ln T + d i j T + e i j / T 2 )
q i and r i are the surface area and volume size parameters, which are related to the structure of the molecule. The coordination number Z is set to 10. a i j , b i j , c i j , d i j , and e i j are the unsymmetrical binary adjustable interaction parameters between species i and j.
With suitable model parameters, the activity of water and the osmotic pressure of a certain draw solution can be calculated. Because the molality concentration (moles per weight of solvent) is more convenient in thermodynamic calculation, the concentration of feed and draw solutions are expressed in molality rather than molarity (moles per volume of solution) in the following section.

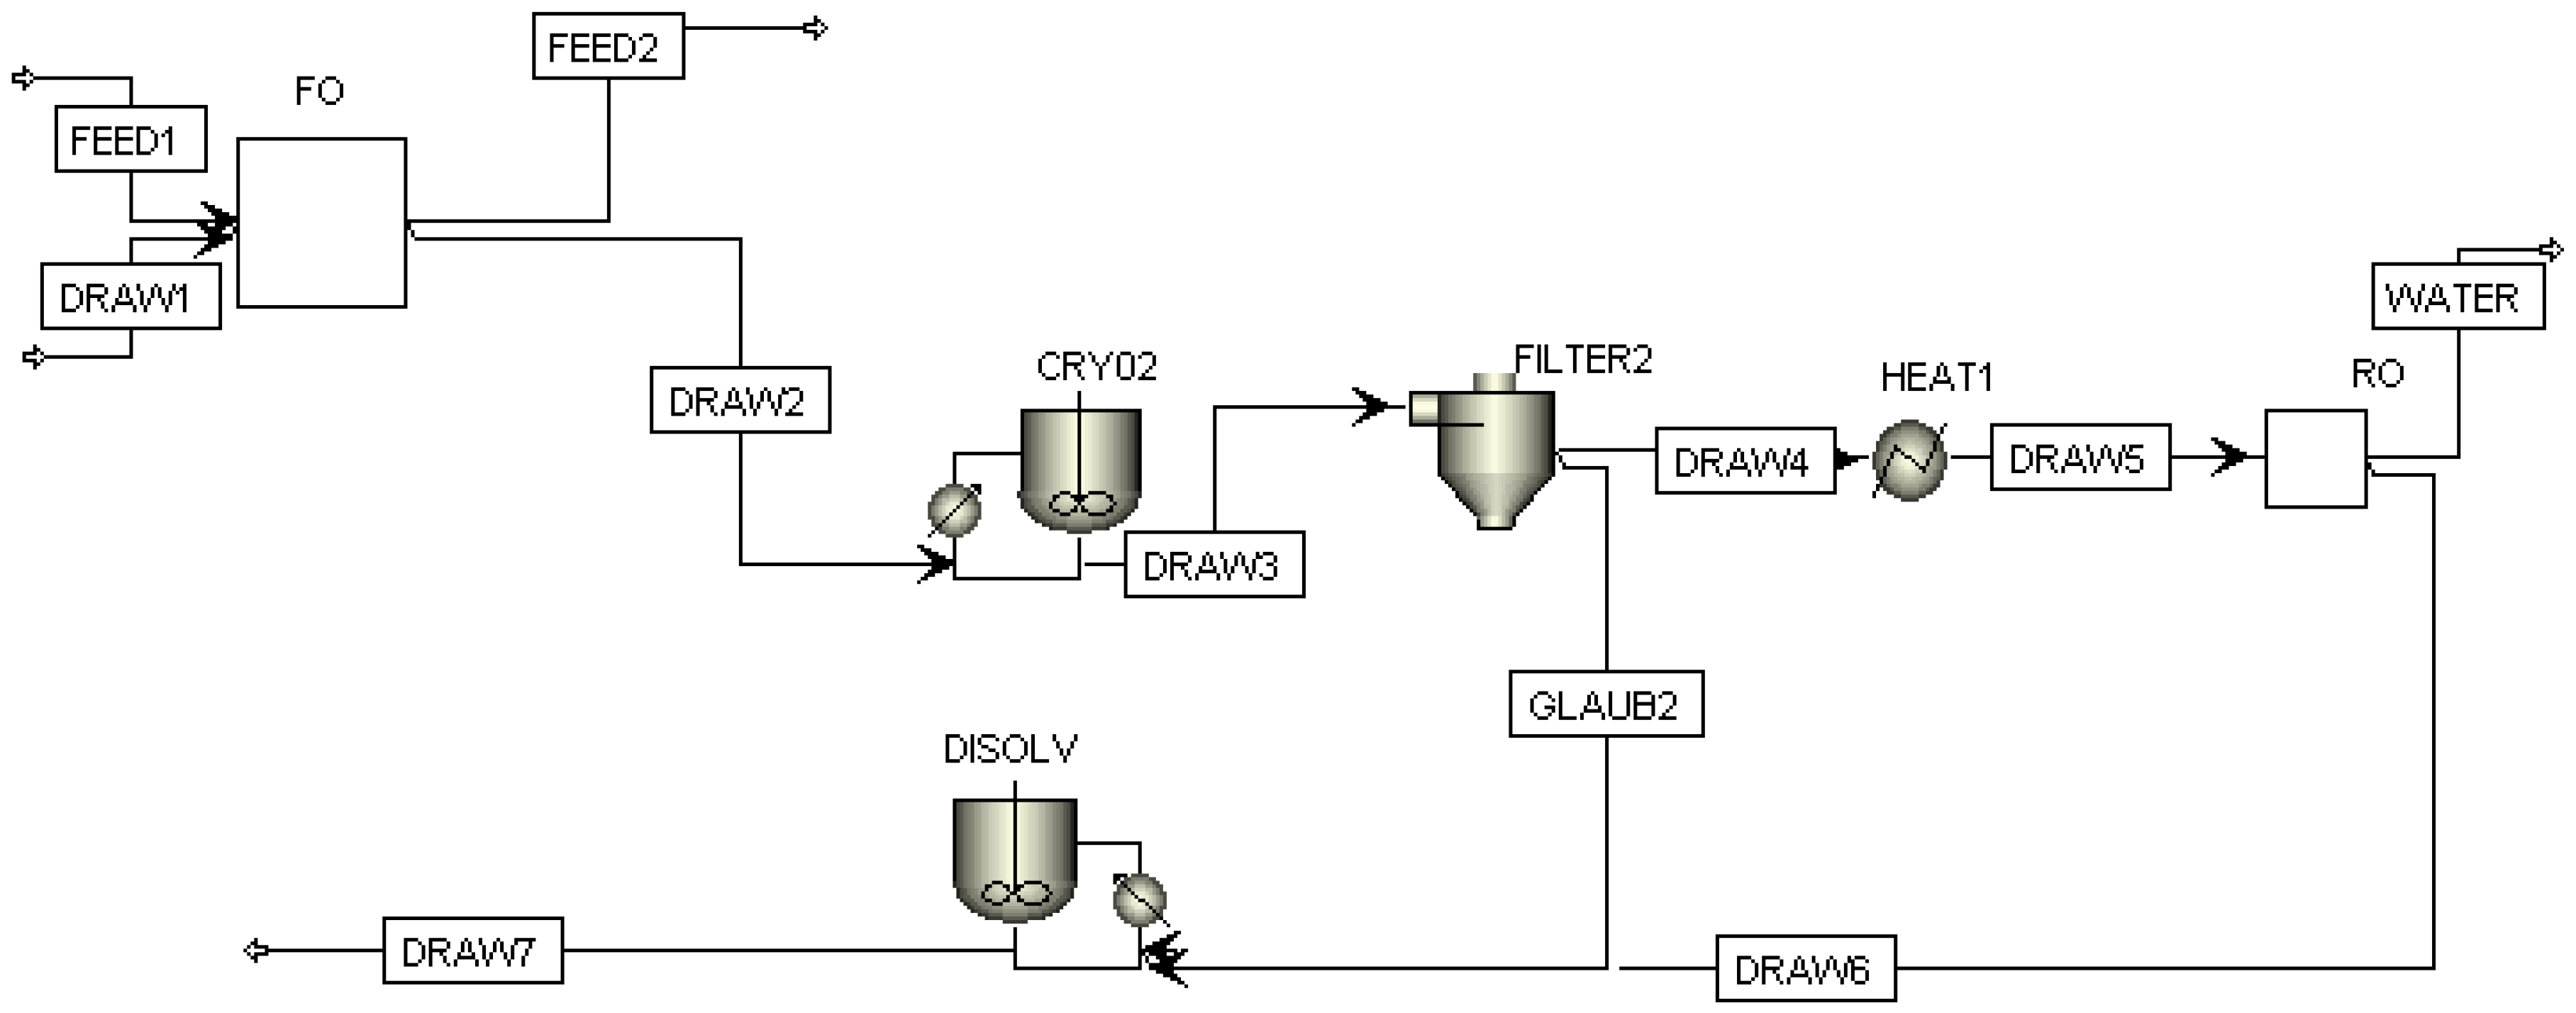
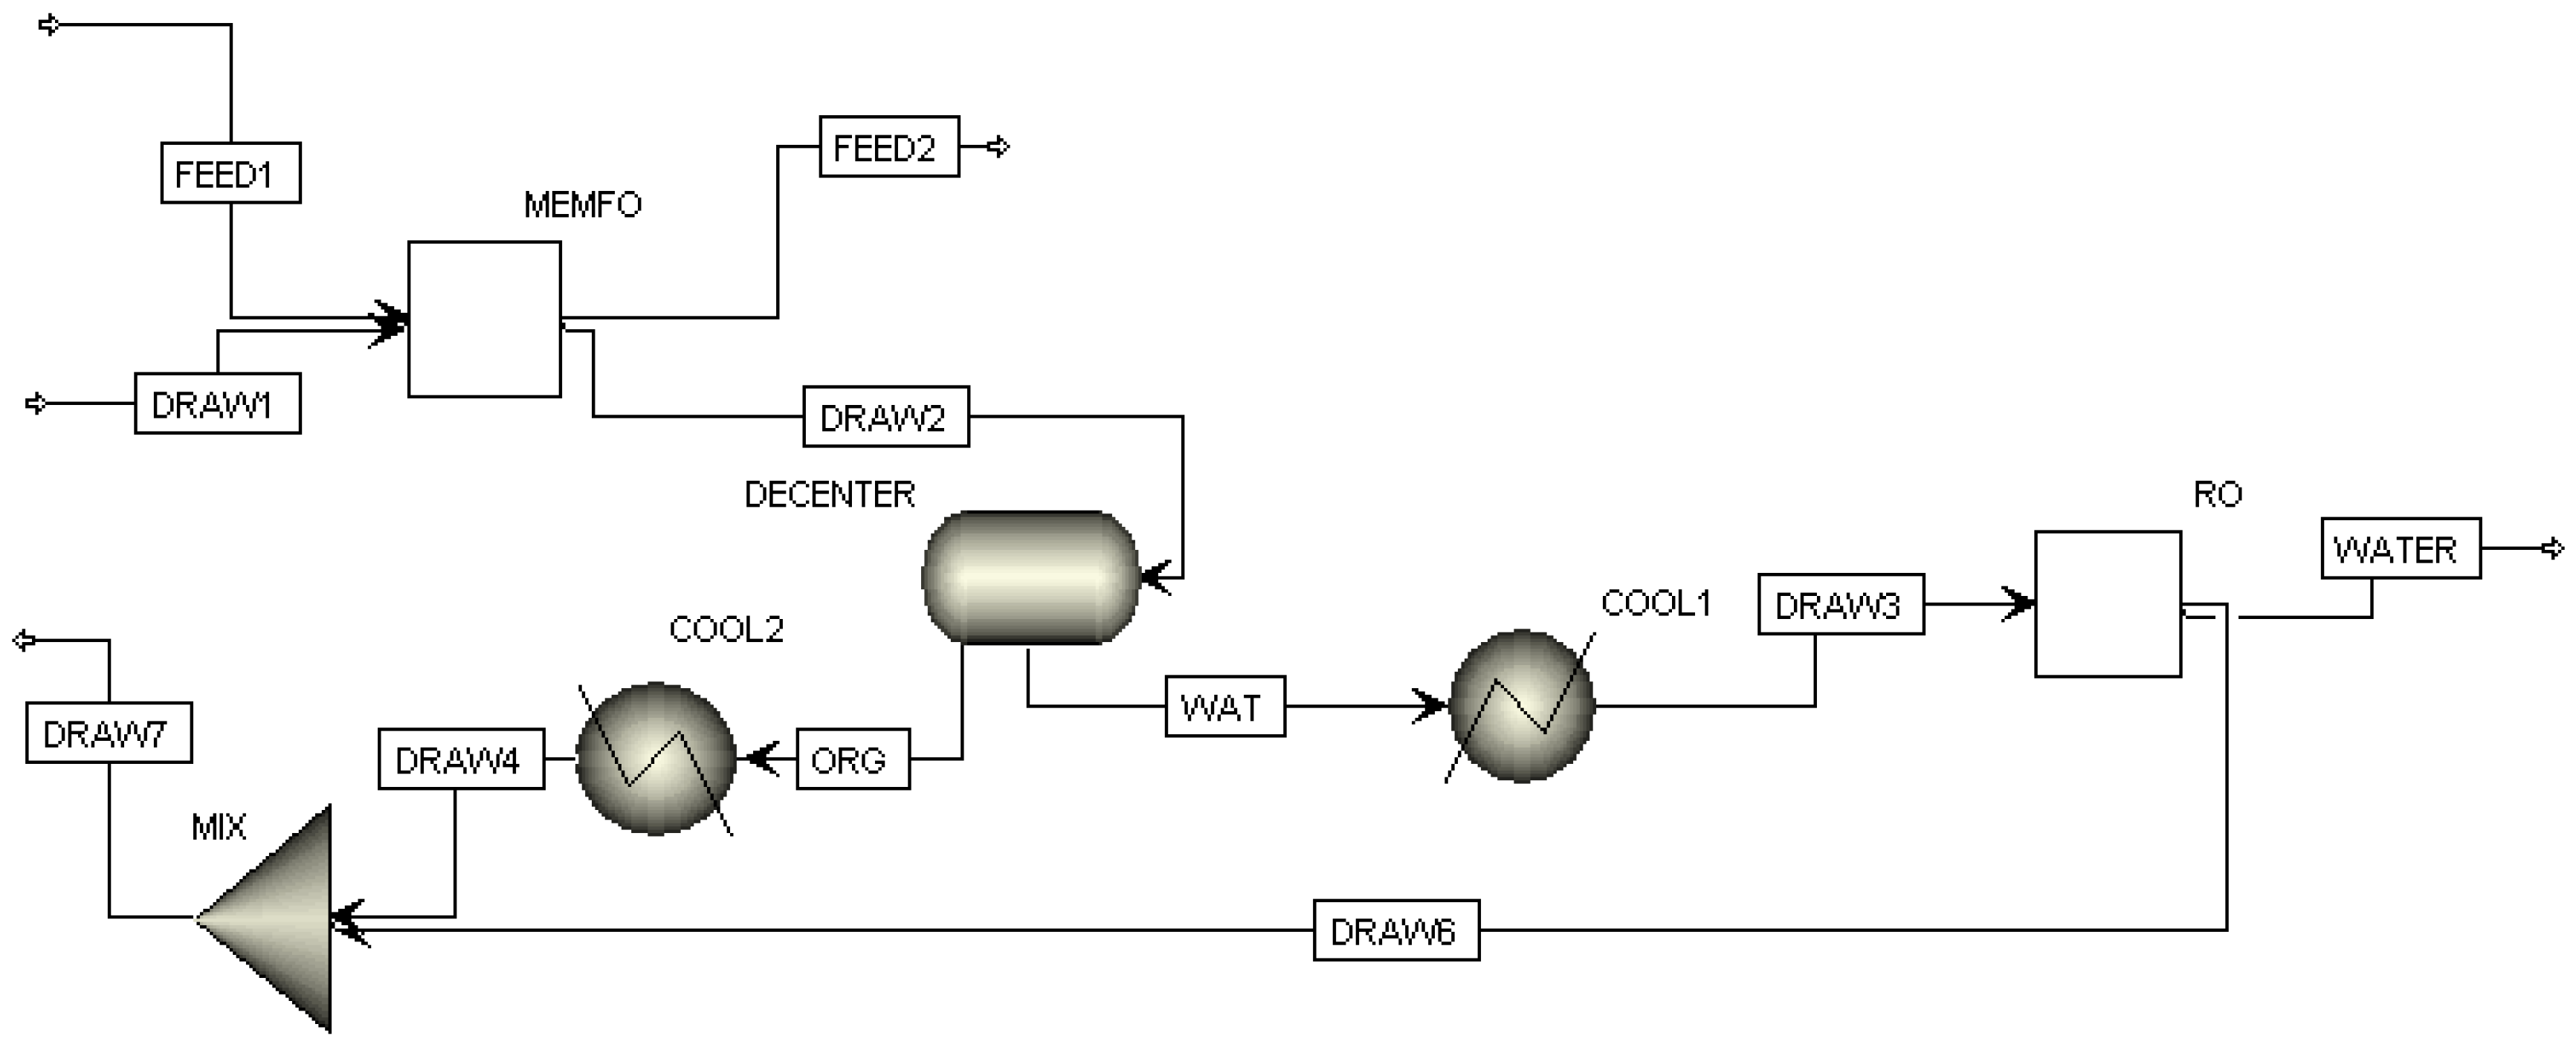
2.3. FO Process Design

NH3-CO2, Na2SO4, and organic solutes were used in this study and different draw solute recovery schemes were required with respect to their properties. The FO process diagram using NH3-CO2 as the draw solute is shown by Figure 1. The original feed and draw solutions were input parameters for the customized FO unit operation model, where the water in the feed side was transferred into the draw side according to osmotic pressure equilibrium. Multistage distillation columns decomposed NH3-CO2 more completely and maximized the water production, but required a heat source of higher temperature [20]. Assuming an available heat source with the temperature of more than 110 °C, a multistage distillation column was used for the decomposition of the diluted NH3-CO2 draw solution. The distillation column with 15 stages was modelled by the RadFrac unit operation model in the Aspen Plus. From the bottom of the distillation column, water with a low amount of ammonia and carbonate was produced. The NH3 and CO2 gases from the top of the distillation column were cooled down and then mixed with water to regenerate the draw solution. The eNRTL model was selected for the calculation of thermodynamic properties, and the model parameters were retrieved from the Aspen default databank.
The outline of the FO process using Na2SO4 as the draw solute is displayed in Figure 2. The Na2SO4 was precipitated out from the diluted draw solution, in the form of glauber salt, via cooling down to 0 °C. The crystallization of the Na2SO4 was simulated by the Crystallizer model in Aspen Plus. After crystallization, the solids were separated from the solution via filtration for draw solution recovery. The clear solution was sent to reverse osmosis (RO) for the production of water. For the calculation of thermodynamic properties, the eNRTL model parameters in the default databank were used.
Figure 3 demonstrates the Aspen Plus flowsheet of the FO process using organic solutes with an LCST point as the draw solutes. The Decenter model in Aspen Plus was employed for the simulation of a liquid-liquid separator, which enables rigorous calculation of liquid-liquid phase separation by thermodynamic modelling. After liquid-liquid separation, the water phase was sent into the RO model for the production of water. The organic phase was recycled as a new draw solution. The UNIQUAC model parameters for PB were regressed with respect to experimental liquid-liquid equilibrium data, as the Aspen databank (Aspen Plus, v7.6, Aspen Technology, Inc., Bedford, MA, USA) does not have such parameters. Unfortunately, we cannot find enough data to obtain the vapor-liquid parameters for the estimation of osmotic pressure; so previous regressed liquid-liquid parameters were used which may cause some uncertainty in the simulation. The liquid-liquid parameters in the default databank for dipropylamine (DP) were employed to calculate its liquid-liquid equilibrium properties. In addition, the osmotic pressure of DP was calculated by the vapor-liquid parameters for a better result.

3. Results

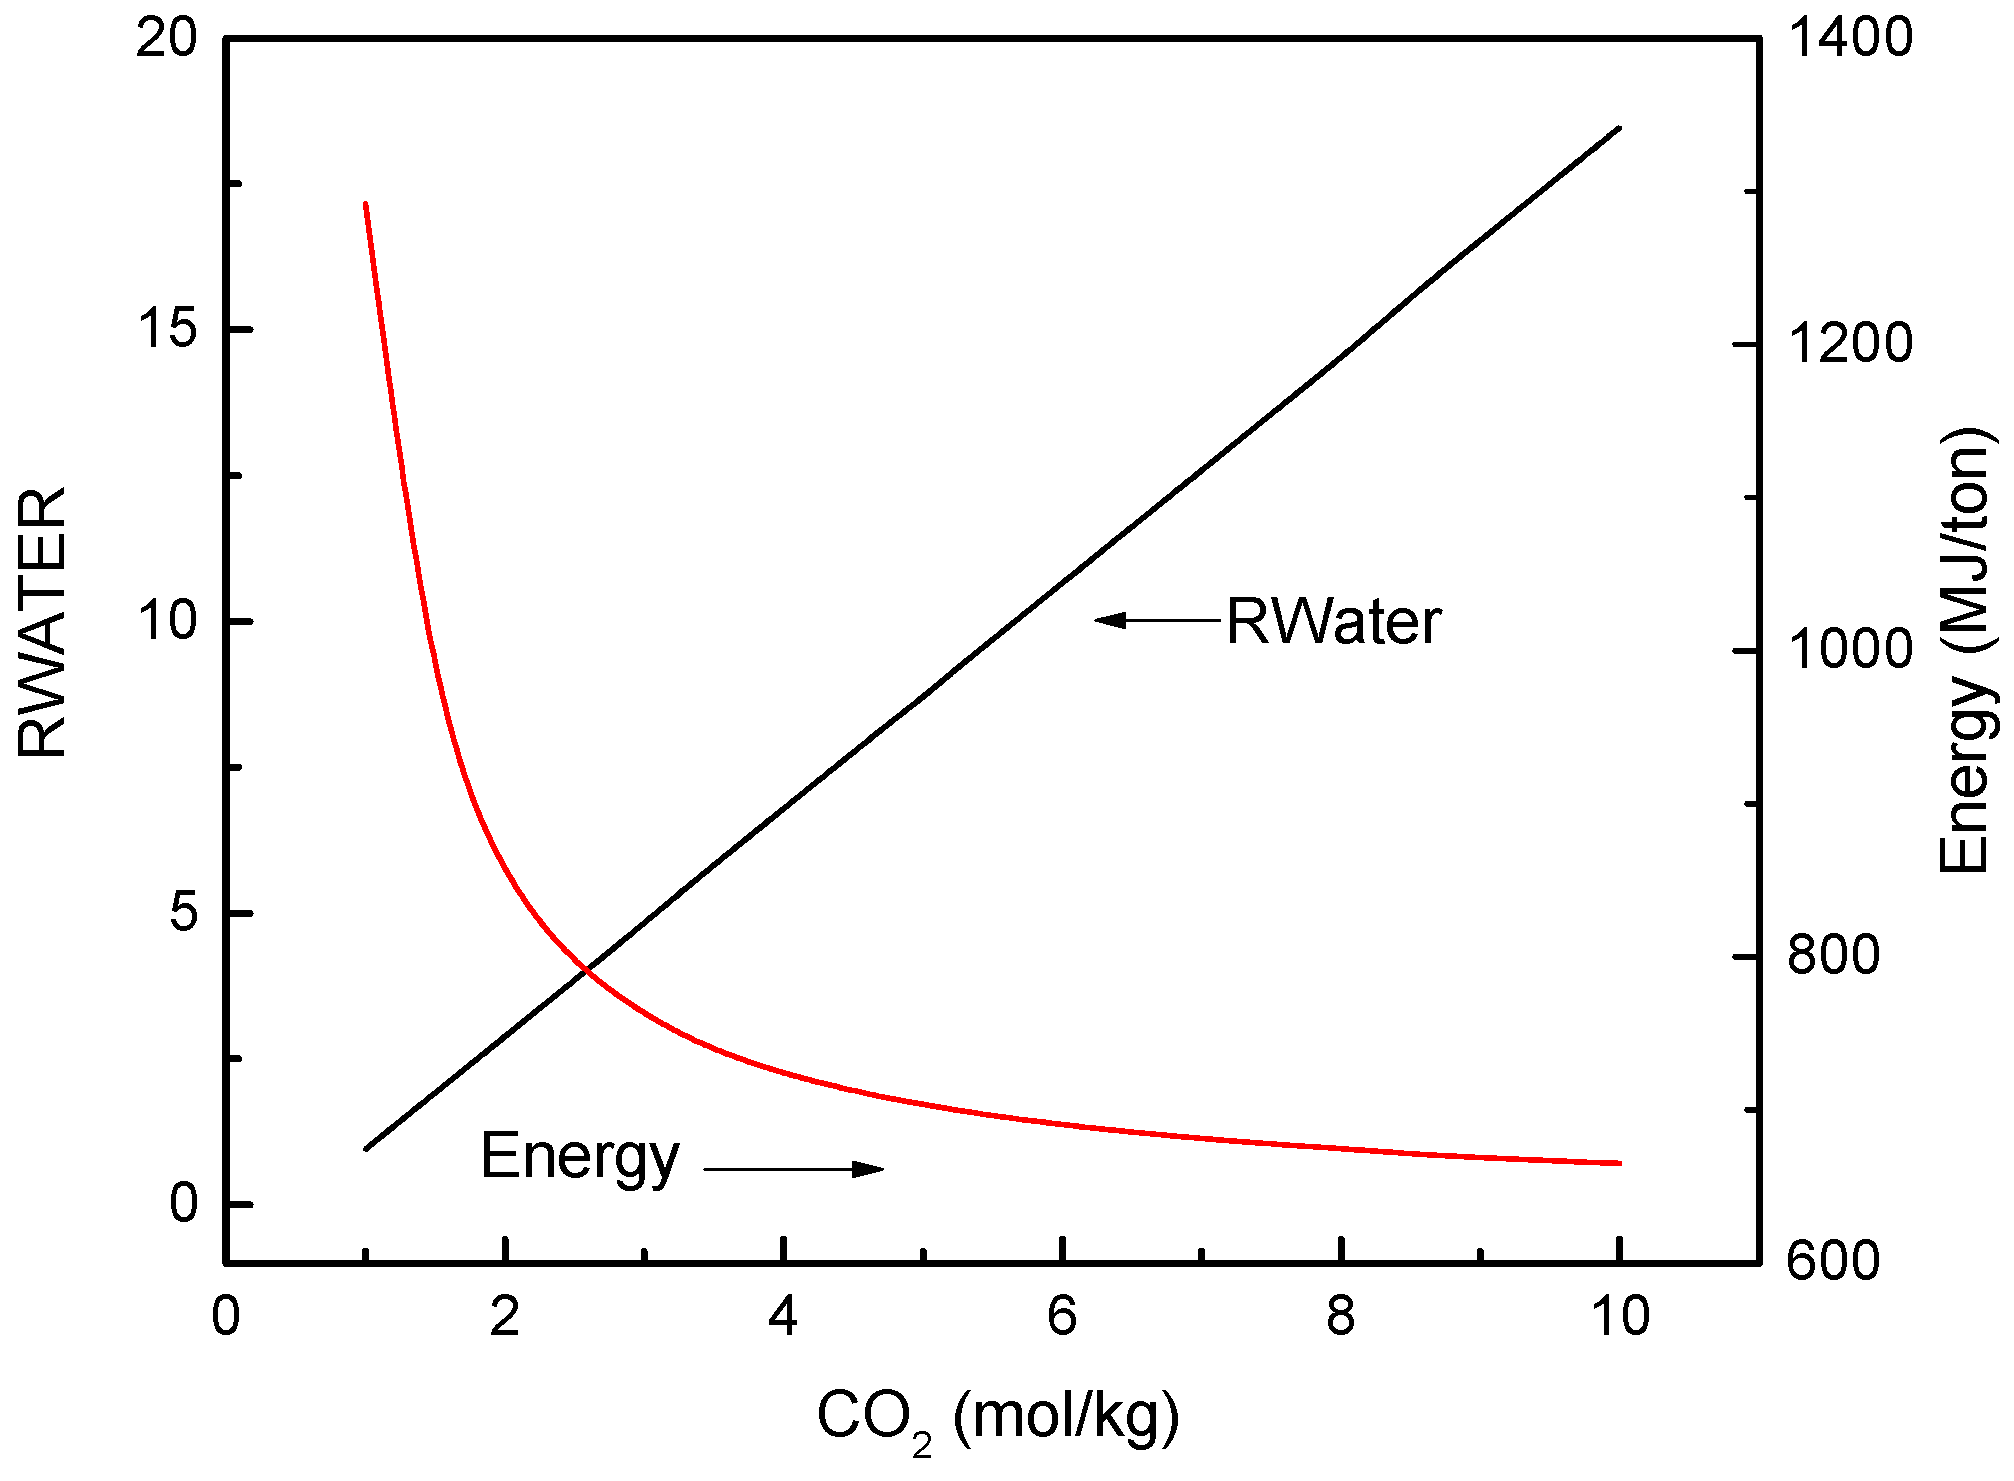
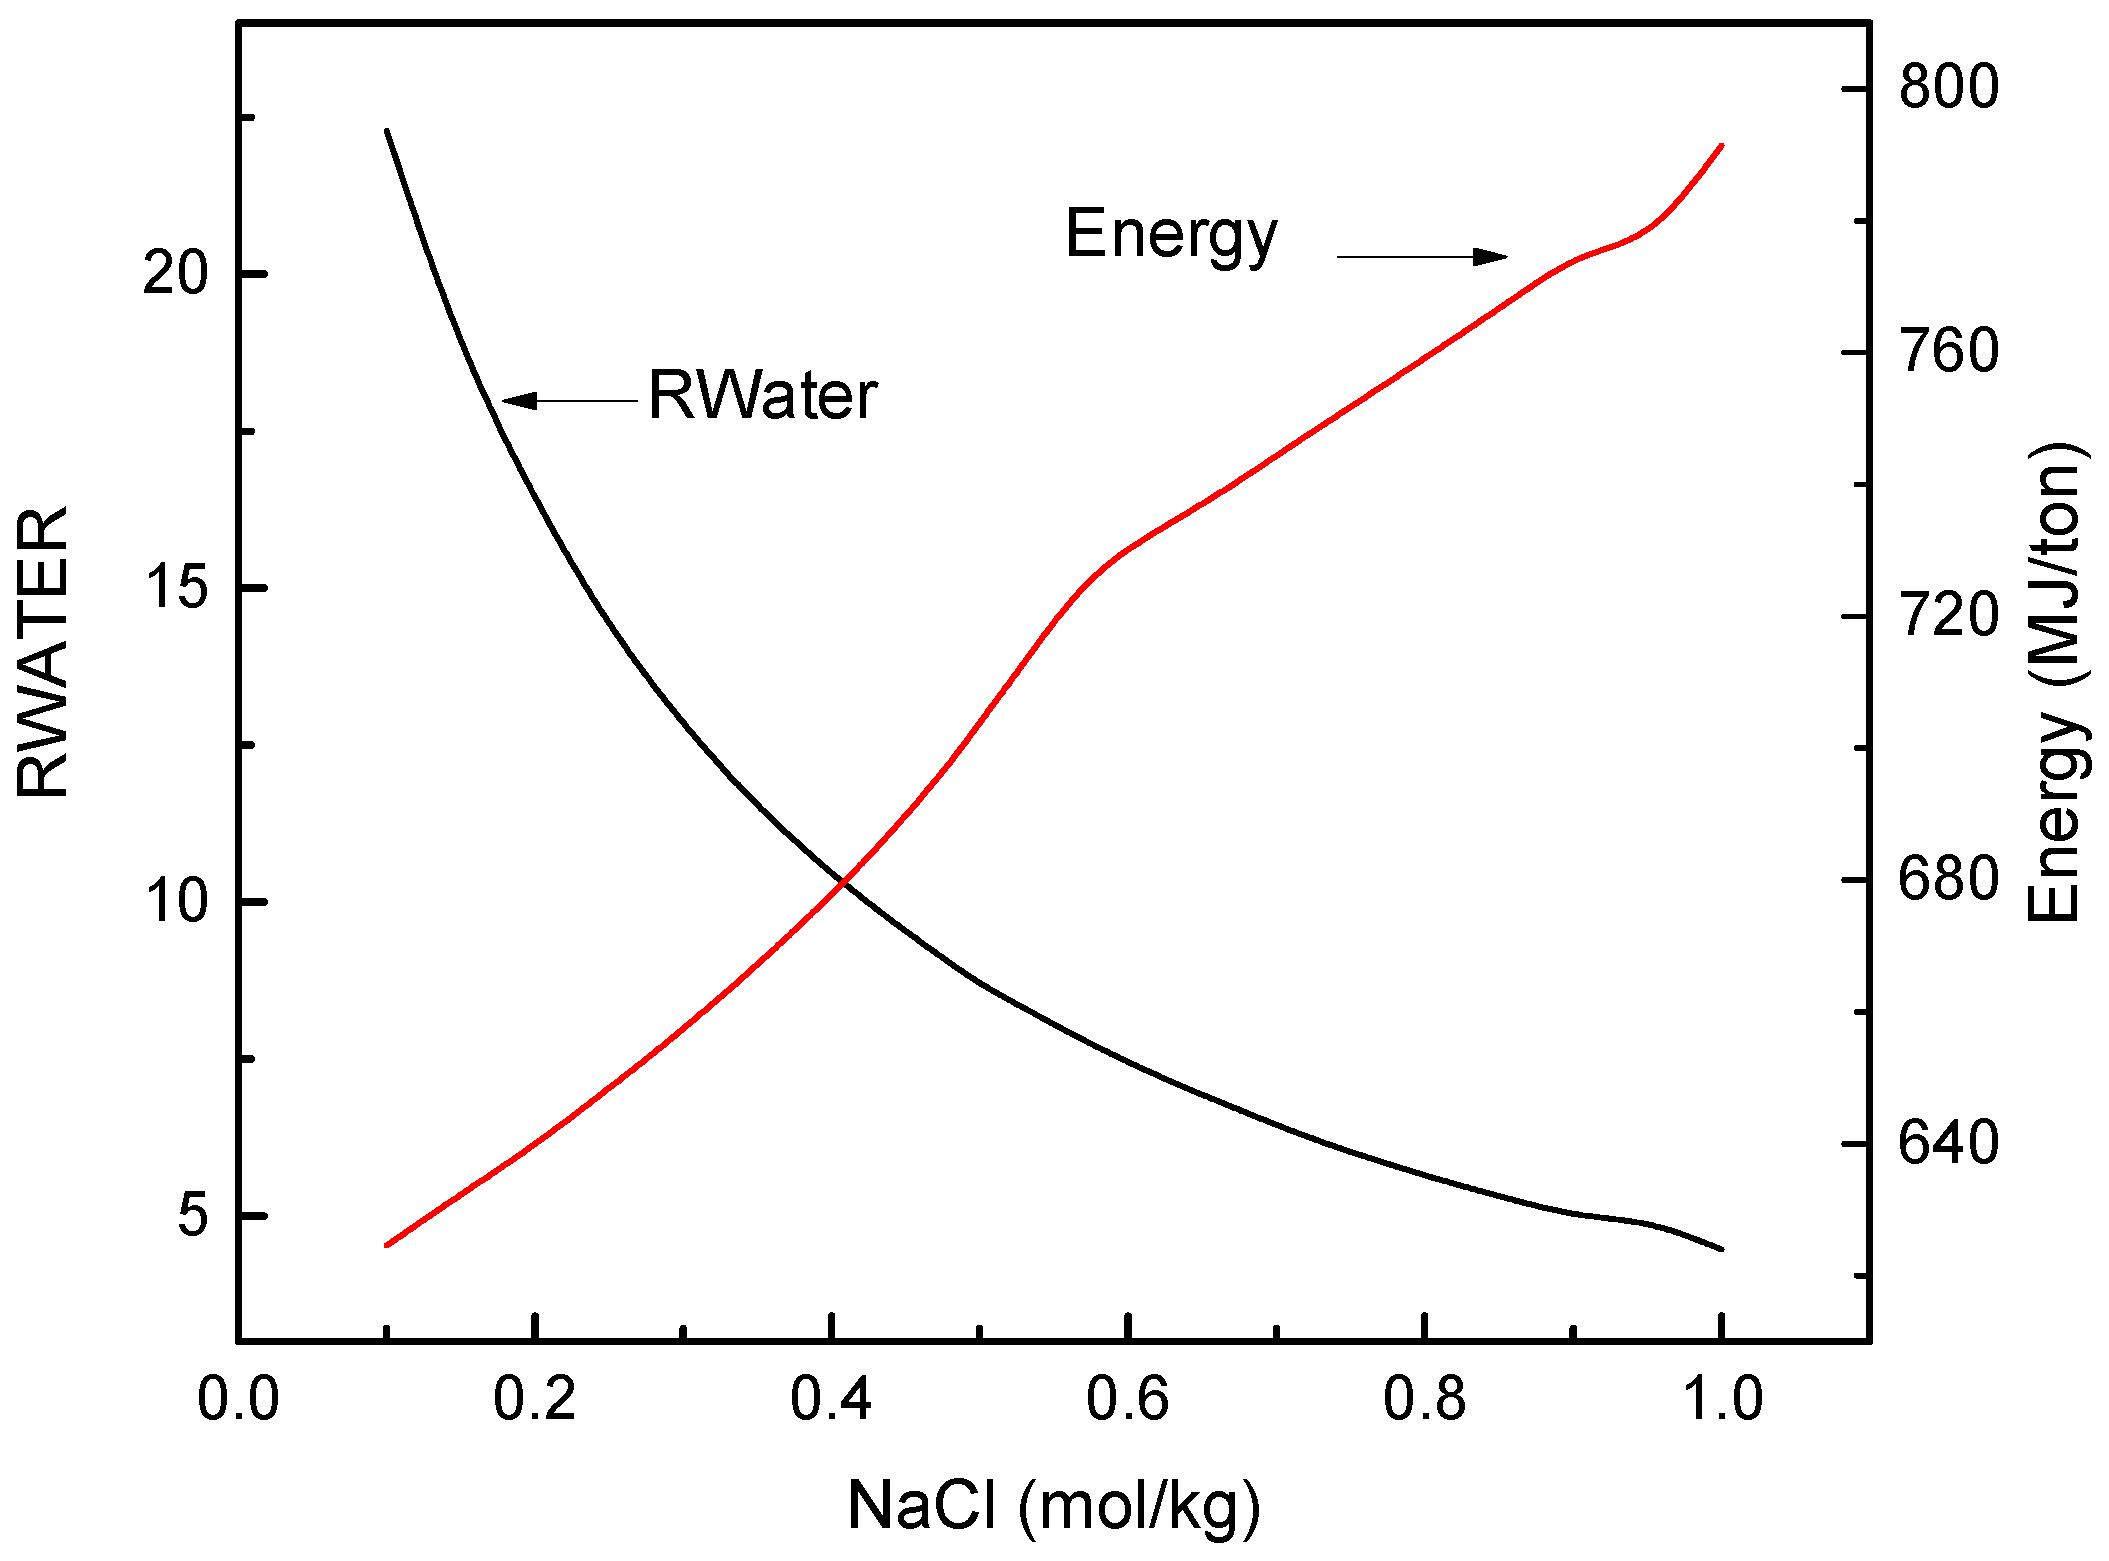
3.1. FO Process Using NH3-CO2 as Draw Solute

NH3-CO2 draw solution is regenerated via thermally decomposing the diluted draw solution into NH3 and CO2 gases at elevated temperature, then absorbing the gases by water to regenerate a concentrated draw solution [12]. The dissolved NH3 and CO2 gases in solution present in various forms including NH4+, NH2COO, HCO3, and CO32− ions, together with NH3(0) and CO2(0) neutral molecules. The osmotic pressure of the NH3-CO2 solution is influenced by the distribution of those species, which can be affected by the concentrations of NH3 and CO2 and also their ratio. An NH3-CO2 solution with a higher NH3 to CO2 ratio composed from ammonia salts like ammonium carbonate and ammonium carbamate can provide higher driving forces for the FO process due to its higher osmotic pressure [27]. However, the high pH of those solutions with high NH3 to CO2 ratios might become a problem for the membrane. NH4HCO3 solutions with the NH3 to CO2 ratio of 1 was preferred by some other researchers because it is less corrosive to the membrane [13]. In this simulation, the performance of the FO process was the first concern so a high ratio of 2.4 was selected.
To illustrate the influence of the feed concentration on the process performance, NaCl concentrations ranged from 0.1 to 1 mol·kg−1. The draw solution was composed of 12 mol·kg−1 NH3 and 5 mol·kg−1 CO2. The results are presented in terms of RWATER and energy consumption per quantity of produced water. It can be seen in Figure 4 that RWATER and the energy consumption clearly showed a reverse trend with an increase of feed concentration. RWATER is decreased while the energy consumption per water increases with increasing NaCl concentration. With the increasing feed concentration, the osmotic pressure differences across the membrane decreased. As a consequence, a lower amount of water would be migrated to the draw side before osmotic pressure equilibrium was reached, which leads to a low RWATER value. The low RWATER values mean that more “extra” energy was needed to heat up the draw solution.
The FO performance at different NH3-CO2 concentrations is illustrated in Figure 5. The feed concentration was fixed at 0.5 mol·kg−1 NaCl, which has an osmotic pressure of 2.22 MPa. The concentration of CO2 in the draw solution ranged from 1.0 to 10.0 mol·kg−1, and the NH3 to CO2 ratio was kept at 2.4. It can be seen in Figure 5 that increasing the draw solution concentration would have a very positive effect on improving the energy efficiency. As discussed above, the increasing osmotic pressure difference is the main reason for the improved FO performance at higher draw solution concentrations. The osmotic pressure of the NH3-CO2 solution at different concentrations was plotted in Figure 6. The osmotic pressure of a draw solution containing 2.4 mol·kg−1 NH3 and 1.0 mol·kg−1 CO2 is 6.20 MPa, which would generate an osmotic pressure difference of 4.00 MPa when the feed solution contains 0.5 mol·kg−1 NaCl. By increasing the NH3 and CO2 concentrations to 24.0 and 10.0 mol·kg−1, an osmotic pressure difference of 59.2 MPa can be obtained.

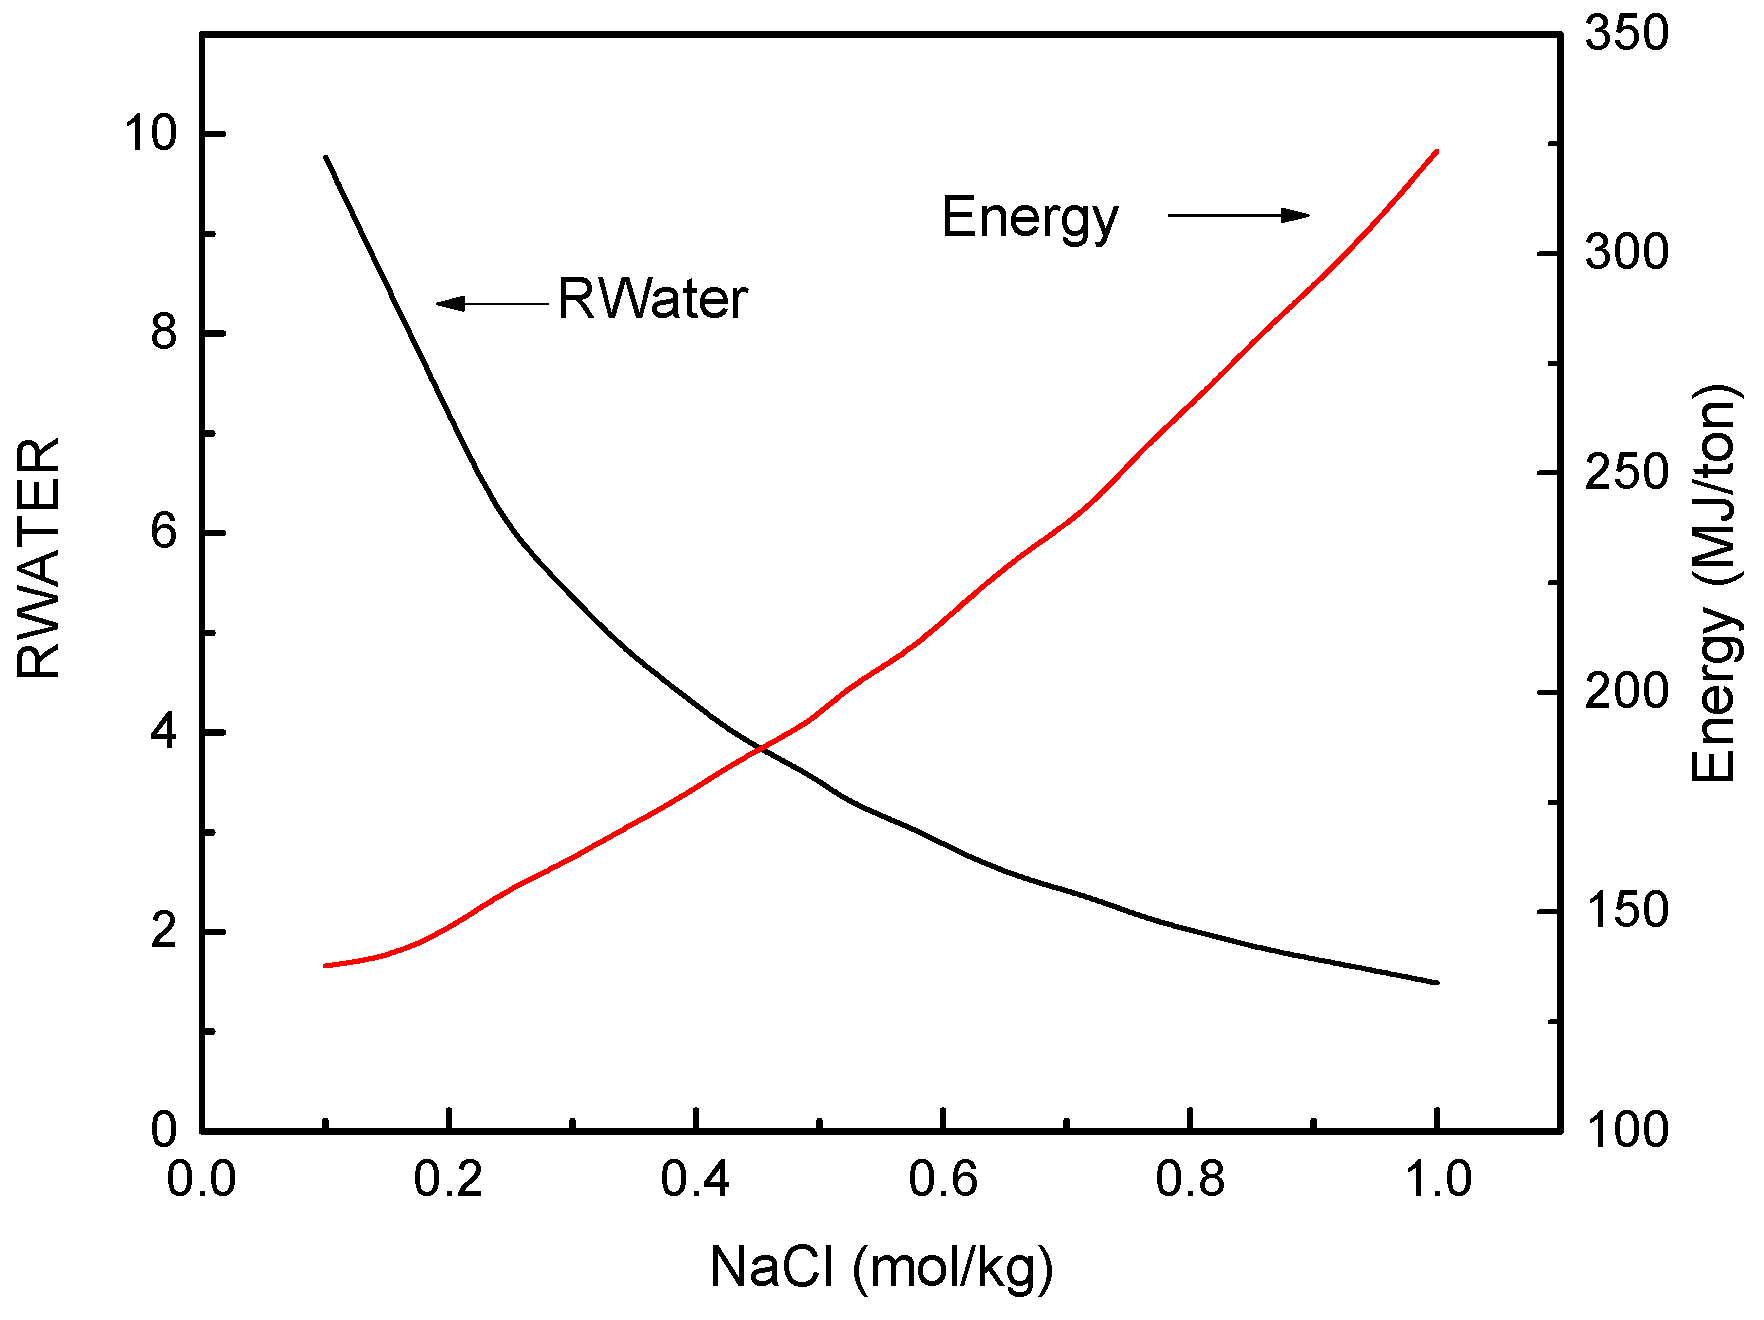
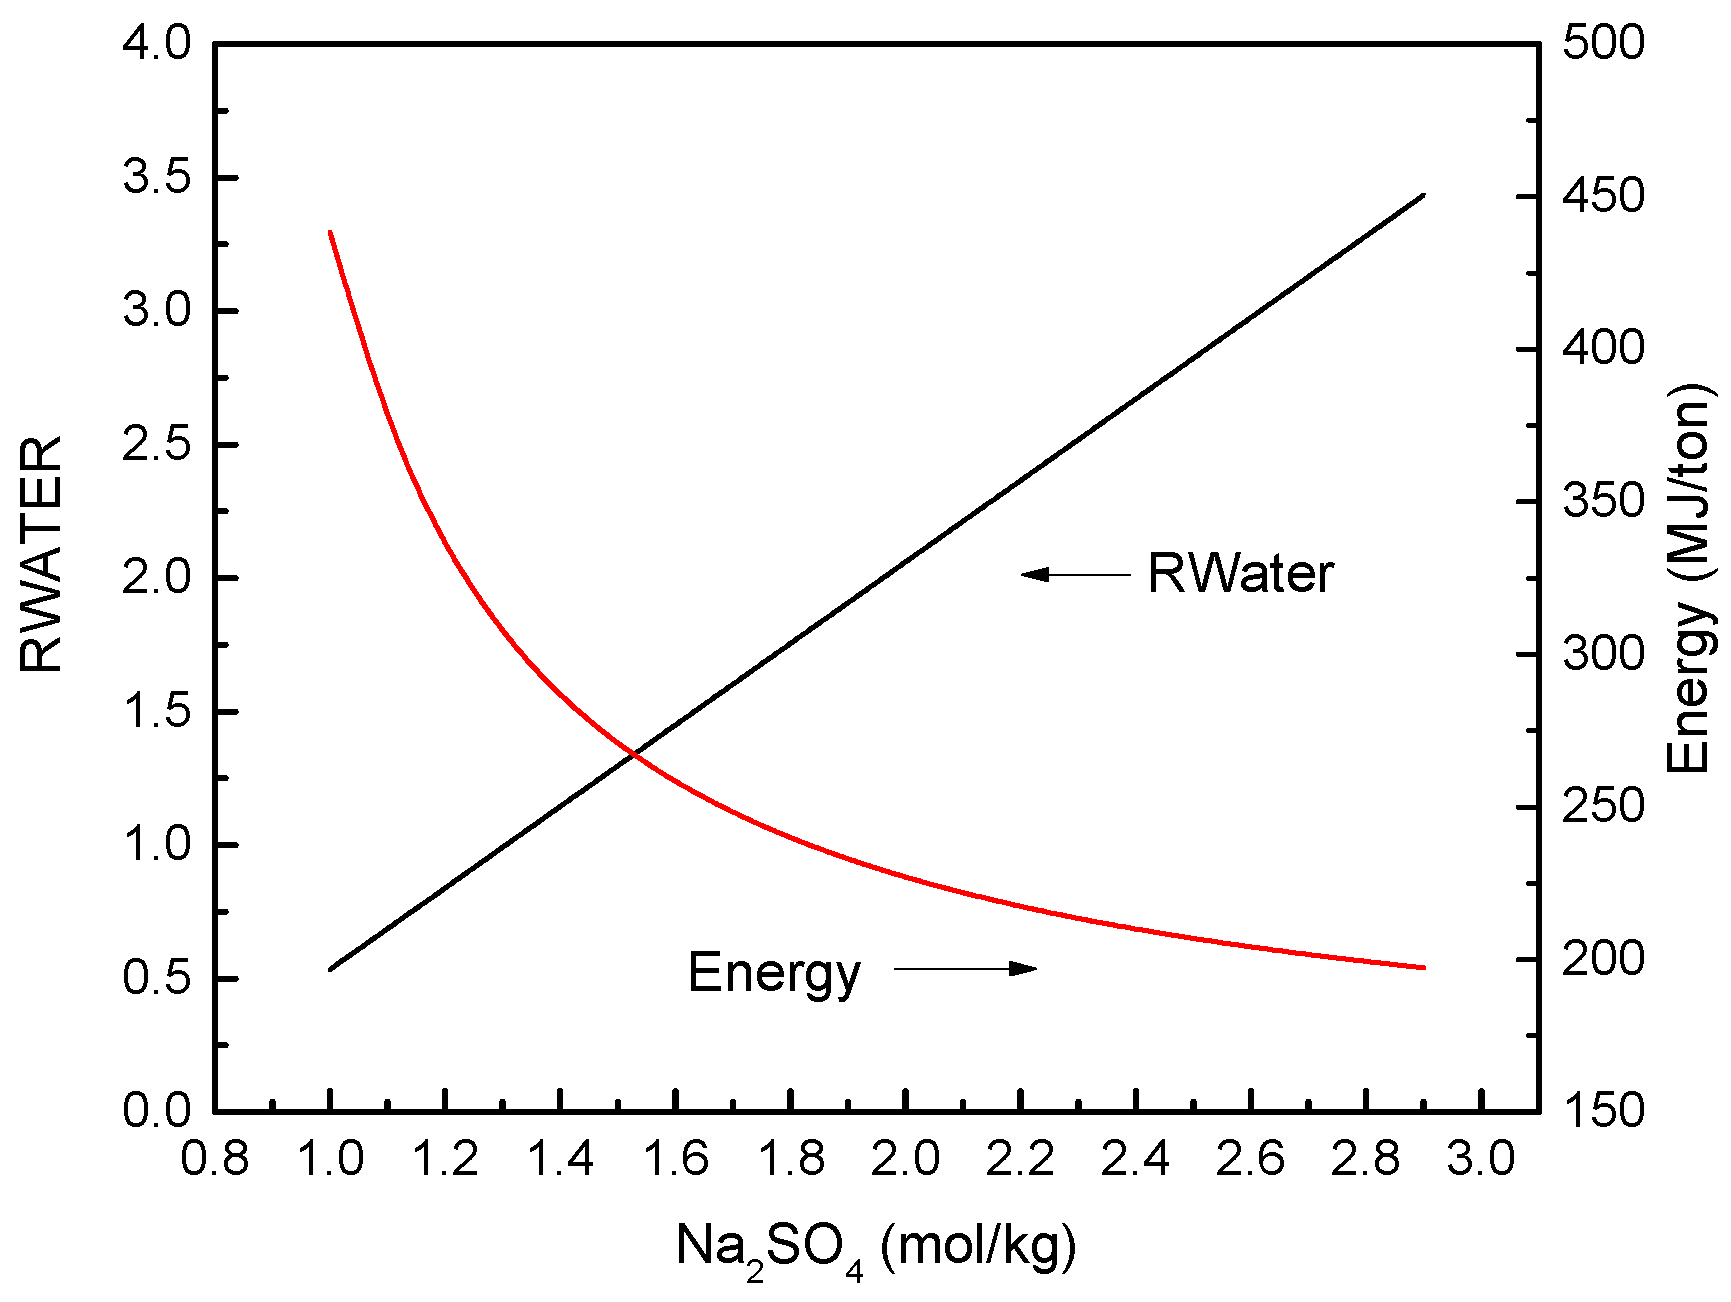
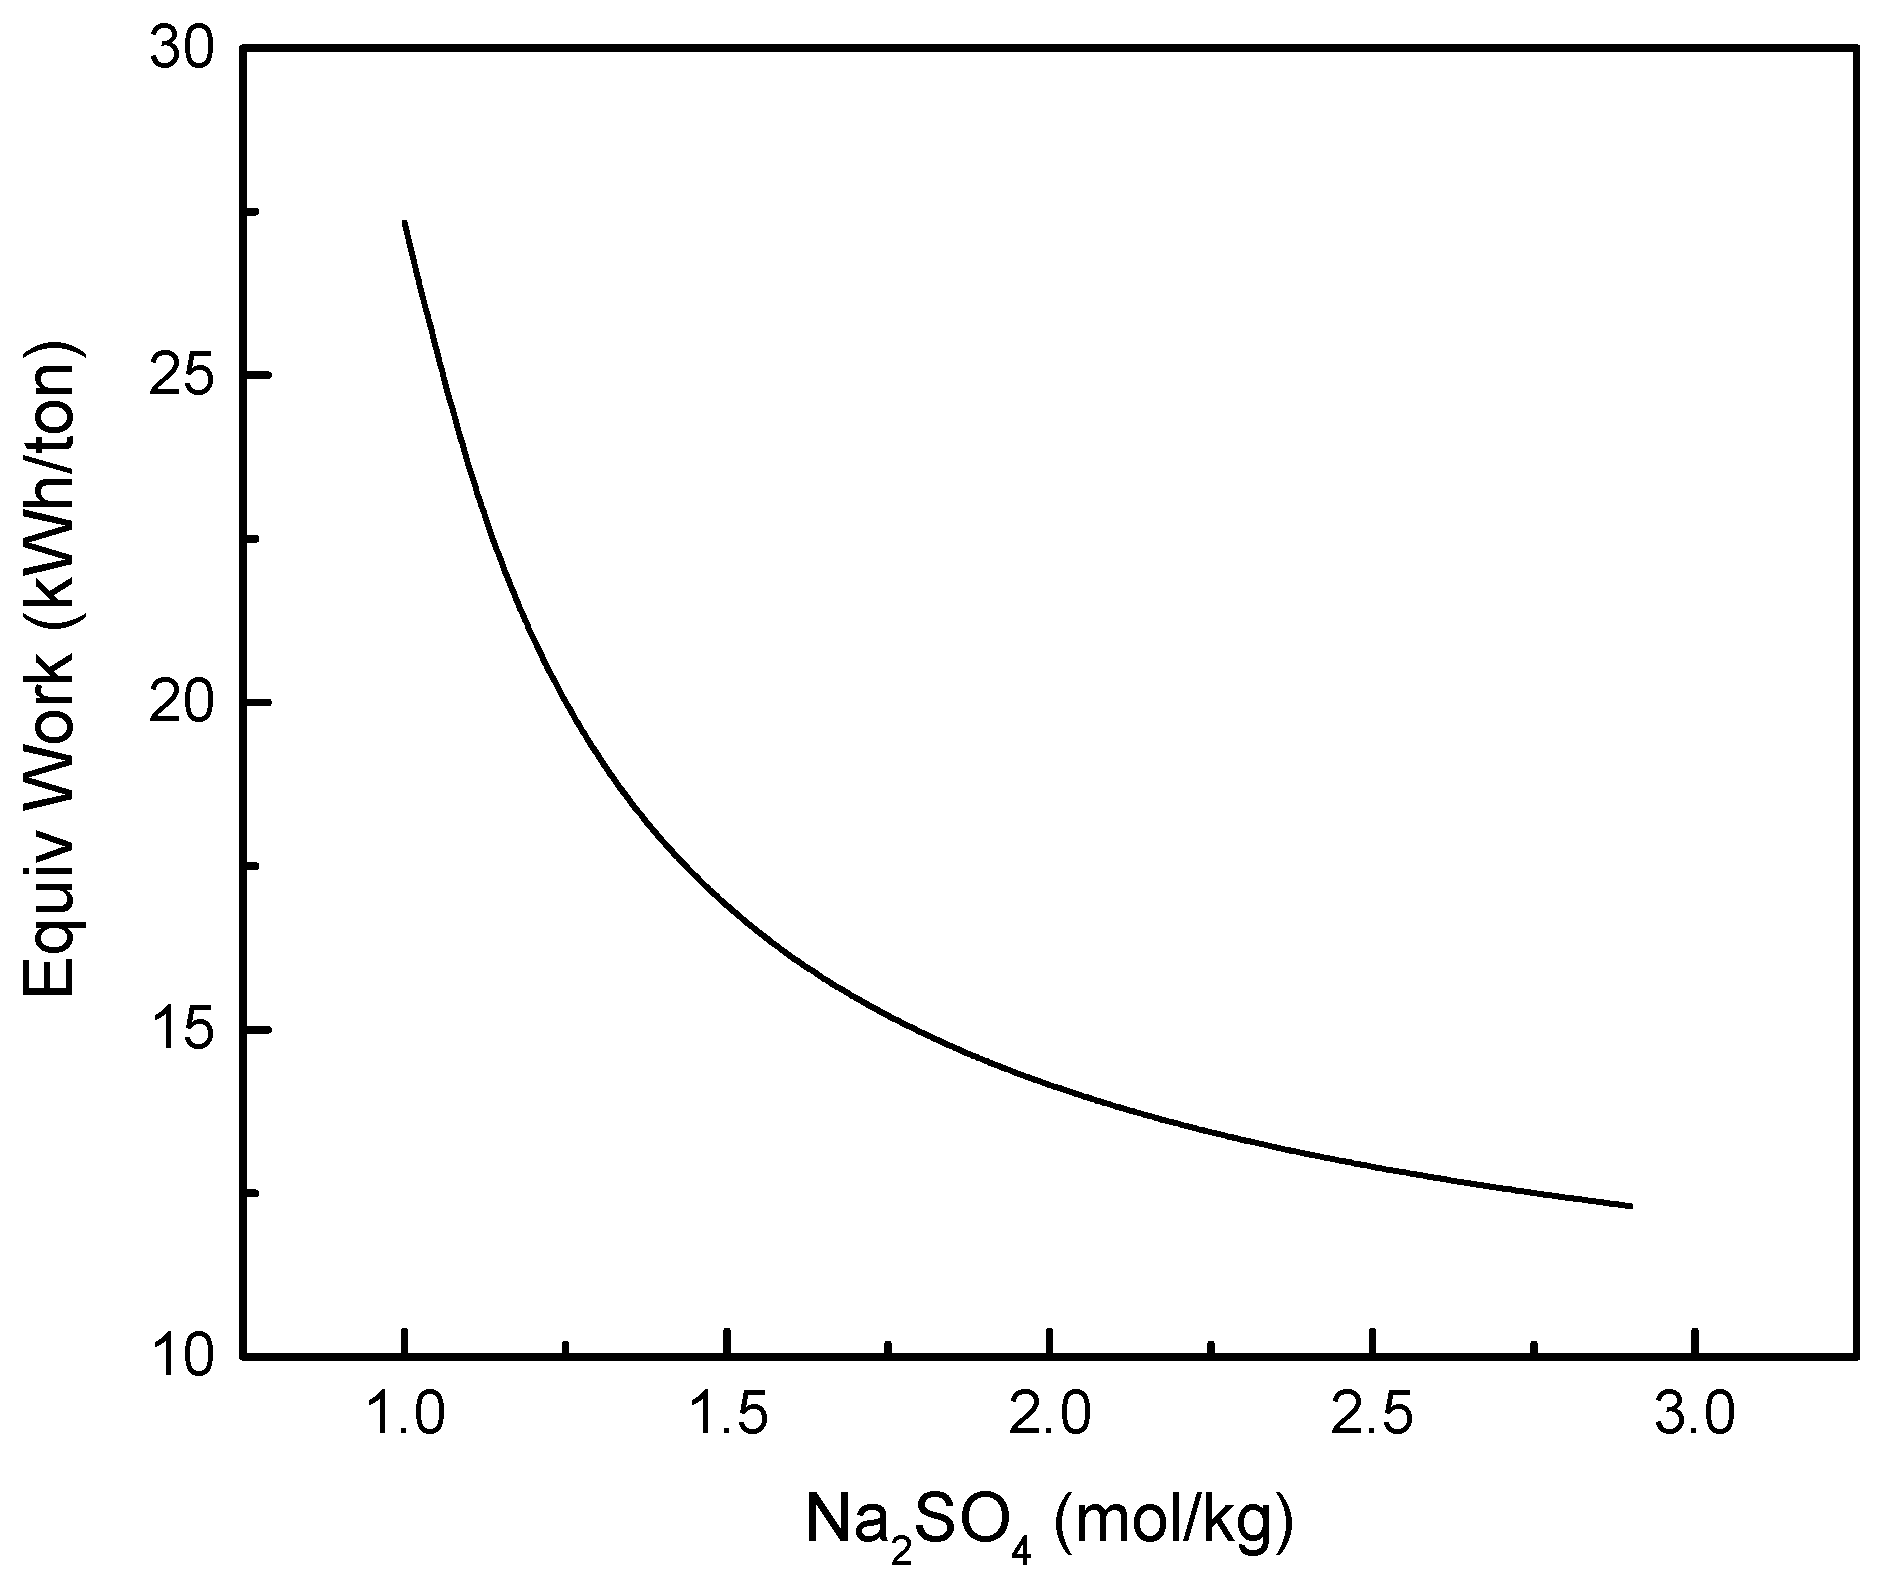
3.2. FO Process Using Na2SO4 as Draw Solute

As a draw solute, Na2SO4 would not only generate considerable osmotic pressure, but would also have a low draw solute back-leak because the SO42− ion does not easily penetrate the FO membrane [28,29]. Because the solubility of Na2SO4 was sharply decreased at the temperature range of 0 to 32 °C, it gives the chance of recycling Na2SO4 via crystallization at a low temperature.
The FO performance at different feed solution concentrations is displayed in Figure 7. The concentration of draw solution was set 2.9 mol·kg−1, which is close to the maximum solubility of Na2SO4 in water. Similar to the situation of NH3-CO2, high feed concentration had a negative influence on FO performance. The value of RWATER decreased from 9.77 to 1.49 mol·mol−1 while energy consumption increased from 138 to 324 MJ·ton−1 when the concentration of feed solution changed from 0.1 mol·kg−1 NaCl to 1 mol·kg−1. Figure 8 shows the FO performance at draw solution concentrations from 1 to 2.9 mol·kg−1, with feed solution of 0.5 mol·kg−1 NaCl. The value of RWATER increased almost linearly with increasing Na2SO4 concentration, and the energy consumption sharply decreased.

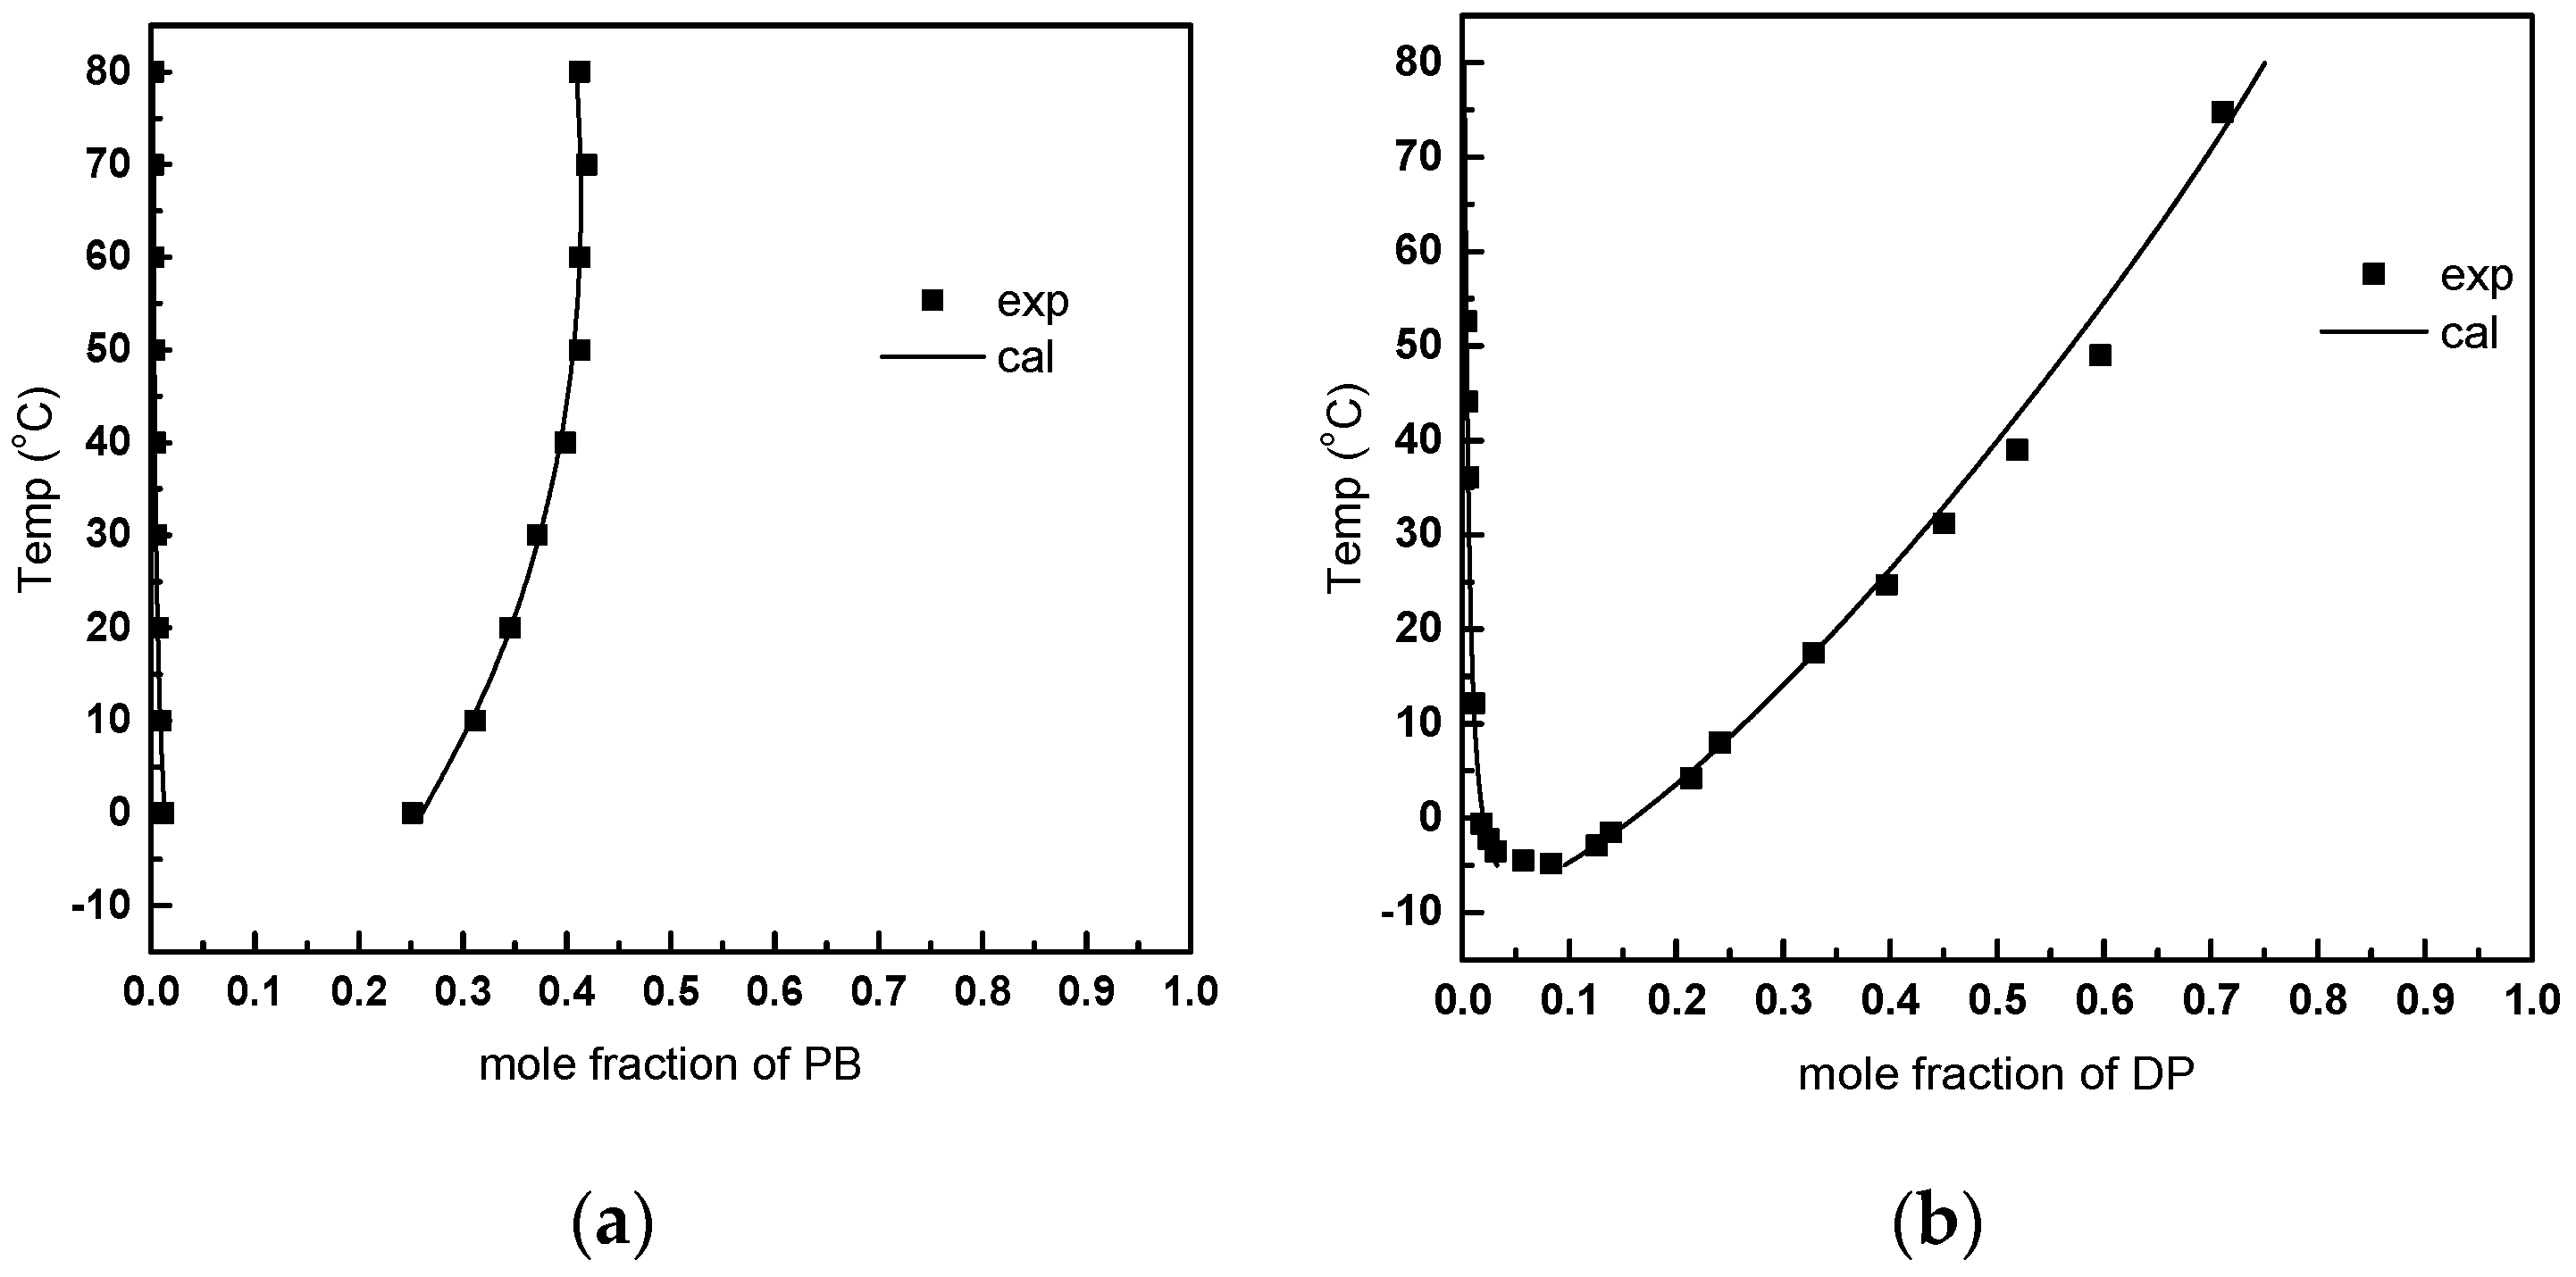
3.3. FO Process Using Solvents with LCST Points

An organic solute with a low critical solution temperature (LCST) point is completely miscible with water below the phase transition temperature, making it possible to provide enough osmotic pressure to withdraw the water from feed solutions [30]. At an elevated temperature above the LCST point, the miscible organic-water solution would exhibit the liquid-liquid phase separation. Then two liquid phases are formed, including the organic-rich phase with concentrated draw solute, and the water-rich phase. Therefore, the draw solute can be separated from water by varying the temperature for the liquid-liquid phase separation. The draw solute recovery of organic solutes with an LCST point only needs a simple liquid-liquid separator, which would operate more easily than the distillation columns for the decomposition of NH3-CO2 solution. Furthermore, the transportation and re-condensation of gases can be avoided so that it would make the process operation more easy. As a result, organic solutes with LCST points tend to be promising draw solute candidates and receive considerable research attention.
Two organic solvents, namely propylene glycol mono-butyl ether (PB) and dipropylamine (DP), were selected as the draw solutes. PB was once evaluated by Nakayama et al. [17] and the advantages of using glycol ethers as draw solutes include low viscosities, low pH values, low volatilities, etc. On the contrary, the high pH value of the aqueous DP solution might cause potential damage to the membrane, and more caution needs to be taken during the operation because of the volatility and toxicity of DP. So, DP is not a very good draw solution in the real world, but in this case DP was selected to demonstrate the effect of different liquid-liquid equilibriums on the FO performance. Figure 9 demonstrates the liquid-liquid equilibrium diagram of the solvent + water systems. The feasibility of using the UNIQUAC model to estimate the thermodynamic properties of the organic solutions was verified by comparing the calculated liquid-liquid equilibrium data with literature data [31,32]. In addition, the calculated results agree well with published results. It can be seen that the solubility of water in the organic-rich phase of the DP + water mixture shows a greater dependence on temperature than PB, which suggests that larger RWATER values, thus lower energy consumption, may be obtained when using DP.
To investigate the influence of feed concentration on FO performance, the temperature for separation was kept at 80 °C. The results are shown in Figure 10 for PB and Figure 11 for DP. From the results, it can be expected that the energy consumption of the FO process using organic draw solute would increase by increasing the feed concentration, because the osmotic pressure difference is decreased. Comparing the FO performance when using PB as a draw solute with that when using DP, it is clearly demonstrated that much more energy is required for the PB draw solute. This can be explained by their difference in liquid-liquid equilibrium behavior. The mole fraction concentration of the PB draw solution in the organic rich phase is 0.409 at the temperature of 80 °C. In addition, it will reach the osmotic pressure equilibrium at the concentration of 0.381, if the organic rich phase is used as the draw solution and the feed solution is composed of 0.5 mol·kg−1 NaCl. On the contrary, the change in concentration for DP draw solution is from 0.751 to 0.579 at the same condition. The higher concentration of DP in the organic rich phase after phase separation means it can produce a higher osmotic pressure compared to that of PB. Thus, a greater RWATER value and a better FO performance were achieved by using DP as draw solute.
As the organic rich phase is used as a draw solution, the concentration of draw solution using organic solute with an LCST point is controlled by the separation temperature. The temperature was manipulated to study its effect on the FO performance using DP as draw solute. It can be seen from the results shown in Figure 12 that the RWATER value increases with increasing temperature. However, the energy consumption was first decreased then increased with increasing temperature, and achieve a minimal value at around 76 °C. Although a greater RWATER can be obtained at higher temperatures because of the more concentrated draw solution. More thermal energy would be required to heat up the solution. As a consequence of these two effects, an optimized temperature for liquid-liquid separation might be found for certain FO processes using draw solutes with LCST points.
Figure 13 gives a direct comparison of the energy consumptions of the FO processes using different draw solutes. It shows that the energy consumptions of FO processes using PB and Na2SO4 were more sensitive to feed concentration changes. The FO process using PB exhibited the highest energy consumption among the four investigated draw solutes, which was about ten times the value of the NH3-CO2 process. Compared with NH3-CO2, the Na2SO4 process showed a much lower energy value. However, it should be noted that the cooling operation is achieved normally with the utilization of electric power which is a high grade energy, while a low-grade heat source was used for the decomposition of the NH3-CO2 solution. So, equivalent work is necessary for the comparison of total energy consumption, as discussed later.

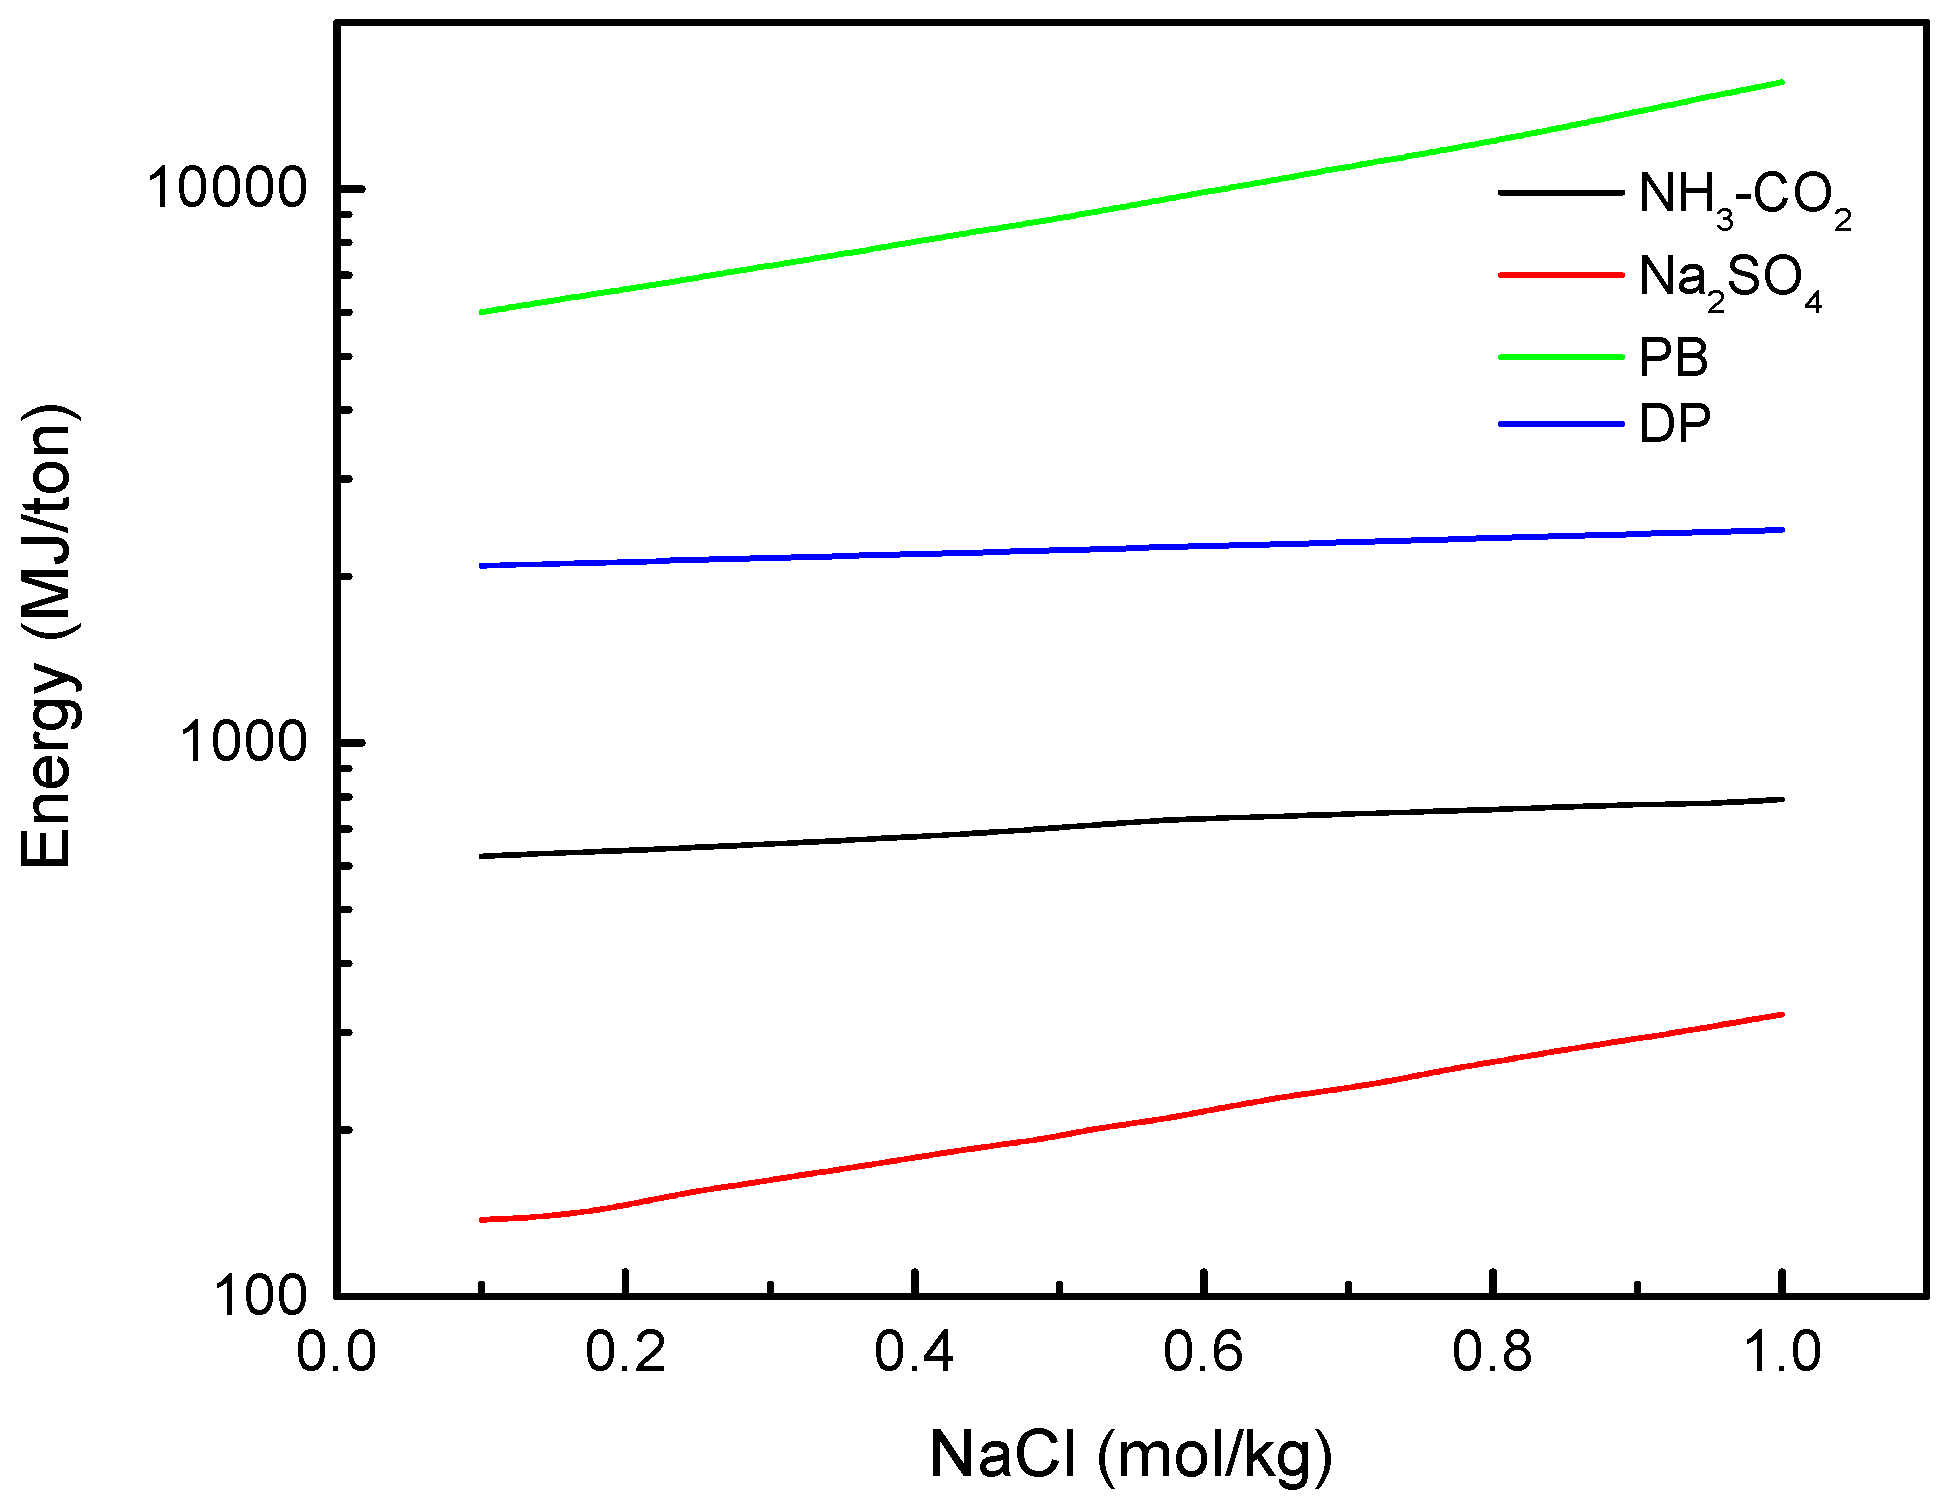
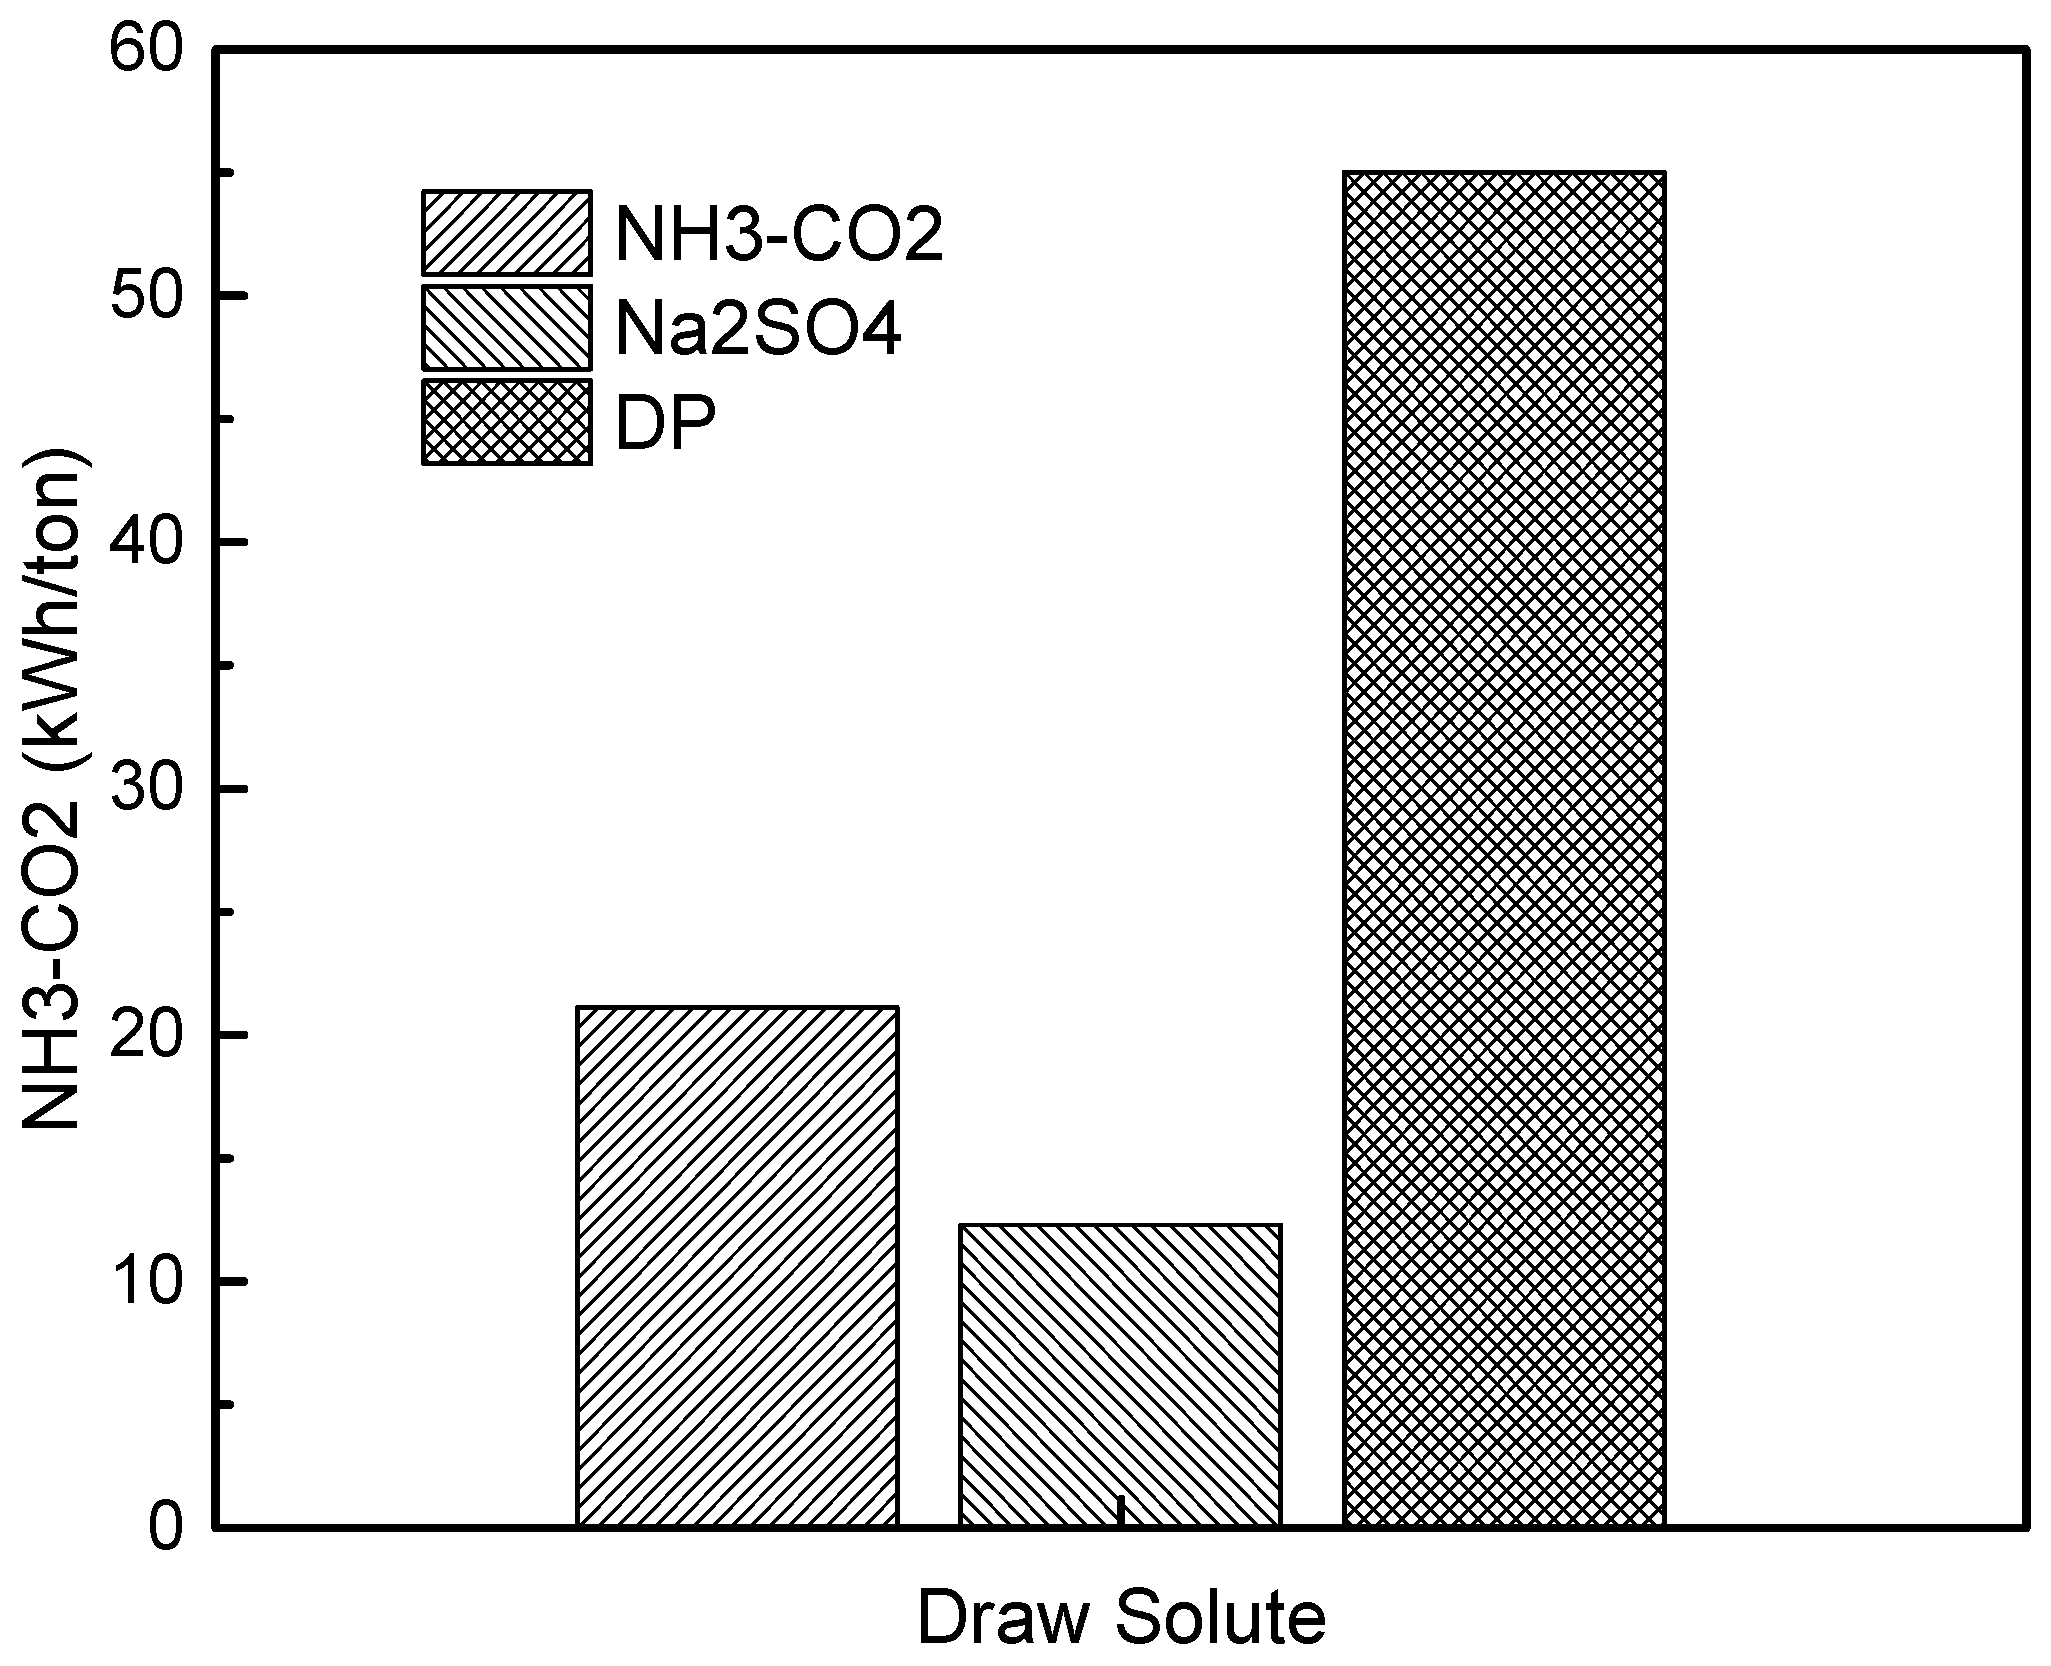
3.4. Equivalent Work for FO

In order to compare the total value of the FO processes using different grades of energy, a method of involving the calculation of “equivalent work”, in which the energy consumed was assigned an electrical work value, was considered. For the FO processes using NH3-CO2 and organic solutes with LCST points, thermal energy is required for the recovery of draw solutions. In the case where no low grade heat source is available, fuel energy would be directly charged to the FO process. So, the equivalent work is associated to the electrical work produced by the fuel energy [31], which can be calculated by the following equation:
W e q = Q d × η p d + W p u m p
Q d means the thermal energy supplied to the FO process, η p d is the overall power plant efficiency, and W p u m p is the electrical energy requirements for pumping work.
Figure 14. gives an example where low grade thermal energy from a cogeneration power desalting plant [32] is available for the FO process. The steam supplied to the FO process is extracted from the low pressure turbine. In this case, the equivalent work to the thermal energy Q d is relevant to the electrical work produced by the low pressure turbine:
W e q = Q d × η L P + W p u m p
where η L P means the low pressure turbine efficiency for producing electrical work. In addition, if assumed that the ideal Rankine cycle is employed by the low pressure turbine, the equivalent work can be further calculated as:
W e q = Q d × h 1 h 2 h 1 h 3 × E t u r b i n e + W p u m p
where h 1 is the enthalpy of the steam used to provide process heat input, h 2 is the enthalpy of the steam at the turbine outlet, and h 3 is the enthalpy of the steam at the condenser outlet. In this study, the condenser temperature was assumed to be 35 °C. E t u r b i n e is the turbine efficiency which is assumed to be 85%.
For the FO process using Na2SO4, electrical work is required for draw solute recovery. The equivalent work for the heat removal by the refrigerator system is expressed as:
W e q = Q d C O P + W p u m p
where C O P (Coefficient of Performance) is the ratio of cooling or heating to energy consumption. C O P is largely dependent on operating conditions, like the cooling and ambient temperatures, coolant medium, the efficiency of the heat pump, etc. In this study, C O P is assumed to be 4.5 for cooling the diluted draw solution from room temperature to 0 °C, and a glycol refrigeration system was used.
The results of equivalent work at different draw solution concentrations are displayed in Figure 15, Figure 16 and Figure 17. In those calculations, all the feed solutions consisted of 0.5 mol·kg−1 NaCl. For the draw solute of NH3-CO2, the boiler temperature was approximated at 100 °C under ambient pressure so low grade steams of 110 and 130 °C were used. Because the temperature for liquid-liquid separation of DP + water solutions was below 80 °C, a heat source of 90 °C can be used for the FO process using a draw solute of DP. It can be seen in Figure 15 that the equivalent work was from 60.5 to 117.6 kWh·ton−1 for NH3-CO2 when the heat was directly supplied by fuel energy. When a low grade steam of 110 °C was used, the lowest equivalent work could be 21.1 kWh·ton−1 which suggests that the grade of heat sources would have a significant influence on the process value. For the case of Na2SO4, as shown in Figure 16, the minimum of equivalent work was 12.3 kWh·ton−1 if the value of C O P was 4.5. The equivalent work of DP using a steam of 90 °C, was in the range of 55.0 to 70.6 kWh·ton−1 as shown in Figure 17. For a direct comparison of the equivalent work of the FO processes using different draw solutes, the minimum equivalent work for each draw solute (for example, the value for NH3-CO2 process was obtained with 10 mol·kg−1 CO2 and 110 °C heat source) are presented in Figure 18. It can be seen that while a lower temperature steam can be employed for the FO process using DP, the equivalent work was still larger than the one using NH3-CO2. The FO process using a draw solute of Na2SO4 exhibited the lowest equivalent work among the draw solutes investigated in this study.
The method developed in this work provides an approach to quickly estimate the energy consumption of an FO process using certain draw solute, therefore, it would be helpful for screening the draw solutes. However, it should also be noted that the assumptions in this study are based on ideal conditions. More factors such as the membrane permeability, long term stability, and the price of the energy need to be taken into consideration for more practical operations. For example, the FO process using NH3-CO2 may be more attractive than using Na2SO4 if abundant low grade heat sources at cheap prices are available.

4. Conclusions

The energy requirements of the FO process using various draw solutes were presented under different feed and draw solution concentrations. It was found that the increasing feed solution concentrations would have a negative effect on process performance. The energy consumption of the FO process decreased with increasing draw solution concentration. The NH3-CO2 process had the lowest thermal energy requirement among the three FO processes because the draw solute recovery was achieved by heating. On the contrary, the FO process using propylene glycol mono-butyl ether showed a relatively large energy consumption due to its small solubility in water. The FO process using Na2SO4 required the lowest equivalent work, and the cooling efficiency largely depended on operating conditions.
For the future development of draw solutes, the NH3-CO2 system has high potential due to its low thermal energy consumption and its ability to treat highly concentrated feed solutions. Although Na2SO4 seems to be a promising draw solute on terms of the equivalent work, further studies, such as the mass transfer mechanism across the membrane and the crystallization and dissolution rate of Na2SO4 salt, are essential. For the development of draw solutes with LCST points, it is important to find an organic solute whose solubility in water is strongly dependent on temperature.

Acknowledgments

The support of the National Key Technologies R&D Program of China (No. 2015BAE06B00) is gratefully acknowledged.

Author Contributions

The authors contributed equally to this work.

Conflicts of Interest

The authors declare no conflict of interest.

References

  1. Water Scarcity|Threats|WWF. Available online: http://www.worldwildlife.org/threats/water-scarcity (accessed on 14 March 2016).
  2. International Decade for Action “Water for Life” 2005–2015. Focus Areas: Water Scarcity. Available online: http://www.un.org/waterforlifedecade/scarcity.shtml (accessed on 14 March 2016).
  3. Morin, O.J. Design and operating comparison of MSF and MED systems. Desalination 1993, 93, 69–109. [Google Scholar] [CrossRef]
  4. Mistry, K.H.; McGovern, R.K.; Thiel, G.P.; Summers, E.K.; Zubair, S.M.; Lienhard, J.H. Entropy generation analysis of desalination technologies. Entropy 2011, 13, 1829–1864. [Google Scholar] [CrossRef] [Green Version]
  5. Greenlee, L.F.; Lawler, D.F.; Freeman, B.D.; Marrot, B.; Moulin, P. Reverse osmosis desalination: Water sources, technology, and today’s challenges. Water Res. 2009, 43, 2317–2348. [Google Scholar] [CrossRef] [PubMed]
  6. Deshmukh, A.; Yip, N.Y.; Lin, S.; Elimelech, M. Desalination by forward osmosis: Identifying performance limiting parameters through module-scale modeling. J. Membr. Sci. 2015, 491, 159–167. [Google Scholar] [CrossRef]
  7. Chung, T.-S.; Li, X.; Ong, R.C.; Ge, Q.; Wang, H.; Han, G. Emerging forward osmosis (FO) technologies and challenges ahead for clean water and clean energy applications. Curr. Opin. Chem. Eng. 2012, 1, 246–257. [Google Scholar] [CrossRef]
  8. Klaysom, C.; Cath, T.Y.; Depuydt, T.; Vankelecom, I.F.J. Forward and pressure retarded osmosis: Potential solutions for global challenges in energy and water supply. Chem. Soc. Rev. 2013, 42, 6959–6989. [Google Scholar] [CrossRef] [PubMed]
  9. Shaffer, D.L.; Werber, J.R.; Jaramillo, H.; Lin, S.; Elimelech, M. Forward osmosis: Where are we now? Desalination 2015, 356, 271–284. [Google Scholar] [CrossRef]
  10. Chekli, L.; Phuntsho, S.; Shon, H.K.; Vigneswaran, S.; Kandasamy, J.; Chanan, A. A review of draw solutes in forward osmosis process and their use in modern applications. Desalination Water Treat. 2012, 43, 167–184. [Google Scholar] [CrossRef]
  11. McCutcheon, J.R.; McGinnis, R.L.; Elimelech, M. A novel ammonia—Carbon dioxide forward (direct) osmosis desalination process. Desalination 2005, 174, 1–11. [Google Scholar] [CrossRef]
  12. McGinnis, R.L.; Hancock, N.T.; Nowosielski-Slepowron, M.S.; McGurgan, G.D. Pilot demonstration of the NH3/CO2 forward osmosis desalination process on high salinity brines. Desalination 2013, 312, 67–74. [Google Scholar] [CrossRef]
  13. Kim, Y.; Lee, J.H.; Kim, Y.C.; Lee, K.H.; Park, I.S.; Park, S.-J. Operation and simulation of pilot-scale forward osmosis desalination with ammonium bicarbonate. Chem. Eng. Res. Des. 2015, 94, 390–395. [Google Scholar] [CrossRef]
  14. Wendt, D.S.; Orme, C.J.; Mines, G.L.; Wilson, A.D. Energy requirements of the switchable polarity solvent forward osmosis (SPS-FO) water purification process. Desalination 2015, 374, 81–91. [Google Scholar] [CrossRef]
  15. Jessop, P.G.; Mercer, S.M.; Heldebrant, D.J. CO2-triggered switchable solvents, surfactants, and other materials. Energy Environ. Sci. 2012, 5, 7240–7253. [Google Scholar] [CrossRef]
  16. Stone, M.L.; Rae, C.; Stewart, F.F.; Wilson, A.D. Switchable polarity solvents as draw solutes for forward osmosis. Desalination 2013, 312, 124–129. [Google Scholar] [CrossRef]
  17. Nakayama, D.; Mok, Y.; Noh, M.; Park, J.; Kang, S.; Lee, Y. Lower critical solution temperature (LCST) phase separation of glycol ethers for forward osmotic control. Phys. Chem. Chem. Phys. 2014, 16, 5319–5325. [Google Scholar] [CrossRef] [PubMed]
  18. Cai, Y.; Shen, W.; Wei, J.; Chong, T.H.; Wang, R.; Krantz, W.B.; Fane, A.G.; Hu, X. Energy-efficient desalination by forward osmosis using responsive ionic liquid draw solutes. Environ. Sci. Water Res. Technol. 2015, 1, 341–347. [Google Scholar] [CrossRef]
  19. Zhong, Y.; Feng, X.; Chen, W.; Wang, X.; Huang, K.-W.; Gnanou, Y.; Lai, Z. Using UCST ionic liquid as a draw solute in forward osmosis to treat high-salinity water. Environ. Sci. Technol. 2016, 50, 1039–1045. [Google Scholar] [CrossRef] [PubMed]
  20. McGinnis, R.L.; Elimelech, M. Energy requirements of ammonia–carbon dioxide forward osmosis desalination. Desalination 2007, 207, 370–382. [Google Scholar] [CrossRef]
  21. Mazlan, N.M.; Peshev, D.; Livingston, A.G. Energy consumption for desalination—A comparison of forward osmosis with reverse osmosis, and the potential for perfect membranes. Desalination 2016, 377, 138–151. [Google Scholar] [CrossRef]
  22. Park, M.Y.; Shin, S.; Kim, E.S. Effective energy management by combining gas turbine cycles and forward osmosis desalination process. Appl. Energy 2015, 154, 51–61. [Google Scholar] [CrossRef]
  23. Chen, C.C.; Britt, H.I.; Boston, J.F.; Evans, L.B. Local composition model for excess Gibbs energy of electrolyte systems. Part I: Single solvent, single completely dissociated electrolyte systems. AIChE J. 1982, 28, 588–596. [Google Scholar] [CrossRef]
  24. Abrams, D.S.; Prausnitz, J.M. Statistical thermodynamics of liquid mixtures: A new expression for the excess Gibbs energy of partly or completely miscible systems. AIChE J. 1975, 21, 116–128. [Google Scholar] [CrossRef]
  25. Chen, C.C.; Song, Y.H. Generalized electrolyte-NRTL model for mixed-solvent electrolyte systems. AIChE J. 2004, 50, 1928–1941. [Google Scholar] [CrossRef]
  26. Chen, C.C.; Evans, L.B. A local composition model for the excess Gibbs energy of aqueous electrolyte systems. AIChE J. 1986, 32, 444–454. [Google Scholar] [CrossRef]
  27. McCutcheon, J.R.; McGinnis, R.L.; Elimelech, M. Desalination by ammonia–carbon dioxide forward osmosis: Influence of draw and feed solution concentrations on process performance. J. Membr. Sci. 2006, 278, 114–123. [Google Scholar] [CrossRef]
  28. Achilli, A.; Cath, T.Y.; Childress, A.E. Selection of inorganic-based draw solutions for forward osmosis applications. J. Membr. Sci. 2010, 364, 233–241. [Google Scholar] [CrossRef]
  29. Zhao, S.; Zou, L.; Mulcahy, D. Brackish water desalination by a hybrid forward osmosis–nanofiltration system using divalent draw solute. Desalination 2012, 284, 175–181. [Google Scholar] [CrossRef]
  30. Christensen, S.P.; Donate, F.A.; Frank, T.C.; LaTulip, R.J.; Wilson, L.C. Mutual solubility and lower critical solution temperature for water + glycol ether systems. J. Chem. Eng. Data 2005, 50, 869–877. [Google Scholar] [CrossRef]
  31. Al-Karaghouli, A.; Kazmerski, L.L. Energy consumption and water production cost of conventional and renewable-energy-powered desalination processes. Renew. Sustain. Energy Rev. 2013, 24, 343–356. [Google Scholar] [CrossRef]
  32. Darwish, M.A.; Al Asfour, F.; Al-Najem, N. Energy consumption in equivalent work by different desalting methods: Case study for Kuwait. Desalination 2003, 152, 83–92. [Google Scholar] [CrossRef]
Figure 1. Aspen Plus flowsheet of the forward osmosis (FO) process using NH3-CO2 as the draw solute.
Water 09 00189 g001
Figure 2. Aspen Plus flowsheet of the FO process using Na2SO4 as the draw solute.
Water 09 00189 g002
Figure 3. Aspen Plus flowsheet of the FO process using organic solutes with a LCST point as the draw solute.
Water 09 00189 g003
Figure 4. The effect of feed solution concentration on the FO process performance using NH3-CO2 as the draw solute.
Water 09 00189 g004
Figure 5. The effect of draw solution concentration on the FO process performance using NH3-CO2 as the draw solute.
Water 09 00189 g005
Figure 6. Osmotic pressure of draw solution at difference CO2 concentrations.
Water 09 00189 g006
Figure 7. The effect of feed solution concentration on the FO process performance using Na2SO4 as the draw solute.
Water 09 00189 g007
Figure 8. The effect of draw solution concentration on the FO process performance using Na2SO4 as draw solute.
Water 09 00189 g008
Figure 9. Liquid-liquid equilibrium diagram of a lower critical solution temperature (LCST) organic solvents + water system; (a) propylene glycol n-butyl ether (PB) + water; (b) dipropylamine (DP) + water.
Water 09 00189 g009
Figure 10. The effect of feed solution concentration on the FO process performance using PB as the draw solute.
Water 09 00189 g010
Figure 11. The effect of feed solution concentration on the FO process performance using DP as the draw solute.
Water 09 00189 g011
Figure 12. The effect of separation temperature on the FO process performance using DP as the draw solute.
Water 09 00189 g012
Figure 13. Energy consumption of the FO process using different draw solutes as a function of NaCl concentrations.
Water 09 00189 g013
Figure 14. Schematic diagram of cogeneration power desalting plant.
Water 09 00189 g014
Figure 15. Equivalent work of the FO process using NH3-CO2 as the draw solute.
Water 09 00189 g015
Figure 16. Equivalent work of the FO process using Na2SO4 as the draw solute.
Water 09 00189 g016
Figure 17. Equivalent work of the FO process using DP as the draw solute.
Water 09 00189 g017
Figure 18. Equivalent work comparison of the FO process using different draw solutes.
Water 09 00189 g018

