1. Introduction
The imbalance in the supply and demand of water resources in the Haihe River Basin in northern China has become increasingly acute, and the per capita water availability is 270 m
3 per annum. The Heilonggang Basin in Hebei Province, China, is a typical sub-basin of the Haihe Basin. Heilonggang is a drought- and flood-prone coastal alluvial plain. Since the 1970s, groundwater levels have declined as a result of climate change, human activities [
1] and increased demands for water [
2], resulting in the formation of a perennial shallow groundwater depression cone over a wide area. This cone is still expanding and has triggered problems such as land subsidence [
3]. The rate of groundwater level decline in this region was particularly high from 1970 to 1981 and relatively constant after 1981 [
4]. Recently, mitigation measures such as restricting agricultural water use, improving water recharge and implementing measures to control the groundwater level and allow it to rebound have been implemented [
5]. The groundwater level fluctuations throughout the year are relatively high because of precipitation, evaporation and the timing of groundwater extraction. Generally, the groundwater level decreases from March to June and rebounds from June to September. From October to February, the groundwater level remains relatively stable [
6]. During wet years, the groundwater level after the flood season can reach up to 2 m higher than the minimum groundwater level before the flood season [
7].
Hebei Province is an important province for cotton production in China. The total cotton yield decreased from 570,800 tons per annum in 1990 to 222,600 tons per annum in 1999 and then gradually increased to 631,000 tons per annum in 2006 [
8]. In order to increase the crop production, excess amount of agriculture fertilizer is applied in the winter wheat, maize and cotton cropping systems on the North China Plain. Such a process results in nitrate nitrogen concentrations in excess of 10 mg·L
−1 in the shallow groundwater below the North China Plain [
9,
10], which is the limit for potable water adopted in the US and Canada [
11,
12]. Research indicates that agricultural practices are the primary source of excess nitrate nitrogen [
13] due to the crop uptake of over-applied nitrogen fertilizers [
10,
14] and conventional tillage practices [
15]. Additionally, nitrate nitrogen concentrations can be influenced by rainfall [
15], with excess nitrogen accumulating in the soil vadose zone or leaching into the groundwater [
16] because the NH
4+ from ammonium compounds is easily adsorbed by soil particles and NO
2− is unstable [
17]. For these reasons, monitoring the nitrate in the soil vadose zone is important in studies of groundwater contamination [
18] .Furthermore, excess nitrogen that is not absorbed by crops is retained in the vadose zone or leached into the groundwater [
19,
20]. The thickness of the aeration zone changes as the groundwater level changes, which affects soil water and solute transport [
21]. Selecting the optimum nitrogen use and irrigation rate can reduce nitrate nitrogen losses, improve the nitrogen use efficiency and decrease groundwater nitrate pollution on the North China Plain [
22]. Hence, the distribution and transport of nitrate nitrogen based on agricultural irrigation has been studied in South China [
23] and North China [
24].
Various methods have been presented for determining and monitoring nitrate nitrogen concentrations in groundwater to provide guidance for the development of water quality management strategies [
25], identify trends in groundwater nitrate concentrations and prevent further groundwater quality deterioration [
26]. Researchers have suggested that both shallow and deep groundwater chemistry should be monitored and that the recharge areas associated with regional flow systems are extremely vulnerable to nitrate pollution [
27]. Additionally, nitrates accumulate quickly in groundwater, and most nitrates remain in the soil, even after leaching due to large amounts of rain [
28].
The previous studies investigated the problems of nitrate nitrogen contamination in the vadose zone and in the groundwater. Selecting the optimum nitrogen fertilization rates was also investigated. However, the effects of the groundwater fluctuations in the vadose zone on the distribution and amount of nitrate nitrogen were not well addressed. Hence, this paper presents a primary study of the impacts of groundwater level changes on the nitrate nitrogen concentrations in the vadose zone of a cotton field based on a scenario analysis in the Heilonggang Basin, Hebei Province, China. In addition, the following questions concerning the fate of nitrate nitrogen in the vadose zone were addressed: (i) How does the groundwater level affect the accumulation of nitrate nitrogen in the vadose zone? (ii) Do precipitation and the groundwater level at the soil depth of cotton roots affect the amount of nitrate leaching with respect to different irrigation and fertilization levels?
2. Study Area and Data Processing
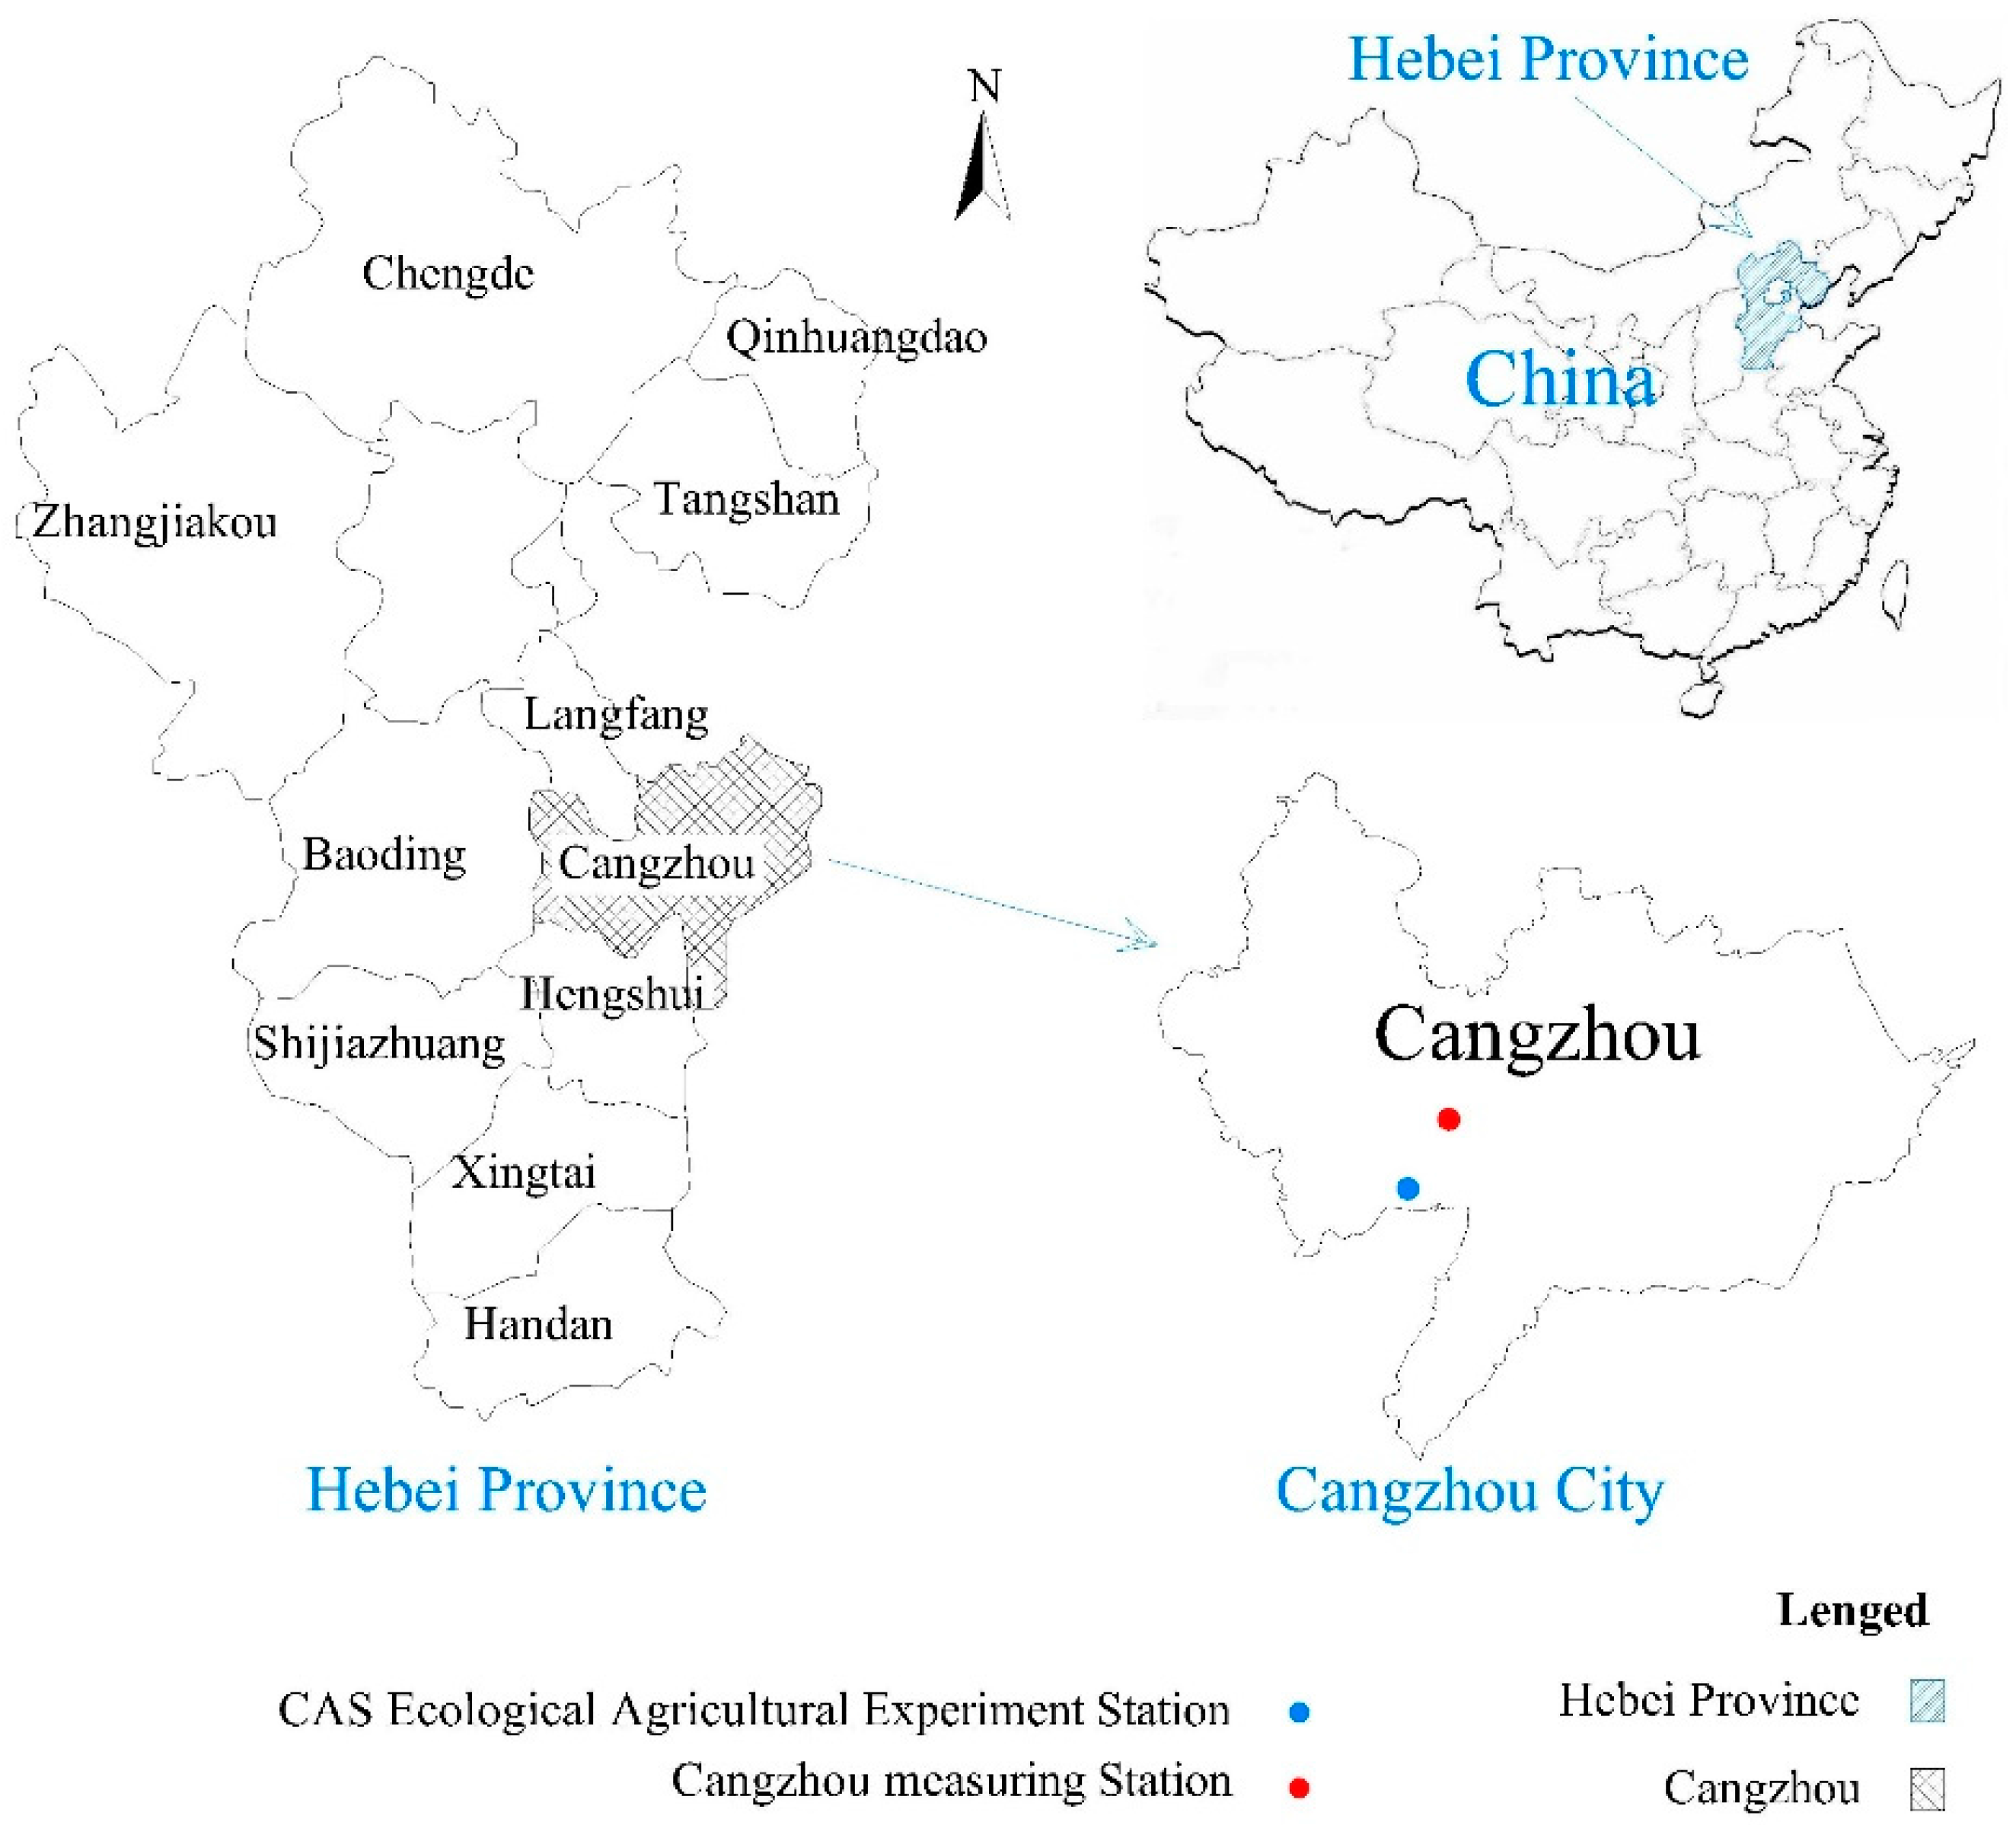
Field studies were conducted at the CAS Ecological Agricultural Experiment Station in the town of Nanpi, Hebei Province, China, at a longitude, latitude and elevation of 116°40′ E, 38°06′ N and 20 m, respectively (
Figure 1). The mean annual evaporation and precipitation at the study site are 1334 mm (E601 evaporator observations) and 567.4 mm, respectively. A field with an area of 319.9 m
2 was planted with cotton in late April and harvested in late October during the three experimental years of 2008, 2009 and 2010. The site contained silt loam soil and had a groundwater depth of approximately 4 m. The volumetric soil water content at field capacity before irrigation ranged from 15.8% to 19.6%, and the average bulk density was 1.40 g·cm
−3 at a soil depth of 1 m (
Table 1).
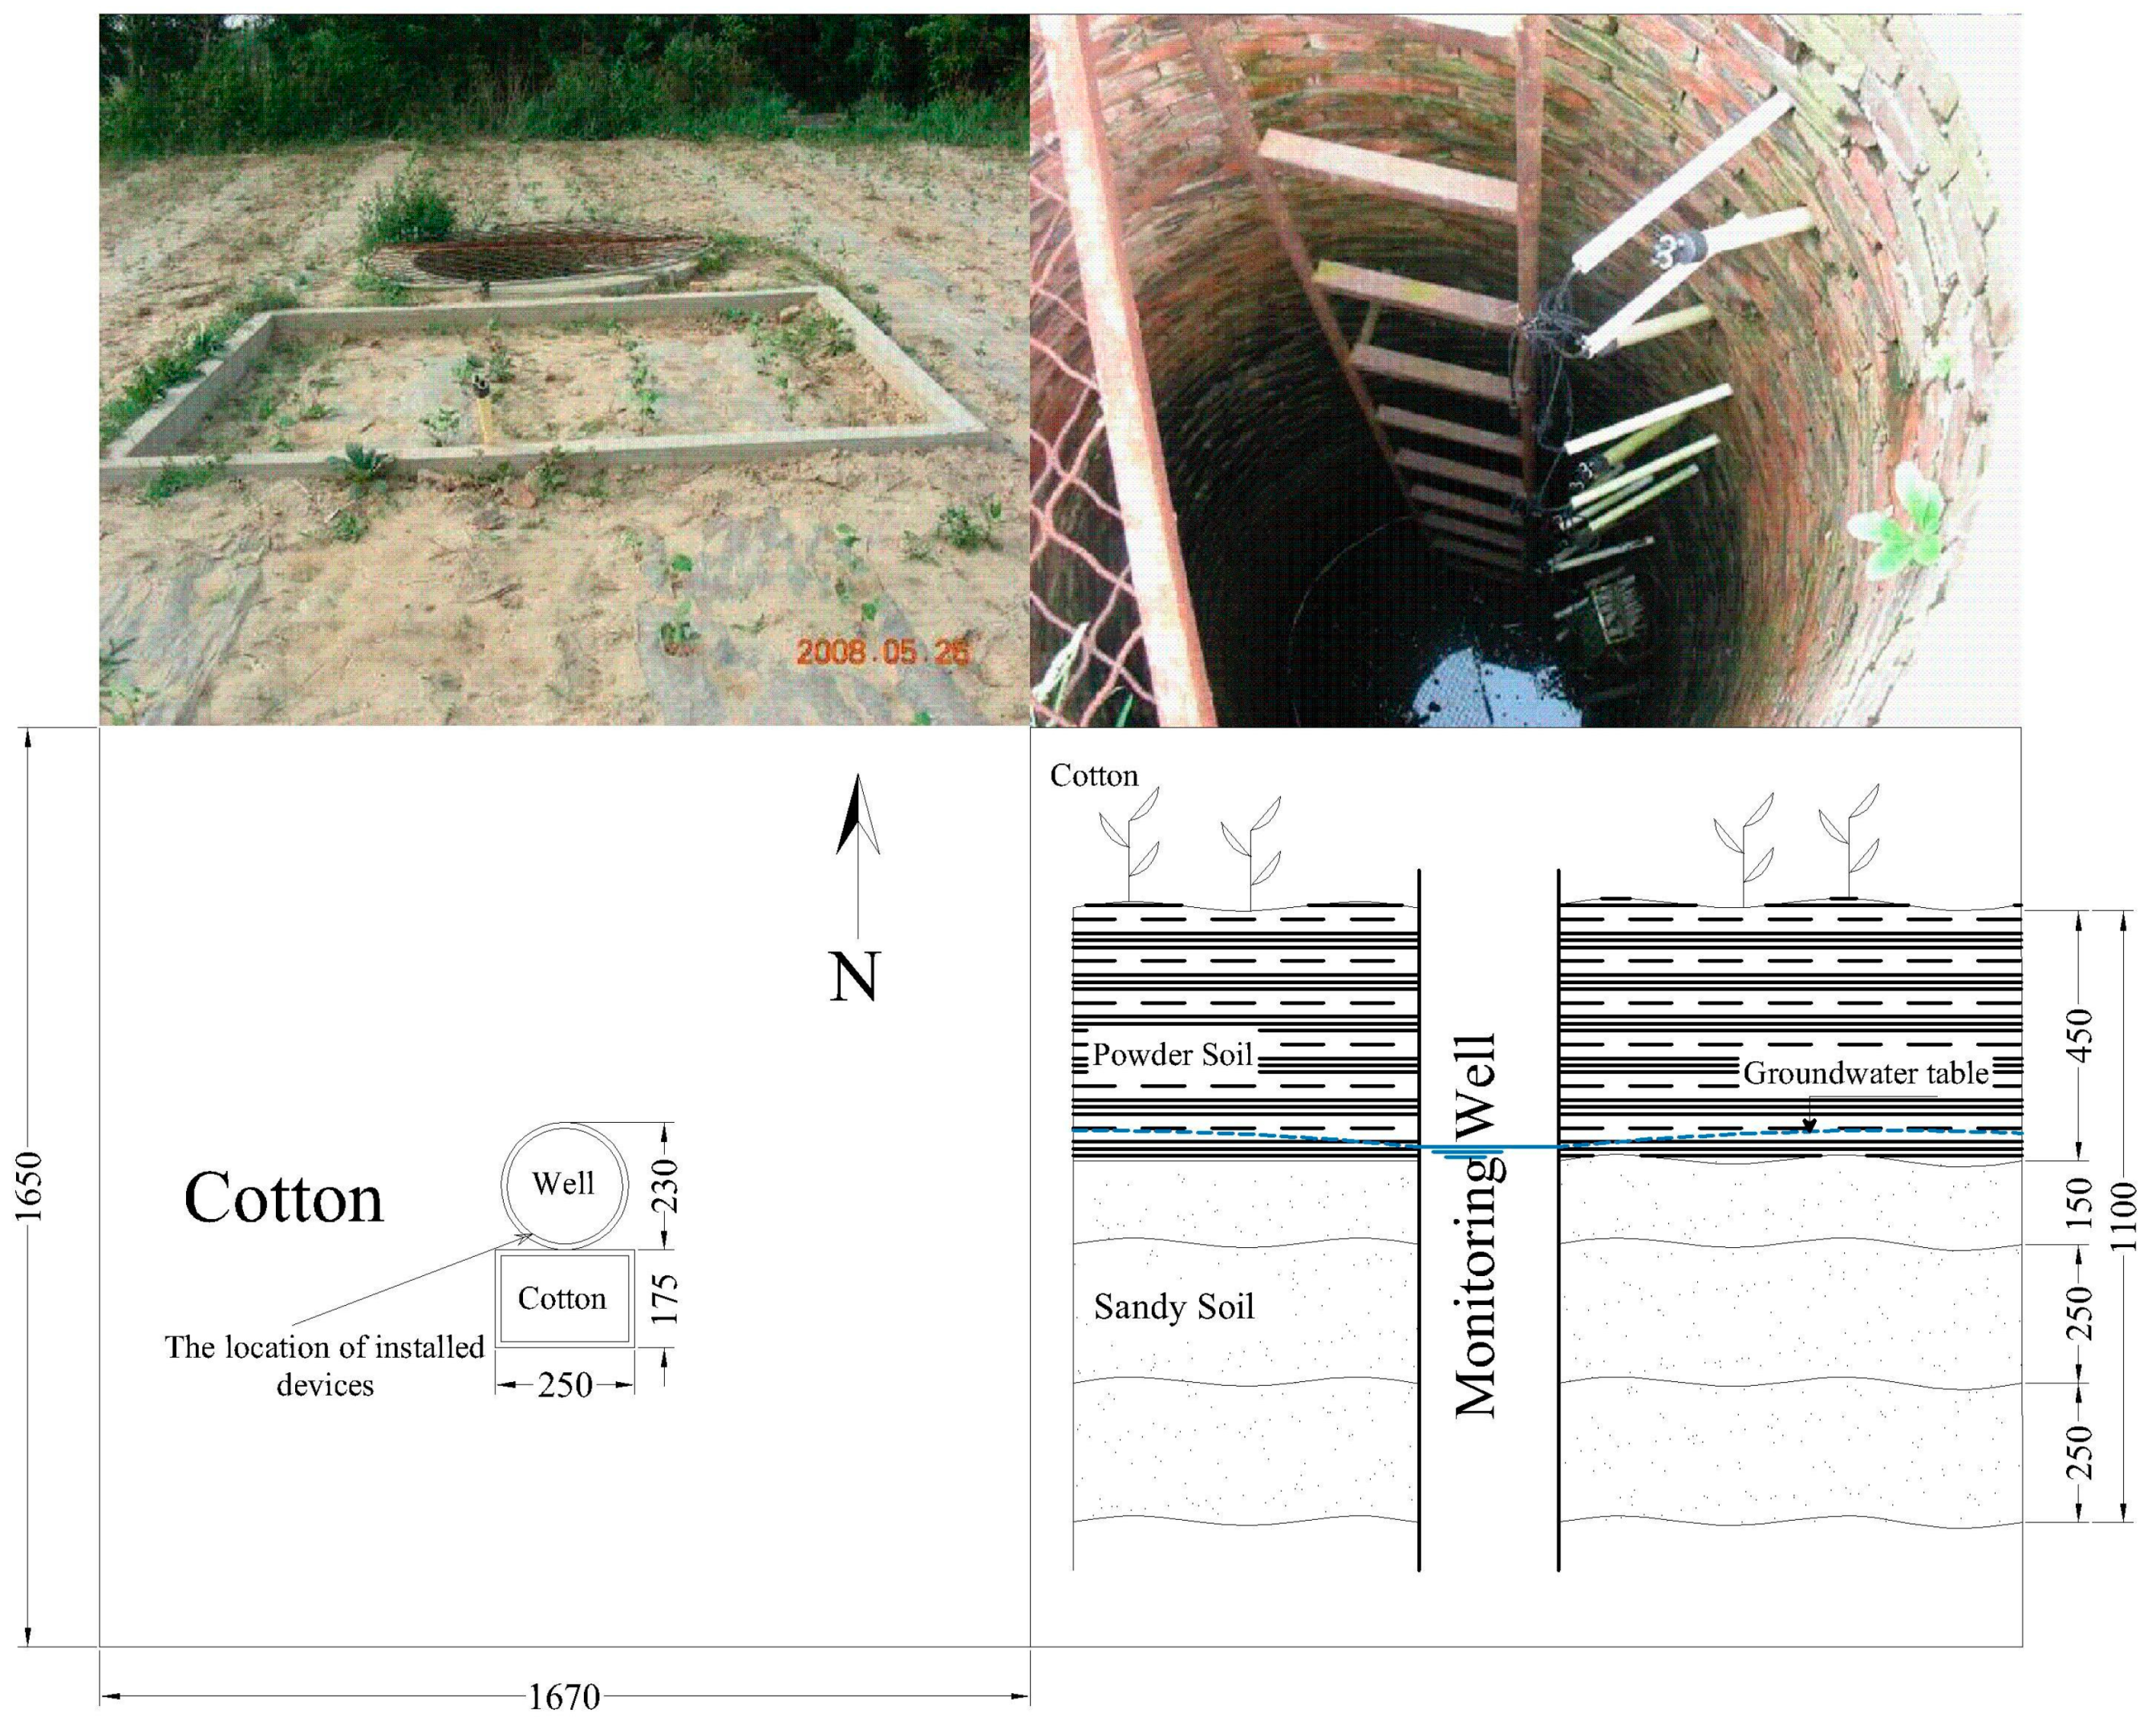
An observation well in the middle of the cotton field was used to monitor groundwater depth, soil water content and solute concentrations. Time-domain reflectometry (TDR) probes and soil solution extractors were installed vertically every 50 cm in the wall of the well to a depth of 5 m (
Figure 2). The soil water content was monitored, and soil solution samples were obtained and analyzed every six days throughout the growing seasons during the three studied years.
3. Methodology
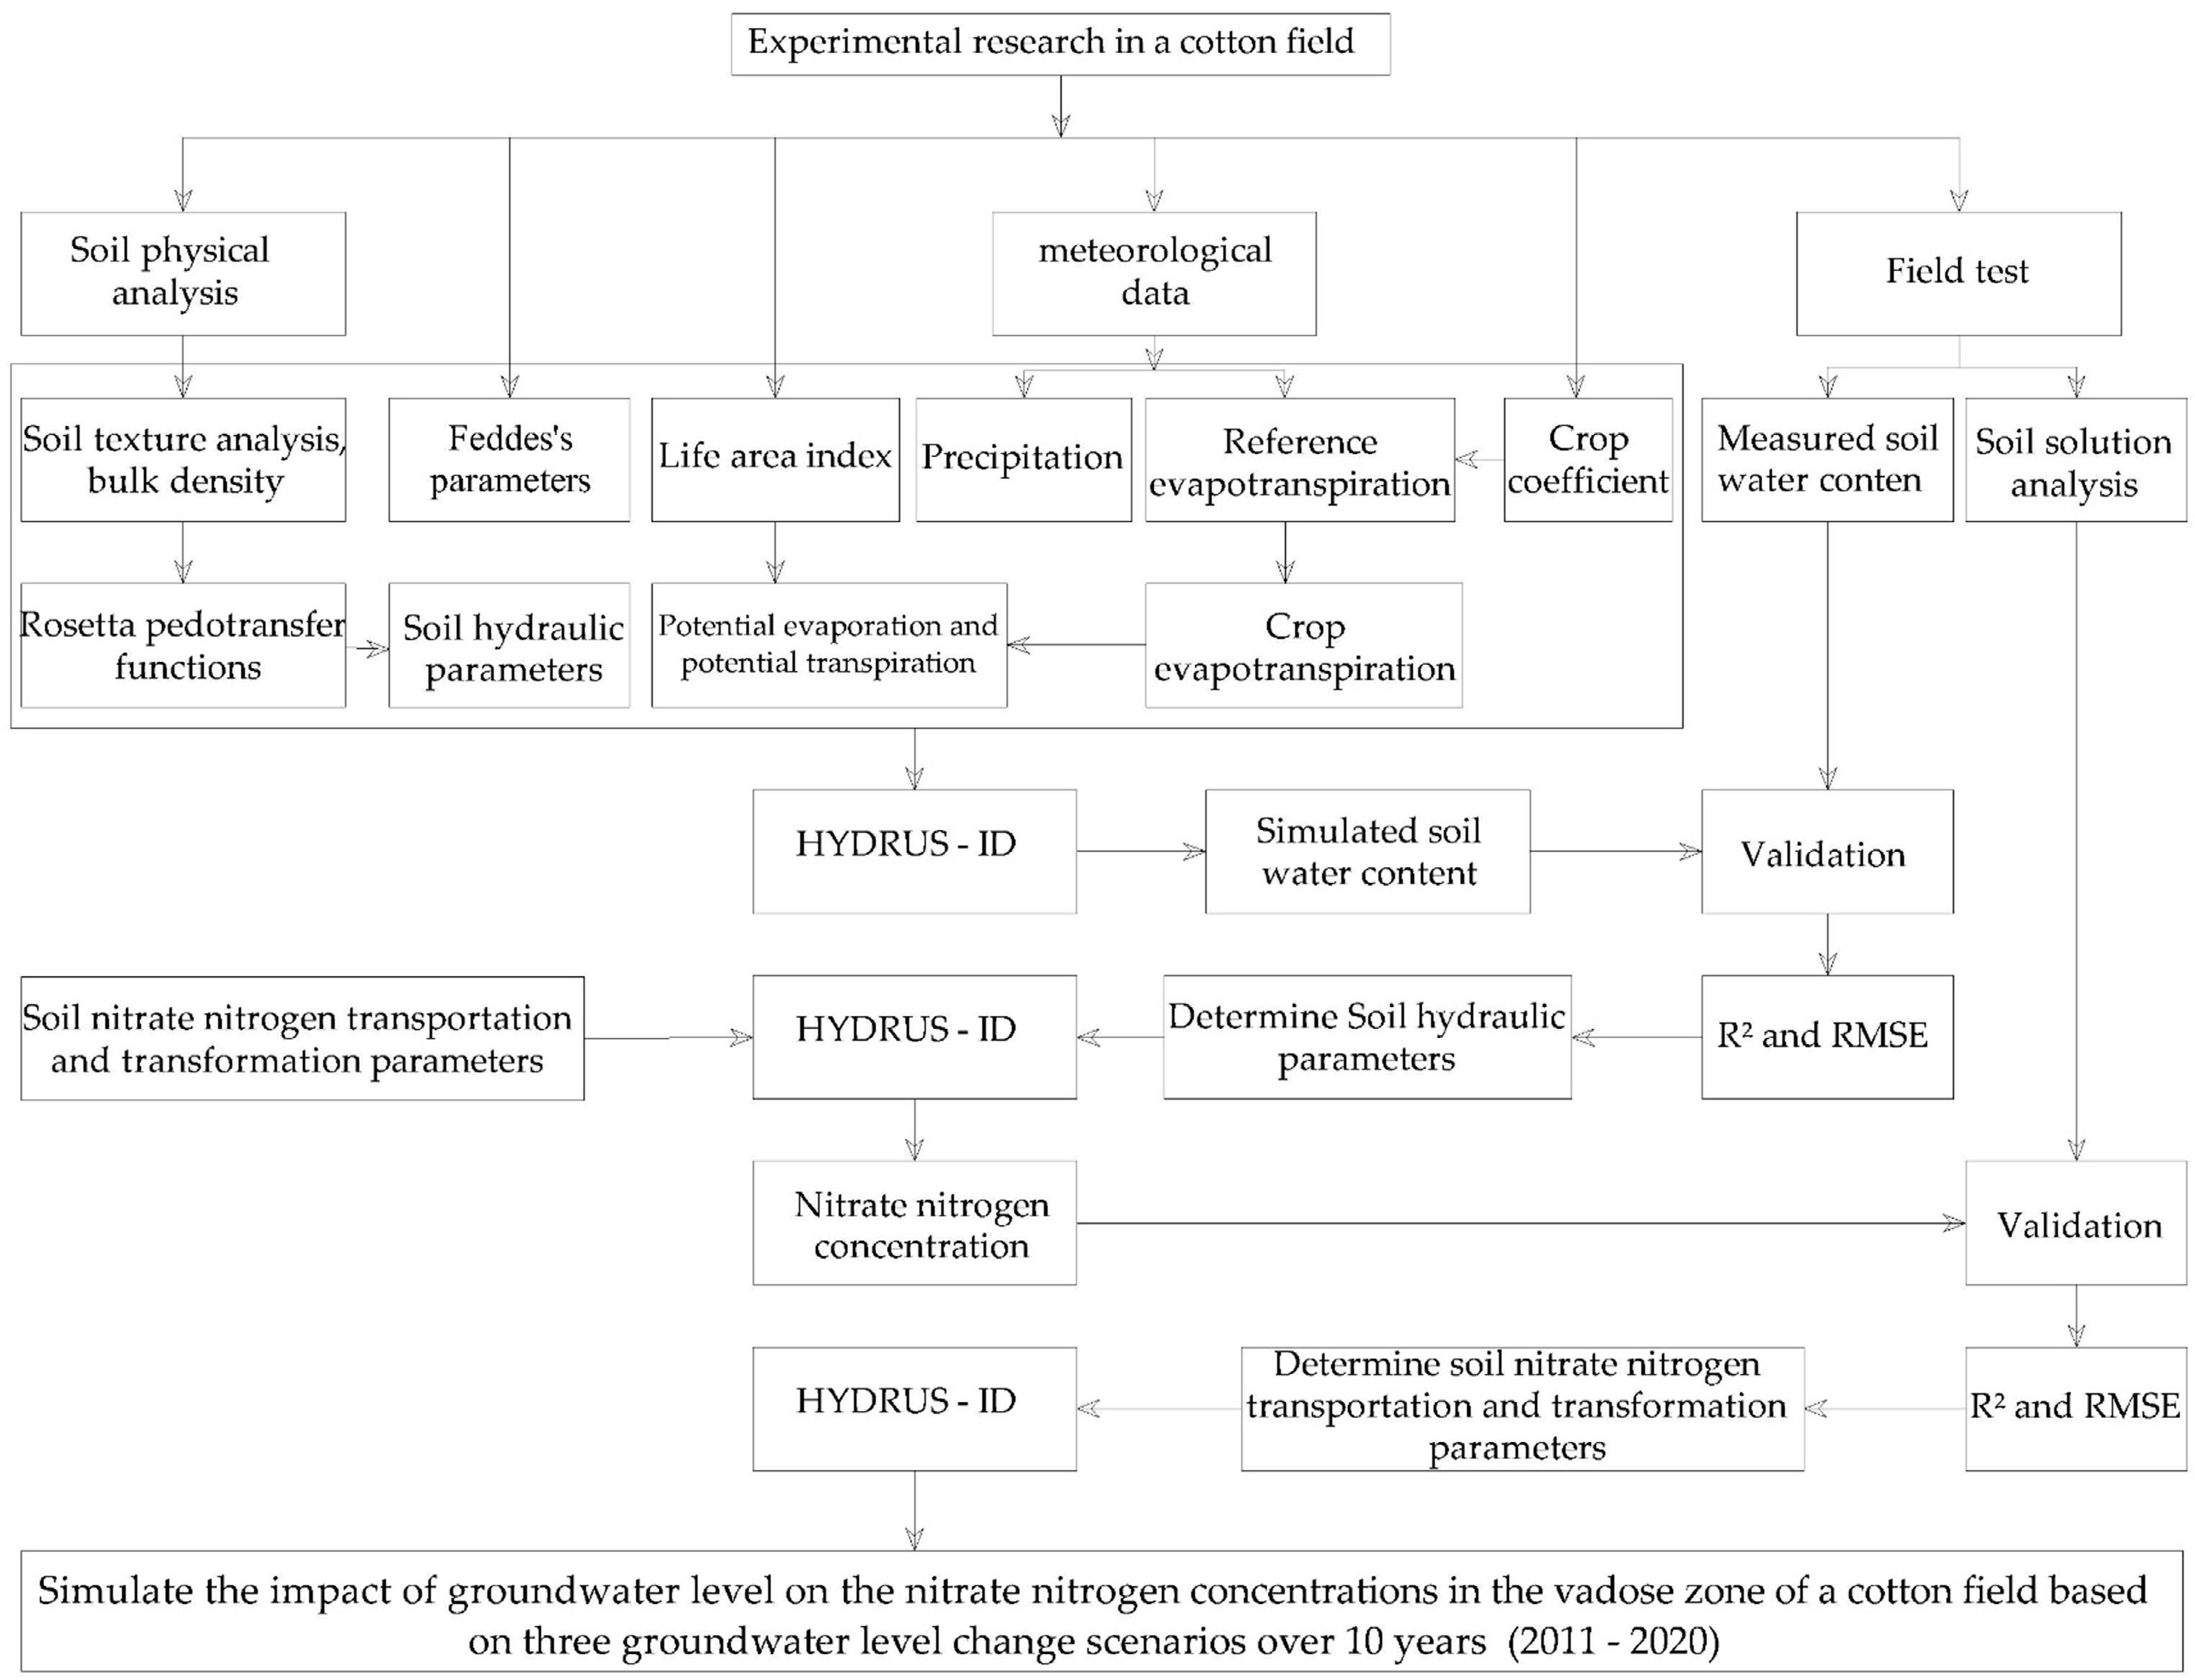
The transport model parameters for soil water and fertilizer were calibrated for three types of groundwater level scenario-based simulations over a projected period of 10 years (2011–2020). The boundary conditions and the accumulation of nitrate nitrogen in the vadose zone simulated conventional tillage to provide a basis for improving the nitrogen use efficiency and reducing groundwater pollution. The complete methodology applied for the present work is shown in the flowchart (
Figure 3).
3.1. The Model and Parameters
The HYDRUS-1D model, developed by the United States Salinity Laboratory, was used in this study. The Richards equation was used to simulate soil water calculations, and the convection–diffusion equation was used for the solute simulation. Many applications indicate that the model can precisely simulate water and nitrogen processes in soil–plant systems involving continuous loops of water and nitrogen use [
29].
The soil–water characteristic curve uses the van Genuchten and Mualem models [
30,
31]:
where
Se is the effective saturation,
n is an empirical constant that affects the shape of the curve,
m = 1 − (1/
n), α is an empirical parameter that is often referred to as the inverse of the air entry point cm
−1,
is the soil water content in cm
3·cm
−3,
is the residual moisture content in cm
3·cm
−3,
is the saturated water content in cm
3·cm
−3, h is the soil water suction head in cm,
K is the unsaturated hydraulic conductivity at a certain water content or pressure head, and
Ks is the saturated hydraulic conductivity.
The van Genuchten parameters and the saturated hydraulic conductivity were obtained via Rosetta pedotransfer functions (PTFs) [
32] using the particle size distribution and bulk density datasets in the HYDRUS-1D model. The best parameter values (
Ks,
,
, α and
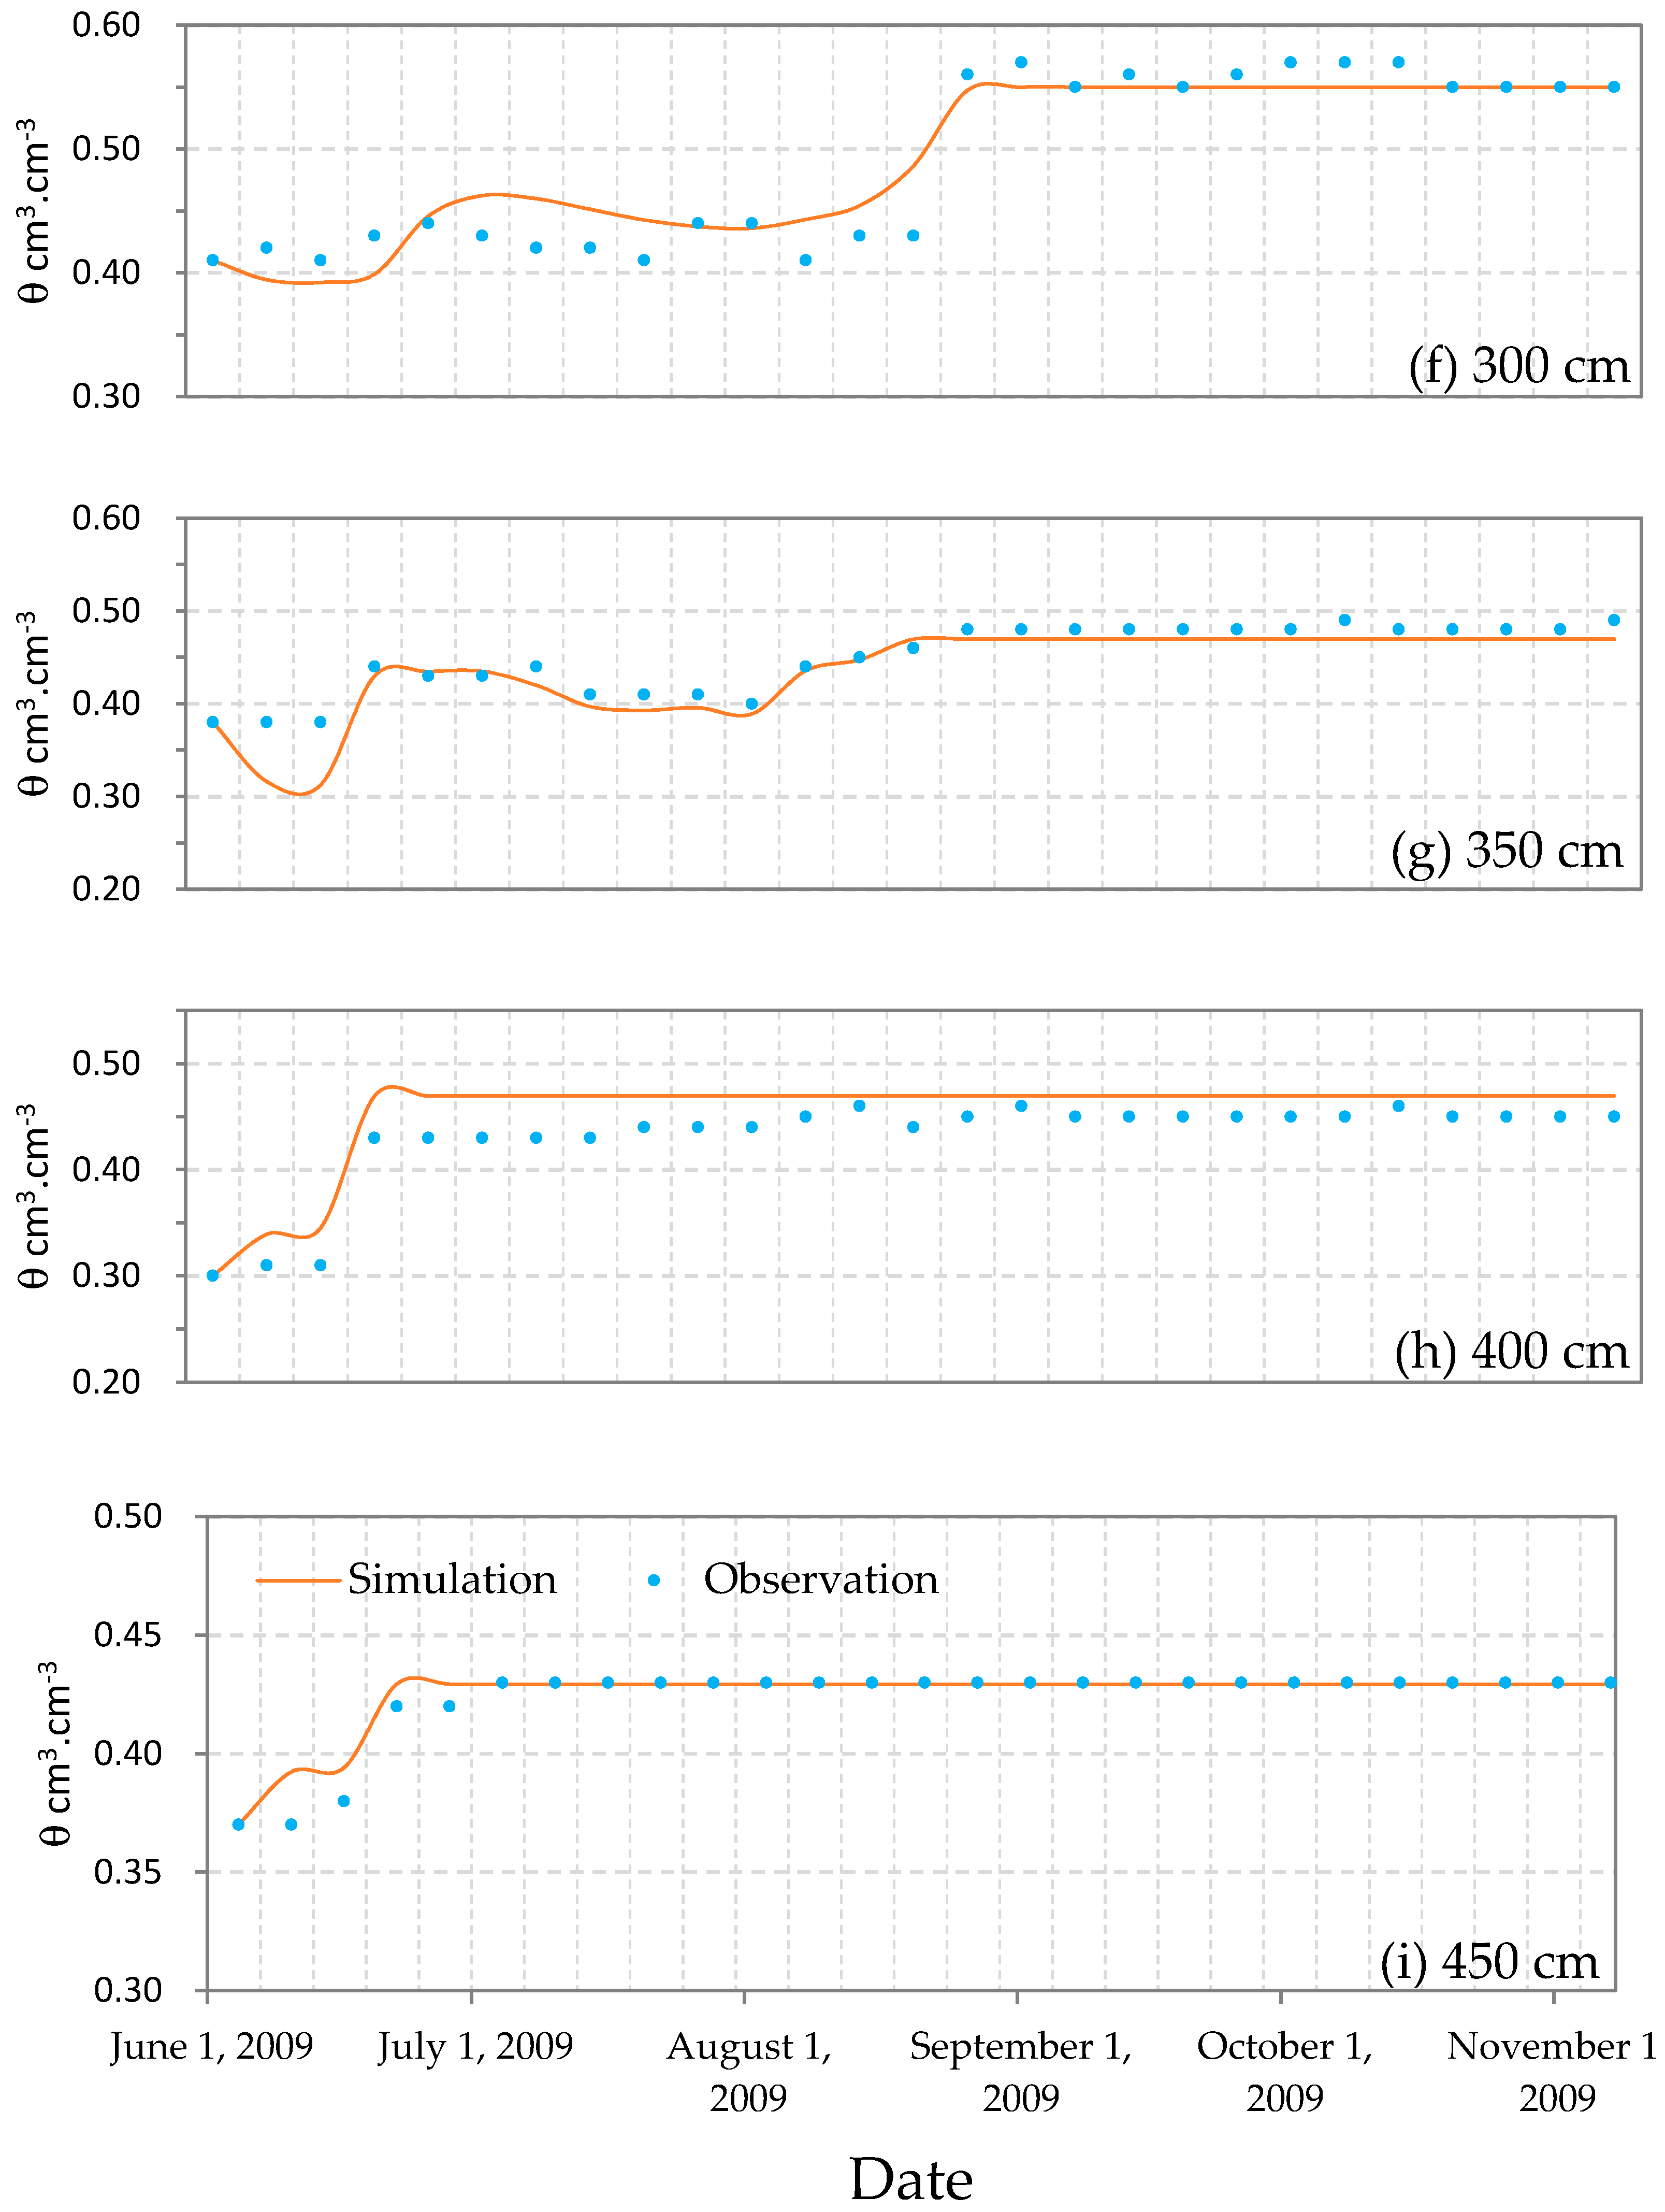
n) were obtained using inverse simulations after several iterations until the maximum change between observed and simulated soil water content was less than a specified tolerance.
The agreement between the observed and simulated data was evaluated using the coefficient of determination (
R2) and root mean standard error (RMSE):
where
Pi represents the predicted values,
Oi represents the observed values,
Oave is the mean value of all observed events and
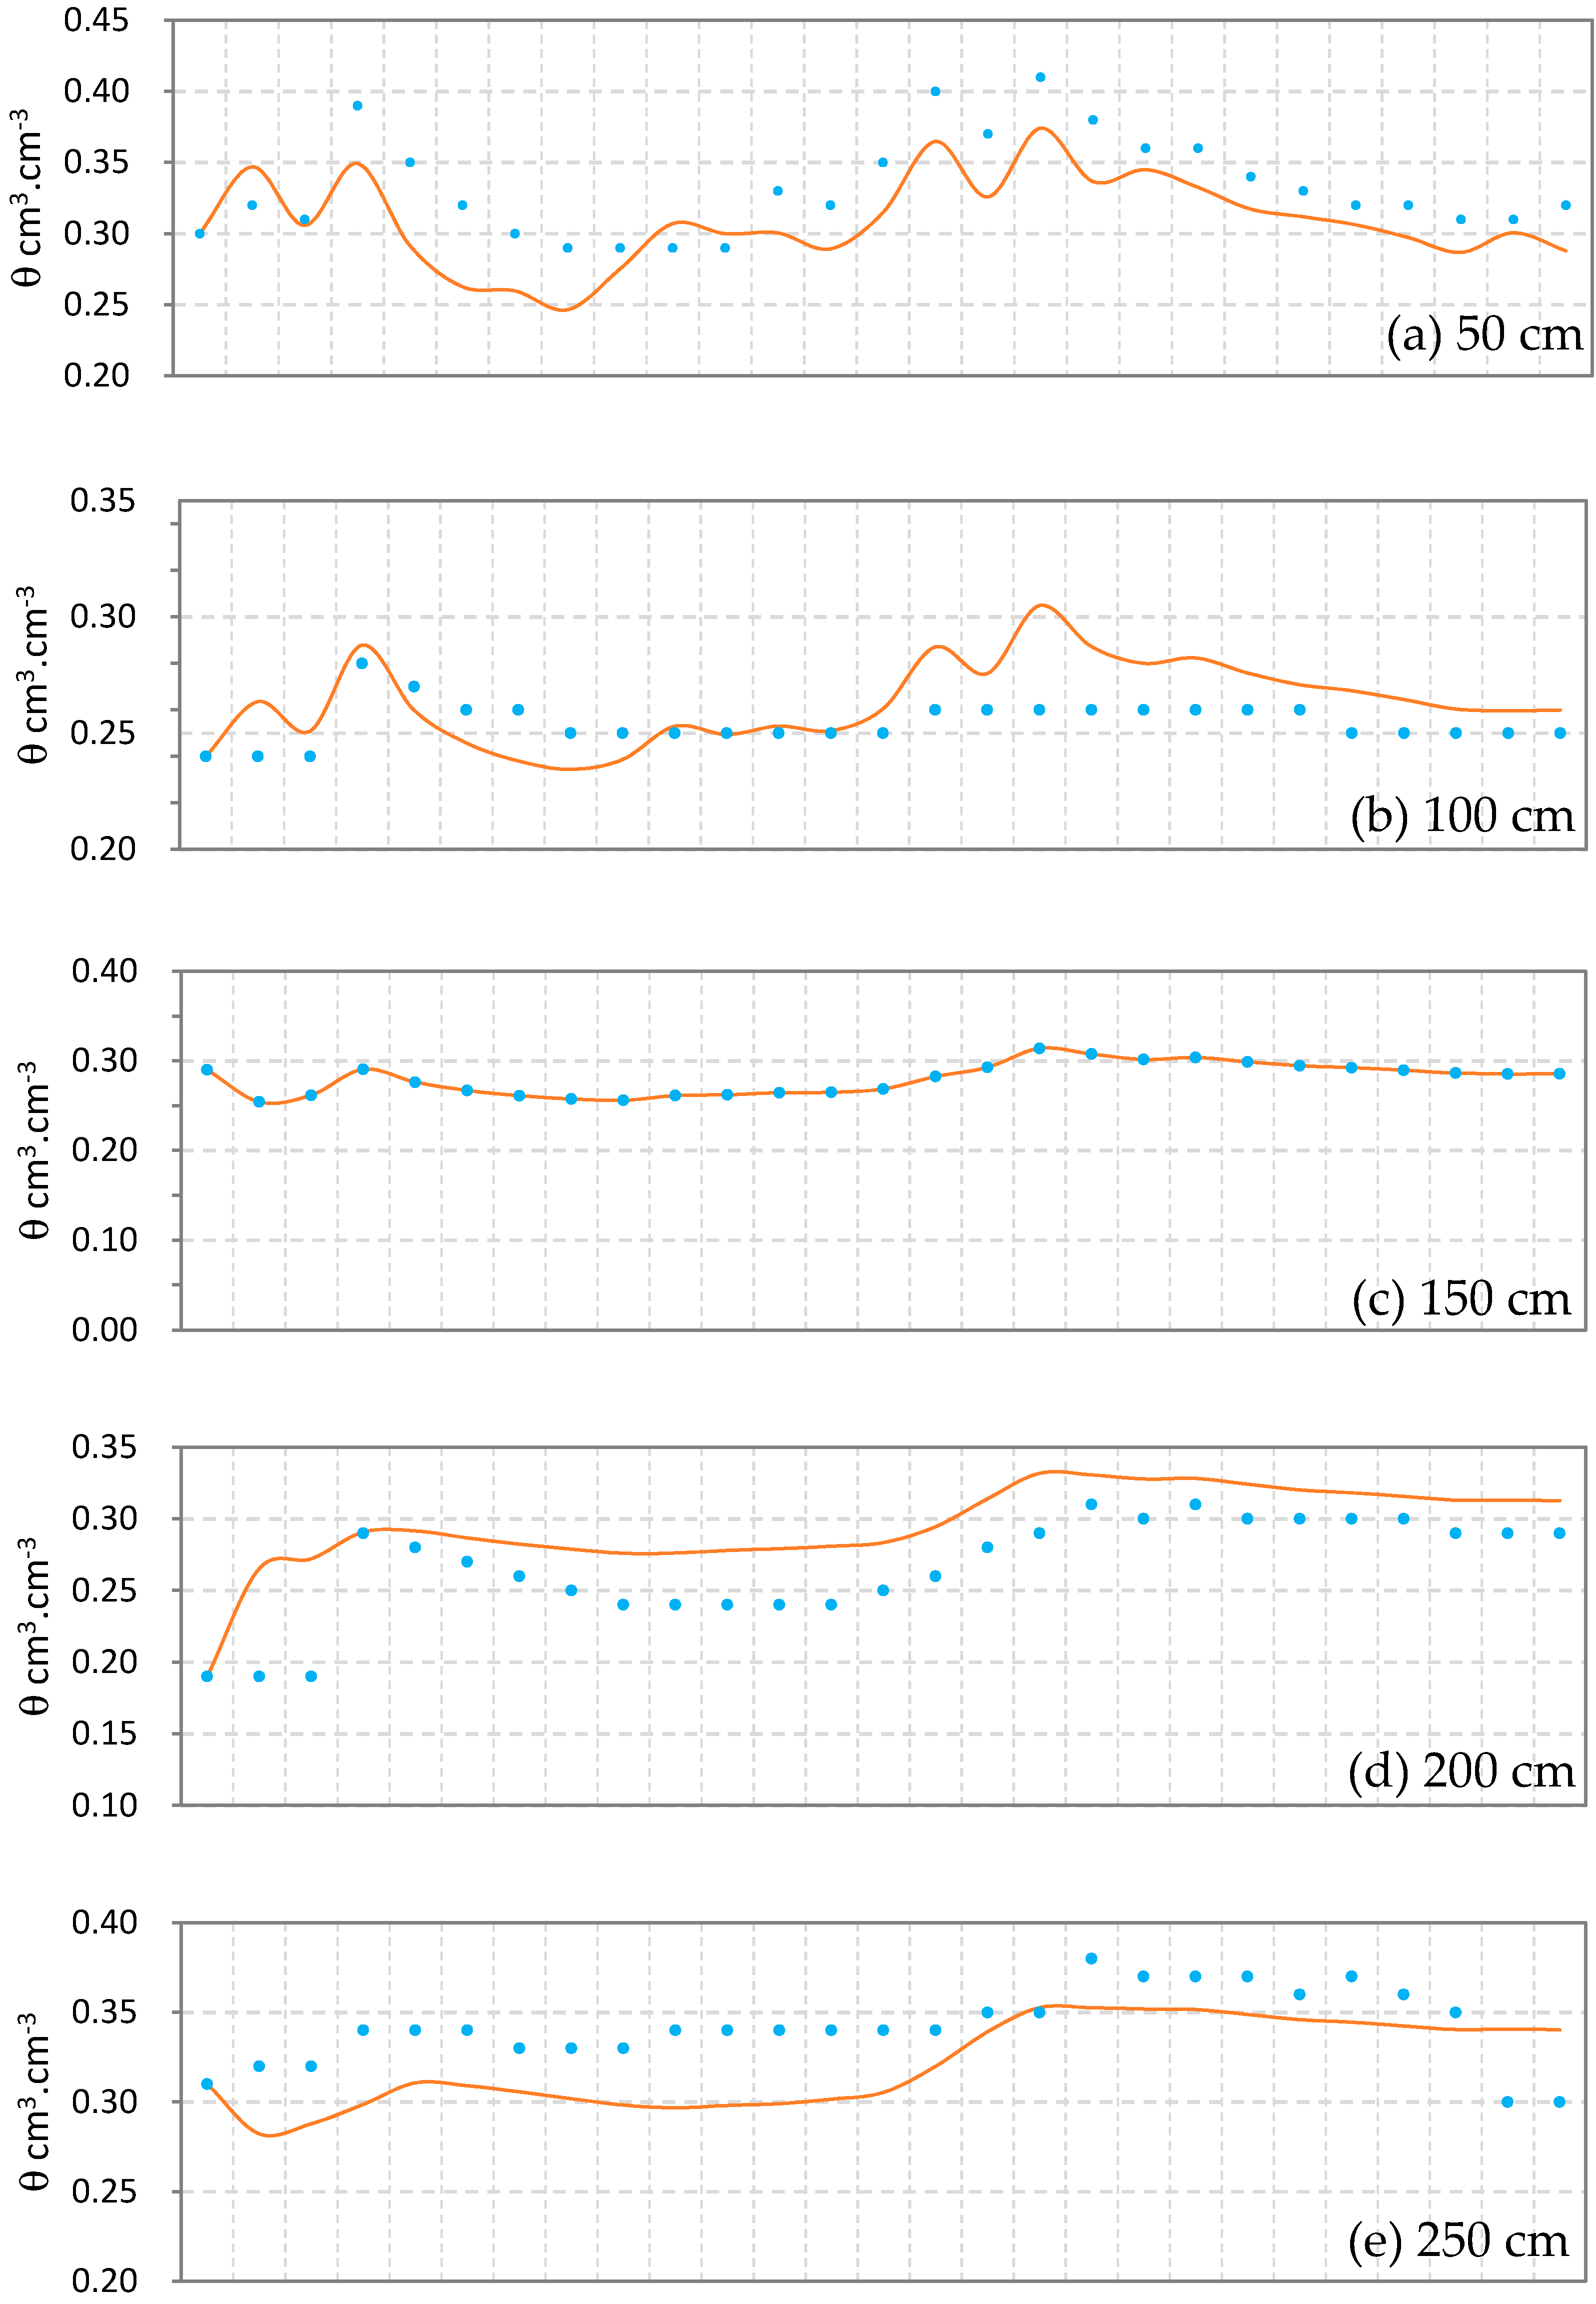
N is the number of observations. The
R2 and RMSE values were 0.91 and 0.026 cm
3·cm
−3, respectively, which indicates that the accuracy of the model simulation was acceptable (
Figure 4). The resulting parameter values from June to November 2009 are shown in
Table 2.
The ammonium nitrogen that formed after the field was fertilized was assumed to rapidly transform into nitrate. Immobilization, denitrification and mineralization were all calculated according to a first-order kinetics model, which is simple chemical non-equilibrium model that assumes sorption is a kinetic process implemented into HYDRUS-1D [
33,
34,
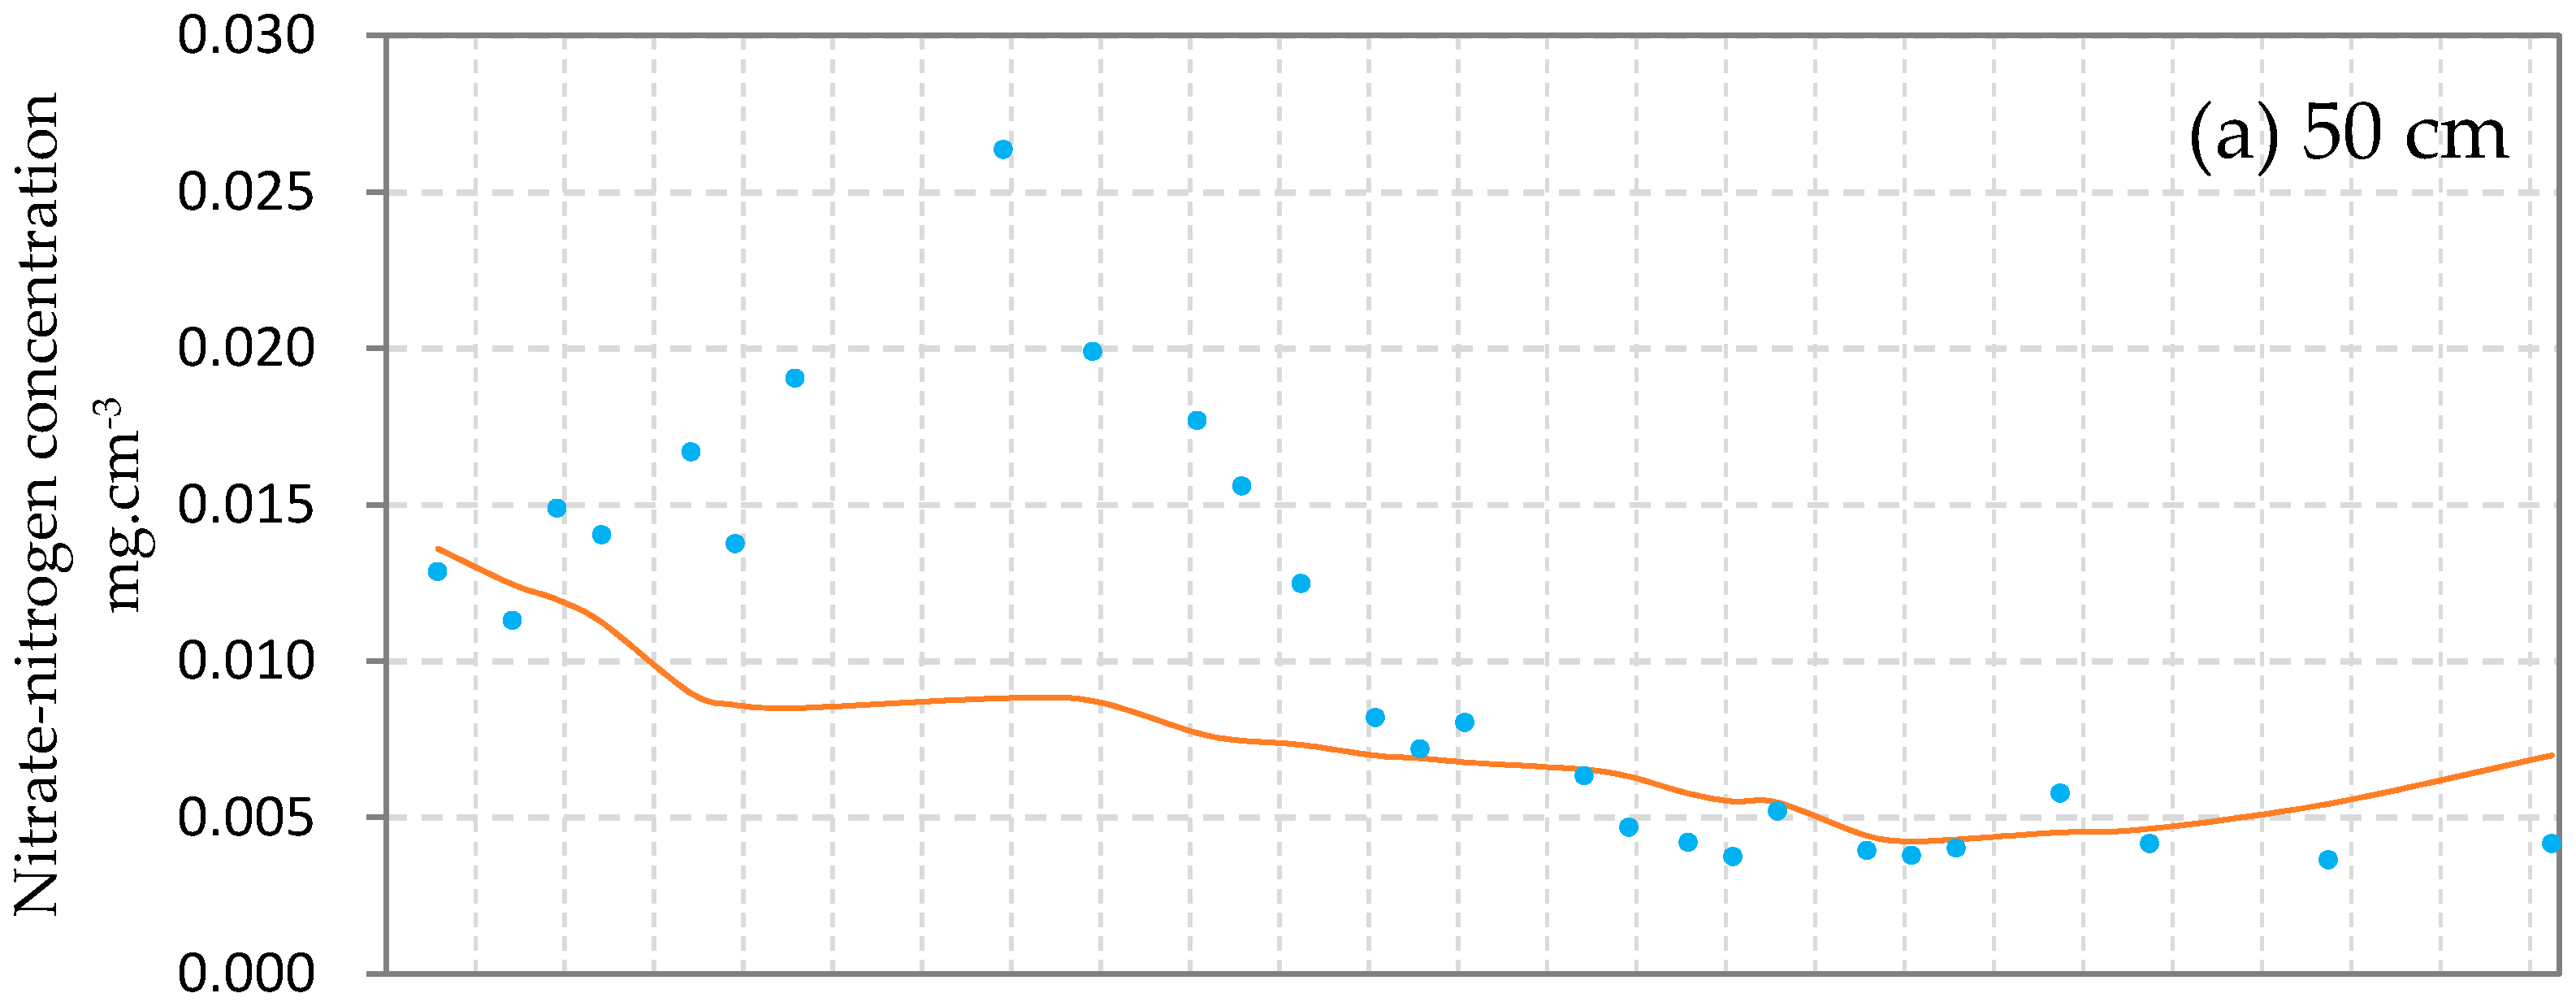
35].
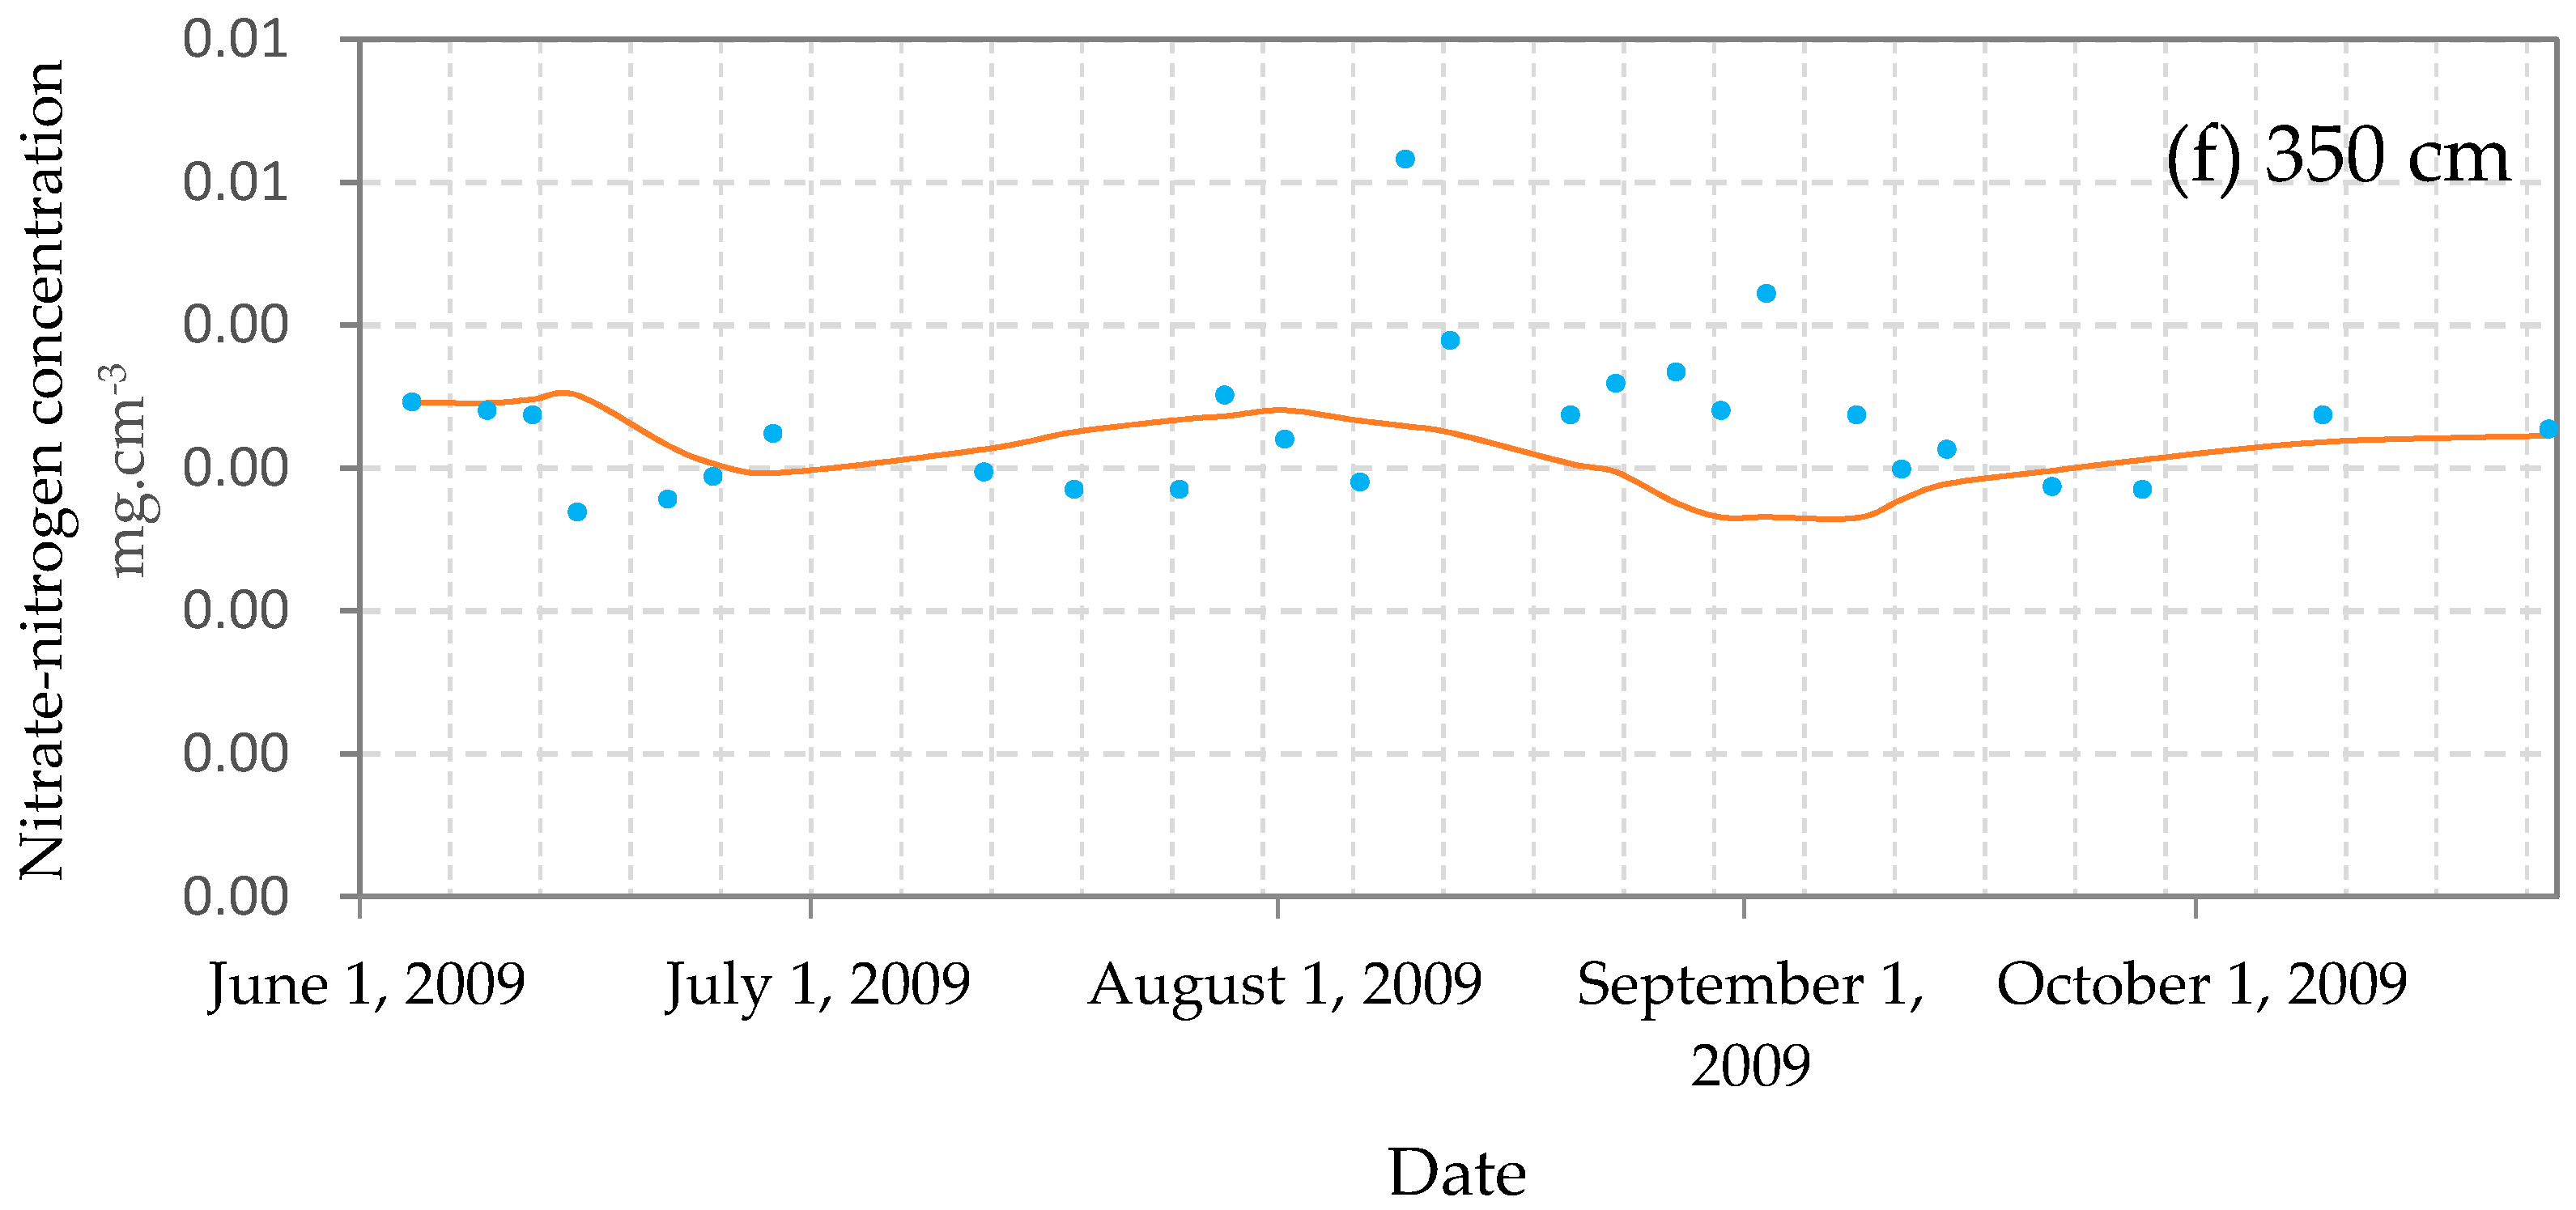
Table 3 shows the results based on data from 4 June to 12 November 2009, the inverse nitrate nitrogen transport calculation results and the transformation parameters in different soil layers. The
R2 and RMSE values of the nitrate nitrogen concentration were 0.70 and 0.0078 mg·cm
−3, respectively (
Figure 5).
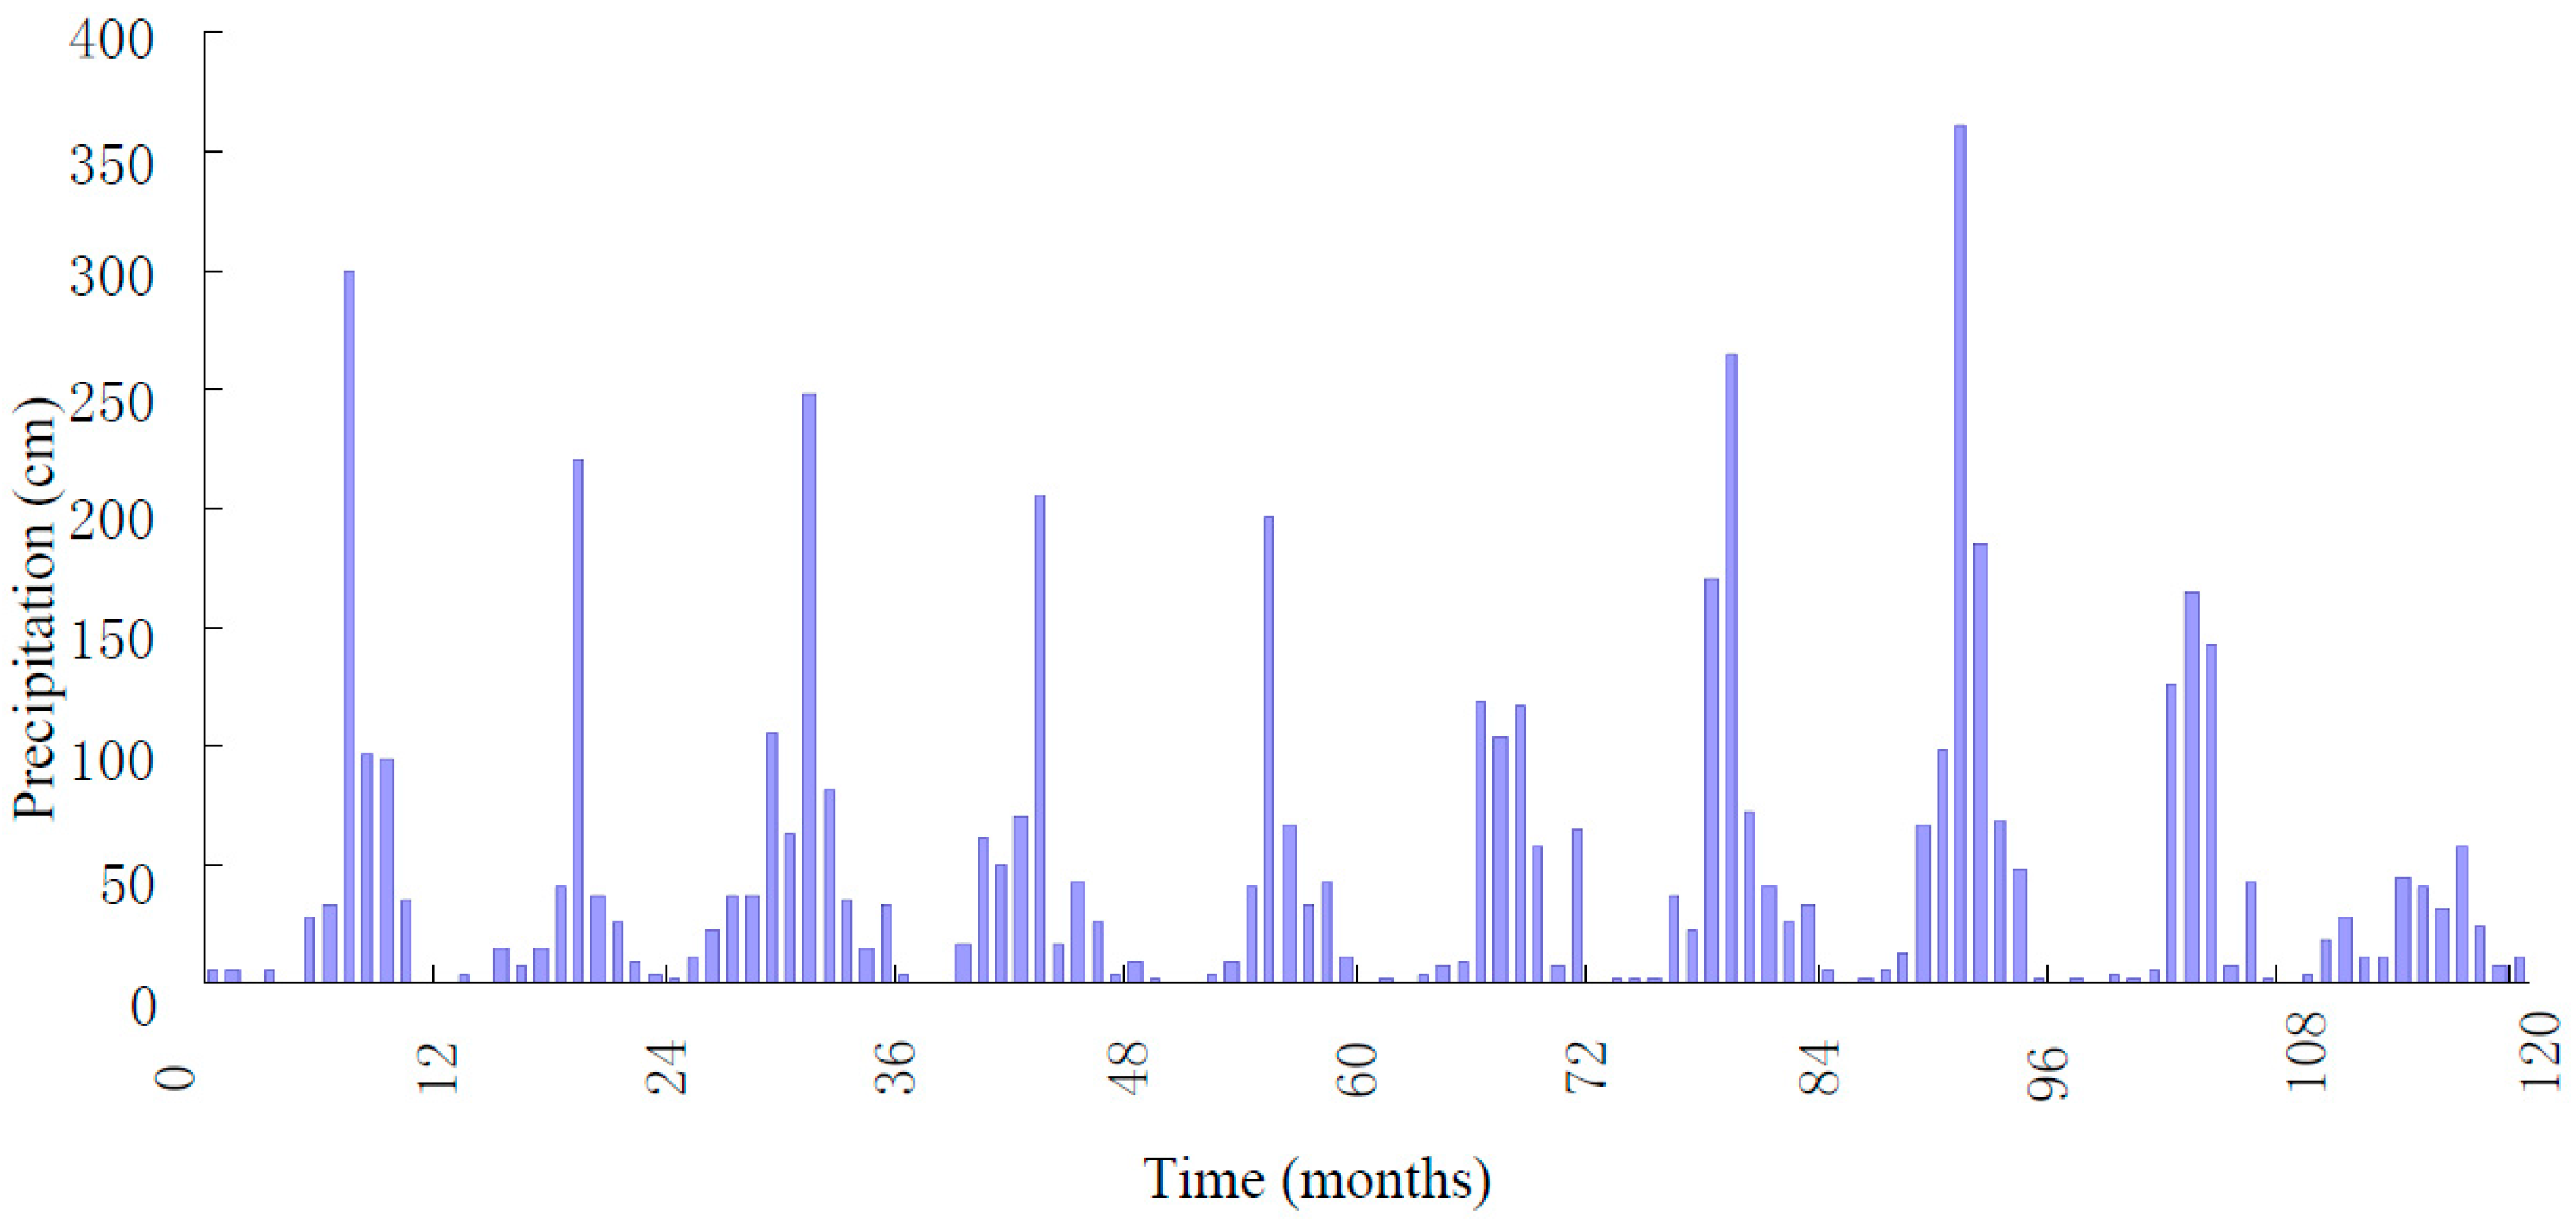
3.2. Precipitation
The yearly average precipitation in the experimental area is 567.4 mm. Rainfall generally occurs during the summer, with 73%, 11%, 13% and 3% of the annual precipitation occurring in the summer, spring, autumn and winter, respectively. Precipitation data for this region are available from the Changzhuang measuring station located near the experimental site (116°51′ E, 38°21′ N) (
Figure 1) for 55 years from 1954 to 2008. Precipitation data from 1988 to 1997 were considered a typical ten-year series for a statistical parameter stability analysis of the coefficient of variation (Cv) and skewness (Cs). The results are shown in
Figure 6.
3.3. Irrigation and Fertilization
A cultivated cotton crop was analyzed in this study. Flood irrigation was conducted one week before seeding each growing season. The total amount of irrigation water applied outside of the growing season was 750 m3·hm−2; the traditional amount of basal fertilizer applied during common farming practices in the study area was 750 kg·hm−2; and the N, P and K contents were all 15%. The basal fertilizer was directly applied in the field before sowing each growing season. In general, the rate of N loss ranged from 20% to 25% and was considered 25% in this study.
The soil water retention of the field in the crop root zone was 0.342 cm3·cm−3. Additionally, the water holding capacity of the field was 65% and was considered the soil water content of the lower limit of the cotton root zone and used to formulate the crop irrigation system.
3.4. Evapotranspiration and Bare Soil Evaporation
Crop evapotranspiration is equal to the crop coefficient multiplied by the reference evapotranspiration (RET). It is difficult to measure RET directly; in most cases, RET is estimated using meteorological records. The most reliable method for diverse climates is the FAO56 Penman–Monteith (PM) method because it is physically based and explicitly incorporates both physiological and aerodynamic parameters [
36]. The PM method requires sunshine duration, temperature, humidity and wind speed data and can be given in the following form [
37]:
where RET is the reference evapotranspiration (mm·day
−1),
Rn is the net radiation at the crop surface (MJ·m
−2·day
−1),
G is the soil heat flux density (MJ·m
−2·day
−1),
T is the mean daily air temperature (°C),
u2 is the mean daily wind speed at 2 m above the ground level (m·s
−1),
es is the saturation vapor pressure (kPa),
ea is the actual vapor pressure (kPa),
es −
ea is the saturation vapor pressure deficit (kPa), Δ is the slope of the saturated vapor pressure in relation to the air temperature (kPa·°C
−1), γ is a psychrometric constant (kPa·°C
−1), ET is the actual crop evapotranspiration (mm·day
−1) and
Kc is the crop coefficient. The crop coefficient values were estimated using the observed weighing lysimeter data. Detailed descriptions of the functions, structures, and principles were provided by Yang et al. [
38].
Table 4 shows the crop coefficient values.
Then, ET was divided into potential evaporation (
Ep) and potential transpiration (
Tp) [
39]:
where
LAI (Leaf area index) is defined as the ratio of the leaf area to land area in units of cm
2·cm
−2. The
LAI was calculated by summing the leaf area per plant (measured using an AM300 area meter) and multiplying that total by an empirical factor of 0.74 [
40] and the total number of plants (24 rows × 56 plants per row). This value was then divided by the total planted area (319.9 m
2) (
Table 5).
The Feddes model was used to estimate the water uptake function of the root system. The parameter values of the Feddes model for the root system growth process obtained from Li [
41] are shown in
Table 6.
The bare soil evaporation according to the modified Penman equation [
43] is given as follows:
where
is the air density (kg·m
−3),
Cp is the specific heat capacity of air (MJ·m
−2·day
−1), λ is the latent heat of vaporization of water (MJ·kg
−1), γ is
C/λ, β is the soil water function or efficiency of evaporation, θ is the volume of the surface soil water, θ
fc is the field soil water retention rate and θ
m is single molecule suction (pF 6.0–7.0), which corresponds to the soil volumetric water content [
44].
3.5. Groundwater Level Change Scenarios
The groundwater depth increases and decreases from 4 m at a uniform rate, and the monthly fluctuations from 1988 to 1997 based on the data measured at the Changzhuang measuring station were applied in the model. Three model test scenarios with different groundwater levels were selected for a comparative model analysis. In Scenario 1, the groundwater level decreased from 4 to 1.5 m; in Scenario 2, the groundwater level remained stable; and, in Scenario 3, the groundwater level increased from 4 to 10 m.
The nitrate nitrogen content at the groundwater interface was assumed negligible because it was low (1.29, 0.71, and 1.03 mg·L−1 at three different times during the experiment).
4. Results and Discussion
The soil water content and nitrate nitrogen concentrations were analyzed every 50 cm in the vadose zone, ranging from 0 to 4 m, on 1 January 2011. The results obtained from this analysis were used as the initial conditions to simulate soil water and nitrate nitrogen transport.
4.1. The Dynamic Responses of Moisture and Nitrate Nitrogen in the Vadose Zone
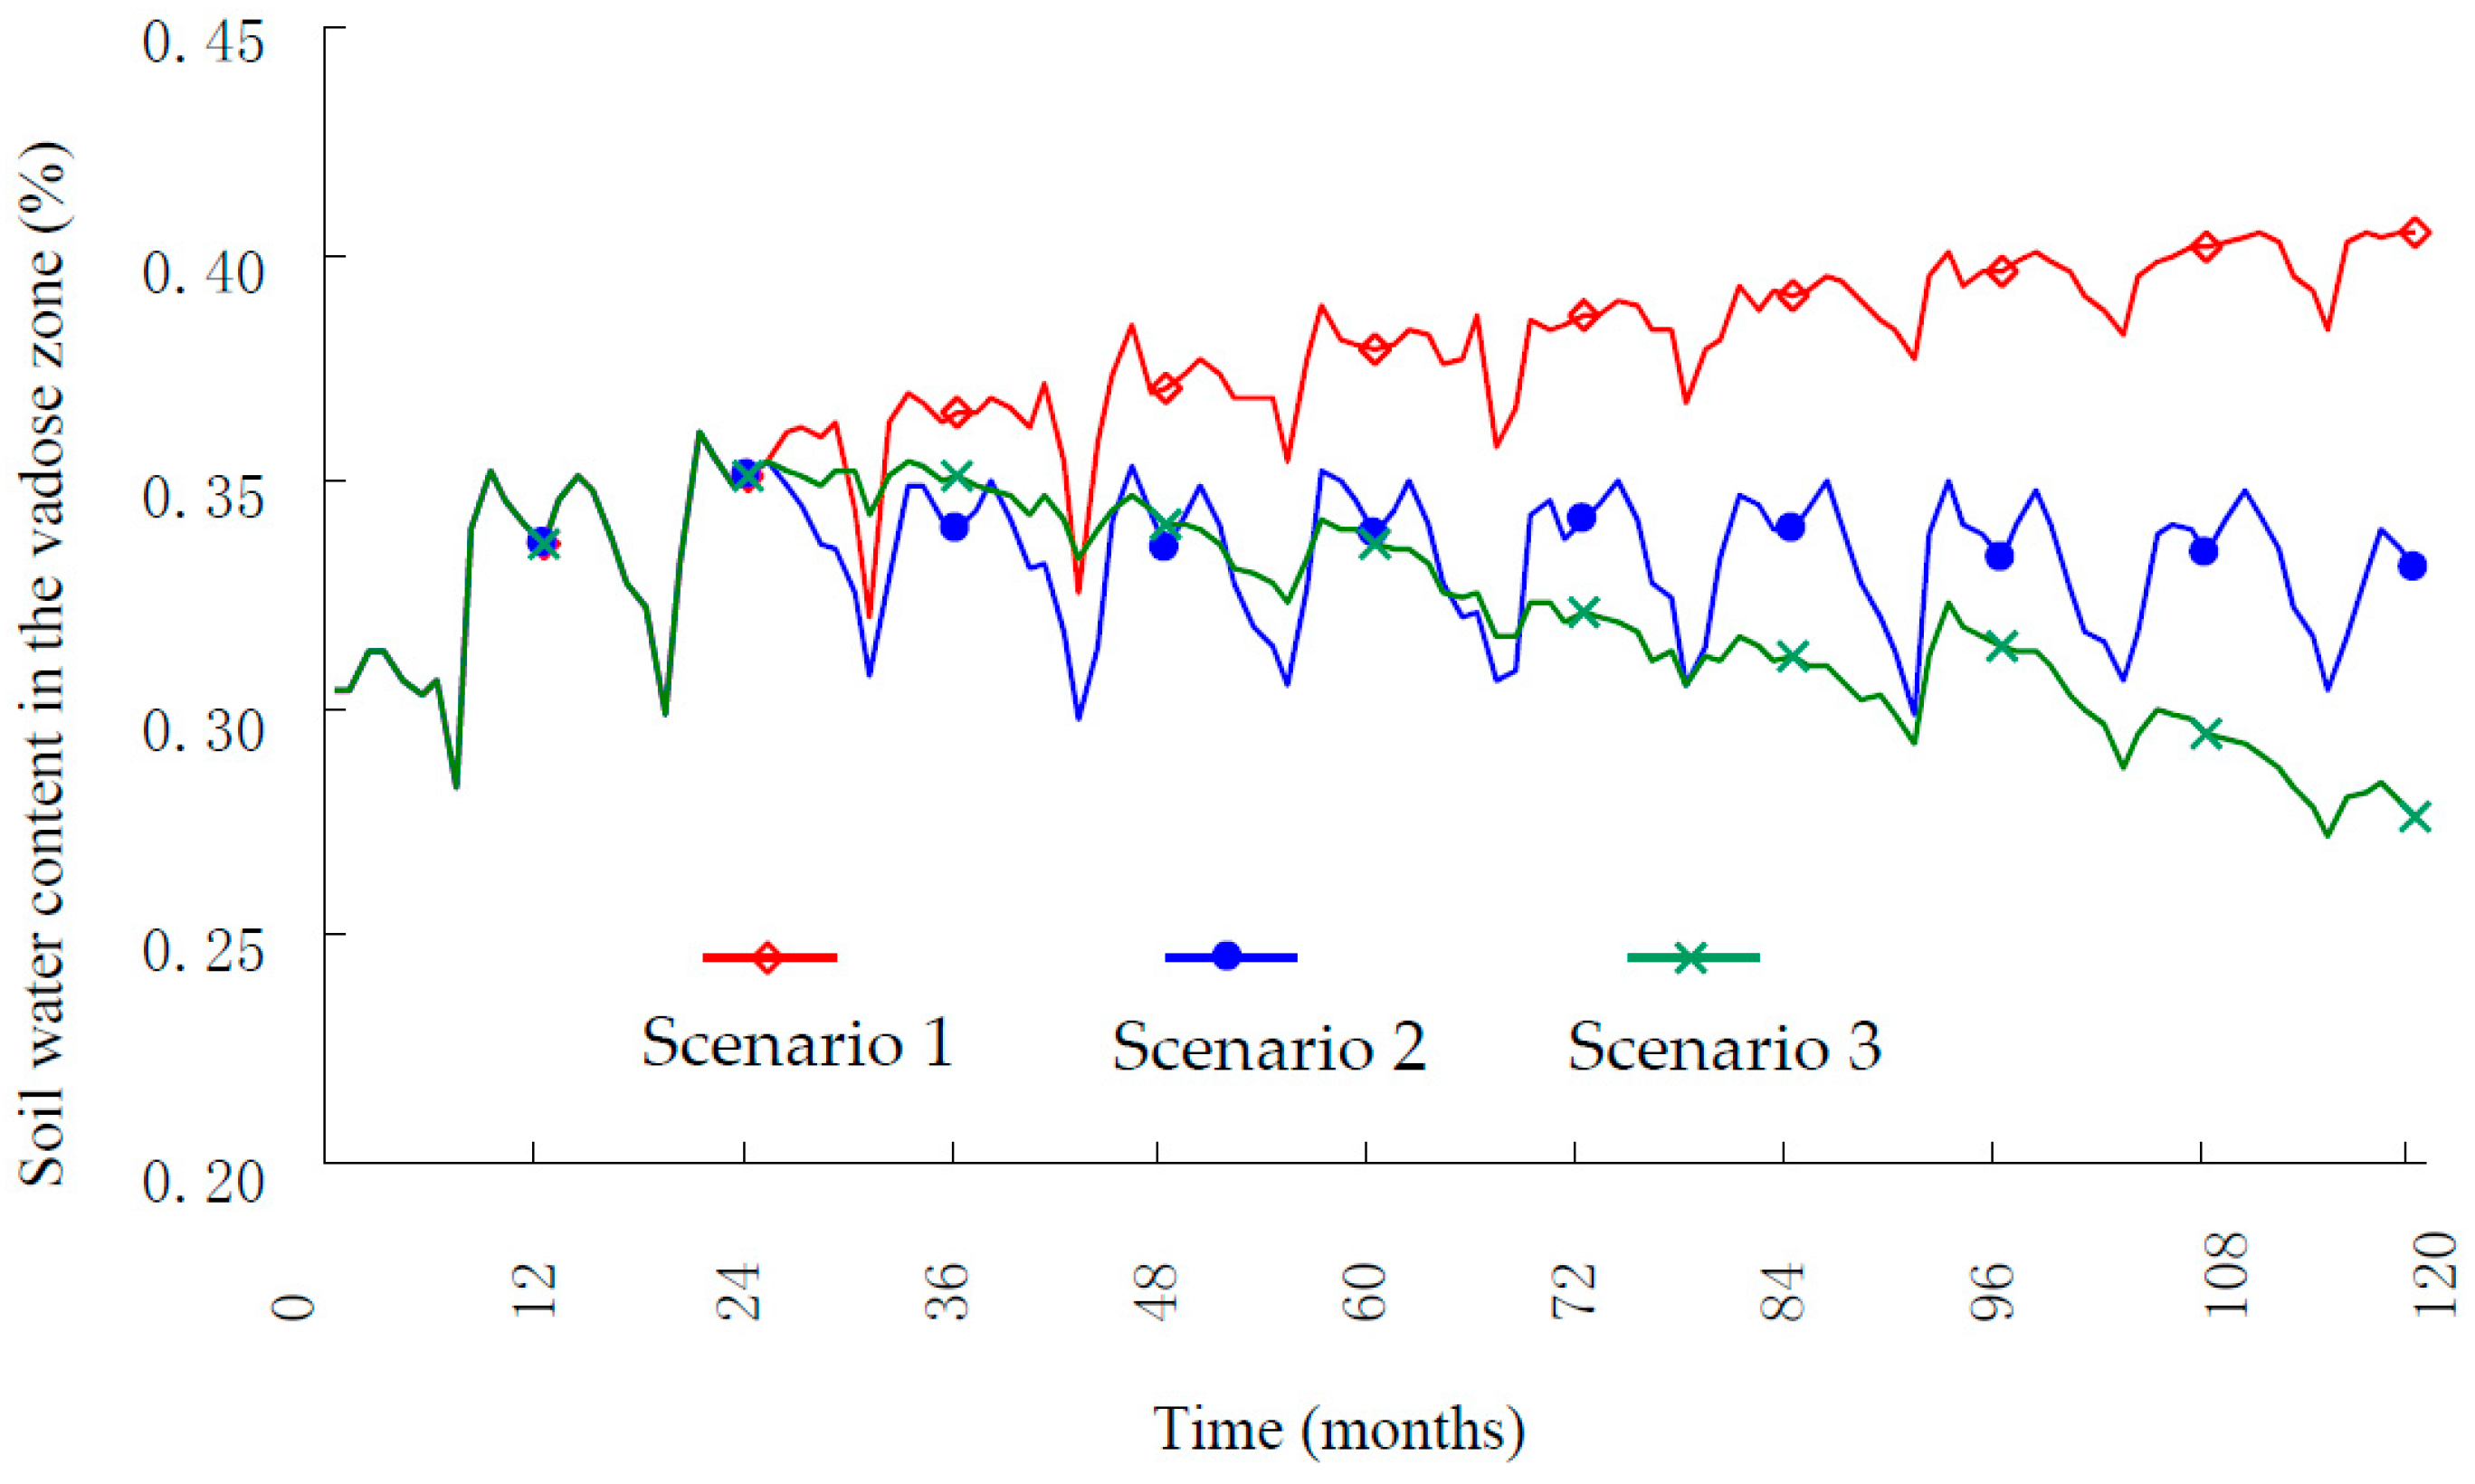
This study used calculations to simulate soil water movement based on three model test scenarios with different types of changes in groundwater levels predicted over 10 years and calculated the soil water contents at different depths, as well as the water storage values at different depths in the vadose zone. The simulation results for the three types of groundwater level changes are presented in
Figure 7 and
Figure 8.
Figure 7 shows that when the groundwater level drops, the overall soil water content significantly decreases. Greater reductions in groundwater level correspond to greater decreases in the soil water content, and the soil water content increases when the groundwater level increases.
Figure 8 shows that the storage capacity of the entire vadose zone increases as the groundwater level decreases because the unsaturated zone becomes thicker and the water storage space increases. By contrast, when the groundwater depth increases from 4 to 10 m and the vadose zone thickness increases to 6 m, the amount of water stored in the vadose zone increases by approximately 2.3-fold from 2011 to 2020. If the groundwater depth is reduced from 4 to 1.5 m, the vadose zone is 2.5 m thinner, and its water storage capacity would decrease by approximately 50% from 2011 to 2050.
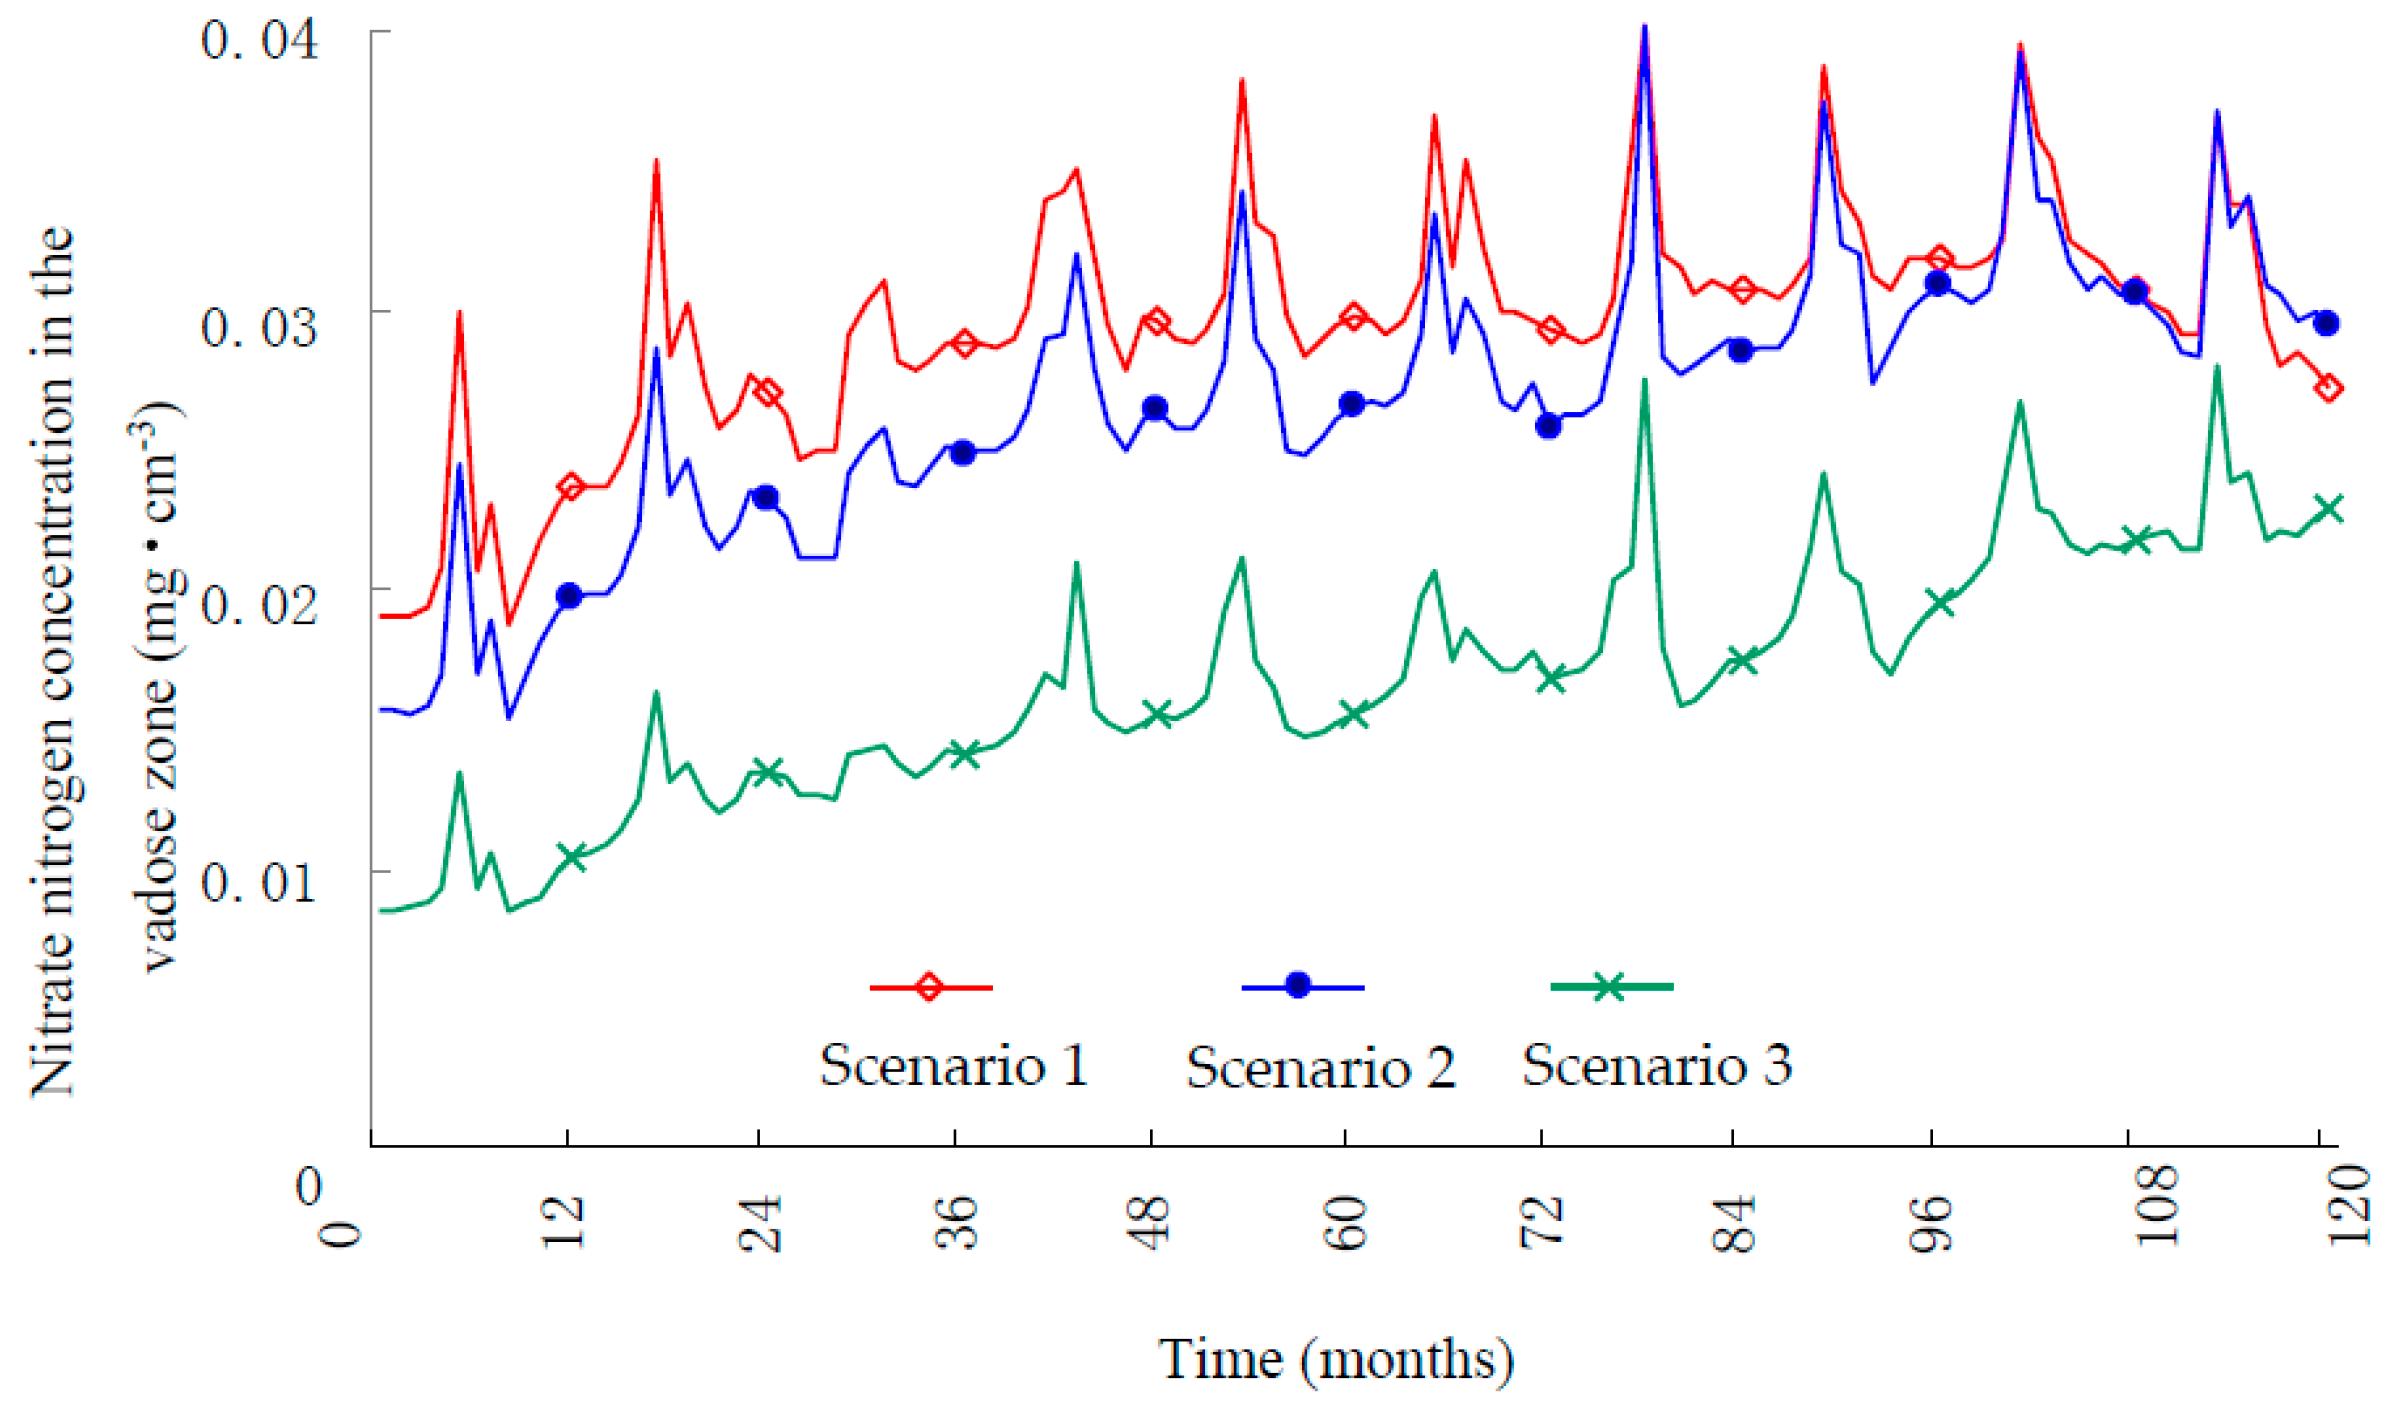
4.2. Nitrate Nitrogen Reserves in the Vadose Zone
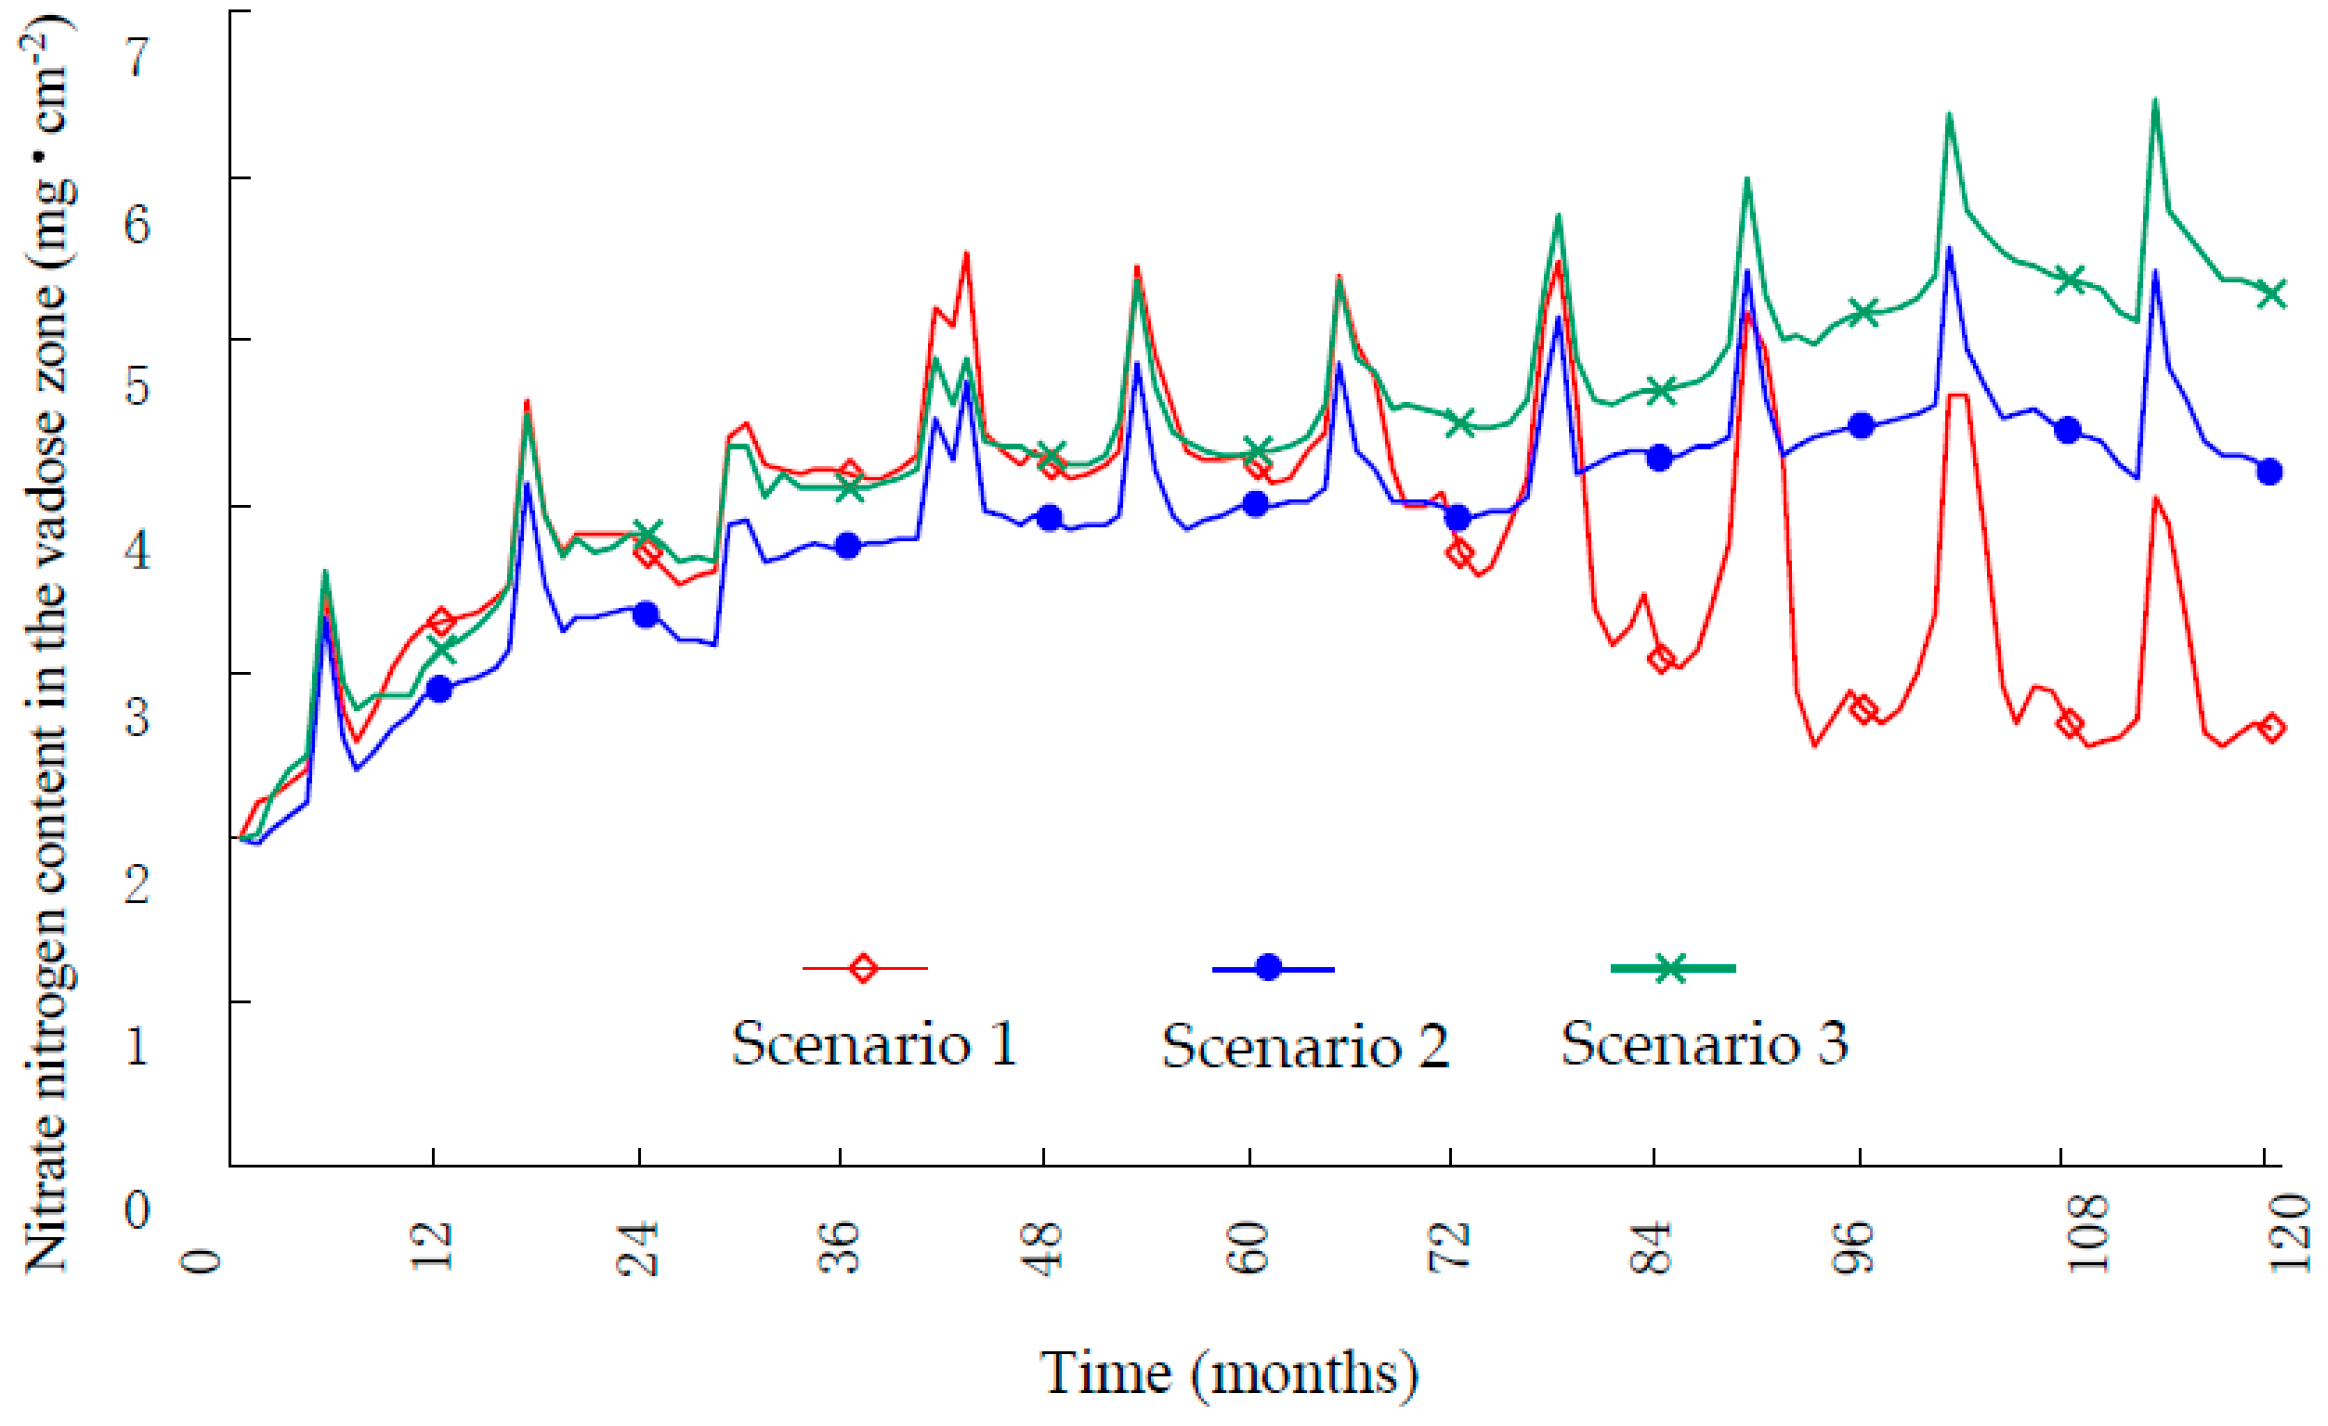
The simulation results of the transport and transformation of soil nitrate nitrogen in the three groundwater level change scenarios over 10 years reveal the nitrate nitrogen concentrations at different depths and the nitrate nitrogen reserves throughout the vadose zone (
Figure 9 and
Figure 10).
Regardless of whether the groundwater level decreases, remains constant or increases, the nitrate nitrogen concentration increases with time (
Figure 9).
All nitrate nitrogen reserves in the vadose zone gradually increase in response to the application of excess fertilizer, regardless of whether the groundwater level decreases, remains constant or increases in the first five years (
Figure 10).
In the last five years that were modeled, the nitrate nitrogen reserves changed differently in the different scenarios and in the presence of different groundwater levels.
The nitrate nitrogen reserves increased when the groundwater depth was stable and decreased when the thickness of the vadose zone increased. When the groundwater depth was changed from 4 to 10 m, the thickness of the vadose zone increased to 6 m, and the nitrate nitrogen reserves in the vadose zone increased by 2.6-fold after ten years.
If the groundwater depth is increased from 4 to 1.5 m, the thickness of the vadose zone gradually decreases, and the nitrate nitrogen reserves of the vadose zone peak in 2016 at a concentration of nearly twice the concentration observed in 2011 before decreasing thereafter. The nitrate nitrogen reserves in the vadose zone in 2020 are nearly equal to those in 2011 due to the combination of the positive and negative effects of over-fertilization, and the nitrate nitrogen in the lower vadose zone dissolves into the groundwater as the groundwater level increases.
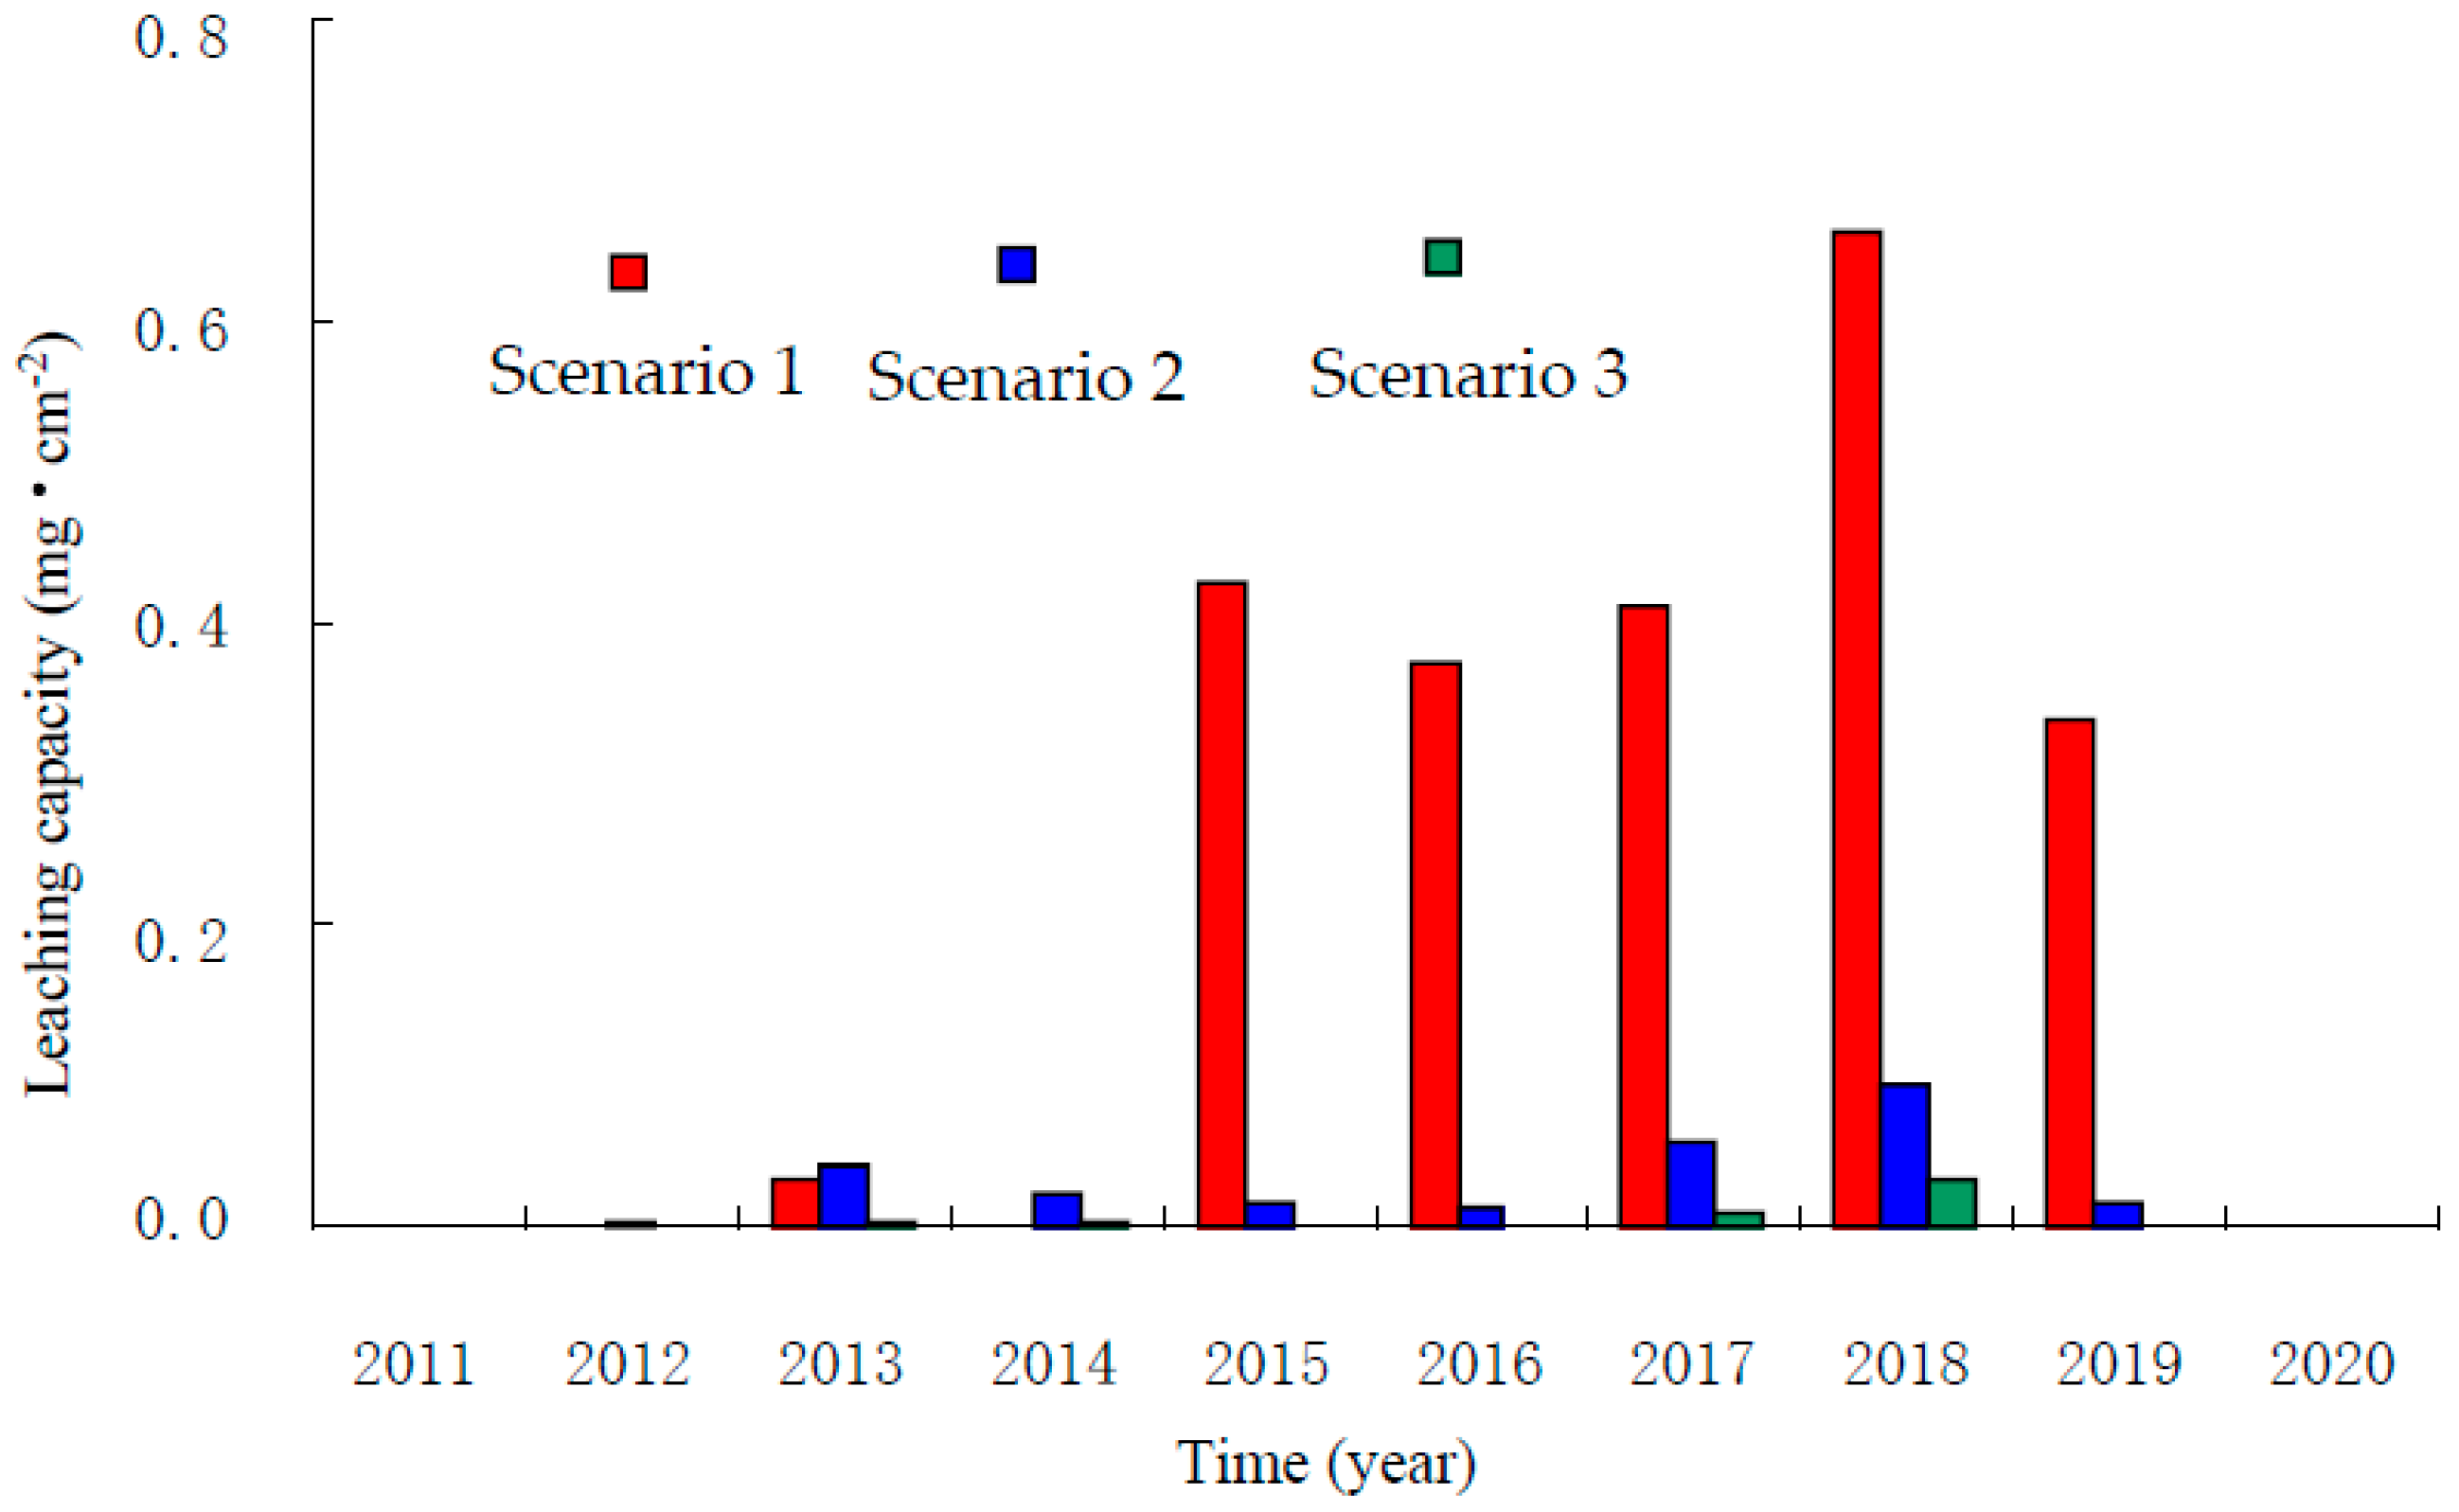
4.3. The Leaching Capacity of Nitrate Nitrogen
Figure 11 shows the amount of nitrate nitrogen that leached into the groundwater from the vadose zone each year for the three scenarios of groundwater level change.
Figure 11 shows that leaching increased as the groundwater level increased. This result does not include the amount of dissolved nitrate nitrogen due to the increasing groundwater level. If the groundwater level is constant or decreases, the concentration of leached nitrate nitrogen is low enough to neglect.
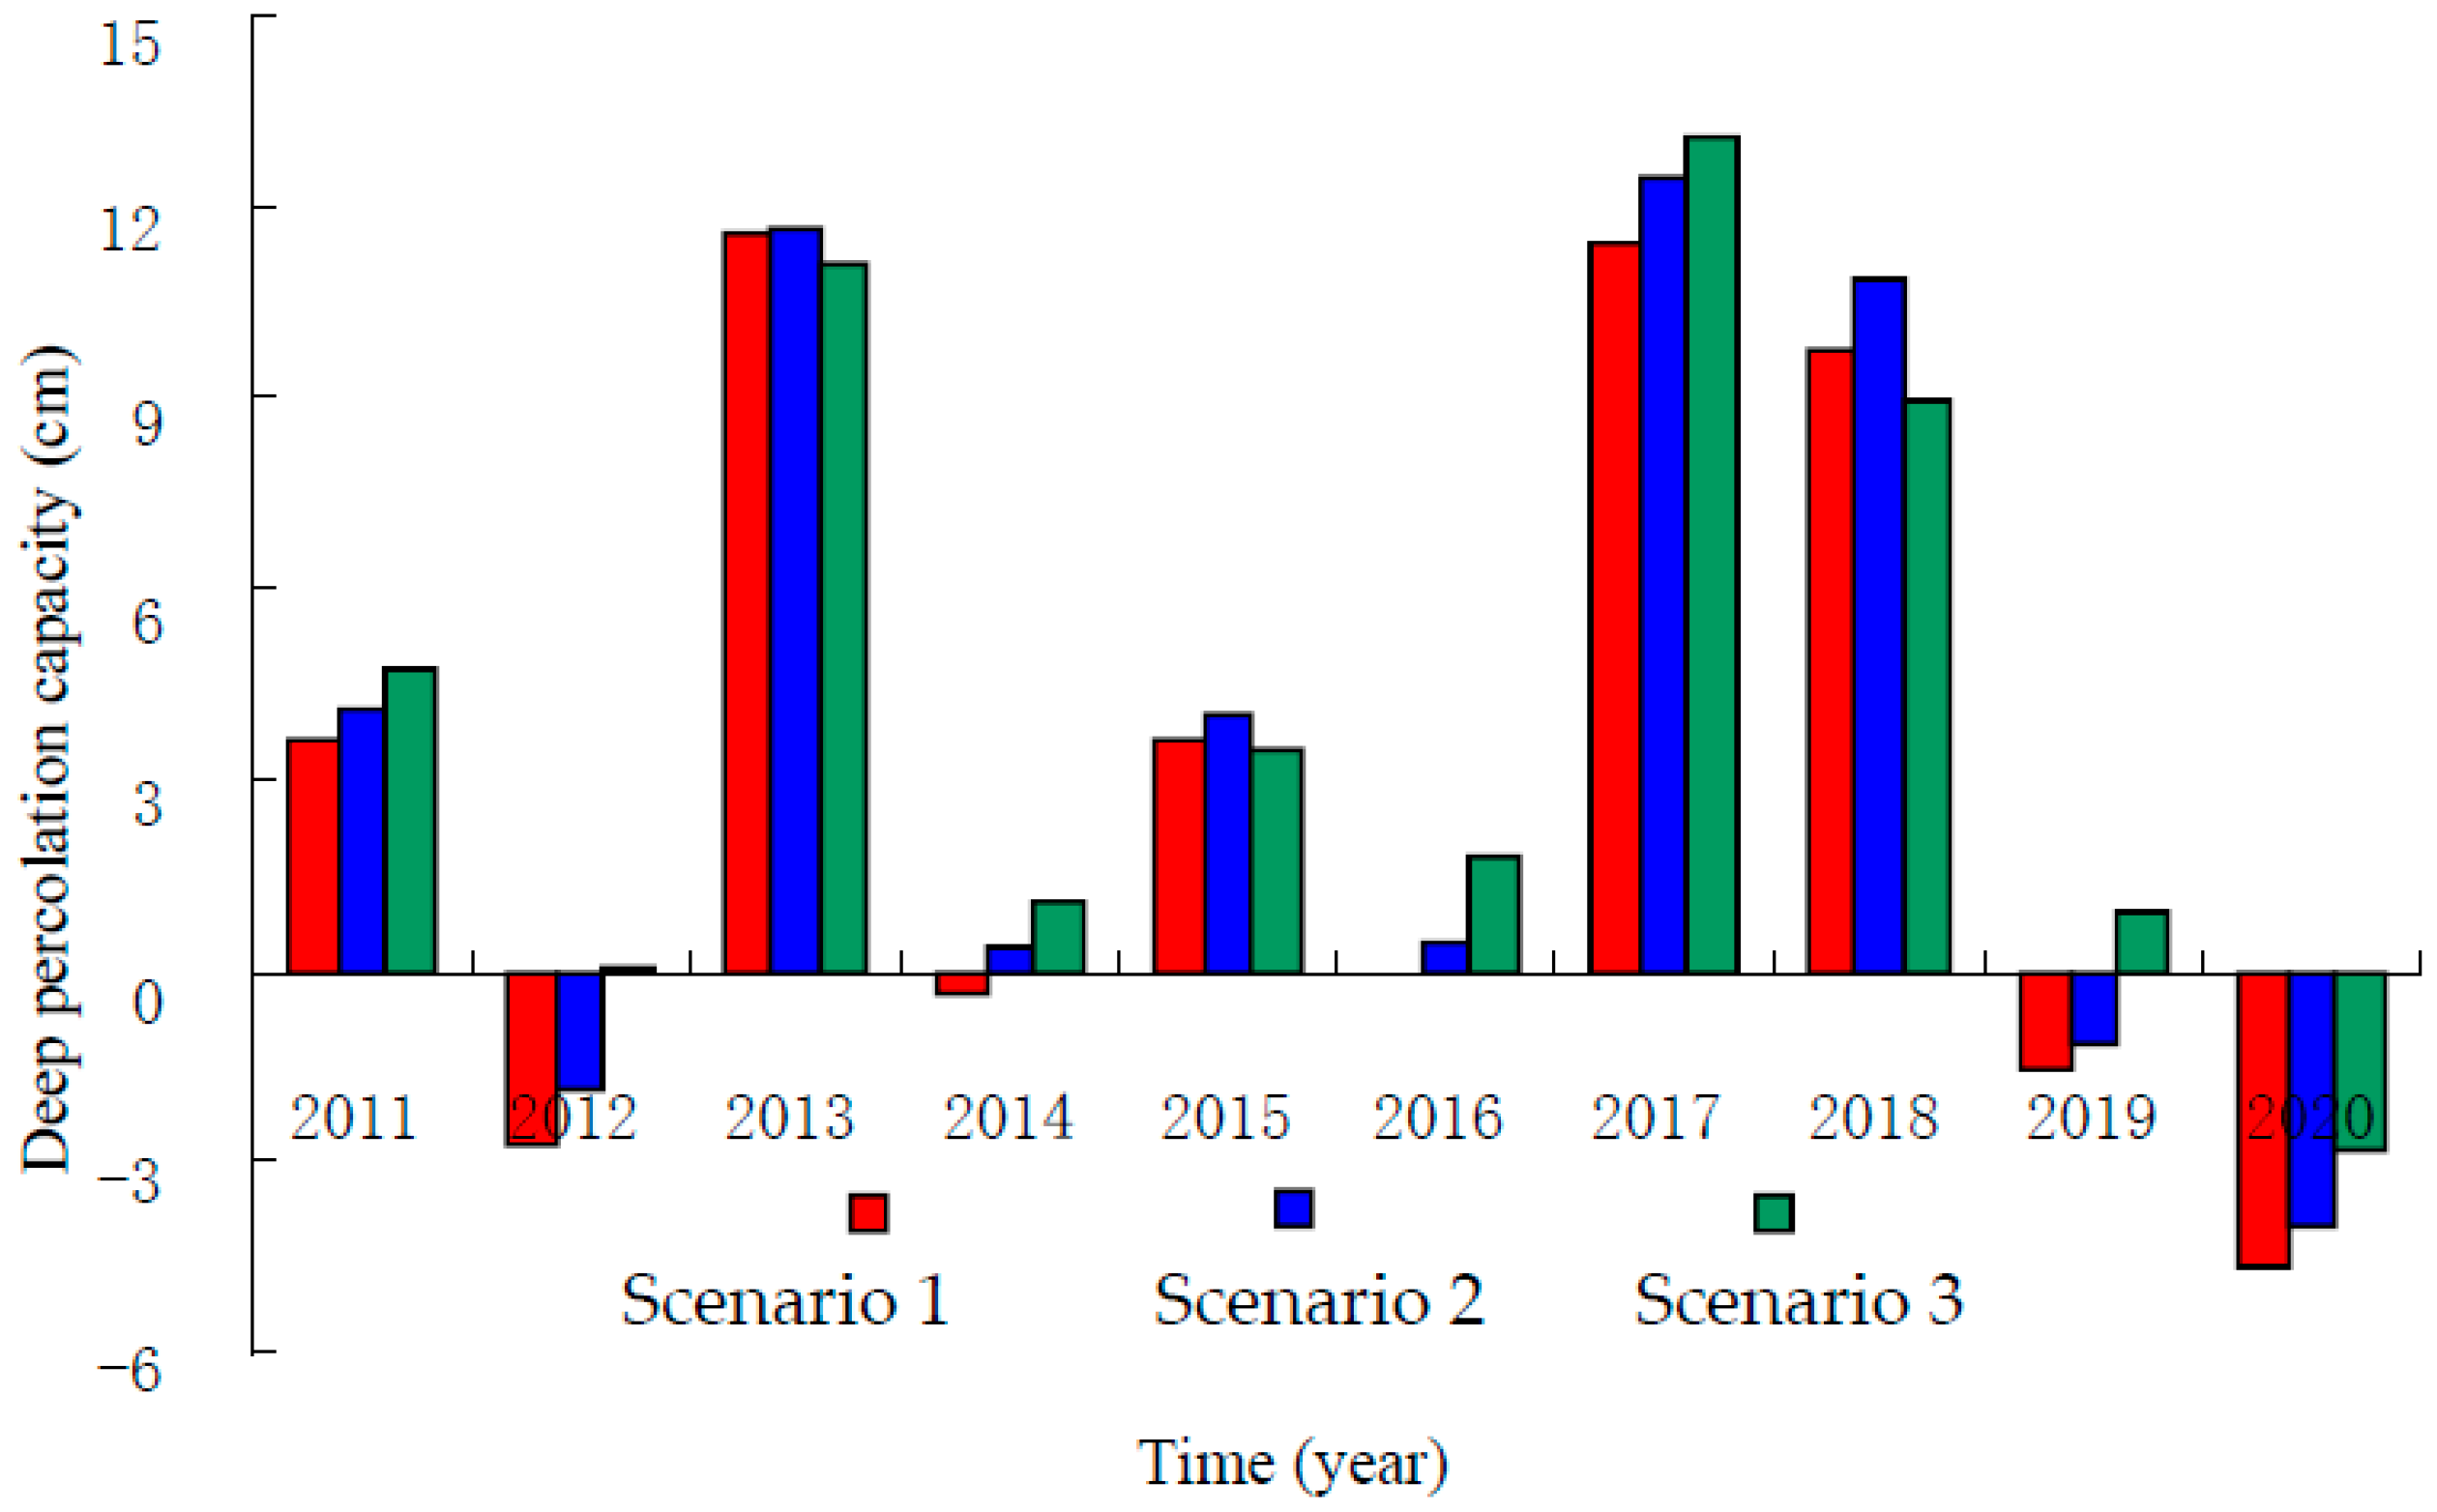
4.4. Deep Percolation of Soil Water in the Root Zone
Deep percolation is a hydrologic process in which water moves downward from the surface in the root zone to deeper groundwater due to precipitation or irrigation levels that exceed the soil water holding capacity. Deep percolation results in moisture and nutrient loss. A reasonable irrigation strategy should be used to minimize deep percolation. A simulation of soil water movement was conducted in this study for the scenarios of groundwater level change predicted over the 10-year period, and the percolation of water in the cotton root zone was assessed. The results are shown in
Figure 12.
Deep percolation in the root zone was largely dependent on yearly precipitation (
Figure 12). Deep percolation increased with greater precipitation and increased groundwater depth, primarily because deeper groundwater causes higher suction below the root zone and faster water flow.
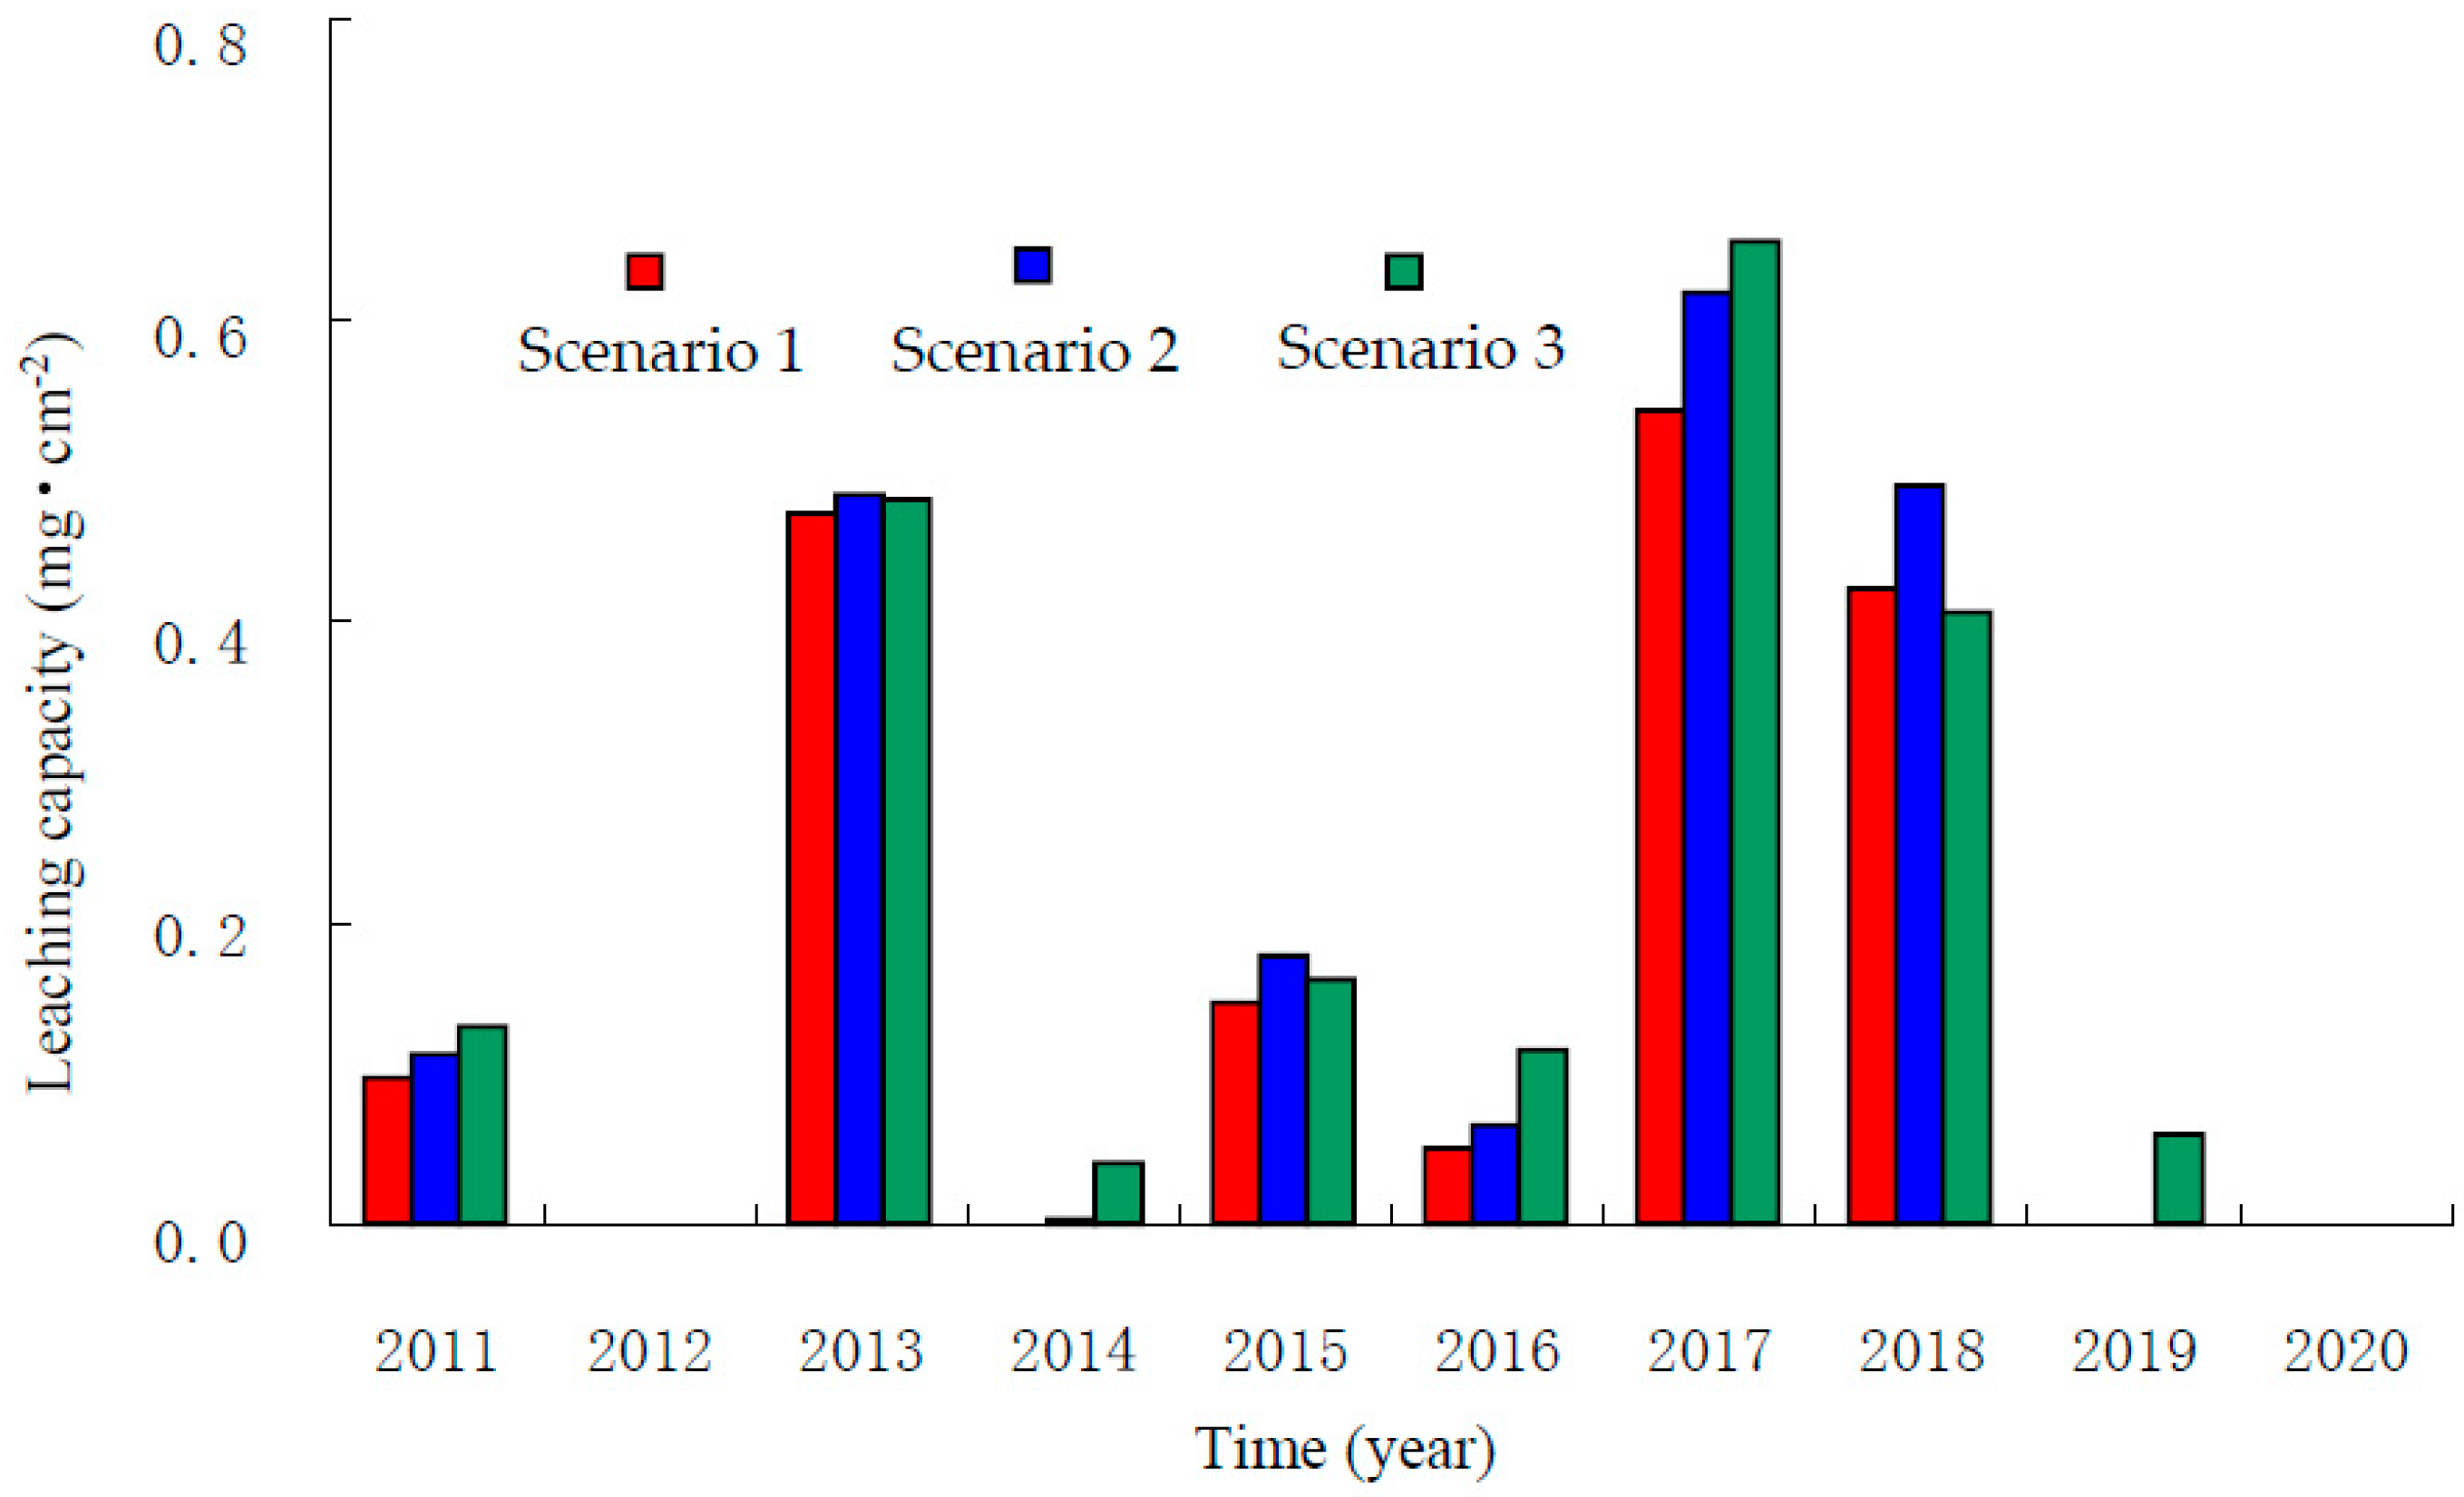
4.5. The Leaching Capacity of Nitrate Nitrogen in the Root Zone
The results for the three scenarios of the simulated changes in groundwater level over the 10-year period and the amount of leaching in the root zone are shown in
Figure 13.
Greater precipitation and a deeper groundwater level correspond to greater leaching of nitrate nitrogen and deep percolation of the soil water in the root zone (
Figure 13).


 ,
, 


