Water Savings of Crop Redistribution in the United States


Abstract
:1. Introduction
2. Materials and Methods
2.1. Data
2.2. Current Production and Water Demand
2.3. Interpolating Yields and Evapotranspiration
2.4. Minimizing Water Demand
3. Results
4. Discussion and Conclusions
Acknowledgments
Author Contributions
Conflicts of Interest
References
- Falkenmark, M.; Rockstrom, J. Balancing Water for Humans and Nature: The New Approach in Ecohydrology; Earthscan: London, UK, 2004. [Google Scholar]
- Konar, M.; Dalin, C.; Hanasaki, N.; Rinaldo, A.; Rodriguez-Iturbe, I. Temporal dynamics of blue and green virtual water trade networks. Water Resour. Res. 2012, 48. [Google Scholar] [CrossRef]
- Carr, J.A.; D’Odorico, P.; Laio, F.; Ridolfi, L. On the temporal variability of the virtual water network. Geophys. Res. Lett. 2012, 39. [Google Scholar] [CrossRef]
- Mekonnen, M.M.; Hoekstra, A.Y. Four billion people facing severe water scarcity. Sci. Adv. 2016, 2, e1500323. [Google Scholar] [CrossRef] [PubMed]
- Falkenmark, M.; Rockström, J. The new blue and green water paradigm: Breaking new ground for water resources planning and management. J. Water Res. Plan. Manag. 2006, 132, 129–132. [Google Scholar] [CrossRef]
- Erisman, J.W.; Sutton, M.A.; Galloway, J.; Klimont, Z.; Winiwarter, W. How a century of ammonia synthesis changed the world. Nat. Geosci. 2008, 1, 636–639. [Google Scholar] [CrossRef]
- D’Odorico, P.; Rulli, M.C. The fourth food revolution. Nat. Geosci. 2013, 6, 417–418. [Google Scholar] [CrossRef]
- Tilman, D.; Balzer, C.; Hill, J.; Befort, B.L. Global food demand and the sustainable intensification of agriculture. Proc. Natl. Acad. Sci. USA 2011, 108, 20260–20264. [Google Scholar] [CrossRef] [PubMed]
- Davis, K.F.; Gephart, J.A.; Emery, K.A.; Leach, A.M.; Galloway, J.N.; D’Odorico, P. Meeting future food demand with current agricultural resources: Required changes in dietary trends and production efficiencies. Glob. Environ. Chang. 2016, 39, 125–132. [Google Scholar] [CrossRef]
- Kummu, M.; De Moel, H.; Porkka, M.; Siebert, S.; Varis, O.; Ward, P. Lost food, wasted resources: Global food supply chain losses and their impacts on freshwater, cropland, and fertiliser use. Sci. Total Environ. 2012, 438, 477–489. [Google Scholar] [CrossRef] [PubMed]
- Jägermeyr, J.; Gerten, D.; Schaphoff, S.; Heinke, J.; Lucht, W.; Rockström, J. Integrated crop water management might sustainably halve the global food gap. Environ. Res. Lett. 2016, 11. [Google Scholar] [CrossRef]
- MacDonald, G.K.; D’Odorico, P.; Seekell, D.A. Pathways to sustainable intensification through crop water management. Environ. Res. Lett. 2016, 11. [Google Scholar] [CrossRef]
- Godfray, H.C.J.; Beddington, J.R.; Crute, I.R.; Haddad, L.; Lawrence, D.; Muir, J.F.; Pretty, J.; Robinson, S.; Thomas, S.M.; Toulmin, C. Food security: The challenge of feeding 9 billion people. Science 2010, 327, 812–818. [Google Scholar] [CrossRef] [PubMed]
- Naylor, R. Expanding the boundaries of agricultural development. Food Secur. 2011, 3, 233–251. [Google Scholar] [CrossRef]
- Foley, J.A.; Ramankutty, N.; Brauman, K.A.; Cassidy, E.S.; Gerber, J.S.; Johnston, M.; Mueller, N.D.; O’Connell, C.; Ray, D.K.; West, P.C.; et al. Solutions for a cultivated planet. Nature 2011, 478, 337–342. [Google Scholar] [CrossRef] [PubMed]
- Mueller, N.D.; Gerber, J.S.; Johnston, M.; Ray, D.K.; Ramankutty, N.; Foley, J.A. Closing yield gaps through nutrient and water management. Nature 2012, 490, 254–257. [Google Scholar] [CrossRef] [PubMed]
- Davis, K.F.; Rulli, M.C.; Garrassino, F.; Seveso, A.; D’Odorico, P. Water limits to closing yield gaps. Adv. Water Resour. 2016, 99, 67–75. [Google Scholar] [CrossRef]
- Ray, D.K.; Foley, J.A. Increasing global crop harvest frequency: Recent trends and future directions. Environ. Res. Lett. 2013, 8. [Google Scholar] [CrossRef]
- Food and Agriculture Organization of the United Nations. FAOSTAT Database. FAO: Rome, Italy, 2016. Available online: http://www.fao.org/faostat/en/#home (accessed on 9 October 2016).
- Dalin, C.; Konar, M.; Hanasaki, N.; Rinaldo, A.; Rodriguez-Iturbe, I. Evolution of the global virtual water trade network. Proc. Natl. Acad. Sci. USA 2012, 109, 5989–5994. [Google Scholar] [CrossRef] [PubMed]
- Porkka, M.; Kummu, M.; Siebert, S.; Varis, O. From food insufficiency towards trade dependency: A historical analysis of global food availability. PLoS ONE 2013, 8, e82714. [Google Scholar] [CrossRef] [PubMed]
- D’Odorico, P.; Carr, J.A.; Laio, F.; Ridolfi, L.; Vandoni, S. Feeding humanity through global food trade. Earth Future 2014, 2, 458–469. [Google Scholar] [CrossRef]
- MacDonald, G.K.; Brauman, K.A.; Sun, S.; Carlson, K.M.; Cassidy, E.S.; Gerber, J.S.; West, P.C. Rethinking Agricultural Trade Relationships in an Era of Globalization. BioScience 2015, 65, 275–289. [Google Scholar] [CrossRef]
- Hoekstra, A.Y.; Mekonnen, M.M. The water footprint of humanity. Proc. Natl. Acad. Sci. USA 2012, 109, 3232–3237. [Google Scholar] [CrossRef] [PubMed]
- Carr, J.A.; D’Odorico, P.; Laio, F.; Ridolfi, L. Recent history and geography of virtual water trade. PLoS ONE 2013, 8, e55825. [Google Scholar] [CrossRef] [PubMed]
- International Institute for Applied Systems Analysis (IIASA); Food and Agriculture Organization of the United Nations (FAO). Global Agro-Ecological Zones (GAEZ v3.0); IIASA: Laxenburg, Austria; FAO: Rome, Italy, 2012. [Google Scholar]
- The World Bank. World Development Indicators Database; World Bank: Washington, DC, USA, 2016. [Google Scholar]
- Tuninetti, M.; Tamea, S.; D’Odorico, P.; Laio, F.; Ridolfi, L. Global sensitivity of high-resolution estimates of crop water footprint. Water Resour. Res. 2015, 51. [Google Scholar] [CrossRef]
- Schyns, J.F.; Hoekstra, A.Y. The Added Value of Water Footprint Assessment for National Water Policy: A Case Study for Morocco. PLoS ONE 2014, 9, e99705. [Google Scholar] [CrossRef] [PubMed]


| Crop | kcal·kg−1 | g·protein·kg−1 | USD·tonne−1 |
|---|---|---|---|
| groundnut | 5373.83 | 230.43 | 611 |
| maize | 3008.30 | 72.67 | 225 |
| potato | 588.24 | 16.00 | 291 |
| rapeseed | 8780.49 | 0.24 | 464 |
| rice | 3695.42 | 69.50 | 345 |
| sorghum | 3072.35 | 90.27 | 233 |
| soybean | 3465.35 | 322.58 | 385 |
| sugar beet | 50.00 | 5.00 | 51 |
| sugar cane | 319.74 | 1.68 | 52 |
| sunflower | 3448.28 | 115.38 | 423 |
| wheat | 2930.81 | 88.61 | 232 |
| Crop | Yield (tonne·ha−1) | ETa (mm·year−1) | ||||
|---|---|---|---|---|---|---|
| Mean (Original) | Mean Difference | σ of Difference | Mean (Original) | Mean Difference | σ of Difference | |
| groundnut | 2.8059 | 0.0046 | 1.0819 | 387.97 | 0.00 | 1.08 |
| maize | 8.7484 | 0.0316 | 1.7495 | 488.41 | 0.03 | 1.75 |
| potato | 37.5840 | 0.0588 | 3.6882 | 373.91 | 0.06 | 3.69 |
| rapeseed | 1.8599 | 0.0510 | 2.4319 | 350.31 | 0.05 | 2.43 |
| rice | 6.7160 | 0.0130 | 1.8656 | 502.64 | 0.01 | 1.87 |
| sorghum | 3.8663 | 0.0172 | 2.0990 | 482.53 | 0.01 | 2.10 |
| soybean | 2.3157 | 0.0050 | 1.1238 | 438.08 | 0.01 | 1.12 |
| sugar beet | 49.6580 | 0.0607 | 2.0047 | 427.31 | 0.06 | 2.00 |
| sugar cane | 72.7020 | 0.0418 | 3.5551 | 1104.31 | 0.04 | 3.56 |
| sunflower | 1.6333 | −0.0129 | 2.0664 | 365.85 | −0.01 | 2.07 |
| wheat | 3.2151 | 0.0578 | 2.1105 | 367.30 | 0.06 | 2.11 |
| State | Water | Tonnes | Calories | Protein | Value |
|---|---|---|---|---|---|
| Alabama | −3 | 277 | 15 | 13 | 306 |
| Alaska | −2 | 86 | 17 | 38 | 154 |
| Arizona | −25 | 4 | 38 | 74 | 57 |
| Arkansas | −4 | 112 | 30 | 15 | 107 |
| California | −56 | −10 | 29 | 54 | 32 |
| Colorado | −6 | 326 | 333 | 313 | 464 |
| Connecticut | −2 | 341 | 750 | 554 | 354 |
| Delaware | −1 | 6 | 2 | 5 | 17 |
| Florida | −3 | 28 | 5 | 8 | 81 |
| Georgia | −2 | 221 | 16 | 15 | 248 |
| Hawaii | −6 | 27 | 48 | 7 | 58 |
| Idaho | −31 | 13 | 145 | 125 | 70 |
| Illinois | −1 | 46 | 2 | 2 | 56 |
| Indiana | −2 | 897 | 228 | 70 | 709 |
| Iowa | −1 | 104 | 2 | 3 | 120 |
| Kansas | −9 | 246 | 36 | 28 | 308 |
| Kentucky | −3 | 91 | 9 | 8 | 114 |
| Louisiana | −10 | 17 | 9 | 16 | 121 |
| Maine | −2 | 3 | 22 | 19 | 15 |
| Maryland | −2 | 87 | 5 | 6 | 110 |
| Massachusetts | 0 | 62 | 128 | 88 | 60 |
| Michigan | −1 | 326 | 196 | 70 | 518 |
| Minnesota | −2 | 546 | 246 | 91 | 793 |
| Mississippi | −5 | 173 | 20 | 10 | 187 |
| Missouri | −2 | 79 | 8 | 5 | 90 |
| Montana | −17 | 304 | 260 | 299 | 445 |
| Nebraska | −1 | 714 | 462 | 171 | 648 |
| Nevada | −43 | 40 | 91 | 126 | 48 |
| New Hampshire | −4 | 87 | 118 | 77 | 222 |
| New Jersey | −2 | 92 | 2 | 5 | 108 |
| New Mexico | −6 | 7 | 11 | 22 | 26 |
| New York | −1 | 710 | 391 | 202 | 761 |
| North Carolina | −5 | 162 | 16 | 12 | 204 |
| North Dakota | −15 | 125 | 81 | 220 | 195 |
| Ohio | −2 | 185 | 4 | 6 | 210 |
| Oklahoma | −10 | 241 | 46 | 51 | 341 |
| Oregon | −38 | 49 | 139 | 98 | 88 |
| Pennsylvania | −2 | 187 | 6 | 9 | 234 |
| Rhode Island | 0 | 2 | 7 | 5 | 1 |
| South Carolina | −2 | 167 | 15 | 10 | 205 |
| South Dakota | −1 | 635 | 252 | 107 | 558 |
| Tennessee | −3 | 93 | 8 | 7 | 118 |
| Texas | −9 | 41 | 21 | 32 | 86 |
| Utah | −36 | 25 | 41 | 126 | 55 |
| Vermont | −2 | 1921 | 614 | 260 | 2497 |
| Virginia | −4 | 101 | 9 | 12 | 140 |
| Washington | −45 | 47 | 117 | 119 | 66 |
| West Virginia | −2 | 67 | 2 | 5 | 96 |
| Wisconsin | −1 | 1168 | 433 | 150 | 1016 |
| Wyoming | −20 | 22 | 214 | 212 | 124 |
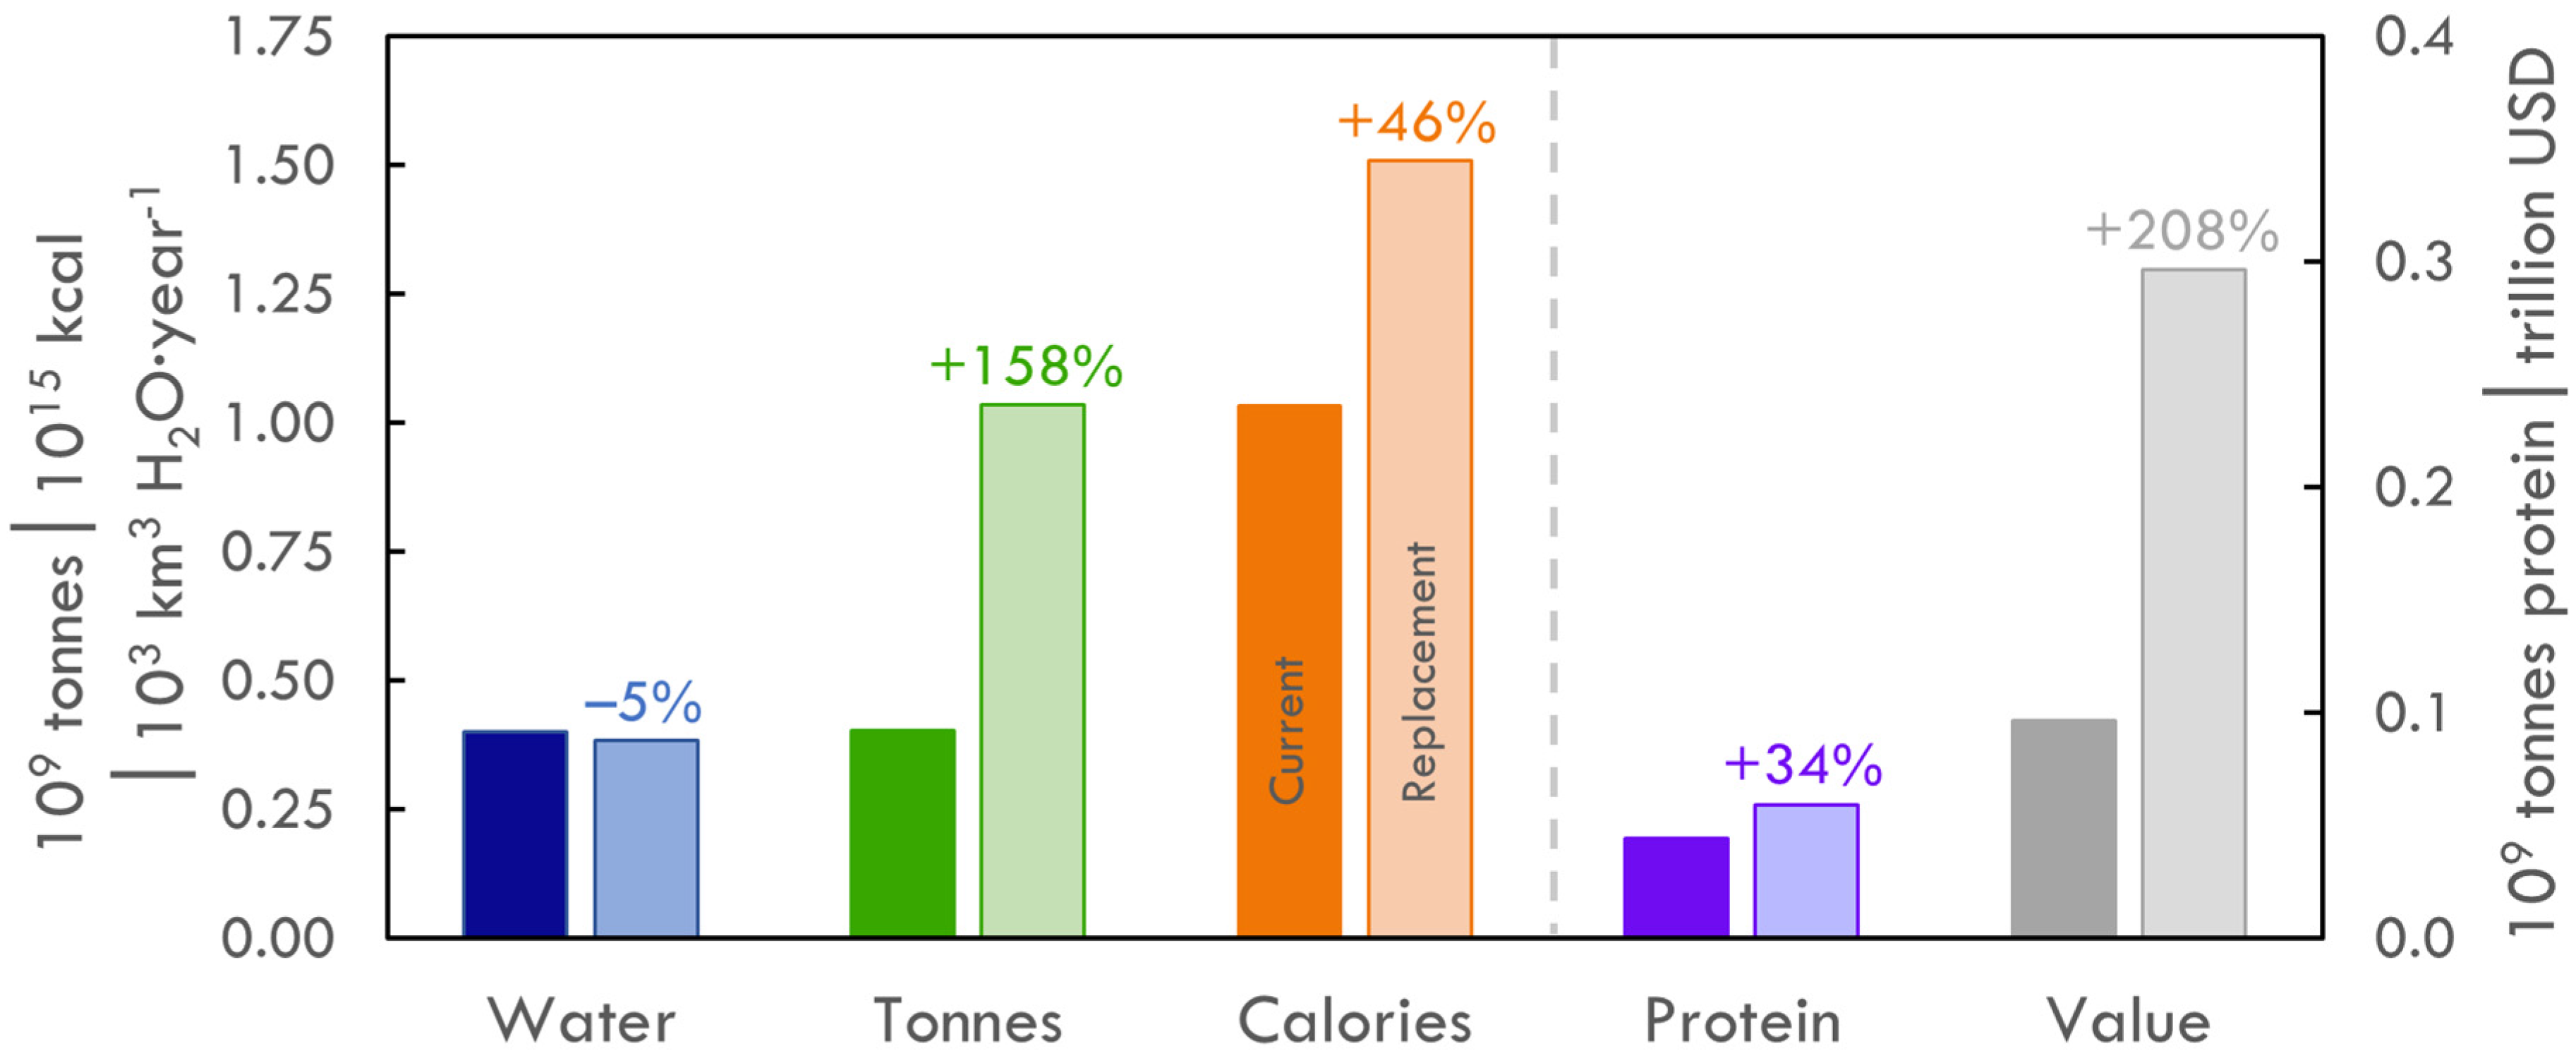
| United States | −5 | 158 | 46 | 34 | 208 |
© 2017 by the authors. Licensee MDPI, Basel, Switzerland. This article is an open access article distributed under the terms and conditions of the Creative Commons Attribution (CC BY) license ( http://creativecommons.org/licenses/by/4.0/).
Share and Cite
Davis, K.F.; Seveso, A.; Rulli, M.C.; D’Odorico, P. Water Savings of Crop Redistribution in the United States. Water 2017, 9, 83. https://doi.org/10.3390/w9020083
Davis KF, Seveso A, Rulli MC, D’Odorico P. Water Savings of Crop Redistribution in the United States. Water. 2017; 9(2):83. https://doi.org/10.3390/w9020083
Chicago/Turabian StyleDavis, Kyle Frankel, Antonio Seveso, Maria Cristina Rulli, and Paolo D’Odorico. 2017. "Water Savings of Crop Redistribution in the United States" Water 9, no. 2: 83. https://doi.org/10.3390/w9020083