Abstract
Runoff prediction in limited-data areas is vital for hydrological applications, such as the design of infrastructure and flood defenses, runoff forecasting, and water management. Rainfall–runoff models may be useful for simulation of runoff generation, particularly event-based models, which offer a practical modeling scheme because of their simplicity. However, there is a need to reduce the uncertainties related to the estimation of the initial wetness condition (IWC) prior to a rainfall event. Soil moisture is one of the most important variables in rainfall–runoff modeling, and remotely sensed soil moisture is recognized as an effective way to improve the accuracy of runoff prediction. In this study, the IWC was evaluated based on remotely sensed soil moisture by using the Soil Conservation Service-Curve Number (SCS-CN) method, which is one of the representative event-based models used for reducing the uncertainty of runoff prediction. Four proxy variables for the IWC were determined from the measurements of total rainfall depth (API5), ground-based soil moisture (SSMinsitu), remotely sensed surface soil moisture (SSM), and soil water index (SWI) provided by the advanced scatterometer (ASCAT). To obtain a robust IWC framework, this study consists of two main parts: the validation of remotely sensed soil moisture, and the evaluation of runoff prediction using four proxy variables with a set of rainfall–runoff events in the East Asian monsoon region. The results showed an acceptable agreement between remotely sensed soil moisture (SSM and SWI) and ground based soil moisture data (SSMinsitu). In the proxy variable analysis, the SWI indicated the optimal value among the proposed proxy variables. In the runoff prediction analysis considering various infiltration conditions, the SSM and SWI proxy variables significantly reduced the runoff prediction error as compared with API5 by 60% and 66%, respectively. Moreover, the proposed IWC framework with remotely sensed soil moisture indicates an improved Nash–Sutcliffe efficiency from 0.48 to 0.74 for the four catchments in the Korean Peninsula. It can be concluded that the SCS-CN method extended with remotely sensed soil moisture for reducing uncertainty in the runoff prediction and the proxy variables obtained from the soil moisture data provided by the ASCAT can be useful in enhancing the accuracy of runoff prediction over a range of spatial scales.
1. Introduction
Soil moisture denotes the water content in the land surface and subsurface, and it affects the partitioning between runoff and infiltration, as well as mass and energy exchange between the land surface and atmosphere. Soil moisture information is a critical factor in examining hydrological and meteorological systems, as well as in analyzing climate change impacts [,]. The characteristics of the spatiotemporal variability of soil moisture are important indicators of subsurface water storage that influences the partitioning of rainfall into runoff and infiltration [,,,]. An accurate soil moisture observation can lead to improved hydrological modeling for both flood simulation and forecasting, as well as surface–ground water flow. It requires the development of an accurate and reliable soil moisture monitoring process with a suitable spatiotemporal resolution at the catchment scale. Obviously, direct soil moisture observation is not simple owing to spatiotemporal variability, heterogeneity in soil properties, and geographical location of the observatory [].
Several studies have implemented soil moisture measurements to improve the estimation accuracy of rainfall–runoff by using three different methodologies. The first method consists of ground-based measurement that includes the use of neutron probes, time domain reflectometry (TDR), and frequency domain reflectometry (FDR). The ground-based soil moisture data obtained are used for evaluating the hydrological response by using means of continuous rainfall–runoff models [,] and event-based models [,,], which use indexes based on base flow or antecedent precipitation. Zehe et al. [] used two spatial TDR clusters consisting of 71 coated TDR probes to investigate the role of soil moisture in runoff generation at grassland and forest sites by using a physically based hydrological model. They suggested that the correlation structure was dominated by throughfall and interception, and they found a very strong correlation between the antecedent soil moisture and precipitation events at the forest site.
The second method includes land surface models [,] and soil water balance models, which usually require the formula of the water content balance equation []. Most of these models simulate the spatially distributed moisture state of soil or soil water index (SWI). They require meteorological records, observed soil moisture data, and physical representation of catchment characteristics with relevant topographical parameters (elevation, land cover, soil properties, etc.) as the forcing variables. Coustau et al. [] reported that the initial wetness condition (IWC) derived from the simulated soil moisture significantly improved most of the flood simulations in the event-based rainfall–runoff model.
The third method, a relatively new method for estimating the soil moisture profile, uses various remote sensing instruments, including those on aircraft and satellites with active and passive microwave sensors []. It has the unique capability of providing information at a global scale with adequate spatiotemporal resolution and accuracy [,,]. Several previous studies used the remotely sensed soil moisture to inform continuous rainfall–runoff models [,,] and event-based models [,]. In general, ground-based measurements are known to provide detailed information on soil moisture at a point scale; however, they are time consuming in the case of large area coverage. For a representative hydrological application, remotely sensed soil moisture for large regions or even on a global scale are often required []. This means that the only method of determining soil moisture at such a scale is using remote sensing data []. Moreover, remotely sensed soil moisture data have been demonstrated to improve the rainfall–runoff model performance by providing more accurate initial conditions [,,,]. The IWCs are important input parameters for various hydrological simulations, such as surface runoff generation.
Continuous models assess the detailed information of the physical and hydrodynamic properties of soil and vegetation. These models calculate the mass and energy balances for the assessment of soil moisture at the beginning of a rainfall event. They are physically based and simulate runoff generation; therefore, they require a complete time-series of input data. Event-based models, on the other hand, require less complex parameters than continuous models. They usually consider flood processes at the event scale and are easier to calibrate, as there is no need for complex parameters. These models, based on simple assumptions, can be useful for evaluating rainfall–runoff model parameters in limited-data areas. Their main weakness is that the parameter estimation representing the IWC affects the model accuracy. In this study, we expand the proposed representation of the IWC by incorporating remotely sensed soil moisture and the Soil Conservation Service Curve Number (SCS-CN) method to reduce the uncertainties in runoff prediction.
This study has the following main objectives: (1) to develop a robust framework for determining the IWC; and (2) to propose proxy variables for the IWC by integrating remotely sensed soil moisture into an event-based model, and comparing the performance of each variable in providing a reliable scheme for reducing uncertainties in runoff prediction. The IWC variables—also called proxy variables—consist of the API5 (antecedent precipitation index for five days), SSMinsitu (surface soil moisture obtained by in situ measurement), SSM (remotely sensed surface soil moisture), and SWI (remotely sensed soil water index obtained from the SSM).
This study consists of three parts. First, the SSM and the reanalyzed root zone soil moisture (RZSM) obtained using an active microwave sensor, the advanced scatterometer (ASCAT), were compared with the SSMinsitu to assess the agreement of the satellite soil moisture data with in situ measurements in Northeast Asia. Second, the proposed four proxy variables for IWC were determined by comparing them with the maximum water retention capacity. Finally, to provide reliable evidence of the improved runoff prediction using the proxy and real satellite soil moisture measurements, the estimated runoff depths were compared for small- and medium-sized catchments. The SCS-CN approach, which is a representative event-based model, was for runoff prediction, as an event-based model requires fewer parameters for rainfall–runoff modeling. The continuous model is able to assess rainfall–runoff modeling with antecedent soil moisture information, but requires a complete time-series of the meteorological data. In this research, the event based model is suitable for verification of IWC proxy variables using remotely sensed soil moisture because of the limitation of data. This is the first study that describes the evaluation of the ASCAT-based soil moisture with the rainfall–runoff model in the East Asian monsoon region. Previous studies using satellite-based soil moisture datasets [,,] have conducted simulations of runoff predictions, which were mainly performed at experimental sites rather than limited-data regions. Therefore, it is necessary to develop a robust approach using remotely sensed soil moisture data considering areas having various catchment conditions. This framework will contribute to a better understanding and improved estimation of the initial condition variables for practical applications in hydrological engineering.
2. Method
2.1. Description of the Study Area and Ground-Based Measurement
The study area consists of six catchments with sizes ranging from small to medium (<1520 km2) located on the Korean Peninsula in the East Asian monsoon region (34–39° N and 126–130° E) as follows: Yangpyeong (YP, 880 km2), Hongseong (HS, 453 km2), Andong (AD, 1520 km2), Cheongju (CJ, 153 km2), Imsil (IS, 596 km2), and Hongseong (HS, 377 km2). These sites were selected based on the availability of hydrometeorological network and ASCAT data of sufficient quality (Figure 1).
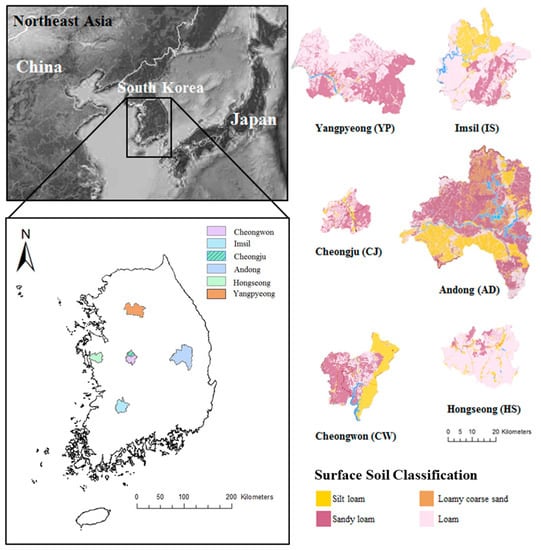
Figure 1.
Validation basins in Northeast Asia and surface soil classification.
The region has a temperate humid climate and a seasonal transition, referred to as the East Asian monsoon. It is divided into a cold and dry winter monsoon and a warm and wet summer monsoon. Most of the floods occur in the summer monsoon, between late May and September []. The catchments have summer-dominated rainfall events with approximately 600 mm of rainfall in July and 20 mm of rainfall in March. The mean annual precipitation over the six catchments is 1242.6 mm, and the mean annual temperature is 11.5 °C (Table 1).

Table 1.
Characteristics of the study areas.
On the Korean Peninsula, ground-based soil moisture has been monitored since 2010. The in situ soil moisture data are recorded at a time interval of 1 h by the Rural Development Administration (RDA) network []. The soil moisture probes are based on the FDR technique, and they continuously measure the volumetric soil moisture in the soil column at depths of 10, 20, 30, and 40 cm, however, only a few stations provide soil moisture data at several depths. In most stations, in situ soil moisture data are provided at a 10 cm depth. The in situ soil moisture dataset selected for this study covers 34 months from January 2011 to October 2013. Moreover, to assess the reliability of the satellite-based soil moisture data, surface soil moisture measurements were performed at a depth of 10 cm in the six catchments. Both discharge and rainfall have been monitored in the catchments by the Ministry of Land, Infrastructure and Transport and the Korea Meteorological Administration. The total hydrometeorological network consisted of 27 rain gauges and six discharge stations in the study catchments. The daily discharge was measured using a Doppler velocimetry and was calculated using the stage-discharge relation curve based on the actual measurement data. Table 1 shows the main characteristics of each catchment in terms of land use and surface soil type, according to the Korean Soil Information System [].
2.2. Remotely Sensed Soil Moisture
The ASCAT, on board of the Meteorological Operational satellite programme-A (MetOp-A), is a real-aperture radar instrument that measures the radar backscatter at C-band, VV polarization, succeeding the ERS-1 and ERS-2 scatterometers. The data on available soil moisture were provided by the European remote-sensing satellite (ERS) at 1–3-day intervals, from both the ascending (09:30 local time) and descending (21:30 local time) overpasses. The ASCAT operates an active microwave at a frequency of 5.3 GHz with a spatial resolution of 25 km resampled to 12.5 km. The SSM data are retrieved from the ASCAT backscatter measurement using a time-series-based change detection approach developed for the ERS-1/2 scatterometer. The relative soil moisture data ranging from 0% (driest soil condition) to 100% (wettest soil condition) are derived by scaling the normalized backscattering coefficients between the lowest and highest backscatter values for the first few centimeters of the soil [,]. The SSM retrieval, ms(t), is estimated from the Vienna University of Technology (TU-Wien) algorithm by Wagner et al. []:
where and are the backscatter values for the dry and wet conditions, respectively, and is the current backscatter measurement. The ASCAT SSM products are provided in terms of the degree of saturation. The SSM, ms(t), used for this study were obtained by processing three years (January 2011–October 2013) worth of data using the WARP 5.5 software provided by TU-Wien []. The ASCAT soil moisture is rescaled from the degree of saturation to volumetric units (m3·m−3) by considering the soil porosity of the dominant soil type provided by the Korean Soil Information System []. The average daily ASCAT SSM was used for the validation of this study. To estimate the RZSM, an assimilation approach of the profile soil moisture values correlated with the SSM was used to obtain the SWI values [,,]. The semi-empirical (exponential filter) approach proposed by Wagner et al. [] shown in Equation (2), is a simple and effective method for retrieving the profile saturation degree; information on the surface saturation degree; and a parameter, T, termed the characteristic time length, representing the time scale of saturation degree variation. The SWI values are obtained using the following formula:
where SWI(t) is the SWI at time t, and ms(ti) is the SSM estimated from the satellite at time ti. Despite its simplicity, this algorithm has been found to be reliable in predicting the soil moisture profile based on the SSM information using both in situ measurements [,] and modeled data []. In this study, the SWI values for T = 1 to 150 days were used to compare the remotely sensed soil moisture data with the ground-based soil moisture data, taken at a depth of 10 cm owing to data limitation, and to calibrate the remotely sensed soil moisture as initial parameters for runoff prediction in 2011 and 2012, including the growing seasons (1 May through 30 September). Moreover, we used the SWI values at T = 5, 10, 20, and 40 days to evaluate the runoff prediction-derived proxy variables considering the RZSM profile listed in Section 3.2.2.
2.3. SCS-CN Approach
The SCS-CN model is based on the following basic formula for calculating the runoff depth (Q) from the rainfall depth (P) and the initial abstraction (Ia = λS):
where S is the maximum potential retention and CN is the curve number, which characterizes the reaction of the catchment to the rainfall event. The potential retention is expressed in terms of the dimensionless index CN ranging from 0 when S → ∞, to 100 when S = 0. The parameter S is a dynamic storage term, which is expected to increase as the catchment dries up and to decrease as it reaches saturation. The determination of the SCS-CN values commonly used in hydrological applications assumes the initial abstraction rate after rainfall to be a constant value, λ = 0.2, so that S is the only unknown parameter when using this method []. The S value for a catchment is estimated by the curve number, considering the hydrological wetness condition in the classical procedure; however, it varies with rainfall events and the IWC, including the soil moisture profile [,]. The S value characterizes the retention potential in the subsurface soil layer and represents the direct runoff potential [,]. Therefore, it can be considered as a good indicator for assessing the antecedent moisture condition (AMC). The measured P–Q plots were used to calculate the S value from Equation (3) as follows:
The CN values are estimated based on the land use and hydrological soil types, and can be selected from the National Engineering Handbook Section 4 tables (tabulated CN values), or calculated by the measured rainfall–runoff data from local or nearby similar watersheds as follows:
The application of CN values derived from the measured pair of P and Q is expanded by a secondary relationship that essentially emerges between the calculated CN value and the rainfall depth (CN–P relationship) in the watershed. Three typical behaviors of this secondary relationship were specified by Hawkins []: standard, complacent, and violent. In most watersheds, the standard response appears as a near-constant asymptotic value for the relationship between the decreasing calculated CN value and the increasing P. Watersheds with a complacent behavior display a decreasing CN value with increasing P in less common cases. The violent response exhibits an apparently constant small CN value for a small P, and is often observed with abrupt rise thresholds of rainfall events in a relatively saturated condition. The asymptotic constant value is used to identify the CN value by evaluating this secondary relationship for standard or violent situations []. The method for the asymptotic determination of CN could be applied easily to hydrological engineering design in other regions in order to improve the seasonal limits of AMC for different soil groups, land uses, and topographies [].
The soil moisture variability was estimated by characterizing the AMC, which is traditionally classified by the antecedent precipitation; the five-day antecedent precipitation (API5) is also used as an index. The parameters AMC-I, -II, and -III correspond to dry, normal, and wet surface conditions, respectively. The tabulated CN values refer to the AMC-II condition of the watershed, and the CN values for AMC-II can be adjusted as follows []:
2.4. IWC and Soil Moisture Relationship
Event-based models have several advantages and are easy to apply even for users without extended hydrological expertise []. They consist of only a few parameters and are relatively easy to calibrate, since they only consider the rainfall–runoff processes at the event scale. Their major disadvantage is the definition of the initial soil moisture conditions, which need to be determined using additional external information. Proxy variables representing the IWC before a flood event are necessary for overcoming this limitation. In particular, a robust framework should be constructed to obtain satisfactory estimations for the IWC under various conditions. In this study, four different proxy variables, obtained from ground-based and satellite-based soil moisture as well as precipitation data, were established to indicate the IWC prior to flood events. The selected proxy variables were: (i) API5, obtained from the total precipitation occurring in the five days prior to the beginning of each event; (ii) SSMinsitu, obtained from the ground-based SSM of the RDA network; and (iii) SSM directly sensed by the ASCAT; and (iv) SWI from the ASCAT SSM, which is the exponentially filtered SWI. The selected IWC proxy variables were compared with the potential retention capacity to assess their reliability as initial parameters of the rainfall–runoff model.
3. Results
3.1. Validation of Remotely Sensed Soil Moisture
The daily ASCAT soil moisture was validated using in situ measurements provided by the RDA network over the study period from 2011 to 2012 (growing season from 1 May to 30 September) at six sites located on the Korean Peninsula. The average daily soil moisture measurements according to the catchment size from satellite were compared with the in situ measurements. The time-series plots of the ASCAT SSM and ASCAT SWI for three different values of parameter T (T = 5, 20, and 40), in situ measurements and weighted in situ soil moisture (SWI_insitu) along with the daily rainfall data, are shown in Figure 2a,b for all sites. SWI_insitu (T = 20) is weighted in situ soil moisture measurements by exponential filter same as SWI. T = 20 days was deemed to be the best case for SWI_insitu because T = 5 days of SWI_insitu showed little change compared to in situ soil moisture, and T = 40 days showed similar results to T = 20 days. Figure 2a shows that in 2011, the ASCAT SSM exhibited temporal patterns similar to the in situ measurements for all catchments. In situ data before 22 June in 2011 was not measured for IS area. The ASCAT SSM values at sites YP, CJ, and HS were underestimated, while those at IS, AD, and CW were overestimated. This could be due to a systematic error or uncertainties resulting from different soil layers. The ASCAT SSM values were more sensitive to rainfall events than the in situ SSM values. The in situ measurements show less change than ASCAT SSM during the 2011 and 2012 study periods for all sites. In the HS catchment, when rainfall events did not occur, the patterns were overestimated compared to the in situ measurements. However, the ASCAT SSM and SWI values showed a reasonable agreement with the precipitation patterns in all catchments. We estimated in situ soil moisture for root zone using exponential filter because there are no in situ soil moisture data deeper than 10 cm over the study areas. SWI (T = 20, 40) followed the trend of SWI_insitu with bias values except HS area.
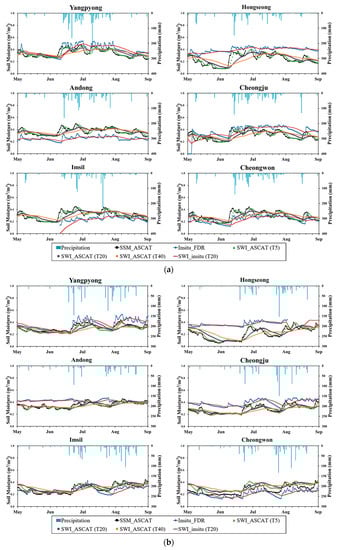
Figure 2.
Temporal patterns of remotely sensed surface soil moisture (SSM), in situ soil moisture (10 cm), root zone soil moisture (RZSM) from soil wetness index (T = 5, 20, 40) and weighted in situ soil moisture products (SWI_insitu, T = 20) with rainfall events from 1 May to 30 September: (a) 2011; and (b) 2012 at six sites in Northeast Asia.
These results can be explained by the different hydraulic conductivities of the soil. Loam soil accounts for more than three quarters (79.4%) of the total study area (Table 1). For sites with this type of soil, it is more difficult to determine the soil water content using ground-based measurement than for other sites, because loam has a higher saturated hydraulic conductivity than sandy loam []. The hydraulic characteristics of a soil are determined by its particle size distribution []. Although there were differences in the results of the analysis of the spatial distribution of surface soil type and precipitation, it can be concluded that the remote sensing footprints from ASCAT soil moisture show better correspondence to the rainfall events according to the precipitation intensity than point scale values.
Figure 2b shows that, in 2012, the ASCAT SSM corresponded well to the temporal patterns of in situ measurement. At sites YP, HS, and CJ, the ASCAT SSM values exhibited an underestimated temporal pattern. ASCAT SWI showed similar to trend of SWI_insitu with bias values. During the growing season in 2012, for all catchments, the time-series pattern of the ASCAT SSM corresponded well to the in situ measurements and the rainfall events, compared to the three cases of RZSM from the ASCAT SWI. In particular, the in situ soil moisture time series showed stationary values when rainfall events occurred continuously during the summer season (Figure 2a,b). These results could be caused by the different spatial scales of the ASCAT and in situ soil moisture measurements. In general, the temporal patterns of the ASCAT SSM displayed an immediate increase in the soil moisture following rainfall events. Cho and Choi [] reported that the ASCAT soil moisture, including SSM and RZSM, corresponded accurately to temporal patterns of in situ measurement and precipitation patterns on the Korean Peninsula. It is worthwhile to note that remotely sensed soil moisture measurements, considering the topsoil and root zone soil layers, provide an effective saturation concept for short and intense rainfall events, as has been shown in several previous studies [,,].
The in situ soil moisture data show that, in 2011, the average and standard deviation values ranged from 0.23 to 0.39 m3·m−3 and from 0.03 to 0.08 m3·m−3, respectively (Table 2). The correlation coefficient (R) comparing the ASCAT SSM and in situ measurements ranged from 0.43 to 0.77 (average R = 0.60). The correlation coefficient (R) value comparing the ASCAT SWI and in situ measurements showed a higher correlation (average R = 0.68) than the ASCAT SSM at most of the sites. These results correspond to those of previous studies [,]. The ASCAT SWI is one of the RZSM [,] that significantly improve the match between remotely sensed soil moisture and in situ observations near the surface of the soil by applying an exponential filter. The ASCAT SSM represent the standard deviations ranging from 0.05 to 0.09 m3·m−3. The Root Mean Square Error (RMSE) between the in situ soil moisture measurement and the ASCAT SSM ranged from 0.02 to 0.10 m3·m−3 (average RMSE = 0.06). The ASCAT SWI show standard deviations ranging from 0.04 to 0.07 m3·m−3 and RMSE values ranging from 0.02 to 0.09 m3·m−3 (average RMSE = 0.06). The results of the statistical analysis showed that the ASCAT soil moisture was reliable at lower RMSE values and standard deviation values. In 2012, the trend of the results shown (Table 3) for the R values (average R = 0.51 for SSM, average R = 0.53 for SWI) was similar to that shown in 2011. The sites HS and IS exhibited the lowest R values for SSM and RZSM, respectively. These results indicate that each study area has a spatial heterogeneity of land surface characteristics. The amount of soil moisture is influenced by differences in the infiltration capacity according to the surface soil properties and land cover [,]. Chaney et al. [] noted that the topography, land cover, and soil properties are the main drivers of spatial heterogeneity of soil moisture, and soil moisture variability is attributed to the complex interactions between the drivers of heterogeneity. The results of this study support the findings that both the remotely sensed soil moisture (SSM and SWI) have the potential to mimic soil moisture parameters and can be characterized as the IWCs before rainfall events, as noted in several previous studies [,,].
Table 2.
Comparison of in situ data, ASCAT SSM, and ASCAT SWI (T = 20) from 1 May to 30 September 2011.
Table 3.
Comparison of in situ data, ASCAT SSM, and ASCAT SWI (T = 20) from 1 May to 30 September 2012.
3.2. Runoff Prediction Using Remotely Sensed Soil Moisture
In this study, two different approaches are proposed to evaluate the four proxy variables for runoff prediction by measuring the remotely sensed soil moisture. The first approach assesses the initial condition-derived soil moisture with validation sets of rainfall events, and the second approach assesses the error analysis of the estimated runoff prediction with the evaluation set of rainfall events.
3.2.1. Proxy Variables of IWC
The analysis of the ASCAT soil moisture was performed for both the surface and root zone layers. We selected the rainfall–runoff events objectively, along with the criteria at each of the validation sites. As previously stated, this study conducts validation of the four proxy variables of IWC to improve the accuracy of the initial conditions in the rainfall–runoff simulation. The four proxy variables were assessed using an event-based runoff model, the SCS-CN method, which is widely used for runoff prediction because it is known as one of the most robust approaches [,,]. The set of rainfall events (Table 4) characterized by a mean rainfall depth greater than 10 mm/day and no rainfall event in the previous one or two days was selected to efficiently capture a relatively dry soil condition [,]. The total rainfall depth P was calculated using the Thiessen polygon method, and the direct runoff depth Q was determined using the base flow separation method.
Table 4.
Main properties of selected rainfall–runoff event for validation of runoff proxy variables of antecedent wetness conditions: rainfall (P) and direct runoff (Q).
The correlation coefficients for the IWC proxy variables were calculated in relation to the value of the maximum potential water retention, Sobs. The maximum potential water retention capacity can be explained by the mean soil water deficit of the catchment having an inverse linear relationship with the wetness condition and degree of saturation. Considering the effect of the SSM and RZSM, the T value was counted as a calibration parameter ranging from 1 to 150 days. Table 5 shows the results of the correlation coefficient for each site along with the optimal value of T parameters determined for minimizing the error. As shown in the table, the API5 value ranged from −0.151 to 0.179; SSMinsitu ranged from −0.327 to 0.579; SSM ranged from −0.14 to 0.897, and SWI ranged from −0.516 to −0.769. The SWI derived from the RZSM had higher inverse correlation values than the other IWC proxy variables, with an average correlation of −0.67. The API5 value derived from the antecedent five-day rainfall was found to have a lower reliability for estimating the potential maximum retention, as the average R value was 0.019. This may be explained by the spatial heterogeneity of surface soil type compared with other sites (Table 1). The diverse soil types could be the cause of erroneous results, and the quality of the soil moisture was influenced by the spatial heterogeneity in a pixel [,]. The IWC proxy variables, API5, SSMinsitu, and SSM, representing the surface soil moisture or cumulative precipitation during the short term, showed a poor regression performance with Sobs. In particular, API5, as a classical indicator of the SCS-CN approach, was not suitable for the IWC proxy variable with a correlation value close to zero. These results correspond to those of Brocca et al. [] and Jacobs et al. []. The ASCAT SWI can be considered more reliable in the estimation of the IWC, providing a more accurate runoff prediction.
Table 5.
Correlation between observed maximum potential retention and the four proxy variables of antecedent wetness conditions (AWC).
Figure 3 shows the correlation coefficient of the linear regression between the SWI proxy variable and Sobs values according to the characteristic time length parameter, T, for the six validation sites. The optimal T value was determined for a T 1 to 150 days, and optimal T value for sites YP, HS, AD, CJ, and IS was estimated as 45, 64, 59, 100, and 59 days, respectively; the optimal T value for site CW was estimated as three days. According to previous studies [,,], the optimal T value ranges from 30 to 90 days. In Figure 3, T was set to range from 1 to 60 days because it is difficult to explain that remotely sensed soil moisture before two months (60 days) can affect to the infiltration of the next rainfall events. However, in the CJ correlation coefficient increased continuously with the T value and reached a maximum at T = 100 days. The reason for the differences in T value is due to the investigated soil layer thickness. The lower T value for site CW was obtained from the fast-responding catchment influenced by a thin soil layer. A higher T value suggests that a deeper soil layer influences the rainfall–runoff transformation process. The differences in topography and land cover could explain the variation in T value. To obtain the optimal T value, further examination should be conducted by considering a larger number of study sites.
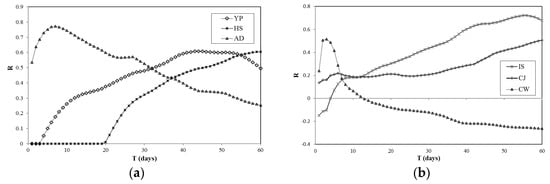
Figure 3.
Correlation coefficient (R) pattern for different values of characteristic time length (T days) at six sites: (a) YP, HS, and AD; and (b) IS, CJ, and CW.
3.2.2. Estimated Runoff Model Comparison
This study proposed several approaches to improve event-based rainfall–runoff modeling using the SSM and SWI derived from the ASCAT satellite. Based on the runoff data availability, evaluation sets of rainfall–runoff events were selected, and the main characteristics, such as total rainfall (mm), measured runoff data (mm), AMC, ASCAT SSM, and CN (P) calculated from the CN–P relationship, are shown in Table 6. The estimated runoff for each event was determined by four different CN parameters to define the initial conditions, representing the IWC (Table 7). In the first approach, the QCNP values were predicted using the CN–P relationship obtained from the exponential regression for each site, as shown with the standard response in Figure 4. These were greater than the asymptotic CN values. Equations (7)–(10) are fitted functions and represent the values of the coefficient of determination for sites YP, AD, CJ, and CW, respectively, as follows:
Table 6.
Main characteristics of the selected rainfall–runoff events for evaluation of estimated runoff depth, remotely sensed surface soil moisture (SSM) through ASCAT, CN (P) from CN–P relationship defined in Equations (6)–(9), and CN* normalizing CN in Equation (4) by CN (P).
Table 7.
Comparative coefficient results of estimated runoff depth using CN–P relationship (QCNP), modified antecedent moisture condition (QAMC), remotely sensed surface soil moisture through ASCAT (QSSM), and ASCAT soil water index (QSWI).
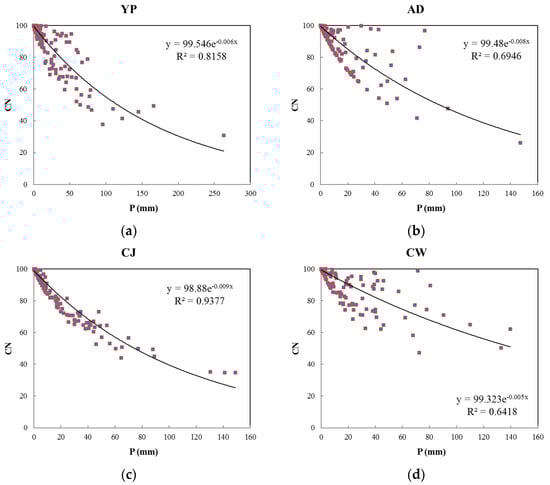
Figure 4.
CN–P relationship that describes the curve number estimated with 428 measured rainfall–runoff pairs for two years (2011, 2012) from 1 March to 30 September at four sites: (a) YP; (b) AD; (c) CJ; and (d) CW.
Figure 4 shows a standard behavior characterized by constant CN values with increasing rainfall depth. In most of these cases, when the CN values calculated using Equation (5) were plotted against rainfall depth (P), they decreased steadily with increasing P. A strong relationship between P and CN was detected from the standard behavior. Thus, the maximum potential retention S increases as P increases until it reaches a constant value. The variation of the standard form is clearly described by [,].
In the second approach, QAMC was predicted using the CN value estimated from the adjusted CN (P) corresponding to the antecedent moisture condition (API5) using Equation (5). In the third approach, QSSM was predicted using the linear relationship between the rescaled CN value (CN*) and the ASCAT SSM. The CN* value was obtained from the calculated CN value divided by CN (P) to indicate the relationship between the dry and wet condition-influenced rainfall depth []. A larger CN* value represents a greater wetness condition that has less potential for storage. Similarly, a lower CN* value represents a drier soil condition with increased infiltration capacity.
In the last approach, QSWI was predicted from the estimated CN value using the linear relationship between CN* and the ASCAT SWI data at T = 5, 10, 20, and 40 days to consider the variability of the infiltration effect. The overall adequacy of the initial conditions on runoff prediction was quantified by calculating the RMSE values for the four sites (Table 7). The model performance was also determined using the Nash–Sutcliffe coefficient (NSe) []. The RMSE values for the site YP ranged from 3.33 to 4.83 mm when compared with the measured runoff data; the estimated runoff derived by the ASCAT SSM showed a smaller error in comparison. The RMSE value for the site AD presented lower overall values, with the exception of one case: the error of the second approach using the adjusted AMC condition, which was high. The RMSE value for site CJ ranged from 0.81 to 1.93 mm, and the average RMSE value in the case of the ASCAT SWI was 0.93 mm. For site CW, the average RMSE was lower than 1.50 mm for QSWI, and QAWC was the highest at 5.35 mm. Thus, the estimated runoff derived from the ASCAT SWI values showed outstanding results, and the small errors could be inferred from the catchment size. The predicted runoff using the ASCAT SSM and SWI (T = 10) showed high NSe values (YP: 0.71, AD: 0.48, CJ: 0.74, and CW: 0.48). Therefore, the runoff prediction values using the remotely sensed soil moisture indicated potentially reliable statistical results for assessing the goodness of fit of the rainfall–runoff model. The runoff prediction scheme applying the remotely sensed soil moisture, meeting the reliable goodness of fit criteria, provided an enhanced framework for the rainfall–runoff model.
This suggests that modeling uncertainties can be reduced using more accurate initial condition parameters based on remotely sensed soil moisture. In addition, these results agree with the observation of Kustas and Goodrich [] that a medium-sized catchment was adequate for runoff prediction. For these evaluated rainfall events, the remotely sensed soil moisture reduced the overall error in the runoff prediction by approximately 70% compared to the reference amount of runoff obtained the traditional SCS-CN approach. Site YP exhibited the highest reduction rate among the four sites with a value of 80%, along with 68% for site AD and 22% for CW in the case of runoff prediction using the CN–P relationship. Subsequently, the SSM and SWI data also significantly reduced the error with improved runoff prediction at 88% for site YP, 92% for AD, and 60% for CW. On the other hand, for site CJ, the CN–P relationship did not improve the runoff prediction, and the error reduction was 35% for both SSM and SWI. This could be due to the pattern of land use, i.e., grassland < 10%, mixed forest < 33%, and cropland > 30%, as well as the surface soil type.
The estimated runoff, QCN-Table, predicted using the tabulated CN values, has the largest error for the measured runoff depth (Figure 5). It is difficult to select an accurate CN value from handbook tables because the calculated runoff is more sensitive to the selected CN than the recorded rainfall data [,] The error in runoff prediction patterns at the four sites exhibited a considerable difference owing to the variation of CN parameters (Figure 6). The variability and differences between SSM (Figure 6c) and SWI (T = 40) considering RZSM (Figure 6d) appeared smaller for all sites compared with the CN–P relationships (Figure 6a,b). It is likely that this is due to the differences between the real soil moisture data and synthetic initial condition data to simulate the runoff depth. Moreover, this may indicate a shortcoming of the event-based model in the absence of accurate IWC information. It is worthwhile to note that the remotely sensed soil moisture provides the required reliability for the simulation of runoff prediction.
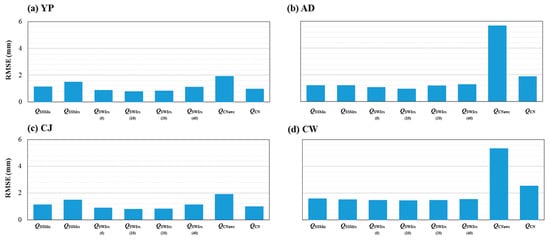
Figure 5.
Comparative results of estimated runoff depths in the eight cases of RMSE at four sites: (a) YP; (b) AD; (c) CJ; and (d) CW.
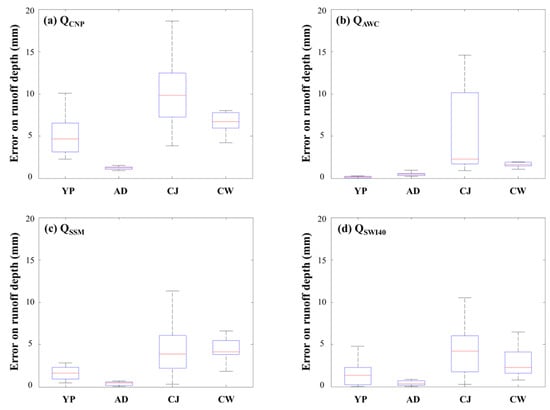
Figure 6.
Boxplot of absolute error in the estimated runoff depth at each site: (a) QCNP was predicted using the CN estimated from CN–P relationship; (b) QAWC was predicted using the CN estimated from CN–P relationship; (c) QSSM was predicted using remotely sensed surface soil moisture; and (d) QSWI40 was predicted using soil wetness condition from T = 40.
To describe the rainfall distribution in runoff prediction, the average infiltration rates after runoff response were calculated as follows:
where Ii is the average infiltration after the generation of surface flow (mm/min), α is the slope gradient (°), and t is the rainfall duration (min). As shown in Figure 7, the changing trend of the average infiltration rate and soil moisture with the SWI values (at T = 5, 20, and 40) exhibited a good agreement in general, and the consistency of the SWI (at T = 5) was generally higher than in the other cases. This also explains that the main cause of the difference in SWI values is that the infiltrated soil moisture was collected gradually and formed a lateral flow along the impermeable base according to the topographical features. Moreover, the differences in the average infiltration rate for each site were caused by the differences in the dominant land cover. The results of this study show that the remotely sensed soil moisture considering the infiltration effect can provide a reasonable initial condition to predict the runoff for a range of catchments. However, they should be used with caution according to the regional conditions.
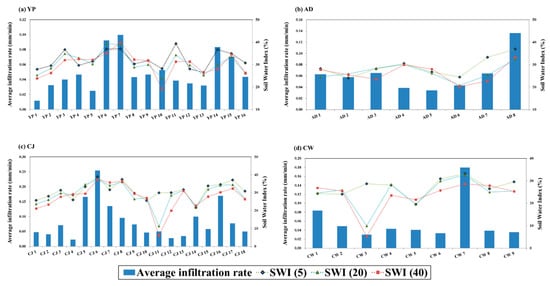
Figure 7.
Average infiltration rate in the rainfall events and the relationship between soil wetness conditions (T = 5, 20, and 40) and the average infiltration rate at four sites: (a) YP; (b) AD; (c) CJ; and (d) CW.
4. Discussion
The four proxy variables based on the measured precipitation, ground-based soil moisture, and remotely sensed soil moisture were verified by comparing them with the maximum potential water retention, Sobs, at the catchment scale. A range of IWC variables was used to describe the initial soil moisture conditions prior to rainfall events through an event-based rainfall–runoff model, the SCS-CN model. A continuous model is able to assess rainfall–runoff modeling with antecedent soil moisture information, but requires a complete time-series of meteorological data. In the limited-data region, the event base model is suitable for the verification of IWC proxy variables using remotely sensed soil moisture. In this procedure, the SWI, which is usually considered in hydrological practice for IWC assessment, was determined as the optimal variable with a correlation coefficient of approximately −0.68, apart from the site IS. The most suitable values for the T parameter were those in the range of 40 to 57 days for sites YP, HS, and AD. They were higher than the standard value used on the global scale, which is T = 20 days []. However, lower values, ranging from 4 to 12 days, were obtained for sites CJ, IS, and CW, most likely due to the soil type differences.
The results of the estimated runoff depth based on the CN–P relationship showed that the remotely sensed surface soil moisture (SSM) and soil wetness index (SWI) were found to be relatively accurate in runoff prediction, with an error reduction greater than 56% and 68%, respectively, and reliable goodness of fit criteria at the four sites (YP, AD, CJ, and CW). The CN value derived by the ASCAT soil moisture data was also shown to be a valid predictor improving runoff prediction. These results indicate that the remotely sensed soil moisture describe a significant portion of the variability in estimating the initial condition, and reduced error in the runoff prediction. Moreover, since the CN values derived by the CN–P relationship using the measured P and Q pairs also reduced the error with improved runoff prediction, the approach calculating QCNP appears to be satisfactory where P and Q data are available or the tabulated CN values are not available.
Note that this study provides a framework by which we can obtain a reasonably good performance in a limited-data region. The IWC framework using the remotely sensed soil moisture can be a useful way of providing a more accurate runoff prediction. Furthermore, this procedure could be extended or combined with other procedures to incorporate multiple site observations, providing a robust IWC framework using a remotely sensed soil moisture dataset and objective functions with derivation methods for various proxy variables. Further studies are necessary to assess the performance of the proposed approach in other limited-data catchments to support these conclusions, particularly in larger-scale catchments. It is necessary to pay more attention to the impact of the rainfall spatial distribution and specific monitoring, which take into account the spatial variability of topographical features. This research will be helpful in determining the accuracy of remotely sensed soil moisture and runoff prediction, as well as various hydrological applications.
Acknowledgments
This research was supported by Space Core Technology Development Program through the National Research Foundation of Korea (NRF) funded by the Ministry of Science, ICT and Future Planning (NRF-2014M1A3A3A02034789). And this work was supported by the National Research Foundation of Korea (NRF) grant funded by the Korea government (MSIP) (NRF-2016R1A2B4008312).
Author Contributions
Wooyeon Sunwoo designed and performed the simulations, analyzed the data, and wrote paper. Minha Choi contributed providing analysis tools and idea in developing manuscript.
Conflicts of Interest
The authors declare no conflict of interest.
References
- Famiglietti, J.S.; Wood, E.F. Multiscale modeling of spatially variable water and energy balance processes. Water Resour. Res. 1994, 30, 3061–3078. [Google Scholar] [CrossRef]
- Alexander, L. Climate science: Extreme heat rooted in dry soils. Nat. Geosci. 2011, 4, 12–13. [Google Scholar] [CrossRef]
- Brocca, L.; Melone, F.; Moramarco, T. On the estimation of antecedent wetness conditions in rainfall–runoff modelling. Hygrol. Process. 2008, 11, 629–642. [Google Scholar] [CrossRef]
- Cho, E.; Choi, M. Regional scale spatio-temporal variability of soil moisture and its relationship with meteorological factors over the Korean peninsula. J. Hydrol. 2014, 516, 317–329. [Google Scholar] [CrossRef]
- Matgen, P.; Heitz, S.; Hasenauer, S.; Hissler, C.; Brocca, L.; Hoffmann, L.; Wagner, W.; Savenije, H.H.G. On the potential of MetOp ASCAT-derived soil wetness indices as a new aperture for hydrological monitoring and prediction: A field evaluation over Luxembourg. Hygrol. Process. 2012, 26, 2346–2359. [Google Scholar] [CrossRef]
- Rötzer, K.; Montzka, C.; Bogena, H.; Wagner, W.; Kerr, Y.H.; Kidd, R.; Vereecken, H. Catchment scale validation of SMOS and ASCAT soil moisture products using hydrological modeling and temporal stability analysis. J. Hydrol. 2014, 519, 934–946. [Google Scholar] [CrossRef]
- Penna, D.; Borga, M.; Norbiato, D.; Fontana, G.D. Hillslope scale soil moisture variability in a steep alpine terrain. J. Hydrol. 2009, 364, 311–327. [Google Scholar] [CrossRef]
- Anctil, F.; Lauzon, L.; Filion, M. Added gains of soil moisture content observations for streamflow predictions using neural networks. J. Hydrol. 2008, 359, 225–234. [Google Scholar] [CrossRef]
- Huang, M.B.; Gallichand, J.; Dong, C.Y.; Wang, Z.L.; Shao, M.A. Use of moisture data and curve number method for estimating runoff in the Loess Plateau of China. Hydrol. Process. 2007, 21, 1471–1481. [Google Scholar] [CrossRef]
- Brocca, L.; Melone, F.; Moramarco, T.; Morbidelli, R. Antecedent wetness conditions based on ERS scatterometer data. J. Hydrol. 2009, 364, 73–87. [Google Scholar] [CrossRef]
- Tramblay, Y.; Bouvier, C.; Martin, C.; Didon-Lescot, J.-F.; Todorovik, D.; Domergue, J.-M. Assessment of initial soil moisture conditions for event-based rainfall-runoff modeling. J. Hydrol. 2010, 387, 176–187. [Google Scholar] [CrossRef]
- Zehe, E.; Graeff, T.; Morgner, M.; Bauer, A.; Bronstert, A. Plot and field scale soil moisture dynamics and subsurface wetness control on runoff generation in a headwater in the Ore Mountains. Hydrol. Earth Syst. Sci. 2010, 14, 873–889. [Google Scholar] [CrossRef]
- Koster, R.D.; Guo, Z.; Yang, R.; Dirmeyer, P.A.; Mitchell, K.; Puma, M.J. On the nature of soil moisture in land surface models. J. Clim. 2009, 22, 4322–4335. [Google Scholar] [CrossRef]
- Petropoulos, G.; Carlson, T.N.; Wooster, M.J. An Overview of the Use of the SimSphere Soil Vegetation Atmosphere Transfer (SVAT) Model for the Study of Land-Atmosphere Interactions. Sensor 2009, 9, 4286–4308. [Google Scholar] [CrossRef] [PubMed]
- Brocca, L.; Melone, F.; Moramarco, T.; Wagner, W.; Naeimi, V.; Bartalis, Z.; Hasenauer, S. Improving runoff prediction through the assimilation of the ASCAT soil moisture product. Hydrol. Earth Syst. Sci. 2010, 14, 1881–1893. [Google Scholar] [CrossRef]
- Coustau, M.; Bouvier, C.; Borrell-Estupina, V.; Jourde, H. Flood modelling with a distributed event-based parsimonious rainfall-runoff model: Case of the karstic Lez river catchment. Nat. Hazards Earth Syst. Sci. 2012, 12, 1119–1133. [Google Scholar] [CrossRef]
- Ochsner, T.E.; Cosh, M.H.; Cuenca, R.H.; Dorigo, W.A.; Draper, C.S.; Hagimoto, Y.; Kerr, Y.H.; Njoku, E.G.; Small, E.E.; Zreda, M. State of the art in large-scale soil moisture monitoring. Soil Sci. Soc. Am. J. 2013, 77, 1888–1919. [Google Scholar] [CrossRef]
- Li, Y.; Grimaldi, S.; Walker, J.; Pauwels, V. Application of Remote Sensing Data to Constrain Operational Rainfall-Driven Flood Forecasting: A Review. Remote Sens. 2016, 8, 456. [Google Scholar] [CrossRef]
- Brocca, L.; Moramarco, T.; Melone, F.; Wagner, W.; Hasenauer, S.; Hahn, S. Assimilation of surface- and root-zone ASCAT soil moisture products into rainfall runoff modeling. IEEE Trans. Geosci. Remote Sens. 2012, 50, 2542–2555. [Google Scholar] [CrossRef]
- Jacobs, J.M.; Myers, D.A.; Whitfield, B.M. Improved rainfall/runoff estimates using remotely sensed soil moisture. J Am. Water Resour. Assoc. 2003, 4, 313–324. [Google Scholar] [CrossRef]
- Kerr, Y.H. Soil Moisture from space: Where we are? Hydrogeol. J. 2007, 15, 117–120. [Google Scholar] [CrossRef]
- Massari, C.; Brocca, L.; Barbetta, S.; Papathanasiou, C.; Mimikou, M.; Moramarco, T. Using globally available soil moisture indicators for flood modelling in Mediterranean catchments. Hydrol. Earth Syst. Sci. 2014, 18, 839–853. [Google Scholar] [CrossRef]
- Wanders, N.; Karssenberg, D.; Roo, A.D.; De Jong, S.M.; Bierkens, M.F. The suitability of remotely sensed soil moisture for improving operational flood forecasting. Hydrol. Earth Syst. Sci. 2014, 18, 2343–2357. [Google Scholar] [CrossRef]
- Guo, Z.T.; Zhou, X.; Wu, H.B. Glacial-interglacial water cycle, global monsoon and atmospheric methane changes. Clim. Dyn. 2012, 39, 1073–1092. [Google Scholar] [CrossRef]
- Rural Development Administration Network. Available online: http://rda.go.kr (accessed on January 2011 to October 2013).
- Korean Soil Information System. Available online: http://soil.rda.go.kr (accessed on January 2011 to October 2013).
- Wagner, W.; Lemoine, G.; Rott, H. A method for estimating soil moisture from ERS scatterometer and soil data. Remote Sens. Environ. 1999, 70, 191–207. [Google Scholar] [CrossRef]
- Naeimi, V.; Scipal, K.; Bartalis, Z.; Hasenauer, S.; Wagner, W. An improved soil moisture retrieval algorithm for ERS and METOP scatterometer observations. IEEE Trans. Geosci. Remote Sens. 2009, 47, 1999–2013. [Google Scholar] [CrossRef]
- Brocca, L.; Hasenauer, S.; Lacava, T.; Melone, F.; Moramarco, T.; Wagner, W.; Dorigo, W.; Matgen, P.; Martínez-Fernández, J.; Llorens, P.; et al. Soil moisture estimation through ASCAT and AMSR-E sensors: An intercomparison and validation study across Europe. Remote Sens. Environ. 2011, 115, 3390–3408. [Google Scholar] [CrossRef]
- Sinclair, S.; Pegram, G.G.S. A comparison of ASCAT and modelled soil moisture over South Africa, using TOPKAPI in land surface mode. Hydrol. Earth Syst. Sci. 2010, 14, 613–626. [Google Scholar] [CrossRef]
- Albergel, C.; Calvet, J.C.; De Rosnay, P.; Balsamo, G.; Wagner, W.; Hasenauer, S.; Naeimi, V.; Martin, E.; Bazile, E.; Bouyssel, F.; et al. Cross-evaluation of modelled and remotely sensed surface soil moisture with in situ data in Southwestern France. Hydrol. Earth Syst. Sci. 2010, 14, 2177–2191. [Google Scholar] [CrossRef]
- Bisselink, B.; van Meijgaard, E.; Dolman, A.J.; de Jeu, R.A.M. Initializing a regional climate model with satellite-derived soil moisture. J. Geophys. Res. 2011, 116, D02121. [Google Scholar] [CrossRef]
- Ponce, V.M.; Hawkins, R.H. Runoff curve number: Has it reached maturity? J. Hydrol. Eng. 1996, 1, 11–18. [Google Scholar] [CrossRef]
- Hawkins, R.H.; Ward, T.J.; Woodward, D.E.; Van Mullem, J.A. Curve Number Hydrology: State of the Practice; Report of ASCE/EWRI Task Committee; American Society of Civil Engineers: Reston, VA, USA, 2008; pp. 9–46. [Google Scholar]
- D’Asaro, E.A.; Thomson, J.; Scherbina, A.Y.; Harcourt, R.R.; Cronin, M.F.; Hemer, M.A.; Fox-Kemper, B. Quantifying upper ocean turbulence driven by surface waves. Geophys. Res. Lett. 2014, 41, 1–6. [Google Scholar] [CrossRef]
- Hawkins, R.H. Asymptotic determination of runoff curve numbers from data. J. Irrig. Drain. Eng. 1993, 119, 334–345. [Google Scholar] [CrossRef]
- Hjelmfelt, A.T., Jr.; Woodward, D.A.; Conaway, G.; Plummer, A.; Quan, Q.D.; Van Mullen, J.; Hawkins, R.H.; Rietz, D. Curve numbers, recent developments. In Proceedings of the 29th Congress of the International Association of Hydraulic Engineering and Research, Beijing, China, 16–21 September 2001.
- Rawls, W.J.; Brakensiek, D.L.; Saxton, K.E. Estimation of soil water properties. Trans. ASAE 1982, 25, 1316–1320. [Google Scholar] [CrossRef]
- Cosby, B.; Hornberger, G.; Clapp, R.; Ginn, T. A statistical exploration of the relationships of soil moisture characteristics to the physical properties of soils. Water Resour. Res. 1984, 20, 682–690. [Google Scholar] [CrossRef]
- Cho, E.; Choi, M.; Wagner, W. An assessment of remotely sensed surface and root zone soil moisture through active and passive sensors in northeast Asia. Remote Sens. Environ. 2015, 160, 166–179. [Google Scholar] [CrossRef]
- Draper, C.; Walker, J.P.; Steinle, P.; De Jeu, R.A.M.; Holmes, T.R.H. An evaluation of AMSR-E derived soil moisture over Australia. Remote Sens. Environ. 2009, 113, 703–710. [Google Scholar] [CrossRef]
- Liu, Y.Y.; Parinussa, R.M.; Dorigo, W.A.; De Jeu, R.A.; Wagner, W.; Van Dijk, A.I.; McCabe, M.F.; Evans, J.P. Developing an improved soil moisture dataset by blending passive and active microwave satellite-based retrievals. Hydrol. Earth Syst. Sci. 2011, 15, 425–436. [Google Scholar] [CrossRef]
- Loew, A. Impact of surface heterogeneity on surface soil moisture retrievals from passive microwave data at the regional scale: The Upper Danube case. Remote Sens. Environ. 2008, 112, 231–248. [Google Scholar] [CrossRef]
- Nishat, S.; Guo, Y.; Baetz, B.W. Antecedent soil moisture conditions of different soil types in South-Western Ontario. Can. Hydrol. Process. 2010, 24, 2417–2424. [Google Scholar] [CrossRef]
- Chaney, N.; Roundy, R.; Herrera-Estrada, J.; Wood, E. High-resolution modeling of the spatial heterogeneity of soil moisture: Applications in network design. Water Resour. Res. 2015, 51, 619–638. [Google Scholar] [CrossRef]
- Crow, W.T.; Bindlish, R.; Jackson, T.J. The added value of spaceborne passive microwave soil moisture retrievals for forecasting rainfall-runoff ratio partitioning. Geophys. Res. Lett. 2005, 32, L18401. [Google Scholar] [CrossRef]
- Lacava, T.; Brocca, L.; Calice, G.; Melone, F.; Moramarco, T.; Pergola, N.; Tramutoli, V. Soil moisture variations monitoring by AMSU-based soil wetness indices: A long-term inter-comparison with ground measurements. Remote Sens. Environ. 2010, 114, 2317–2325. [Google Scholar] [CrossRef]
- Nash, J.E.; Sutcliffe, J.V. River flow forecasting through conceptual models part I—A discussion of principles. J. Hydrol. 1970, 10, 282–290. [Google Scholar] [CrossRef]
- Kustas, W.P.; Goodrich, D.C. Preface to the special section on Monsoon 90. Water Resour. Res. 1994, 30, 1211–1225. [Google Scholar] [CrossRef]
© 2017 by the authors. Licensee MDPI, Basel, Switzerland. This article is an open access article distributed under the terms and conditions of the Creative Commons Attribution (CC BY) license ( http://creativecommons.org/licenses/by/4.0/).