Abstract
Flat (F), mini-ditch (MD), and ridge-furrow (RF) are three conventional cotton planting patterns that are usually adopted around the world, yet soil and crop responses to these three patterns are poorly studied, as is their suitability for increasing yield for coastal areas in Eastern China. The effects of three planting methods on water and salt dynamics as well as on growth and lint yield of cotton (Gossypium hirsutum L.) were investigated in a saline field in Bohai Rim, China, to select the best planting pattern for cultivating coastal saline fields of Eastern China. Soil moisture in the root zone with RF was 11.9% and 12.1% higher than with F and MD, whereas the electrical conductivity of a saturated soil extract (ECe) in the root zone with RF was 18.0% and 13.8% lower than with MD and F, respectively, during the growth period, which indicated that RF could efficiently collect rainfall and leach salt in the root zone. After drip irrigation, the infiltration and salt-leaching depth with RF were both deeper than that with F and MD. The stand establishment of MD was the highest (80.3%) due to the greenhouse effect from film mulching, and was 12.8% and 4.6% higher than that with F and RF, respectively. Growth indicators and lint yield demonstrated that RF was superior to F and MD because of the higher soil moisture and lower ECe. The lint yield was significantly higher in RF, suggesting that RF can be an optimal planting pattern for agricultural reclamation in similar saline-alkaline areas around the world.
1. Introduction
Salinity is one of the most important factors limiting the productivity of agricultural crops, and yield is greatly increased when soil salinity is managed to fall below the tolerance threshold of a crop [1,2]. The uncultivated coastal saline plains of the Western Bohai Rim in Northern China are about 670,000 ha, accounting for nearly a quarter of the area with low agricultural production in this region [3,4]. The soils of these plains are highly saline with low crop productivity and cannot meet local agricultural demands for food [4]. Several methods have been introduced to solve the issues of many uncultivated and poorly productive fields and food shortages in this region, including comprehensive improvements such as river sediment amelioration, chemical remediation, and phytoremediation, all of which have been successful in salt alleviation [5,6,7]. However, these remediation measurements can take effect only when they are combined with large amounts of irrigation [8], and available irrigation resources are scarce in these saline areas [9]. Appropriate planting patterns could influence water and salt transport by controlling evaporation and distributing rainfall [10]; moreover, they are inexpensive and do not pollute the soil. Thus, planting patterns are an environmentally friendly way to moderate soil salinity [11].
Flat (F), mini-ditch (MD), and ridge-furrow (RF) are three conventional planting patterns used around the world [11,12,13]. Flat planting is widely accepted for its ease of implementation and is usually regarded as a control when investigating the influence of seeding depth, planting date, planting density, irrigation, or other factors on yield [11,14]. MD is another agronomic technique that is commonly used in arid and semiarid areas [15]. The MD method can increase stand establishment and yield when the soil temperature is suitable [16], while it might delay plant emergence and reduce seedling vigor and yield when the soil temperature is low [17]. However, in other cases, the MD method has no significant influence on stand establishment and yield [18]. When combined with plastic film mulching, the MD method shows a positive effect on crop growth by increasing soil moisture and temperature [19,20]. Ridge-furrow planting, which is well known for efficiently capturing rainfall and improving water-use efficiency, is widely used in the arid and semiarid areas [21]. Li et al. [22] found that RF can increase yield and water-use efficiency by 1.9 and 1.8 times, respectively, when compared to F in Northwestern China. Devkota et al. [11,23] compared different planting patterns for salinity management and found that RF could efficiently reduce salinity in the soil profile in Central Asia. Other studies have also indicated that RF could increase crop yield by 40%–150% when compared to F in arid and semiarid areas [12,21], but it is not known whether RF is suitable for cotton planting in coastal areas.
Around the Bohai Rim, F is the only planting pattern for cotton cultivation [20]. Although cotton is regarded as the most salt-tolerant of the annual crops, the stand establishment rate, growth, and lint yield in this region are relatively low because of high salinity in soils [24,25,26]. Reducing salt content and improving the soil environment for crop growth is important in increasing yield [24,25]. Though studies of F and MD or F and RF have been conducted to investigate the effects on soil water and salt dynamics as well as on crop production [13,24], most of these experiments were carried out in the inland with dry climates, not in the coastal region with a semi-humid climate [11,12]. Planting patterns such as MD and RF, which have proved beneficial for increasing yield in other parts of the world [21], need to be introduced in this region. Water and salt movement, as well as crop production, respond differently to the same planting pattern under the dry and semi-humid conditions [27].
Plastic film mulching is essential when soil temperature is low and evaporation is extensive [20,28]. According to Wang et al. [29], soil temperature 5 cm under the plastic film mulching was 3–5 °C higher than that without plastic film mulching. Du et al. [30] found that plastic film mulching can increase winter wheat yield from late winter to early spring in the North China Plain. When there was a gap between the plastic and soil, Dong et al. [31] found that the temperature in the gap was 1.9 °C higher than that outside the mulch, and the seedling biomass and lint yield were significantly higher than when there was no gap. The effects of plastic film mulching on increasing soil temperature and moisture have been acknowledged, but the effects of plastic film mulching under different planting patterns are not well documented.
Few studies have compared the influence of F, MD, and RF on the soil environment (soil moisture and salt) and crop growth (plant height, leaf area, aboveground biomass, and root-length density) in coastal saline areas, and it is not known which planting pattern is more suitable for these areas. Therefore, the objective of this study was to investigate the response of soil water and salt movement as well as cotton growth to F, MD, and RF planting and to select the best pattern for cultivating the heavy soil in a coastal field along the Bohai Rim.
2. Results
2.1. Temporal and Spatial Distribution of Soil Water and Electrical Conductivity of a Saturated Extract
2.1.1. Soil Water Content
The soil water content of the 0–80 cm layer of the three planting patterns showed a dramatic decrease from 63 to 97 days after sowing (DAS) and a sharp increase from 97 to 136 DAS (Figure 1a). Soil water content was significantly affected by planting pattern and sampling date, but they did not have a significant interaction effect on soil water content (Table 1). Soil water content in RF was 11.9% higher than that of F and was 12.1% higher than that of MD during the growth period, and the coefficients of variation of soil water content for F, MD, and RF were 0.061, 0.054, and 0.069, respectively. Compared to soil water content at the sowing, soil water content at harvest increased by 11.7% and 10.8% for F and MD, respectively, while it decreased by 12.8% for RF.
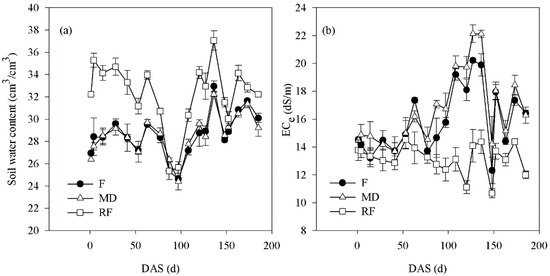
Figure 1.
Temporal dynamics of (a) soil water content and (b) ECe under the mulch in 0–80 cm layer for flat (F), mini-ditch (MD), and ridge-furrow (RF) planting during the cotton growth period. DAS means days after sowing. Values are mean ± standard error (n = 3).

Table 1.
Repeated measures ANOVA of soil water content and ECe affected by different planting patterns.
Spatial distribution of soil water content showed an increasing trend with the increase of soil depth during the driest period for the three planting patterns (Figure 2a–c). Soil water content in the whole profile of RF was the highest (26.5%), and was 3.0% and 2.0% higher than that of F and MD, respectively. Moreover, soil water content of the 20–80 cm layer under the RF mulched was 11.4% higher than that of the unmulched area, while smaller differences were found for F (−3.1%) and MD (0.7%). The infiltration depth of F, MD, and RF was 30 cm, 30 cm, and 50 cm, respectively at 12 h after drip irrigation (Figure 3a–c). Soil water content of RF in the 0–30 cm layer was 5.1% and 5.0% higher at 120 h after drip irrigation than at 0 h (before drip irrigation) for F and MD, and soil water content in the 20–50 cm layer was 15.8% higher at 120 h after drip irrigation than at 0 h for RF.
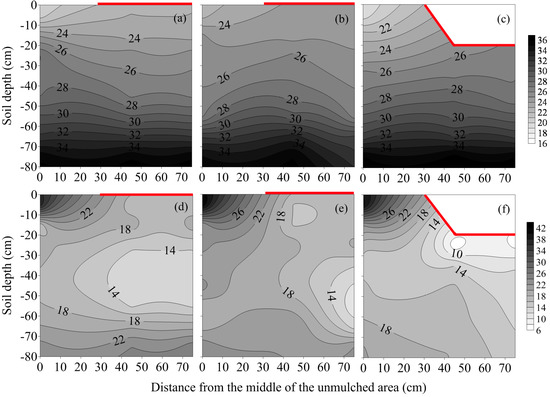
Figure 2.
Spatial distributions of (a–c) soil water content (cm3/cm3) and (d–f) ECe (electrical conductivity of soil paste extract) (dS/m) in 0–80 cm layer at 97 DAS (boll-setting stage). (a,d) flat (F); (b,e) mini-ditch (MD); and (c,f) ridge-furrow (RF) planting. DAS means days after sowing. Red lines represent plastic film.
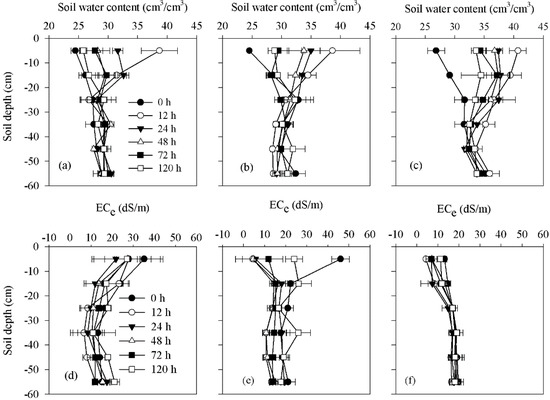
Figure 3.
Distributions of (a–c) soil water content and (d–f) ECe in 0–60 cm layer beneath the emitter before (0 h) and after (12 h, 24 h, 48 h, 72 h, 120 h) drip irrigation at 54 DAS (squaring stage). (a,d) flat (F); (b,e) mini-ditch (MD); and (c,f) ridge-furrow (RF) planting. DAS means days after sowing. Values are mean ± standard error (n = 3).
2.1.2. Electrical Conductivity of the Saturated Soil Extract (ECe)
Planting pattern, sampling date, and their interaction all significantly affected the temporal distribution of ECe (Table 1). The value of ECe in the root zone of RF was 18.0% lower than that for MD and was 13.8% lower than for F, and the coefficients of variation of ECe were 0.15, 0.16 and 0.08 for F, MD, and RF, respectively, during the growth period. The increase in ECe of F and MD during 97–136 DAS was obviously higher than that of RF (Figure 1b), and the ECe decreased dramatically during 136–148 DAS for the three planting patterns. Compared to soil ECe at the sowing, soil ECe at harvest increased by 13.2% and 12.4% for F and MD, respectively, while it decreased by 12.8% for RF.
The spatial distribution of ECe for the three planting patterns during the driest period showed a decreasing trend from the surface layer to the deepest layer (Figure 2d–f). Film mulching clearly lowered the salinity: mulched soil ECe was 29.9% less than that of the unmulched soil for F; the corresponding values were 40.7% and 42.1% for MD and RF, respectively. The ECe of the three patterns in the 0–20 cm layer dropped dramatically from 0 to 12 h after drip irrigation, and it then slowly increased from 12 to 120 h (Figure 3d–f). The salt-leaching depth of ECe was 10, 10 and 30 cm for F, MD, and RF, respectively, at 12 h after drip irrigation. At 120 h after drip irrigation, the ECe of F, MD, and RF in the top 10 cm was 15.3%, 51.8%, and 47.9% lower than that at 0 h, respectively.
2.2. Plant Growth
2.2.1. Root-Length Density (RLD)
Roots were mainly confined to the top 0–40 cm layer for F and MD and the 20–60 cm layer for RF (Figure 4), and the corresponding RLD for F, MD, and RF was 0.73, 0.82, and 0.90 cm/cm3, respectively. Moreover, RLD in RF was 23.3% and 9.8% higher than that in F and MD. Outside the mulch, RLD was 51.7%, 27.0%, and 96.4% lower than that under the mulch for F, MD, and RF, respectively.
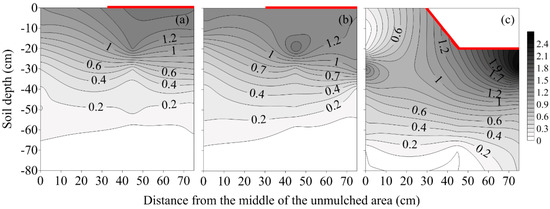
Figure 4.
Root-length density (RLD) (cm/cm3) distribution in 0–80 cm layer at 121 DAS (boll-setting stage). (a) flat (F); (b) mini-ditch (MD); and (c) ridge-furrow (RF) planting. DAS means days after sowing. Red lines represent plastic film.
2.2.2. Aboveground Growth Indicators
A significant difference was found at both 36 and 126 DAS for the aboveground growth indicators of the three planting patterns (Table 2). The stand establishment rate (80.3%) in MD was the highest and was significantly higher (12.8% and 4.6%, respectively) than that of F and RF (Table 2). At 126 DAS, plant height in RF was 109.7% and 94.4% higher than that of F and MD, and the aboveground biomass per plant in RF was 185.3% and 145.4% higher than that of F and MD (Table 2). At both 36 and 126 DAS, RF showed the best growth performance among the three planting patterns.
Table 2.
Stand establishment rate, plant height, leaf area, number of branches with infructescences per plant (fruiting branches), and aboveground biomass at 36 DAS (seedling stage) and 126 DAS (boll-setting stage) as affected by flat (F), mini-ditch (MD), and ridge-furrow (RF) planting.
2.3. Yield Components and Fiber Quality
Significant differences (p < 0.05) were found in lint yield and number of bolls per plant among F, MD, and RF (Table 3). The highest lint yield was obtained in RF, with a value of 927.9 kg/ha, which was 50.4% and 66.1% higher than that in MD and F, respectively. The number of bolls per plant in RF was also the highest (10.3 per plant) and 87.9% and 80.7% higher than that in MD and F, respectively (Table 3). However, no significant differences were found in lint percentage, boll weight, and fiber quality among the three planting patterns (p > 0.05) (Table 3).
Table 3.
Yield components and fiber quality as affected by flat (F), mini-ditch (MD), and ridge-furrow (RF) planting.
3. Materials and Methods
3.1. Experimental Site Description
The field experiment was conducted from April to October in 2014 at the state-run farm in Haixing County (38°05′03″ N, 117°23′48″ E; 6 m above sea level), southeast of Cangzhou City, Hebei Province, China. The farm is about 42 km from the Western Bohai Rim. The average annual rainfall was 482 mm in 1960–2010, and more than 75% of the rainfall occurs from June to September; total rainfall in 2014 was 400 mm and was 17.1% less than the average rainfall of the past 50 years (Figure 5a). There were 50 rainfall events with a total of 352.5 mm during the 185-day growth period of cotton (Figure 5b). The local freshwater aquifers are 320–600 m below the surface, while the water table (0.5–3 m below the surface) is high in salinity (more than 25 dS/m). The soil is predominantly silt loam (USDA classification) [32], which is the typical soil type of coastal farmlands in this region. Details of soil mechanical composition, bulk density, field capacity, ECe (electrical conductivity of saturated soil extract), and pH of the local soil are shown in Table 4. The surface soil (0–40 cm) contained 76 mg/kg organic matter, 420 mg/kg total N, 3.78 mg/kg available P, 176.02 mg/kg available K, with a pH of 7.56 (soil/water ratio of 1:5 by weight) and an ECe of 21.4 dS/m before the experiment.
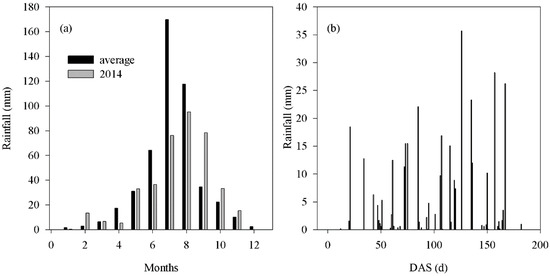
Figure 5.
(a) Monthly average rainfall distribution during the past 50 years (1960–2010) and in 2014; (b) Daily rainfall distribution after sowing in 2014. DAS means days after sowing.
Table 4.
Soil mechanical composition, bulk density, field capacity, ECe (electrical conductivity of saturated extracts), and pH (pH of saturated extract, 1:5 soil: water, w/w) of the test site soil.
3.2. Experimental Design
The experimental area was 218.7 m2 (4.5 m × 48.6 m) in total, divided into three blocks with an area of 72.9 m2 (4.5 m × 16.2 m), and there were three replications in a randomized block arrangement (Figure 6a). Each block accommodated three plots (4.5 m × 5.4 m), which were F, MD, and RF, respectively (Figure 6a). The field was plowed, harrowed, and leveled with a rotary cultivator (1GQN-230, Tongtian Co., Shijiazhuang, China) in preparation for planting 10 days before sowing. Cotton (Gossypium hirsutum L.) cv ‘Jiza No. 1’ was chosen as the tested cultivar and is widely planted in the experimental area. Cotton was sown on 22 April and harvested on 23 October in 2014.
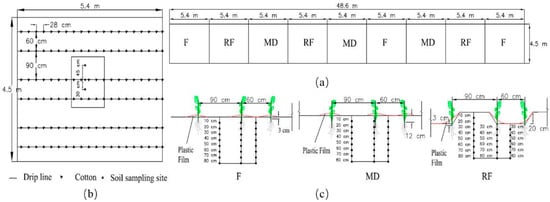
Figure 6.
(a) The schematic diagram of plot layout; (b) cotton row spacing, sampling position, and drip line layout; and (c) planting patterns for the experiment. Black dots represent sampling points. Red lines represent plastic film.
All planting patterns were established with a north–south orientation to each row. The seeding furrow was 3 cm deep for F and RF, and 12 cm deep for MD (Figure 6c). Cottonseeds were put into the seeding furrow and individually covered with 3 cm of soil, but the rest of the furrow was not filled in. The planting rows had an alternating narrow–wide spacing of 60–90 cm for the three patterns (Figure 6b), and the narrow rows were mulched with transparent plastic film (6 μm thick and 100 cm wide). There was an approximately 9 cm gap between the film and the seeding furrow for MD, and the 12 cm depth for MD was chosen after reviewing similar studies such as Dong et al. [31]. For RF, the ridges were 20 cm high and the bottom width of the furrows was 60 cm (Figure 6c). For all the planting patterns, cottonseeds were sown manually 28 cm apart.
3.3. Irrigation and Fertilization
Each planting row was equipped with one line of drip tape (Figure 6b). The drip tape was 0.04 cm thick and 1.6 cm in diameter, with an emitter spacing of 30 cm and a discharge rate of 2.4 L/h. Drip irrigation was initiated whenever the soil water content of the root zone (0–80 cm layer) fell below 70% of field capacity [33]. During the growth period, cotton was irrigated three times (at 1, 54, and 86 days after sowing (DAS)), and 75 m3/ha of fresh water (0.83 dS/m) was applied each time. Compound fertilizer (18% N, 18% P2O5, and 18% K2O) was applied at 450 kg/ha as top dressing at the sowing, and 300 kg/ha urea (46% N) was applied at the early flowering stage with fertigation. Herbicides were used before planting, insecticides were applied every 5–7 days from the seedling stage to the boll-opening stage with a sprayer pump, and topping was carried out manually at 90 DAS, which is consistent with the local agronomic practices.
3.4. Sampling and Measurements
3.4.1. Soil Water Content and ECe
Soil samples for water content and ECe measurements were taken with an auger (2.0 cm diameter) at an interval of 7 days after sowing from each plot. The soil samples were taken at 10 cm intervals from the midpoint between two neighboring plants along the row from 0 to 80 cm for F and MD and from 20 to 80 cm for RF (Figure 6c). To quantify the influence of the planting pattern on soil water and ECe distribution during the driest period, at 97 DAS (boll-setting stage), soil samples were taken from three locations, the unmulched midpoint between the wide rows that were 90 cm apart, the midpoint between the two neighboring plants along the row, and the mulched midpoint between the narrow rows that were 60 cm apart, to a depth of 80 cm in 10 cm increments for the three planting patterns (Figure 6). In addition, to evaluate soil water content and ECe dynamics under different planting patterns, we also monitored soil moisture and ECe at 10 cm intervals in the 0–60 cm layer for F and MD and the 20–80 cm layer for RF underneath the emitter before (0 h) and after (12, 24, 48, 72, and 120 h) the second drip irrigation event (54 DAS, squaring stage) for each plot.
Soil water content was determined by the oven-drying method and was converted to volumetric water content with the corresponding layer’s bulk density (Table 4). Soil salinity was evaluated by measuring ECe. The soil samples were air-dried, ground, and passed through a 2 mm sieve, and the electrical conductivity (EC1:5) of the soil extract (1:5 soil/water ratio by weight) was measured using a conductivity meter (DDS-307, Shanghai Precision and Scientific Instrument Co., Ltd., Shanghai, China). To convert EC1:5 to ECe, the relationship between ECe and EC1:5 was determined using Wallender’s method [5]:
ECe = 10 EC1:5 + 0.378, n = 48, R2 = 0.996.
3.4.2. Plant Growth
Root Length Density (RLD)
Root samples were taken from each plot to analyze root-length distribution at 121 DAS (the boll-setting stage). For F and MD, root sampling depth ranged from 0 to 80 cm in 10 cm increments at the unmulched midpoint between the wide rows, directly below the cotton plant, and at the mulched midpoint between the narrow rows. For RF, root sampling depth ranged from 0 to 80 cm in 10 cm increments at the midpoint between the wide rows, and from 20 to 80 cm in 10 cm increments directly below the cotton plant and the mulched midpoint between the narrow rows. The root auger bucket (XDB 307, Beijing New Landmark Soil Equipment Co., Beijing, China) had an inner diameter of 7 cm and was 10 cm long. The root samples were washed with tap water, scanned with a flatbed image scanner (Pro Ver. 700, Epson Inc., Long Beach, CA, USA), and analyzed using WinRhizo (Pro 2007, Regent Instruments Inc., Ville de Québec, QC, Canada) to calculate RLD.
Aboveground Growth
The number of established plants was counted in the two center rows in each plot at 36 DAS (seedling stage). The stand establishment rate was calculated as follows [34]:
where Se is the stand establishment rate (%), Nh is the number of healthy plants in the two center rows of 3 m each, Ns is the number of seeds sown, and Gp is the germination rate (%).
Se = Nh/(Ns × Gp) × 100%
Plant height and leaf area (LA) were measured at 36 DAS and 126 DAS (boll-setting stage). The aboveground biomass (stems, leaves, branches, and bolls) in each plot was determined gravimetrically by oven-drying the samples at 105 °C for 30 min and then at 75 °C for 48 h.
Lint Yield and Fiber Quality
Cotton was harvested manually from the two center rows in each plot and lint yield (kg/ha) was determined after ginning. Yield components (number of bolls per plant, boll weight, and lint percentage) were determined from 10 randomly selected mature plants per plot. The fiber quality properties (length, micronaire, strength, and uniformity of fiber length) were determined using a high-volume cotton classification machine [35] (HVI 900; Uster Technologies, Uster, Switzerland) at the Cotton Quality Supervision, Inspection, and Testing Center of China’s Ministry of Agriculture, Anyang, China.
Statistical Analysis
An analysis of variance (ANOVA) with Fisher’s least significant difference (LSD) (p < 0.05) was used to determine differences between means. The analyses were carried out using SPSS (Ver. 16.0, SPSS Inc., Chicago, IL, USA). Distributions of rainfall, soil water content, and ECe, were created using Surfer (Ver. 9.0, Golden Software Inc., Golden, CO, USA) and Sigmaplot (Ver. 10.0, Systat Software, San Jose, CA, USA).
4. Discussion
4.1. RF Increased Soil Water Content and Decreased ECe in the Root Zone
The soil water content dynamic is determined by water compensation and water consumption [36,37]. In this experiment, the soil water content dynamic of the three planting patterns showed similar trends during the growth period. The RF pattern, with 20 cm high ridges, could not only collect rainfall but also reduce runoff [21]. Therefore, soil moisture in the root zone of RF was relatively higher than that of F and MD during the whole season. Crop water consumption has a positive relationship with growth indicators [38]. There was a decrease for RF and an increase for F and MD in soil moisture after cotton harvesting, which was attributed to greater water consumption in RF because of its greater RLD and aboveground growth indicators (Figure 4 and Table 2).
The dynamics of soil water content and ECe in the three planting patterns showed an increasing trend from 97 to 136 DAS (Figure 1), which was similar to the results of Harter et al. [39] and Abliz et al. [40], who studied sites where the groundwater was at a shallow depth (1–2 m) and had high salinity (15 dS/m). However, our results were not consistent with the results in the North China Plain where the groundwater table was below 7 m [27]. One possible explanation for the trend may be that the high groundwater table rose with intensive rainfall and increased the ECe in the upper soil layer. The ECe increase in RF was smaller than that in F and MD from 97 to 136 DAS (Figure 1b) because the furrow can collect rainfall, thereby reducing salinity; moreover, salt in the furrow can also be transported to the ridge by evaporation. Similar findings were also reported in Central Asia, where the climate conditions were completely different from the studied region [11,23]. There was a decrease in ECe in the three planting patterns as the groundwater level dropped with drainage from 136 to 148 DAS, which reflects the fact that salt in the upper soil layer can be transported to deeper soil layers with water flow. The ECe is influenced by both the total precipitation and the annual leaching fraction [41]. In this study, most of the rainfall events were less than 25 mm in 2014, showing that this year was a relatively dry year, and soil ECe of F and MD showed an increasing trend because rainfall infiltration was hindered by the plastic film and salt accumulated in the root zone as roots took up water, whereas, for RF, soil ECe was decreased because the collected rainfall in the furrow can infiltrate into the soil through the planting hole and leach salt out of the root zone. The ECe variations of these three planting patterns indicated that the leaching fraction can also be influenced by planting patterns, as found in another study [42].
Crops usually suffer the severest stress from drought and salt during the driest period of the year [10], and soil water and salt distribution during the driest period can clearly reflect the ability of different planting patterns to control water and salt content [43]. Similarly, the soil moisture and ECe dynamics before and after drip irrigation can also reflect the ability of different planting patterns to retain water and lower ECe [44]. In this experiment, for both the whole soil profile and the root zone of RF, soil moisture was higher, and ECe was lower than that of F and MD, which indicated that RF was better at alleviating water and salt stress than F and MD. Similarly, Devkota et al. [23] also found higher moisture and lower ECe in furrow soil than in F, as soil moisture pooled in the furrow while salt could move to the ridge through evaporation, which confirmed that RF was a good planting pattern for water and salt management.
Soil water infiltration and salt leaching depth are influenced by various factors [45]. In this study, the ridges were 20 cm higher than the furrow and could prevent runoff. Moreover, the “plow pan” of the furrow was broken, which enabled water and salt to infiltrate to a deeper layer. The porosity of the soil plowed to 20 cm was higher than that of soil plowed to 5 cm, which enhanced the infiltration and water storage capacity of deeper soil [46]. Thus, both the water infiltration depth and salt-leaching depth in RF were deeper than those of F and MD. The infiltration depth was deeper than the salt-leaching depth for the three planting patterns, primarily because the dispersion coefficient of salt was small when compared to that of water. Chen et al. [47] found similar results in a saline water irrigation experiment.
4.2. RF Promoted Cotton Growth and Improved Lint Yield
Previous research has shown that RLD can effectively reflect root water uptake ability, and root growth can be influenced by the distribution of soil water content and ECe [48]. In this study, the RLD of RF was the highest, and the RLD of these three planting patters was higher in the mulched area than in the unmulched area, which could be attributed to the higher water content and lower ECe in both RF and the mulched area that provided a suitable soil environment for root growth. The results were similar to the split root system, in that both the plant growth and yield were higher with unequal salinity distribution than with equal salinity distribution, because plant roots were able to take up enough water from soil in the low-salinity environment [34]. In the Yellow River Delta of China, Dong et al. [49] also found that RF could increase stand establishment and lint yield of cotton in a saline field.
A conducive soil environment for seedlings could increase the stand establishment rate and promote crop growth [50]. Plastic film mulching has proved to be an effective measure to increase soil temperature and to reduce evaporation as well as to prevent salt accumulation [49,50]. However, according to Li et al. [51], the temperature under mulch could reach to more than 50 °C at 14:00 during the daytime, and the seedlings might be burned or killed in such a high-temperature environment. In this study, the gap between the soil and the plastic mulch could moderate the temperature as the specific heat capacity of soil is higher than that of air [32]. Thus, MD had the highest stand establishment rate. In a nearby experimental site, Wang et al. [20] also found that the soil moisture was higher and the ECe was lower under plastic mulching in MD than in F. Thus, the plastic mulching provided suitable temperatures and contributed to desalination, which was beneficial to the plants. The stand establishment rate has a positive relationship with soil enzymes and organic matter [52]. The stand establishment rate of RF was lower than that of MD because the soil enzymes and organic matter in the furrow were reduced as the upper 20 cm of soil was moved to the ridge. The stand establishment rate of RF was higher than that of F, which was consistent with the results of Joshi [53], who found that the furrow combined with film mulching could provide a higher soil moisture and lower salinity environment than F. In short, the greenhouse effect from the mulch could improve the stand establishment rate through the combination of higher soil moisture and lower ECe as well as suitable temperatures.
In general, crop growth as well as development processes have a close relationship with soil moisture and ECe [54]. The RF pattern provided a relatively suitable environment of soil moisture and ECe for root water uptake. Indeed, plant growth indicators and lint yield of RF were remarkably superior to those of MD and F (Table 2 and Table 3). The results were in accordance with studies that RF could increase yield by 40%–150% when compared to F in Northwestern China [12,21]. However, Zhang et al. [55] found that yield of RF was lower than that of F in the Huang-Huai-Hai plain of China for winter wheat because the narrow furrow lowered seeding density per area. In addition, there is a decrease in yield with RF when too much water is present in the root zone, as the water may impede root respiration [56]. Therefore, the implementation of RF should consider crop species, crop density, and soil moisture condition.
For the same genotype, cotton fiber quality is determined by the comprehensive effects of different environmental factors [57]. When soil moisture is below 50% of the available water, fiber length could be significantly affected [58], while the effects of salinity stress on fiber characteristics vary [59]. Bernstein [60] reported that fiber length and strength decreased with increased salinity, while fiber fineness was scarcely affected by soil salinity. According to Razzouk and Whittington [61], increasing levels of salinity (5.42–20.31 dS/m) have no effects on fiber length and maturity percentage. In the present study, there were no significant differences of fiber quality among the three planting patterns, possibly because the soil moisture in the root zone were relatively high (all above 60% of the field capacity) and cannot cause cotton water stress [33] across the growth period for the three treatments, and ECe were not large enough to influence the fiber quality.
5. Conclusions
Proper planting patterns such as RF can manage soil water and salinity efficiently and are beneficial for the resulting crop growth and yield increase. The MD pattern showed the highest stand establishment rate as the greenhouse effect from the gap formed by the mulch provided a better environment for seedling growth. The RF pattern had the highest lint yield among the three planting patterns and has the potential to increase yield in highly saline fields in Bohai Rim. The greater yield in RF is mainly because the furrow could collect rainfall and increase soil water content and lower ECe, and then promote root water uptake and crop growth. Therefore, RF can be regarded as a preferred planting pattern for similar saline-alkaline conditions around the world. Moreover, RF can decrease salt content in the root zone, which will also be a great benefit for agro-ecosystem stability and agricultural sustainability in the areas with heavily saline-alkaline soils. Therefore, RF was a proper planting pattern in increasing crop production and reclaiming agricultural land in the saline-alkaline regions.
Acknowledgments
Financial support for this study was provided by the China Agriculture Research System (Grant No.: CARS-18-19) and the National Natural Science Foundation of China (Grant Nos.: 51179193 and 51209207). We gratefully acknowledge the Institute of Cotton Hebei Academy of Agriculture and Forestry Science and the State-run Farms Haixing of Hebei Province for their selfless support for this study. We are also grateful to other anonymous reviewers for their valuable comments on the manuscript.
Author Contributions
The research presented here was carried out in collaboration between all authors. Chitao Sun, Junpeng Zhang and Jingsheng Sun conceived the idea and designed the study; Chitao Sun and Di Feng carried out the data analysis and prepared the first draft of the manuscript; Zhaorong Mi, Caixia Li, Junpeng Zhang, Yang Gao and Jingsheng Sun provided important advice on the concept of methodology and writing of the manuscript.
Conflicts of Interest
The authors declare no conflict of interest.
References
- Ramos, T.B.; Šimůnek, J.; Gonçalves, M.C.; Martins, J.C.; Prazeres, A.; Castanheira, N.L.; Pereira, L.S. Field evaluation of a multicomponent solute transport model in soils irrigated with saline waters. J. Hydrol. 2011, 407, 129–144. [Google Scholar] [CrossRef]
- Sousa, J.W.; Baldwin, C.; Camkin, J.; Fidelman, P.; Silva, O.; Neto, S.; Smith, F.T. Water: Drought, Crisis and Governance in Australia and Brazil. Water 2016, 8, 493. [Google Scholar] [CrossRef]
- Ivits, E.; Cherlet, M.; Tóth, T.; Lewińska, K.E.; Tóth, G. Characterization of productivity limitation of salt-affected lands in different climate regions of Europe using remote sensing derived productivity indicators. Land Degrad. Dev. 2013, 24, 438–452. [Google Scholar]
- Li, Z.S.; Ou, Y.; Liu, X.Y.; Hu, C.S. Scientific Basis for Constructing the “Bohai Sea Granary”—Demands, Potential and Approaches. Bull. Chin. Acad. Sci. 2011, 26, 371–374. [Google Scholar]
- Wallender, W.W.; Tanji, K.K. Agricultural Salinity Assessment and Management; Manuals and Reports on Engineering Practice No. 71; American Society of Civil Engineers: Reston, VA, USA, 2011. [Google Scholar]
- Qadir, M.; Ghafoor, A.; Murtaza, G. Amelioration strategies for saline soils: A review. Land Degrad. Dev. 2000, 11, 501–521. [Google Scholar] [CrossRef]
- Pasternak, D. Salt Tolerance and Crop Production—A Comprehensive Approach. Annu. Rev. Phytopathol. 2003, 25, 271–291. [Google Scholar] [CrossRef]
- Mao, W.B.; Kang, S.; Wan, Y.; Sun, Y.; Li, X.; Wang, Y. Yellow river sediment as a soil amendment for amelioration of saline land in the Yellow river delta. Land Degrad. Dev. 2014, 27, 1595–1602. [Google Scholar] [CrossRef]
- Wang, X.B.; Zhao, Q.; Hu, Y.; Zheng, Y.; Wu, X.; Wu, H.; Zhang, G.; Cai, D.; Manzur, C.L. An alternative water source and combined agronomic practices for cotton irrigation in coastal saline soils. Irrig. Sci. 2012, 30, 221–232. [Google Scholar] [CrossRef]
- Ahmed, I.M.; Cao, F.; Zhang, M.; Chen, X.; Zhang, G.; Wu, F. Difference in yield and physiological features in response to drought and salinity combined stress during anthesis in Tibetan wild and cultivated barleys. PLoS ONE 2013, 8, e77869. [Google Scholar] [CrossRef] [PubMed]
- Devkota, M.; Martius, C.; Gupta, R.K.; Devkota, K.P.; Mcdonald, A.J.; Lamers, J.P.A. Managing soil salinity with permanent bed planting in irrigated production systems in Central Asia. Agric. Ecosyst. Environ. 2015, 202, 90–97. [Google Scholar] [CrossRef]
- Tian, Y.; Su, D.; Li, F.; Li, X. Effect of rainwater harvesting with ridge and furrow on yield of potato in semiarid areas. Field Crops Res. 2003, 84, 385–391. [Google Scholar] [CrossRef]
- Tisdall, J.M.; Hodgson, A.S. Ridge tillage in Australia: A review. Soil Tillage Res. 1990, 18, 127–144. [Google Scholar] [CrossRef]
- Zhao, Y.G.; Li, Y.; Wang, J.; Pang, H.; Li, Y. Buried straw layer plus plastic mulching reduces soil salinity and increases sunflower yield in saline soils. Soil Tillage Res. 2016, 155, 363–370. [Google Scholar] [CrossRef]
- Zhang, H.; Ma, P.; Zhao, Z.; Zhao, G.; Tian, B.; Wang, J.; Wang, G. Mapping QTL controlling maize deep-seeding tolerance-related traits and confirmation of a major QTL for mesocotyl length. Theor. Appl. Genet. 2012, 124, 223–232. [Google Scholar] [CrossRef] [PubMed]
- Knappenberger, T.; Köller, K. Spatial assessment of the correlation of seeding depth with emergence and yield of corn. Precis. Agric. 2012, 13, 163–180. [Google Scholar] [CrossRef]
- Loeppky, H.; Lafond, G.P.; Fowler, D.B. Seeding Depth in Relation to Plant Development, Winter Survival, and Yield of No-Till Winter Wheat. Agron. J. 1989, 81, 125–129. [Google Scholar] [CrossRef]
- Kato, F.; Araki, M.; Miyazawa, Y.; Fujii, N.; Takeda, K.; Suge, H.; Takahashi, H. Factors responsible for deep-sowing tolerance in wheat seedlings: Varietal differences in cell proliferation and the co-ordinated synchronization of epidermal cell expansion and cortical cell division for the gibberellin-mediated elongation of first. Ann. Bot. 2011, 108, 439–447. [Google Scholar] [CrossRef] [PubMed]
- Dong, H.Z. Underlying mechanisms and related techniques of stand establishment of cotton on coastal saline-alkali soil. Chin. J. Appl. Ecol. 2012, 23, 566–572. [Google Scholar]
- Wang, Z.B.; Li, C.; Liu, Y.; Liu, L.; Sun, H.; Zhang, Y. Effectiveness of the micro-ditch and overbite-membrane planting model for cotton in a dry and alkaline coastal area. Cotton Sci. 2012, 24, 318–324. [Google Scholar]
- Li, X.; Su, D.; Yuan, Q. Ridge-furrow planting of alfalfa (Medicago sativa L.) for improved rainwater harvest in rainfed semiarid areas in Northwest China. Soil Tillage Res. 2007, 93, 117–125. [Google Scholar] [CrossRef]
- Li, X.Y.; Gong, J.D.; Gao, Q.Z.; Li, F.R. Incorporation of ridge and furrow method of rainfall harvesting with mulching for crop production under semiarid conditions. Agric. Water Manag. 2001, 50, 173–183. [Google Scholar] [CrossRef]
- Devkota, M.; Gupta, R.K.; Martius, C.; Lamers, J.P.A.; Devkota, K.P.; Sayre, K.D.; Vlek, P.L.G. Soil salinity management on raised beds with different furrow irrigation modes in salt-affected lands. Agric. Water Manag. 2015, 152, 243–250. [Google Scholar] [CrossRef]
- Qadir, M.; Oster, J.D. Crop and irrigation management strategies for saline-sodic soils and waters aimed at environmentally sustainable agriculture. Sci. Total Environ. 2004, 323, 1–19. [Google Scholar] [CrossRef] [PubMed]
- Meiri, A.; Plaut, Z. Crop production and management under saline conditions. Plant Soil 1985, 89, 253–271. [Google Scholar] [CrossRef]
- Mass, E.V.; Hoffman, G.J. Crop salt tolerance: Current assessment. J. Irrig. Drain. Div. 1977, 103, 115–134. [Google Scholar]
- Fang, S.; Chen, X. Influence of atmospheric precipitation on soil leaching and desalinization in the North China Plain. Acta Pedol. Sin. 2005, 42, 730–736. [Google Scholar]
- Ma, B.L.; Text, A.T.F. Ridge-furrow with full plastic film mulching improves water use efficiency and tuber yield of potato in a semiarid rainfed ecosystem. Field Crops Res. 2014, 161, 137–148. [Google Scholar]
- Wang, Y.Z.; Yuan, X.J. Effects of plastic film mulching on temperature increase and preservation of soil moisture and its response s to growth character of rice with dry-land cultivation. Trans. Chin. Soc. Agric. Eng. 2002, 18, 29–31. [Google Scholar]
- Du, X.; Zhang, W.H.; Zhang, Y.S.; Cao, C.Y.; Li, K.J. Artificial warming from late winter to early spring by phased plastic mulching increases grain yield of winter wheat. Acta. Agron. Sin. 2016, 42, 1530–1540. [Google Scholar] [CrossRef]
- Dong, H.Z.; Li, W.; Miao, X. Ecological effects of mulched deep-seeding in relation to stand establishment and lint yield of cotton in saline soil. Cotton Sci. 2011, 23, 121–126. [Google Scholar]
- Jury, W.A.; Horton, R. Soil Physics; John Wiley & Sons: Hoboken, NJ, USA, 1991; Volume 21, p. 4. [Google Scholar]
- Yu, X.G.; Sun, J.; Xiao, J.; Liu, Z.; Zhang, J. A study on drought indices and lower limit of suitable soil moisture of cotton. Acta Gossypii Sin. 1999, 11, 35–38. [Google Scholar]
- Dong, H.; Kong, X.; Luo, Z.; Li, W.; Xin, C. Unequal salt distribution in the root zone increases growth and yield of cotton. Eur. J. Agron. 2010, 33, 285–292. [Google Scholar] [CrossRef]
- Wang, X.; Zhang, L.; Evers, J.B.; Mao, L.; Wei, S.; Pan, X.; Zhao, X.; Werf, W.V.D.; Li, Z. Predicting the effects of environment and management on cotton fibre growth and quality: A functional-structural plant modelling approach. AoB Plants 2014, 6, 301–307. [Google Scholar] [CrossRef] [PubMed]
- Hatfield, J.L.; Sauer, T.J.; Prueger, J.H. Managing Soils to Achieve Greater Water Use Efficiency. Agron. J. 2001, 93, 271–280. [Google Scholar] [CrossRef]
- Li, H.; Yi, J.; Zhang, J.; Zhao, Y.; Si, B.; Hill, R.L.; Cui, L.; Liu, X. Modeling of Soil Water and Salt Dynamics and Its Effects on Root Water Uptake in Heihe Arid Wetland, Gansu, China. Water 2015, 7, 2382–2401. [Google Scholar] [CrossRef]
- Zhang, X.; Chen, S.; Sun, H.; Pei, D.; Wang, Y. Dry matter, harvest index, grain yield and water use efficiency as affected by water supply in winter wheat. Irrig. Sci. 2008, 27, 1–10. [Google Scholar] [CrossRef]
- Harter, T.; Davis, H.; Mathews, M.C.; Meyer, R.D. Shallow groundwater quality on dairy farms with irrigated forage crops. J. Contam. Hydrol. 2002, 55, 287–315. [Google Scholar] [CrossRef]
- Abliz, A.; Tiyip, T.; Ghulam, A.; Ümüt, H.; Ding, J.L.; Sawut, M.; Zhang, F.; Nurmemet, I.; Abliz, A. Effects of shallow groundwater table and salinity on soil salt dynamics in the Keriya Oasis, Northwestern China. Environ. Earth Sci. 2016, 75, 1–15. [Google Scholar] [CrossRef]
- Isidoro, D.; Grattan, S.R. Predicting soil salinity in response to different irrigation practices, soil types and rainfall scenarios. Irrig. Sci. 2011, 29, 197–211. [Google Scholar] [CrossRef]
- Adcock, D.; Mcneill, A.M.; Mcdonald, G.K.; Armstrong, R.D. Subsoil constraints to crop production on neutral and alkaline soils in south-eastern Australia: A review of current knowledge and management strategies. Anim. Prod. Sci. 2007, 47, 1245–1261. [Google Scholar] [CrossRef]
- Scotter, D.R.; Raats, P.A.C. Movement of salt and water near crystalline salt in relatively dry soil. Soil Sci. 1970, 109, 170–178. [Google Scholar] [CrossRef]
- Chen, L.J.; Feng, Q.; Li, F.R.; Li, C.S. Simulation of soil water and salt transfer under mulched furrow irrigation with saline water. Geoderma 2014, 241–242, 87–96. [Google Scholar] [CrossRef]
- Mmolawa, K.; Or, D. Root zone solute dynamics under drip irrigation: A review. Plant Soil 2000, 222, 163–190. [Google Scholar] [CrossRef]
- Lipiec, J.; Kuś, J.; Słowińska-Jurkiewicz, A.; Nosalewicz, A. Soil porosity and water infiltration as influenced by tillage methods. Soil Tillage Res. 2006, 89, 210–220. [Google Scholar] [CrossRef]
- Guo, K.; Liu, X. Dynamics of meltwater quality and quantity during saline ice melting and its effects on the infiltration and desalinization of coastal saline soils. Agric. Water Manag. 2014, 139, 1–6. [Google Scholar]
- Min, W.; Guo, H.; Zhou, G.; Zhang, W.; Ma, L.; Ye, J.; Hou, Z. Root distribution and growth of cotton as affected by drip irrigation with saline water. Field Crops Res. 2014, 169, 1–10. [Google Scholar] [CrossRef]
- Dong, H.; Li, W.; Tang, W.; Zhang, D. Furrow Seeding with Plastic Mulching Increases Stand Establishment and Lint Yield of Cotton in a Saline Field. Agron. J. 2008, 100, 1640–1646. [Google Scholar] [CrossRef]
- Dong, H.; Li, W.; Tang, W.; Zhang, D. Early plastic mulching increases stand establishment and lint yield of cotton in saline fields. Field Crops Res. 2009, 111, 269–275. [Google Scholar] [CrossRef]
- Li, Y.; Shao, M.A. Spatial and temporal variation of soil temperature extremum under plastic mulch in Xinjiang. J. Appl. Ecol. 2004, 15, 2039–2044. [Google Scholar]
- Feng, D.; Zhang, J.; Sun, C.; Liu, X.; Dang, H.; Cao, C.; Zheng, C.; Sun, J.; Li, K. Effects of long-term irrigation with saline water on soil physical-chemical properties and activities of soil enzyme. J. Soil Water Conserv. 2014, 28, 171–176. [Google Scholar]
- Joshi, N.L. Seedling emergence and yield of pearlmillet on naturally crusted arid soils in relation to sowing and cultural methods. Soil Tillage Res. 1987, 10, 103–112. [Google Scholar] [CrossRef]
- Li, C.; Lei, J.; Zhao, Y.; Xu, X.; Li, S. Effect of saline water irrigation on soil development and plant growth in the Taklimakan Desert Highway shelterbelt. Soil Tillage Res. 2015, 146, 99–107. [Google Scholar] [CrossRef]
- Zhang, J.; Sun, J.; Duan, A.; Wang, J.; Shen, X.; Liu, X. Effects of different planting patterns on water use and yield performance of winter wheat in the Huang-Huai-Hai plain of China. Agric. Water Manag. 2007, 92, 41–47. [Google Scholar] [CrossRef]
- Kucharik, C.J.; Fayram, N.J.; Nicholas, C.K. A paired study of prairie carbon stocks, fluxes, and phenology: Comparing the world’s oldest prairie restoration with an adjacent remnant. Glob. Chang. Biol. 2006, 12, 122–139. [Google Scholar] [CrossRef]
- He, Z.J.; Luo, H.H.; Han, C.L.; Zhang, H.Z.; Zhang, W.F. Effect of source-sink regulator on yield and fiber quality of under-mulch-drip Irrigation cotton under the different soil moisture conditions. J. Shihezi Univ. (Natl. Sci.) 2007, 25, 397–403. [Google Scholar]
- Bange, M.P.; Constable, G.A.; Gordon, S.G.; Naylor, G.R.S.; van der Sluijs, M.H.J. FIBREpak A Guide to Improving Australian Cotton Fibre Quality; CSIRO and the Cotton Catchment Communities Cooperative Research Centre, Cotton Catchment Communities (CRC): Narrabri, Australia, 2009; pp. 45–47. [Google Scholar]
- Ashraf, M. Salt Tolerance of Cotton: Some New Advances. Crit. Rev. Plant Sci. 2002, 21, 1–30. [Google Scholar] [CrossRef]
- Bernstein, L.; Bernstein, L. Salt Tolerance of Field Crops; United States Salinity Report to Collaborators: Riverside, CA, USA, 1960; pp. 37–38. [Google Scholar]
- Razzouk, S.; Whittington, W.J. Effects of salinity on cotton yield and quality. Field Crops Res. 1991, 26, 305–314. [Google Scholar] [CrossRef]
© 2017 by the authors; licensee MDPI, Basel, Switzerland. This article is an open access article distributed under the terms and conditions of the Creative Commons Attribution (CC-BY) license (http://creativecommons.org/licenses/by/4.0/).