1. Introduction
In 2013, 18% of the total population of 5.5 million in Finland, and 13% of the 9.7 million inhabitants in Sweden, were living in rural areas without connections to sewage networks and wastewater treatment plants [
1]. In addition, many more people continue to live in country cottages during holidays and weekends. Connecting these houses to the network is very difficult and economically unviable because of the long distances over which pipes would need to be dug through forests, wetlands, bedrock etc. Therefore, it is clear that some houses in rural parts will never be connected to sewage networks. Some of these sparsely populated areas are situated on islands, or on the shores of the Baltic Sea or beside inland lakes, where the natural environment is unusually sensitive and water protection is extremely important.
Most rural houses have their own drinking water well or are connected to local waterworks, often using groundwater [
2]. The annual precipitation in Nordic countries is higher than evaporation, so fresh groundwater is usually readily available. In addition, the electrical networks reach most of these rural houses so that the pumping of water is not a problem. Therefore, most rural people use water without restrictions and they can even have water-flushing toilets. Thus, both daily water consumption and wastewater formation can be rather high, necessitating a wastewater treatment unit —today this is also legislated by Finnish Governmental Decree 209 [
3]. This law estimates that daily wastewater loads per person should be: 2.2 g for phosphorus (P), 14 g for nitrogen (N), and 50 g for biological oxygen demand (BOD
7), and that it is required that these wastewaters are treated so that the reductions should be 70% (85%) for P, 30% (40%) for N, and 80% (90%) for BOD
7. The reduction percentages in parentheses are intended to be applied to particularly sensitive areas (near surface waters or in sites used for raw water abstraction). Thus, the allowed maximal daily loads of one individual are estimated to be: 0.66 g for P, 9.8 g for N, and 10 g for BOD
7, regardless of the volume of the effluent (≈consumption of water). In Sweden, the reductions in BOD
7 are even more stringent, at 90%, while the reduction limits for P and N are the same as in Finland [
4]. There are no legal regulations in Finland or Sweden concerning enteric bacteria or enteric viruses in the effluent, despite the fact that it is often possible to detect enteric pathogen microorganisms in surface waters used for bathing [
5].
The wastewater treatment is challenging in the cold Nordic climate where the land is covered by ice and snow during winter months. In Finland, the system must be built to serve at least a family size of five persons, even in cases where the present family size is smaller. If the present family size is larger, or if there are more people spending regular periods in the house, the treatment system should also be built to operate in these situations. The small-scale treatment units sometimes serve two or more families, small schools, cafes etc., and then the unit must be larger. The load of wastewater varies extensively since family members may spend time in working places, schools, travelling etc. Another reason why the load variation can be very high is that holiday houses can be empty for long periods. It is evident that the wastewater treatment system installed in these houses must function properly, even if there are temporal load changes or breaks.
There are many different wastewater treatment systems available and households can select the system that they think will suit them best. Nowadays, the wastewater systems are mostly either different commercial small-scale wastewater treatment plants or sand filters. The selection may be based on the soil structure, but the price of the treatment system and maintenance work during use must also be considered. Municipal guidelines or recommendations and examples of neighbours also affect this selection. System installation is usually done by commercial companies, but later maintenance work is almost invariably undertaken by the inhabitants themselves according to the operation manual provided by the companies producing, selling, or installing the treatment unit.
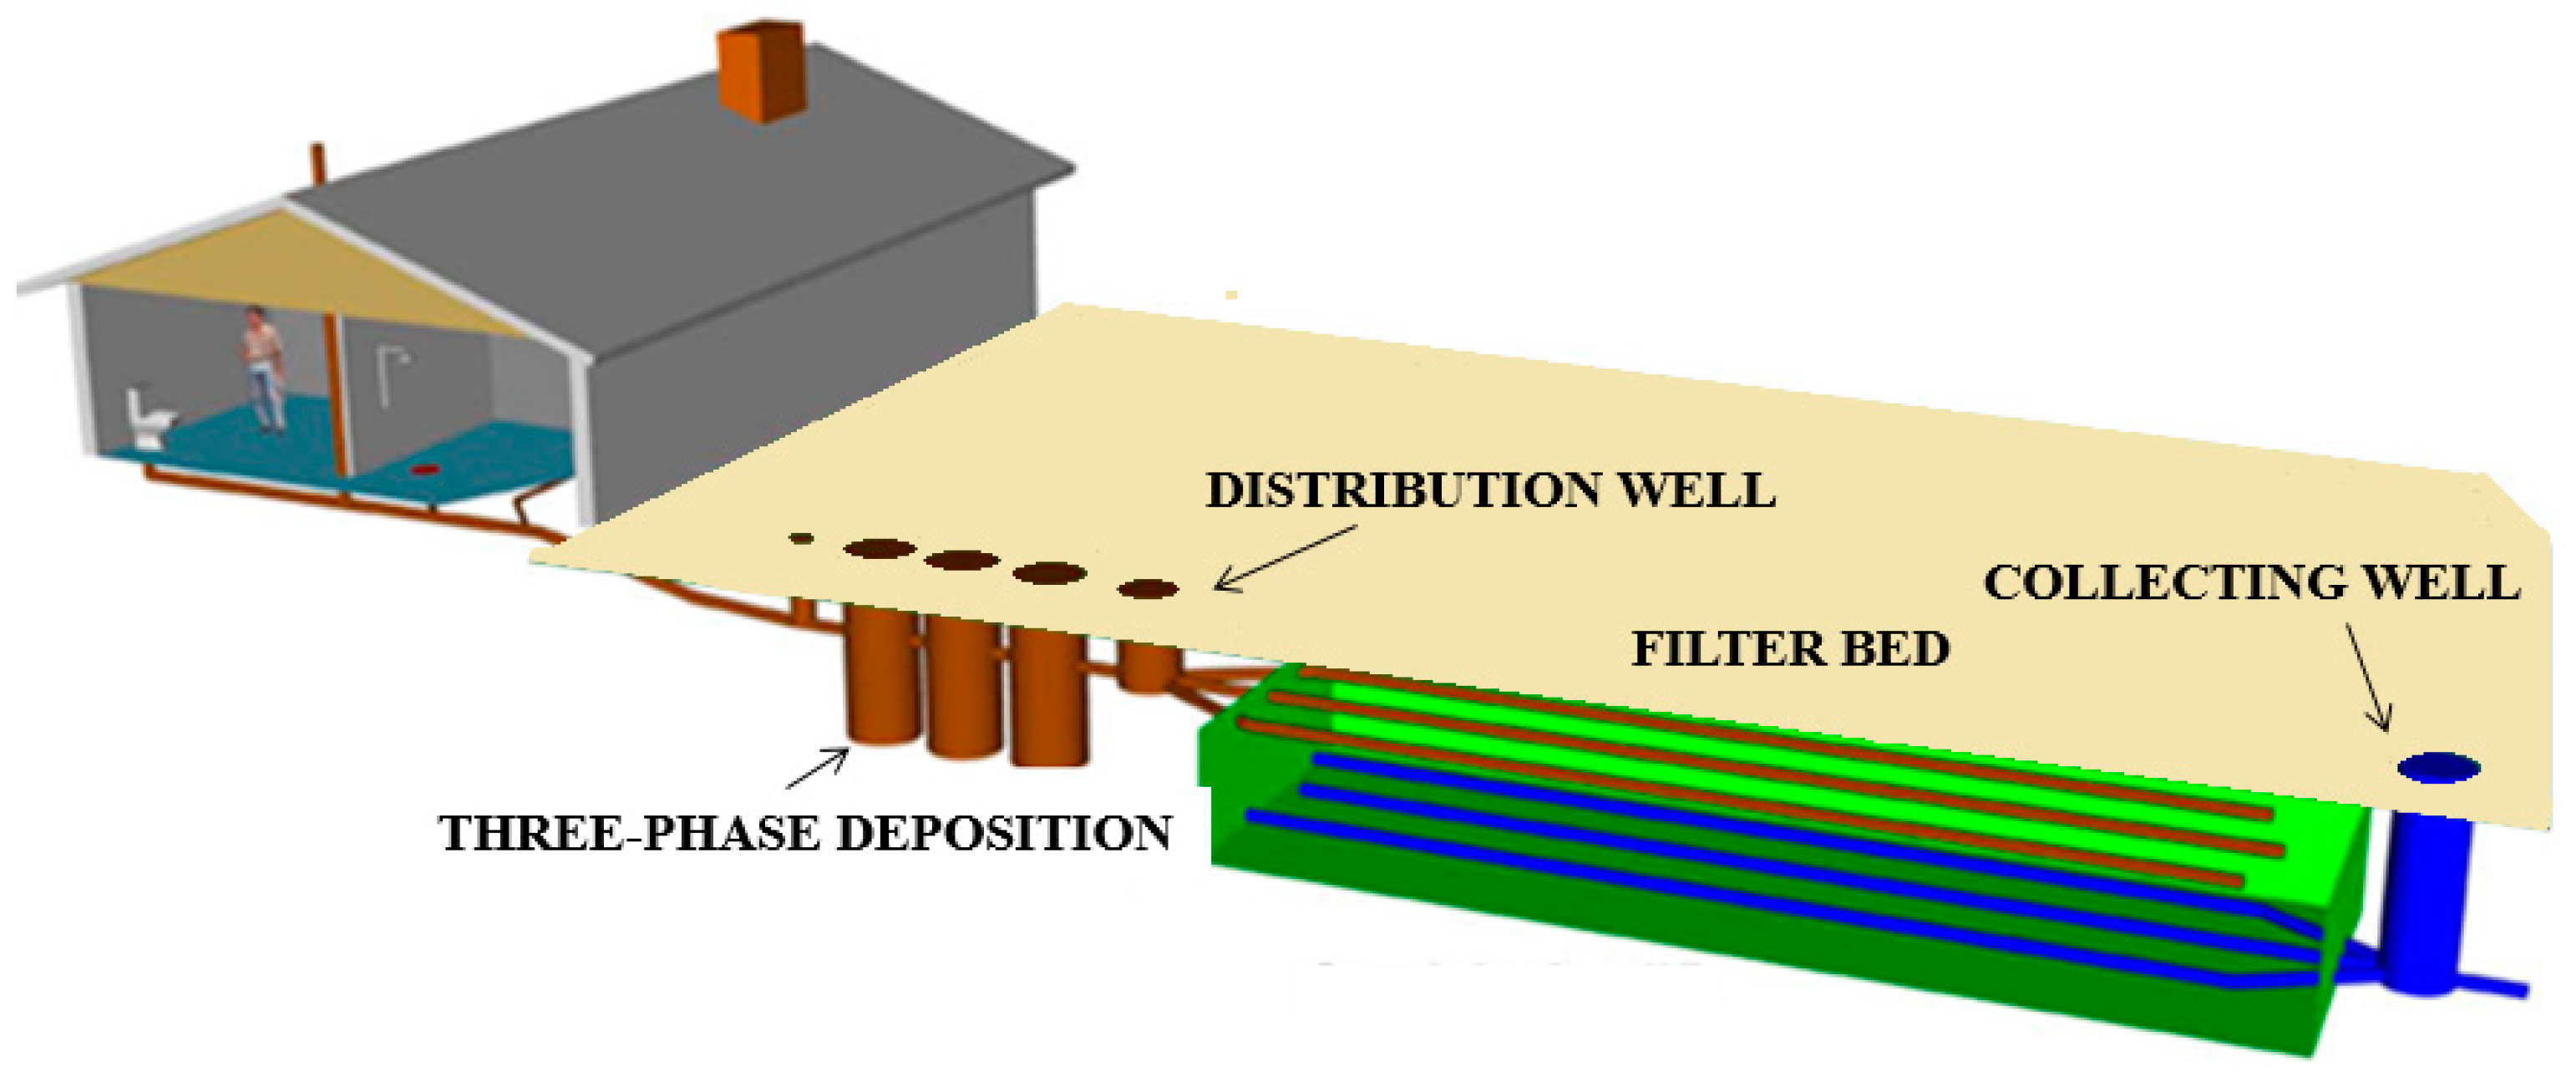
Sand filters involve various layers of sand and gravel and have a moderate filtration rate. They are so deep that wastewater is led underground, ensuring that the water does not freeze in winter (
Figure 1). Some commercial sand filters also use other materials, which tend to be commercial secrets. Wastewater treatment should be aerobic so that a biofilm will develop on the interfaces of gravel and sand. Before the sand filter, there is usually a three-phase precipitation well, allowing those particles with a high specific weight to travel to the bottom, whereas compounds with a low specific weight such as fat, will be transferred to the surface of the wastewater. Specific phosphorus binding materials such as calcium, iron, or aluminium compounds are often used in the filter layers or situated either before or after the filtration unit. Filtration is usually vertical, and rarely horizontal. The filter area required for a single person is often 5–6 m
2 and the distribution of wastewater is usually aided by distribution pipes so that the whole filter area is utilised. Most sand filters are built on-site, excluding commercial modular filters. The collection pipe finally leads the treated wastewater to ditches or to receiving surface waters, and towards groundwater.
The commercial treatment plants are mainly active sludge treatment plants such as sequencing batch reactors, operating continuously or discontinuously, or biofilters and biorotors. Most of these use chemical coagulants (aluminium, iron or calcium) to precipitate phosphorus. Air is pumped into the system to guarantee aerobic treatment and to improve operational efficiency. A small amount of active sludge can be returned to the start of the process and the treated wastewater will be pumped to collection pipes. Excess sludge must occasionally be removed and transported to a wastewater treatment plant. The commercial treatment systems need less land area than the sand filters.
There are recent analytical works which document the long-term performances of one or a few small-scale treatment units or sand filters [
6,
7,
8,
9,
10,
11,
12]. In addition, the carbon footprint of different on-site wastewater treatment systems has been evaluated [
13], and there is one questionnaire study, which inquired about the performance of many different on-site treatment systems [
14]. In Finland and Sweden, the quality of many effluents of on-site treatment units have been analysed during normal use, but the results have only been published in Finnish or in Swedish, in internal reports [
15,
16,
17,
18,
19]. This review was conducted to summarize those previous works and to compare chemical and microbiological quality of effluents in different wastewater treatment units during normal use. We also wanted to identify factors limiting the operational capabilities of these different small-scale treatment units.
2. Materials and Methods
2.1. Selected Wastewater Treatment Unit Effluents
The results of the effluents of 162 different family size wastewater treatment units (including one small primary school) situated in Finland and Sweden were selected. Many of these treatment units were sampled several times and therefore a total of 717 effluents were studied. The different samplings have been conducted separately, since the samplings were done at different seasons during different years, and the load of wastewater and the maintenance practice therefore varied. The effluent data collected during improper functions (renovation processes, broken pipes or chemical pumps, shortage of coagulant etc.) have not been included in this study. All of the treatment units selected treated both black and grey wastewaters, and those units which aimed to treat only grey wastewaters were not included in this work.
The number of effluent samples from commercial small-scale treatment plants was 526 and they originated from 135 different treatment plants, made and installed by many companies. These plants were biorotors, biofilters, and continuously or discontinuously operating active sludge plants, often with a coagulant added to precipitate phosphorus. These treatment units had been operating for several months before this study and their operation was assumed to be normal.
The number of sand filter effluents sampled was 191 and they originated from 27 different sand filters, all of which were situated in Finland. Sand filters were mainly buried filters made by local entrepreneurs using local sand and gravel, but commercial pipes and pumps, and they were typically 1.5–2.5 m deep. They were divided into filters with and without specific P-binding material sites, and some filters were commercial modular sand filters.
2.2. Sampling and Analyses
The original effluent data was collected under the supervision of five different projects [
15,
16,
17,
18,
19]. The projects were supervised by the County Office of Västra Götaland (Sweden), the Finnish Environmental Institute, the Finnish Association for Water Protection (two projects), and the Valonia Service Centre for Sustainable Development and Energy of Southwest Finland. The samplings were completed by local environmental health officers or by paid project workers. The effluents were collected as either grab samples or combined samples, between 2003 and 2014.
The effluents were analysed in different laboratories. The analysis methods used were standard methods, as described by the American Public Health Association [
20], except that the determination of biological oxygen demand compounds utilized an incubation time of seven days, as used in Sweden and Finland. The Helsinki Convention [
21] states that the conversion factor from BOD
5 to BOD
7 is 1.15. The daily water consumption was estimated but not measured. The estimated mean water consumption was 100 ± 20 L, with variations from 62 to 200 L/person/day. In this work, the daily water consumption was estimated to be 120 L per person, which is close to the daily personal water consumption, for example, as measured by the Kuopio Water Company [
22]. If each individual consumes 120 L every day, with 0.66 g of P, 9.8 g of N, and 10 g of BOD
7 in the treated wastewater, then the concentration for P, N, and BOD
7, should be less than 5.5 mg/L, 81.7 mg/L, and 83 mg/L, respectively, and these values are used to estimate the values.
Total phosphorus (P) and total nitrogen (N) levels were analysed from all 717 effluents, whilst the level of BOD7 was analysed from 716 effluents, and suspended solids from 245 effluents. The number of effluents used in the analysis was 133 for Escherichia coli, 192 for enterococci, and 111 for total coliforms. In most cases, if E. coli and/or total coliforms were analysed, then enterococci were not analysed.
The Excel 2007 programme was used to calculate the arithmetic averages for physico-chemical parameters and log10 numbers for bacteria with their standard deviations, correlation coefficients between different parameters, and significances revealed by the application of a t-test. If a bacterial number was less than the detection limit (usually 100 colony forming units per 100 mL), then half of the detection limit has been used. If the bacterial number exceeded the determination limit, then this upper value has been used in the calculation.
3. Result
3.1. General Results
In sum, 31% of effluents contained more than 5.5 mg/L P, 22% of effluents contained more than 81.7 mg/L N, and 5% of effluents contained more than 83 mg/L BOD
7. Often, when P, BOD
7, or N, exceeded the previously set values (based on 120 L daily water consumption), they were also over the limits on other parameters (
Table 1). The quality of different effluents varied and the standard deviations were also sometimes high. This may be partly attributable to the fact that there were different treatment plants and different families producing domestic wastewater in different seasons, with different maintenance competences. The variation tended to be high, especially among the different commercial treatment plants, excluding those using biorotors where a coagulant was used for precipitating phosphorus.
If one compares all commercial plants (five first result columns) and all sand filters (three last result columns in
Table 1), then it seems that the total value of P was slightly lower in effluents from commercial plants, than in those emerging from sand filters, partly due to high P-concentration in modular sand filters. In contrast, the total values of N, BOD
7, suspended solids, and log numbers, of
E. coli and enterococci were higher in effluents of commercial plants than those from all of the sand filters. Although the variations are rather high, the differences are statistically significant for P between biorotors and sand filters, irrespective of whether or not phosphorus coagulant was used. In addition, there were P-concentrations exceeding the limits in effluents. There were statistical differences in BOD
7 values of sand filter effluents, but only a few were over the set limit.
If one considers all of the effluents, then the correlation coefficients of phosphorus with nitrogen, log10 of E. coli, and log10 of enterococci, were 0.18, 0.26 and 0.29, respectively. There were higher correlations of BOD7 with nitrogen, log10 of E. coli, log10 of enterococci, and log10 of coliforms, i.e., correlation coefficients of 0.38, 0.37, 0.53 and 0.27, respectively. Suspended solids correlated with phosphorus, nitrogen, BOD7, log10 of E. coli, and log10 of enterococci, showcasing correlation coefficients of 0.44, 0.33, 0.60, 0.31 and 0.48, respectively.
The inclusion of a P-binding coagulant in biorotors and sand filters improved wastewater treatment, compared to when no P-binding coagulant was used, as can be seen in
Table 1. In particular, sand filters utilizing P-binding coagulants exhibited a good ability to reduce all tested parameters. The relatively high standard deviation of effluent P in this group was traced to six specific sand filters which applied alumium sulphate as the coagulant, and these had an average concentration of 6.3 mg/L for P, i.e., almost three times higher than the P concentration in the other sand filters, using other coagulants. One commercial modular sand filter (In-Drän) displayed a low ability to reduce P from wastewater, resulting in 70% of these effluents exceeding the set
P-value. In all 70 cases where the P-concentration of effluent was ≥14 mg/L, the treatment system was either a commercial treatment system or a commercial modular sand filter.
Table 1 shows that N-concentration of effluents was mainly exceeded in effluents of commercial biofilters, and in different active sludge plants and biorotors which did not use coagulants. The N-concentration of effluents often exceeded the limits, with the highest N-value being 210 mg/L in one discontinuous operating active sludge process plant; unfortunately there was only one plant of this type tested, so no comparison can be made with other systems.
In 59% of cases, the E. coli log numbers were at least 2 per 100 mL (corresponding to at least 100 colony forming units per 100 mL). The corresponding percentages were 53% for enterococci and 86% for total coliforms.The log number of E. coli was at least 3 per 100 mL for 44% of the effluents studied. The highest log10 numbers for these indicators were more than 5 cfu in 100 mL (corresponding to 100,000 cfu in 100 mL), which was found in 2% for E. coli and 3% of enterocooci.
If the log
10-numbers in 100 mL of
E. coli and enterococci are grouped according to different P-concentrations, then one can discern statistically significant differences between the bacterial numbers in effluents with different P-concentrations, as can be seen in
Table 2.
The total N was 59.8 ± 37.1 mg/L in grab samples, and 52.8 ± 30.0 mg/L in combined samples, thus differing from each other with P-values of 0.004. The suspended solids were 71.9 ± 79.3 mg/L in grab samples and es 26.9 ± 44.6 mg/L in combined samples, and these differed statistically, with P-values of 0.0002. The other parameters were similar, regardless of the sampling method.
3.2. Results of Different Commercial Biofilters and Active Sludge Process Plants
Since the standard deviations of P, N, and BOD
7 concentrations were sometimes very high (
Table 1), more detailed results for different commercial models or biofilters, continuous active sludge processes and discontinuous active sludge processes, are presented in
Table 3. Different models originating from the same commercial enterprises have been combined if these models have a similar function, and only differ in size. The results have also been combined if the same model is sold under two names.
Table 3 shows that most (but not all) commercial treatment plants do meet the limits set for treating wastewaters. In biofilters with P-precipitation, the quality of the effluent was better. However, the mean values of P, N, and BOD
7 varied in effluents of some models and standard deviation was sometimes rather high, so their performance was not always reliable.
In some cases, there were effluents with very high concentrations of P, N, and BOD7. The highest P-concentration (120 mg/L) in effluents was detected in a discontinuously operating wastewater treatment plant (Biokem), but P-concentrations in other effluents originating from a similar treatment plant were approx. 0.2 mg/L. The highest BOD7 value (470 mg/L) was found in the effluent of a discontinuously operating active sludge process plant (Biorens), but the other six units of a similar system produced effluents with a BOD7 value of less than 50 mg/L, indicating that there can be differences, depending on installation or maintenance.
3.3. Effects of Season on the Effluents of P, N and BOD7
Since many rural houses are either totally or partly holiday homes, where the numbers of inhabitants can vary at different times of the year, the values of P, N, and BOD
7 in effluents of each month are presented in
Table 4.
There are clearly monthly variations in the P-concentrations of effluents, whereas N and BOD
7 are more stable throughout the year. There was a clear increase in the P-concentrations in the summer (June, July and August) and in February, as well as in the autumn months, as can be seen in
Table 4. The P-concentration of all effluents collected in June, July, and August differed statistically (
P = 0.003) when compared to the P-concentration in all effluents collected in December and January.
In February, September, October, and November, the effluents from some sand filters contained very high P-concentrations, as well as exhibiting very high standard deviations, which means that there was extensive variation in the performance of the different sand filters. In February, the highest P-concentrations were found in commercial sand filters (Propipe), aiming to precipitate P after sand filtering. In September, October, and November, the high P-concentrations were found in commercial modular sand filters (In-Drän), as can also be seen in
Table 1. In fact, if we consider these two models, then some individual filters produced effluents with very high P-concentrations, while the others produced wastewater effluents with much lower P-concentrations.
The number of E. coli was very low from January to May, and again in October. In the other months, the log10 number of E. coli varied from 2.49 ± 1.03 to 3.14 ± 1.09 per 100 mL, without significant differences. The number of enterococci was analysed 6–16 times in all months except July. The lowest monthly log10 number of enterococci, 2.13 ± 1.45 per 100 mL, was identified in September and the highest, 3.40 ± 1.80 per 100 mL, was assayed in August, also without any significant differences between different months.
4. Discussion
4.1. Reductions of Different Nutrient Parameters
We estimated that both the daily water consumption and the wastewater formation were 120 L per person and thus the exceedings of P, N, and BOD7 were based on this assumption. If the water consumption was higher, there would be more dilutions and the set limits (5.5 mg/L for P, 81.7 mg/L for N and 83 mg/L for BOD7) would have been lower and there would have been more results exceeding these values. On the contrary, if the daily water consumption had been less than 120 L per person, the set concentrations of P, N, and BOD7 would have been higher and there would have been less results exceeding these values.
Phosphorus reduction is the most critical parameter when evaluating the performance of different small-scale wastewater treatment units, since it was most often the P-reduction which exceeded the set value calculated from the Finnish limits [
3]. Phosphorus is the growth limiting factor and thus it is the most important pollutant in Nordic fresh surface waters [
23]. Therefore, its effective reduction is especially important in the summer, when the total P load is responsible for eutrophication of natural waters. The P-reduction was successful with most sand filters and biorotors using coagulants, i.e., the vast majority; 88% of biorotors and 82% of sand filters produced effluent with P-concentrations of ≤5.5 mg/L (calculated with 120 L daily water consumption,
Table 1). In contrast, their effluents contained high amounts of P if the treatment unit did not use any coagulant, as was the case in some biorotors and commercial modular filters. A lower P-concentration could only be achieved if there was some possibility to use coagulants, for instance, in an after-treatment unit. The sand filters in which the P content of the effluent was over 5.5 mg/L, were mainly old sand filters or septic tanks that had not been emptied sufficiently frequently.
The reductions of nitrogen, BOD
7, and suspended solids in our work were more frequently acceptable than the reduction of P. It was interesting to note that log
10 numbers of
E. coli and enterococci were significantly lower if the P-reduction had been effective, i.e., if the P-concentration was lower than 1 mg/L (
Table 2). In most cases, the excessive values were not very significant if one excludes those few cases where the N-concentration was as high as 210 mg/L, or BOD
7-values were 470 mg/L and 420 mg/L.
4.2. Hygienic Quality of Effluents
Most effluents studied contained
E. coli and enterococci, and in some cases, their numbers could be higher than the upper detection limit (5 log
10 numbers corresponding to 100,000 cfu per 100 mL). The majority of effluent samples analysed contained more than 2 log
10 numbers (corresponding to 100 cfu) of
E. coli or/and enterococci per 100 mL. Thus, the effluent must still be considered as treated wastewater. The effluents should be classified as poor quality bathing water, since the numbers of
E. coli could exceed 900 cfu per 100 mL and the numbers of intestinal enterococci were over 330 cfu per 100 mL [
24]. The effluent could rarely be used as irrigation water for edible plants, i.e., only 56% of the effluents had
E. coli numbers below 1000 cfu (3 log
10 numbers) per 100 mL, which is the recommended value according to WHO [
25].
For hygienic reasons, the disinfection of effluents would be important if the effluents gain access to either groundwater or surface waters, and were then used for drinking water, irrigation, bathing, or other sensitive purposes, since if effluents contain bacterial indicators, they may also house pathogenic campylobacteria and adenoviruses [
5,
26]. Disinfection would also be important if the volume percentage of effluents were rather large in the receiving water, as can be the case in arid regions.
Disinfection has been conducted in some on-site wastewater treatment systems. Chlorine, UV, and ozone have been used in the USA [
27], although it is recognized that chlorination may be problematic since it can produce toxic side-products. Furthermore, UV-transmission in effluents can be low and ozone is expensive and uneasy to maintain by non-professional wastewater users.
Peracetic acid would be a possible disinfectant. It has been found to be effective at disinfecting on-site wastewaters and its disinfection effect also continued when the disinfected wastewater tanks were emptied into animal slurry tanks. Also, no problems were encountered during the work conducted in a cold climate [
28]. Peracetic acid is often used to disinfect laboratory or food industry surfaces or to control veterinary diseases. Thus, it is readily available and its dosing is straightforward. Peracetic acid has also been used in a full-scale activated sludge plant; in this case, the costs of using the chemical to disinfect 1000 L of water have been estimated to be around 0.04 $US [
29], but the price might be higher during small-scale use.
Both UV and peracetic acid can be effective disinfection methods [
30,
31]. If there is a need to only disinfect effluents during brief periods, such as when it will be used for agricultural irrigation or bathing periods, or during epidemic periods, peracetic acid might be a good alternative since there are low capital costs. If it is necessary to disinfect throughout the year, both of these methods can be selected. When deciding on which technique to choose, it needs to be remembered that the contact time for peracetic acid is approximately half an hour, but the tank geometry is not critical. UV is not a good selection if some parts of the wastewater in the treatment tank are not illuminated by the UV light, or if the distance from the UV light to the wastewater is too long or if the wastewater is intensely coloured.
Both chemical disinfection and UV methods are continually developing. Thus, new UV-emitting LEDs may be a possible alternative in the future, if the colour and particles in effluent do not cause problems. In fact, there are no published results on their effectiveness, nor are there any commercial products available.
The numbers of enteric microorganisms can be rather high in some cases. Therefore, the regional authorities should consider whether there should be some limitations, or at least recommendations, issued about the numbers of E. coli, especially if it becomes more likely that the water will be recycled as fresh water. This approach may become more common due to climate change; in developing countries, it may also be attributed to the increased demand for fresh water, i.e., due to their growing human populations and improvements in their standards of living.
4.3. Sand Filters Built by Local Entrepreneurs or Commercial Plants
Generally, it can be said that the sand filters manufactured by local entrepreneurs operated better than the commercial modular sand filters (
Table 1)—at least if the sand filters included a P-coagulating layer. The sand filters seemed to be more reliable, and less sensitive, during wastewater load variations. A Greek sand filter with after-trapping for P [
9], produced effluent which contained less N than the average N-value in our sand filter effluents, but the BOD and
P values were lower in sand filter effluents of the present work. The higher temperature of the Mediterranean climate compared to the Finnish temperature may explain the difference in nitrogen reductions, since nitrification may be limited by low temperatures [
32]. Another consideration is that sand filters had lower carbon footprints than commercial treatment systems [
13].
In Finland, there are lower costs associated with sand filters than the expenses related to active sludge plants or biofilters, if estimated over the system’s lifetime of 30 years [
33]. These costs include the materials, installation, transportation, electricity, and maintenance works over the 30 years. The prices also include the purchase of new pumps every 8 years, whereas for sand filters, one needs to install a new field after 20 years. Finally, for commercial plants, there are the costs of purchasing coagulants, as well as those due to the transportation of excess sludge to local wastewater treatment plants twice a year.
Theoretically, rainwater could dilute the effluents from sand filters, but not those of small-scale treatment plants made in vessels. Annual precipitation varies from 550 to 650 mm, with some precipitation occurring each month, and precipitation is higher than evaporation, which ranges from 300 to 400 mm [
34]. Thus, one can estimate that 150–250 mm of rainwater should be draining into the groundwater and gaining access to surface waters. If the size of one sand filter is 30 m
2, then the theoretical volume of annual leaching water could be 4500–7500 L, which is approximately 2%–3% of the annual water consumption of five persons. The variation inherent in all parameters is so high that it would be impossible to find any potential dilution factors in the P-results of the effluents. We could detect no evidence of possible dilution factors, as seen in
Table 4, where the concentrations of P, N, and BOD
7 in effluents of sand filters and small-scale treatment plants, were rather similar for all months. The lack of dilution was also evident in the spring and autumn months, when the risk of flooding is highest, i.e., due to melting of snow in spring or when the growth period with evaporation has ended in autumn.
4.4. Commercial Plants Need to Receive More Attention, Especially If There Are Pauses in Wastewater Formation
The standard deviations of P and other nutrients were higher in effluents originating from commercial biofilters, and continuously or discontinuously operating active sludge processes, upon comparison with those from sand filters (
Table 1 and
Table 3), reflecting more inherent variation in their effectiveness. In other words, some, but not all plants, performed well. Based on the results, it was found that when the P content of the effluent was over 10 mg/L, there was no longer any effective coagulant, or instead of active sludge in active sludge process, the sludge had been inactivated. It was interesting to note that BioKube belonged to the best operating systems, as can be seen in
Table 3 and as has been confirmed in a Korean report [
12].
High P-concentrations can also be attributed to a situation in which phosphorus accumulating microorganisms had initially incorporated phosphorus into cellular polyphosphates, but had subsequently released P as phosphate into the effluent if there was no wastewater load, or if the conditions had changed to being anoxic or anaerobic [
6,
35]. When the daily P load has been increased to twice or three times the normal load, the biological removal efficiency of P will almost disappear, whereas the biological removals of N and C are less sensitive since the microorganisms needed to remove N or C can be reactivated again after the stress situation has ended [
8]. The irregular wastewater load may explain the low microbiological P-removals and high P-concentrations in the effluents assessed here, at least during summer months, while reductions of N and BOD
7 were normal (
Table 4).
Before the summer holidays, there may have been pauses in wastewater production and the treatment process would not have been operating normally, as discussed in the previous paragraph. One possible supplemental explanation for the poor P-reduction of wastewater treatment units during the holiday months is that many vacationers rent a summer cottage for a few weeks, but that these temporary users may not be aware that there is a problem with their wastewater treatment system. Even if they think that it is not functioning properly, they may not know whom they should contact for help, or they may simply not wish to interrupt their holiday in order to deal with it.
Furthermore, it is possible that during holidays, the P load will also be increased due to greater numbers of users. The relatively high P-concentration in effluents sampled from commercial treatment plants in June, July, and August, may be partly traced by the summer diets of Finns and Swedes. June, July, and August, are peak times for the consumption of ice cream and sausages, e.g., 40% of annual sales of ice cream and 32% of sausages intended for grilling or barbecuing, occur in these three months according to data from a leading Finnish chain of grocery stores [
36]. These products are relatively phosphate-rich, i.e., milk and meat products are the major sources of phosphorus in the Finnish diet [
37] and therefore, human excreta may contain more P during the summer.
4.5. If There Is Malfunction
There are several factors that reduce the treatment efficiency of small wastewater treatment systems [
10]. A malfunction can cause bad smells and if there is no oxygen, then methane may be formed [
6]. Poor performance can be caused by incorrect system installation, undersizing, or their location may be too close to the groundwater level or to storm waters [
14]. In Sweden and in Finland, poor performance in wastewater treatment efficiency can occur if a holiday house starts to be used all year round and/or the number of users is greater than the number for which the specific system was originally intended [
14].
If environmental officers detect very high concentrations of phosphorus, they should check for possible errors in maintenance or installation. They also need to ensure that the sample can be taken without being contaminated by precipitates from the system’s bottom or walls. A new sample should be taken in order to determine that the errors have been corrected.
In some cases, the very high values can be caused by the fact that, in some models, sampling of effluents is difficult and the effluent sample may partly be mixed with solid matter precipitated on the walls of the sampling tube. Those companies manufacturing family-size wastewater treatment plants should pay much more attention to ensure that the sampling of effluents is easy and reliable, especially that the values do not underestimate the treatment efficiency.
In the future, component manufacturers should pay more attention to coagulant feeding and dosage, as well as to the quality of active sludge and to the success of the clarification, in order to ensure the reliability of their systems. If it is likely that the levels of P will increase in the effluent, e.g., due to a higher number of users, then there should be clear guidance about how to adjust the amount of supplemental Fe- or Al-based coagulant. Furthermore, the end users should have the possibility to follow the consumption of the coagulant and the manufacturers should incorporate an alarm system into the use of the plan, g giving a warning before the coagulant supply has become exhausted.
The installation of a relatively large wastewater collection tank before treatment systems, could partly reduce variation and reduce the stress on the microorganisms, responsible for the purification process. This stress occurs when there are high volumes of hot, alkaline washing wastewaters, but it does not help if there are long pauses. The coagulant dosage can sometimes be too high and there can be days when the system does not add any coagulant, as reported by one technically educated owner of a small-scale treatment unit. In some cases, the dosing pump for aluminium or iron compounds can become clogged, especially if there are long pauses in its use.
It is possible that in some cases, the system may not have been installed correctly, i.e., there were extensive differences in P-concentrations of the effluent samples from the different systems of the same brands (
Table 3). Another explanation is that these commercial treatment units may not be fit for the purpose for which they were sold, or the maintenance work can be too difficult for ordinary families. One can also speculate that some of the engineering companies selling these treatment units are not competent at resolving problems that may arise when the system is operating.
Commercial small-scale treatment units might be likened to a black box if the end users do not understand the fundamental principles underpinning their operation, especially if they are not able to adhere to the maintenance instructions. Therefore, the companies manufacturing these plants should ensure that the instruction manual is written in a language that a layman can understand. The families should know where they can buy P-coagulants and how often the excess sludge must be transported to the wastewater treatment plant.
The price of commercial treatment plants could also include a post-installation control, i.e., the manufacturer should check that the plant is operating correctly. At the very least, the P-concentration in the effluent should be analysed to ensure that the installation and maintenance have been successful. The P-assays could even be conducted by using rapid field methods, so that the values would be available while the company’s experts are still at the site. The end user should also maintain contact with the manufacturer for years, in order to be alerted should there be new information. The manufacturers should consider becoming informed if the property changes owners, in order to ensure that the new occupiers are familiarized with the maintenance procedure of wastewater treatment in their new home. There could be changes in the recommended concentrations of coagulants or there could be a change to some totally new type of coagulant, and the end user should always be notified of these changes. A good manual (possibly on the Internet) is therefore essential.


