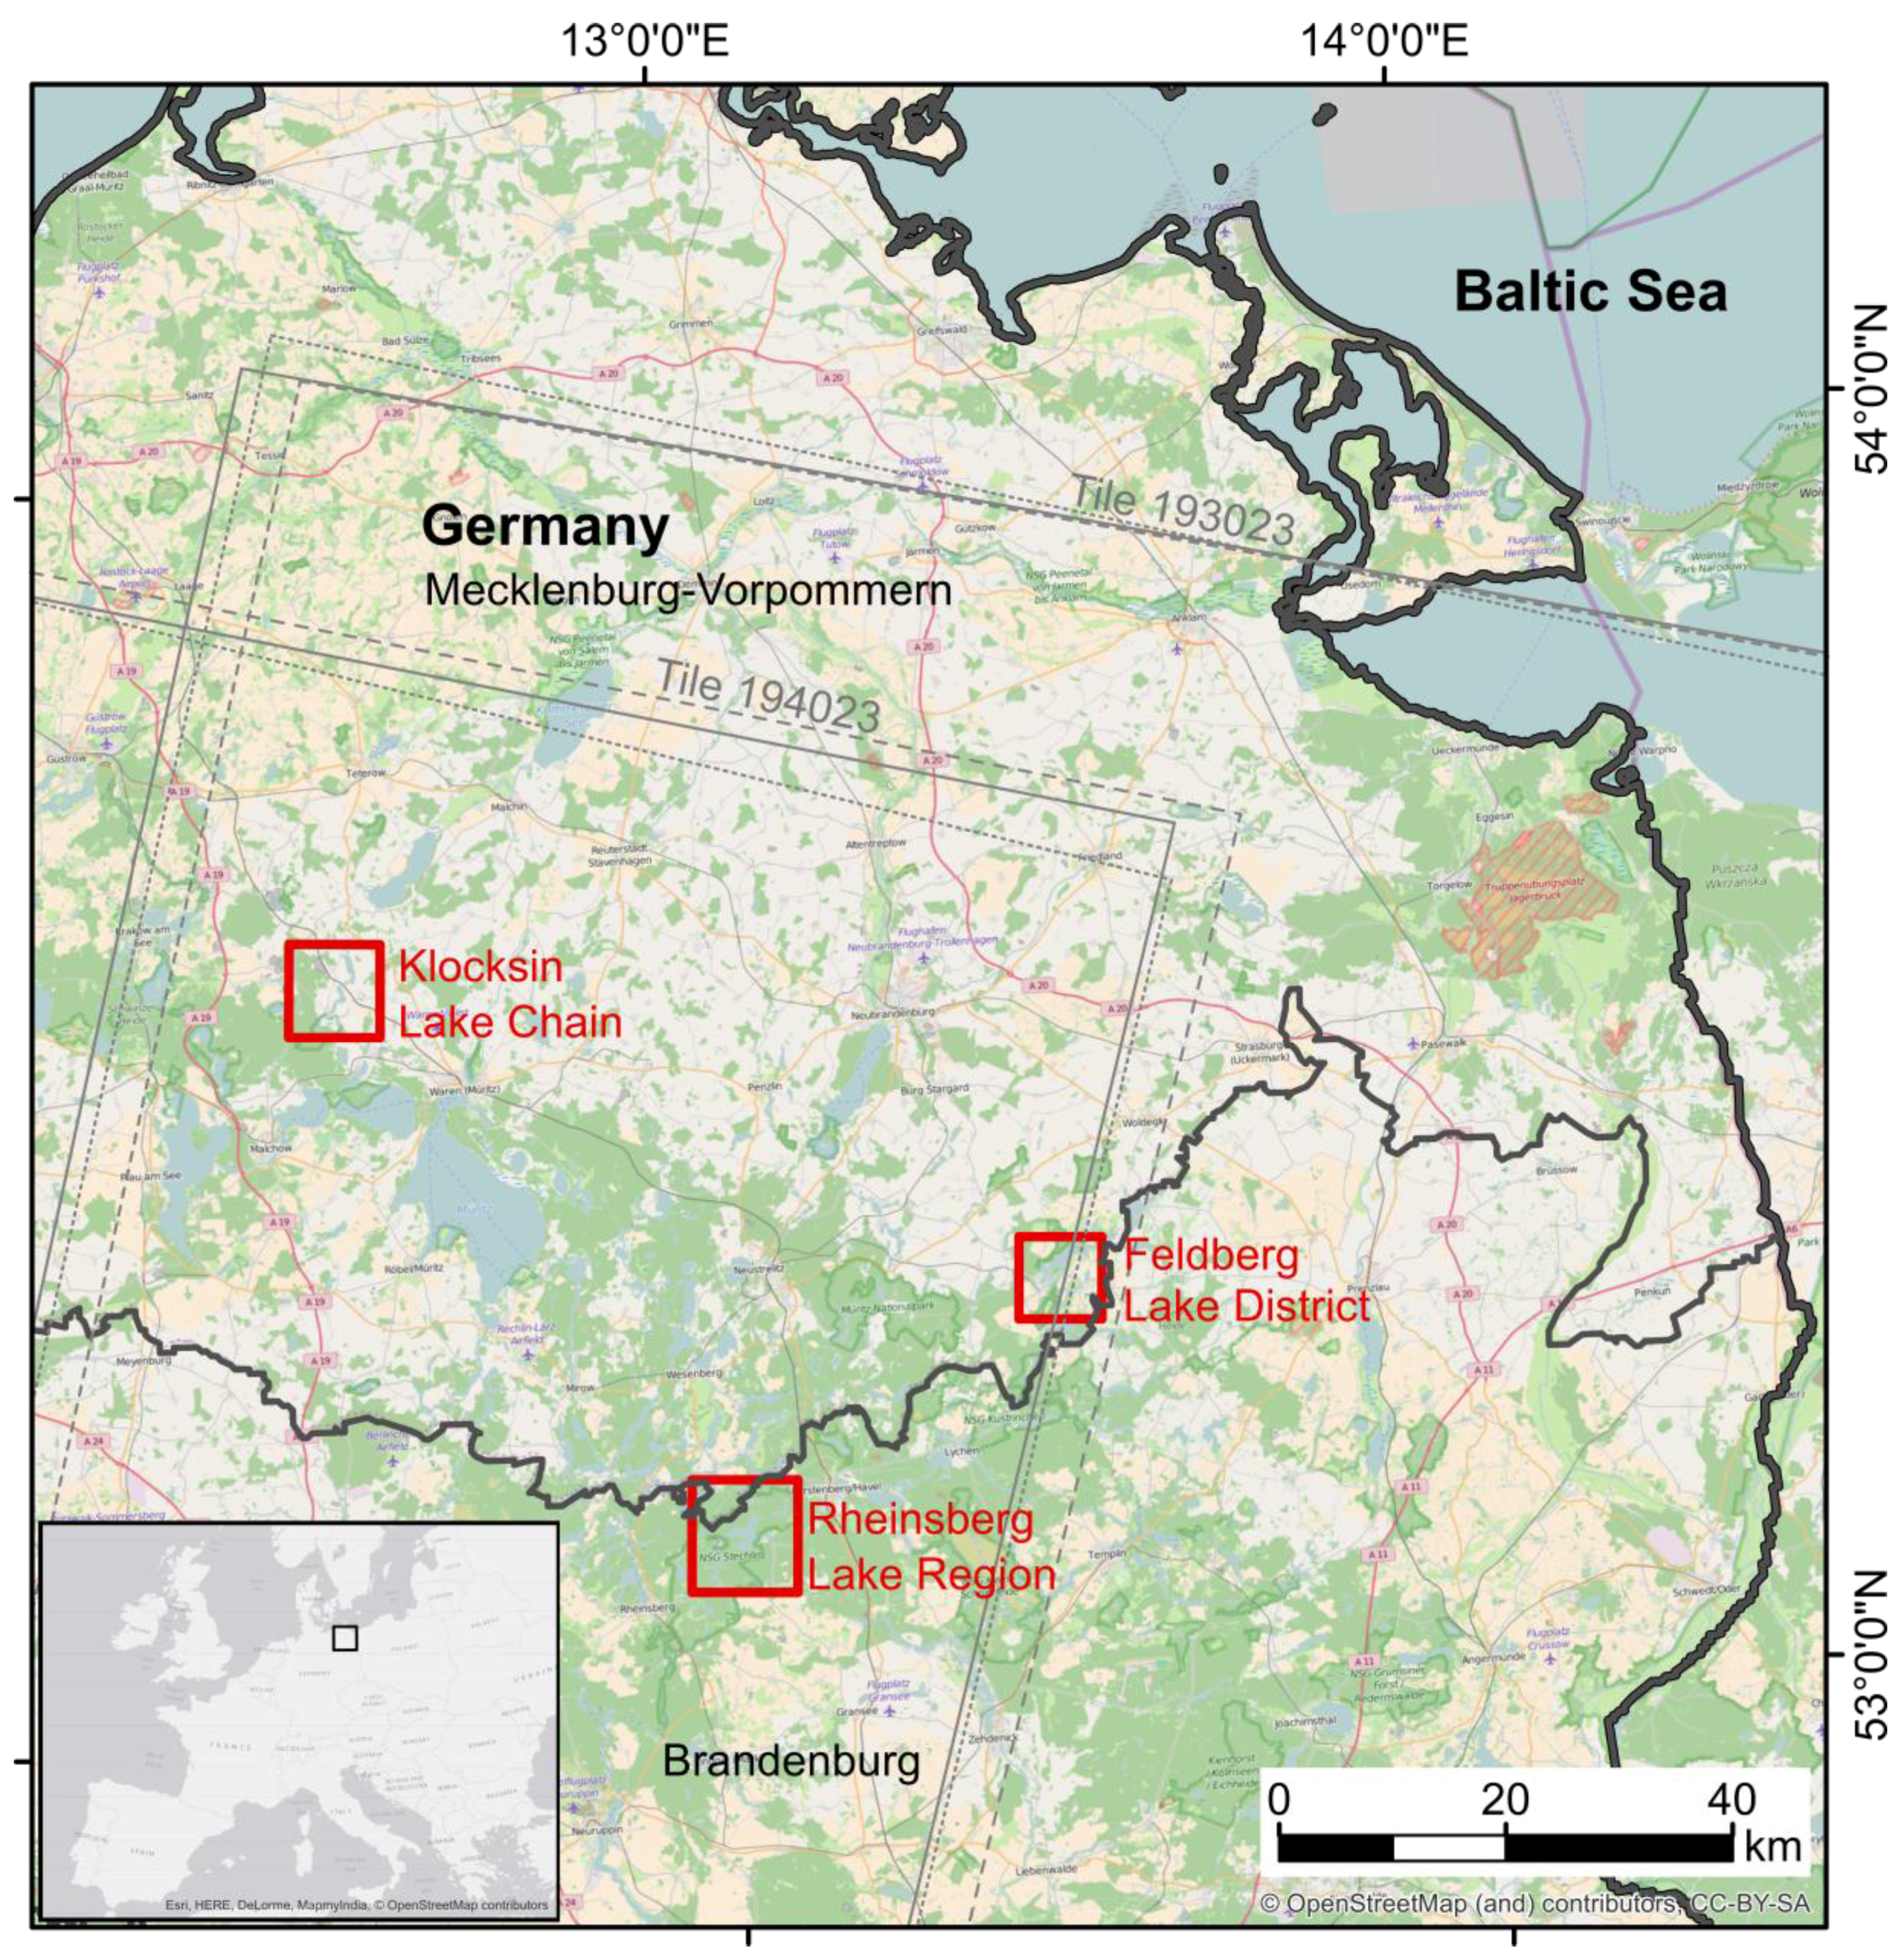
5.1. Visibility of Calcite Precipitation in Multi-Spectral Satellite Imagery (Landsat and Sentinel-2)
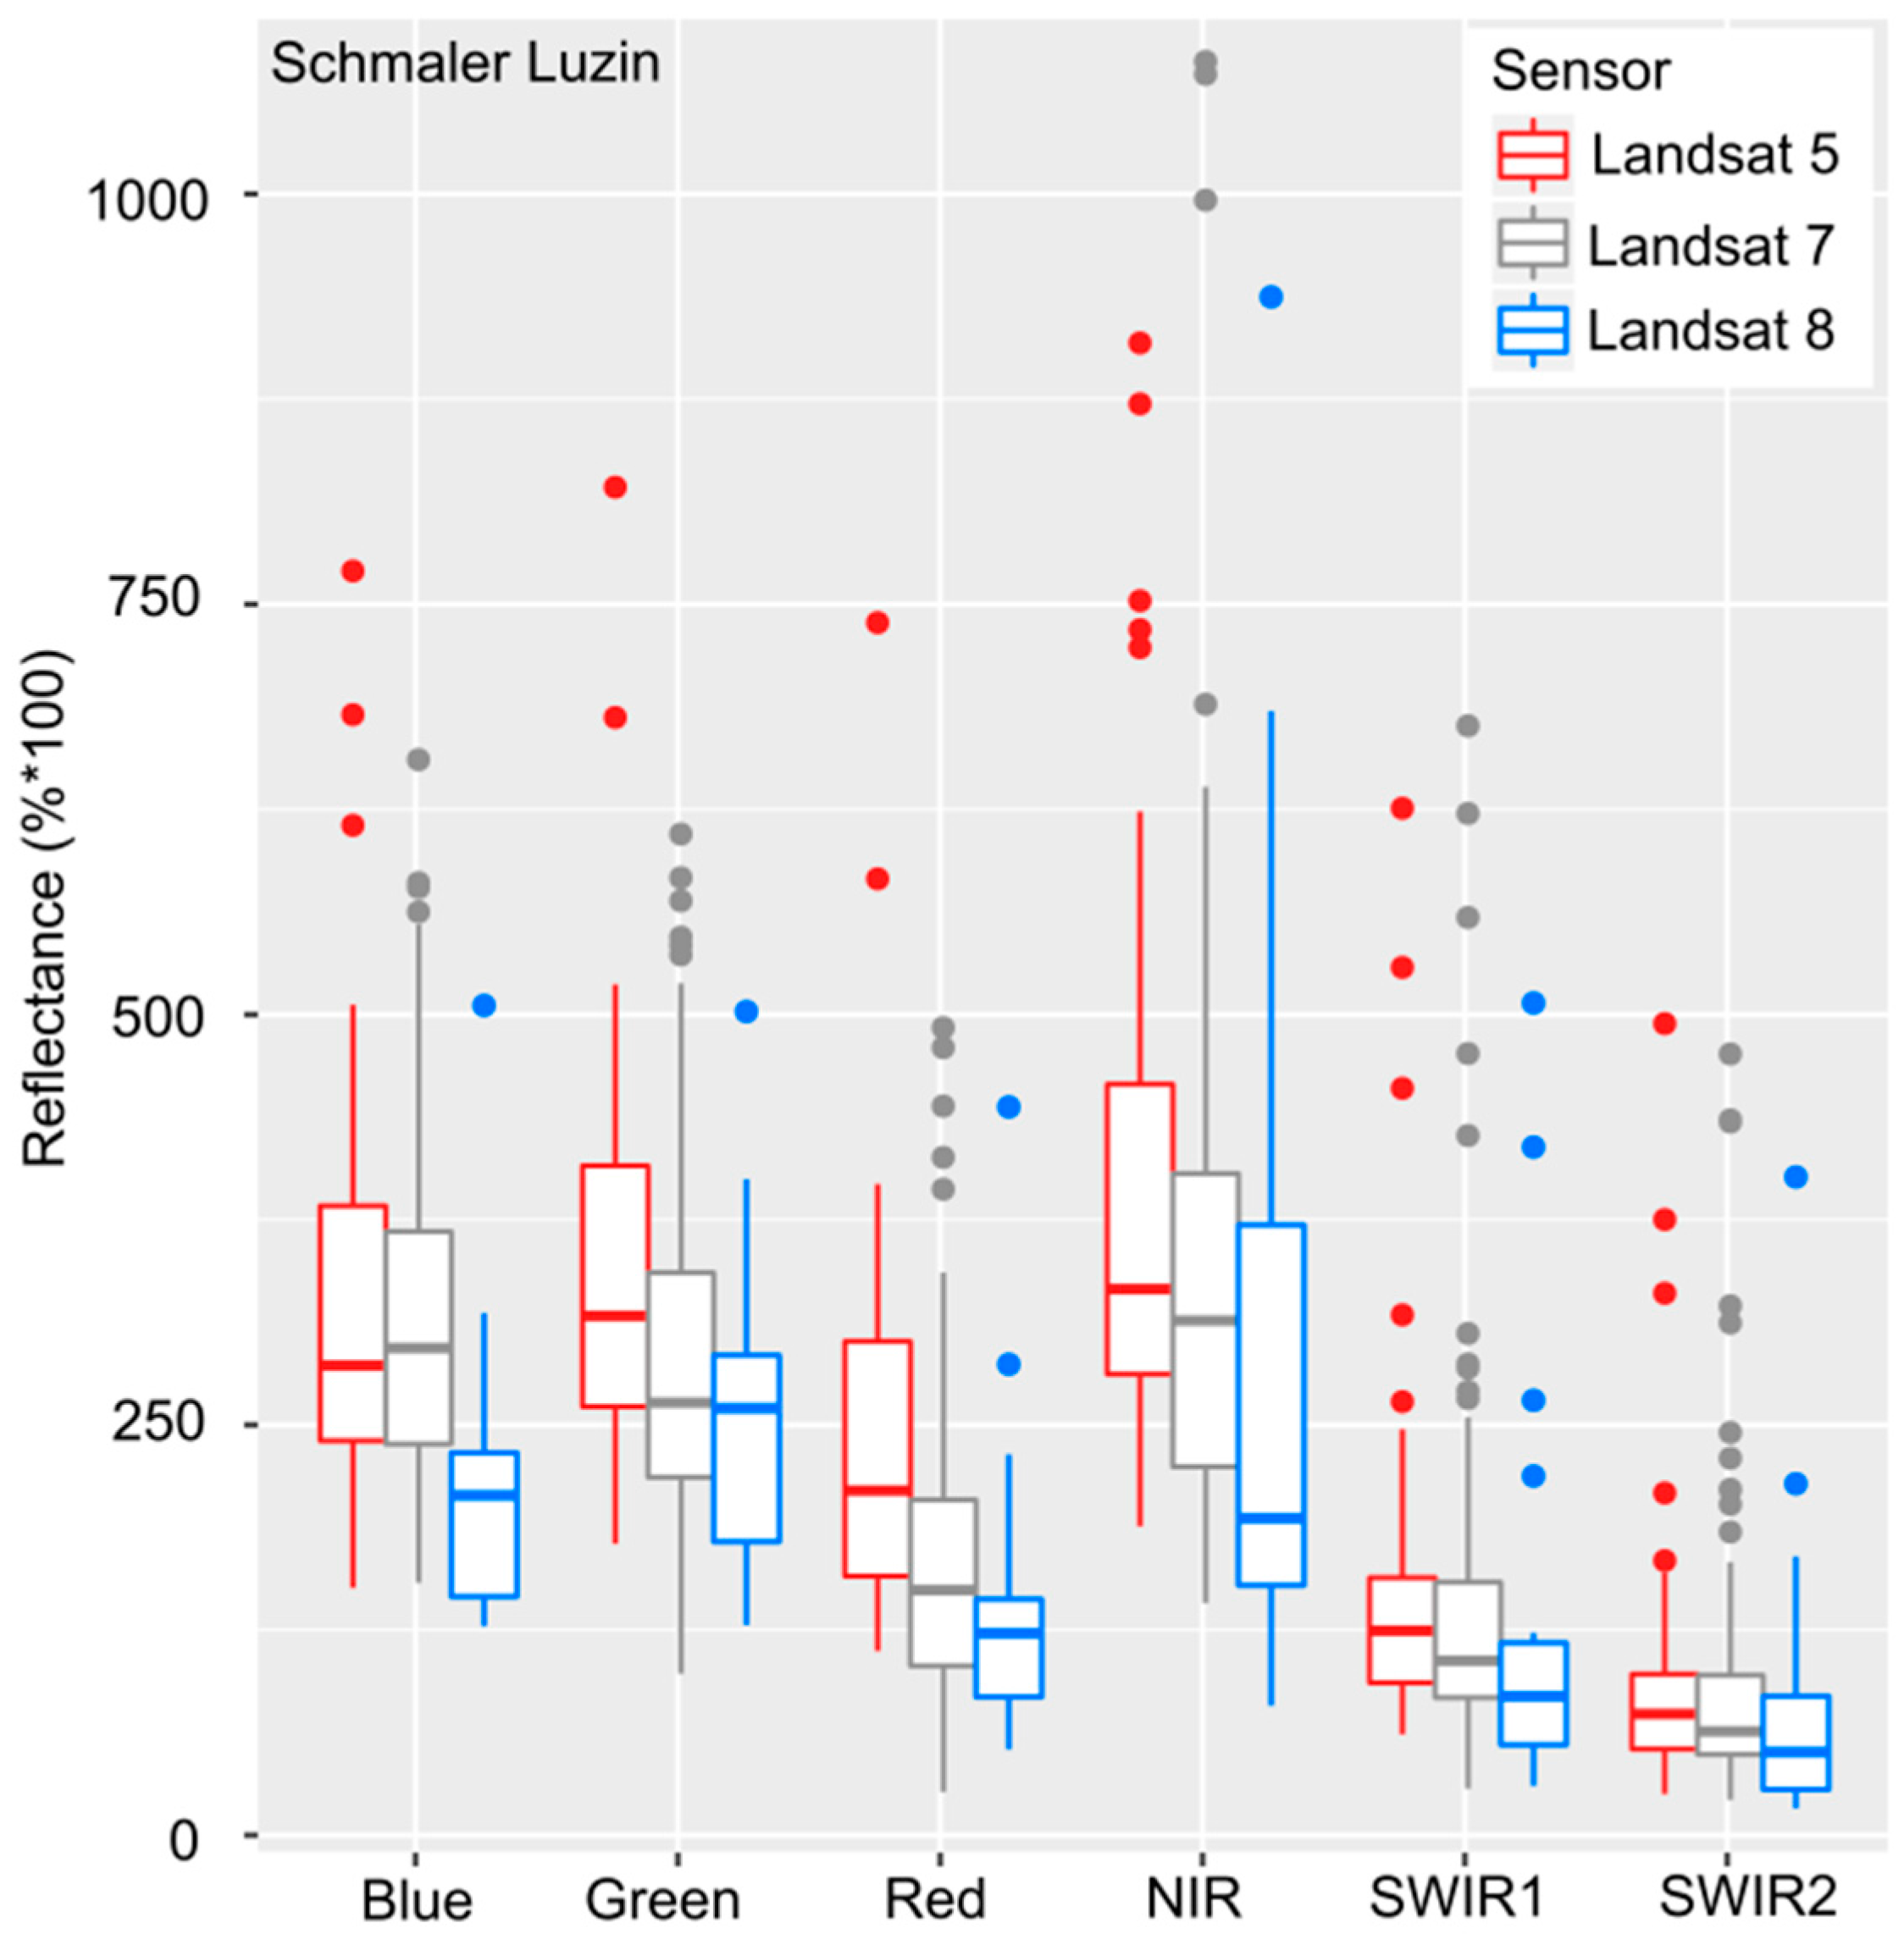
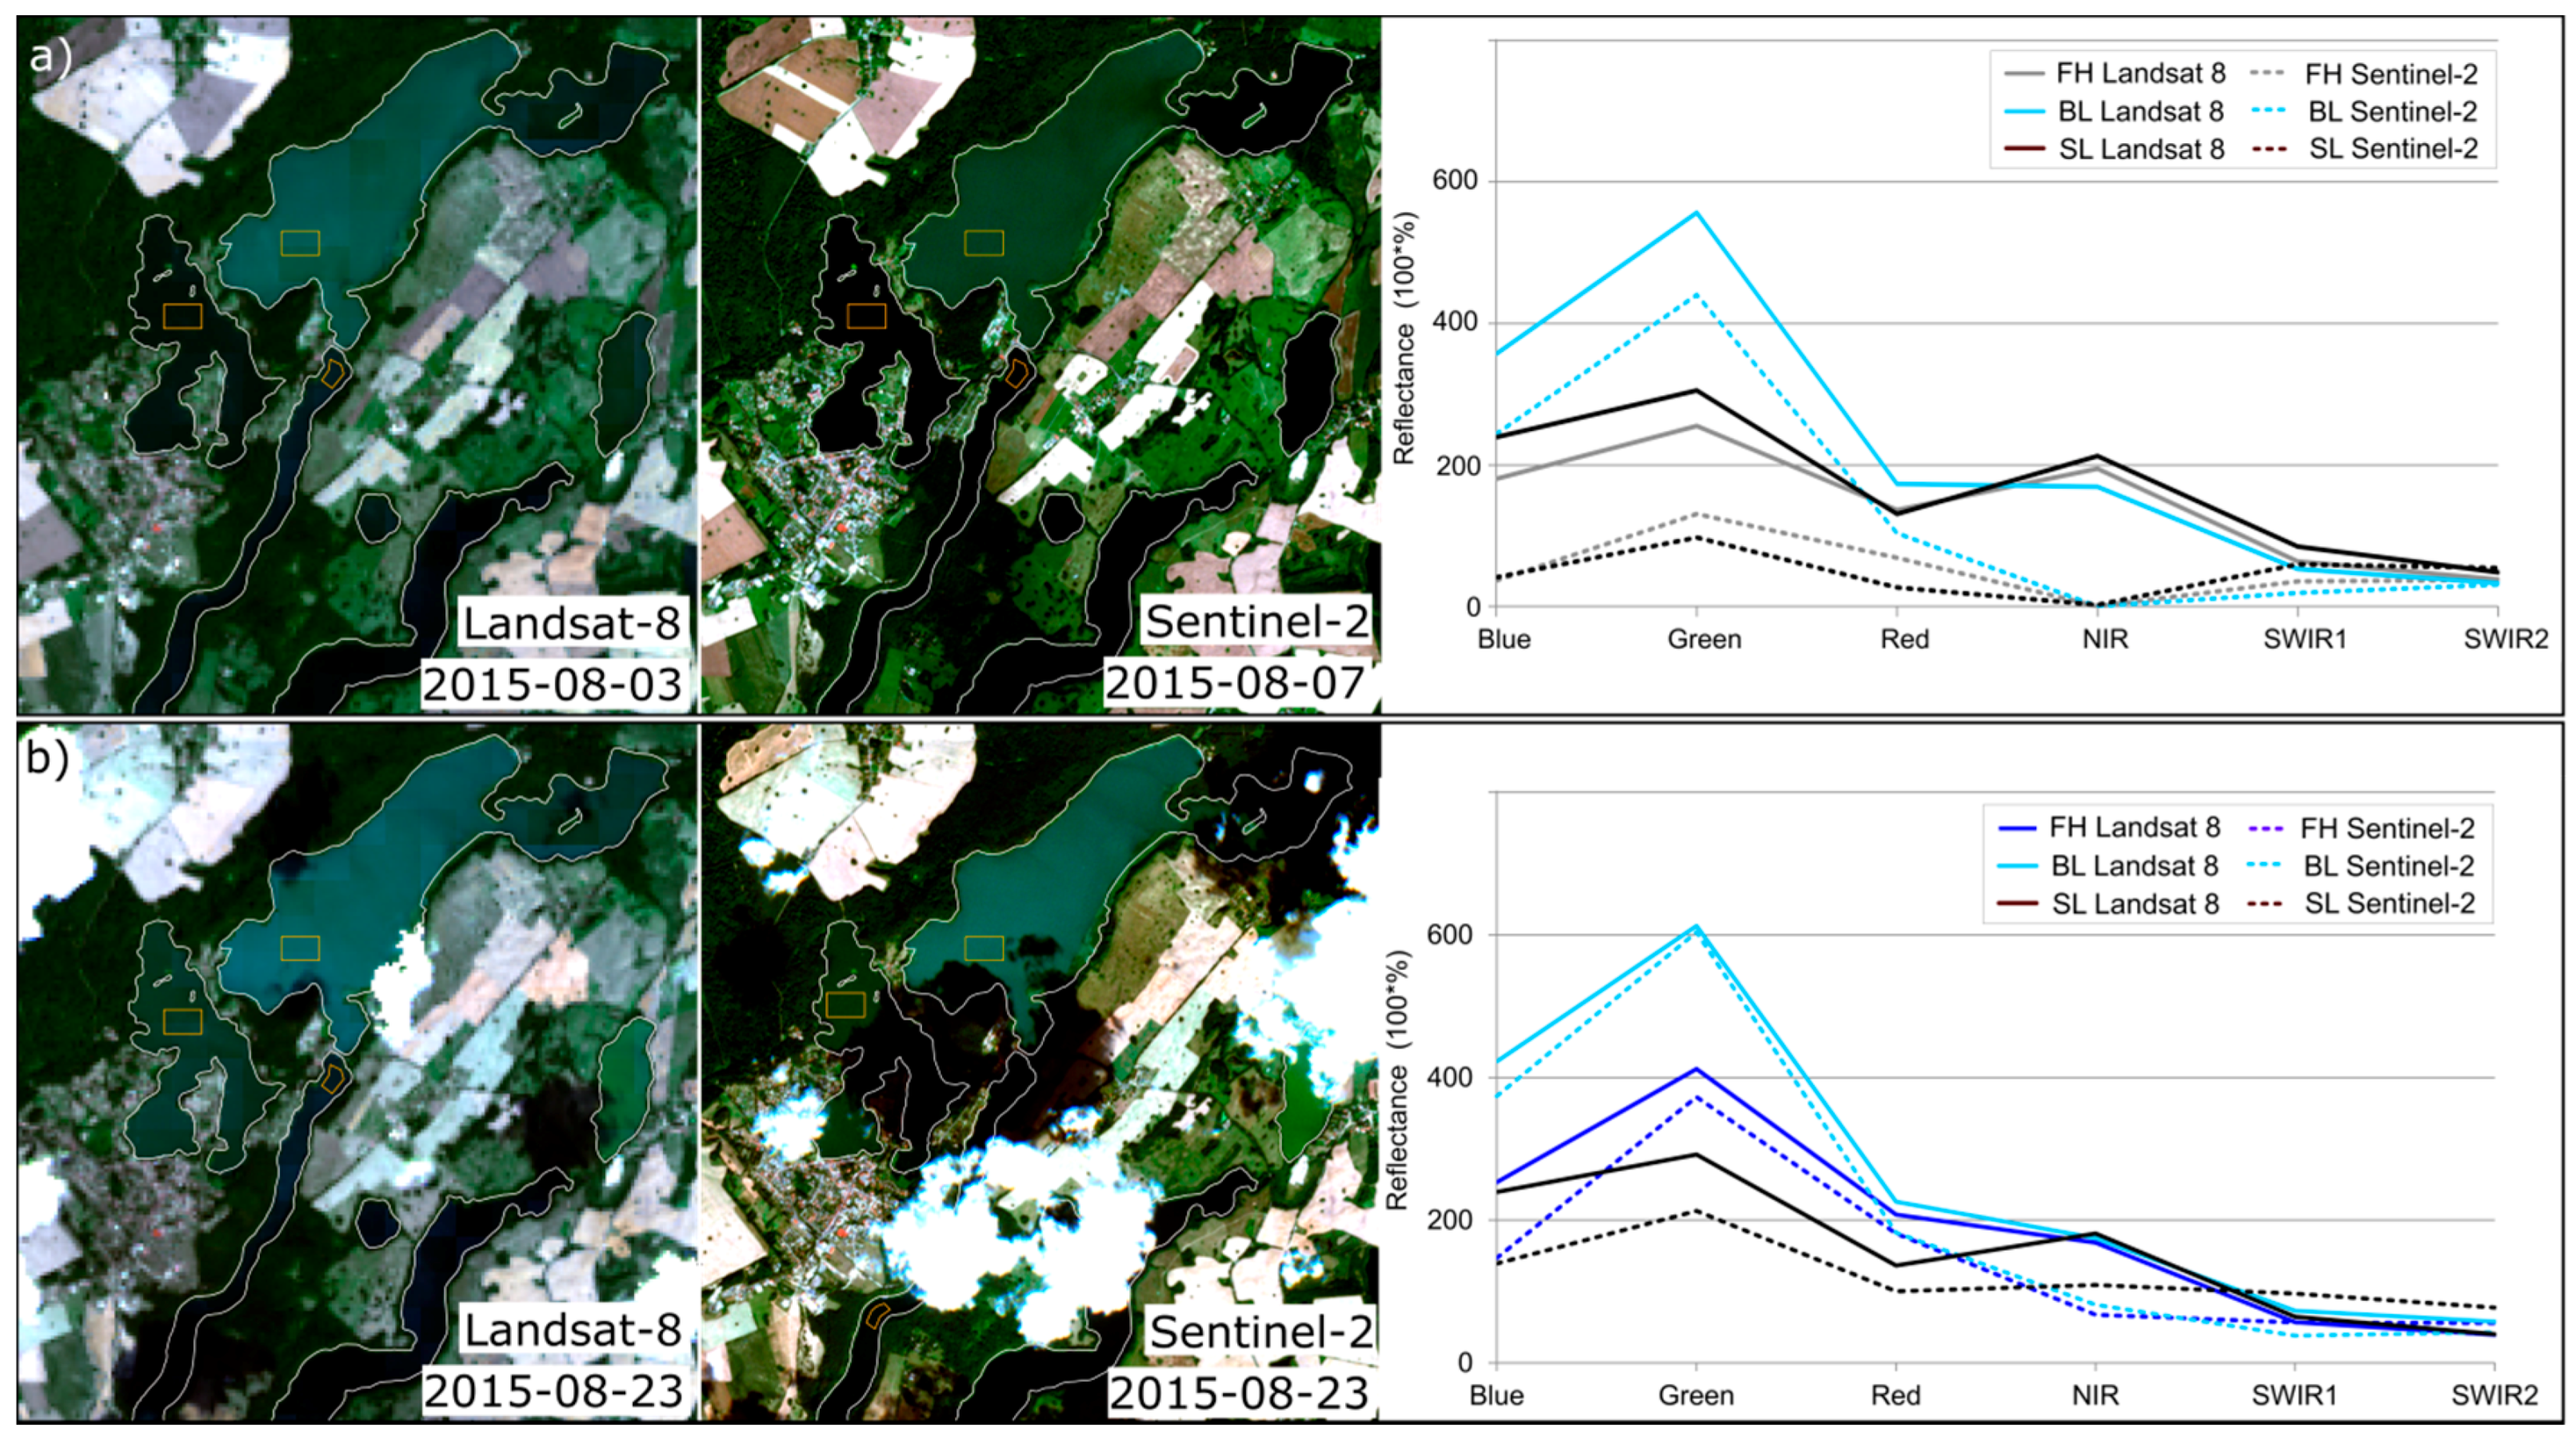
The atmospheric correction is the most complex and error-prone processing step in water remote sensing as atmospheric correction models try to remove a large noise (atmosphere) from the small signal of water. However, in time series analysis atmospheric correction is essential for the comparison of different dates and sensors. In this study, we use the Landsat archive (Landsat 5, 7 and 8) and Sentinel-2 imagery, but the focus is the fast and easy applicability of satellite images for the monitoring of calcite precipitation. Thus, we ordered the satellite images in their highest processing level, including atmospheric correction, or used the state-of-the-art processor (e.g., sen2cor for the atmospheric correction) recommended by the provider of the satellite data. However, the models for the atmospheric correction differ for the different sensors and cause significant variation in the lake spectra (cf.
Figure 13).
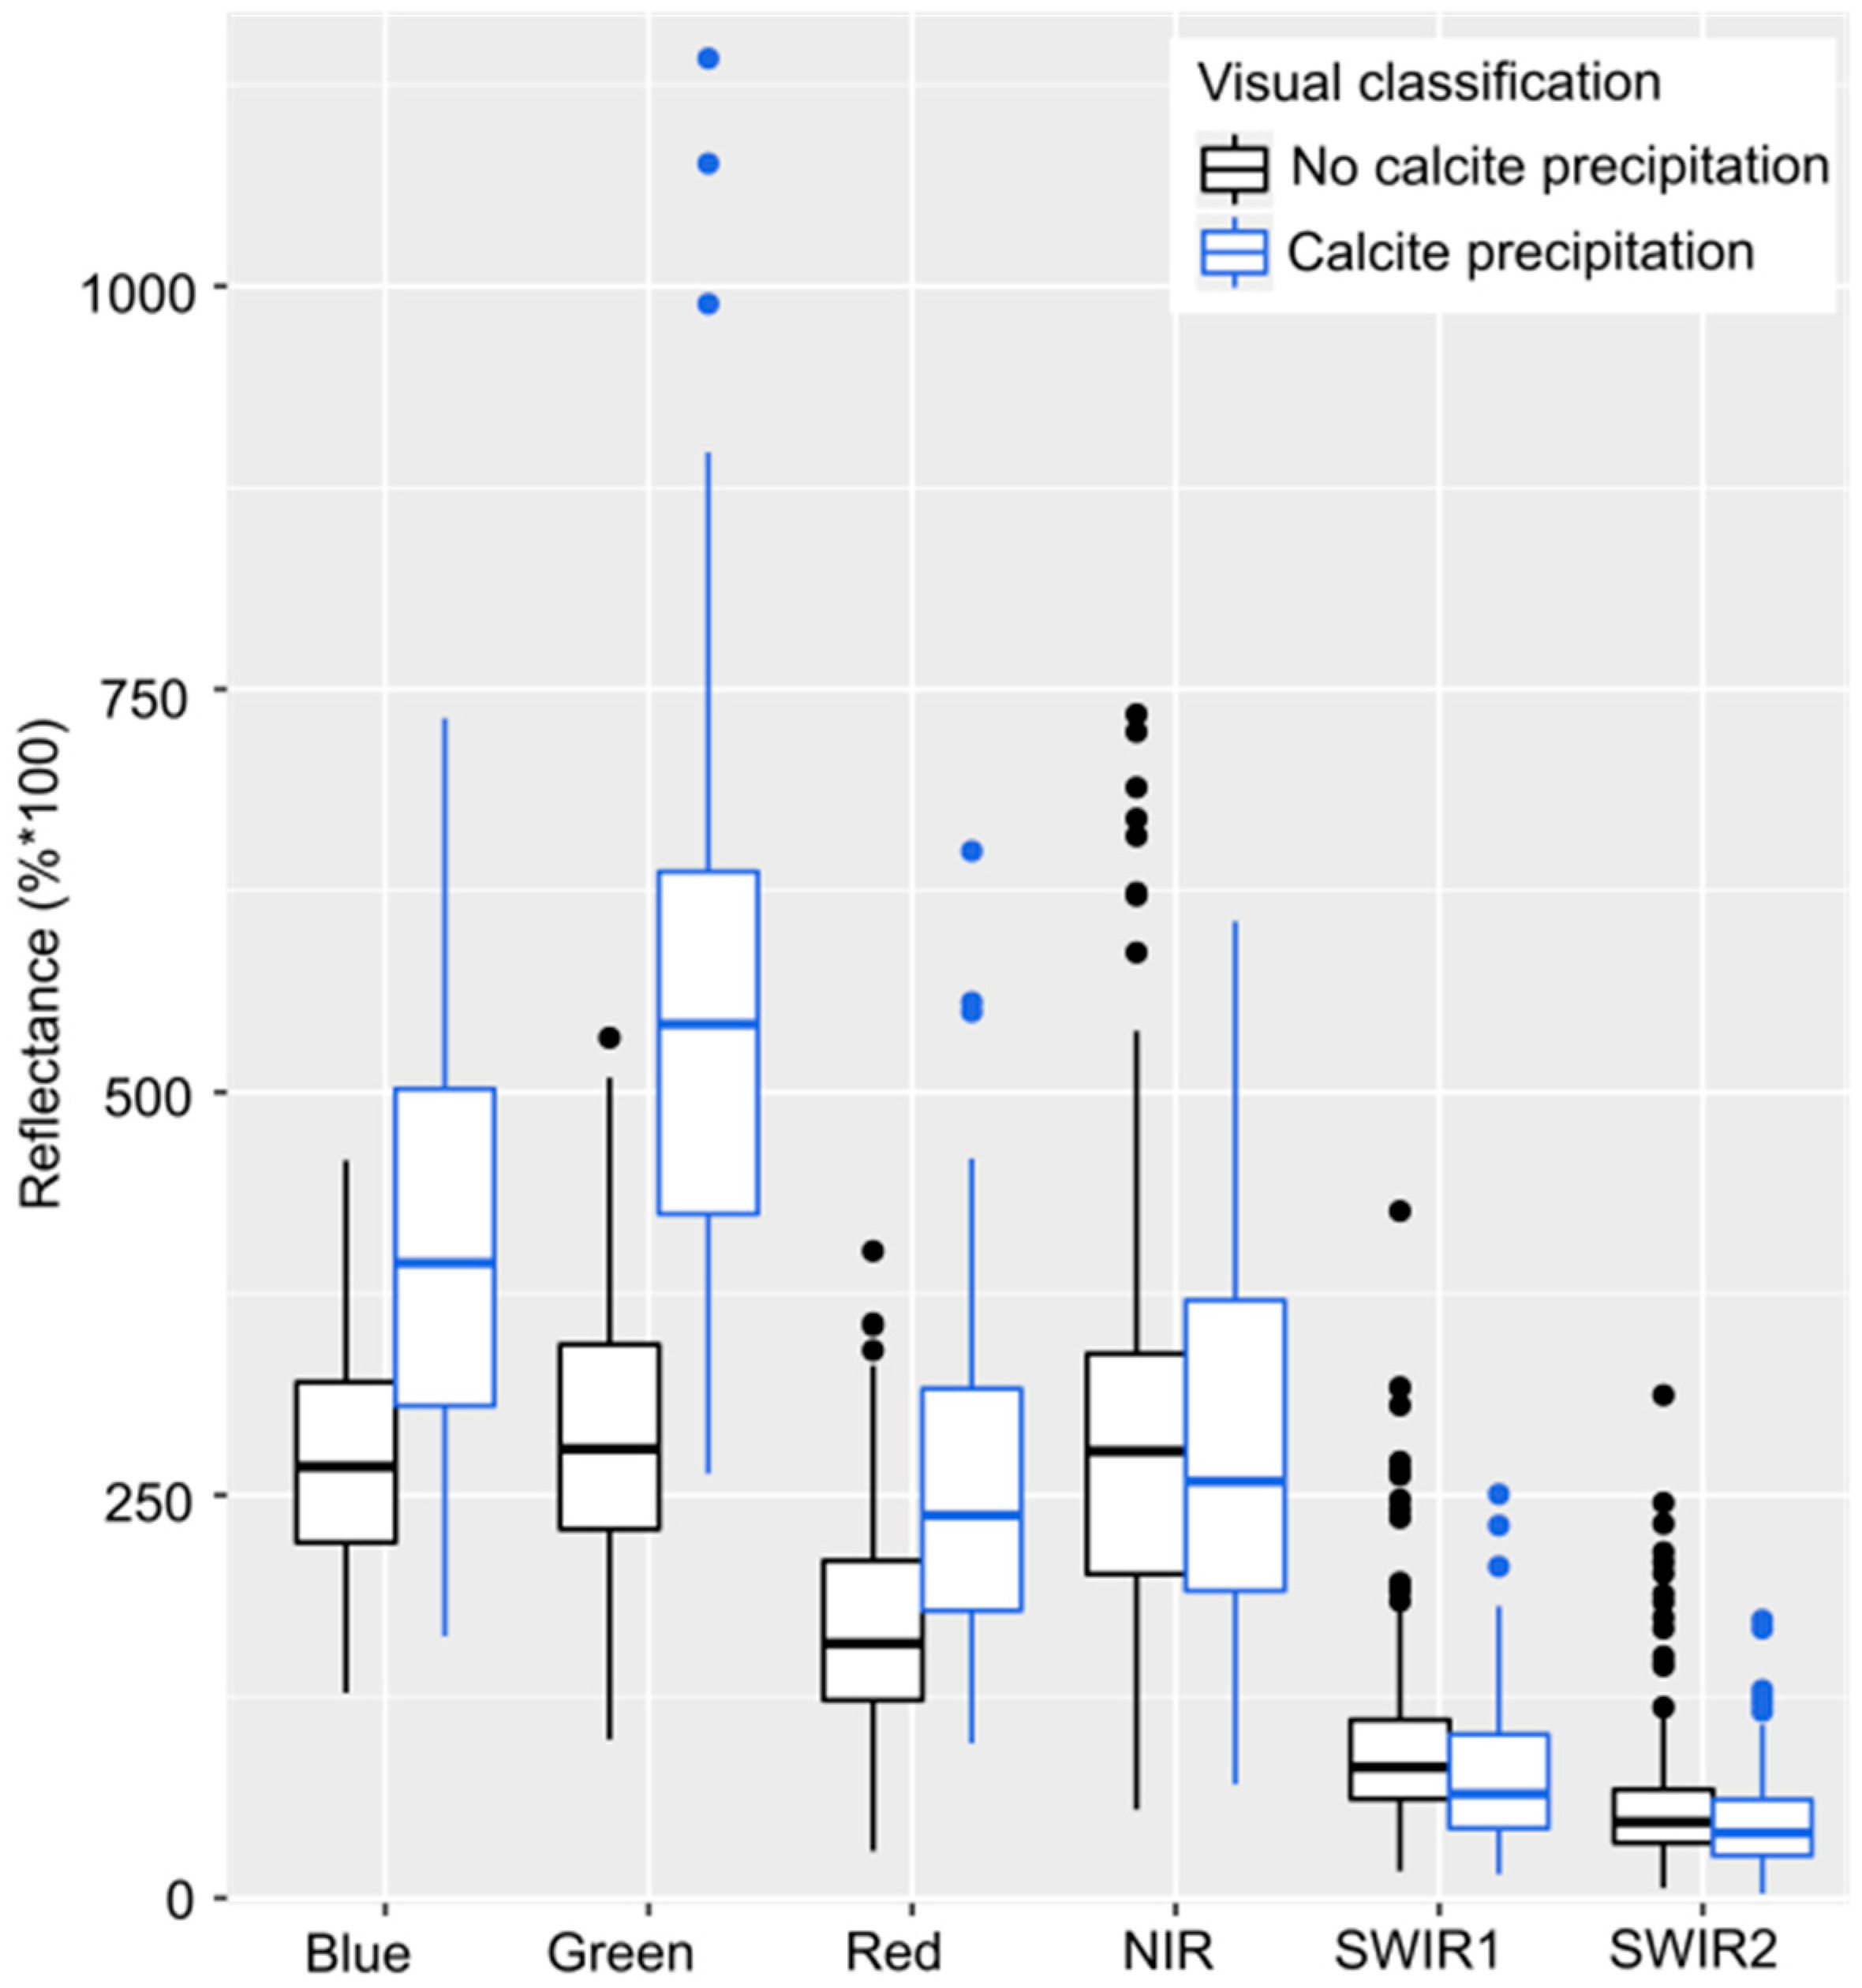
Despite the significant variation in the lake spectra, calcite precipitation events are clearly visible in multispectral Landsat and Sentinel-2 images. Whereas lakes without calcite precipitation appear black in quasi-true color RGB images, high CaCO3 concentrations cause an additive effect to the spectra, especially in the green band, resulting in a turquoise color. In addition to calcite precipitation, the lake spectra can be influenced by other suspended minerals, yellow substances (“Gelbstoff”), and phytoplankton (chl-a concentration).
Other suspended mineral particles can increase the reflectance similar to calcite precipitation, but sediment entry is negligible in this study area because of dense vegetation cover, low topography and slow flow velocities that cannot carry sediments [
2]. In other study areas, however, sediment entry might distort the monitoring of calcite precipitation. Another possible source of error are shallow water areas where the lake bottom can be seen or where wind can resuspend sediments that cause high particle concentrations in the open water [
2]. Thus, the lake spectra for the analysis are extracted in deep areas of the lakes to avoid misclassifications.
Yellow substances (“Gelbstoff”) in the water absorb in ultraviolet and blue [
2,
10,
11], however, as colored dissolved organic matter (CDOM) was not measured in situ, we cannot estimate its influence on our lake spectra.
Whereas lakes with calcite precipitation are mostly turquoise, on some dates, the lake color appears more greenish than turquoise or is even bright green color (e.g., FH on 1 June 2008). Those green colors can be explained by (a mixture of calcite precipitation and) high chl-a concentrations: Phytoplankton scatters diffusely within the algal biomass (additive effect to the spectra), but also absorbs in blue and red [
10,
56,
57]. Lake spectra with high chl-a are characterized by an peak around 700 nm (red edge) [
56]. This peak cannot be detected using Landsat imagery because of the missing red-edge band of the Landsat sensors [
42,
43]. The new Sentinel-2 mission has a red-edge band and first tests with Sentinel-2 images showed its potential for the estimation of chl-a [
58]. Thus, we expect that Sentinel-2 will be used in future for additional distinction between calcite precipitation and algal blooms. Even though in this study, the limited amount of Sentinel-2 data and a lack of contemporary in situ measurements hindered a further analysis.
Thus, in this study calcite precipitation and phytoplankton blooms cannot be distinguished clearly. The potential risk of misclassification in the lakes in Feldberg Lake District or Klocksin Lake Chain is very low because the lakes are mostly mesotrophic and considerable algal blooms are most likely in eutrophic lakes with chl-a concentration above 20 μg/L [
56]). In Rheinsberg Lake Region, several lakes are eutrophic and, whereas calcite precipitation events also occur in eutrophic lakes (cf. Feldberger Haussee), occasional misclassifications of algal blooms cannot be excluded (e.g., March 2014 at Kleiner Glietzensee).
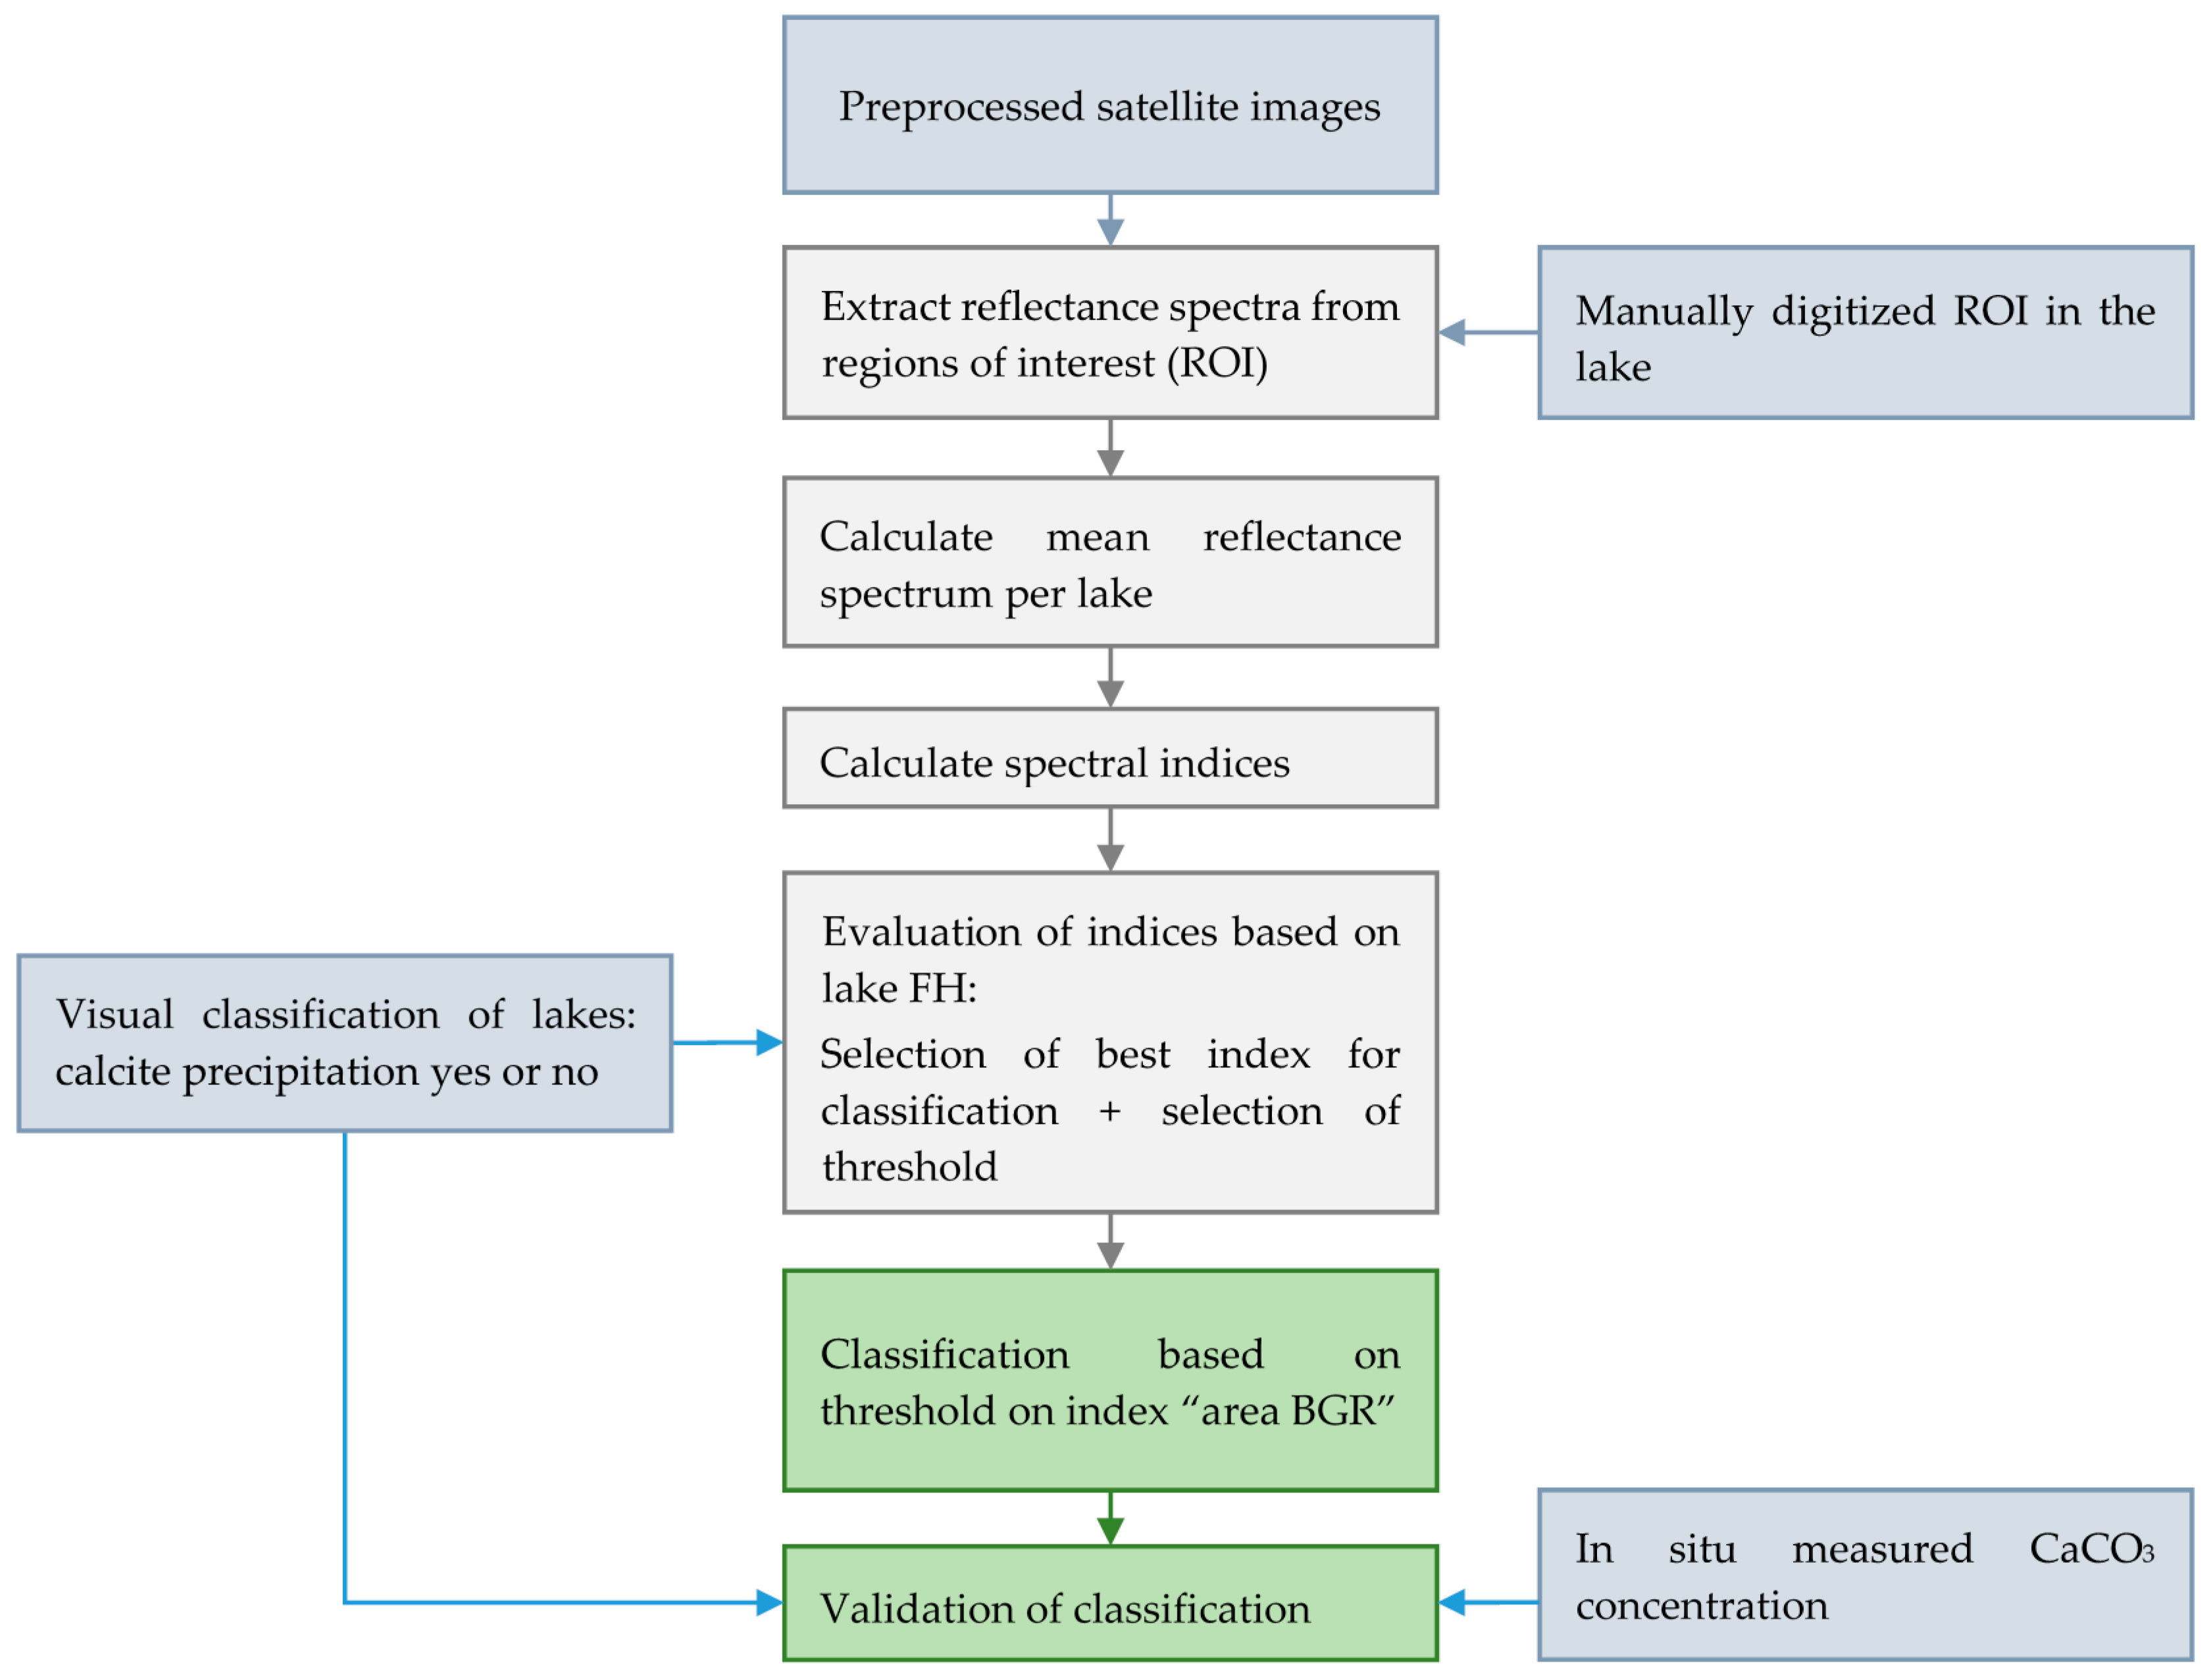
5.2. Classification and Validation of Calcite Precipitation Using Multi-Spectral Satellite Imagery
Even though previous studies highlighted the patchiness of calcite precipitation in large lakes (area >20 km
2) [
1,
2,
25], the lake colors in our study area are homogeneous (cf.
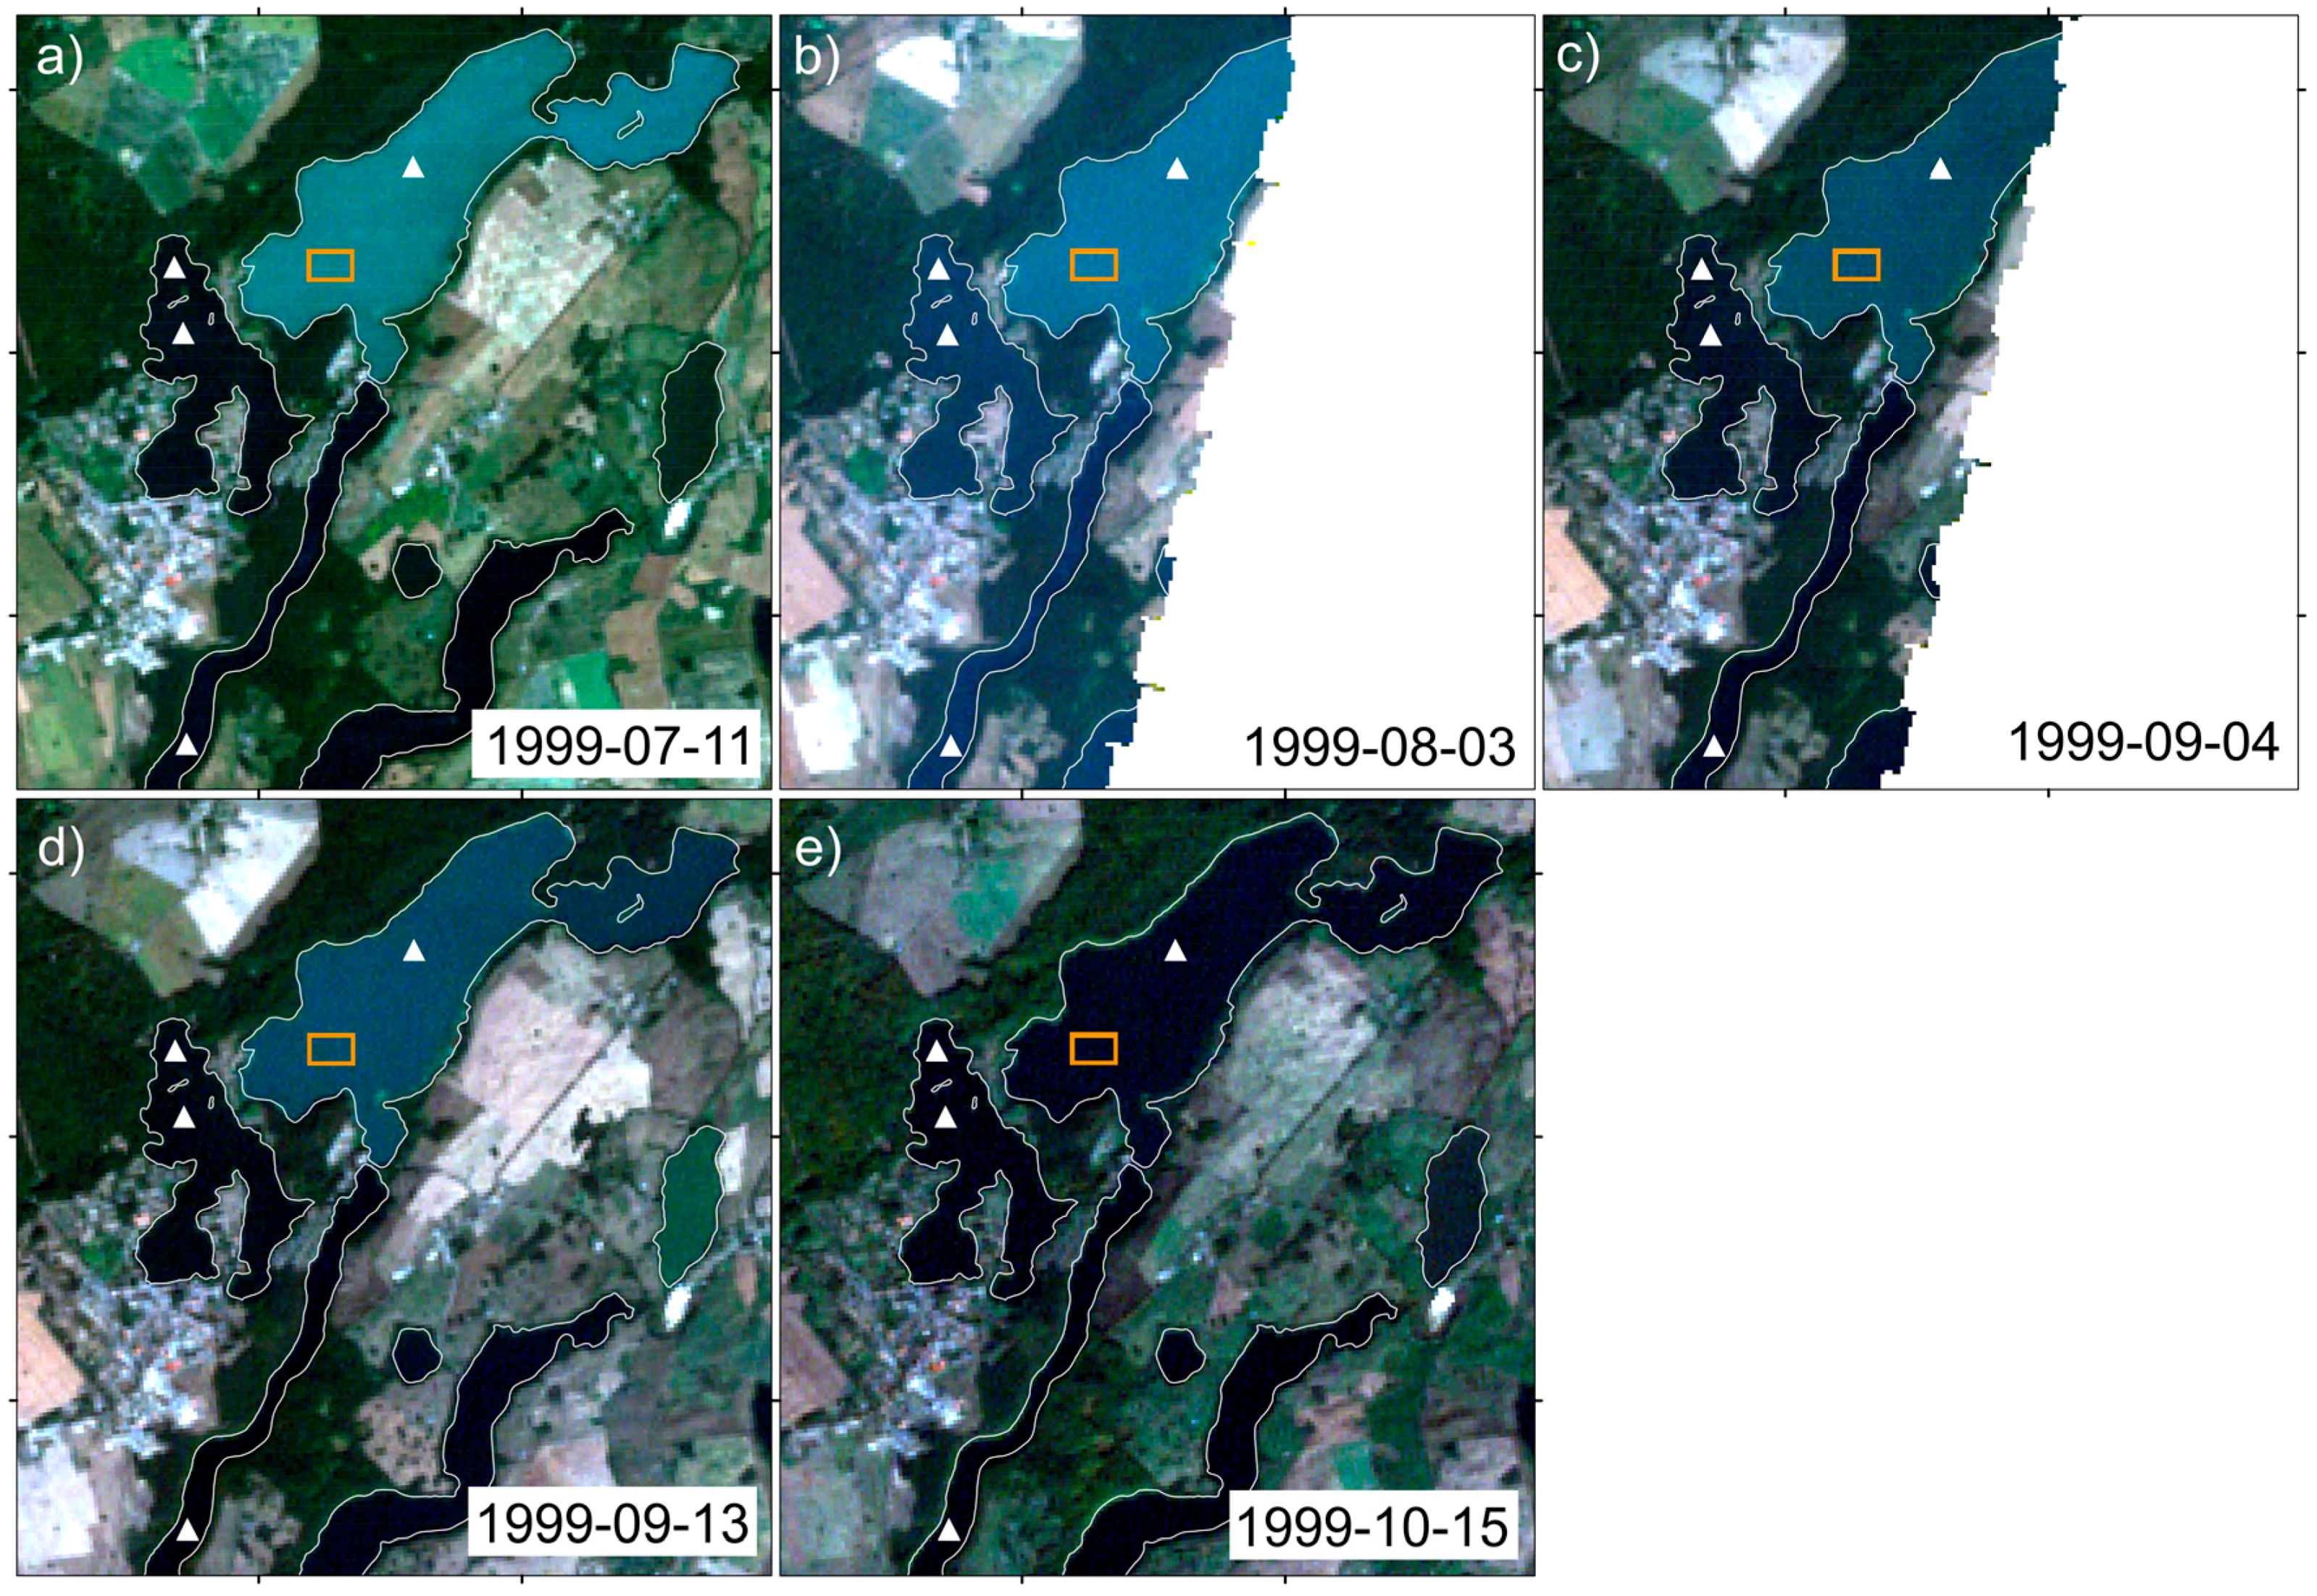
Figure 2 and
Figure 9) as the smaller size of the lakes in northeastern Germany supports mixing processes. The only exceptions are different lake colors in separated basins of lakes (cf. BL in
Figure 9d and
Figure 15). Some heterogeneity within the water bodies is smoothed out by the 30-m resolution of Landsat, but there are also artifacts from the atmospheric correction of Landsat 8 images that cause some variation [
59]. Thus, in this study, a classification based on mean lake spectra was chosen to minimize the variation of the lake spectra. In other regions with higher heterogeneity classifications on pixel level might be preferable.
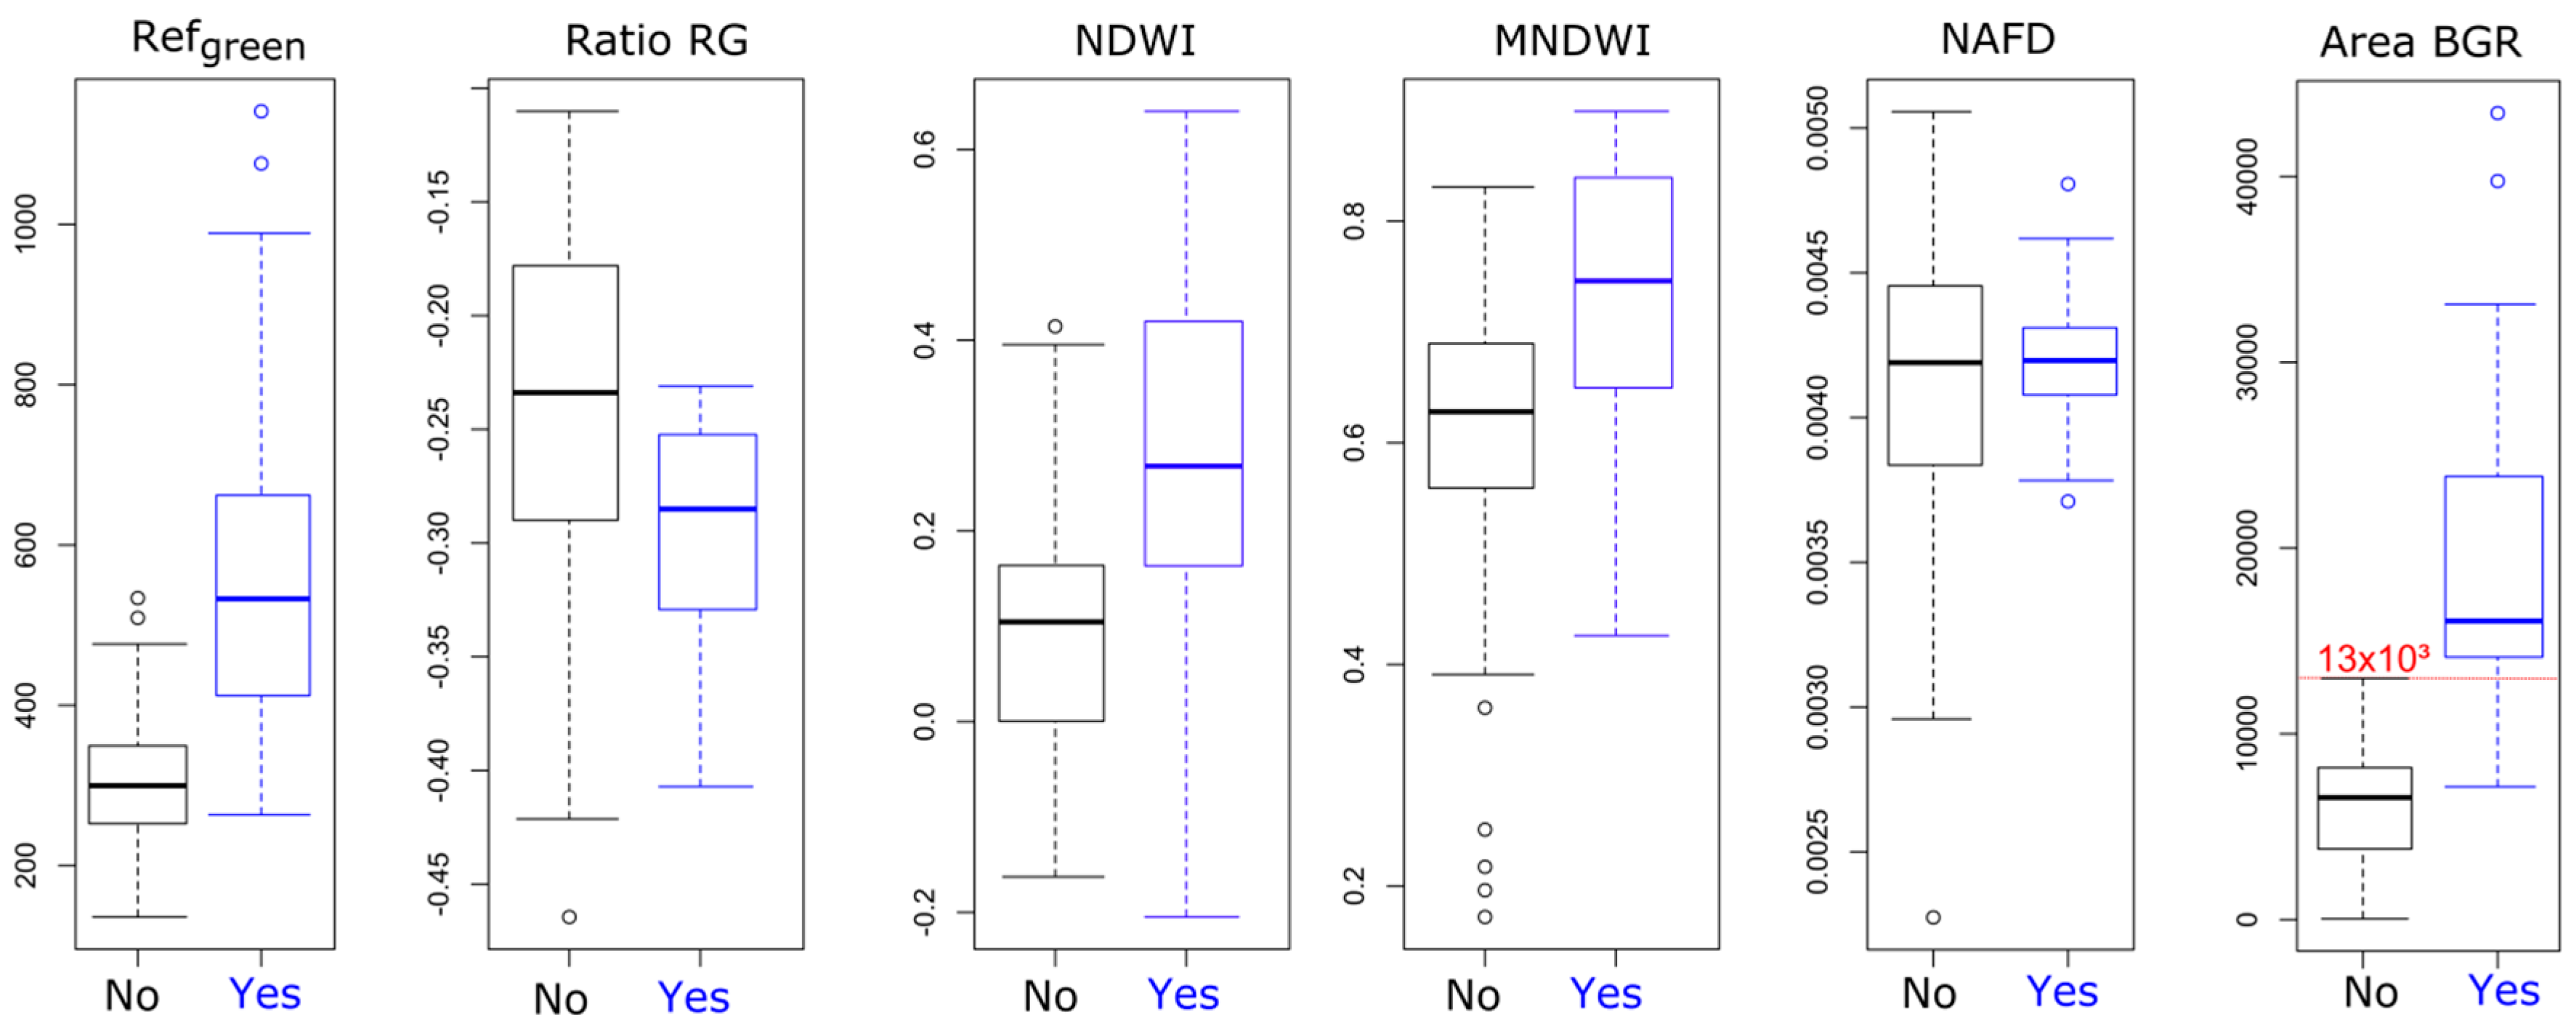
Thiemann and Koschel proposed a classification of calcite concentration based on 800 nm in hyperspectral images and considered more than 3% reflectance at 800 nm as calcite precipitation [
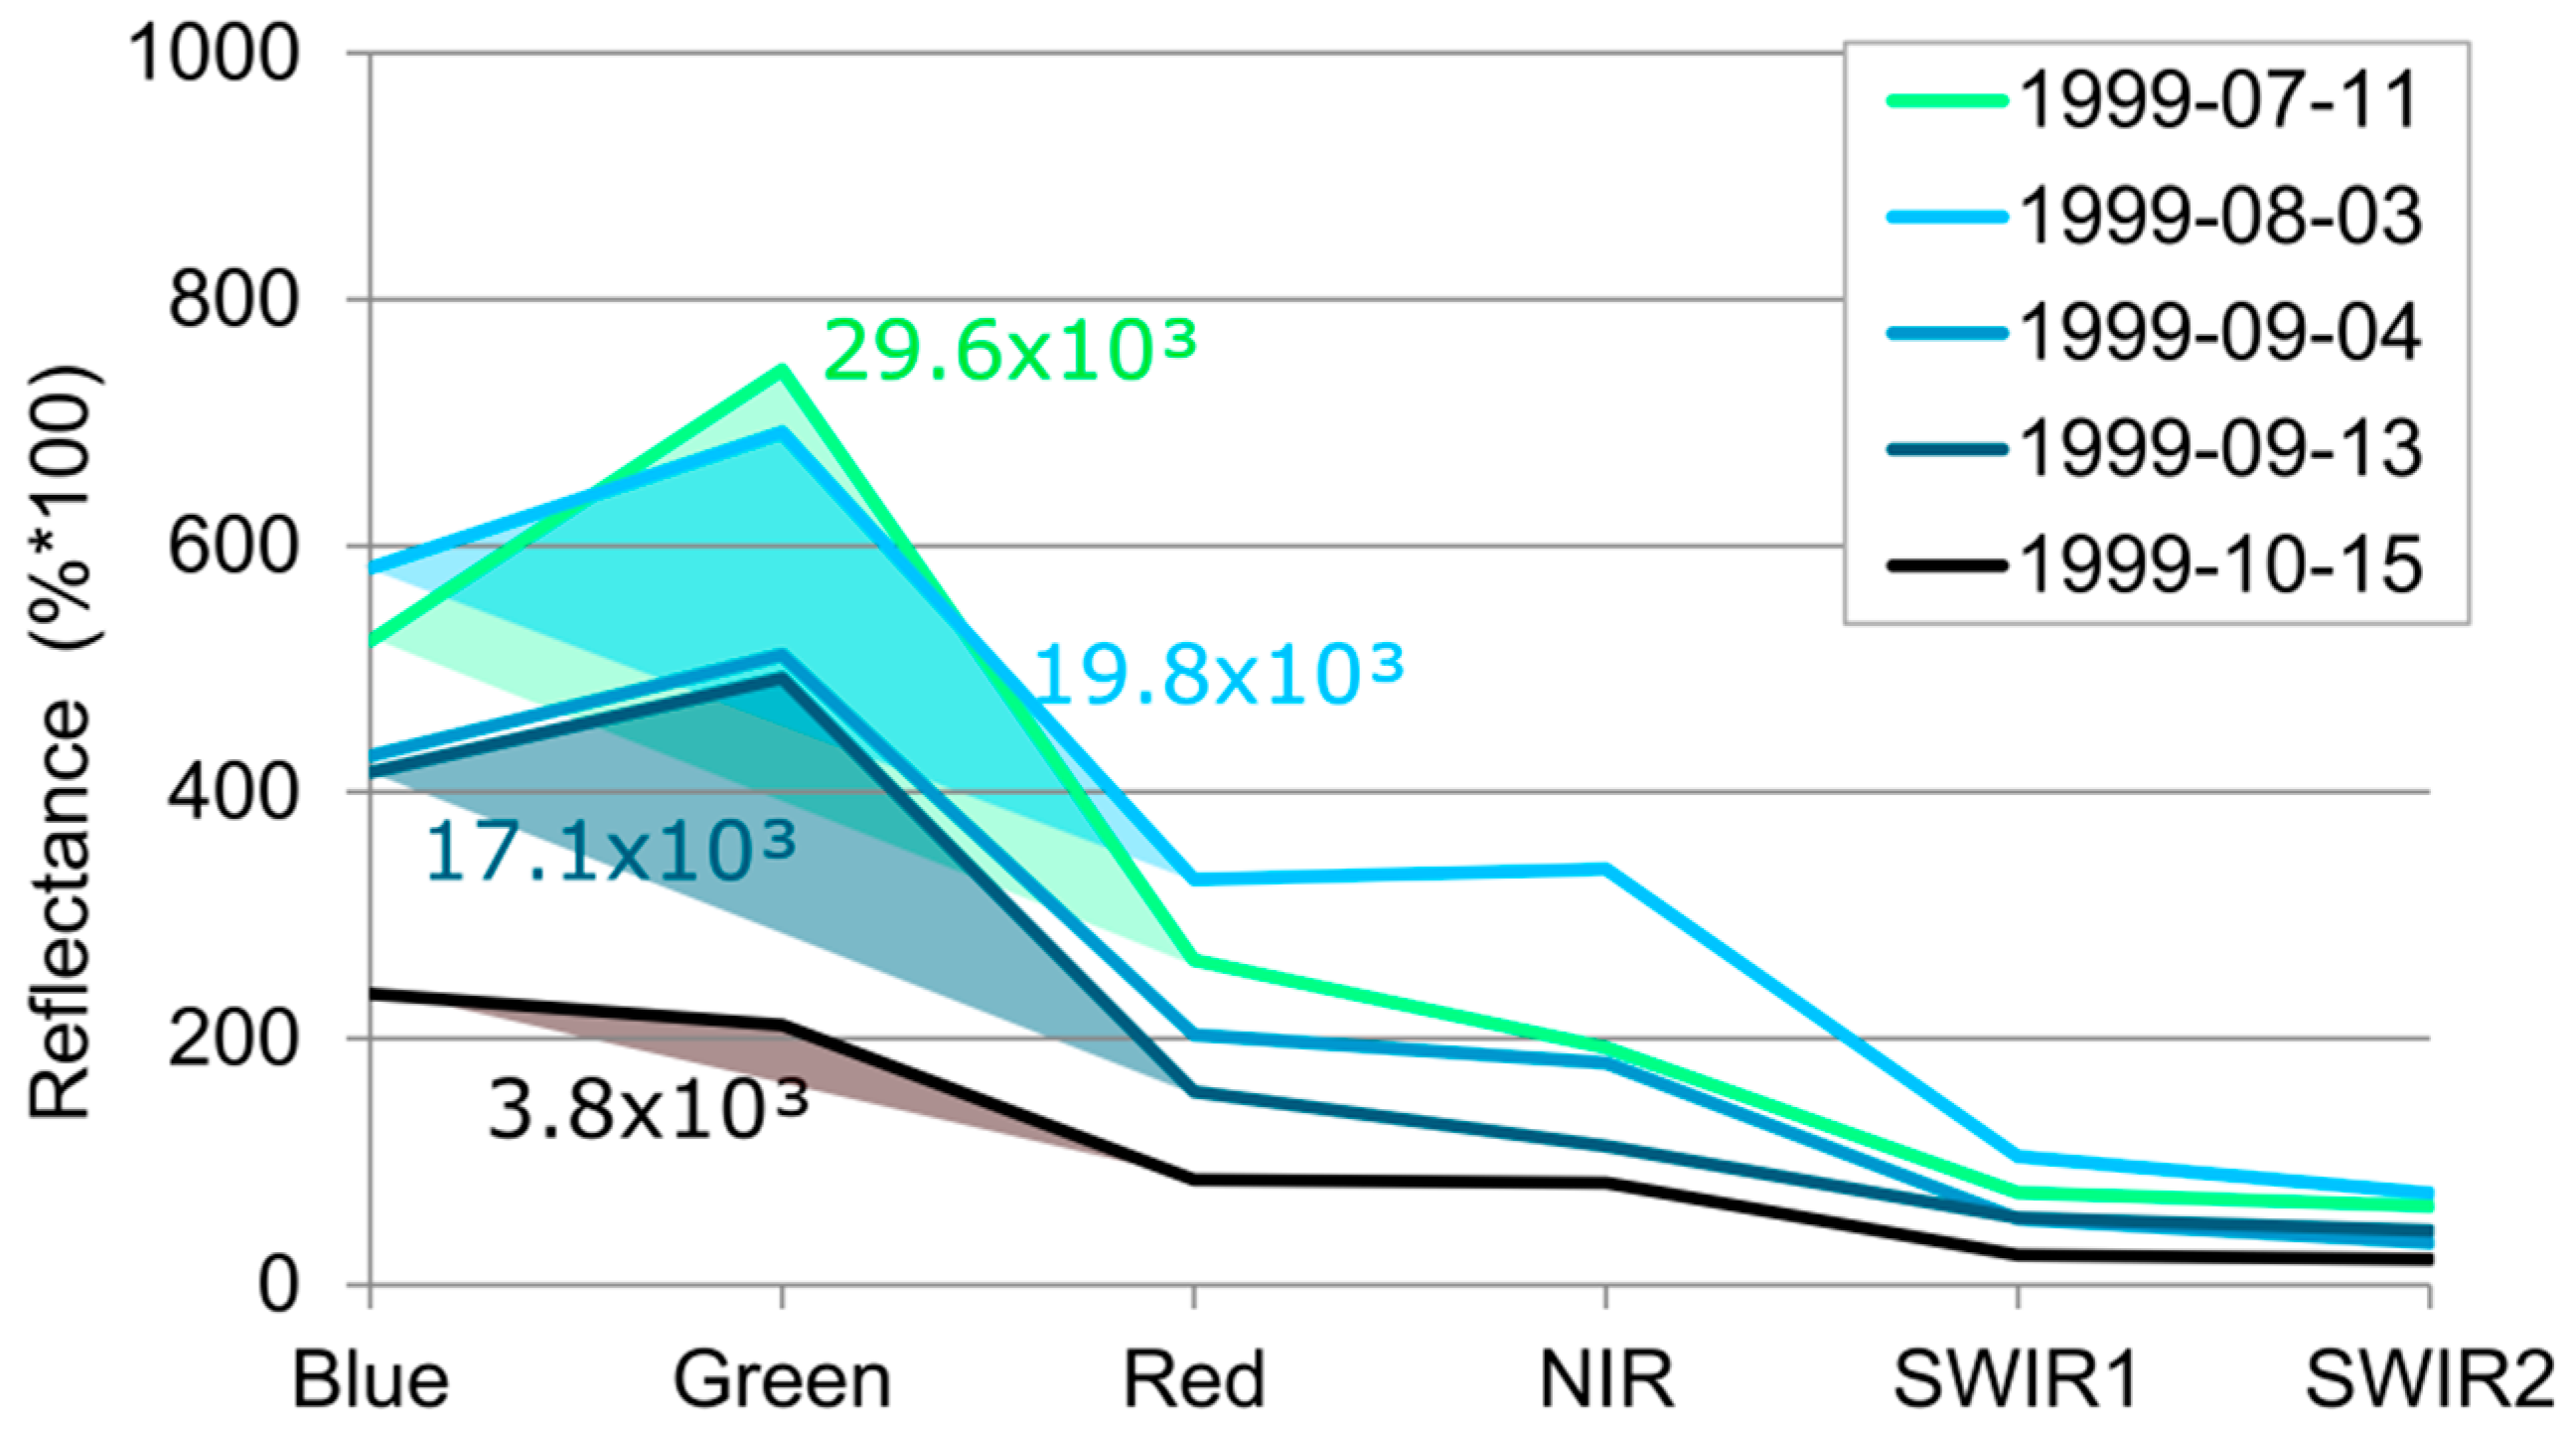
2]. Although Landsat images do not have an 800 nm band, red is on average 655 nm and NIR is at 865 nm and a comparison with the spectra of BL (
Figure 10) shows that only the strongest calcite precipitation on 11 July 1999 meets their criteria for calcite precipitation. At the other dates the reflectance of red and NIR are below 3% reflectance, even though in situ measurements showed increased CaCO
3 concentrations. Therefore, we tested several spectral indices for the classification of calcite precipitation. Best results were achieved with a classification based on the triangular area between the blue, green and red band in the spectra, the “Area BGR”. If the Area BGR value is ≥13 × 10
3, the lake is classified as lake with calcite precipitation. This threshold is suitable for Landsat imagery and Sentinel-2 despite their differences in bandwidth and atmospheric correction.
Before this study, it was unknown which calcite concentrations were detectable from space. Thus, we compared our Landsat-derived classifications with different in situ CaCO
3 concentrations. Without optical aid a previous study suggested the limit for the visual detection of calcite precipitation is 1 mg/L [
3]. Our classification approach was able to detect CaCO
3 concentrations ≥0.7 mg/L with an accuracy of 0.88. A higher threshold in the CaCO
3 concentration increases the number of FP classification results, whereas a lower CaCO
3 concentration increases the number of missed calcite precipitation events (=FN). The accuracy of the automatic classification is hereby also slightly better than the accuracy of the according visual classification of the quasi-true color RGB Landsat images (0.85).
The accuracy of the Landsat-derived classifications is decreased by FN and FP results: Here, FN results can be explained by the conservative threshold that is optimized for the correct classification of lakes without calcite precipitation: Thus, dates with only a slight color change are missed by the threshold. However, the six missed calcite precipitation events all have CaCO
3 concentrations between 0.95 and 1.65 mg/L which should have resulted in a visible color change. The visual classification of those dates confirms that four of the six dates indeed showed no or only a slight color change. The other two images have image quality problems and biased lake reflectance spectra because of cloud coverage. The lack in color change despite calcite precipitation might be explained by the heterogeneity of CaCO
3 concentrations within the lake or by time gaps of one day between in situ measurement and Landsat images. Thiemann and Koschel already noted the varying CaCO
3 concentrations within lakes in northeastern Germany and the possible problems for validation [
2]. Despite careful work, measurement and transmission errors cannot be excluded for certain.
The nine FP classifications are related to already increased calcite concentrations between 0.41 and 0.69 mg/L and resulting in a turquoise color of the lakes. This applies specifically in the visual classification because of the high sensitivity of the human eye and thus a more sensitive visual classification. Because of the time gaps between in situ measurements and Landsat acquisition, it could also be that the concentration during the Landsat acquisition has already increased. An additional validation of single dates using the SI failed because of: (a) its short term changes as soon as crystallization of CaCO
3 starts; and (b) its limitations in case of bio-induced calcite precipitation [
17,
18] as the occurrence of crystal nucleus, e.g., in form of bacteria [
59,
60], is equally important for calcite precipitation. Considering its SI FH has before 2011 not the potential for calcite precipitation, but in situ CaCO
3 measurements and the analysis of Landsat show clear calcite precipitation, whereas SL has high SI values since 2000 and therefore the potential for calcite precipitation, but still calcite precipitation events are very rare.
After the calibration and validation at Feldberg Lake District, the classificaion approach was applied in two other regions without in situ measurements. Here, the validation is based on visual classifications of the lakes. The accuracies are very high (0.99 and 0.97), but whereas Feldberg Lake District has a ratio of calcite precipitation events to normal lake conditions of 1:4, the ratio at Klocksin Lake Chain is already 1:14 and in Rheinsberg Lake Region even higher with 1:36. Thus, the accuracy is biased and in relation to the number of calcite precipitation events, the number of missed calcite precipitations (FN) is high in Rheinsberg Lake Region. The FN results can here also be explained by the conservative classification threshold in combination with the high sensitivity of the human eye and thus a more sensitive visual classification.
The accuracy based on the visual classification at Feldberg Lake District is 0.94. The lower accuracy at Feldberg Lake District in comparison to the other regions is caused by the less strict cloud removal. Especially, haze and missed cloud pixels hinder the accurate classification (FN results).
Whereas FN and FP classification results (e.g., FN results at lake Menowsee) distort the analysis of frequencies and durations, they do not affect the determination of the total area of lakes with calcite precipitation in this study. In comparison to the visual classification, FP are very rare, whereas all FN results occur at lakes that are, at other times, classified as lakes with calcite precipitation.
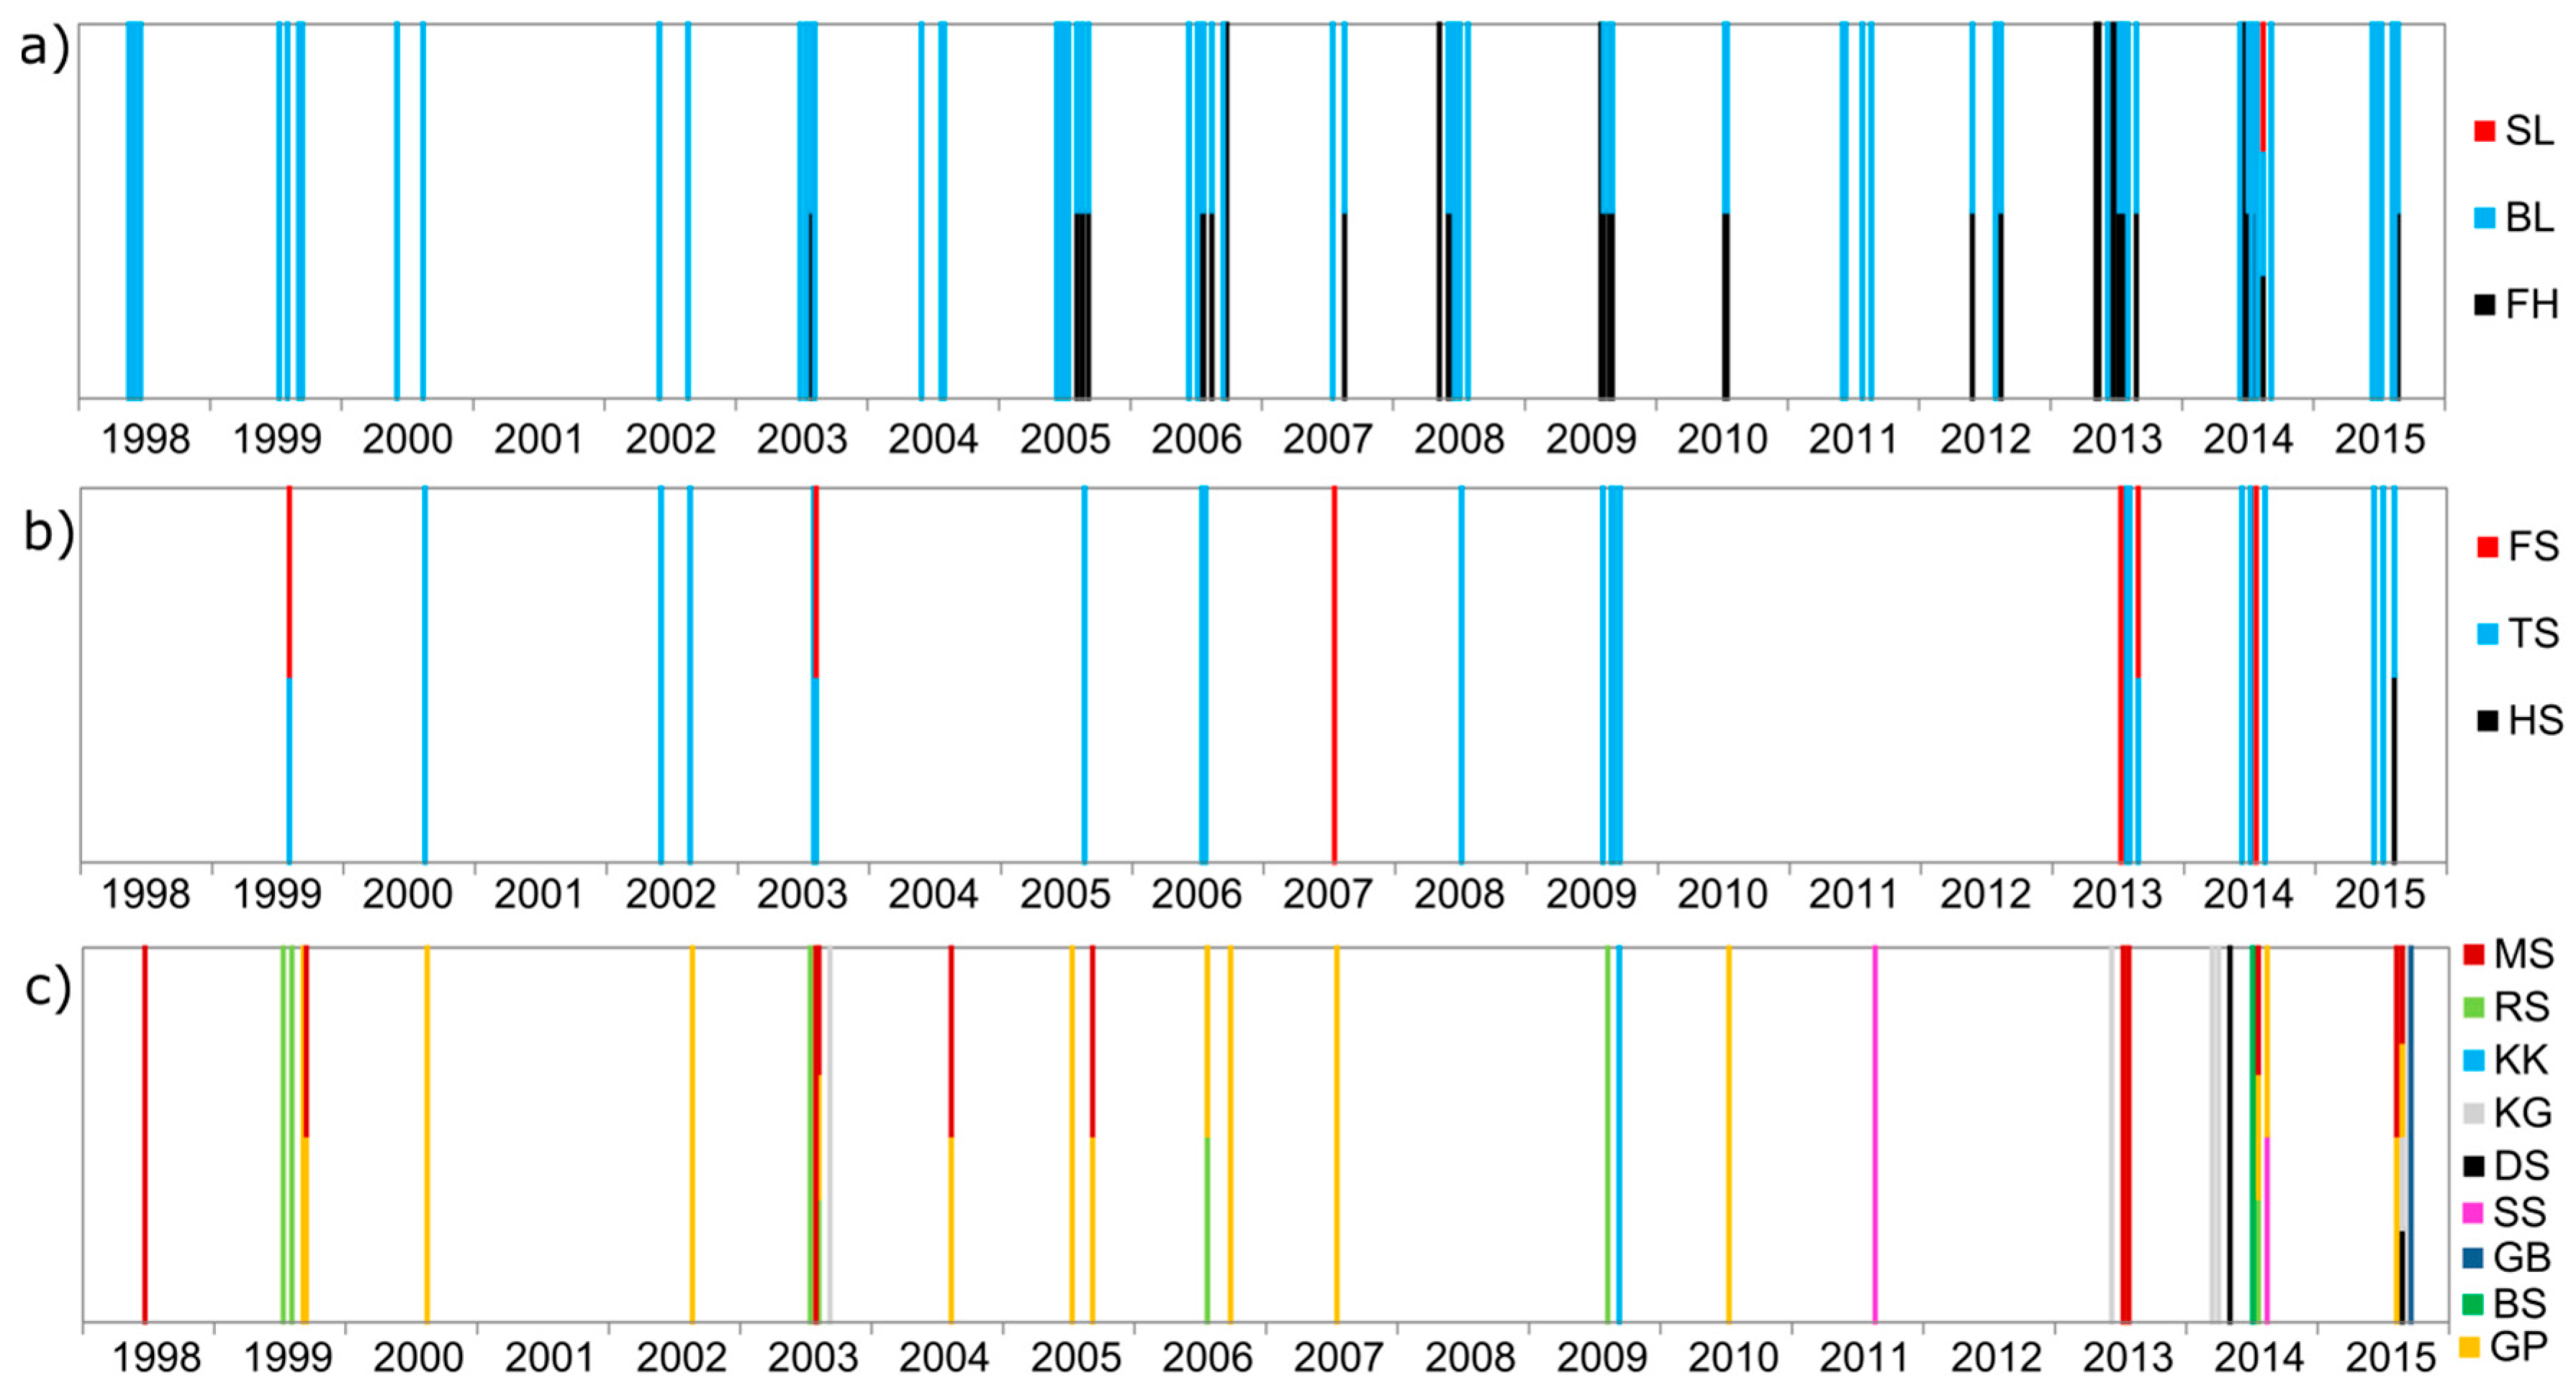
Overall, calcite precipitation events are detected in 15 of 24 lakes in the study areas and the total lake area of lakes with calcite precipitation is approximately 17 km2. Thus, our study supports that calcite precipitation is a common phenomenon in the hardwater lakes, but it also emphasized that the durations and frequencies strongly vary so that each lake must be monitored individually.
5.3. Time Series: Frequency and Duration of Calcite Precipitation
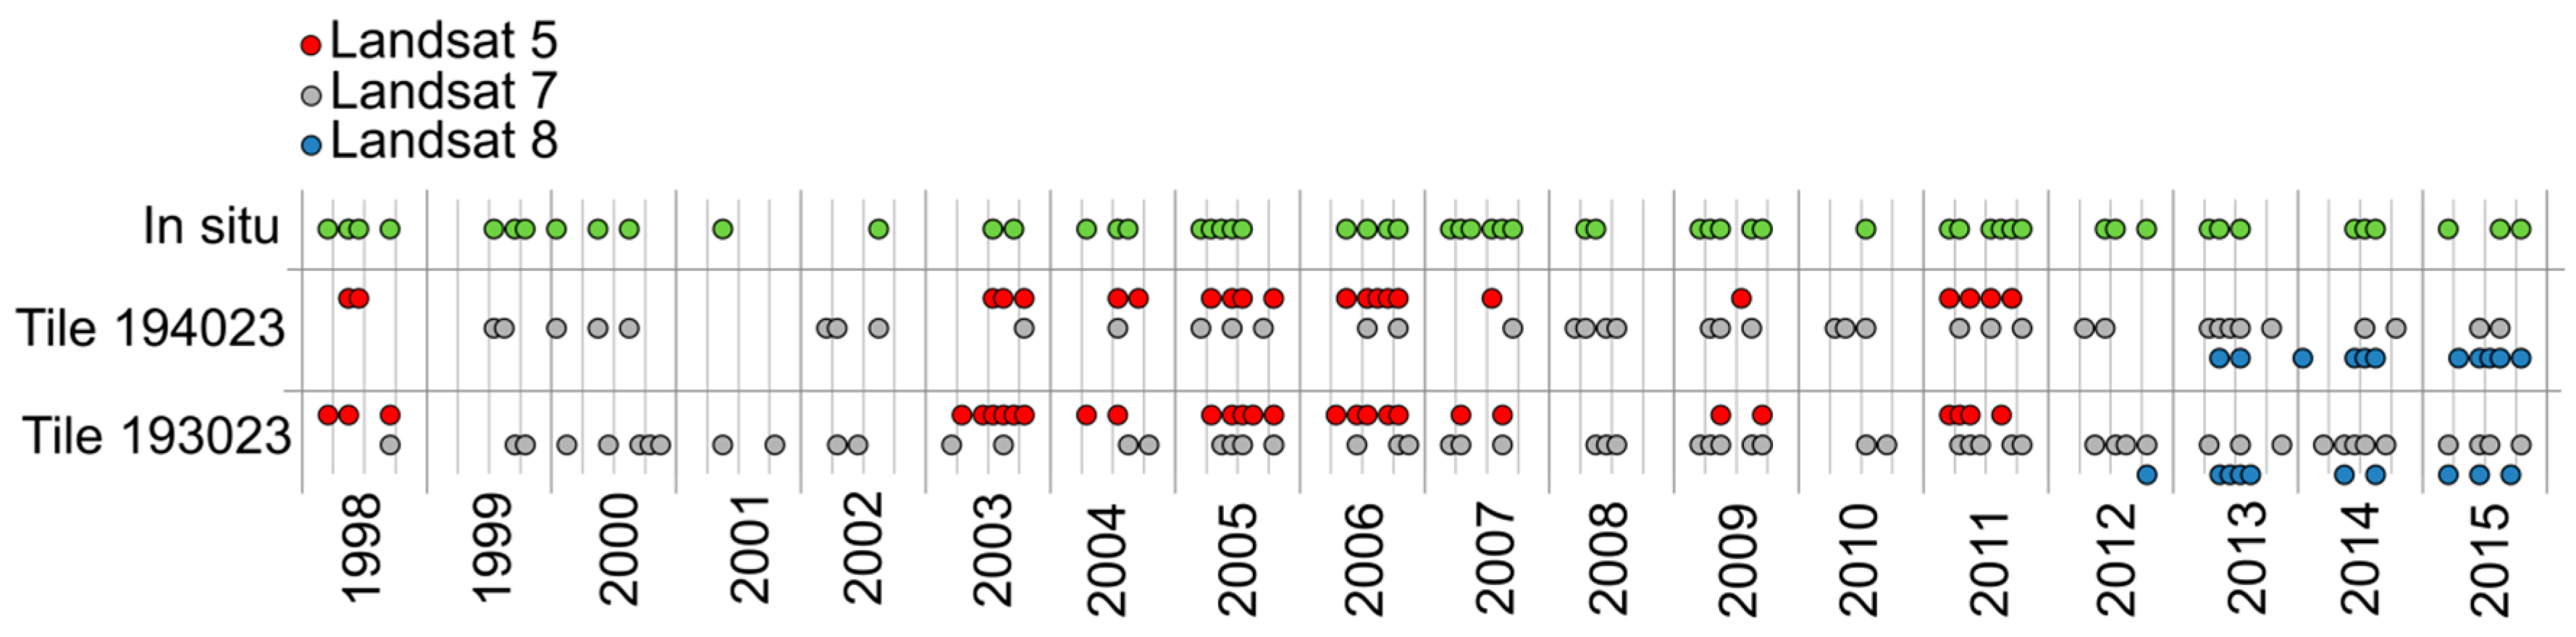
Remote sensing data and especially, the large Landsat image archive, enable a long-term monitoring of large areas. However, for an accurate monitoring of the duration and frequency of calcite precipitation, a high acquisition density is required. The Landsat archives cannot provide a continuous temporal coverage, due to their limited repetition rate of 16 days and acquisition gaps by cloud coverage.
Whereas in some years with overlapping satellite missions the number of acquisitions is high, other years have only very few acquisitions, e.g., 2001 (cf.
Figure 5). Since 2012, Landsat 7 and Landsat 8 are operating together providing a doubled repetition rate of eight days. However, cloud coverage still reduces the coverage significantly. For example, in 2012 the monitoring of the lakes in the Klocksin Lake Chain is only very irregular, because of the removal of cloud and cloud shadow (cf.
Table A1). Thus, for a regular monitoring of calcite precipitation at selected lakes a less strict cloud and cloud shadow removal should be considered, even if this comes along with a higher number of misclassification because of cloud and haze (cf. classification accuracy of Feldberg Lake District). Earth observation with the Sentinel-2 satellite(s) will further increase the data density with its higher time resolution and repetition rate of 10 days. However, so far, only two Sentinel-2a images cover the study area, so that the full potential of Sentinel-2 could not yet be studied.
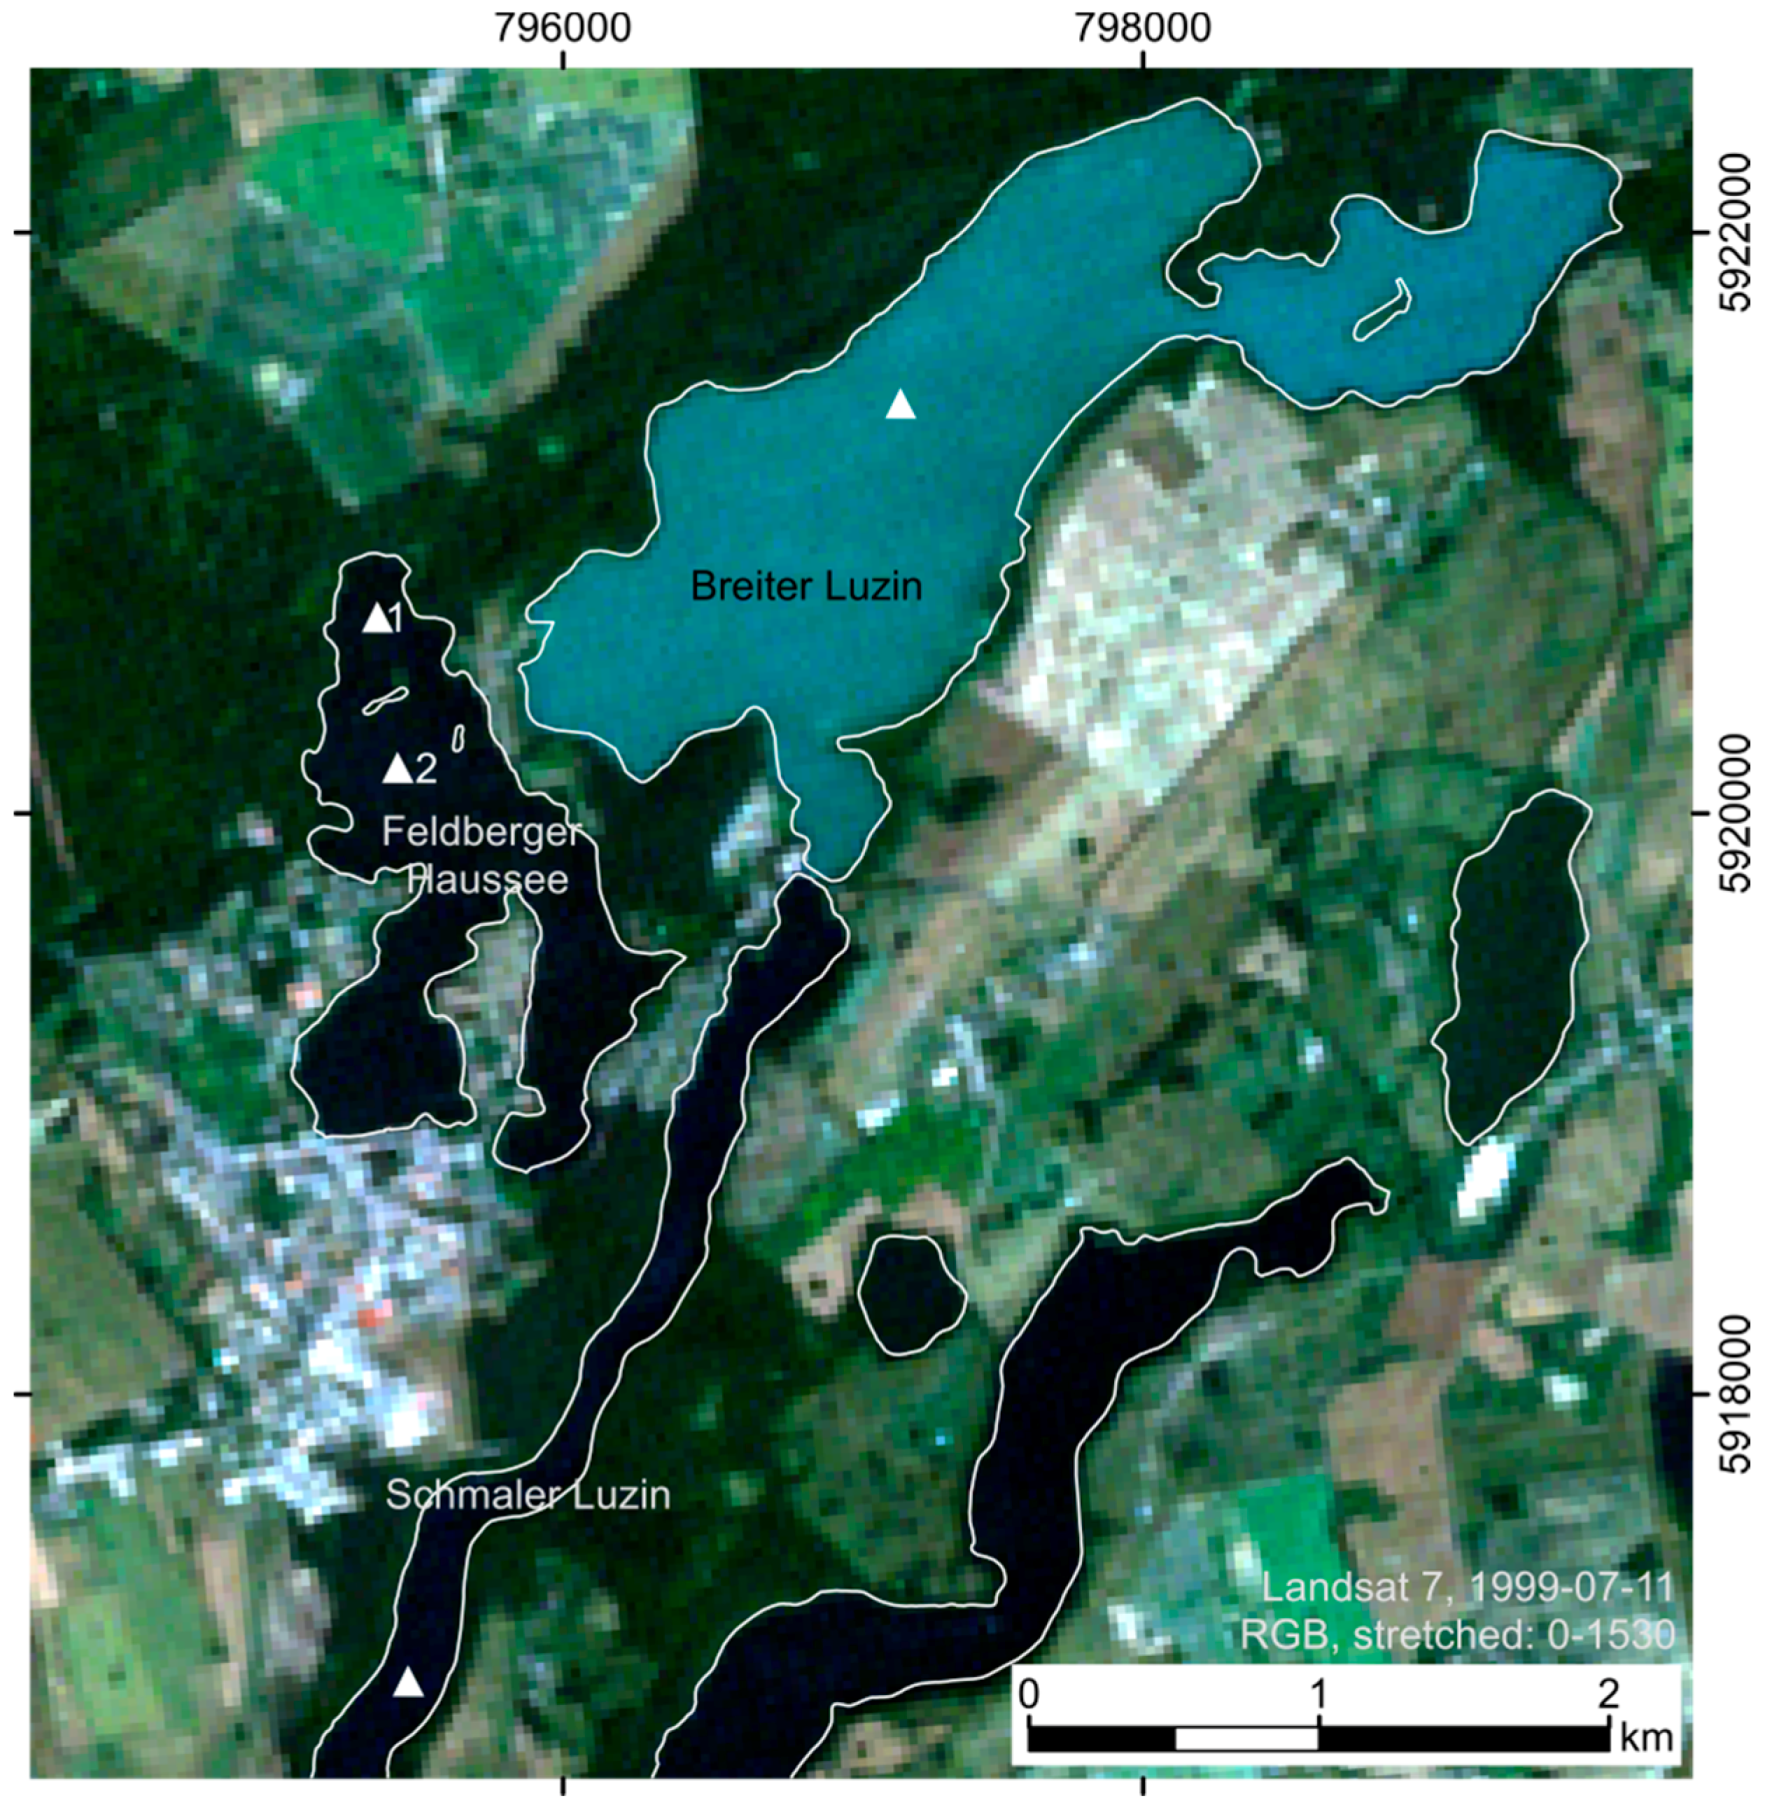
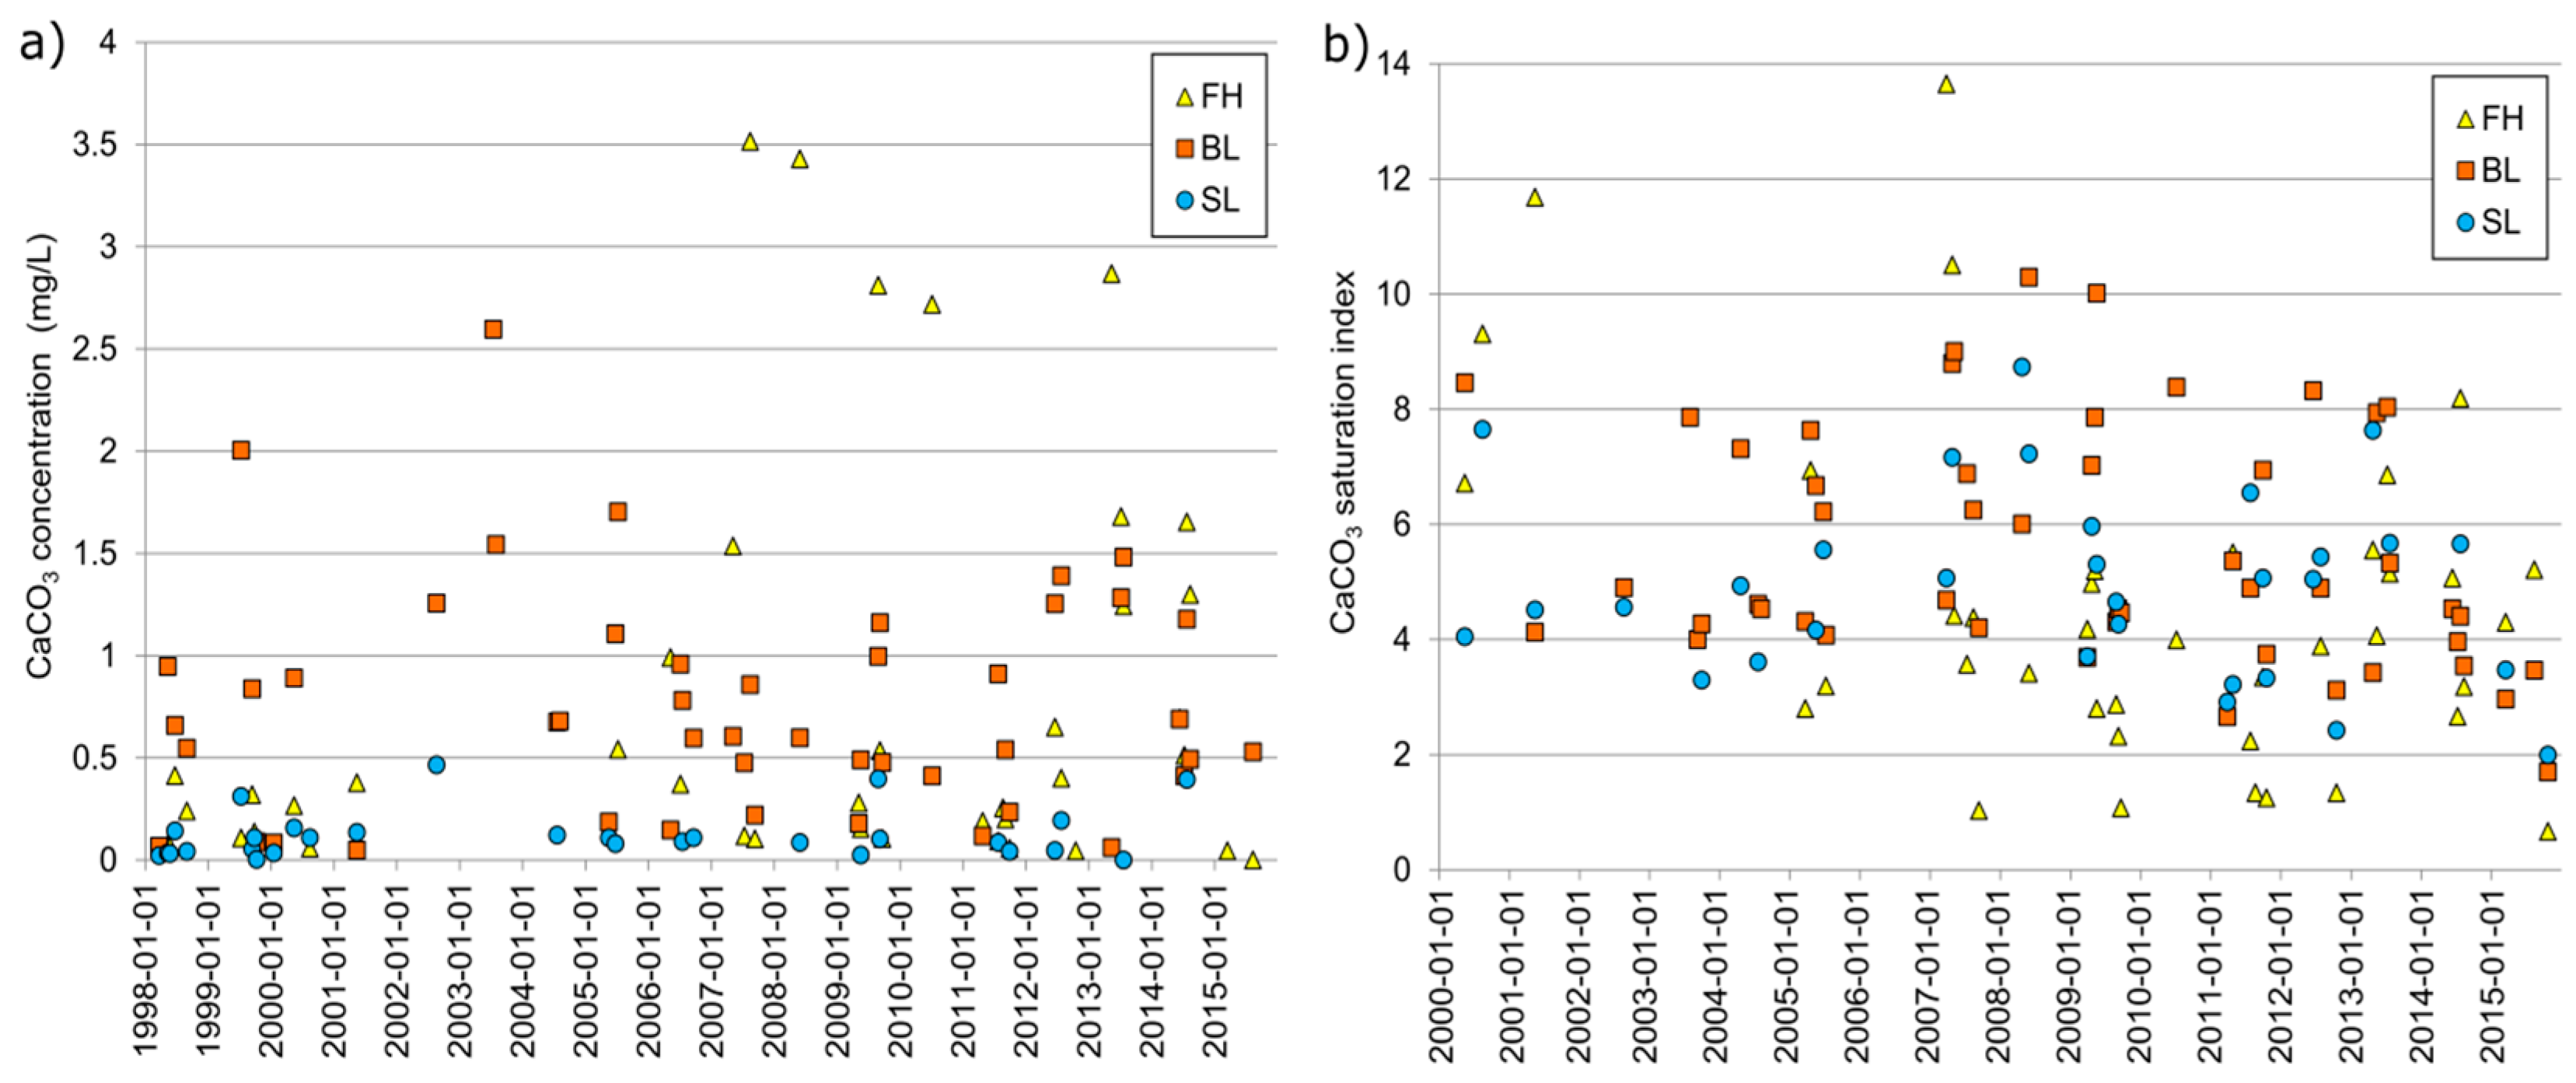
Calcite precipitation is known to be a spatial and temporal very variable process and it is linked to different factors, e.g., trophic state and occurrences of bacteria of the lakes. This causes changing calcite precipitation patterns in time and different calcite precipitation patterns even for adjacent lakes, e.g., in the Feldberg Lake District: even though SL was known for calcite precipitation before 1998, there were no calcite precipitation detected with in situ measurements after the lake restoration in 1996/1997. Whereas the in situ measurements between 1998 and 2015 show CaCO
3 concentrations <0.5 mg/L, the Landsat classification shows a clear calcite precipitation event on 13 August 2014 and misses further five visually classified calcite precipitation events. At FH, no calcite precipitation occurred before 2003. This fits to the in situ measurements: The long-term record (1985–2015) of mean seasonal (May–September) CaCO
3 concentration of FH indicates low values of <0.5 mg/L until 2005. Afterwards a substantial increase was observed. However, the reasons are not entirely clear. Koschel et al. (1983) have concluded that calcite precipitation might be most intensive in mesotrophic lakes [
60]. By 2005 the seasonal (May–September) total phosphorus concentration of the mixed layer had dropped to 0.046 mg/L which is still in the eutrophic range but relatively close to mesotrophic conditions [
61]. In 2011, when a second restoration measure has been carried out, calcite precipitation did not occur, while in 2012 a few calcite precipitation events and in 2013 several calcite precipitation events have been observed at FH. In 2014, the duration and frequency of calcite precipitation events is reduced again and in 2015 only one event has been observed. These variations can be explained by the complex process with competing inhibiting factors and supporting factors for calcite precipitation. During eutrophication phases, excess phosphorus has an inhibiting effect on calcite precipitation [
12] so that artificial removal of phosphorous through poly-aluminum chloride might increase calcite precipitation. A follow-up monitoring will show if the restoration measures at FH have the same result (absence of calcite precipitation) as the restoration measures at SL.
The three lakes with the most calcite precipitation events are FH, BL, and TS. Their average durations are 24, 57, and 31 days (overall average: 37 day), but all three lakes show start–stop–start–stop patterns. However, the comparison of those patterns with the visual classifications reveals that most of those short-term variations are caused by misclassifications (e.g., FN results at FH between 4 July 2014 and 13 August 2014). Visually validated start–stop–start patterns, e.g., at FH between 24 July 2013 and 26 August 2013, substantiates the results of previous studies that showed calcite precipitation with lower calcite concentrations before and after the main event and non-steady, periodic variations [
5].
Whereas the validation in
Section 5.2 discusses the quality of the Landsat-derived calcite precipitation monitoring, it is still unknown, how many calcite precipitation events are missed in times without suitable satellite images or in situ measurements. Therefore, we included sediment analyses at TS to discuss the detection rate of calcite precipitation via remote sensing: The Landsat-derived monitoring at lakes in the Klocksin Lake Chain shows calcite precipitation events at TS at 11 of 18 years, whereas sediment analyses show calcite layers every year. A running monitoring study at TS using sediment traps shows high calcite deposition between May and September. The years 2001, 2007, 2010, and 2012 have only one or two Landsat acquisitions during May and September, thus calcite precipitation events were most likely missed. The years 1998, 2004, and 2011 have four, five, and nine acquisitions. However, the acquisitions are not equally distributed with maximum gaps of 55 days (2004 and 2011) to 89 days (1998) days between the acquisitions and thus, still calcite events could have happened in times without Landsat acquisitions. Especially, as the sediment layers in all of the missed years are extraordinary thin [
33], which indicates either short-term or weak calcite precipitation events.
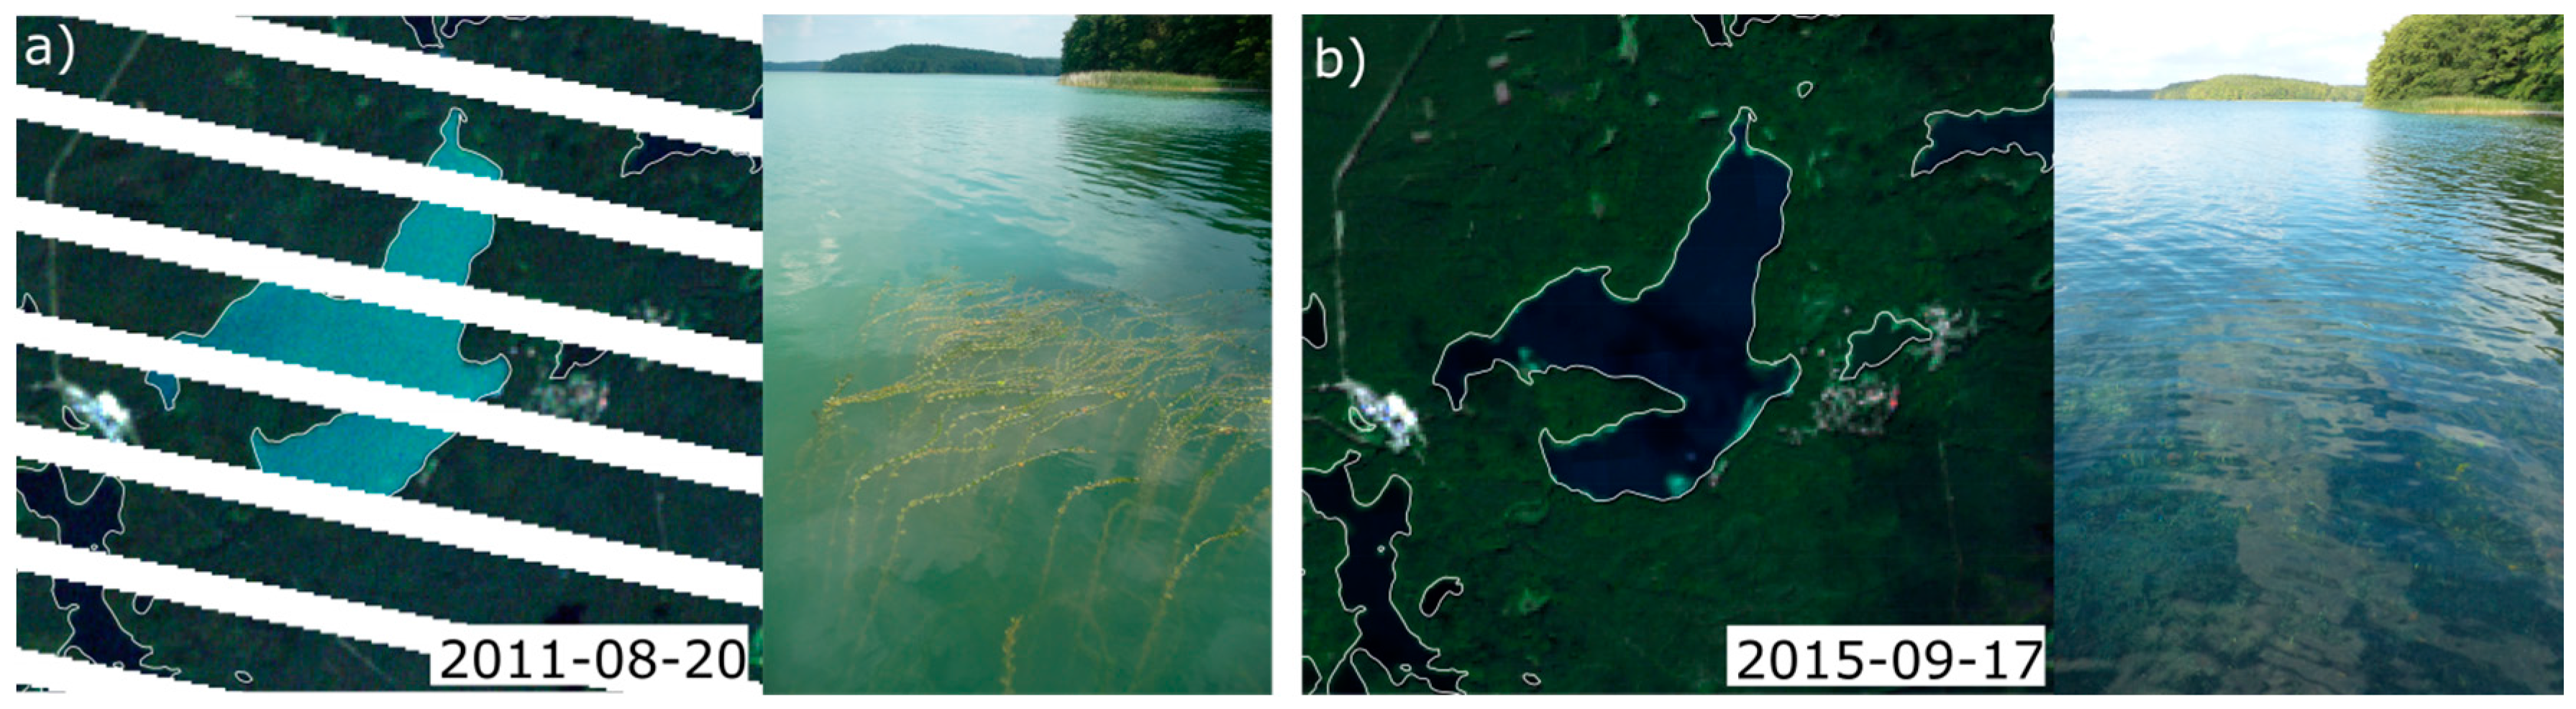
At region Rheinsberg Lake Region, eight of the 17 lakes show at least one calcite precipitation event, but the frequency of events is probably higher than our analyses shows, because the validation based on a visual classification reveals approximately as many calcite precipitation events as FN classifications. On the other hand, five lakes are eutrophic, thus, algal bloom may also occur, either contemporary to high CaCO
3 concentrations or independent of calcite precipitation. In this region the calcite precipitation on 20 August 2011 at the oligotrophic Stechlinsee has to be highlighted. This calcite precipitation is caused by storm “Otto” in July 2011, which caused the mixing of cyanobacteria populations from 7 m to 8 m depth into the surface water [
28]. The resulting increase of the photosynthesis activity caused an increase of the CaCO
3 saturation index and lead to intensive calcite precipitation, still clearly visible in the Landsat image on 20 August 2011.


 ,
, 