Article

Shedding Light on Increasing Trends of Phosphorus Concentration in Upper Austrian Rivers

1
Institute for Water Quality, Resource and Waste Management, TU Wien, Vienna 1040, Austria
2
wpa Beratende Ingenieure GmbH, Vienna 1090, Austria
3
Umweltbundesamt GmbH, Vienna1090, Austria
*
Author to whom correspondence should be addressed.
Water 2016, 8(9), 404; https://doi.org/10.3390/w8090404
Submission received: 27 July 2016 / Revised: 6 September 2016 / Accepted: 12 September 2016 / Published: 16 September 2016

Abstract

:
Phosphorus (P) impairment of surface waters still represents a major concern worldwide, despite decades of awareness and implementation of remedial measures. In view of this situation, it is all the more necessary to provide decision makers with reliable modelling tools, which can correctly estimate the effect of alternative management strategies. This work tests the performance of the semi-empirical model MONERIS (Modelling of Nutrient Emissions in River Systems) in depicting and quantifying trends of instream total phosphorus (TP) concentration in three catchments located in Upper Austria, a region affected by high agricultural nutrients emissions. The model correctly depicts both the existence of increasing trends (4–µ g TP L 1 year 1 ) and the lack thereof (<0.1 µ g TP L 1 year 1 ) in different sub-catchments within the period 2001–2014, although it systematically underestimates the trends magnitude. Furthermore, MONERIS together with an optimized data management system has allowed identifying the probable cause of such trends. The results suggest that, despite considerable improvements achieved through enhanced P removal from wastewater and through the implementation of an agri-environmental programme, changes in land use and in cultivated crop types have led to an offsetting increase of erosion-driven emissions. This methodology offers high potential to predict the effect of different management scenarios, but further model fine-tuning concerning erosion and retention processes is required to improve the model accuracy.

1. Introduction

After decades of awareness of the crucial role played by phosphorus (P) emissions in triggering eutrophication, and despite the implementation of diverse remedial strategies, P impairment of surface waters still represents a worldwide concern [1,2,3,4]. Europe has made substantial progress, but a considerable number of water bodies still fail to meet the levels of P concentrations required to achieve the good ecological status defined by the Water Framework Directive (WFD) [5,6,7]. This can be primarily attributed to legacy P inputs, to inadequate soil conservation and nutrients management strategies in agriculture and partially to climate fluctuations [8]. In this context, reliable modelling tools are necessary to identify and quantify the sources and pathways of phosphorus emissions into surface waters and to support policy makers not only in the design of management strategies but also in the assessment of their performance. The MONERIS model (Modelling of Nutrient Emissions in River Systems) was developed to provide such a policy-support tool for river basin management at large scale [9,10]. Since its conception in 1999, it has undergone several enhancements, and it has been applied to numerous river systems especially in Europe, but also worldwide [11]. The reliability and the accuracy of any model results need to be proved through appropriate validation. In the case of MONERIS, this is usually restricted to the comparison of modelled and observed river loads, given the complexity of the processes involved and the lack of monitoring data regarding specific emission pathways. According to the analysis of [12], loads modelled with MONERIS in different river systems throughout the world show a mean deviation from observed loads ranging from ±15% to ±35%. Such a deviation range equals the error expected in observed loads and is thus an indication of the relatively high accuracy of this model. Nevertheless, MONERIS is a semi-empirical model, which heavily relies on data from several different sources [11], and thus the reliability of its results is highly dependent on data availability and data quality. This is particularly relevant for the generation of scenarios, for which inherently no validation is possible. In light of MONERIS’s role as a policy-support tool, it is imperative that its performance in predicting the effect of distinct management strategies and the reliability of its scenarios are thoroughly investigated at different scales, in different river systems and under different contexts of data availability.
Although future scenarios cannot be investigated, these open questions can be nevertheless addressed by analysing MONERIS performance in depicting past trends. To the best of the authors’ knowledge, until now, such research has been only undertaken by [13,14] in their analysis of the temporal development of nutrient emissions and river loads in the Danube river basin from the 1950s to 2000. Such investigations at a higher geographical resolution, namely at the catchment or sub-catchment scales, are however still missing, although these scales are of outstanding importance for the implementation of water protection measures. The present work aims to shed light on this issue, by addressing in particular the following research questions: (a) how well does MONERIS perform in depicting temporal changes of in-stream P concentrations? (b) can specific causes of temporal changes of in-stream P concentrations be easily identified (e.g., land use changes, implementation of environmental measures, etc.)? and (c) to which extent do MONERIS capabilities in this respect rely on data availability? Furthermore, this contribution also puts forward a novel approach to data management to be combined with MONERIS. For this study, a new management system for the input of data into MONERIS is developed, which aims to greatly enhance the facility, the flexibility, and the transparency in the generation of scenarios.
The case study area selected for this study is the Austrian state Upper Austria. This choice was based on the severe problems of phosphorus contamination in surface water faced by the region, on the existing extensive knowledge on nutrients emissions and on nutrient management, and on the fairly large availability of water quality and hydrological data.

2. Materials and Methods
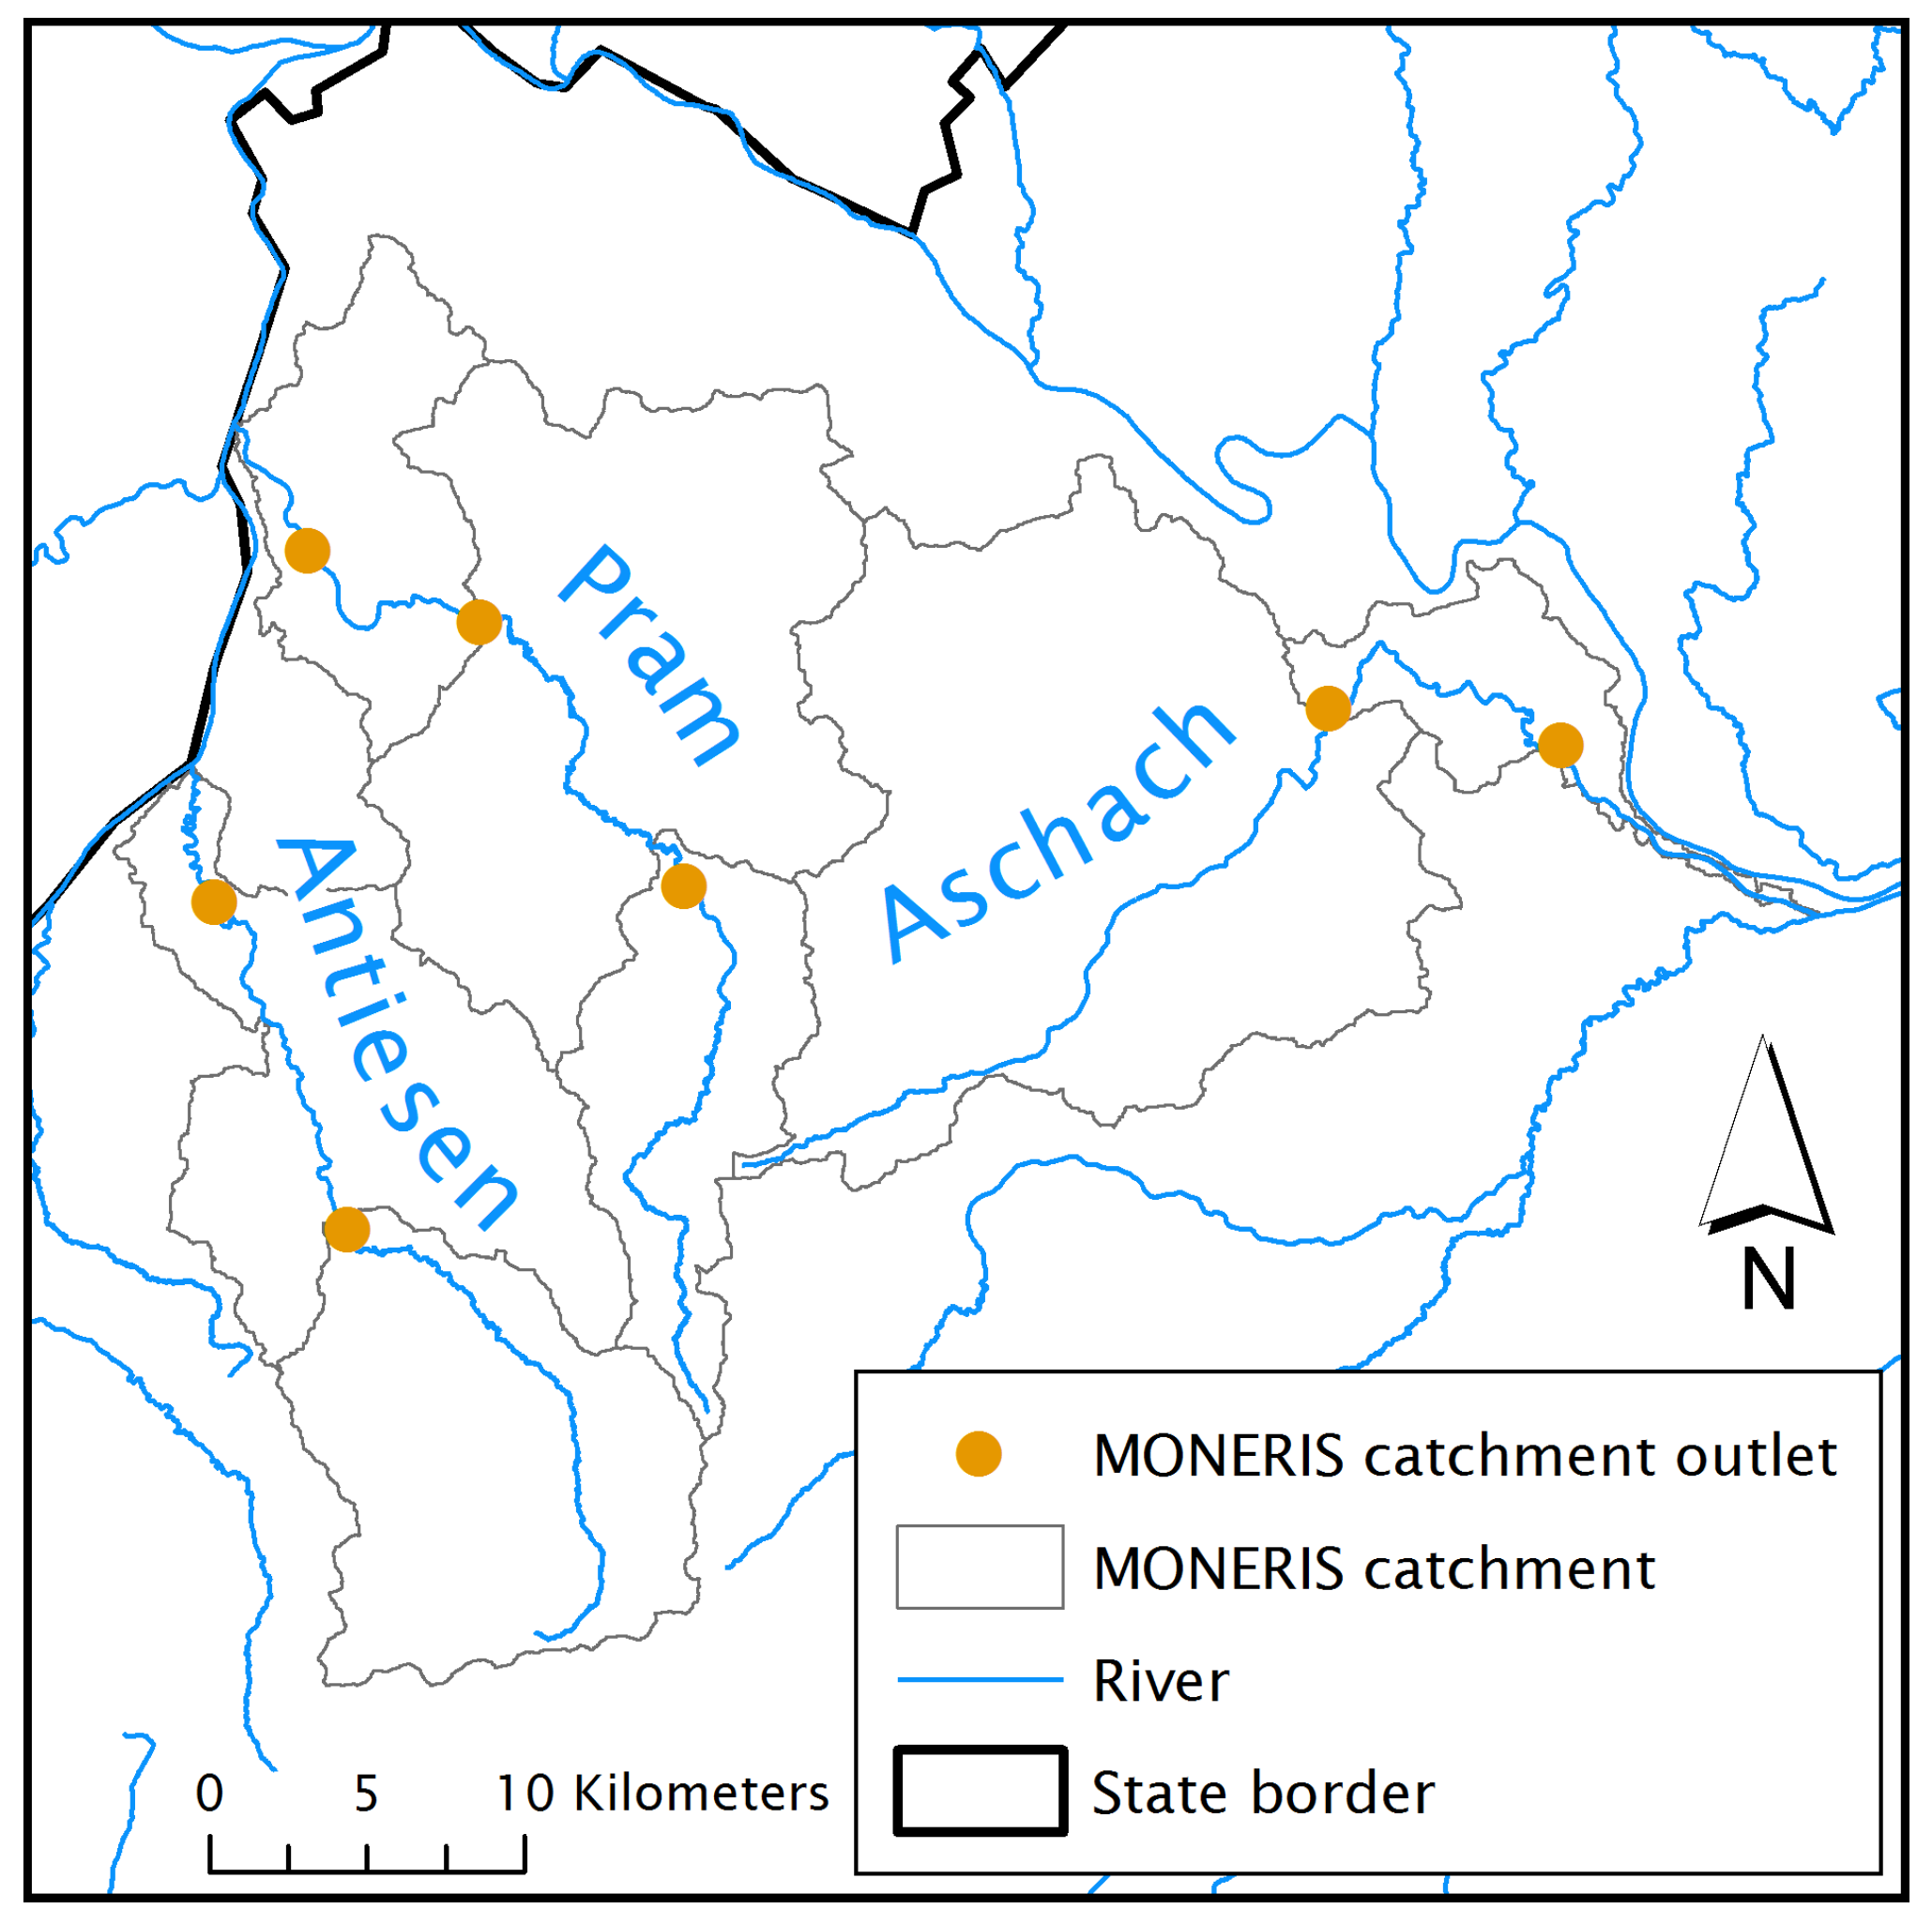
2.1. Case Study

The study area is Upper Austria, an Austrian state located in the northern part of the country. It constitutes the fourth-largest Austrian state by land area (11,982 km 2 ) and the third-largest by population (approximately 1,440,000 inhabitants). The geology of Upper Austria can be divided into four areas: the Bohemian Massif with crystalline rocks north of the Danube, the Molasse basin in the middle and the Flysch zone as well as the Northern Limestone Alps in the south. Apart from a few flat areas along the Danube and the Traun river and the mountainous southern region, its terrain is predominantly hilly. While the Bohemian Massif, the Flysch zone and the Northern Limestone Alps are dominated by forests and grassland, and the Molasse basin is dominated by arable land. Mean annual precipitation ranges from approximately 800 to 1100 mm in the middle and northern part, whereas it usually reaches more than 1500 mm in the mountainous southern part.
Upper Austria was selected for two reasons, which are closely interrelated. In the first place, one-third of its surface waters is exposed to heavy phosphorus contamination, with the consequent high risk of failure of the good ecological status defined by the WFD [15]. This leads to the second reason, namely to the fact that given this critical situation extensive research has been undertaken over the past years in relation to nutrients emissions. Ref. [15] performed an extensive data collection and applied MONERIS to the whole region at the catchment scale, for the period 2001–2006. Subsequently, based on this work, the effectiveness of different measures and management scenarios in reducing nutrients emissions to surface waters was assessed by [16,17,18].

2.2. Trend Analysis

Trends in surface waters were analysed by means of the Mann–Kendall method [19,20], a non-parametric statistical test that is extensively applied for the analysis of time series in the field of water quality because it is robust to missing data and outliers, and it requires no assumption of normality [21]. It delivers the direction and the significance of the temporal change for monotonic trends. To express statistical significance, the following standard levels associated to p values were adopted: significant (p < 0.05), very significant (p < 0.01), and highly significant (p < 0.001). The magnitude of the change was estimated through the non-parametric Sen’slope estimator (also termed Theil–Sen estimator) [22,23], which delivers the change per year by calculating the median of the slopes of all pairs of observations.
Owing to the relationship typically observed between total phosphorus (TP) concentration and flow in streams, namely a rising TP concentration at higher flow rates due to the increased transport of particulate-bound P [24], it was necessary to perform a flow-adjustment prior to the trend analysis in order to remove the variability caused by such relationship. The flow-adjustment was conducted through a stage-wise procedure: first, by modelling the regression between concentration and discharge, then, by applying the trend analysis to the residuals of such relationship, i.e., to the variation which cannot be explained by the discharge [21,25]. This procedure was performed twice, using alternately exponential and polynomial regression functions. The trends were then considered significant only if the Mann–Kendall test delivered significant results after both flow-adjustments.
In order to deeper explore the drivers and reasons for shifts in TP concentrations, instream trends of particulate phosphorus (PP) and soluble reactive phosphorus (SRP) concentrations were also analysed. Whereas, for PP, the same procedure used for TP was followed, for SRP, the Seasonal Kendall test was applied without prior flow adjustment because, in general as well as in the considered cases, SRP concentrations are not dependent on flow [25,26].
The trend analysis was applied to two time periods: 1990–2000 and 2001–2014. The latter was selected for the comparison with the results of MONERIS, since a comprehensive dataset enabled a detailed emissions modelling for this period.
Given the inherent uncertainty associated with the concentration-flow regressions, an additional analysis was performed to test the existence of trends in the flows, for which the Mann–Kendall method was applied.
Data regarding TP, SRP and PP concentrations as well as discharge was obtained from the national H2O [27] and the regional AIM (Amtliches Immissionsmessnetz - Official Immission Control Network) [28] networks of monitoring stations. These networks were established at the beginning of the 1990s, although they also include some stations active since the middle 1980s. They provide, therefore, long-term datasets, which primarily rely on bi-weekly measurements. Federal legislation regulates the standard analytical procedures to be followed for all parameters, which ensures consistency between both datasets (BGBL Nr. 338/1991 replaced by BGBl. II Nr. 479/2006).
All analyses were performed in the free software R [29].

2.3. Novel Approach to Input Data Management

The data that is used to model soil erosion is obtained from the InVeKos database [30]. This database, established by Austrian Authorities to control the agricultural expenses of the EU, is a very detailed and comprehensive compilation of data regarding agricultural area, cultivated crops and applied environmental measures such as cover crops for each farm and year. The soil erosion model is based on the Universal Soil Loss Equation (USLE) [31]. This equation allows the prediction of the long-term average annual soil loss. The USLE is composed of six parameters, including the rainfall erosivity factor (R), the soil erodibility factor (K), the topographic factors (L,S) and the cropping management factors (C,P). The cropping management factors are of particular importance for the calculation of the impact of soil conservation practices. InVeKos data were re-structured and their handling was simplified, through their aggregation based on catchment area, slope class and crop type. All the necessary parameters needed for the USLE were averaged based on the agricultural area of each field, so that soil erosion could be calculated and summarized by the catchment area. Furthermore, in this way, the impact of the environmental measures sponsored by the EU on soil erosion can be shown and scenarios of fictional measures can also be calculated. The InVeKos data are joined and aggregated in Microsoft® Access (2010), but the actual calculation of soil erosion is done in Microsoft® Excel (2010). This approach allows centralized management of the highly aggregated data. As a result, the processing of the input data for the MONERIS model is easier, faster, more transparent and more flexible generations of scenarios can be implemented with it.

2.4. MONERIS Model

Phosphorus emissions were estimated through the MONERIS model, whose structure and algorithms are described in detail by [11]. In particular, an enhanced version of MONERIS was applied, which was developed by [32] to adjust the model to the specifics of the Austrian territory, primarily concerning distinct background emissions owing to the high proportion of alpine areas. As shown by [32,33], following this enhancement, it was possible to achieve in Austria the same accuracy level that the original model provided for Germany, the country for which it was first developed. Emissions were estimated for 2002, 2007 and 2013. These specific years were selected for two main reasons. In the first place, they offer good timing correspondence with the implementation and duration of the agri-environmental programme, namely with the ÖPUL 2000 edition spanning the period 2001–2006 [34] and the ÖPUL 2007 edition covering the time 2007–2014 [35]. The second important criterion was the possibility of compiling a fully comprehensive database. Modelling was performed with average climatic conditions (precipitation, runoff) over the whole period 2001–2013, given that the focus lies on changes induced by management and not on hydrological variations. This ensures consistency between modelling and trend analysis, which is performed in combination with flow adjustment, thus allowing the validation of modelled emissions through comparison with observed trends.

2.5. Uncertainty and Sensitivity Analysis

The uncertainty affecting the trend analysis of observed instream TP concentrations was quantified as standard error of the trend slope calculated through the Theil–Sen estimator in the free software R [29]. Furthermore, in order to test the potential sensitivity of the trend results to the selected time period, the trend analysis of TP concentrations was applied for the period 1998–2014.
With respect to the uncertainty affecting MONERIS results, the model was additionally run for the years 2002 and 2013 using four scenarios. These scenarios were designed with the dual purpose of taking into account different uncertainty sources, which affect the quantification of changes of emissions and their impact on the modelled trends of concentrations, and of ensuring the plausibility of resulting instream TP concentrations. Considering the dominant role played by agricultural erosion in the catchments under study, the focus of uncertainty calculations was set primarily on this emission pathway. In the first two scenarios, TP emissions through agricultural erosion were alternatively raised and reduced by 35%. In order to ensure plausible results and to investigate the sensitivity of the results to the relative influence of the other relevant pathways in the catchments, emissions through groundwater were diminished and increased by 35%, whereas point emissions from wastewater treatment plants (WWTPs) were reduced and raised by 10%, respectively. The reason for the lower error applied to point sources is the high accuracy and reliability of the data for these emissions. Thanks to these scenarios, it was possible to calculate a plausible and consistent variation range of the modelled TP concentrations in 2002 and 2013 and therefore of the concentration trends. The other two scenarios were designed with the more specific goal of investigating whether the impact of the land use change on the TP emissions and on the instream TP concentrations would still be visible after considering the uncertainty in the physical processes involved. To do this, the C factors used in the USLE equation were modified in the following way: the C factors higher than 0.25 were raised by 15% and the C factors lower than 0.25 were decreased by 15% in one scenario, whereas in the other scenario, the opposite variation was introduced. In this way, the first scenario would enhance the influence of the land use change on the emissions and on the trends of concentrations, whereas the second would attenuate it. Both the C factors used in the USLE equation and their variation ranges derive from official studies referring to this specific region and to similar areas located in central Europe [31,36]. No uncertainty was considered for the input data concerning the land use change, given the high accuracy and level of detail characterizing the InVeKos database.

3. Results

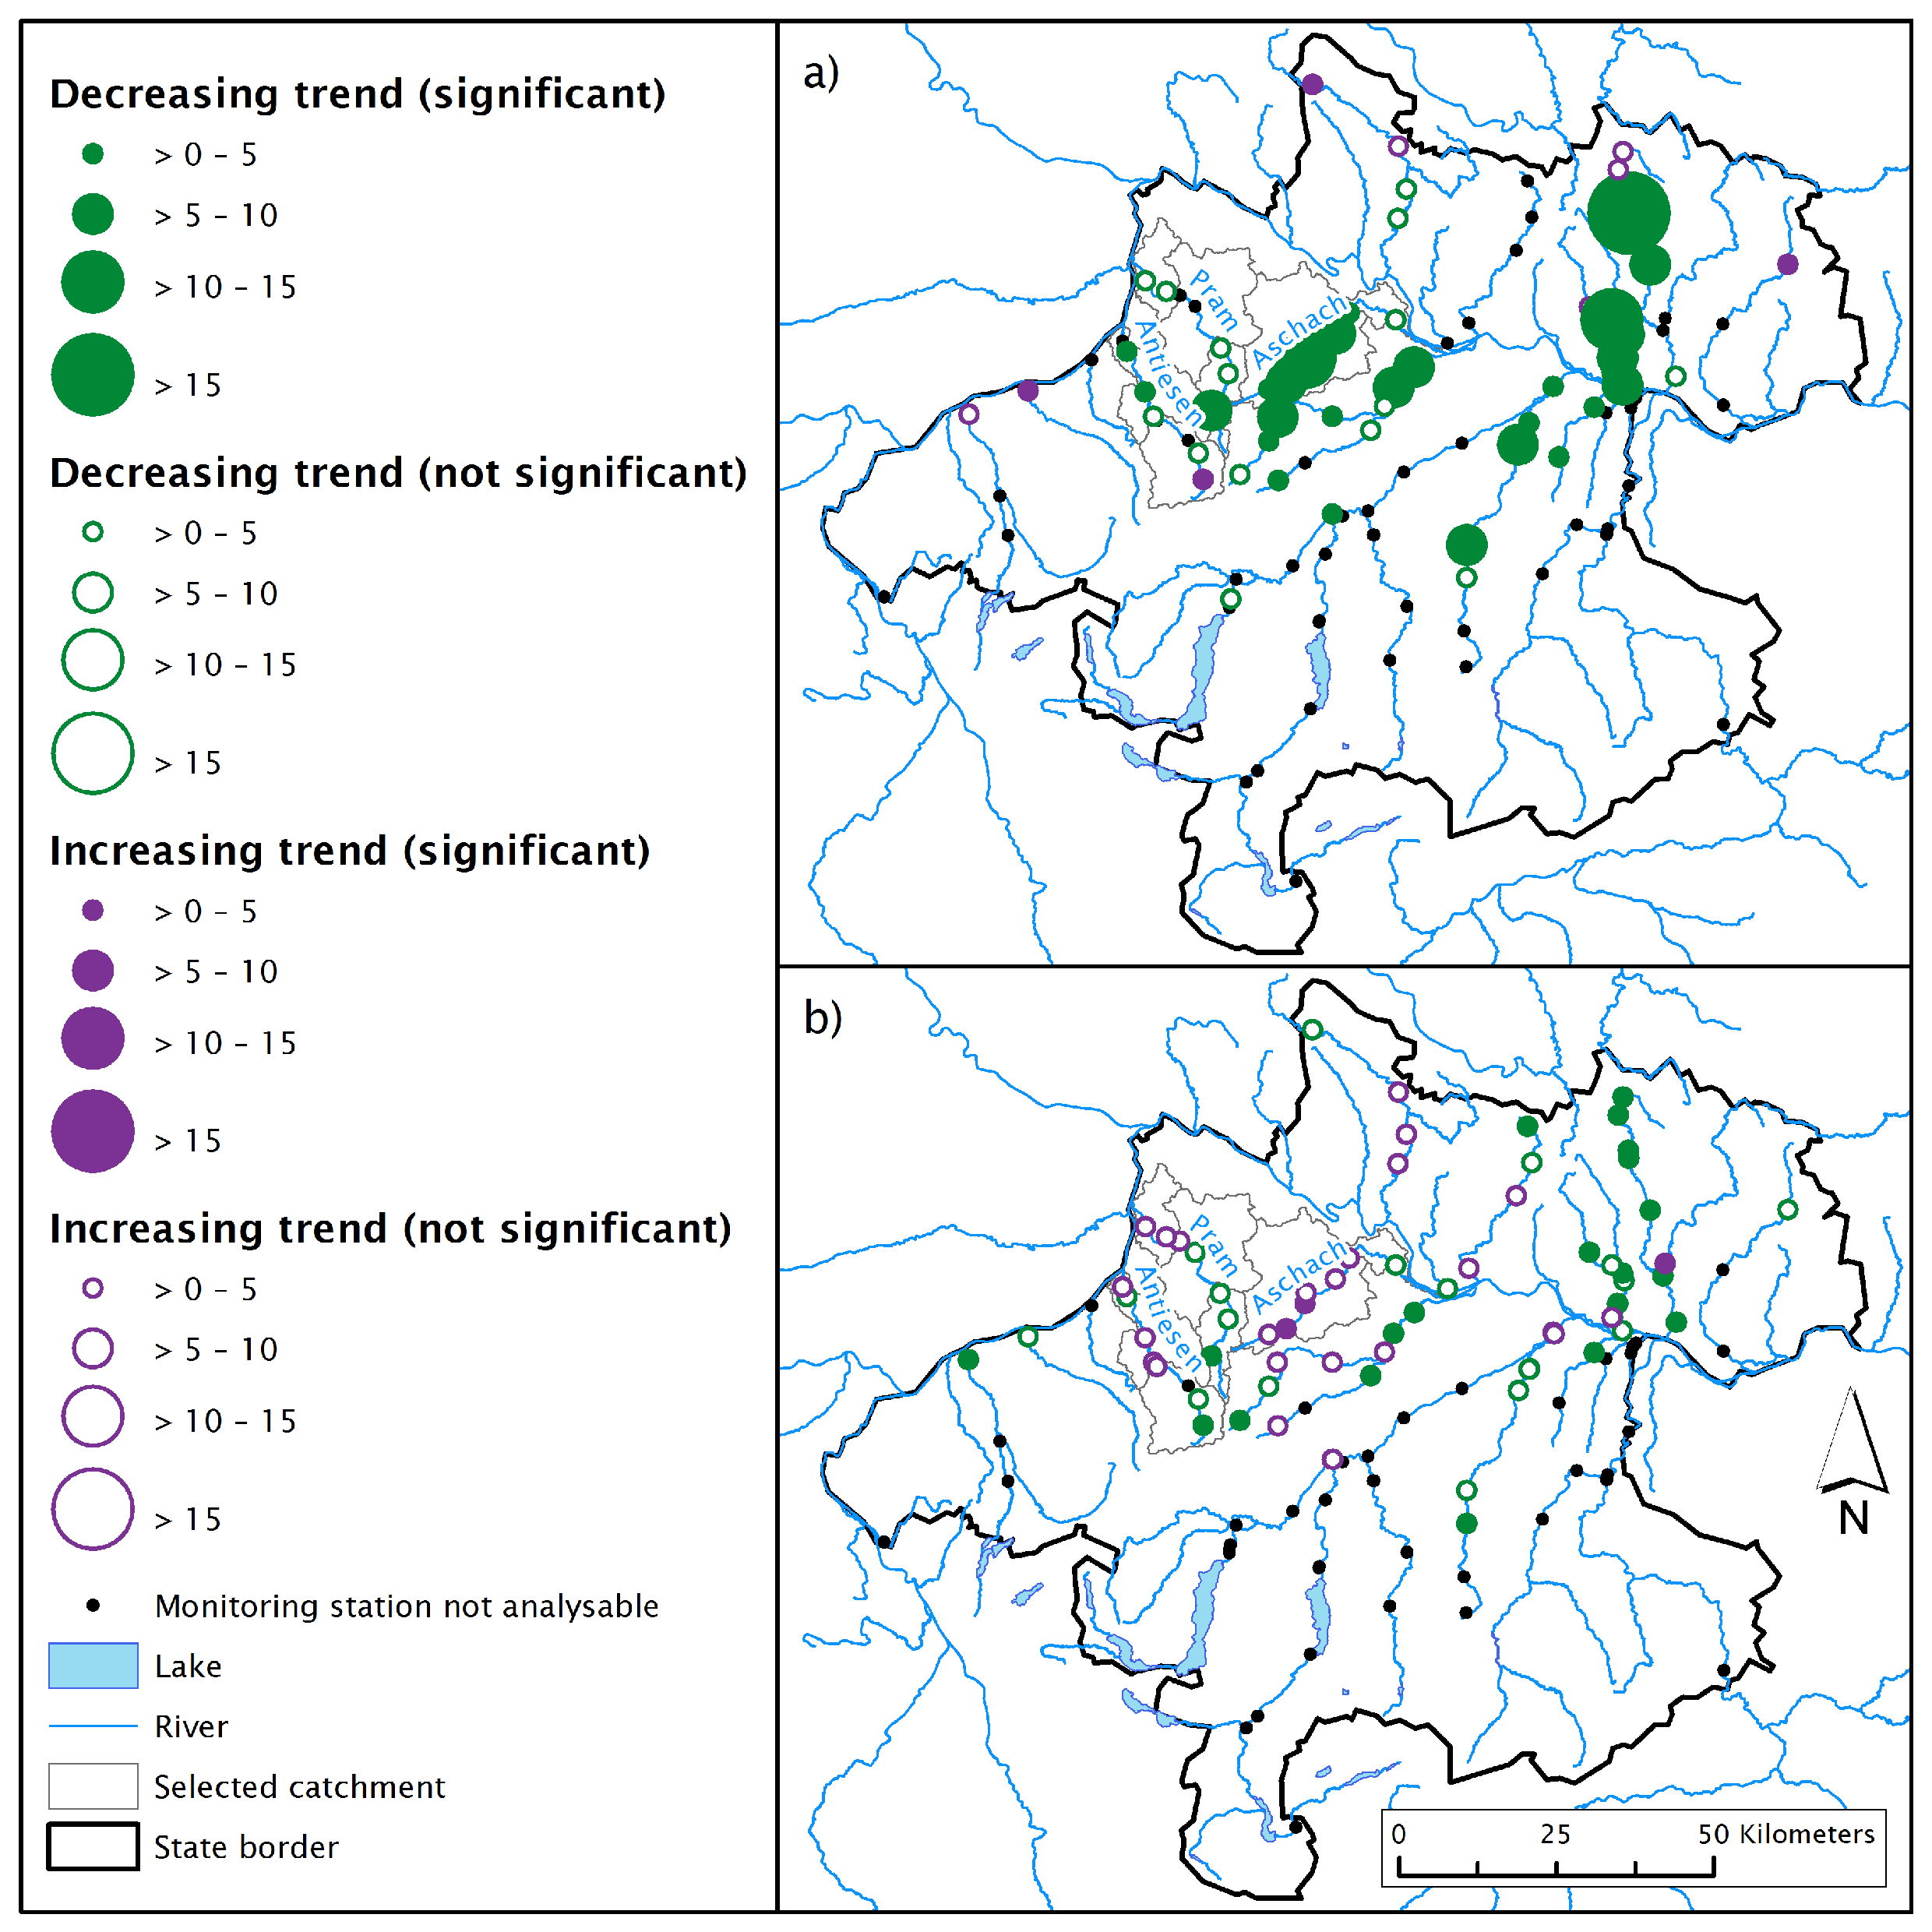
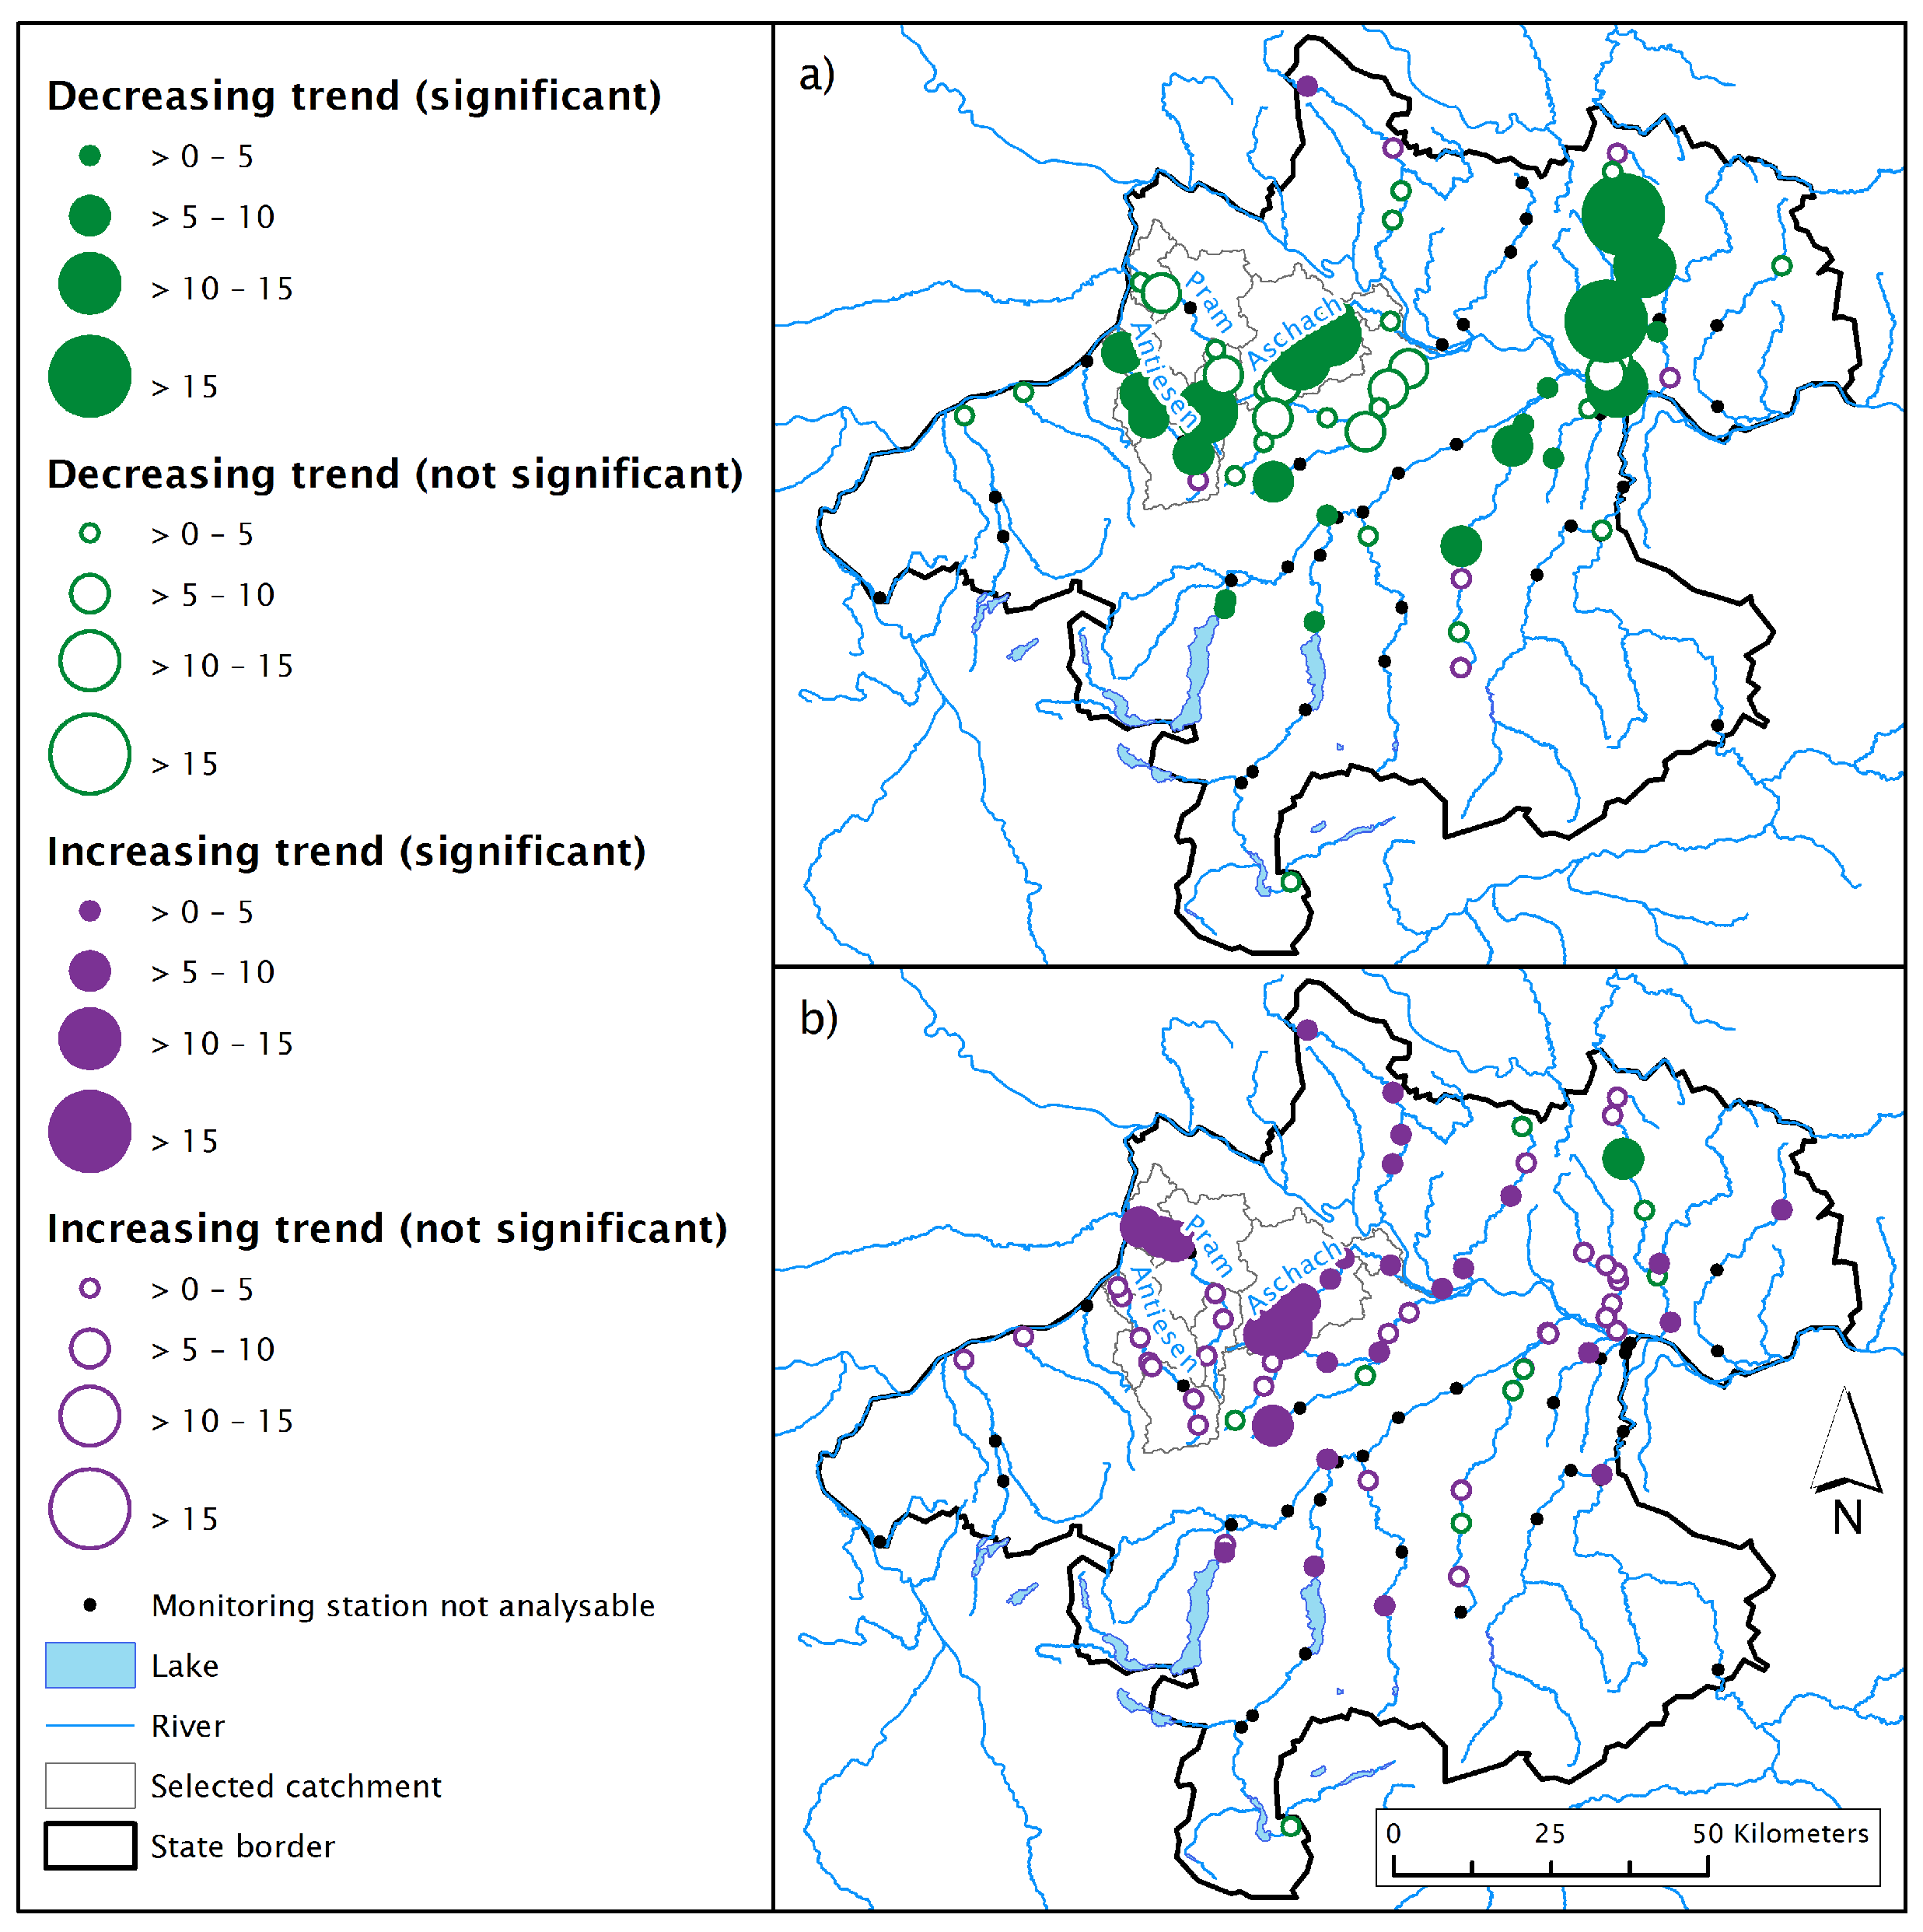
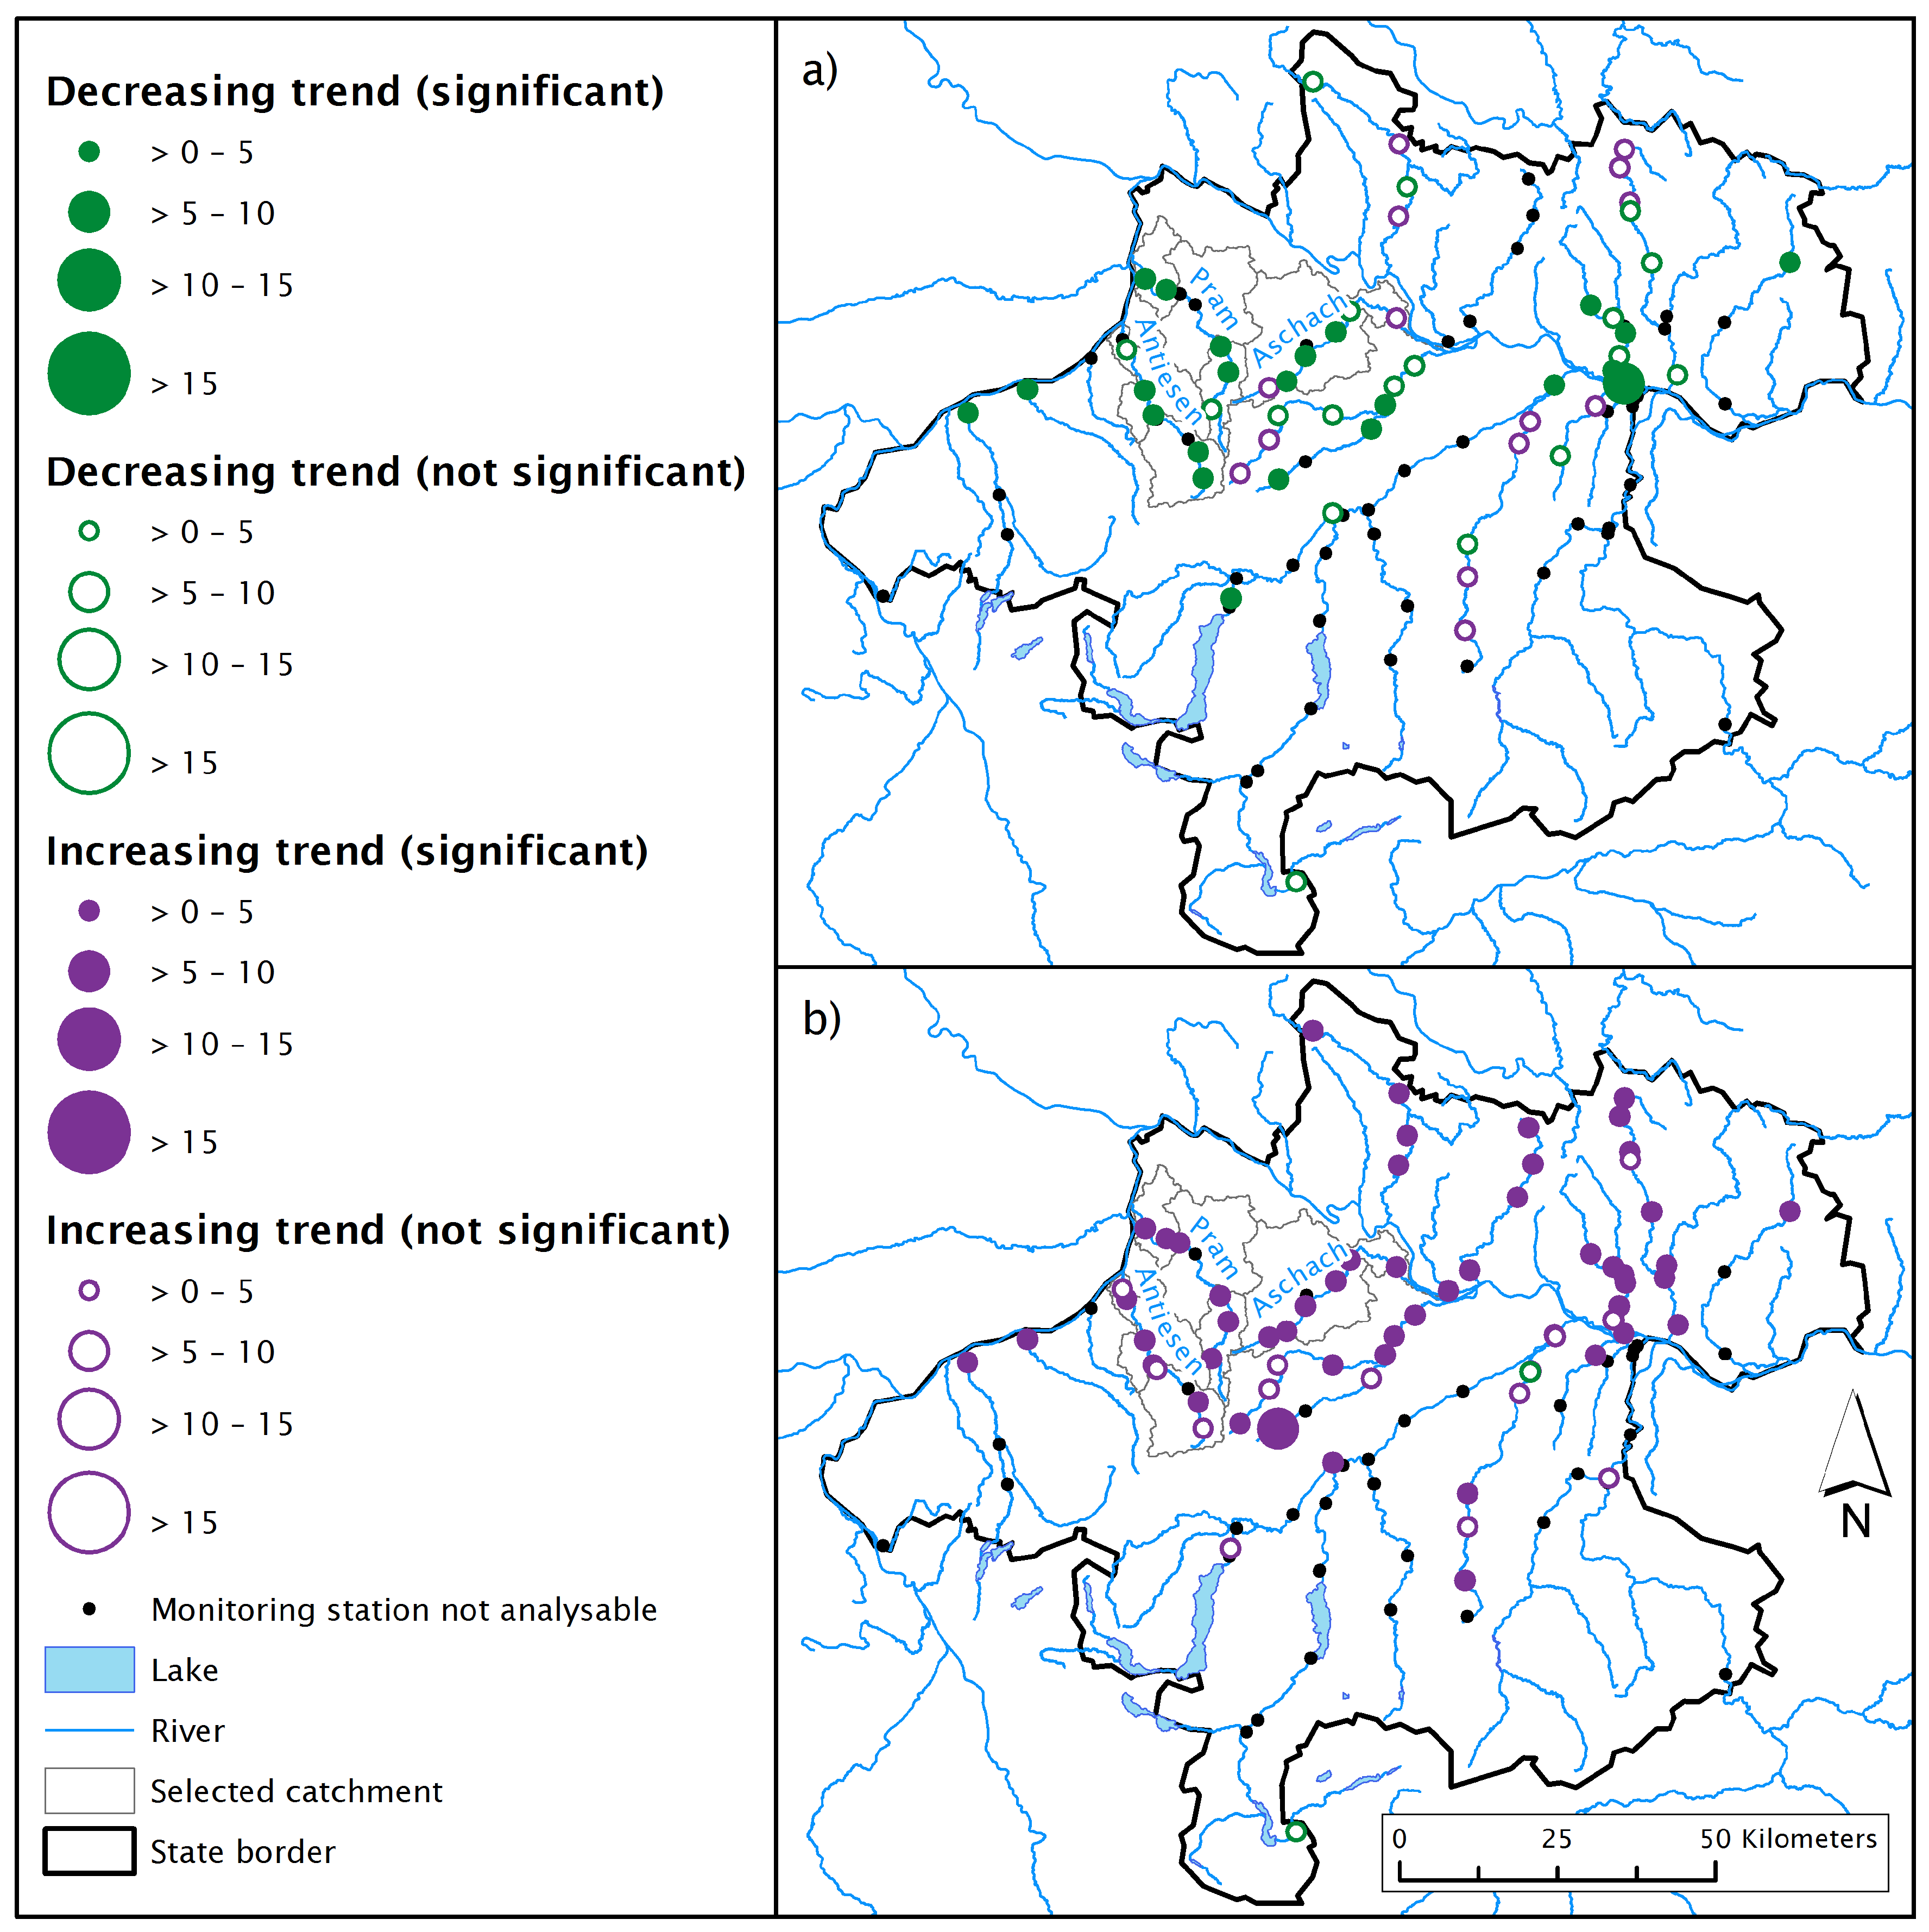
3.1. Trends of Phosphorus Concentrations in Surface Waters

The results of the trend analysis of TP concentrations in the surface waters for the whole Upper Austria are shown in Figure 1. What stands out in this Figure is the inversion of the trends from the period 1990–2000 to the period 2001–2014. In the first period, out of the 63 analysable stations, 24 significant trends were found, 23 of which were decreasing (Figure 1a). Such reduction is likely due to the remarkable improvements achieved during this time in the efficiency of P removal from wastewater. On average, Austrian municipal WWTPs gradually enhanced their P removal rate from less than 50% at the end of the 1980s to 82% in 2001 [37,38]. This explanation is supported by the similar results obtained for SRP concentrations (32 out of 63 stations show significant trends, out of which 28 were declining; Figure 2a), given that SRP, as the typically prevalent phosphorus species in WWTP effluents, is a good indicator for point emissions [39]. However, the detailed estimation of emissions with MONERIS and the quantification of the impact of the changes in point emissions required to test this hypothesis could not be carried out, owing to the low data availability regarding land use for this time period.
In the period 2001–2014, the situation has reversed, with 31 trends being found significant, 30 of which were increasing (Figure 1b). Remarkable consistence and large trends, with increases in the range of 5–10 µ g TP L 1 year 1 , were detected in the catchments of the river Pram and the river Aschach. At the beginning of this study, the opposite results were expected, first because during this time WWTPs further enhanced their average P removal rates up to 90% [40], and second because an agri-environmental programme was launched in the year 2000, with the specific goal of reducing the environmental impact of agriculture [34,35]. The reason for this unexpected result, as thoroughly described in the following sections, is to be found in the changes concerning land use and cultivated crops, whose impact likely offset the improvements achieved through environmental measures.

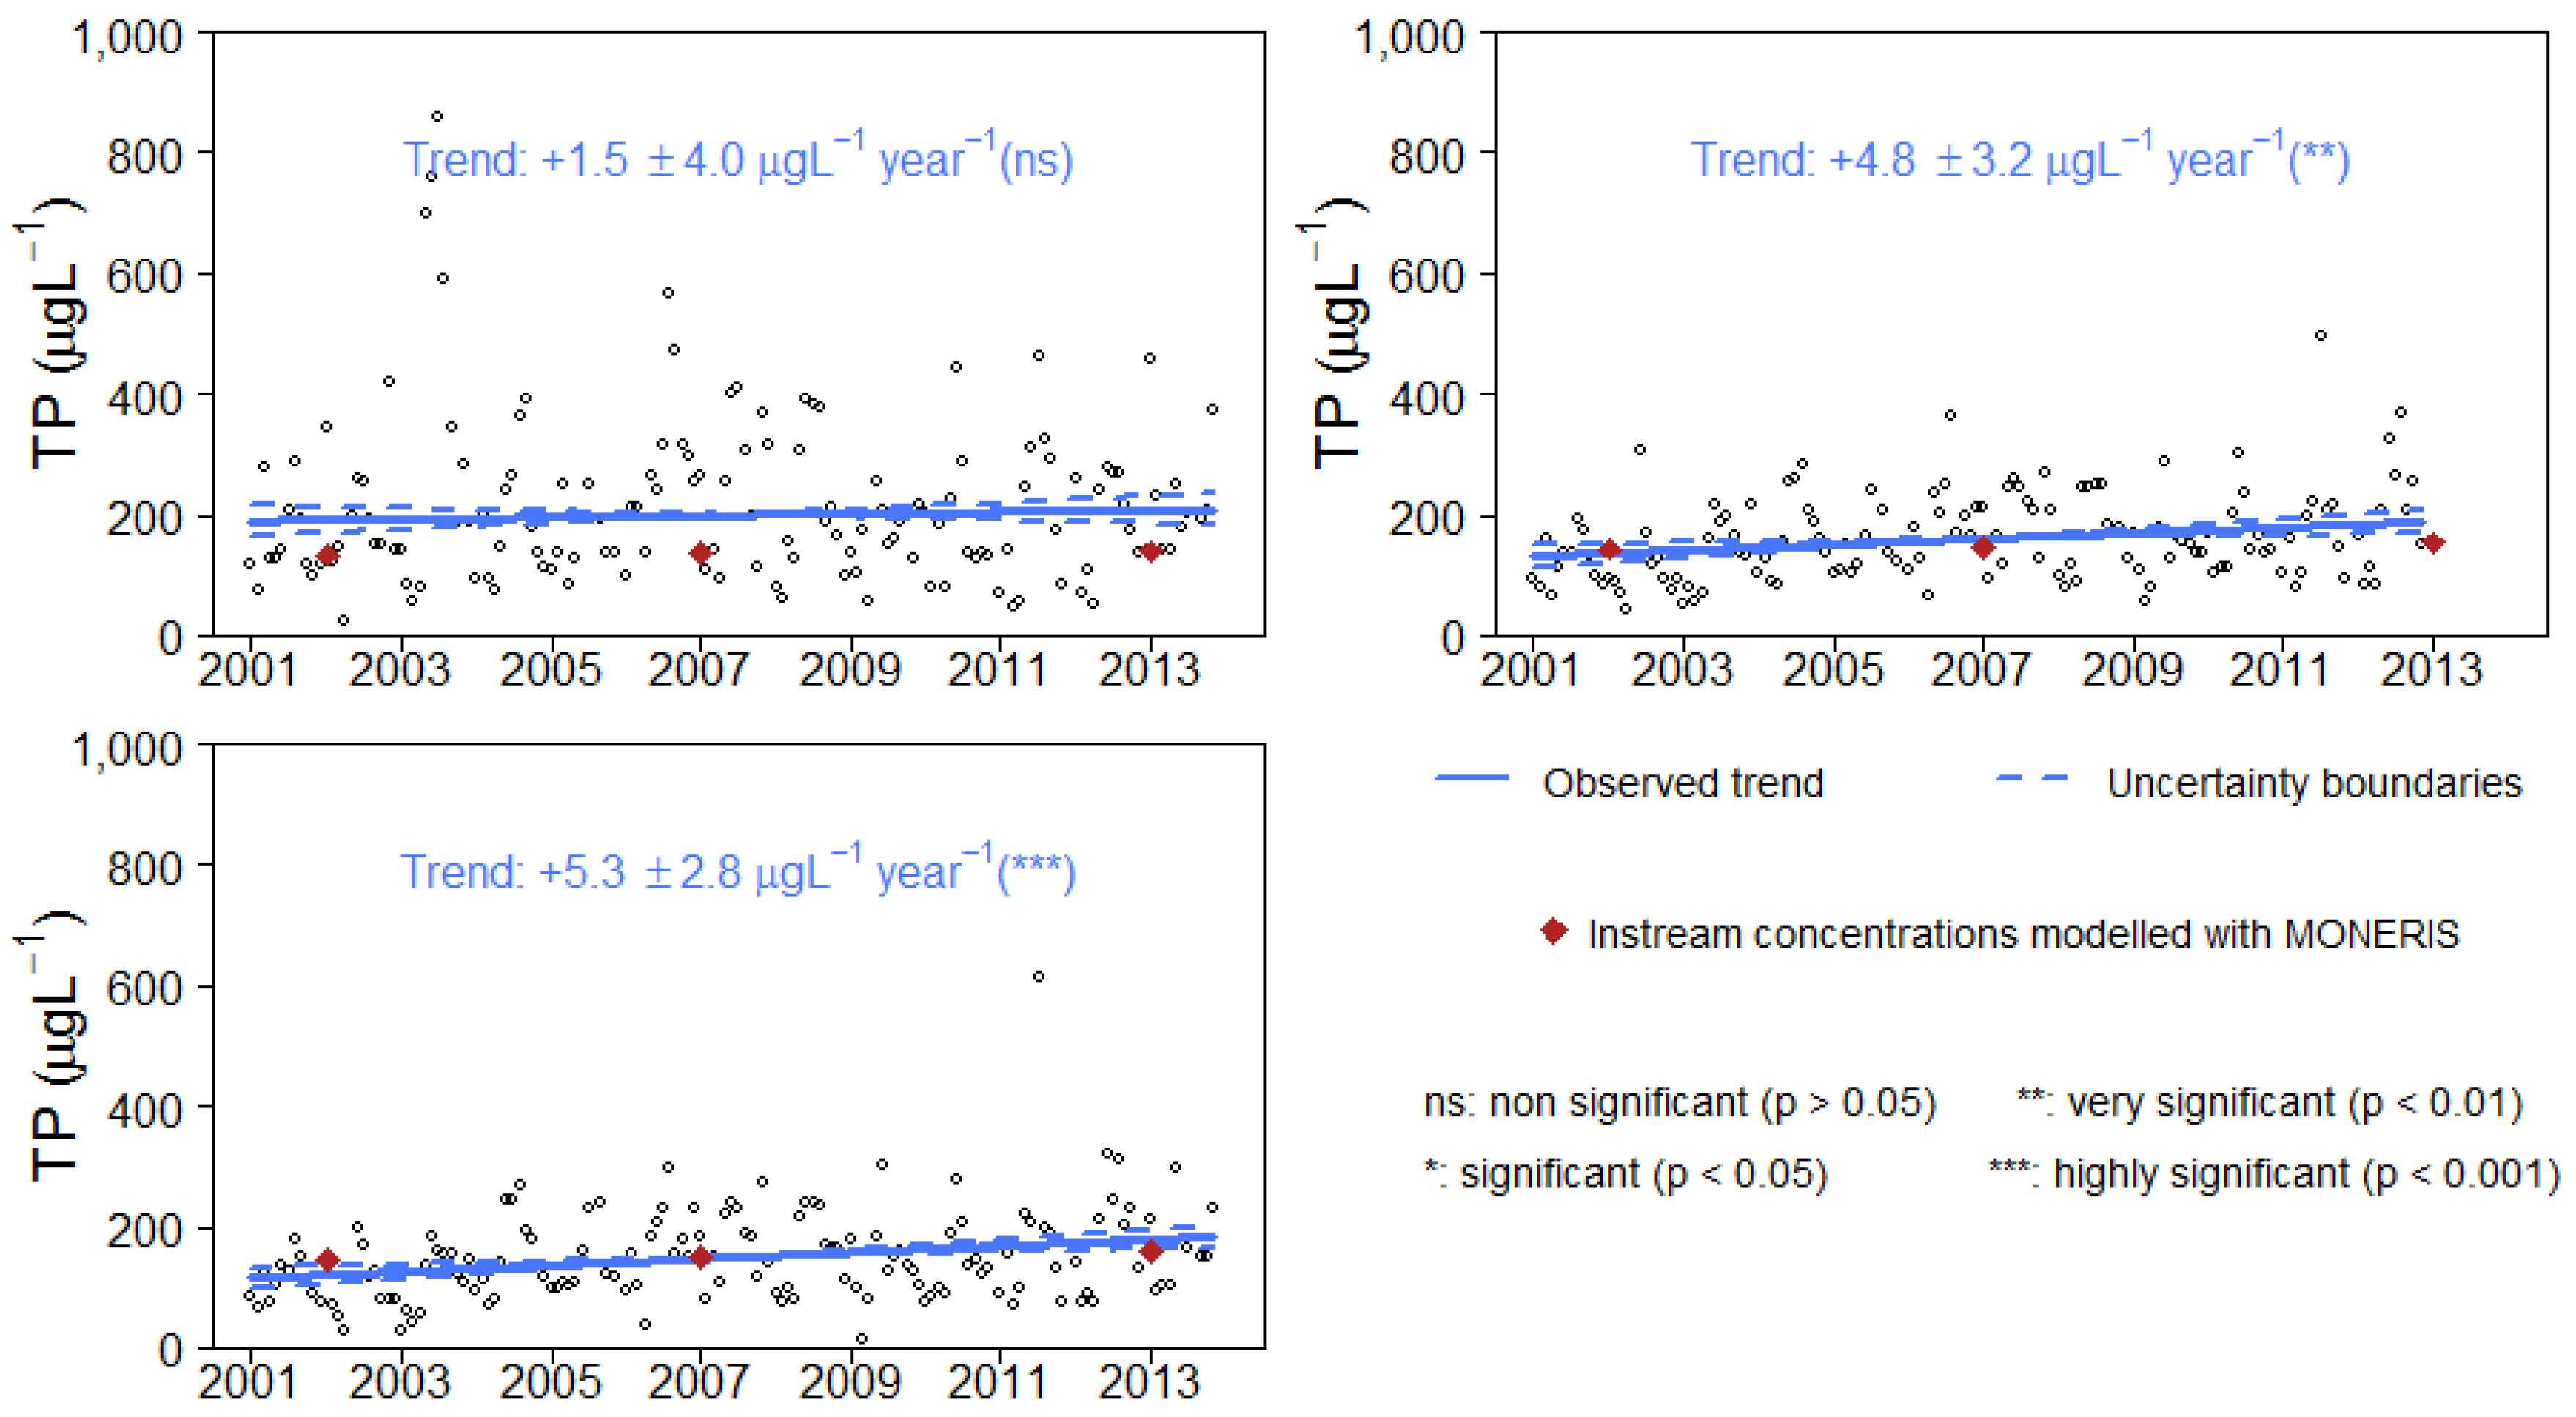
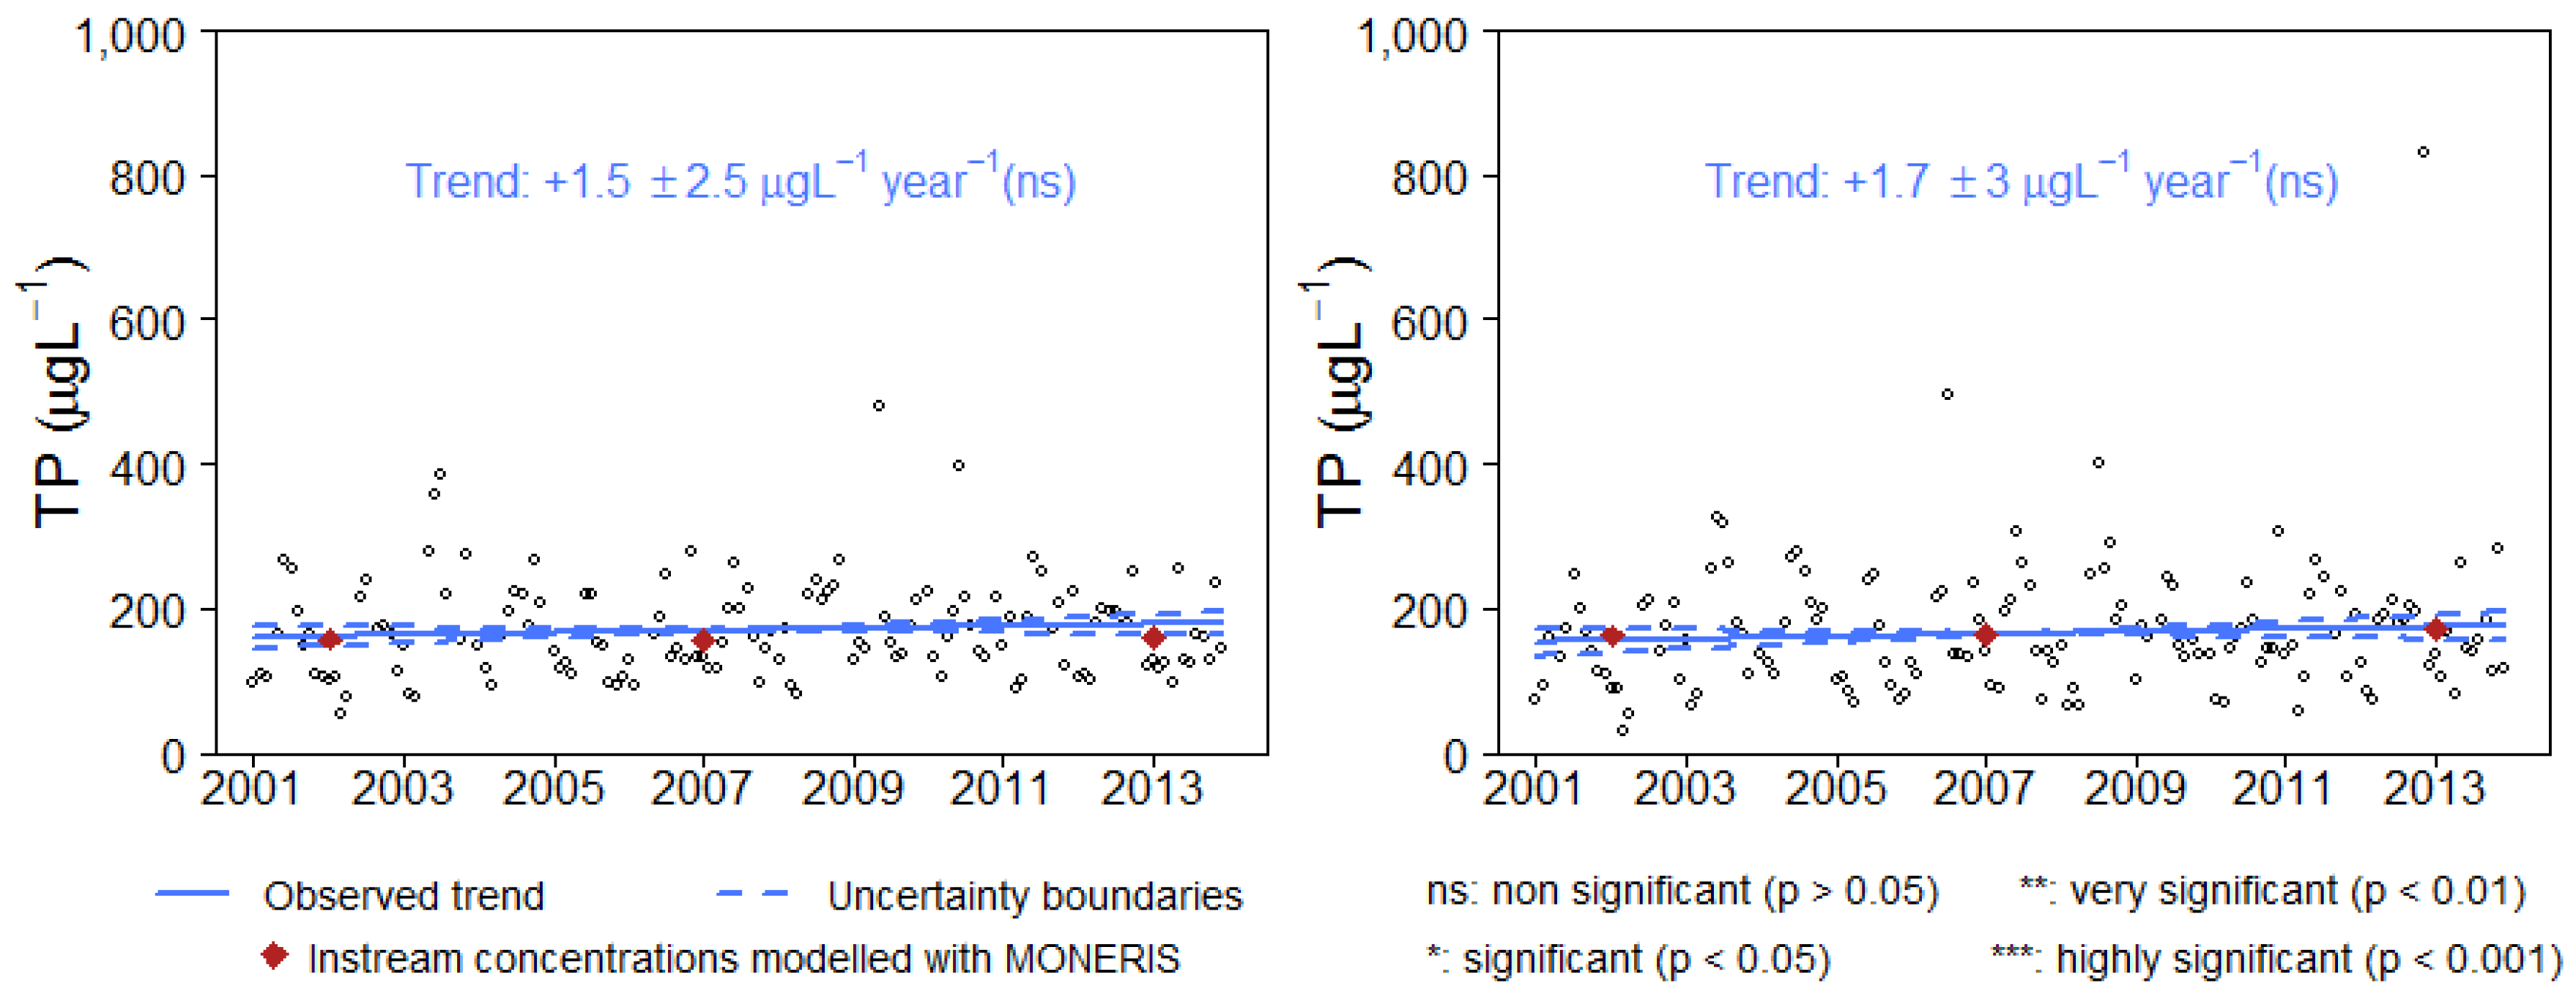
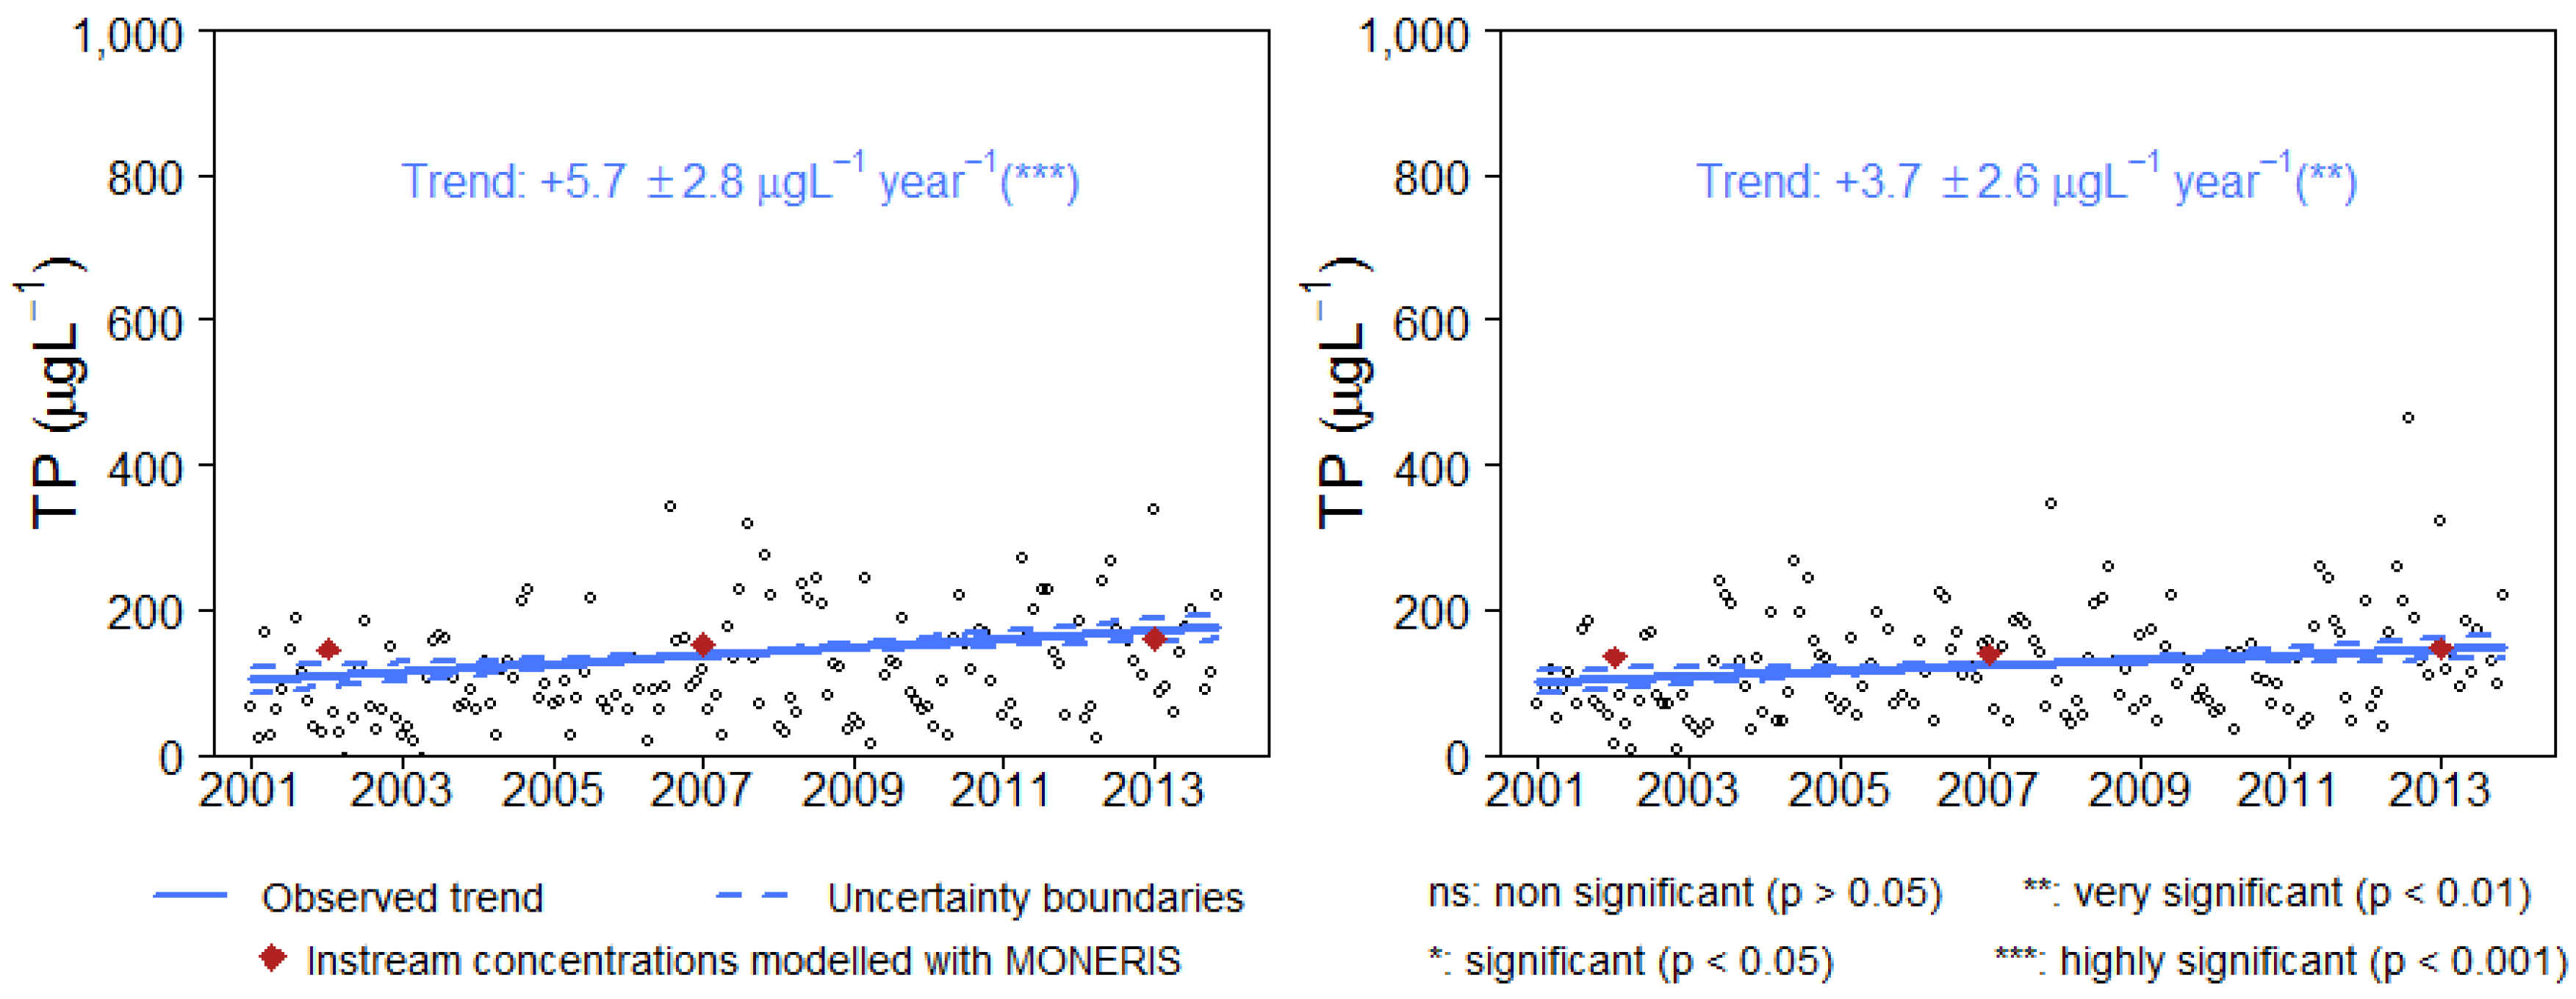
3.2. Comparison of Observed and Modelled TP Concentrations in Selected Catchments

The performance of MONERIS in depicting trends of TP concentrations in surface waters is presented here for three selected catchments: Pram (Figure 3), Aschach (Figure 4) and Antiesen (Figure 5), representative of different situations. The sub-catchment outlets for which trends were modelled with MONERIS are shown in Figure 6. Whereas the streams Pram and Aschach exhibit significant large positive trends, TP in the Antiesen increased only slightly and was not significant statistically. Furthermore, whilst Pram presents significant trends only in its midstream and downstream sub-catchments, Aschach shows consistency in both its sub-catchments.
The comparison between observed and modelled trends for Pram, Aschach and Antiesen is further detailed in Table 1. Given that observed trends are expressed as monotonic change over the whole period 2001–2014, in order to enable a comparison modelled trends are calculated as the average annual change derived from the difference between the concentrations estimated for 2013 and 2002, respectively.
This comparison shows a very good correspondence between data and model results as far as it concerns concentration levels. Furthermore, MONERIS has correctly depicted the presence of increasing trends or lack thereof (it is assumed that an uncertainty range falling below <0.1 µ g TP L 1 year 1 corresponds to absence of trend). Where the model has indicated lack of trends, i.e., in the upstream sub-catchment of the Pram and in both sub-catchments of the Antiesen, the analysis of observed concentrations has delivered statistically nonsignificant trends with highly uncertain slopes fluctuating between positive and negative values. For the other sub-catchments of the river Pram and Aschach, the model estimates greater increasing trends (0.5–1.8 µ g TP L 1 year 1 ), in line with the results of the trend analysis applied to observed concentrations. A weak aspect of its performance lies, however, in the estimation of the trends magnitude, which are systematically lower than the observed ones, although the level of underestimation shows a large range of variability caused by the uncertainty of observed and modelled trends. Whereas comparing the highest boundaries of observed trends with the lowest boundaries of modelled trends results in underestimation factors 9 to 16, the inverse comparison of the lowest observed trends with the highest modelled trends delivers a maximum underestimation by a factor 2.

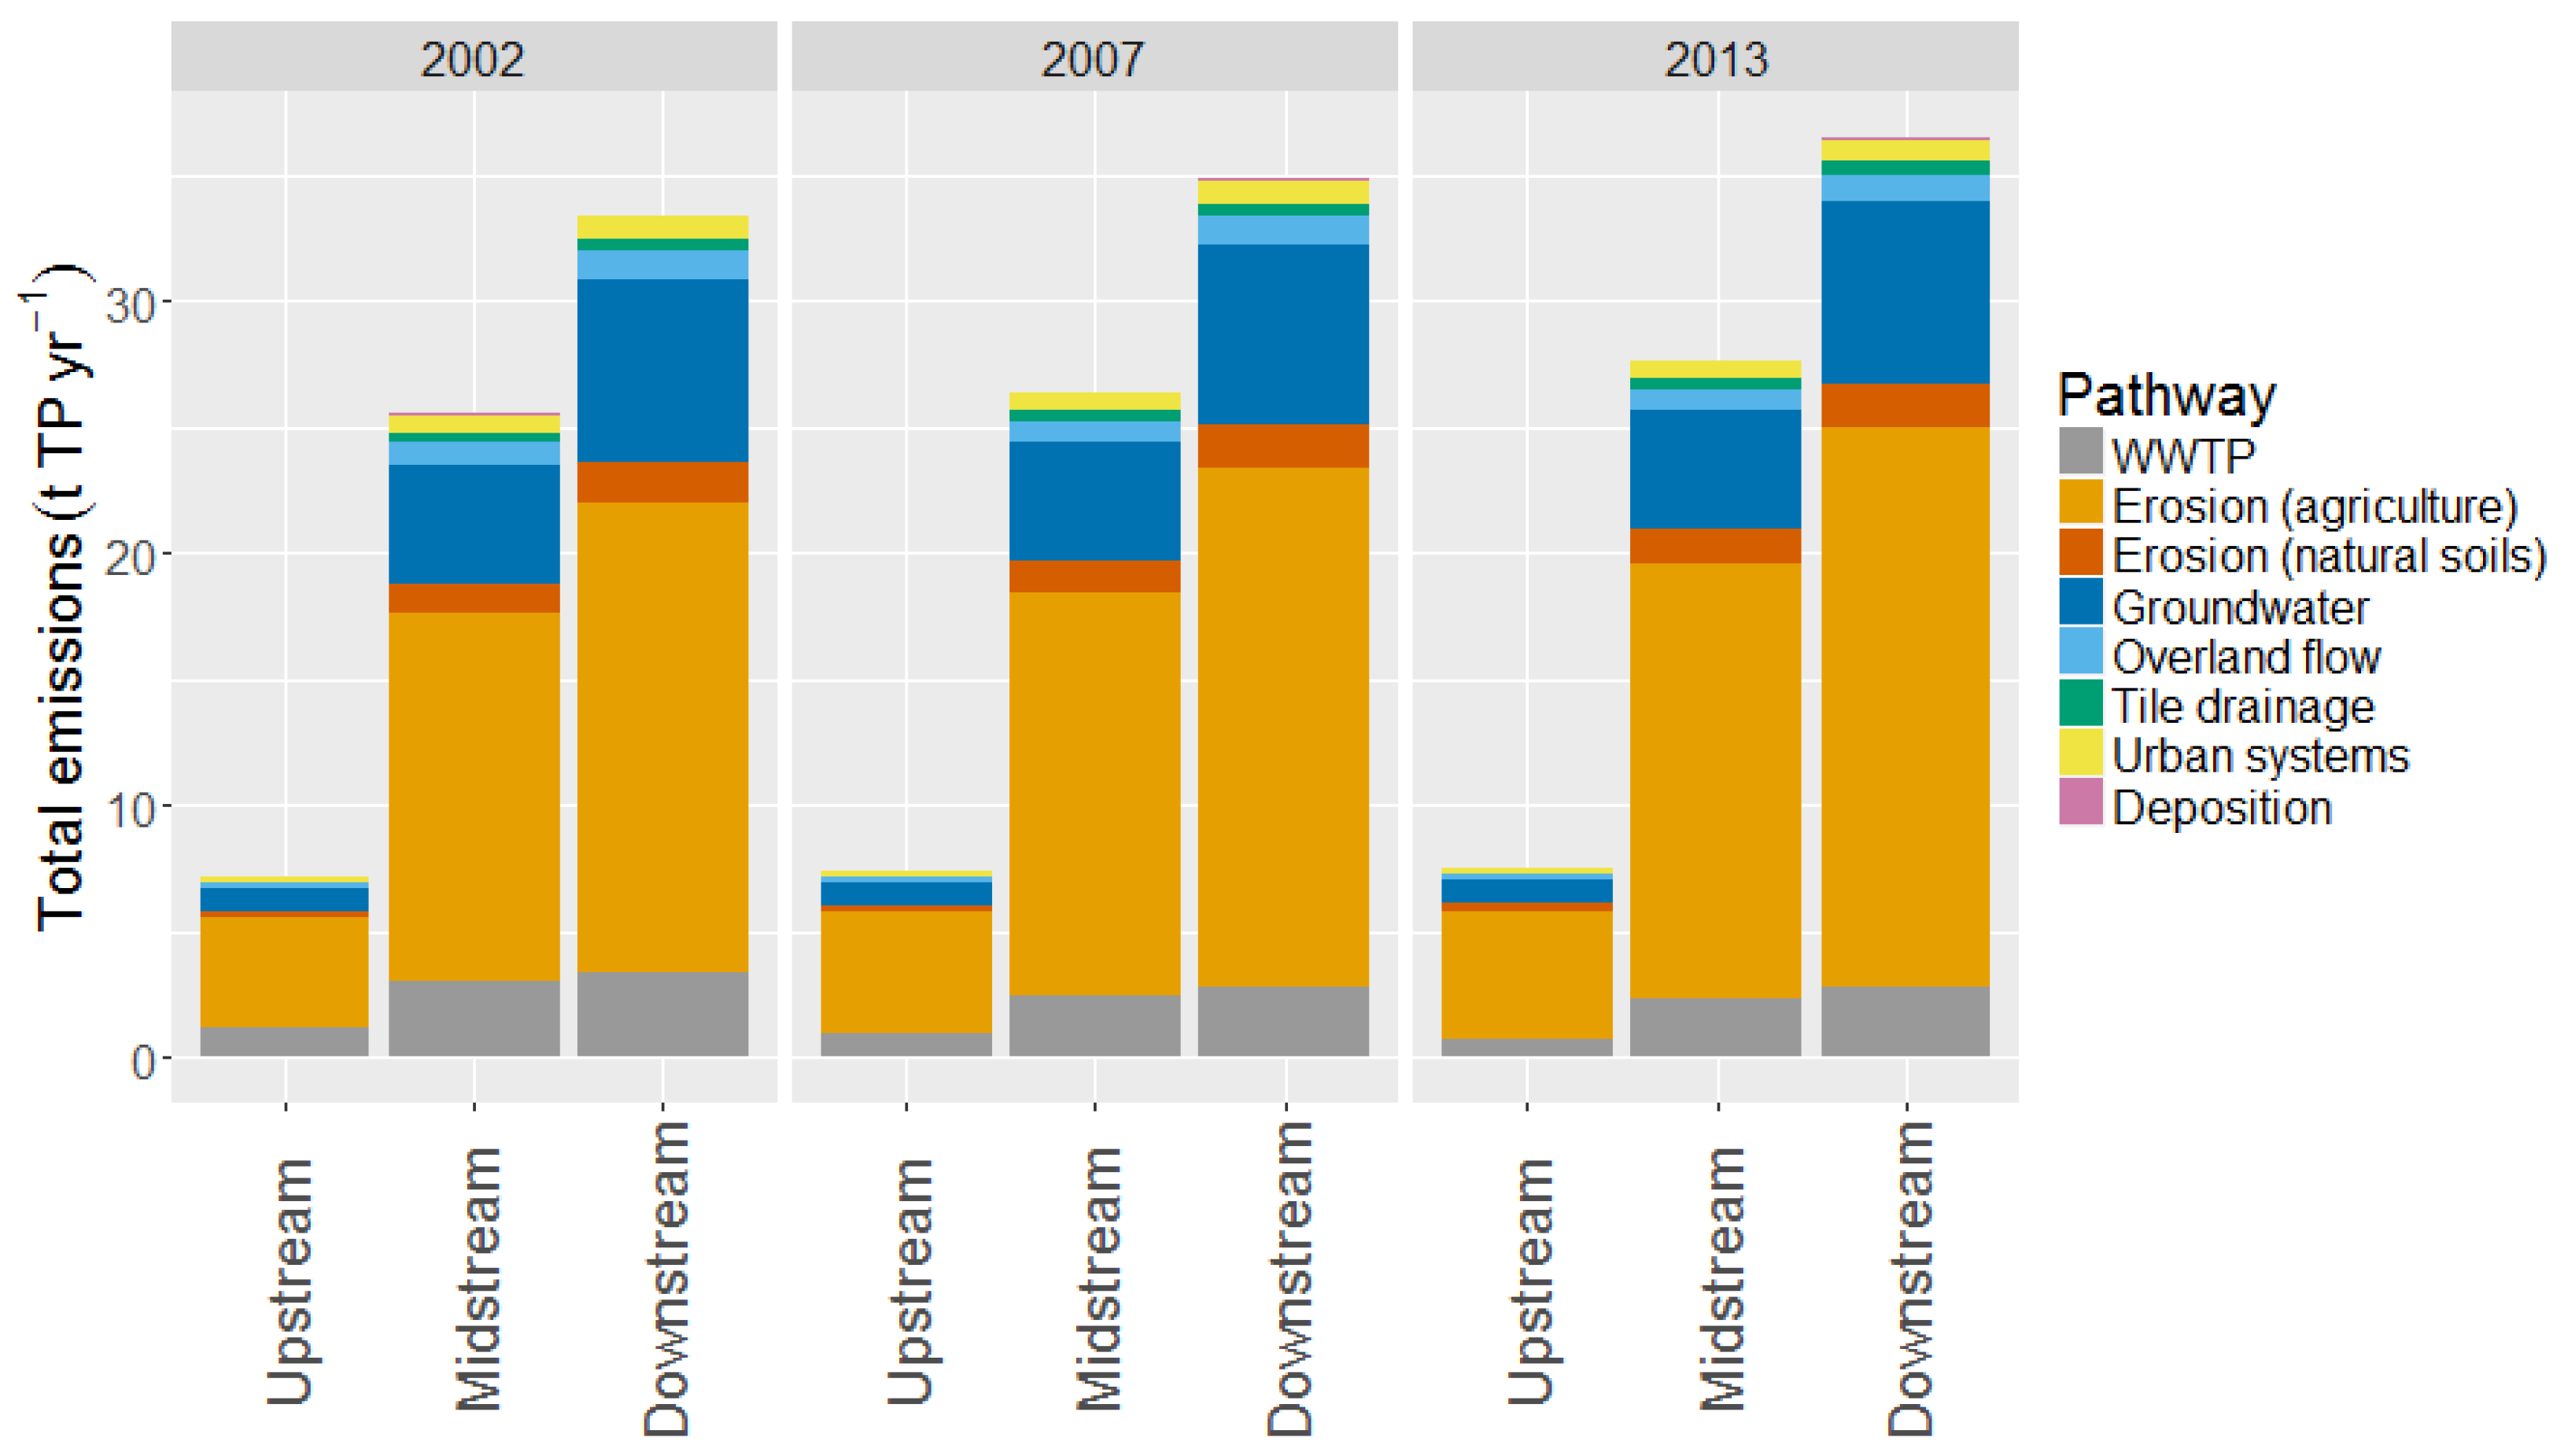
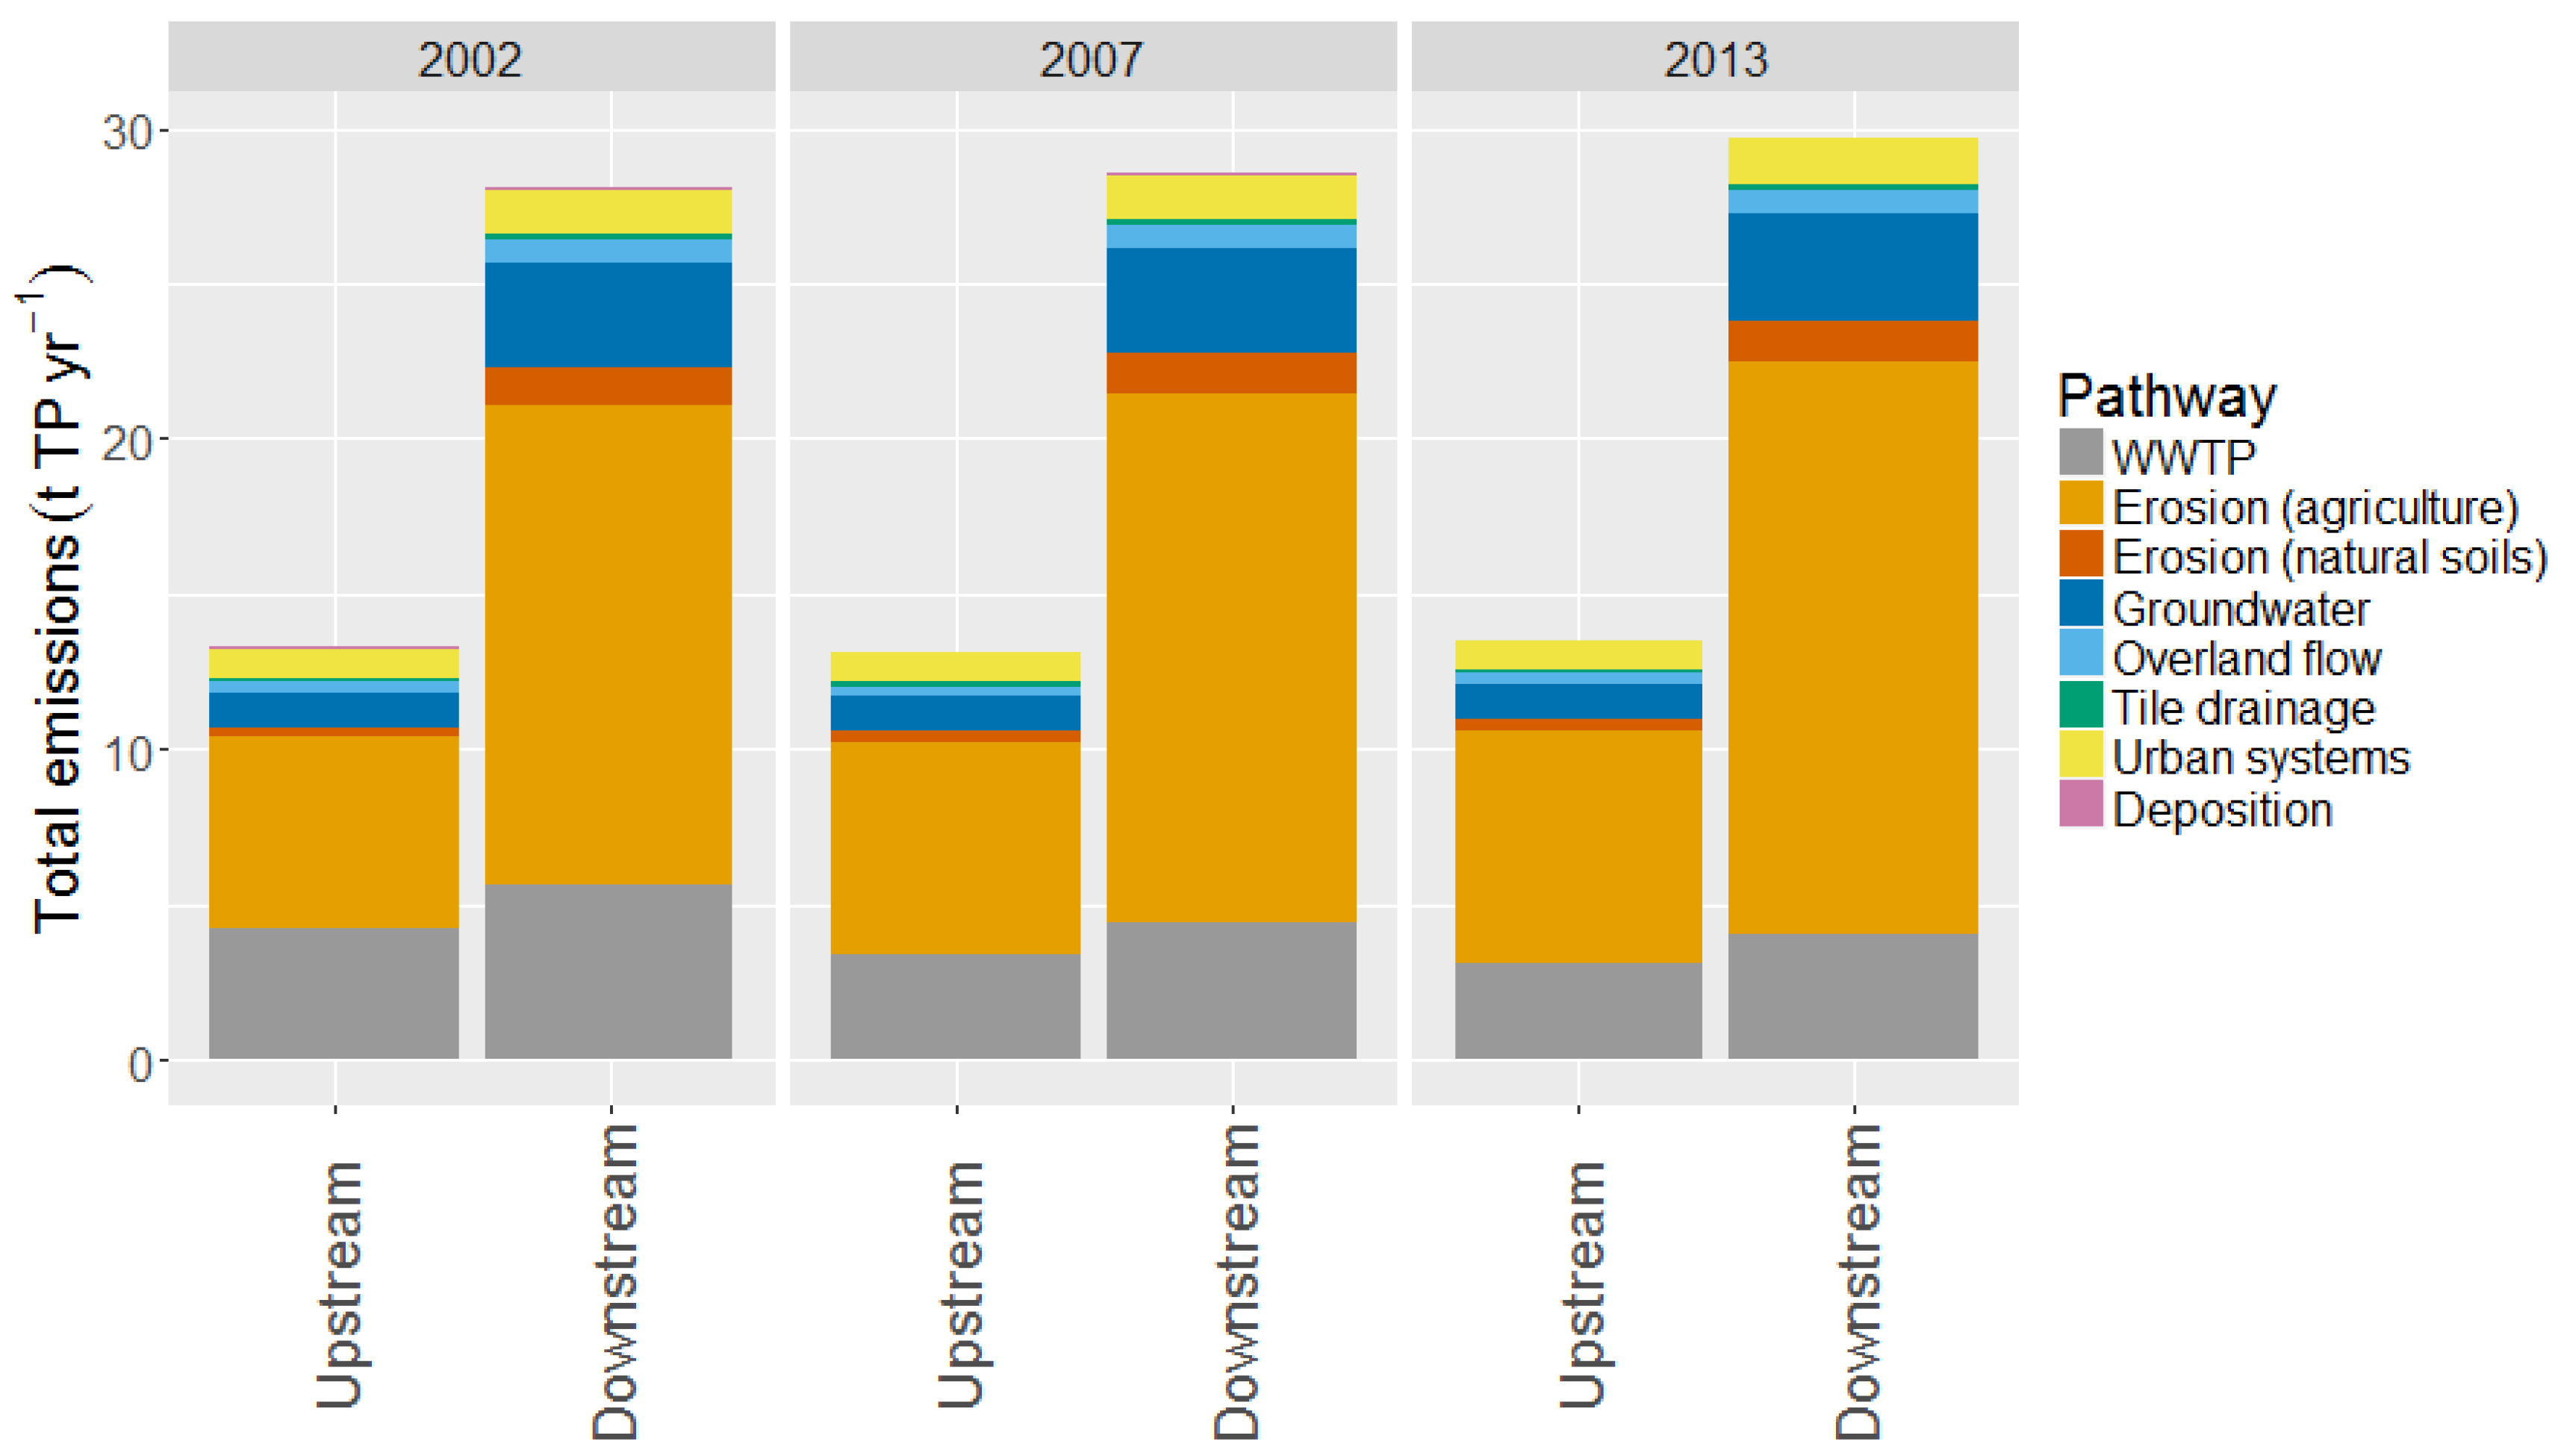
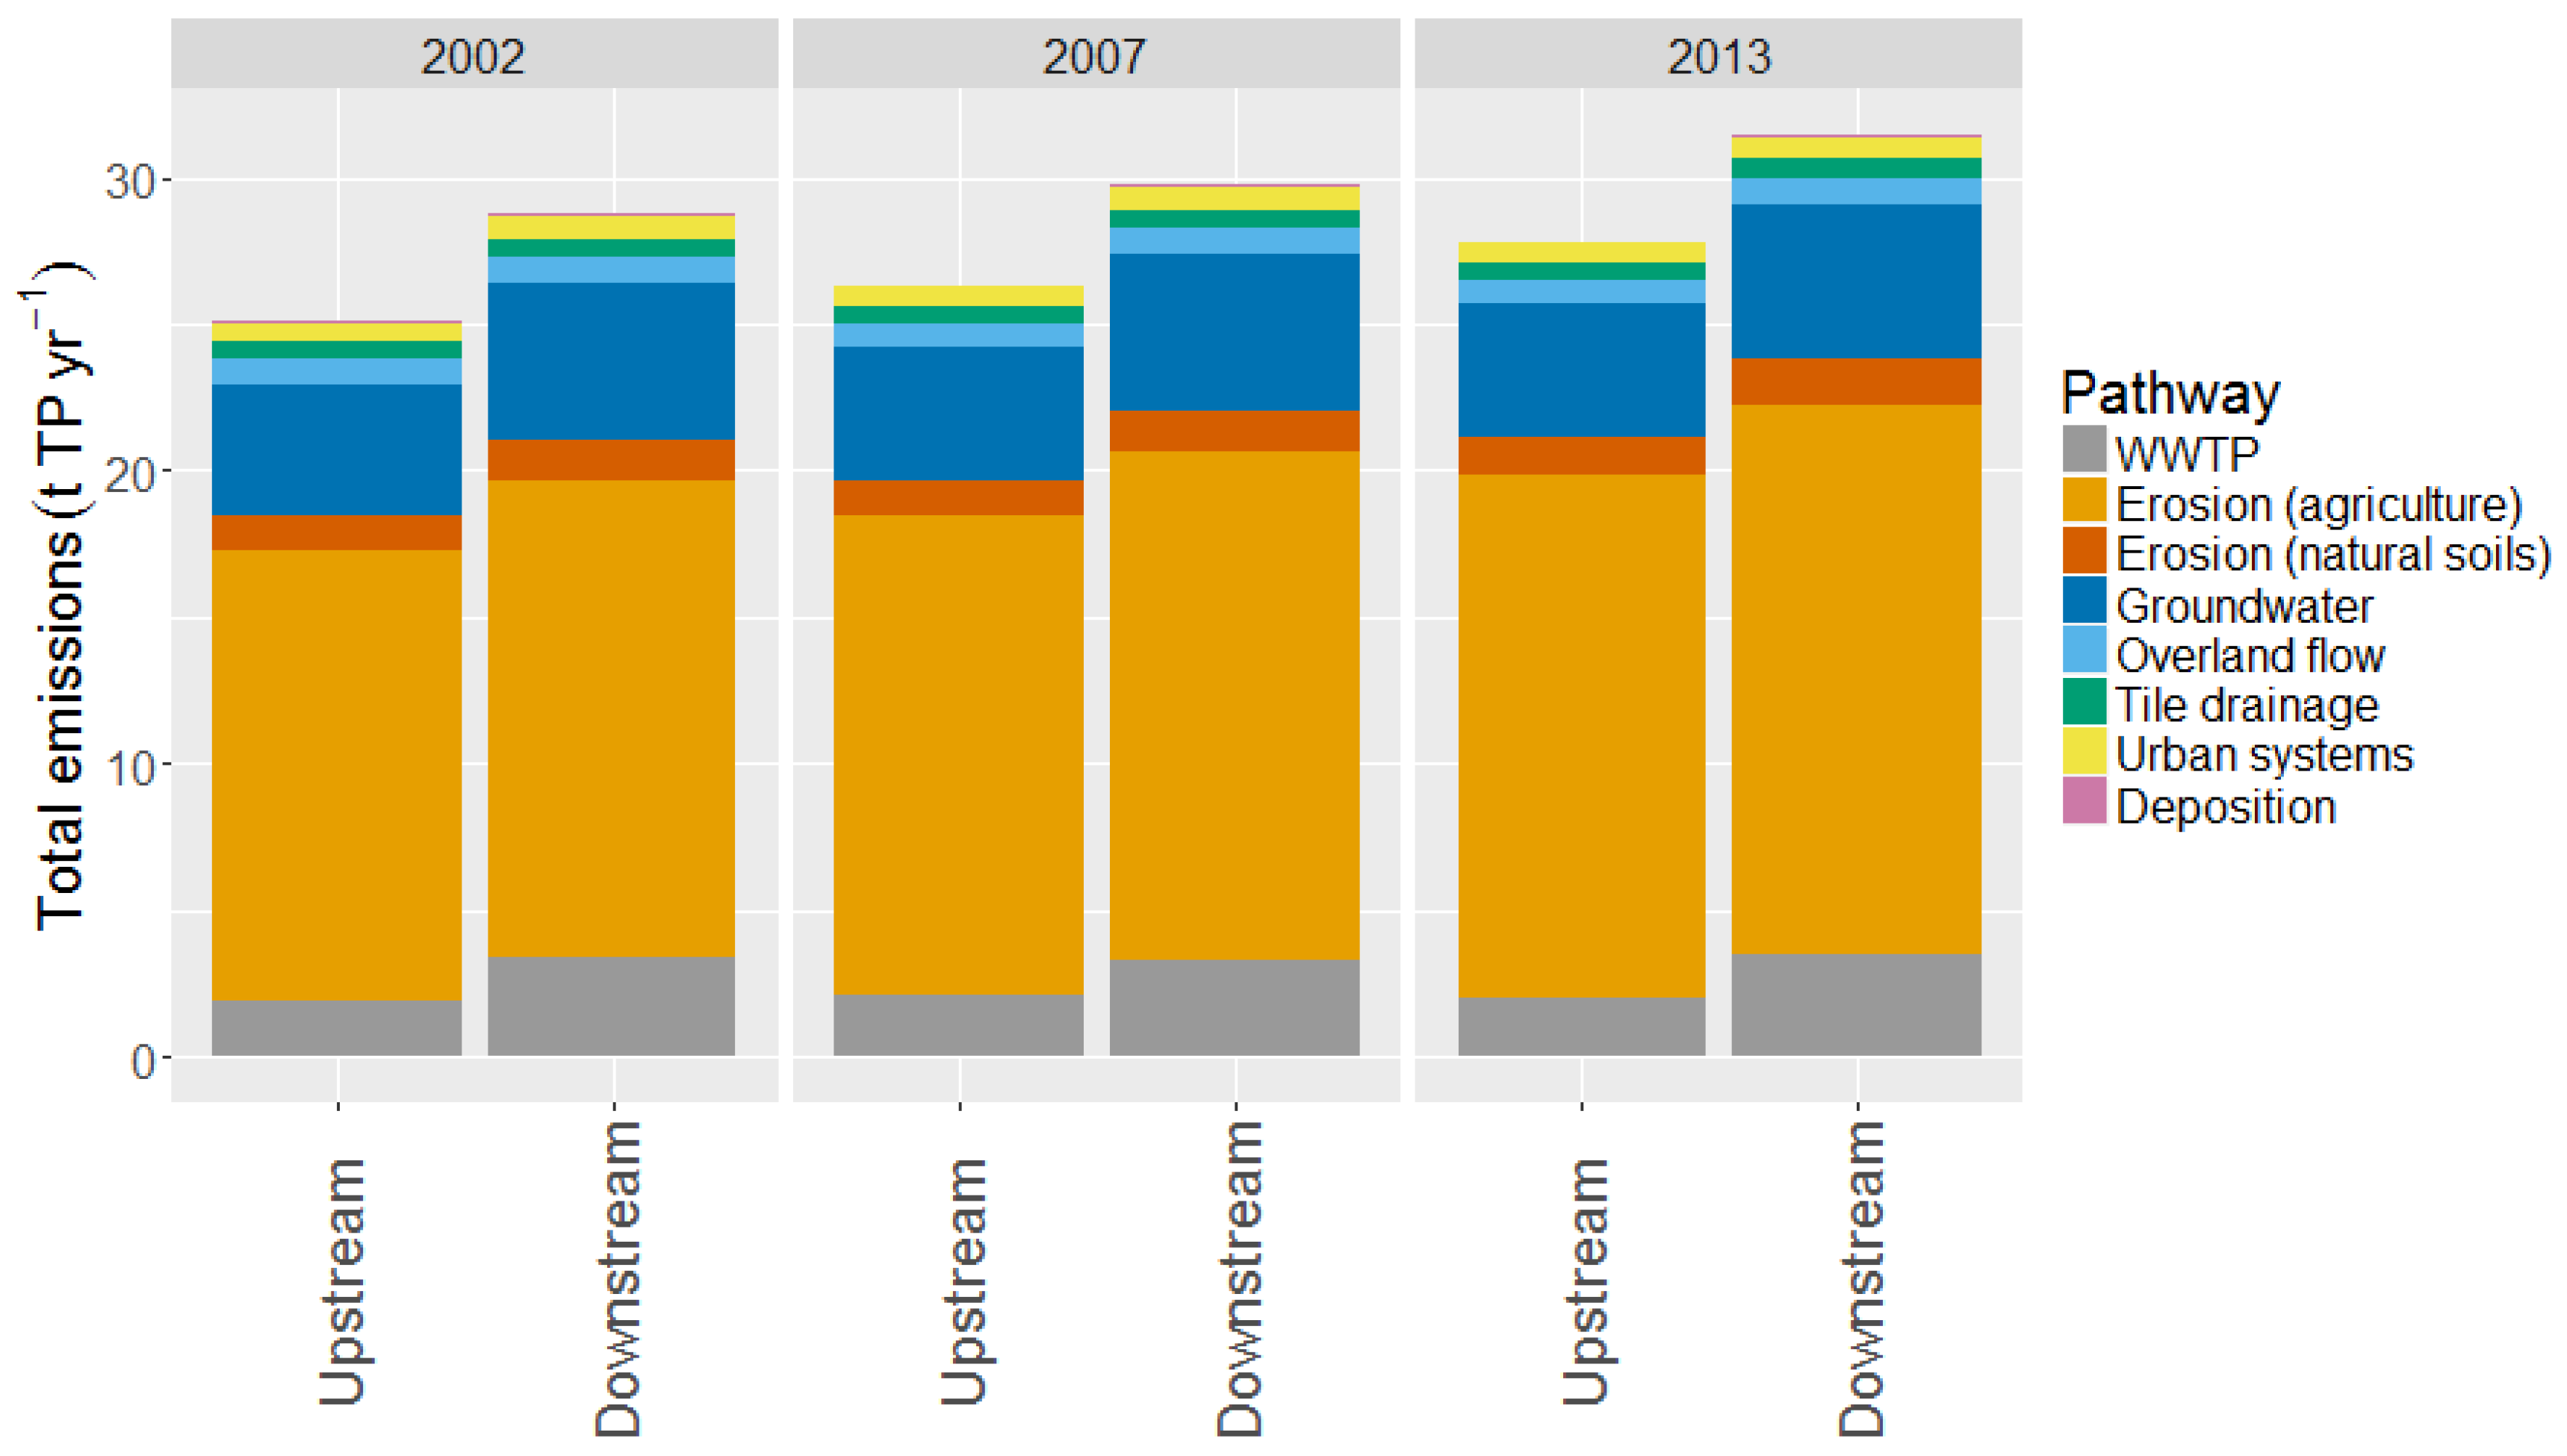
3.3. Identification of the Causes for Changes of TP Concentration in Selected Sub-Catchments

In line with the average tendency at the national level, which saw the enhancement of P removal from wastewater from 82% in 2001 to 90% in 2014 [40], the emissions of TP from WWTPs were considerably reduced during the period 2001–2014 in the whole catchments of the rivers Pram and Antiesen by 17% and 28%, respectively, with the highest reductions taking place upstream in the Pram (36%) and downstream in the Antiesen (25%). The Aschach shows, however, the opposite situation, with an overall increase of WWTP emissions by 3% catchment-wide. The agri-environmental programme “ÖPUL” was first launched when Austria joined the EU in 1995. It was developed to promote an agriculture compatible with environmental protection. During the different stages of the programme, a variety of measures has been implemented. The most well-known of these are cover crops, buffer strips and switch to organic agriculture. The comparison of the total amount of soil erosion with and without the actually implemented measures in the catchments under study shows that the edition 2007 of the programme successfully achieved a 7% reduction of the TP emissions via erosion. Nevertheless, the agricultural land use and the ratio of crop products also changed in those years. The agricultural area decreased by 5%–6% from 2002 to 2013, but the ratio of grassland to arable land significantly changed in favour of the latter, with a loss of approximately 24% of grassland in the selected catchments. Furthermore, the cropping area of maize, silage maize and soybeans considerably increased by roughly 24% and displaced other crops, thus making the soil more vulnerable to erosion. Altogether, it was estimated with MONERIS that these changes in agriculture have led to an increase of TP emissions via erosion by approximately 15% from 2002 to 2013, which has offset the reduction achieved through the ÖPUL programme.
Figure 7, Figure 8 and Figure 9 present the results of MONERIS regarding the consequences of the changes in point and erosion-driven emissions for the total TP emissions. The lowest changes can be observed in the upstream sub-catchment of the river Pram, which exhibits a 5% (±3%) increase of total TP emissions from 2002 to 2013 and in the Antiesen upstream and downstream, with 2% (±4%) and 6% (±4%) increase, respectively. These findings are well in accordance with the absence of significant observed trends. Where significant trends were observed, however, greater increases of total TP emissions are visible. For the river Pram, a rise of total TP emissions by 8% (±3%) and 9% (±3%) is found in the upstream and midstream sub-catchments, respectively. In the same period, total TP emissions raised by 11% (±2%) and 9% (±2%) in the upstream and downstream sub-catchments of the Aschach.
Figure 7, Figure 8 and Figure 9 also show the modelled consequences of the changes in point and diffuse emissions on the relative share of the different pathways. Erosion was already the dominant pathway in all the catchments selected in this work, but the changes mentioned above further exacerbated its relevance in relation to phosphorus emissions. If the downstream catchments are compared, the share of erosion-driven total TP emissions in the Pram and Aschach raised on average from 61% in 2002 to 66% and 65%, respectively, in 2013. For the Antiesen, this change is even sharper, with an average increase from 59% to 67%. These very high and increasing values clearly indicate the crucial role played by erosion in these catchments and explain the high sensitivity of instream TP concentrations to small or moderate changes in land use or type of cultivated crops. The hypothesis that the rise of erosion-driven emissions is responsible for the increasing trend of instream TP concentrations is further supported by the results of the trend analysis performed for PP. As shown in Figure 10, in the period 2001–2014, 54 significant trends were detected for the whole region, 100% of which were increasing. The fact that, out of these 54 trends, 11 were very significant and 38 even highly significant, largely reduces the probability of basing these conclusions on false positives.
As far as it concerns the trend analysis of flow data, the results show no significant trend in any of the Upper Austrian catchments during the period 2001–2014.

3.4. Discussion

In this work, the performance of the MONERIS model for the assessment of changes of phosphorus concentrations in surface waters driven by environmental measures was tested on selected Austrian catchments and sub-catchments.
The results reaffirm MONERIS as a powerful model to estimate instream phosphorus concentrations and show that, with an adequate database covering the most important emission pathways, it is capable of reliably depicting trends at catchment and sub-catchment scale. Not only did MONERIS consistently detect the existence of trends, but in combination with the critical assessment of the temporal development of input data, it also allowed the identification of their probable specific causes. If the maximum deviation in the range of 30%–35% found by [12] between modelled and observed loads were applied to the final MONERIS results, total emissions and consequently instream TP concentrations would no longer present significant differences between 2002 and 2013. Nevertheless, such a strict statistical approach is not thought to be appropriate in this study, given that not absolute deviations but relative differences between years are in the focus of interest. Although the absolute deviation from modelled and observed emissions or instream concentrations might be considerable, a large part of the error involved would be equally present in all modelled years. Considering that erosion is by far the dominant emission pathway in the studied catchments, that the cultivation of maize, maize silage and soybeans undoubtedly makes the soil more vulnerable to erosion with respect to other crops, such as for instance grain, and that the detailed available data do not show relevant changes of other emissions pathways, it would be conceptually incorrect to assume the simultaneous possibility of a positive and negative deviation of modelled TP emissions when comparing the years 2002 and 2013. What is uncertain is, however, the extent of the impact of such changes. This source of uncertainty was tested by altering the relative importance of the three most important pathways, namely erosion, groundwater and WWTPs as well as by altering the C factors used in the USLE equation within variation ranges considered plausible according to the literature. The results of these scenarios still consistently show the existence of positive trends.
A possible alternative hypothesis, which would explain the increase of TP concentration not through changes in the emissions but through the increase of flow, was rejected on the basis of the results of the trend analysis performed on the flow data, which found no significant trend in any of the Upper Austrian catchments.
A deficiency which was detected is the model accuracy in estimating trend magnitudes. In the catchments analysed in this study, a systematic deviation between modelled and observed trends of instream TP concentrations was found. Such a consistent underestimation might either derive from the existence of relevant changes which have been overlooked or from the underestimation of the actual impact exerted by the considered changes. In this case, the second explanation is more plausible, since comprehensive information concerning all emission pathways as well as high resolution hydrological data were available. Given that the increasing trends of instream TP concentrations in this study were found to be likely caused by rising erosion-driven emissions, USLE combined with the available C factors derived from literature may not sufficiently depict the impact of the change in land use on TP emissions.
On the one hand, for a further assessment of MONERIS’ capabilities of depicting trends in surface waters, it would be useful to perform this same analysis for a case study in which the complexity of erosion processes does not play such a fundamental role. The decreasing trends of TP concentrations detected in Upper Austria in the period 1990–2001 offer one such ideal case, given that they were most likely provoked by changes in point emissions. On the other hand, erosion-driven emissions of phosphorus generally play a crucial role all over the world, and therefore it is compelling that algorithms, coefficients and factors currently implemented within MONERIS are further investigated and fine-tuned.
One further aspect worth being brought into this discussion is the uncertainty affecting the trend analysis. Although the standard error associated with the trend slope was calculated and presented, the sensitivity of the slope to the selected time period should also be taken into consideration. As an example, the same analysis was performed over the period 1998–2014. It delivered consistent results of increasing and significant trends, but with lower magnitude (e.g., +3.9 µ g TP L 1 year 1 instead of +5.3 µ g TP L 1 year 1 for Pram downstream and +1.2 µ g TP L 1 year 1 instead of +3.7 µ g TP L 1 year 1 for Aschach downstream). Observed trends should, therefore, not be considered as definitive, but rather indicative values to validate the model.
Although acknowledging uncertainties and limitations, the results of this study suggest that specific developments in business-driven land management offset considerable efforts towards environmental protection and led to undesirable trends of phosphorus contamination in surface waters. In conclusion, this work puts forward the combination of trend analysis, emissions modelling and input data assessment as an adequate approach to estimate the impact of different measures and to identify causes and deliver explanations.

Acknowledgments

This research was funded by the Government of Upper Austria (Contract AUWR-2012-61484/ 46-StU). The authors would like to thank Ulrike Steinmair and Franz Überwimmer of the Government of Upper Austria for their prompt delivery of data and information, for their active support in the interpretation of the results and for the constructive discussion of management strategies.

Author Contributions

Matthias Zessner conceived the research questions and the methodological approach. Ottavia Zoboli performed the trend analyses, conceived and wrote most part of the manuscript. Gerold Hepp contributed to the data preparation for emissions modelling and created Figure 1, Figure 2 and Figure 10. Max Kuderna and Christine Weinberger conceived and developed the novel input data system. In addition, Christine Weinberger collected and updated data on land use and agricultural production. Max Kuderna further contributed with his expertise on the agro-environmental ÖPUL programme as well as with his expertise in soil erosion. Oliver Gabriel collected the data concerning point emissions and performed all model calculations with MONERIS. All co-authors contributed to complete and improve the text of the manuscript.

Conflicts of Interest

The authors declare no conflict of interest.

Abbreviations

The following abbreviations are used in this manuscript:
Pphosphorus
PPparticular phosphorus
SRPsoluble reactive phosphorus
TPtotal phosphorus
WWTPwastewater treatment plant

References

  1. Shigaki, F.; Sharpley, A.; Prochnow, L.I. Animal-based agriculture, phosphorus management and water quality in Brazil: Options for the future. Sci. Agricola 2006, 63, 194–209. [Google Scholar] [CrossRef]
  2. Wang, X. Management of agricultural nonpoint source pollution in China: Current status and challenges. Water Sci. Technol. 2006, 53, 1–9. [Google Scholar] [CrossRef] [PubMed]
  3. Dubrovsky, N.M.; Burow, K.R.; Clark, G.M.; Gronberg, J.M.; Hamilton, P.A.; Hitt, K.J.; Mueller, D.K.; Munn, M.D.; Nolan, B.T.; Puckett, L.J.; et al. The Quality of our Nation’s Waters-Nutrients in the Nation’s Streams and Groundwater, 1992–2004. Circular 1350; US Geological Survey, Ed.; US Geological Survey: Sacramento, CA, USA, 2010.
  4. Novotny, V.; Wang, X.; Englande, A.J., Jr.; Bedoya, D.; Promakasikorn, L.; Tirado, R. Comparative assessment of pollution by the use of industrial agricultural fertilizers in four rapidly developing Asian countries. Environ. Dev. Sustain. 2010, 12, 491–509. [Google Scholar] [CrossRef]
  5. EU. Directive 2000/60/EC of the European Parliament and of the Council Establishing a Framework for the Community Action in the Field of Water Policy. Available online: http://ec.europa.eu/environment/water/water-framework/index_en.html (accessed on 14 September 2016).
  6. EEA. European Waters—Assessment of Status and Pressures; Technical Report; European Environment Agency: Copenhagen, Denmark, 2012. [Google Scholar]
  7. ICPDR. The Danube River Basin District Management Plan—Update 2015; Technical Report; International Commission for the Protection of the Danube River: Vienna, Austria, 2015. [Google Scholar]
  8. Sharpley, A.N.; Bergström, L.; Aronsson, H.; Bechmann, M.; Bolster, C.H.; Börling, K.; Djodjic, F.; Jarvie, H.P.; Schoumans, O.F.; Stamm, C.; et al. Future agriculture with minimized phosphorus losses to waters: Research needs and direction. AMBIO 2015, 44, 163–179. [Google Scholar] [CrossRef] [PubMed] [Green Version]
  9. Behrendt, H.; Huber, P.; Kornmilch, M.; Opitz, D.; Schmoll, O.; Scholz, G.; Uebe, R. Nutrient Emissions into River Basins of Germany; Technical Report, UBA-Texte 23/00; Federal Environmental Agency: Berlin, Germany, 2000; p. 266.
  10. Behrendt, H.; Kornmilch, M.; Opitz, D.; Schmoll, O.; Scholz, G. Estimation of the nutrient inputs into river systems–experiences from German rivers. Reg. Environ. Chang. 2002, 3, 107–117. [Google Scholar] [CrossRef]
  11. Venohr, M.; Hirt, U.; Hofmann, J.; Gericke, A.; Wetzig, A.; Natho, S.; Neumann, F.; Hürdler, J.; Matranga, M.; Mahnkopf, J. Modelling of nutrient emissions in river systems–MONERIS–methods and background. Int. Rev. Hydrobiol. 2011, 96, 435–483. [Google Scholar] [CrossRef]
  12. Zweinert, U. Möglichkeiten und Grenzen bei der Modellierung von Nährstoffeinträgen auf Flussgebietsebene—Untersuchungen am Beispiel des Modells MONERIS. Ph.D. Thesis, Technische Universität Dresden, Dresden, Germany, 2008. [Google Scholar]
  13. Schreiber, H.; Behrendt, H.; Constantinescu, L.T.; Zessner, M. Point and diffuse nutrient emissions and loads in the transboundary Danube River Basin. I. A modelling approach. Archiv für Hydrobiologie. Supplementband. Large Rivers 2005, 16, 221–247. [Google Scholar]
  14. Behrendt, H.; van Gils, J.; Schreiber, H.; Zessner, M. Point and diffuse nutrient emissions and loads in the transboundary Danube River Basin. II. Long-term changes. Archiv für Hydrobiologie. Supplementband. Large Rivers 2005, 16, 221–247. [Google Scholar]
  15. Zessner, M.; Gabriel, O.; Kovacs, A.; Kuderna, M.; Schilling, C.; Hochedlinger, G.; Windhofer, G. Analyse der Nährstoffströme in Oberösterreichischen Einzugsgebieten nach Unterschiedlichen Eintragspfaden für Strategische Planungen (Nährstoffströme Oberösterreich); Technical Report; Im Auftrag des Amtes der Oberösterreichischen Landesregierung: Vienna, Austria, 2011. [Google Scholar]
  16. Zessner, M.; Gabriel, O.; Kovacs, A.; Kuderna, M.; Schilling, C.; Hochedlinger, G.; Windhofer, G. Analyse der Wirkung von Maßnahmen zur Reduktion von Nährstoffeinträgen in Oberösterreichischen Einzugsgebieten nach Unterschiedlichen Eintragspfaden für Strategische Planungen; Technical Report; Im Auftrag des Amtes der Oberösterreichischen Landesregierung: Vienna, Austria, 2012. [Google Scholar]
  17. Zessner, M.; Gabriel, O.; Kuderna, M.; Weinberger, C.; Hepp, G.; Kovacs, A.; Windhofer, G. Effektivität von Maßnahmen zur Reduktion der Phosphorbelastung der oberösterreichischen Fließgewässer. Österreichische Wasser- und Abfallwirtschaft 2013, 66, 51–58. [Google Scholar] [CrossRef]
  18. Zessner, M.; Hepp, G.; Kuderna, M.; Weinberger, C.; Gabriel, O.; Windhofer, G. Konzipierung und Ausrichtung übergeordneter Strategischer Maßnahmen zur Reduktion von Nährstoffeinträgen in Oberösterreichische Fließgewässer; Technical Report; Im Auftrag des Amtes der Oberösterreichischen Landesregierung: Vienna, Austria, 2014. [Google Scholar]
  19. Mann, O.B. Nonparametric tests against trend. Econometrica 1945, 13, 245–259. [Google Scholar] [CrossRef]
  20. Kendall, M.G. Rank Correlation Methods; Griffin, Ed.; C. Griffin: Harpers Ferry, WV, USA, 1948. [Google Scholar]
  21. Helsel, D.R.; Hirsch, R.M. Statistical Methods in Water Resources; US Geological Survey, Ed.; US Geological Survey: Sacramento, CA, USA, 2002. [Google Scholar]
  22. Theil, H. A rank-invariant method of linear and polynomial regression analysis. 1, 2 and 3. Nederl. Akad. Wetensch. Proc. 1950, 53, 386–392, 521–525, 1397–1412. [Google Scholar]
  23. Sen, P.K. Estimates of the regression coefficient based on Kendall‘s tau. J. Am. Stat. Assoc. 1968, 63, 1379–1389. [Google Scholar] [CrossRef]
  24. Zessner, M.; Kroiss, H. Retention and losses of nutrients in the hydrosphere of Austria. Water Sci. Technol. 1999, 40, 59–66. [Google Scholar] [CrossRef]
  25. Hirsch, R.M.; Alexander, R.B.; Smith, R.A. Selection of methods for the detection and estimation of trends in water quality. Water Resour. Res. 1991, 27, 803–813. [Google Scholar] [CrossRef]
  26. Hirsch, R.M.; Slack, J.R.; Smith, R.A. Techniques of trend analysis for monthly water quality data. Water Resour. Res. 1982, 18, 107–121. [Google Scholar] [CrossRef]
  27. BMLFUW. WISA Wasser Informationsystem Austria—H2O Fachdatenbank. Available online: https://wasser.umweltbundesamt.at/h2odb/ (accessed on 14 September 2016).
  28. Upper Austria Government. AIM Amtliches Immissionsmessnetz. Available online: https://www.land-oberoesterreich.gv.at/163846.htm (accessed on 14 September 2016).
  29. R Core Team. R: A Language and Environment for Statistical Computing. 2016. [Google Scholar]
  30. BMLFUW. Invekos Database. Available online: https://www.bmlfuw.gv.at/land/direktzahlungen/Invekos.html (accessed on 14 September 2016).
  31. Schwertmann, U.; Vogl, W.; Kainz, M. Bodenerosion durch Wasser—Vorhersage des Abtrags und Bewertung von Gegenmaßnahmen; Verlag Eugen Ulmer: Stuttgart, Germany, 1987. [Google Scholar]
  32. Zessner, M.; Kovacs, A.; Schilling, C.; Hochedlinger, G.; Gabriel, O.; Natho, S.; Thaler, S.; Windhofer, G. Enhancement of the MONERIS model for application in alpine catchments in Austria. Int. Rev. Hydrobiol. 2011, 96, 541–560. [Google Scholar] [CrossRef]
  33. Schilling, C.; Zessner, M.; Kovacs, A.; Hochedlinger, G.; Windhofer, G.; Gabriel, O.; Thaler, S.; Parajka, J.; Natho, S. Stickstoff- und Phosphorbelastungen der Fließgewässer Österreichs und Möglichkeiten zu deren Reduktion. Österreichische Wasser- und Abfallwirtschaft 2011, 63, 105–116. [Google Scholar] [CrossRef]
  34. BMLFUW. ÖPUL 2000. Sonderrichtlinie für das Österreichische Program zur Förderung einer Umweltgerechten, Extensiven und den Natürlichen Lebensraum Schützenden Landwirtschaft. Available online: https://www.bmlfuw.gv.at/land/laendl_entwicklung/oepul.html (accessed on 14 September 2016).
  35. BMLFUW. ÖPUL 2007. Sonderrichtlinie für das Österreichische Program zur Förderung einer Umweltgerechten, Extensiven und den Natürlichen Lebensraum Schützenden Landwirtschaft. Available online: https://www.bmlfuw.gv.at/land/laendl_entwicklung/oepul.html (accessed on 14 September 2016).
  36. wpa Beratende Ingenieure. Abschätzung des Bodenabtrags in Österreich und Integration der Daten in der INVEKOS Datenbank; Technical Report; Bundesministerium für Land- und Forstwirtschaft, Umwelt und Wasserwirtschaft: Wien, Austria, 2009. [Google Scholar]
  37. BMLFUW. Gewässerschutzbericht 1996; Technical Report; Bundesministerium für Land- und Forstwirtschaft, Umwelt und Wasserwirtschaft, Lebensministerium: Vienna, Austria, 1996. [Google Scholar]
  38. BMLFUW. Kommunale Abwasserrichtlinie der EU—91/271/EWG. Österreichischer Bericht 2008; Technical Report; Bundesministerium für Land- und Forstwirtschaft, Umwelt und Wasserwirtschaft, Lebensministerium: Vienna, Austria, 2008. [Google Scholar]
  39. Jarvie, H.P.; Neal, C.; Withers, P.J.A. Sewage-effluent phosphorus: A greater risk to river eutrophication than agricultural phosphorus? Sci. Total Environ. 2006, 360, 246–253. [Google Scholar] [CrossRef] [PubMed]
  40. BMLFUW. Kommunale Abwasserrichtlinie der EU—91/271/EWG. Österreichischer Bericht 2014; Technical Report; Bundesministerium für Land- und Forstwirtschaft, Umwelt und Wasserwirtschaft, Lebensministerium: Vienna, Austria, 2014. [Google Scholar]
Figure 1. Trends of total phosphorus concentration ( µ g TP L 1 year 1 ) in surface waters in Upper Austria for the following two periods: (a) 1990–2000; (b) 2001–2014.
Water 08 00404 g001
Figure 2. Trends of soluble reactive phosphorus concentration ( µ g SRP L 1 year 1 ) in surface waters in Upper Austria for the following two periods: (a) 1990–2000; (b) 2001–2014.
Water 08 00404 g002
Figure 3. Observed trends of TP concentration compared to modelled TP concentrations for the years 2002, 2007 and 2013 in the three sub-catchments of the river Pram: (a) upstream; (b) midstream; and (c) downstream. Plotted values of TP concentrations correspond to flow-adjusted data. They were calculated by adding the residuals obtained from the concentration versus flow regression to the mean concentration for the period under study [25].
Water 08 00404 g003
Figure 4. Observed trends of TP concentration compared to modelled TP concentrations for the years 2002, 2007 and 2013 in the two sub-catchments of the river Aschach: (a) upstream; and (b) downstream. Plotted values of TP concentrations correspond to flow-adjusted data. They were calculated by adding the residuals obtained from the concentration versus flow regression to the mean concentration for the period under study [25].
Water 08 00404 g004
Figure 5. Observed trends of TP concentration compared to modelled TP concentrations for the years 2002, 2007 and 2013 in the two sub-catchments of the river Antiesen: (a) upstream; and (b) downstream. Plotted values of TP concentrations correspond to flow-adjusted data. They were calculated by adding the residuals obtained from the concentration versus flow regression to the mean concentration for the period under study [25].
Water 08 00404 g005
Figure 6. MONERIS (Modelling of Nutrient Emissions in River Systems) sub-catchment outlets for the rivers Pram, Aschach and Antiesen.
Water 08 00404 g006
Figure 7. Total TP emissions and share of different pathways in the sub-catchments of the river Pram modelled with MONERIS for the years 2002, 2007 and 2013.
Water 08 00404 g007
Figure 8. Total TP emissions and share of different pathways in the sub-catchments of the river Aschach modelled with MONERIS for the years 2002, 2007 and 2013.
Water 08 00404 g008
Figure 9. Total TP emissions and share of different pathways in the sub-catchments of the river Antiesen modelled with MONERIS for the years 2002, 2007 and 2013.
Water 08 00404 g009
Figure 10. Trends of particulate phosphorus concentration ( µ g PP L 1 year 1 ) in surface waters in Upper Austria for the following two periods: (a) 1990–2000; and (b) 2001–2014.
Water 08 00404 g010
Table 1. Comparison of observed and modelled yearly changes of total phosphorus (TP) concentration in the sub-catchments of the rivers Pram, Aschach and Antiesen for the period 2001–2013. Statistical significance of observed trends: ns (non significant), * (significant), ** (very significant), *** (highly significant). Uncertainty of observed trends calculated through Theil–Sen estimator method in R [29]; uncertainty of modelled trends calculated through two MONERIS scenarios, obtained by altering the relative importance of erosion, groundwater and WWTP emissions pathways.
Temporal Change (±μg TP−1 year−1)2001–2013
Observed TrendModelled Trend
Pram upstream+1.5 ± 4.0 (ns)+0.5 ± 0.5
Pram midstream+4.8 ± 3.2 (**)+1.0 ± 0.5
Pram downstream+5.3 ± 2.8 (***)+1.2 ± 0.5
Aschach upstream+5.7 ± 2.8 (***)+1.4 ± 0.4
Aschach downstream+3.7 ± 2.6 (**)+1.1 ± 0.4
Antiesen upstream+1.5 ± 2.5 (ns)+0.3 ± 0.6
Antiesen downstream+1.7 ± 3.0 (ns)+0.7 ± 0.6
Note: yearly values are based on the simplifying assumption of a constant change within the whole period.

